
The Chemistry and Mineralogy (CheMin) X-ray Diffractometer on the MSL Curiosity Rover: A Decade of Mineralogy from Gale Crater, Mars

 ,
,  ,
,  , , ,
, , ,  ,
,  , , , , , , , , , , and
Abstract

1. Introduction
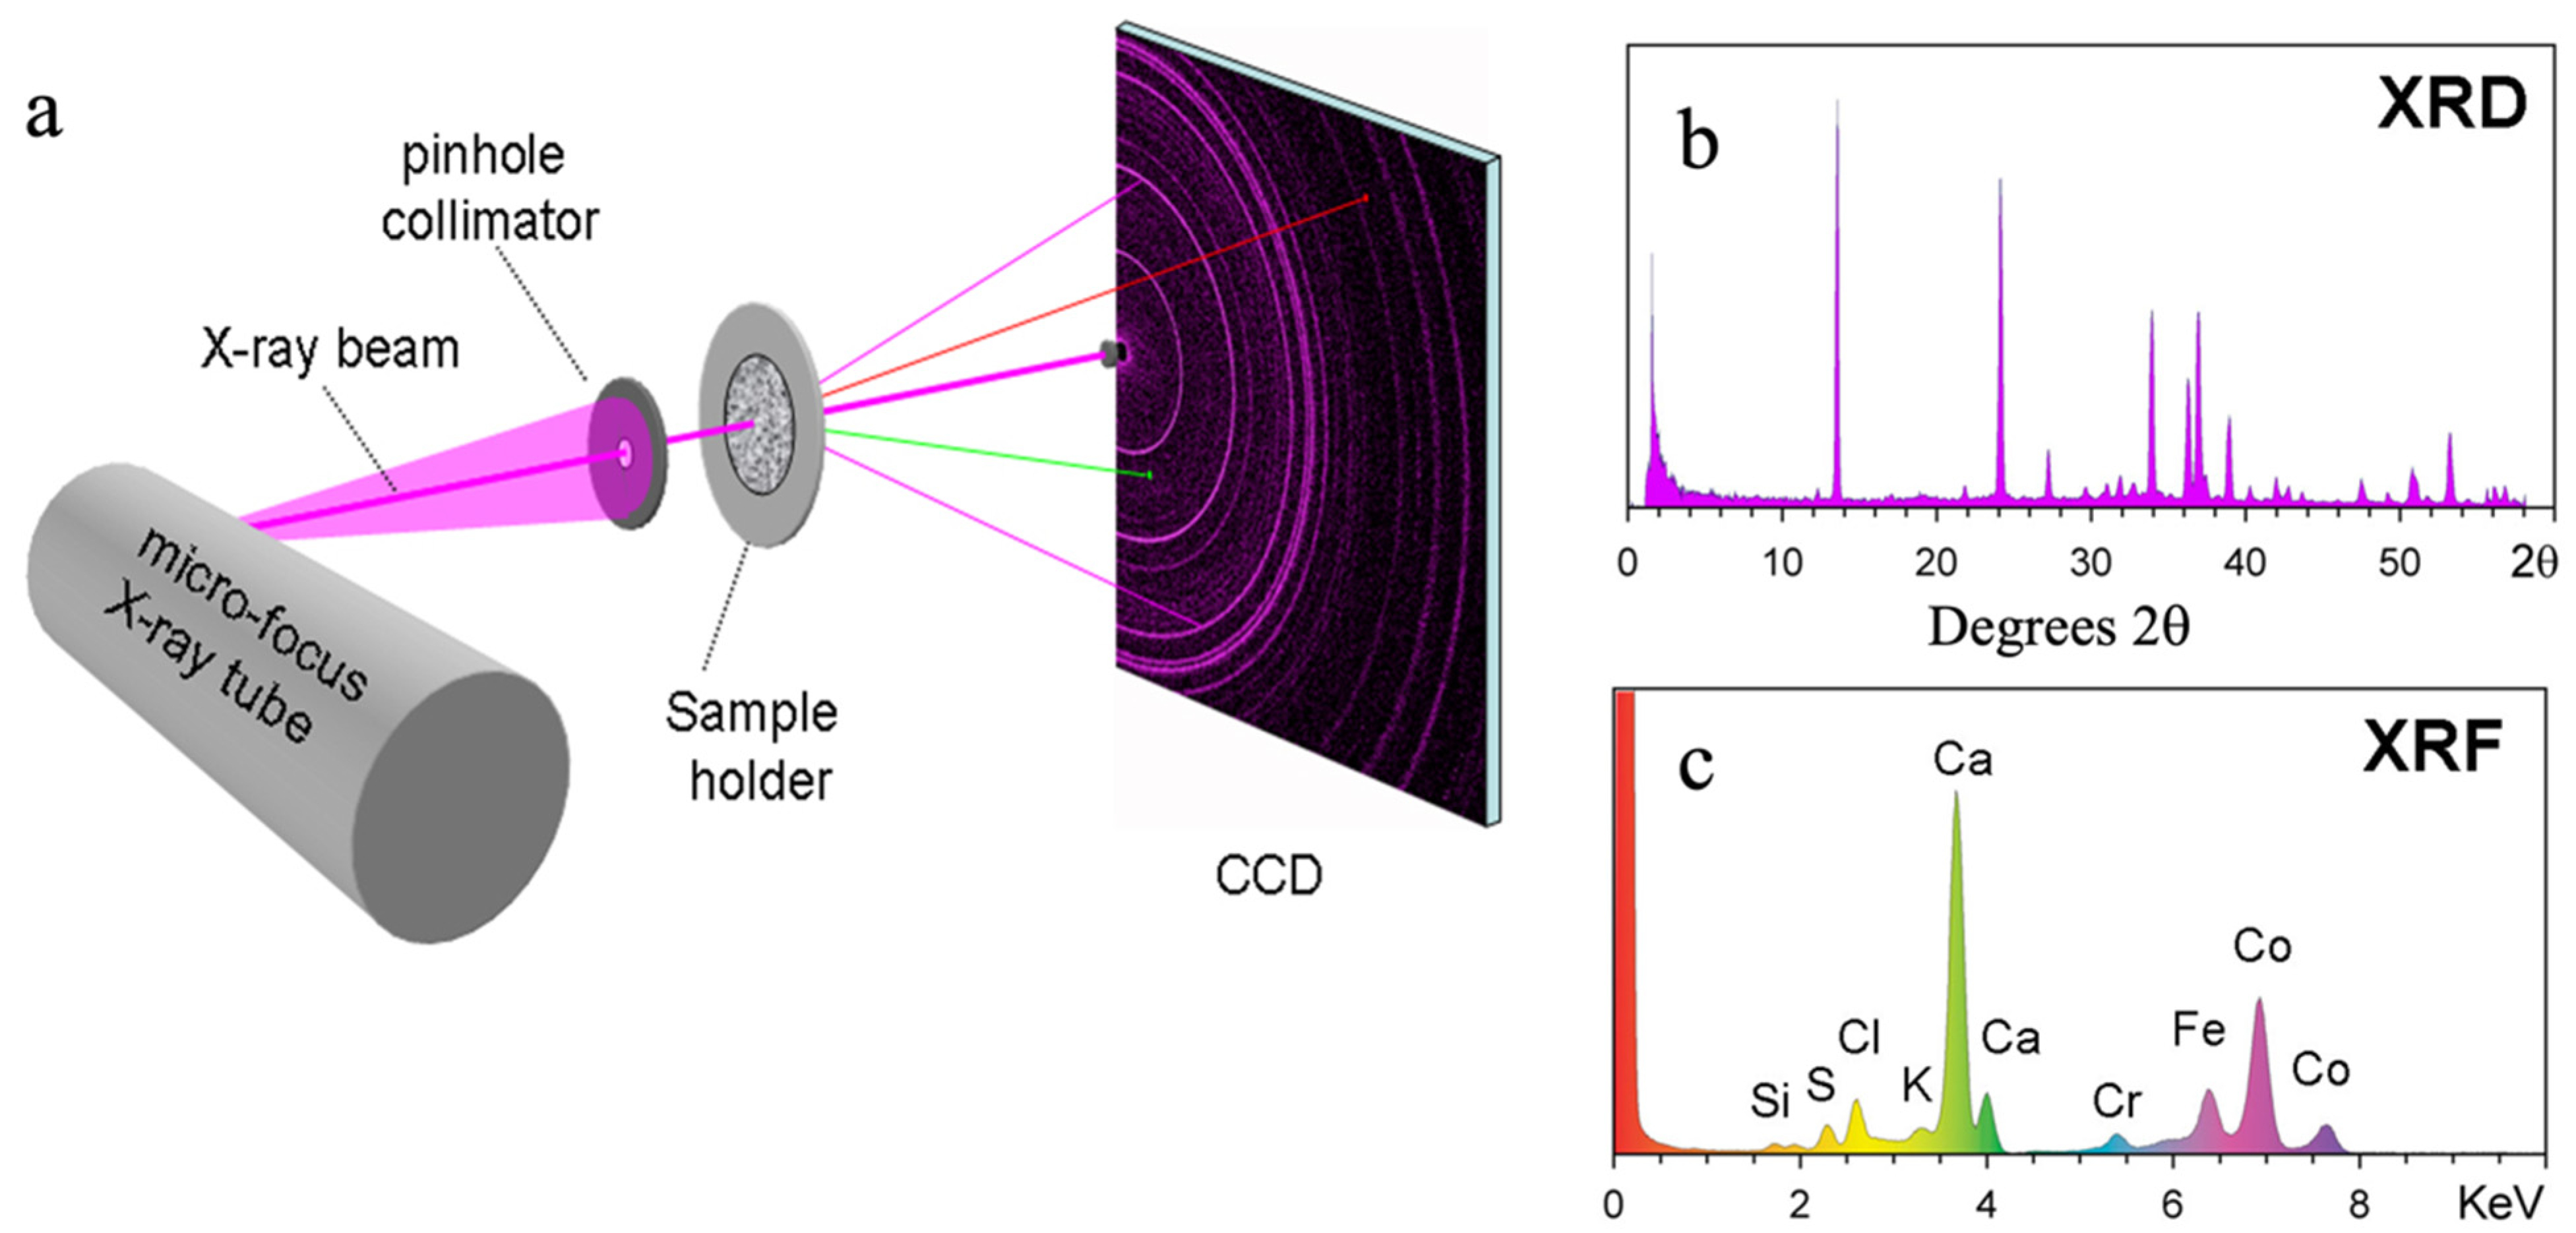
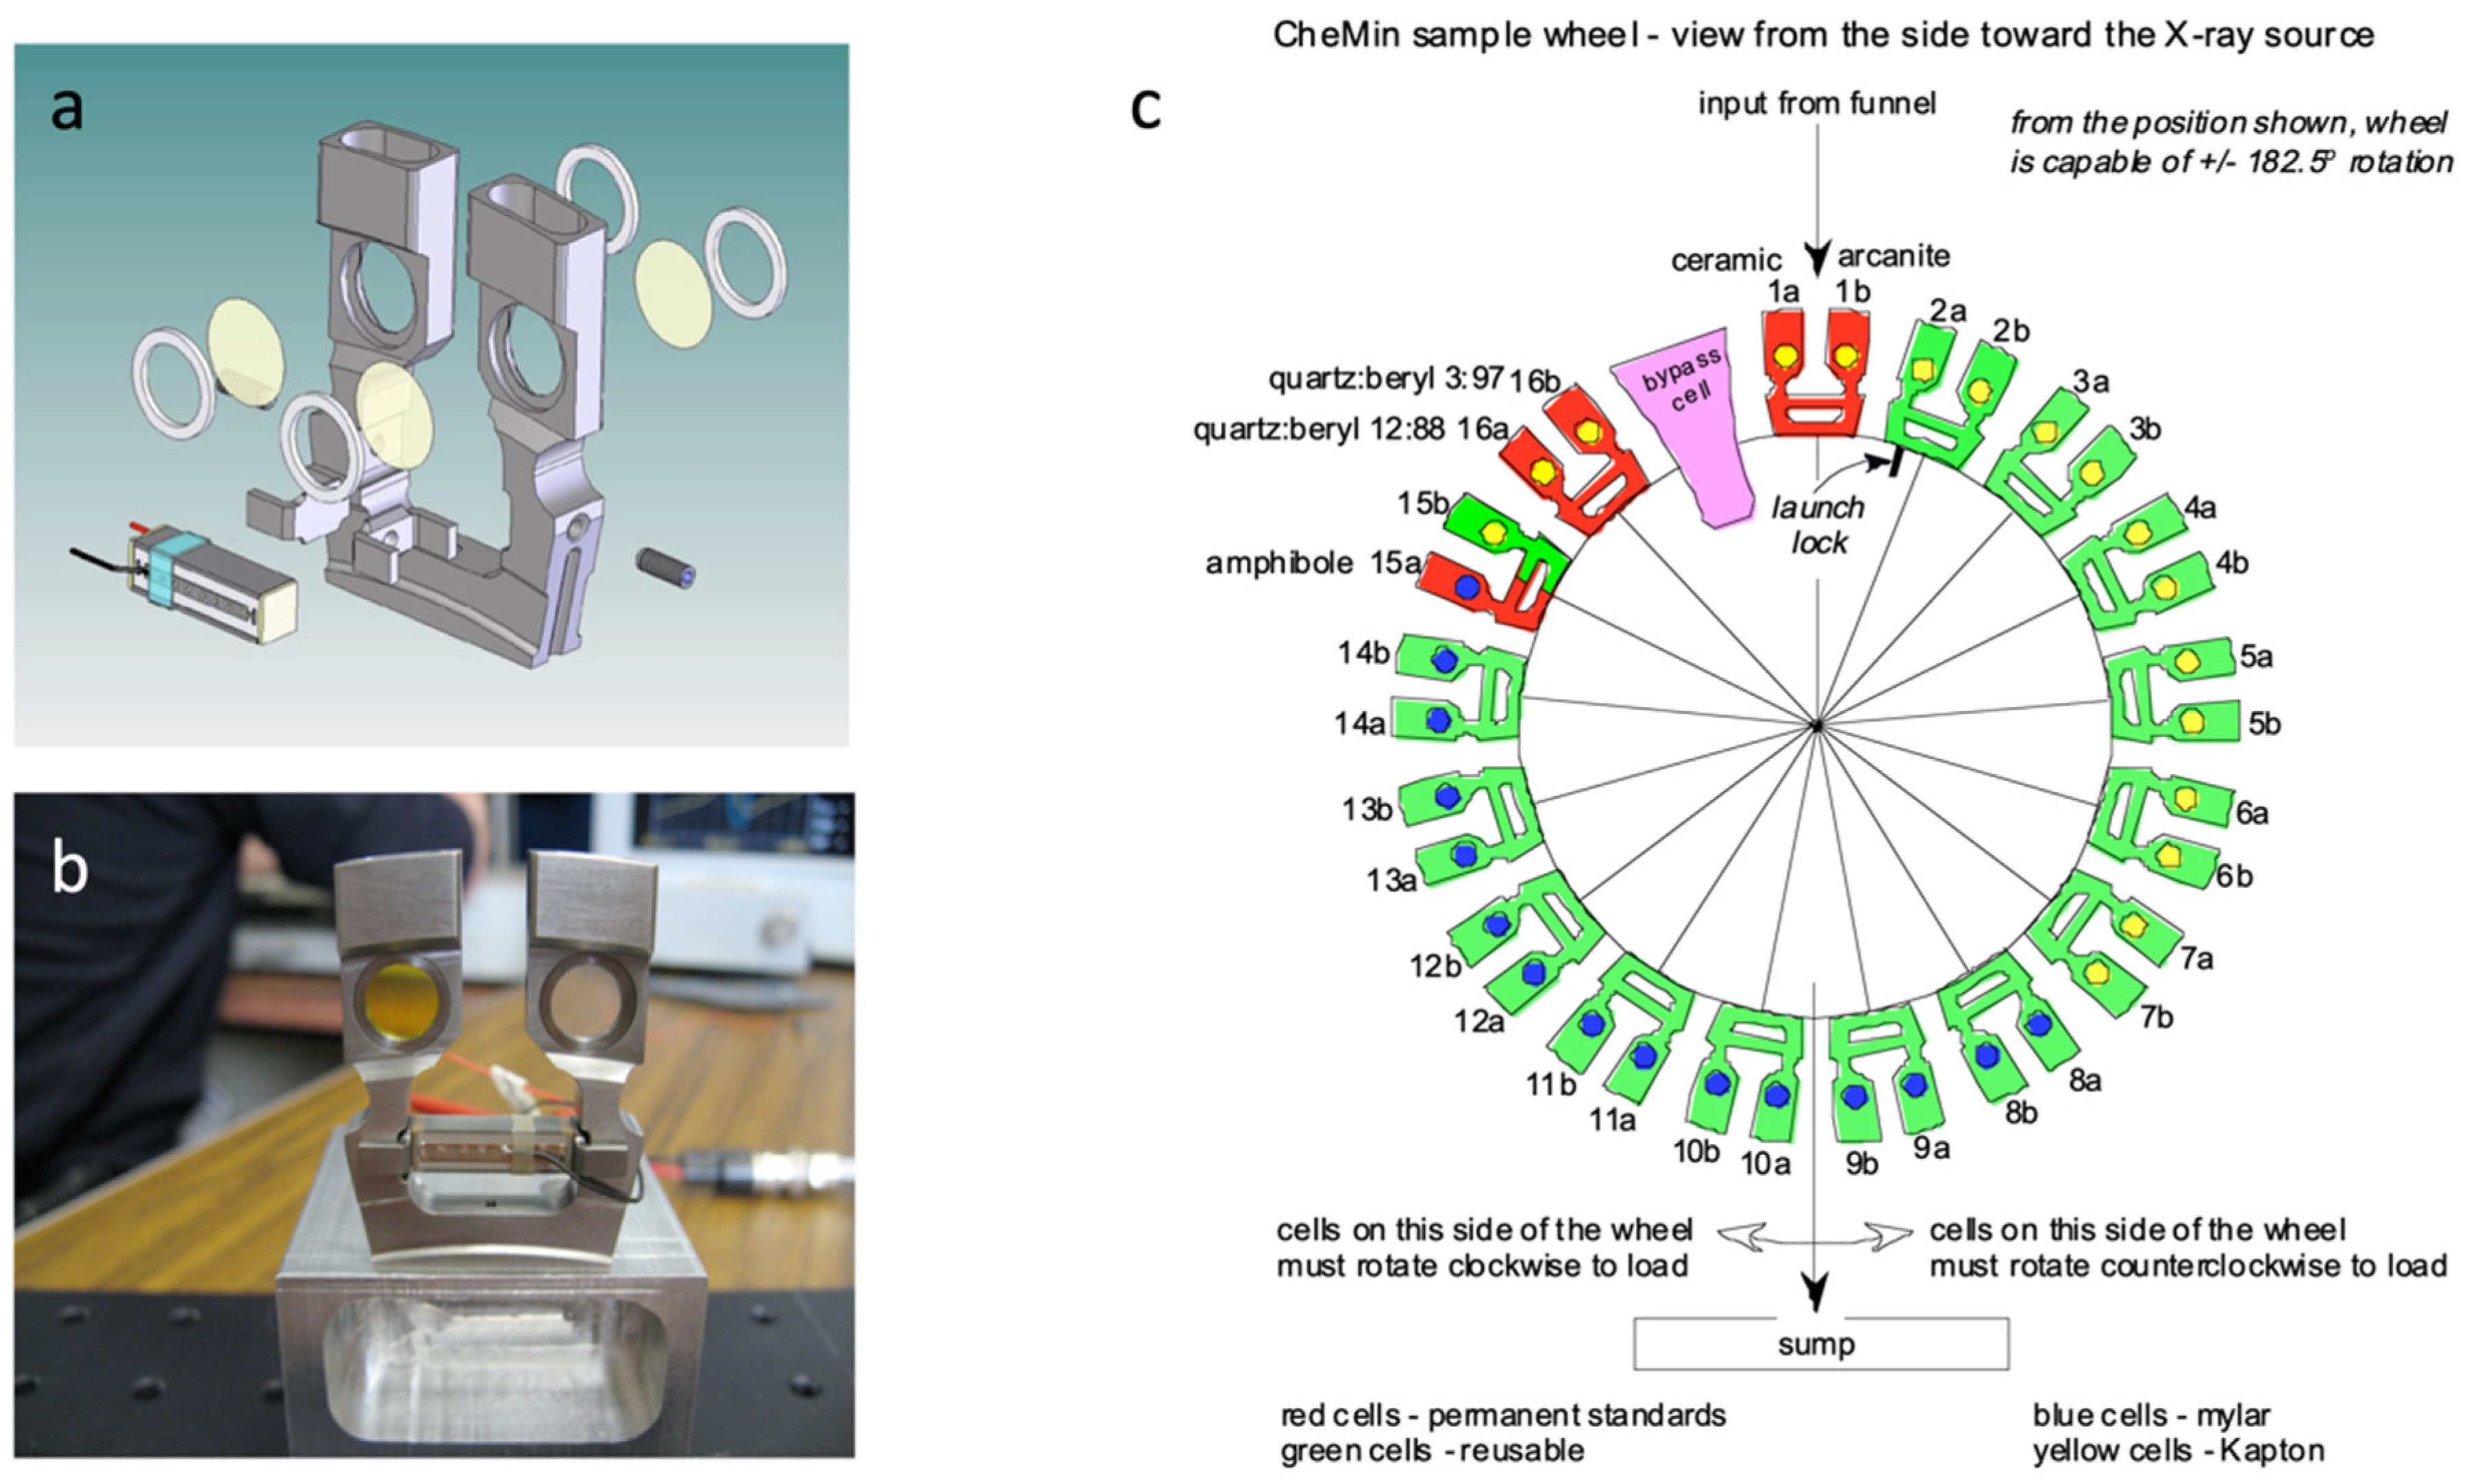
2. Description of the CheMin Instrument
2.1. The CheMin Geometry
2.2. The CheMin Detector and CheMin Data Products
2.3. CheMin 2q Calibration
2.4. Analysis of CheMin Diffraction Patterns
2.4.1. Analysis of the Crystalline Component
2.4.2. Analysis of Clay Mineral Components
2.4.3. Analysis of X-ray Amorphous Components
3. Major Discoveries (“CheMin’s Diary of Discovery”)
3.1. The Mineralogy and Composition of the Mars’ Global Soil
3.2. Discovery and Characterization of an Ancient Habitable Environment on Mars
3.3. Evidence for a Diverse Basalt Mineralogy on Mars
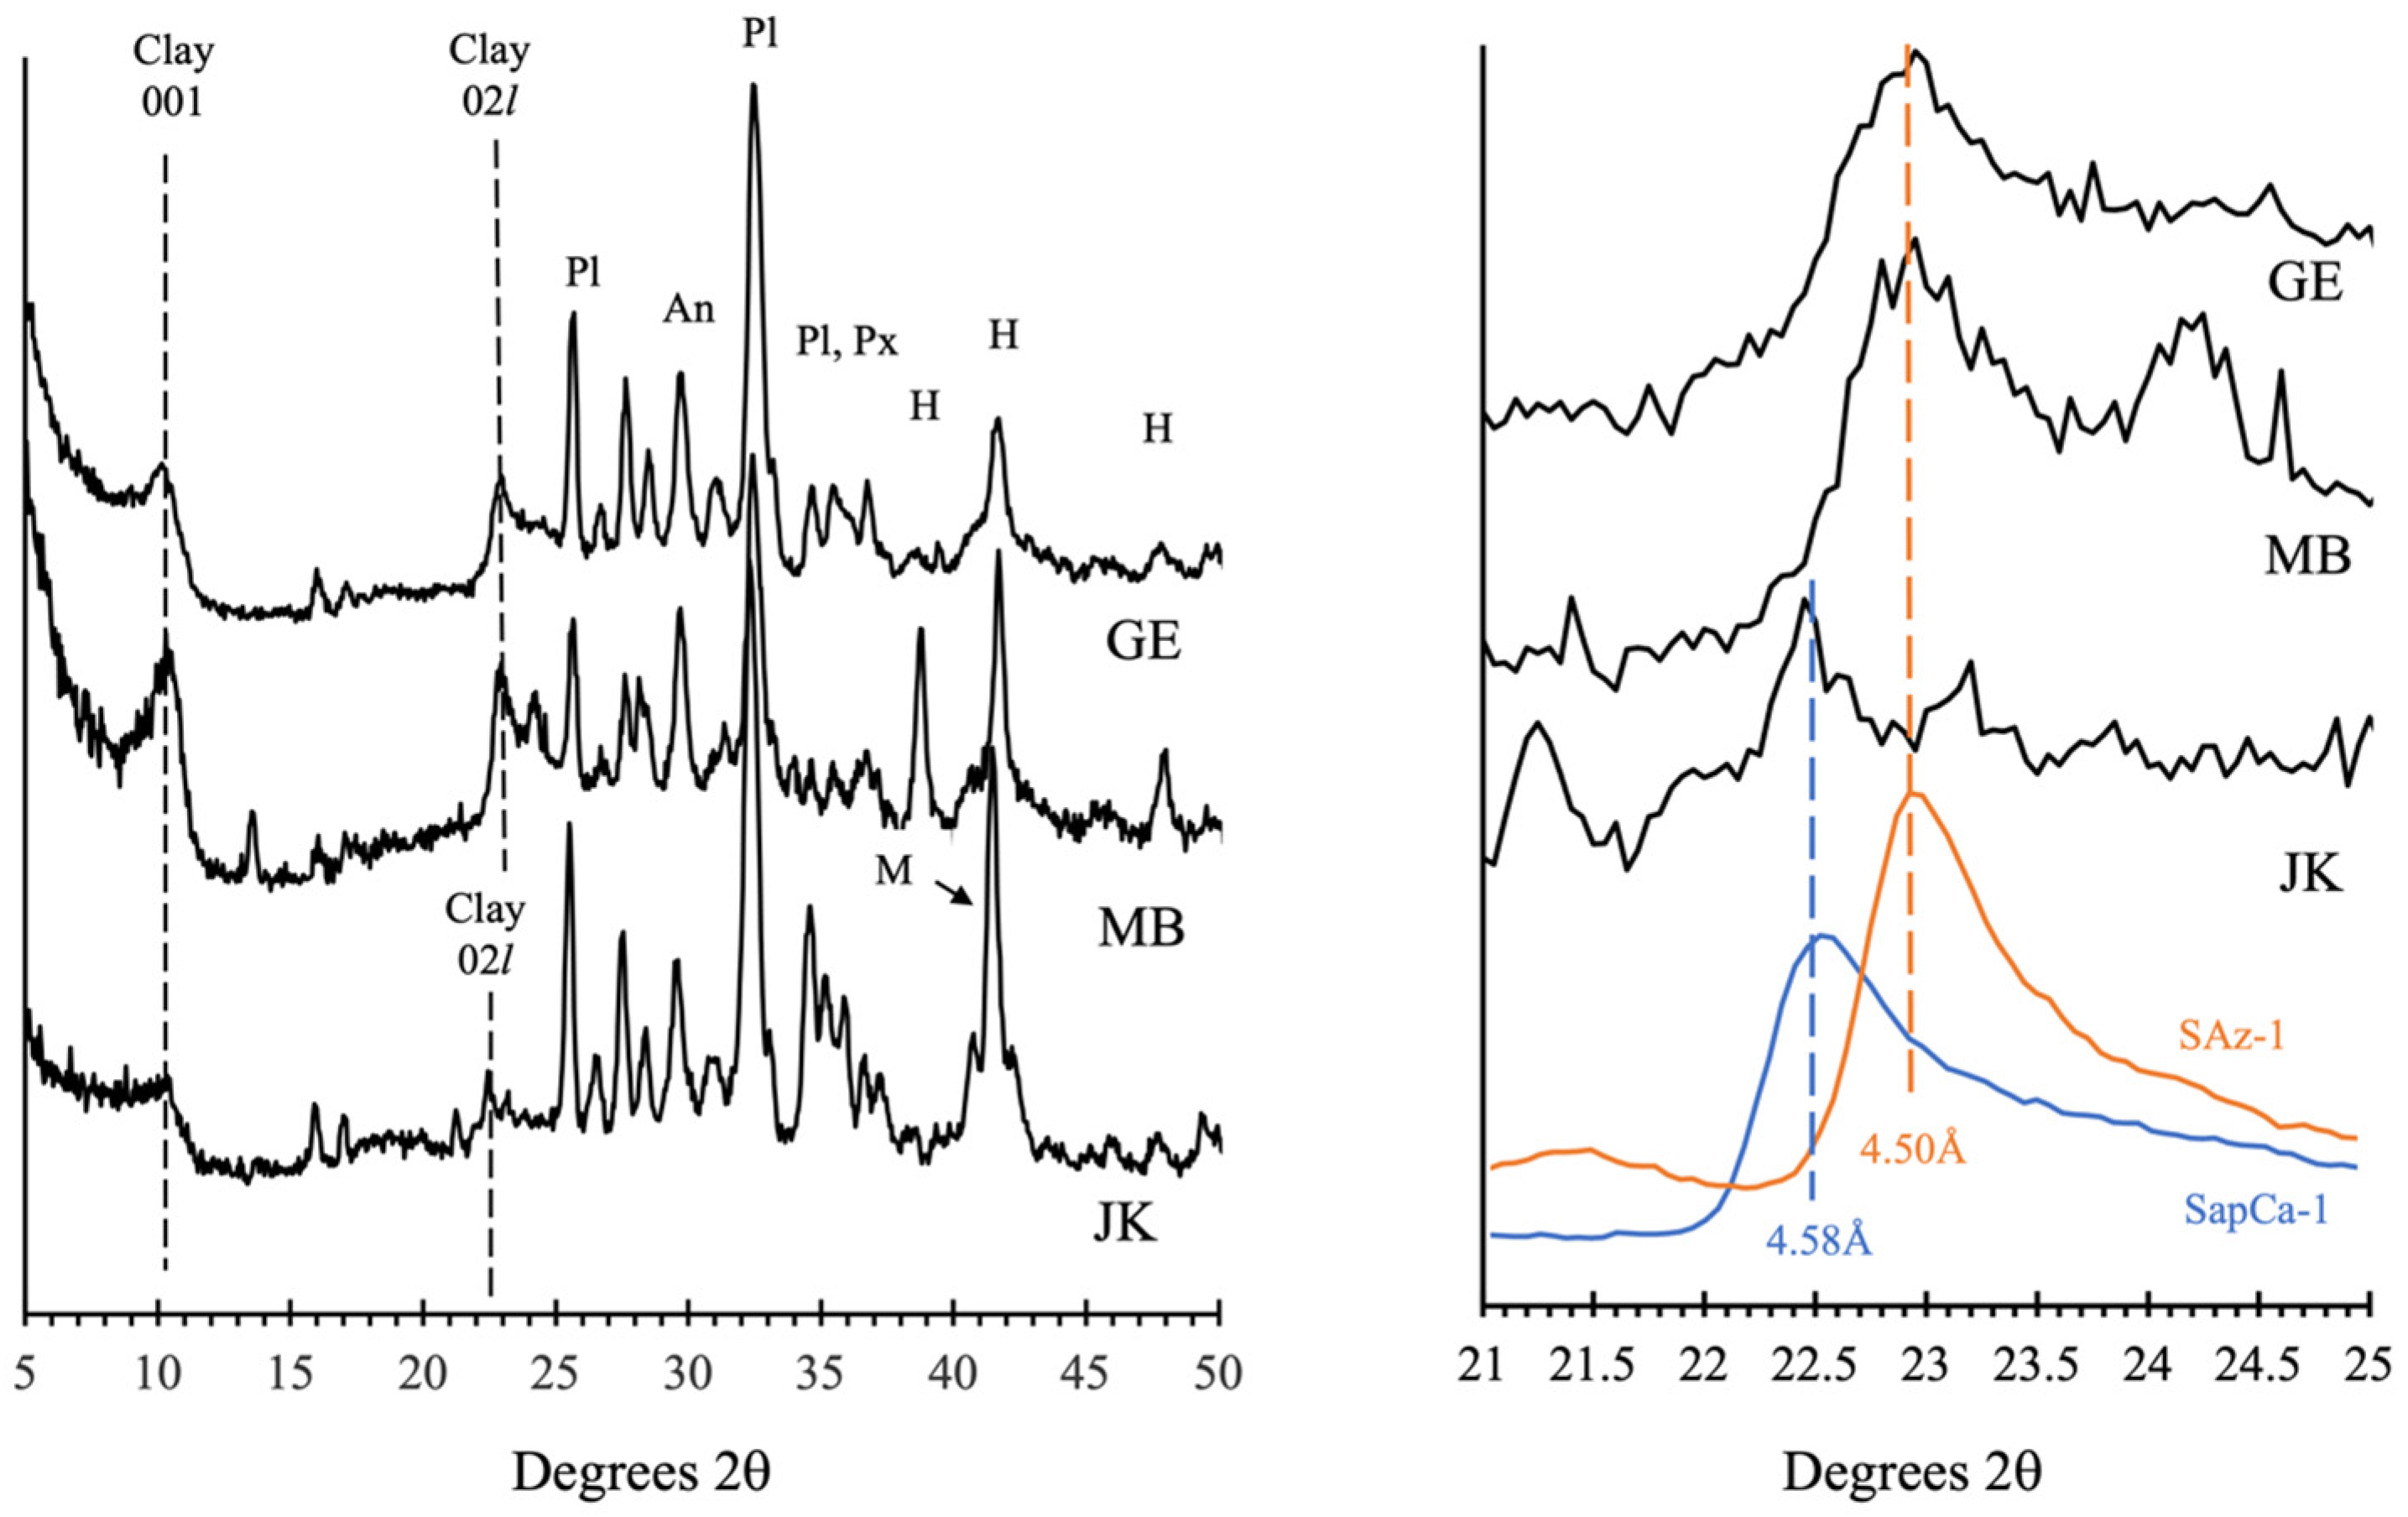
3.4. Clay Mineral Diversity in the Sedimentary Strata of Gale Crater
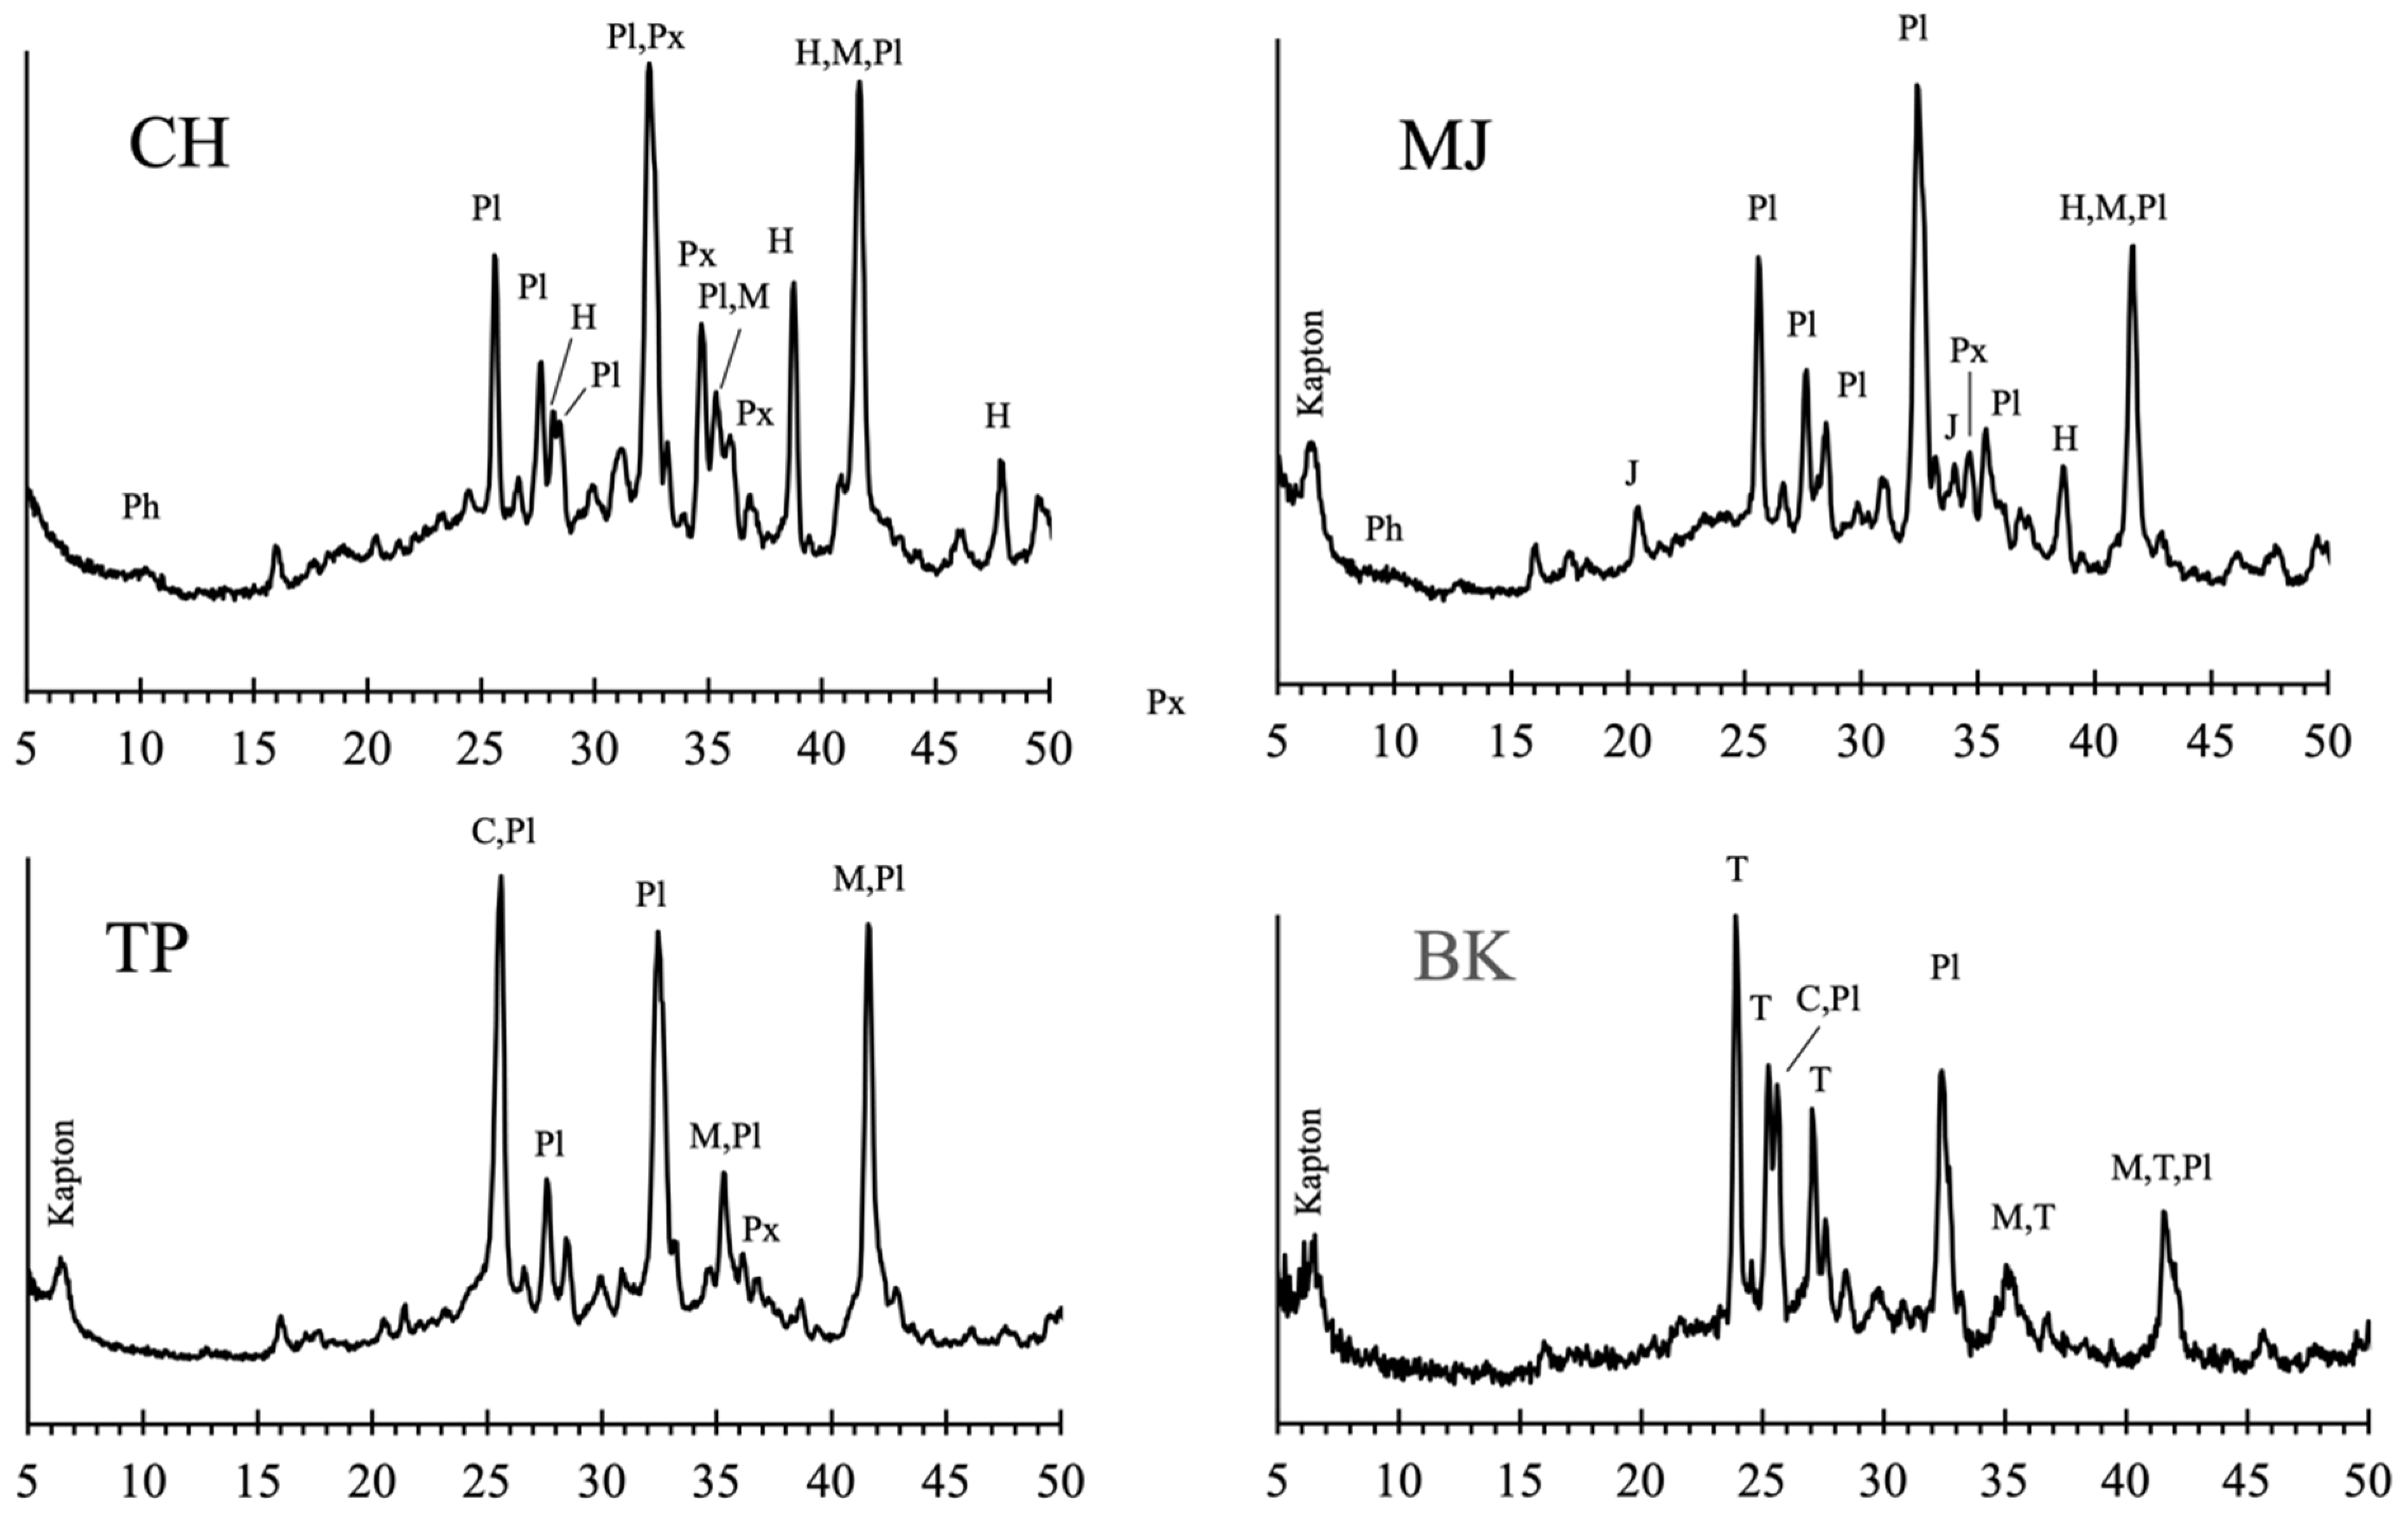
3.5. Depositional and Post-Depositional Features in the Lower Murray Formation
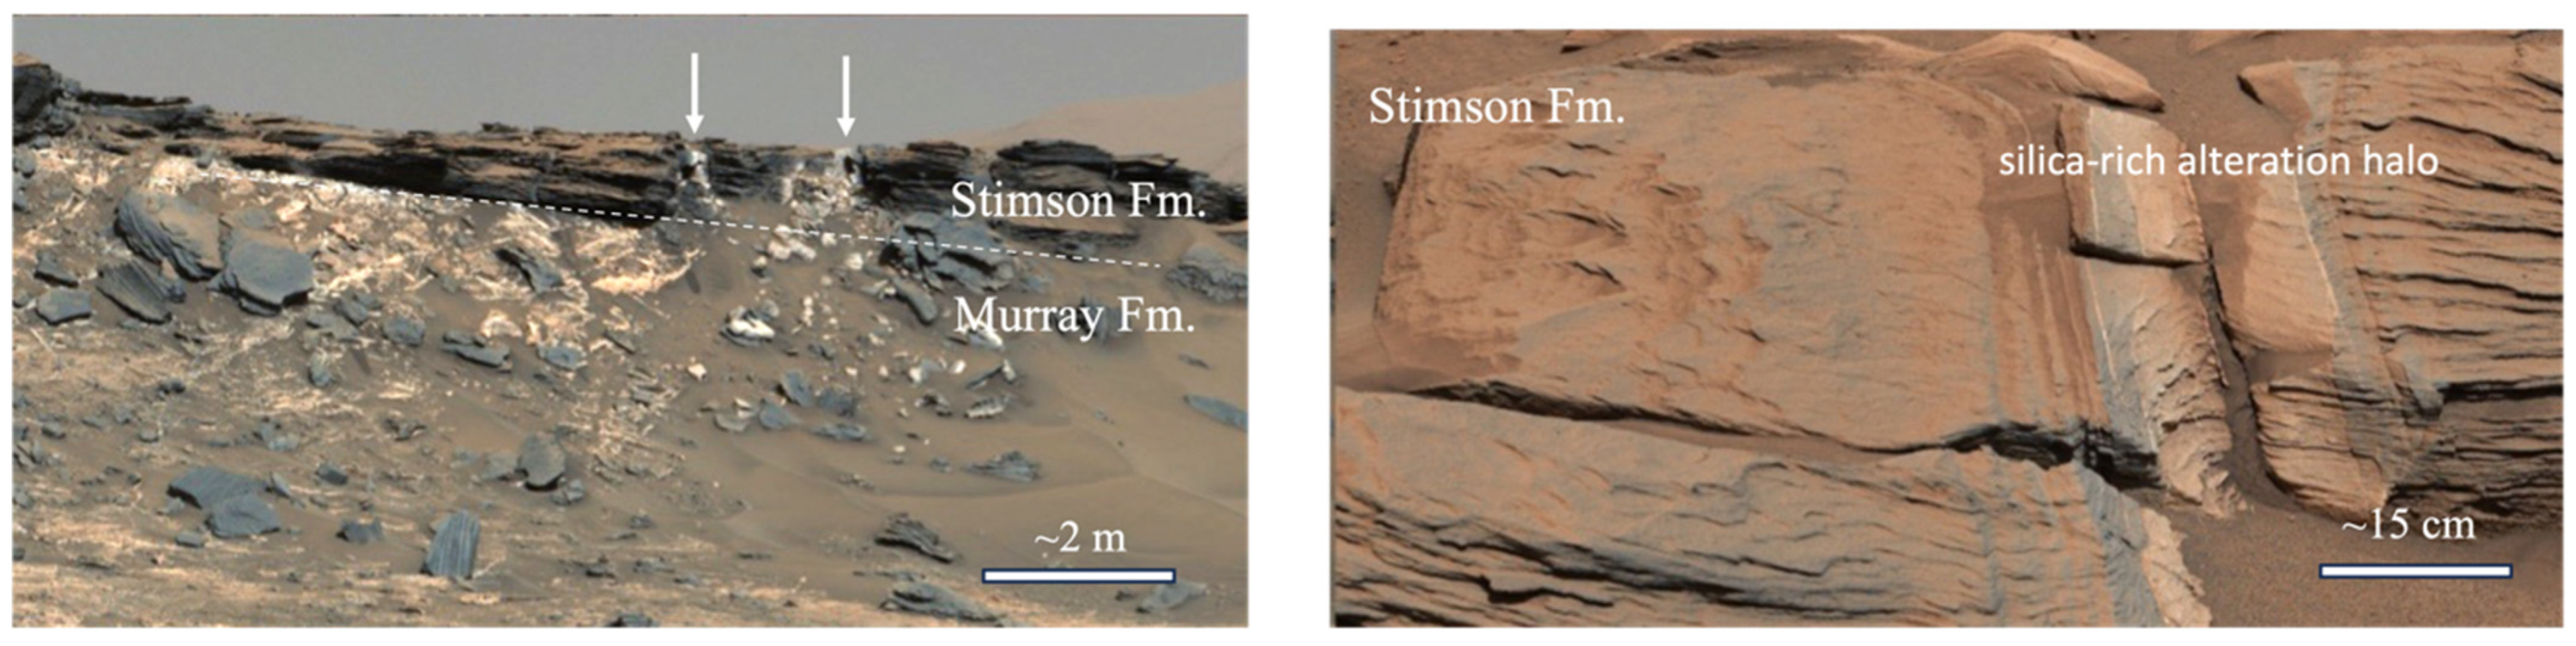
3.6. Si-rich Alteration Halos in the Stimson Formation Aeolian Sandstone
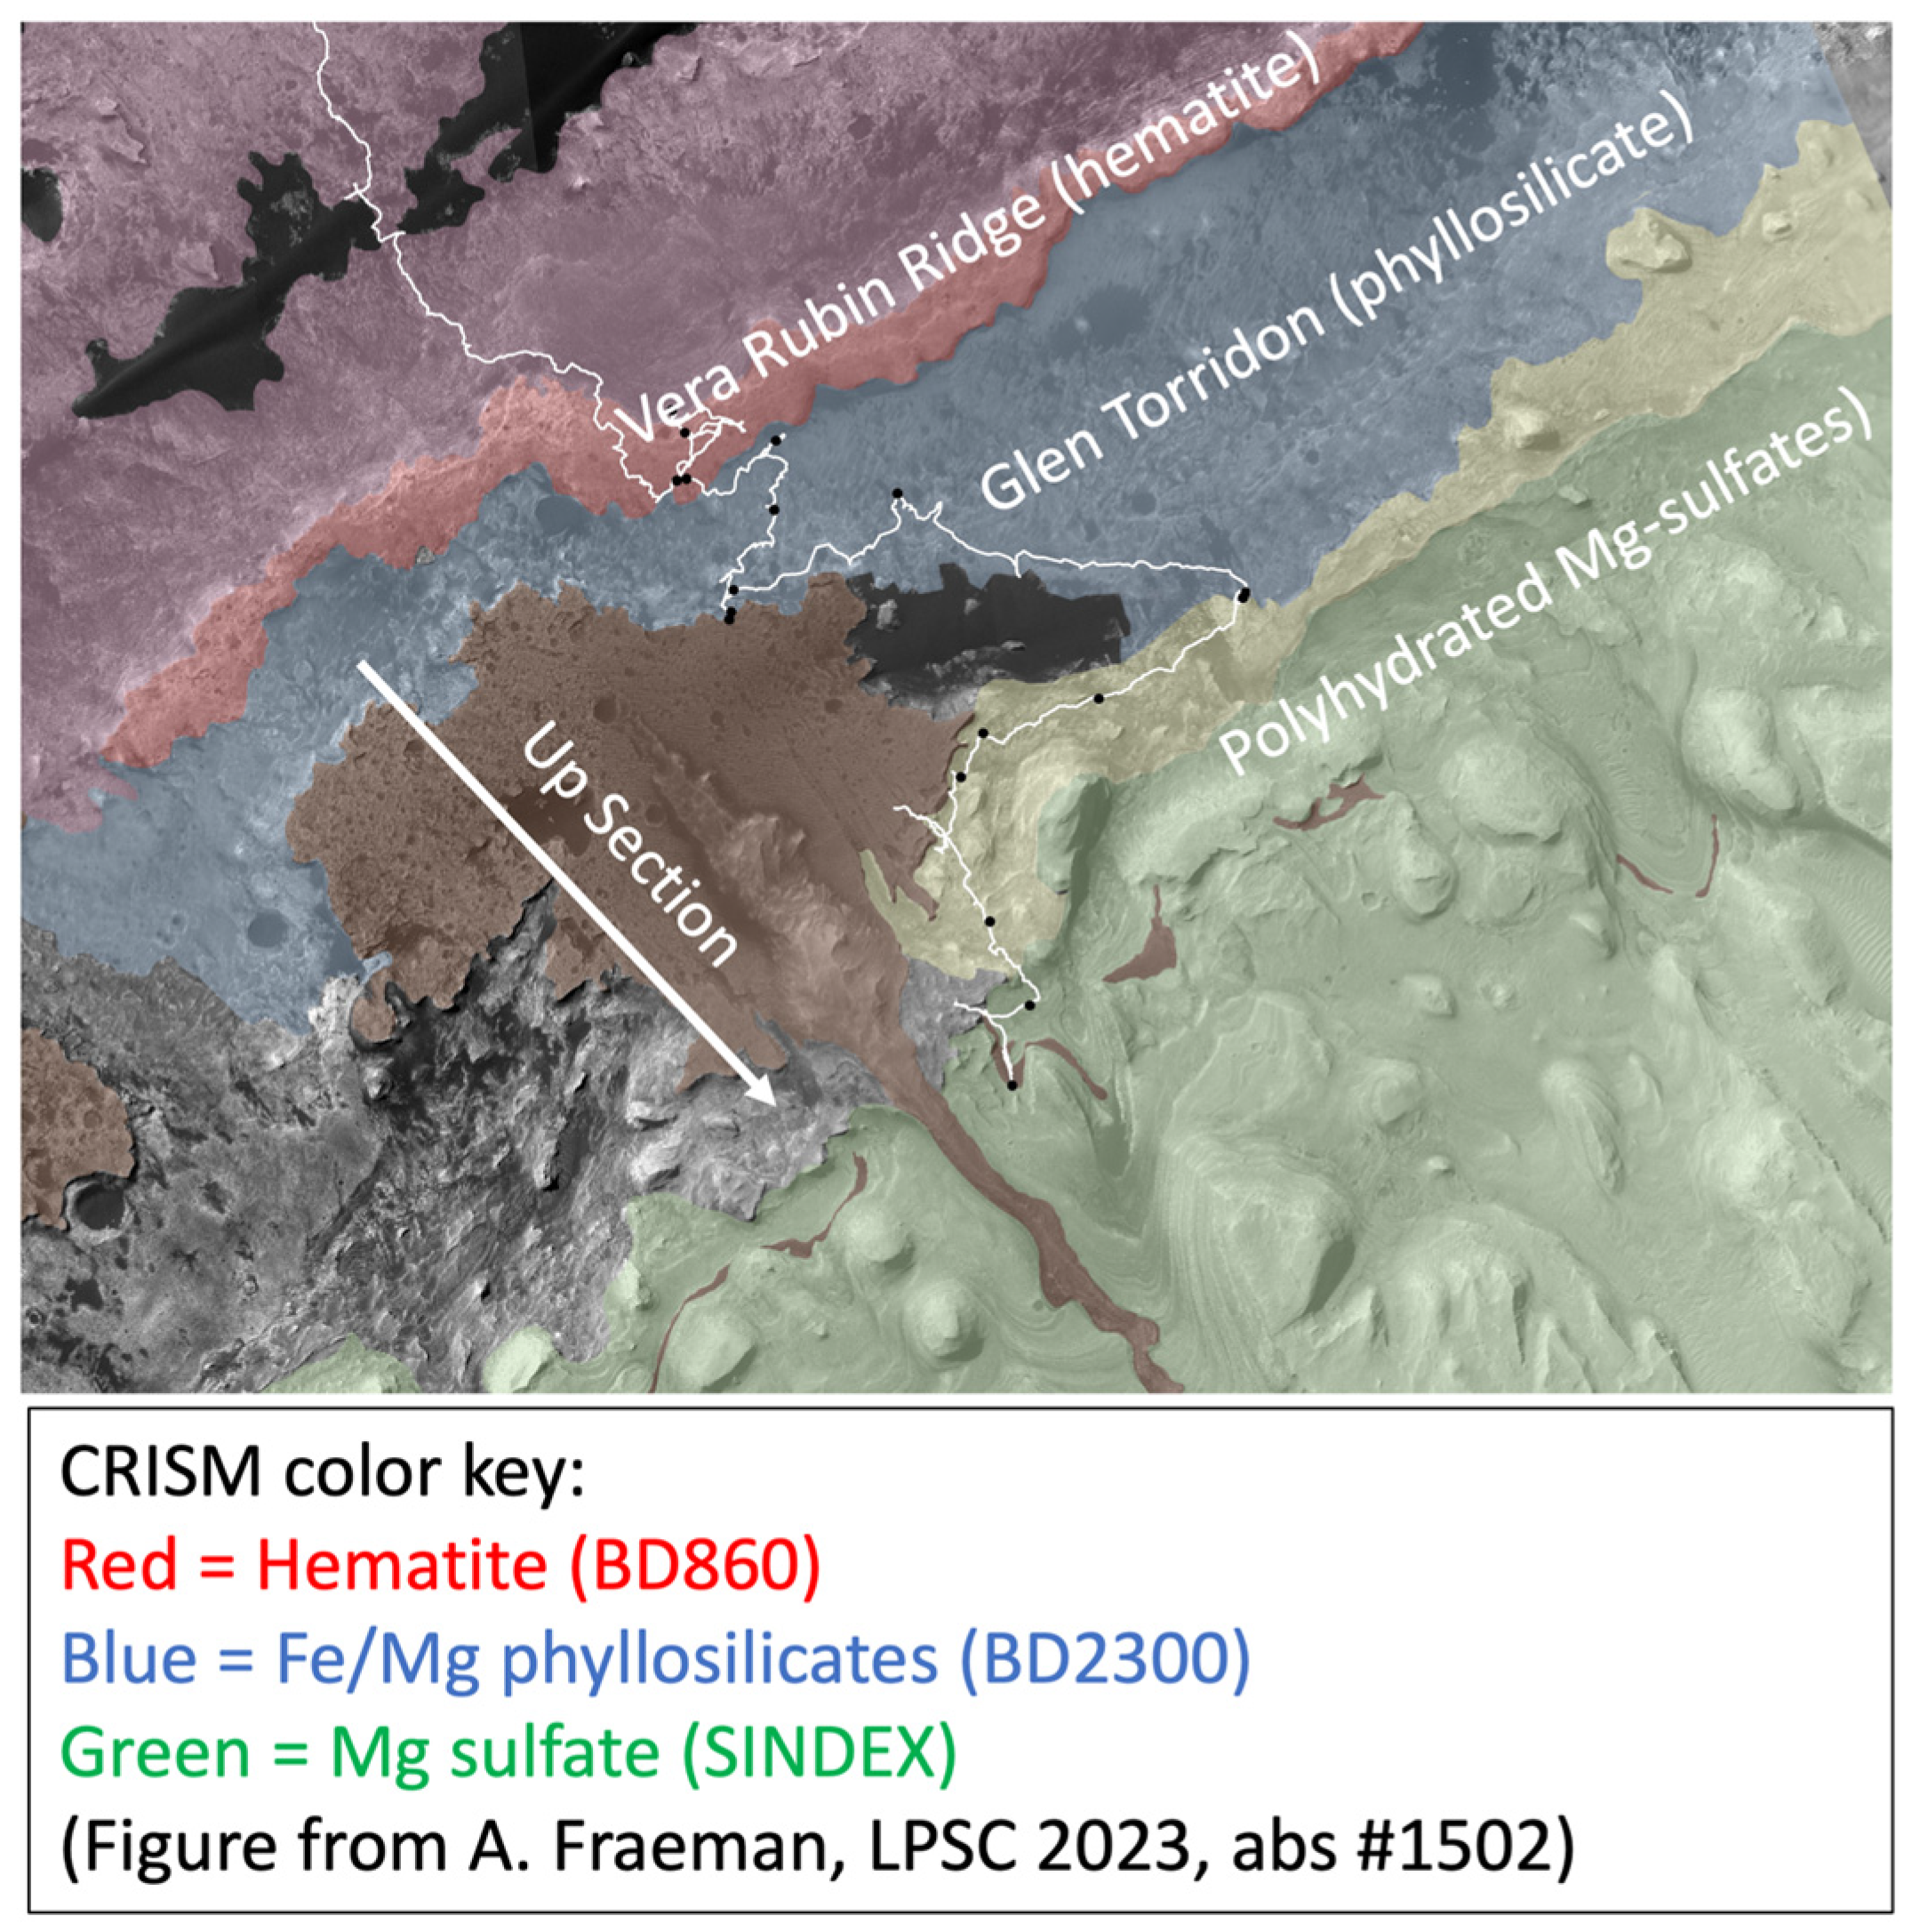
3.7. Vera Rubin Ridge and the Glen Torridon Region
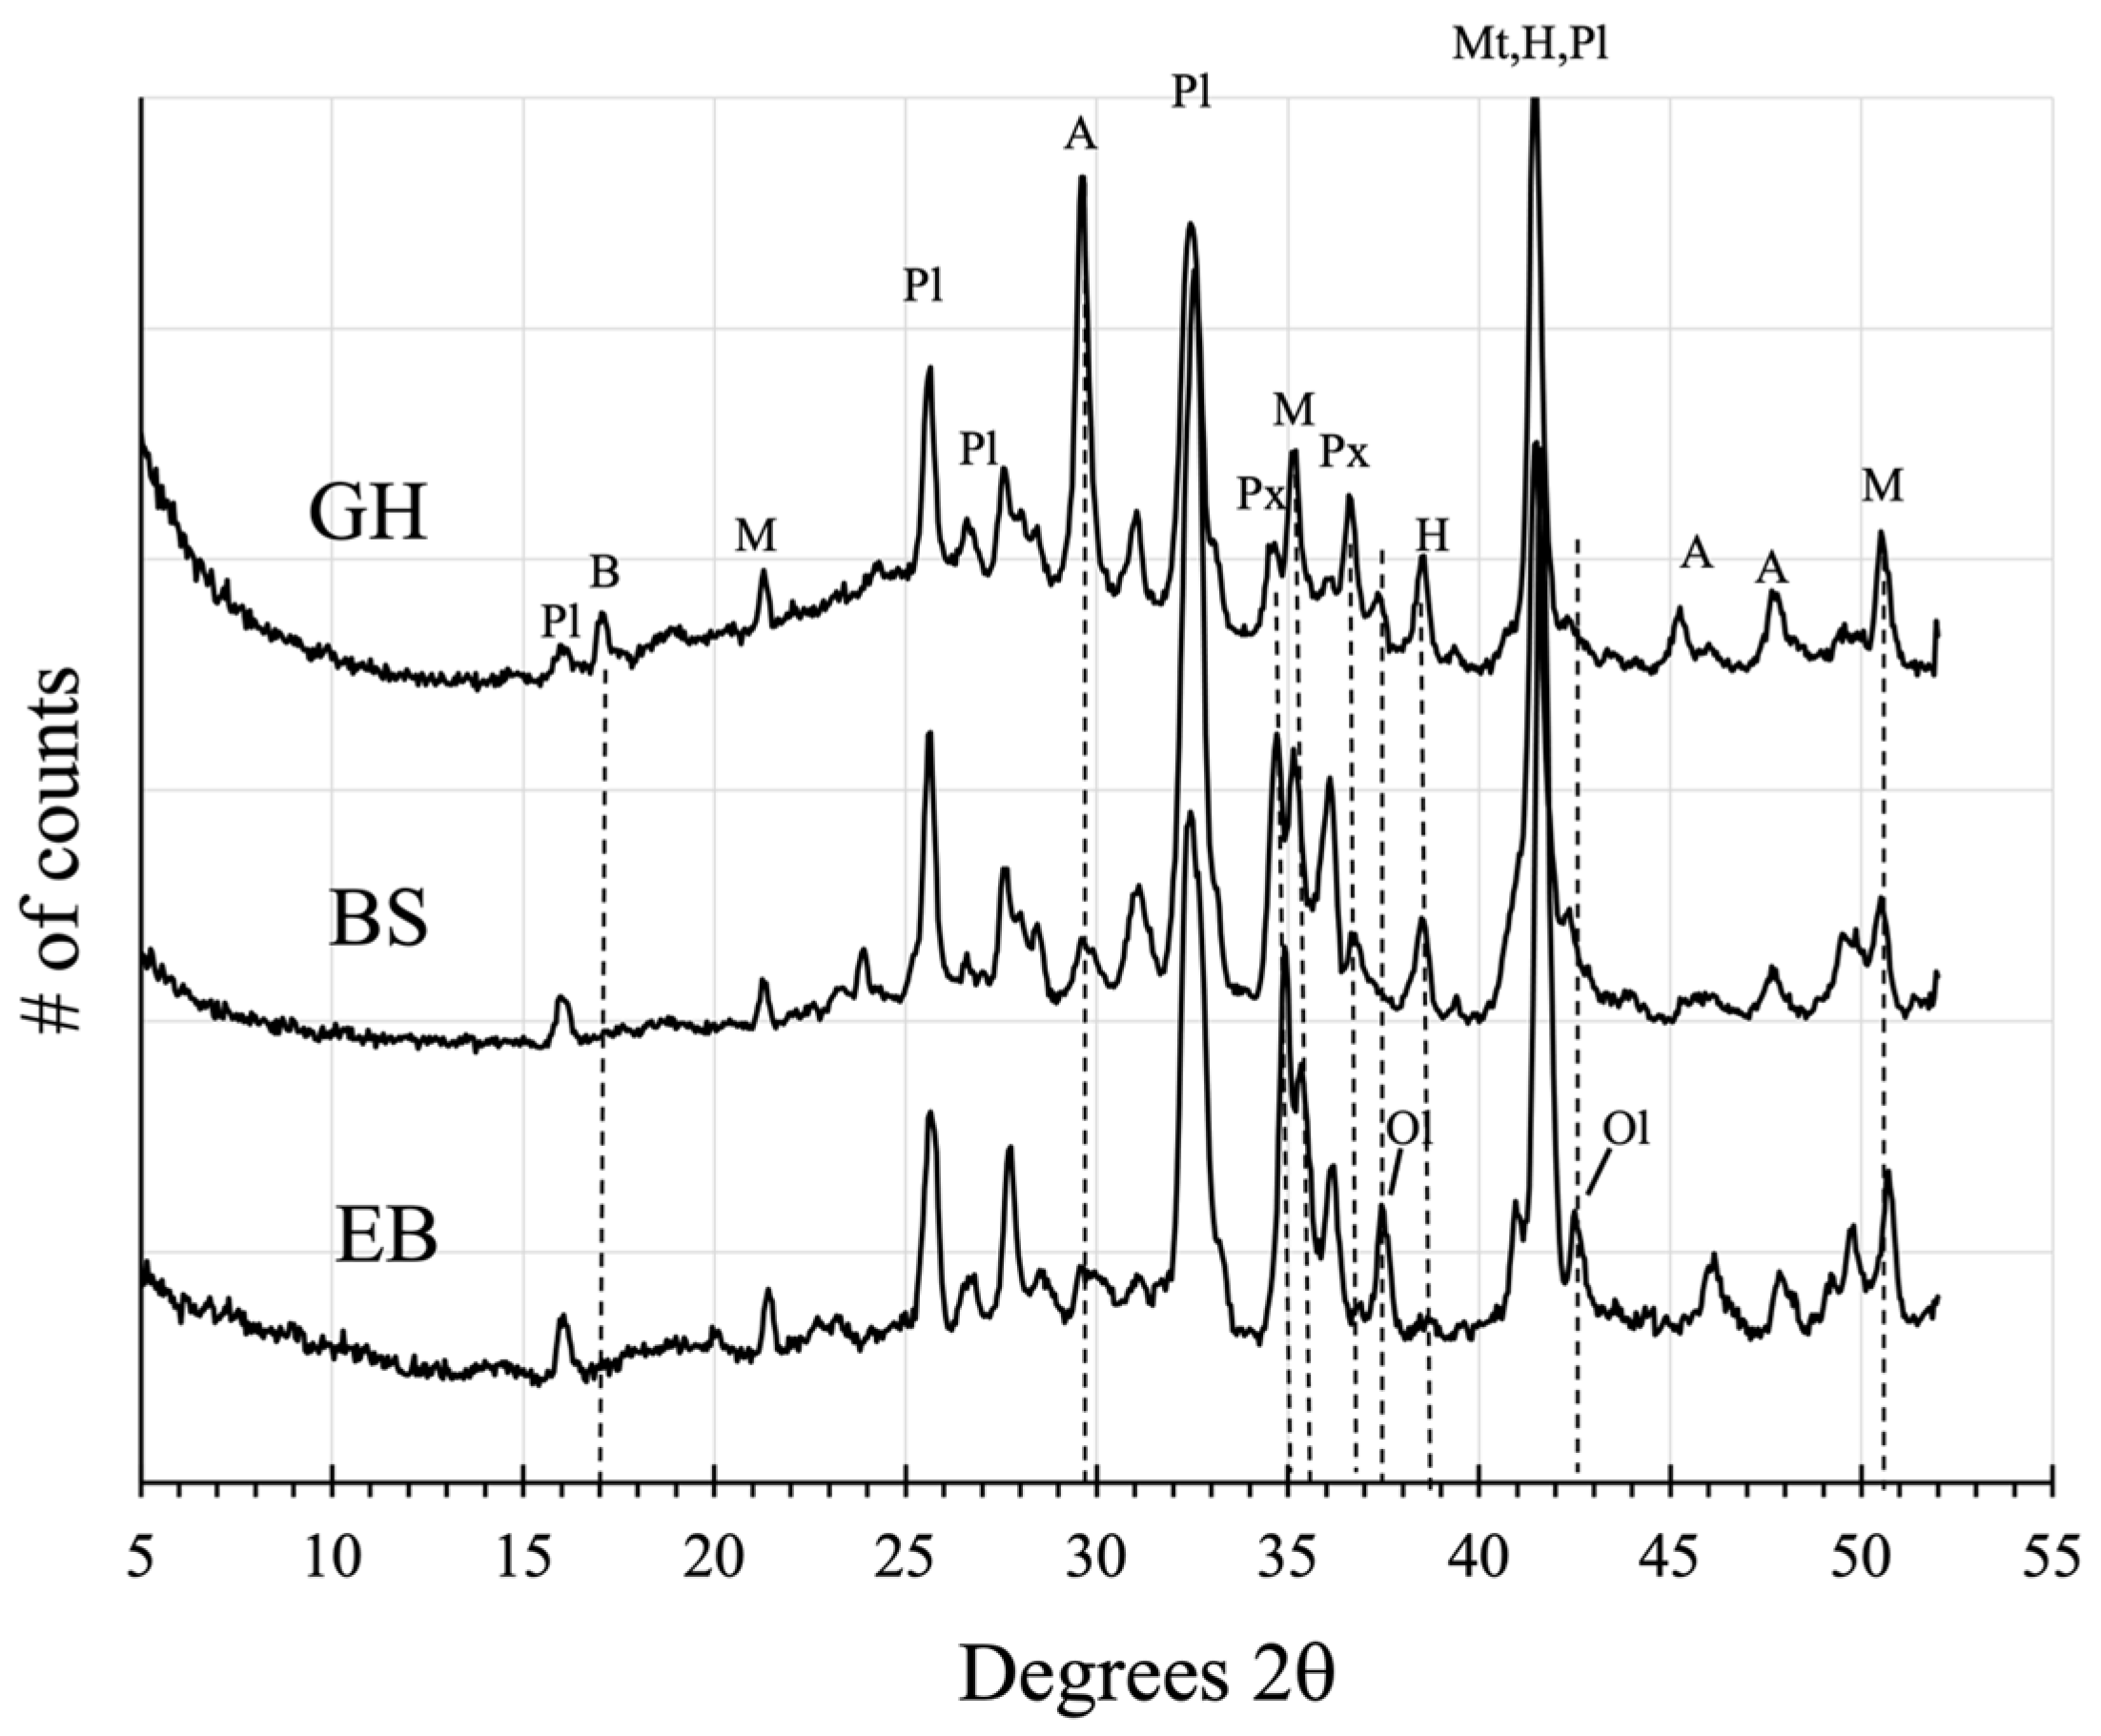
3.7.1. Vera Rubin Ridge
3.7.2. Glen Torridon Region
3.7.3. Brine-Driven Destruction of Clay Minerals in Vera Rubin Ridge
3.8. Mineralogical Characterization of the Sulfate-Bearing Unit
3.8.1. The Clay Mineral—Sulfate Mineral Transition Region
3.8.2. The Sulfate-Bearing Unit
3.9. The Ubiquitous Amorphous Component
4. Discussion and Conclusions
- Discovery and characterization of habitable environments on early Mars. This was one of the principal goals of the MSL mission and was achieved with the first drilled sample at Yellowknife Bay. Requirements for habitability (“life as we know it”) include a source of the biogenic elements (H, C, O, N, P, S), a source of energy (minerals with variable redox states), high to moderate water activity, moderate temperatures, and moderate to neutral pH. A surprising discovery is that through hundreds of meters of lacustrine mudstones, corresponding to hundreds of thousands to millions of years [76], these requirements are satisfied, suggesting that habitable environments were common on early Mars. Mineralogical data are critical to the discovery and characterization of ancient habitable environments, and provide context for the morphologic, isotopic, and chemical data used to evaluate putative evidence of biogenicity. Equally importantly, post-depositional conditions of pressure, temperature, and chemical composition (P, T, X)—determined with a knowledge of the assemblage of minerals and mineral stability ranges—can through their actions preserve evidence of habitability or erase such evidence entirely.
- The paragenesis of clay minerals. Prior to Curiosity’s arrival in Gale crater, the paragenesis of clay minerals identified from orbital near-infrared reflectance spectra was poorly understood [5,6,66,121]. CheMin mineralogical results in combination with sedimentological observations demonstrate that (in all but two cases, whose origin is a matter of debate) the trioctahedral and dioctahedral smectites found were either authigenic or early diagenetic, formed in place in the sediments. CheMin data provided the ground truth for the orbital clay mineral detections at Glen Torridon, but clay minerals are also found in many areas in Gale crater traversed by Curiosity that do not exhibit clay mineral signatures in orbital data.
- The ubiquitous presence of X-ray amorphous material in Gale crater sedimentary rocks. X-ray amorphous materials, whether they are glasses in the true sense or nanophase materials that lack long-range order, are found throughout Gale crater’s sedimentary rocks. The discovery of amorphous materials in ~3.5 Ga on Mars is confounding, given that amorphous materials, inherently unstable, should crystallize in geologically short time periods. The amount and the elemental chemistry of the amorphous components vary in ways that suggest that they are the product of diagenetic events unique to the formations in which they are found.
Author Contributions
Funding
Data Availability Statement
Acknowledgments
Conflicts of Interest
Appendix A

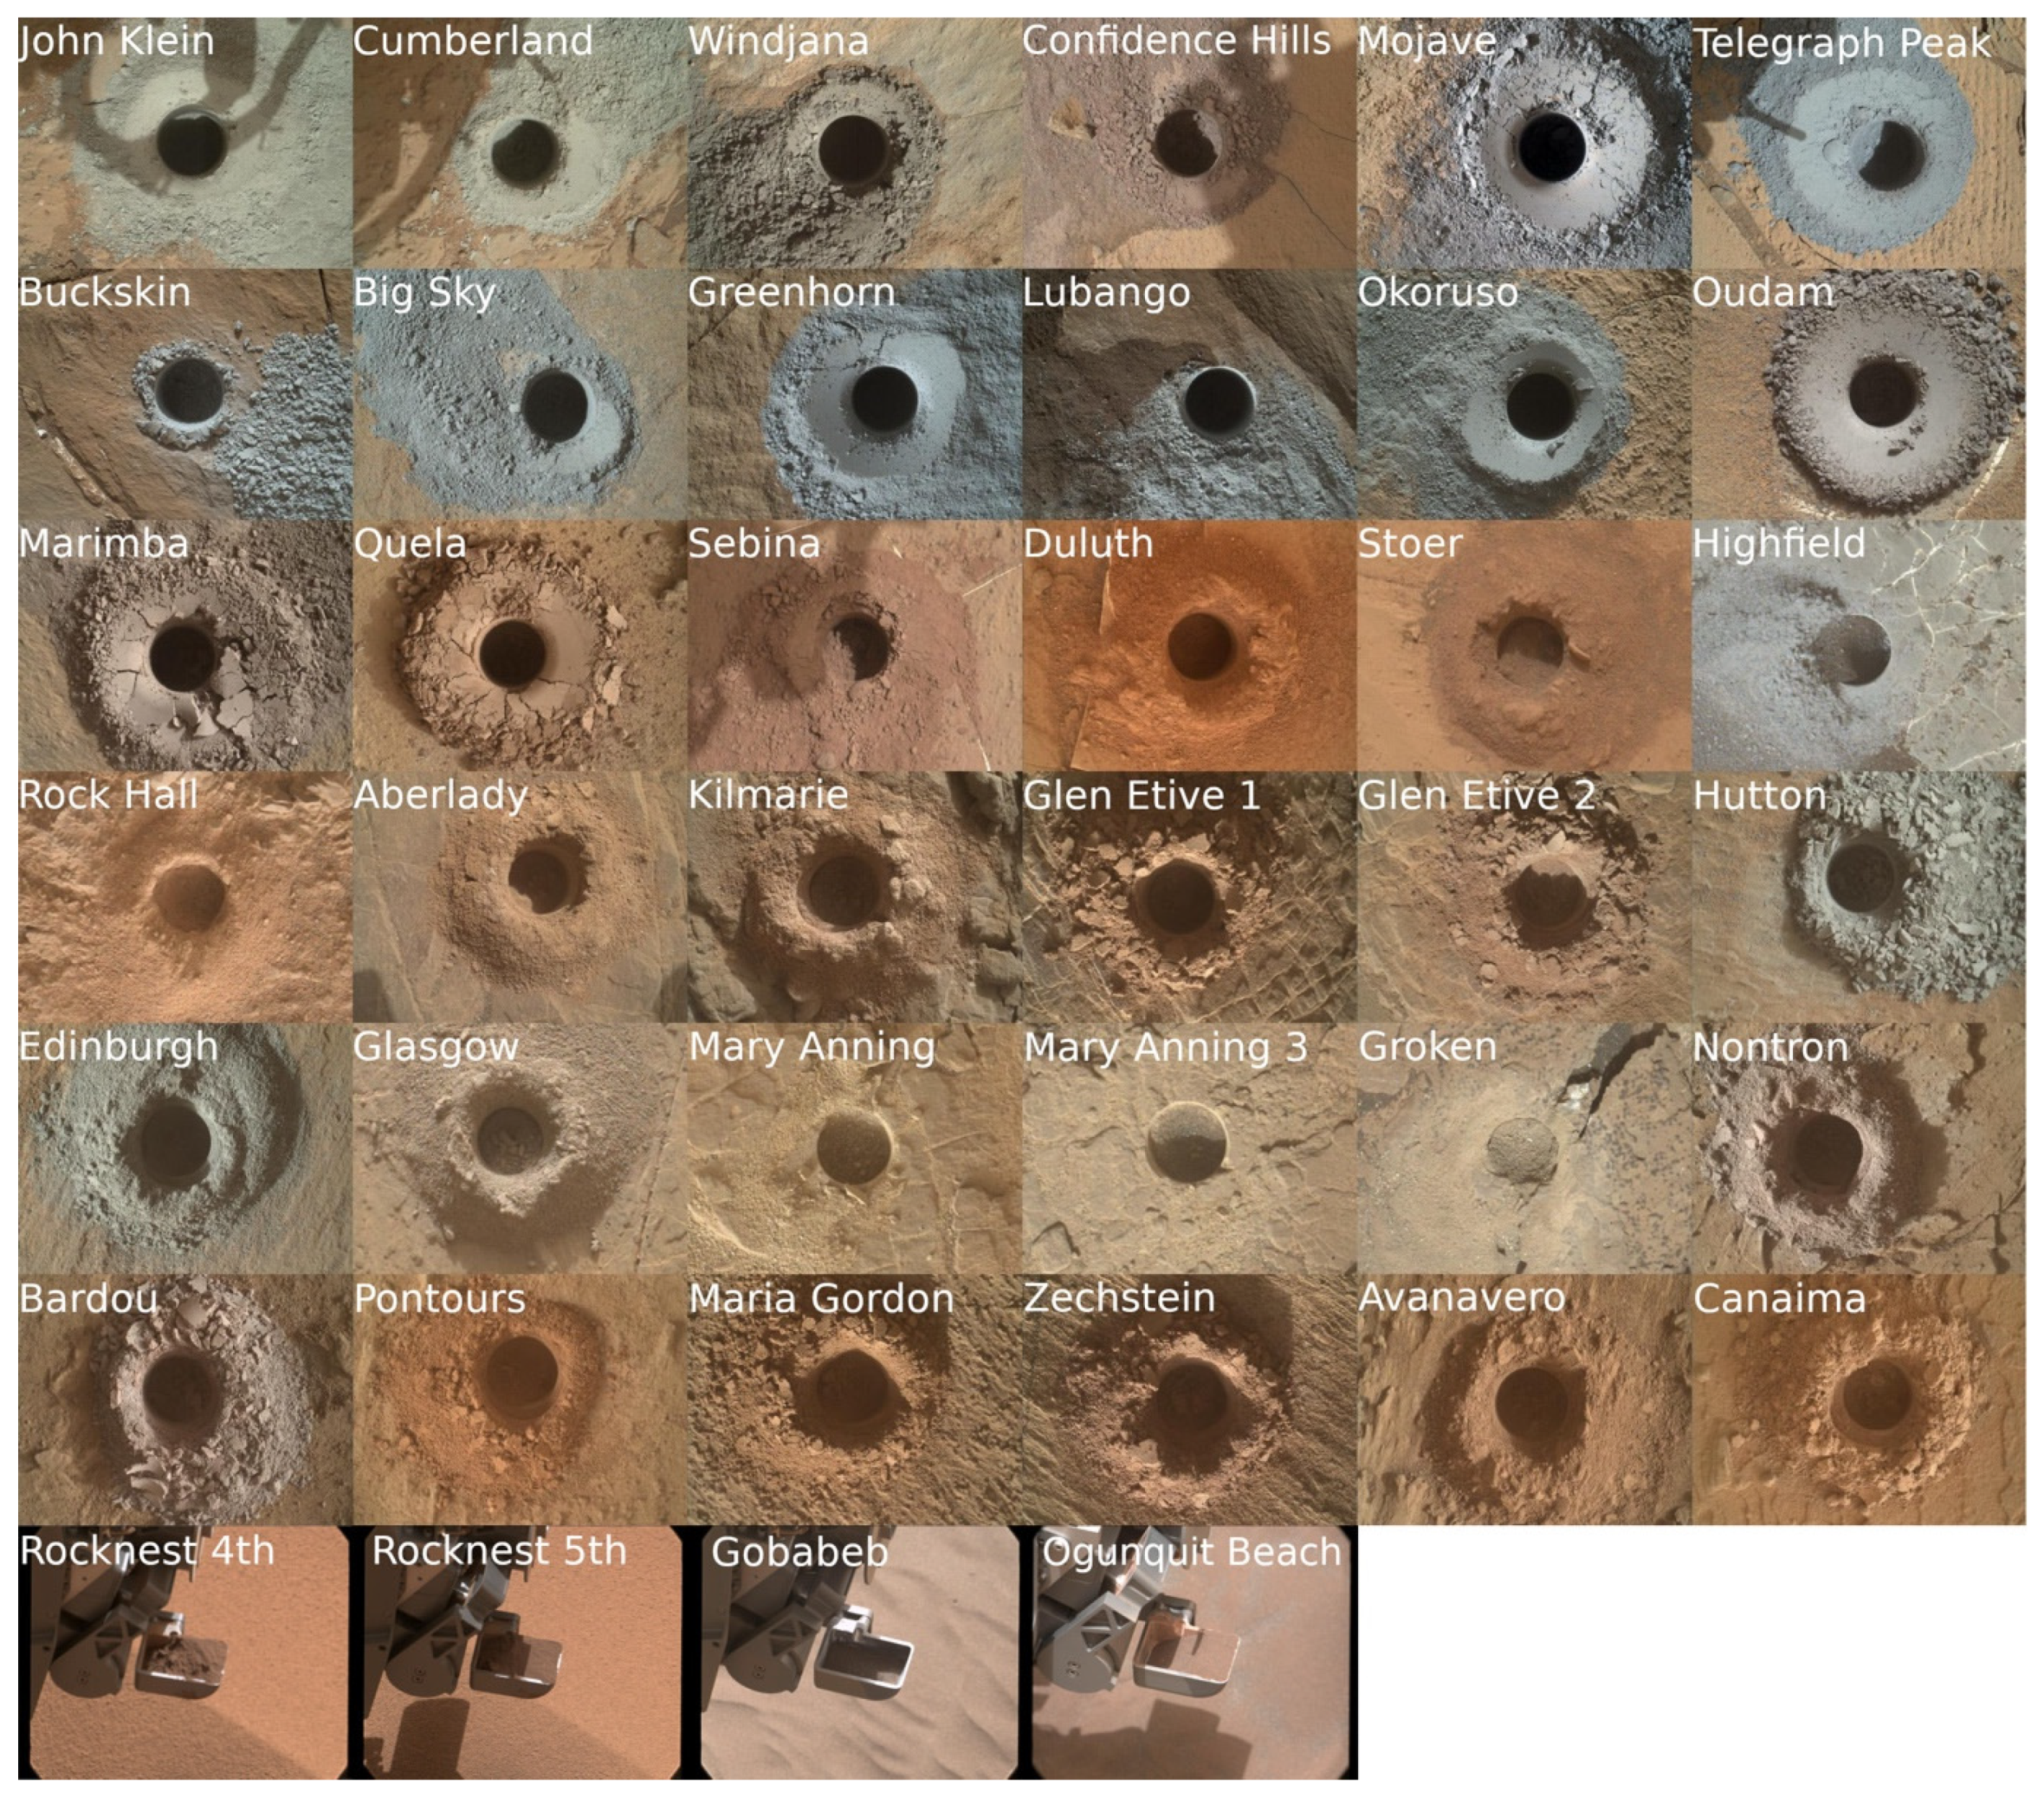
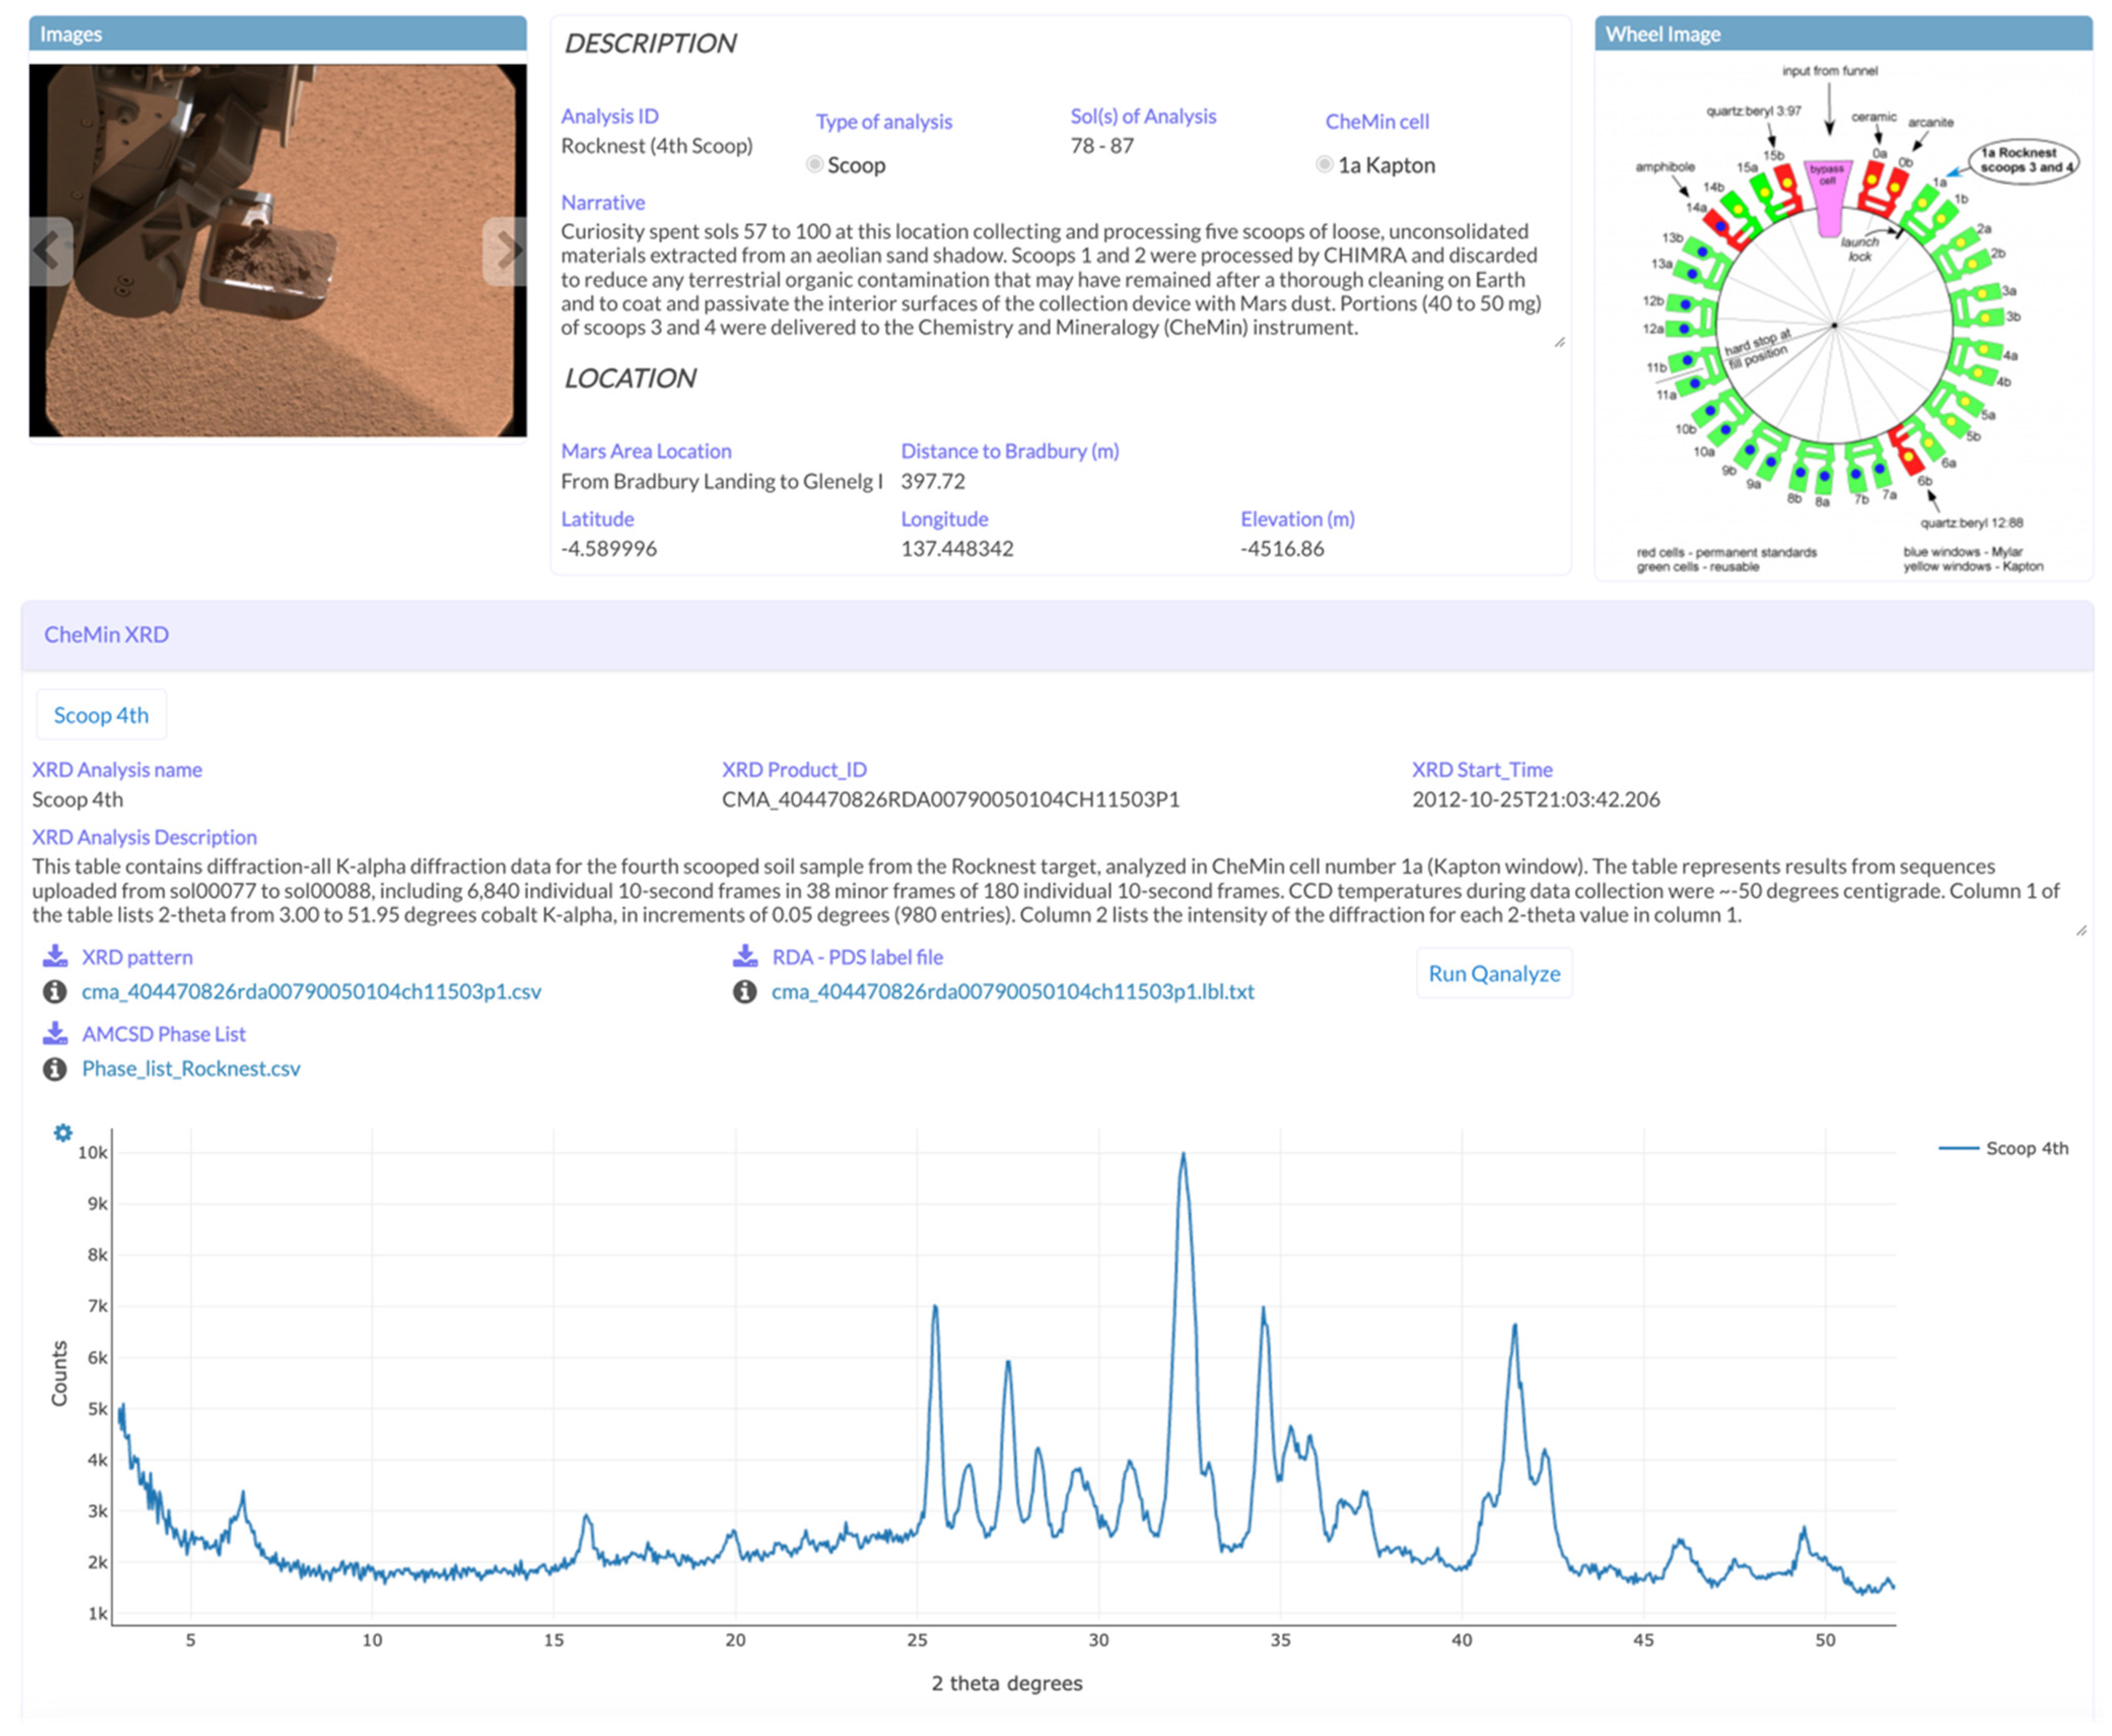
| Analysis ID | Mars Area Location | Analysis Type | CheMin cell | XRD Sol(s) of Analysis | Drill Sol | Elevation (m) |
|---|---|---|---|---|---|---|
| Rocknest (4th Scoop) | From Bradbury Landing to Glenelg Intrigue | Scoop | 1a Kapton | 78–87 | 74 | −4516.86 |
| Rocknest (5th scoop) | From Bradbury Landing to Glenelg Intrigue | Scoop | 7a mylar | 94–119 | 93 | −4516.86 |
| John Klein | Yellowknife Bay | Drill | 13b mylar | 195–272, 473–488 | 182 | −4520.46 |
| Cumberland | Yellowknife Bay | Drill | 12b mylar | 282–432 | 279 | −4520.24 |
| Windjana | Kimberley | Drill | 13a mylar | 623–694 | 621 | −4478.55 |
| Confidence Hills | Pahrump Hills, Murray formation | Drill | 12a mylar | 765–785 | 756 | −4460.62 |
| Mojave2 | Pahrump Hills, Murray formation | Drill | 6a Kapton | 884–894 | 867 | −4459.71 |
| Telegraph Peak | Pahrump Hills, Murray formation | Drill | 5b Kapton | 922–949 | 905 | −4453.51 |
| Buckskin | Pahrump Hills, Murray formation | Drill | 14b Kapton | 1061–1078 | 1060 | −4447.04 |
| Big Sky | Naukluft Plateau | Drill | 7b mylar | 1121–1131 | 1116 | −4434.42 |
| Greenhorn | Naukluft Plateau | Drill | 8a mylar | 1139–1148 | 1134 | −4434.23 |
| Gobabeb | Bagnold Dune Field | Scoop | 7a mylar | 1227–1280 | 1224 | −4423.76 |
| Lubango | Naukluft Plateau | Drill | 8a mylar | 1323–1330 | 1320 | −4429.04 |
| Okoruso | Naukluft Plateau | Drill | 7b mylar | 1334–1346 | 1332 | −4429.17 |
| Oudam | Hartmann’s Valley member, Murray formation | Drill | 12a mylar | 1362–1369 | 1361 | −4435.68 |
| Oudam 13a | Hartmann’s Valley member, Murray formation | Drill | 13a mylar | 1375- 1387 | 1375 | −4435.59 |
| Marimba2 | Karasburg member, Murray formation | Drill | 8b mylar | 1425–1436 | 1422 | −4410.68 |
| Quela | Karasburg member, Murray formation | Drill | 5a Kapton | 1470−1480 | 1464 | −4379.26 |
| Sebina | Sutton Island member, Murray formation | Drill | 4b Kapton | 1496–1507 | 1495 | −4360.89 |
| Ogunquit Beach | Bagnold Dune | Scoop | 1a Kapton | 1832−1931 | 1829? | −4299.95 |
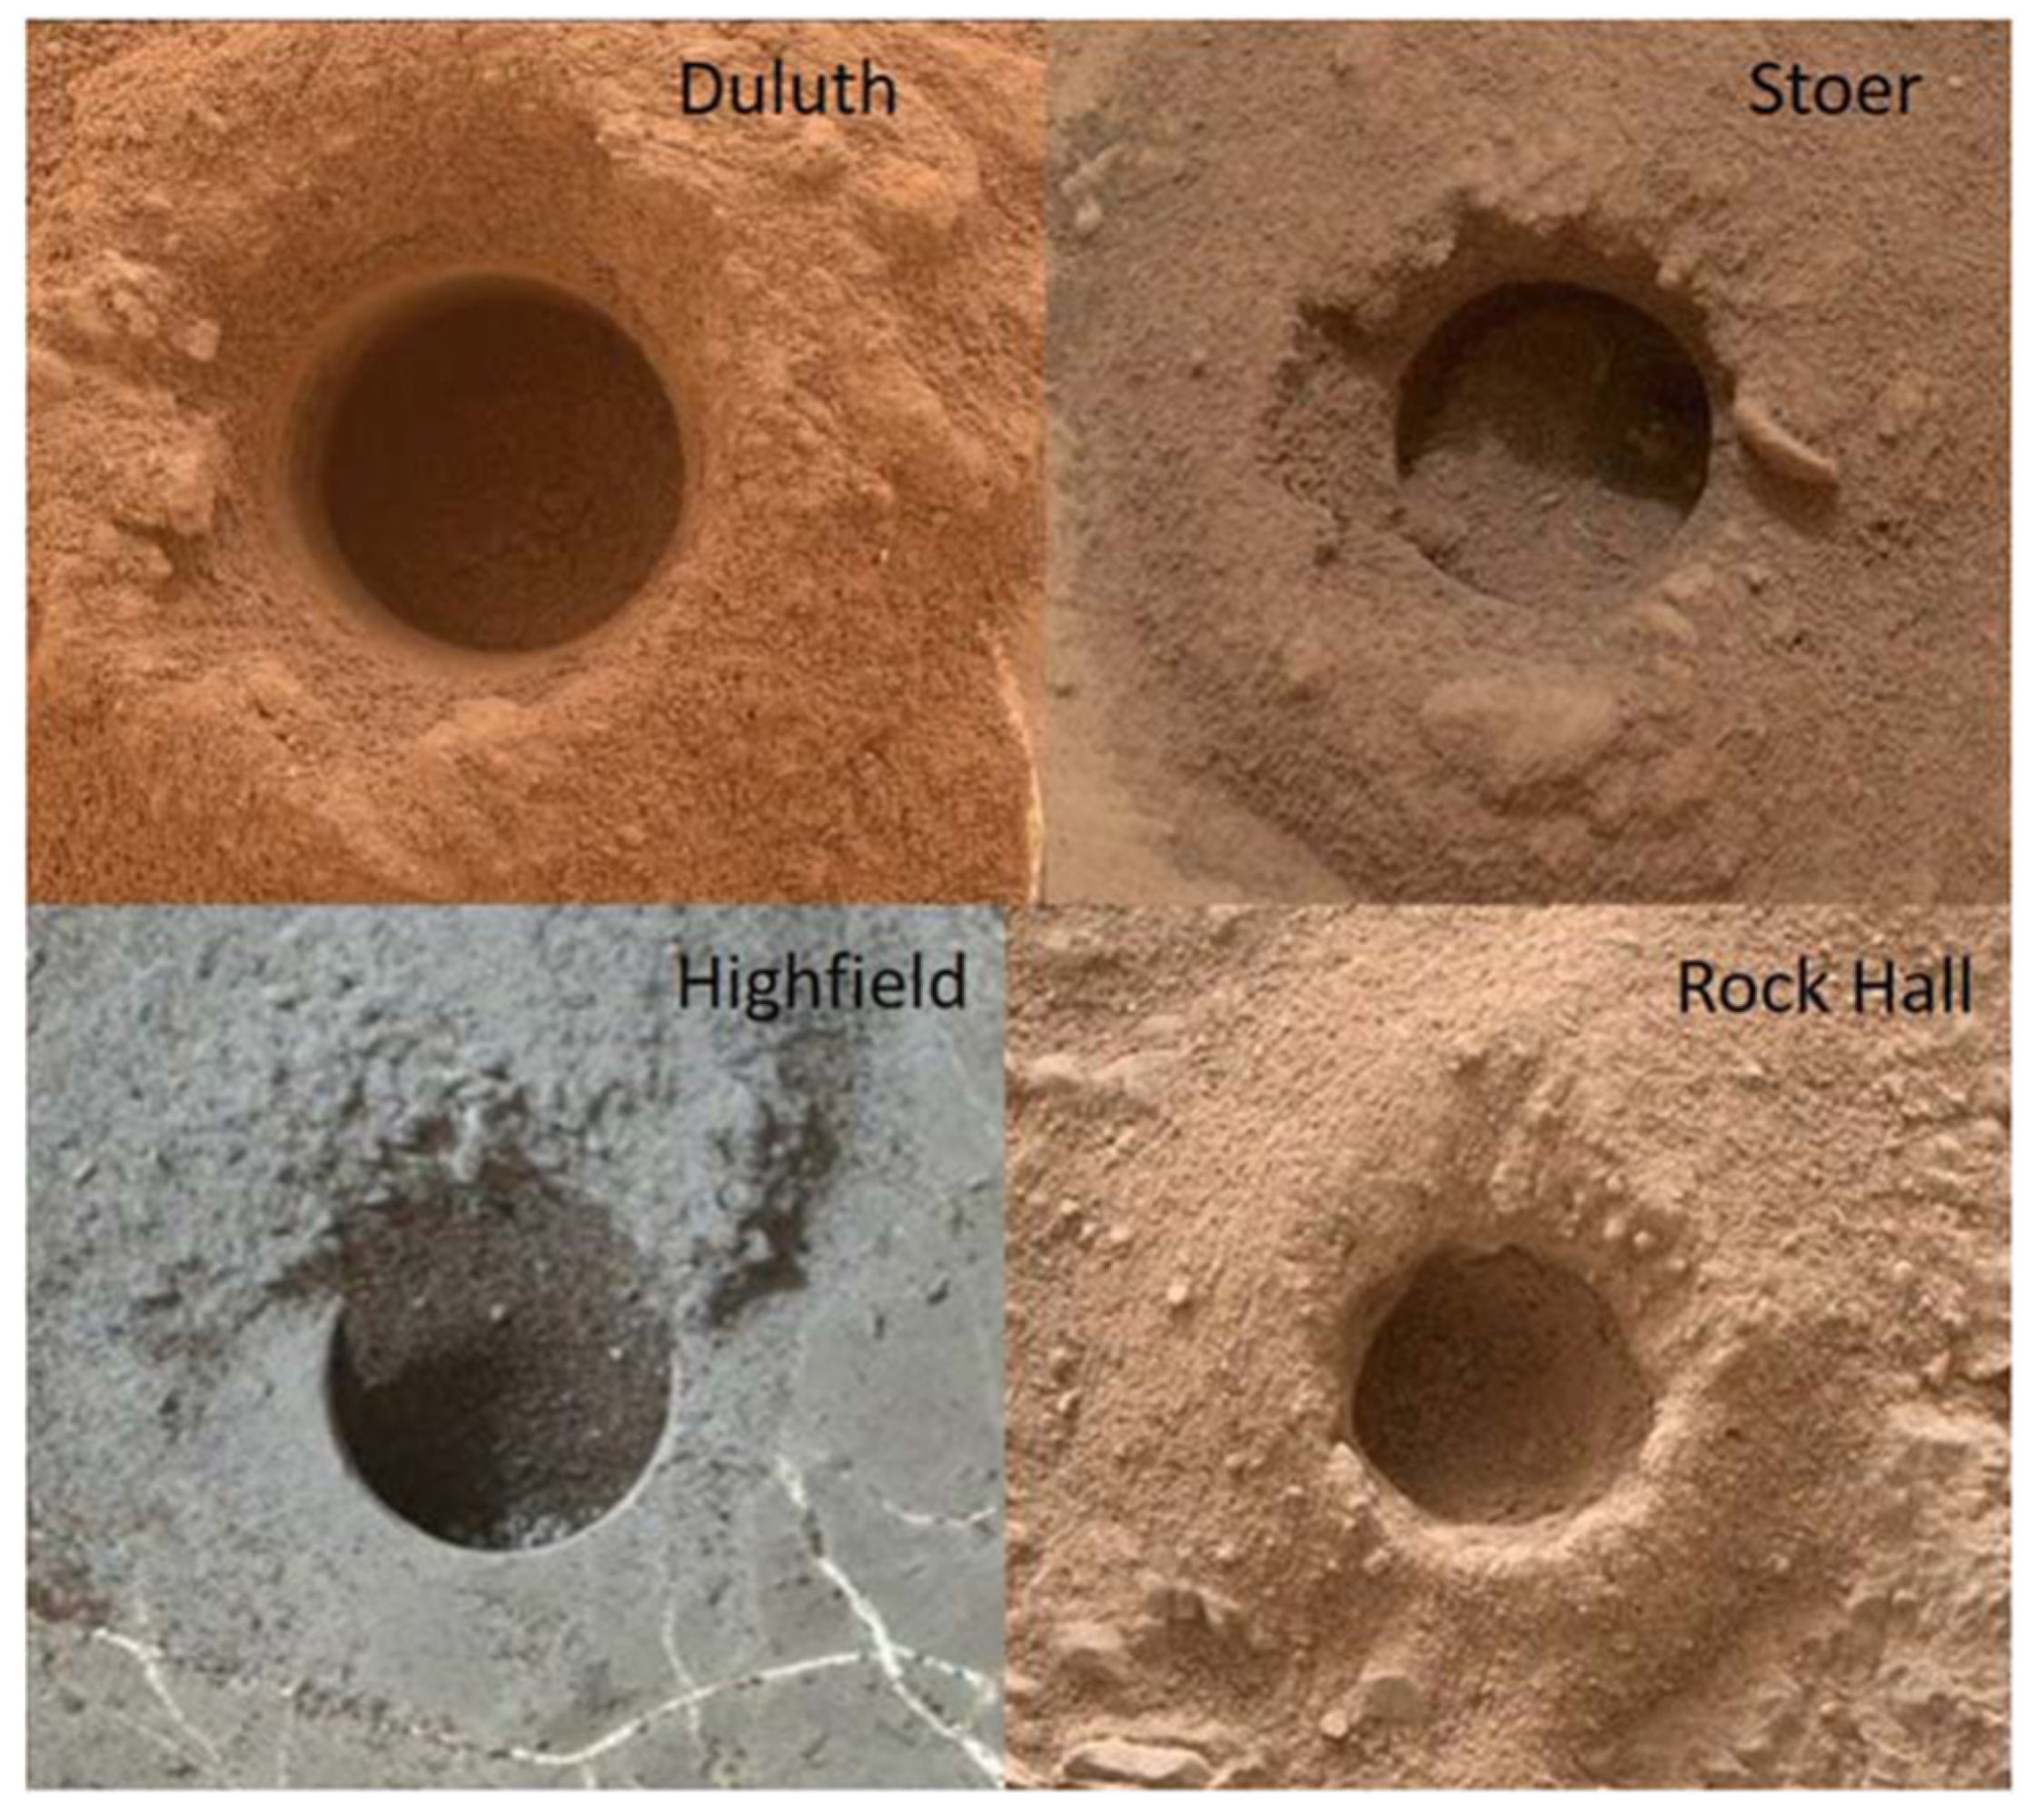
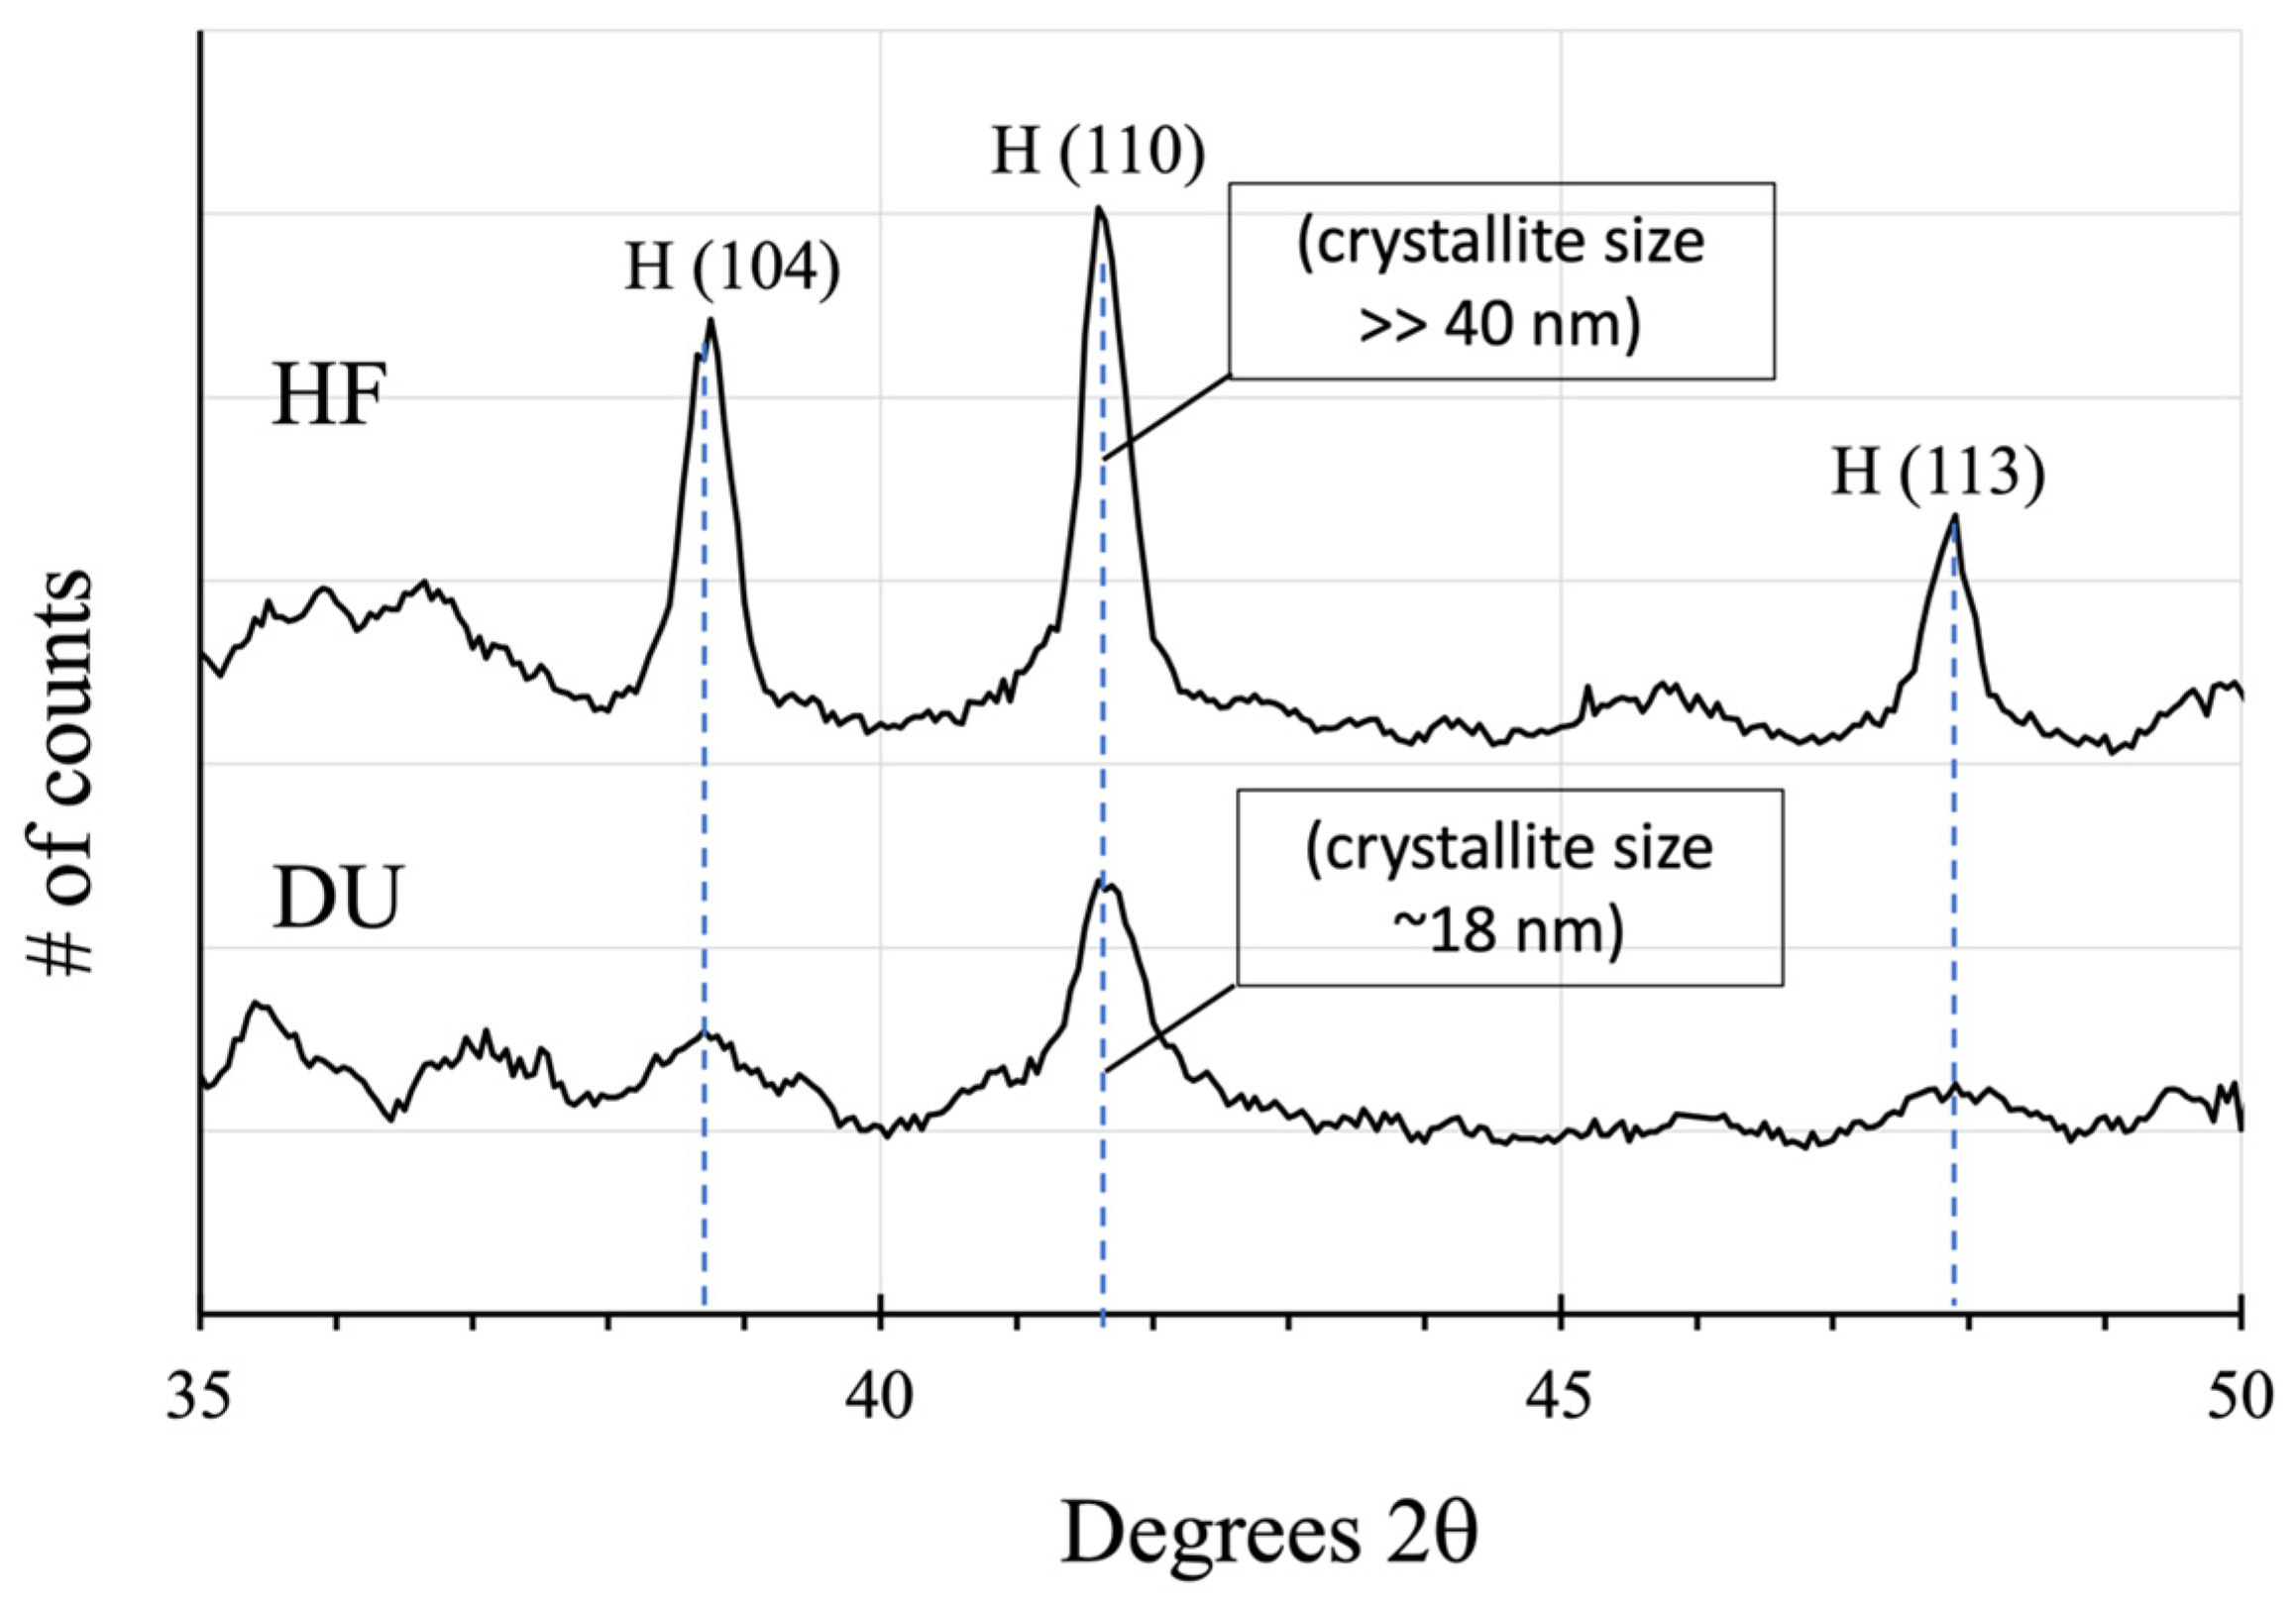
| Duluth | Blunts Point member, Vera Rubin ridge | Drill | 13b mylar | 2068−2095 | 2057 | −4191.63 |
| Stoer | Pettegrove Point member, Vera Rubin ridge | Drill | 10a mylar | 2141−2151 | 2136 | −4170.39 |
| Highfield | Jura member, Vera Rubin ridge | Drill | 10a mylar | 2226−2242 | 2224 | −4146.75 |
| Rock Hall | Jura member, Vera Rubin ridge | Drill | 7b mylar | 2264−2284 | 2261 | −4143.69 |
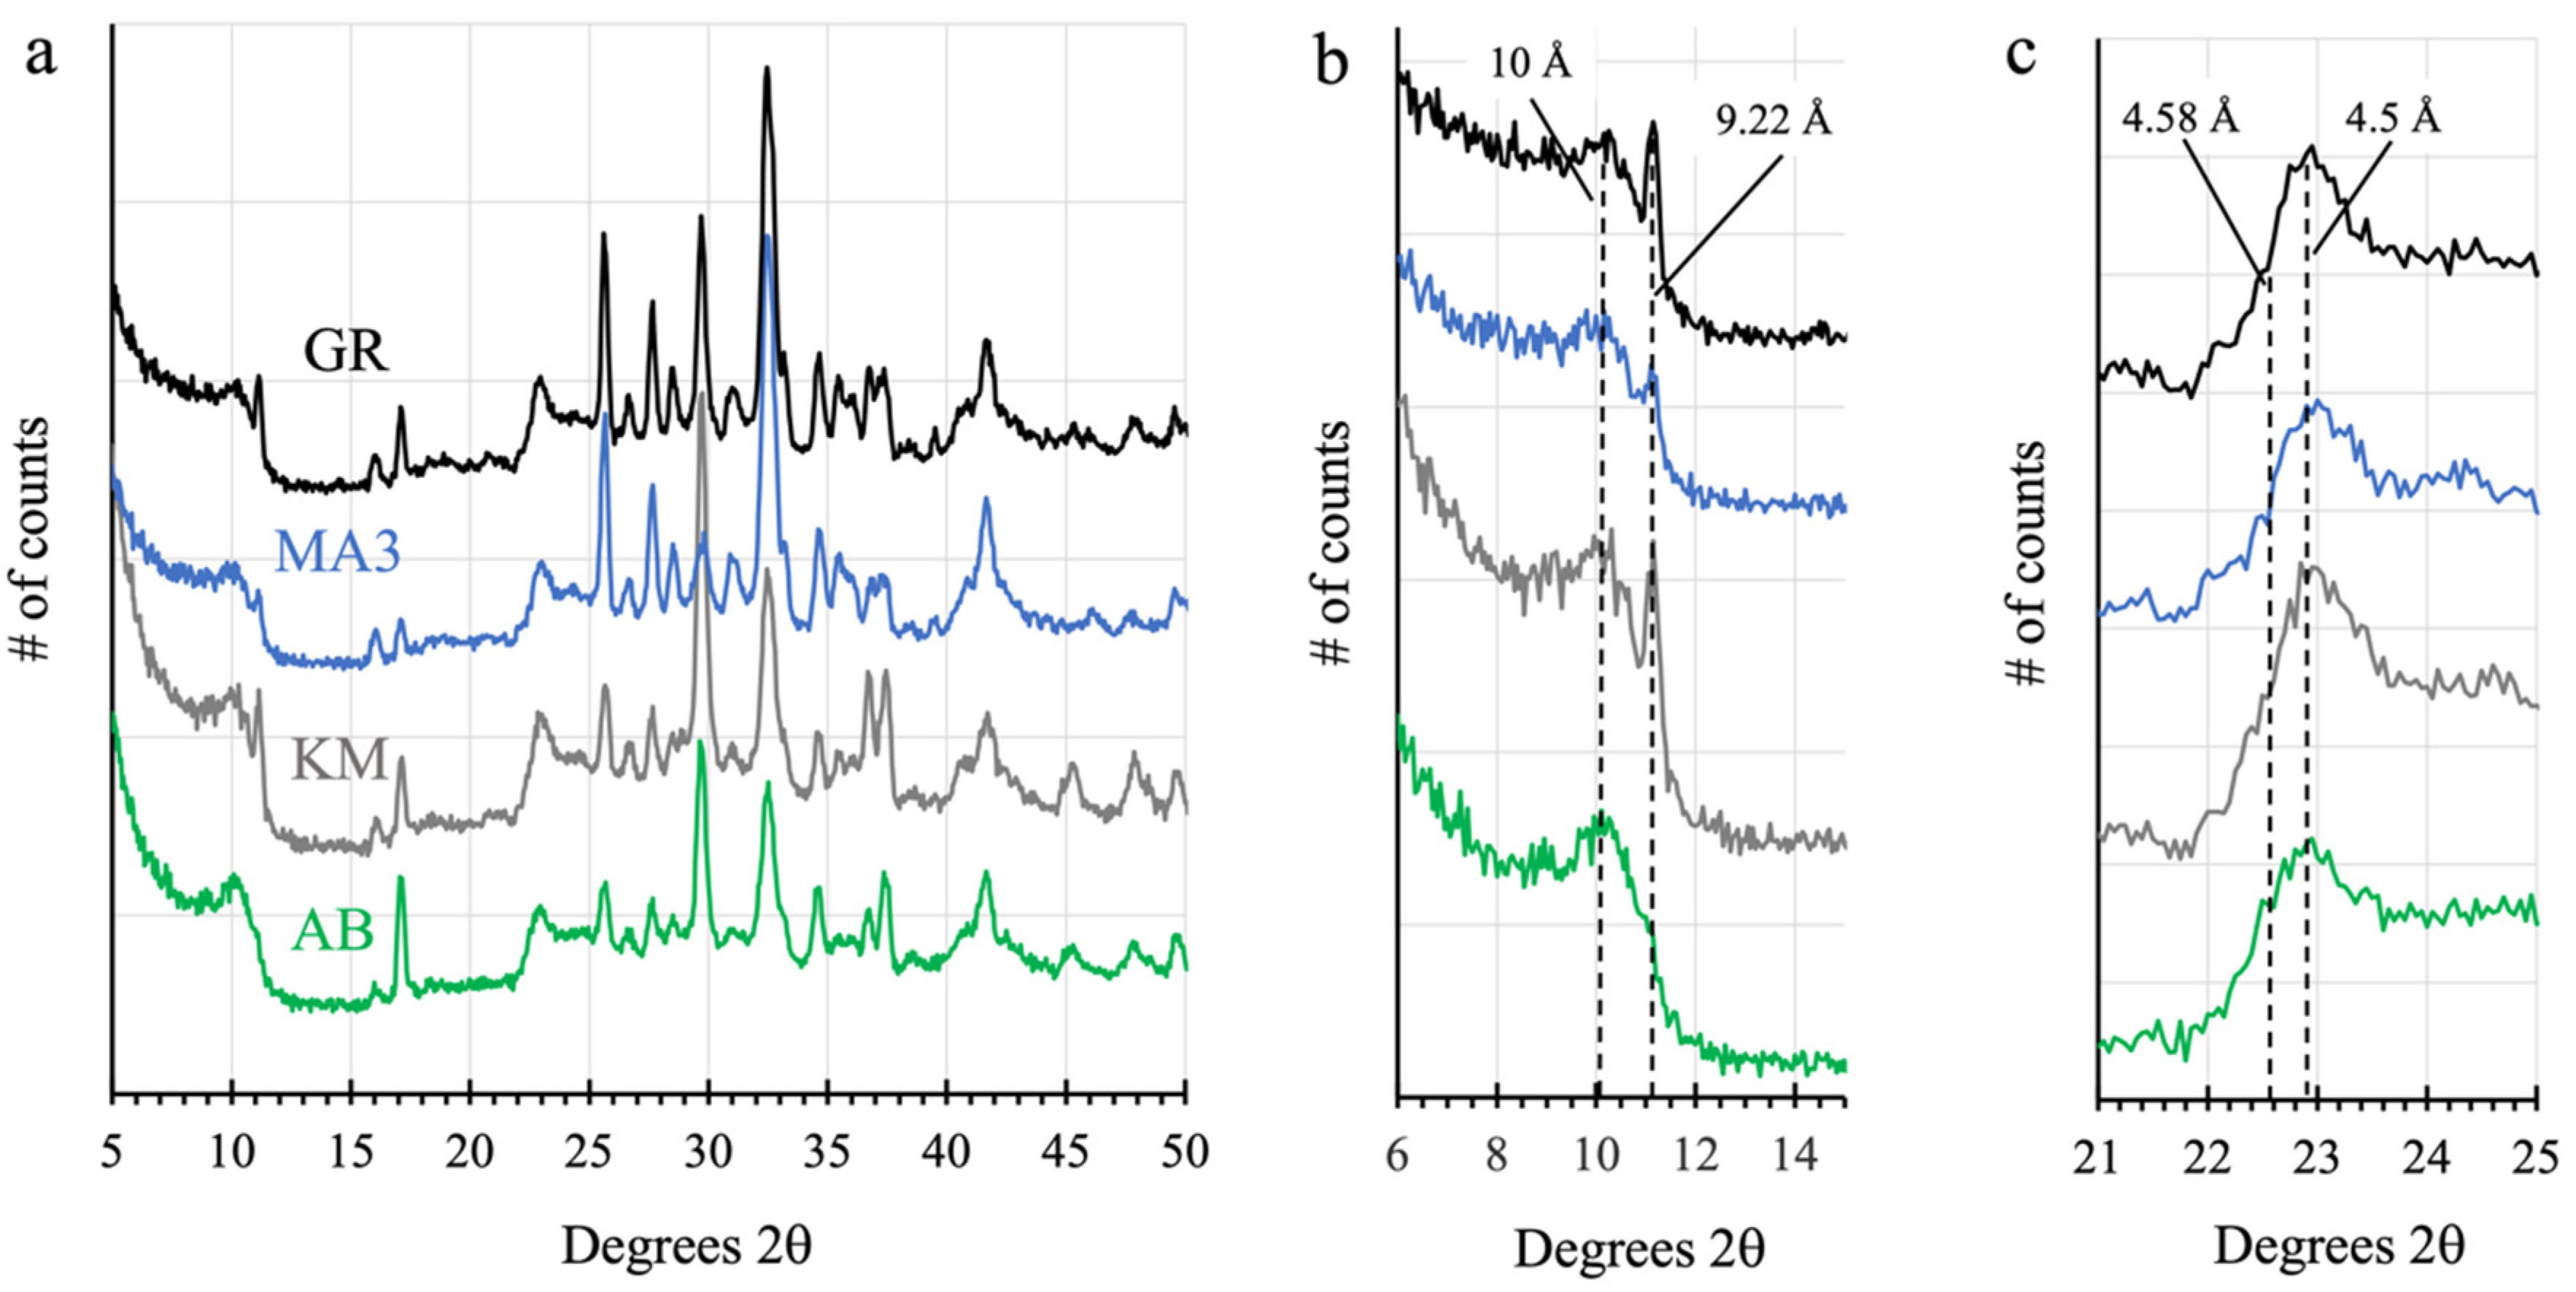
| Aberlady | Clay-bearing unit—Glen Torridon | Drill | 8a mylar | 2373−2384 | 2370 | −4157.79 |
| Kilmarie | Clay-bearing unit—Glen Torridon | Drill | 9b mylar | 2388−2400 | 2384 | −4157.93 |
| Glen Etive 1 | Glen Torridon | Drill | 8b mylar | 2492−2503 | 2486 | −4132.99 |
| Glen Etive 2 | Glen Torridon | Drill | 8a mylar | 2543−2555 | 2527 | −4132.95 |
| Hutton | Glen Torridon | Drill | 12a mylar | 2672−2678 | 2668 | −4095.84 |
| Edinburgh | Glen Torridon | Drill | 7b mylar | 2715−2723 | 2711 | −4088.44 |
| Glasgow | Glen Torridon | Drill | 7b mylar | 2758−2774 | 2754 | −4107.93 |
| Mary Anning | Glen Torridon | Drill | 7a mylar | 2842−2854 | 2828? | −4128.06 |
| Mary Anning 3 | Glen Torridon | Drill | 7a mylar | 2888−2894 | 2870 | −4128.06 |
| Groken | Glen Torridon | Drill | 9a mylar | 2912−2930 | 2910 | −4127.91 |
| Nontron | Clay mineral—Sulfate mineral transition region | Drill | 9a mylar | 3058−3077 | 3056 | −4072.91 |
| Bardou | Clay mineral—Sulfate mineral transition region | Drill | 4a Kapton | 3097−3113 | 3094 | −4066.48 |
| Pontours | Clay mineral—Sulfate mineral transition region | Drill | 1a Kapton | 3172 | 3170 | −4041.25 |
| Maria Gordon | Clay mineral—Sulfate mineral transition region | Drill | 1a Kapton | 3232 | 3229 | −4015.23 |
| Zechstein | Clay mineral—Sulfate mineral transition region | Drill | 1a Kapton | 3292 | 3289 | −3991.11 |
| Avanavero | Clay mineral—Sulfate mineral transition region | Drill | 15a Kapton | 3517−3520 | 3512 | −3920 |
| Canaima | Sulfate Bearing Unit | Drill | 15a Kapton | 3614 | 3612 | −3880 |
| Tapo Caparo | Sulfate Bearing Unit | Drill | 15a Kapton | 3755 | 3752 | −3860 |
| Ubajara | Sulfate Bearing Unit | Drill | 15a Kapton | 3825−3827 | 3823 | −3800 |
| Sequoia | Sulfate Bearing Unit | Drill | 1b Kapton | 3982−3991 | 3982 | −3760 |
| Mineral King | Sulfate Bearing Unit | Drill | 2a Kapton | 4113 | 4110 |
References
- Anderson, R.C.; Jandura, L.; Okon, A.B.; Sunshine, D.; Roumeliotis, C.; Beegle, L.W.; Hurowitz, J.; Kennedy, B.; Limonadi, D.; McCloskey, S.; et al. Collecting Samples in Gale Crater, Mars; an Overview of the Mars Science Laboratory Sample Acquisition, Sample Processing and Handling System. Space Sci. Rev. 2012, 170, 57–75. [Google Scholar] [CrossRef]
- Blake, D.; Vaniman, D.; Achilles, C.; Anderson, R.; Bish, D.; Bristow, T.; Chen, C.; Chipera, S.; Crisp, J.; Marais, D.D.; et al. Characterization and Calibration of the CheMin Mineralogical Instrument on Mars Science Laboratory. Space Sci. Rev. 2012, 170, 341–399. [Google Scholar] [CrossRef]
- Thomson, B.J.; Bridges, N.T.; Milliken, R.; Baldridge, A.; Hook, S.J.; Crowley, J.K.; Marion, G.M.; de Souza Filho, C.R.; Brown, A.J.; Weitz, C.M. Constraints on the origin and evolution of the layered mound in Gale Crater, Mars using Mars Reconnaissance Orbiter data. Icarus 2011, 214, 413–432. [Google Scholar] [CrossRef]
- Malin, M.C.; Edgett, K.S. Sedimentary rocks of early Mars. Science 2000, 290, 1927–1937. [Google Scholar] [CrossRef] [PubMed]
- Milliken, R.E.; Grotzinger, J.P.; Thomson, B.J. Paleoclimate of Mars as captured by the stratigraphic record in Gale Crater. Geophys. Res. Lett. 2010, 37, L04201. [Google Scholar] [CrossRef]
- Fraeman, A.A.; Arvidson, R.E.; Catalano, J.G.; Grotzinger, J.P.; Morris, R.V.; Murchie, S.L.; Stack, K.M.; Humm, D.C.; McGovern, J.A.; Seelos, F.P.; et al. A hematite-bearing layer in Gale Crater, Mars: Mapping and implications for past aqueous conditions. Geology 2013, 41, 1103–1106. [Google Scholar] [CrossRef]
- Fraeman, A.A.; Ehlmann, B.L.; Arvidson, R.E.; Edwards, C.S.; Grotzinger, J.P.; Milliken, R.E.; Quinn, D.P.; Rice, M.S. The stratigraphy and evolution of lower Mount Sharp from spectral, morphological, and thermophysical orbital data sets. J. Geophys. Res. Planets 2016, 121, 1713–1736. [Google Scholar] [CrossRef] [PubMed]
- Grotzinger, J.P.; Crisp, J.; Vasavada, A.R.; Anderson, R.C.; Baker, C.J.; Barry, R.; Blake, D.F.; Conrad, P.; Edgett, K.S.; Ferdowski, B.; et al. Mars Science Laboratory Mission and Science Investigation. Space Sci. Rev. 2012, 170, 5–56. [Google Scholar] [CrossRef]
- Edgett, K.S.; Yingst, R.A.; Ravine, M.A.; Caplinger, M.A.; Maki, J.N.; Ghaemi, F.T.; Schaffner, J.A.; Bell, J.F.; Edwards, L.J.; Herkenhoff, K.E.; et al. Curiosity’s Mars Hand Lens Imager (MAHLI) Investigation. Space Sci. Rev. 2012, 170, 259–317. [Google Scholar] [CrossRef]
- Malin, M.C.; Caplinger, M.A.; Edgett, K.S.; Ghaemi, F.T.; Ravine, M.A.; Schaffner, J.A.; Baker, J.M.; Bardis, J.D.; DiBiase, D.R.; Maki, J.N.; et al. The Mars Science Laboratory (MSL) Mast-mounted Cameras (Mastcams) Flight Instruments. In Proceedings of the 41st Lunar and Planetary Science Conference, The Woodlands, TX, USA, 1–5 March 2010; Available online: https://www.lpi.usra.edu/meetings/lpsc2010/pdf/1123.pdf (accessed on 3 May 2024).
- Gellert, R.; Rieder, R.; Brückner, J.; Clark, B.C.; Dreibus, G.; Klingelhöfer, G.; Lugmair, G.; Ming, D.W.; Wänke, H.; Yen, A.; et al. Alpha Particle X-ray Spectrometer (APXS): Results from Gusev crater and calibration report. J. Geophys. Res. 2006, 111, E02S05. [Google Scholar] [CrossRef]
- Campbell, J.L.; Perrett, G.M.; Gellert, R.; Andrushenko, S.M.; Boyd, N.I.; Maxwell, J.A.; King, P.L.; Schofield, C.D.M. Calibration of the Mars Science Laboratory Alpha Particle X-ray Spectrometer. Space Sci. Rev. 2012, 170, 319–340. [Google Scholar] [CrossRef]
- Maurice, S.; Wiens, R.C.; Saccoccio, M.; Barraclough, B.; Gasnault, O.; Forni, O.; Mangold, N.; Baratoux, D.; Bender, S.; Berger, G.; et al. ChemCam Activities and Discoveries during the Nominal Mission of Mars Science Laboratory in Gale crater, Mars. Space Sci. Rev. 2012, 170, 95–166. [Google Scholar] [CrossRef]
- Wiens, R.C.; Maurice, S.; Barraclough, B.; Saccoccio, M.; Barkley, W.C.; Bell, J.F., III; Bender, S.; Bernardin, J.; Blaney, D.; Blank, J.; et al. The ChemCam Instrument Suite on the Mars Science Laboratory (MSL) Rover: Body Unit and Combined System Tests. Space Sci. Rev. 2012, 170, 167–227. [Google Scholar] [CrossRef]
- Mahaffy, P.R.; Webster, C.R.; Cabane, M.; Conrad, P.G.; Coll, P.; Atreya, S.K.; Arvey, R.; Barciniak, M.; Benna, M.; Bleacher, L.; et al. The Sample Analysis at Mars Investigation and Instrument Suite. Space Sci. Rev. 2012, 170, 401–478. [Google Scholar] [CrossRef]
- Johnson, D.L.; Carroll, B.C.; Leland, R.S. MSL/CheMin Cryocooler System Requirements and Characterization Tests. In Proceedings of the 15th International Cryocooler Conference Long Beach, Long Beach, CA, USA, 9–12 June 2008; In Cryocoolers 15. pp. 621–630. [Google Scholar]
- Lafuente, B.; Blake, D.; Bristow, T.; Rampe, E.; Downs, R.; Sarrazin, P.; Downs, G.; Stone, N.; Pires, A.; Vaniman, D.; et al. Gale Crater Mineralogy and Geochemistry Sample Database (GCMGS). [Data set]. Open Data Repos. 2021. [Google Scholar] [CrossRef]
- Morrison, S.M.; Downs, R.T.; Blake, D.F.; Vaniman, D.T.; Ming, D.W.; Hazen, R.M.; Treiman, A.H.; Achilles, C.N.; Yen, A.S.; Morris, R.V.; et al. Crystal Chemistry of Martian Minerals from Bradbury Landing through Naukluft Plateau, Gale crater, Mars. Am. Miner. 2018, 103, 857–871. [Google Scholar] [CrossRef]
- Lafuente, B.; Downs, R.T.; Yang, H.; Stone, N. Highlights in Mineralogical Crystallography. Armbruster, T., Danisi, R.M., Eds.; W. De Gruyter: Berlin, Germany, 2015; pp. 1–30. Available online: https://rruff.info/about/downloads/HMC1-30.pdf (accessed on 3 May 2024).
- Morris, R.V.; Vaniman, D.T.; Blake, D.F.; Gellert, R.; Chipera, S.J.; Rampe, E.B.; Ming, D.W.; Morrison, S.M.; Downs, R.T.; Treiman, A.H.; et al. Silicic volcanism on Mars evidenced by tridymite in high-SiO2 sedimentary rock at Gale crater. Proc. Natl. Acad. Sci. USA 2016, 113, 7071–7076. [Google Scholar] [CrossRef] [PubMed]
- Dera, P.; Zhuravlev, K.; Prakapenka, V.; Rivers, M.L.; Finkelstein, G.J.; Grubor-Urosevic, O.; Tschauner, O.; Clark, S.M.; Downs, R.T. High pressure single-crystal micro-X-ray diffraction analysis with GSE_ADA/RSV software. High Press. Res. 2013, 33, 466–484. [Google Scholar] [CrossRef]
- Bish, D.L.; Howard, S.A. Quantitative phase analysis using the Rietveld method. J. Appl. Crystallogr. 1988, 21, 86–91. [Google Scholar] [CrossRef]
- Bish, D.L.; Post, J.E. Quantitative mineralogical analysis using the Rietveld full-pattern fitting method. Am. Miner. 1993, 78, 932–942. [Google Scholar]
- Morrison, S.M.; Downs, R.T.; Blake, D.F.; Prabhu, A.E.; Vaniman, D.T.; Ming, D.W.; Rampe, E.B.; Hazen, R.M.; Achilles, C.N.; Treiman, A.H.; et al. Relationships between unit-cell parameters and composition for rock-forming minerals on Earth, Mars, and other extraterrestrial bodies. Am. Miner. 2018, 103, 848–856. [Google Scholar] [CrossRef]
- Morrison, S.M.; David, F.B.; Thomas, F.B.; Nicholas, C.; Steve, J.C.; Patricia, I.C.; Robert, T.D.; Amed, E.; Robert, M.H.; Johannes, M.M.; et al. Expanded Insights into Martian Mineralogy: Updated Analysis of Gale Crater’s Mineral Composition via CheMin Crystal Chemical Investigations. Minerals, 2024; in the press. [Google Scholar]
- Patterson, A.L. The Diffraction of X-rays by Small Crystalline Particles. Phys. Rev. 1939, 56, 972. [Google Scholar] [CrossRef]
- Bristow, T.F.; Bish, D.L.; Vaniman, D.T.; Morris, R.V.; Blake, D.F.; Grotzinger, J.P.; Rampe, E.B.; Crisp, J.A.; Achilles, C.N.; Ming, D.W.; et al. The origin and implications of clay minerals from Yellowknife Bay, Gale crater, Mars. Am. Mineral. 2015, 100, 824–836. [Google Scholar] [CrossRef] [PubMed]
- Bristow, T.F.; Rampe, E.B.; Achilles, C.N.; Blake, D.F.; Chipera, S.J.; Craig, P.; Crisp, J.A.; Marais, D.J.D.; Downs, R.T.; Gellert, R.; et al. Clay mineral diversity and abundance in sedimentary rocks of Gale crater, Mars. Sci. Adv. 2018, 4, eaar3330. [Google Scholar] [CrossRef] [PubMed]
- Vaniman, D.T.; Bish, D.L.; Ming, D.W.; Bristow, T.F.; Morris, R.V.; Blake, D.F.; Chipera, S.J.; Treiman, A.H.; Rampe, E.B.; Rice, M.; et al. Mineralogy of a mudstone at Yellowknife Bay, Gale crater, Mars. Science 2014, 343, 1243480. [Google Scholar] [CrossRef] [PubMed]
- Moore, D.M.; Reynolds, R.C., Jr. X-ray Diffraction and the Identification and Analysis of Clay Minerals; Oxford University Press: Oxford, UK, 1997; 400p, ISBN 9780195087130. [Google Scholar]
- Bristow, T.F.; Grotzinger, J.P.; Rampe, E.B.; Cuadros, J.; Chipera, S.J.; Downs, G.W.; Fedo, C.M.; Frydenvang, J.; McAdam, A.C.; Morris, R.V.; et al. Brine Driven Diagenesis of Clay Minerals in Gale Crater, Mars. Science 2021, 373, 198–204. [Google Scholar] [CrossRef]
- Thorpe, M.T.; Bristow, T.F.; Rampe, E.B.; Tosca, N.J.; Grotzinger, J.P.; Bennett, K.A.; Achilles, C.N.; Blake, D.F.; Chipera, S.J.; Downs, G.; et al. Mars Science Laboratory CheMin data from the Glen Torridon region and the significance of lake-groundwater interactions in interpreting mineralogy and sedimentary history. JGR Planets 2022, 127, e2021JE007099. [Google Scholar] [CrossRef]
- Bergmann, J. Rietveld Analysis Program BGMN Manual. 2005. Available online: http://www.bgmn.de/BGMN_manual_2005.pdf (accessed on 3 May 2024).
- McAdam, A.C.; Sutter, B.; Archer, P.D.; Franz, H.B.; Wong, G.M.; Lewis, J.M.T.; Eigenbrode, J.L.; Stern, J.C.; Knudson, C.A.; Clark, J.; et al. Constraints on the mineralogy and geochemistry of Vera Rubin ridge, Gale crater, Mars, from Mars Science Laboratory Sample Analysis at Mars evolved gas analyses. J. Geophys. Res. Planets 2020, 125, e2019JE006309. [Google Scholar] [CrossRef]
- Chipera, S.J.; Bish, D.L. FULLPAT: A full-pattern quantitative analysis program for X-ray powder diffraction using measured and calculated patterns. J. Appl. Crystallogr. 2002, 35, 744–749. [Google Scholar] [CrossRef]
- Chipera, S.J.; Bish, D.L. Fitting full X-ray diffraction patterns for quantitative analysis: A method for readily quantifying crystalline and disordered phases. Adv. Mater. Phys. Chem. 2013, 3, 47. [Google Scholar] [CrossRef]
- Chung, F.H. Quantitative interpretation of X-ray diffraction patterns of mixtures. I. Matrix-flushing method for quantitative multicomponent analysis. J. Appl. Crystallogr. 1974, 7, 519–525. [Google Scholar] [CrossRef]
- Chung, F.H. Quantitative Interpretation of X-ray Diffraction Patterns of Mixtures. II. Adiabatic Principle of X-ray Diffraction Analysis of Mixtures. J. Appl. Crystallogr. 1974, 7, 526–531. [Google Scholar] [CrossRef]
- Achilles, C.N.; Morris, R.V.; Chipera, S.J.; Ming, D.W.; Rampe, E.B. X-ray diffraction reference intensity ratios of amorphous and poorly crystalline phases: Implications for CheMin on the Mars Science Laboratory Mission. In Proceedings of the 44th Lunar and Planetary Science Conference, The Woodlands, TX, USA, 18–22 March 2013; Available online: https://www.lpi.usra.edu/meetings/lpsc2013/pdf/3072.pdf (accessed on 3 May 2024).
- Rampe, E.B.; Bish, D.L.; Chipera, S.J.; Morris, R.V.; Achilles, C.N.; Ming, D.W.; Blake, D.F.; Anderson, R.C.; Bristow, T.F.; Crisp, J.A.; et al. Detecting Nanophase Weathering Products with CheMin: Reference Intensity Ratios of Allophane, Aluminosilicate Gel, and Ferrihydrite. In Proceedings of the 44th Lunar and Planetary Science Conference, The Woodlands, TX, USA, 18–22 March 2013; Available online: https://www.lpi.usra.edu/meetings/lpsc2013/pdf/1188.pdf (accessed on 3 May 2024).
- Smith, R.J.; Rampe, E.B.; Horgan, B.H.N.; Dehouck, E. Deriving amorphous component abundance and composition of rocks and sediments on Earth and Mars. J. Geophys. Res. Planets 2018, 123, 2485–2505. [Google Scholar] [CrossRef]
- Blake, D.F.; Morris, R.V.; Kocurek, G.; Morrison, S.M.; Downs, R.T.; Bish, D.; Ming, D.W.; Edgett, K.S.; Rubin, D.; Goetz, W.; et al. Characterization and analysis of the Rocknest sand shadow. Science 2013, 341, 1239505. [Google Scholar] [CrossRef]
- Bish, D.L.; Blake, D.F.; Vaniman, D.T.; Chipera, S.J.; Morris, R.V.; Ming, D.W.; MSL Team. X-Ray Diffraction Results from Mars Science Laboratory: Mineralogy of Rocknest Aeolian Bedform at Gale crater. Science 2013, 341, 1238932. [Google Scholar] [CrossRef]
- Bish, D.; Blake, D.; Vaniman, D.; Sarrazin, P.; Bristow, T.; Achilles, C.; Dera, P.; Chipera, S.; Crisp, J.; Downs, R.T.; et al. The first X-ray diffraction measurements on Mars. IUCrJ 2014, 1, 514–522. [Google Scholar] [CrossRef]
- Achilles, C.N.; Downs, R.T.; Ming, D.W.; Rampe, E.B.; Morris, R.V.; Treiman, A.H.; Morrison, S.M.; Blake, D.F.; Vaniman, D.T.; Ewing, R.C.; et al. Mineralogy of an active eolian sediment from the Namib dune, Gale crater, Mars. J. Geophys. Res. Planets 2017, 122, 2344–2361. [Google Scholar] [CrossRef]
- Ehlmann, B.L.; Edgett, K.S.; Sutter, B.; Achilles, C.N.; Litvak, M.L.; Lapotre, M.G.A.; Sullivan, R.; Fraeman, A.A.; Arvidson, R.E.; Blake, D.F.; et al. Chemistry, mineralogy, and grain properties at Namib and High dunes, Bagnold dune field, Gale crater, Mars: A synthesis of Curiosity rover observations. J. Geophys. Res. Planets 2017, 122, 2510–2543. [Google Scholar] [CrossRef]
- Lapotre, M.G.A.; Rampe, E.B. Curiosity’s Investigation of the Bagnold Dunes, Gale Crater: Overview of the Two-Phase Scientific Campaign and Introduction to the Special Collection. Geophys. Res. Lett. 2018, 45, 10200–10210. [Google Scholar] [CrossRef]
- Rampe, E.B.; Lapotre, M.G.A.; Bristow, T.F.; Arvidson, R.E.; Morris, R.V.; Achilles, C.N.; Weitz, C.; Blake, D.F.; Ming, D.W.; Morrison, S.M.; et al. Sand Mineralogy Within the Bagnold Dunes, Gale Crater, as Observed In Situ and From Orbit. J. Geophys. Res. Planets 2018, 45, 9488–9497. [Google Scholar] [CrossRef]
- Herkenhoff, K.E.; Grotzinger, J.; Knoll, A.H.; McLennan, S.M.; Weitz, C.; Yingst, A.; Anderson, R.; Archinal, B.A.; Arvidson, R.E.; Barrett, J.M.; et al. Surface processes recorded by rocks and soils on Meridiani Planum, Mars: Microscopic Imager observations during Opportunity’s first three extended missions. J. Geophys. Res 2008, 113, E12S32. [Google Scholar] [CrossRef]
- Sullivan, R.; Banfield, D.; Bell, J.F., III; Calvin, W.; Fike, D.; Golombek, M.; Greeley, R.; Grotzinger, J.; Herkenhoff, K.; Jerolmack, D.; et al. Aeolian processes at the Mars exploration rover Meridiani Planum landing site. Nature 2005, 436, 58–61. [Google Scholar] [CrossRef]
- Sullivan, R.; Arvidson, R.; Bell, J.F., III; Gellert, R.; Golombek, M.; Greeley, R.; Herkenhoff, K.; Johnson, J.; Thompson, S.; Whelley, P.; et al. Wind-driven particle mobility on Mars: Insights from Mars Exploration Rover observations at “El Dorado” and surroundings at Gusev Crater. J. Geophys. Res. 2008, 113, E06S07. [Google Scholar] [CrossRef]
- Soderblom, L.A.; Anderson, R.C.; Arvidson, R.E.; Bell, J.F.; Cabrol, N.A.; Calvin, W.; Christensen, P.R.; Clark, B.C.; Economou, T.; Ehlmann, B.L.; et al. Soils of Eagle Crater and Meridian Planum at the Opportunity Rover Landing Site. Science 2004, 306, 1723–1726. [Google Scholar] [CrossRef] [PubMed]
- Golombek, M.; Robinson, K.; McEwen, A.; Bridges, N.; Ivanov, B.; Tornabene, L.; Sullivan, R. Constraints on ripple migration at Meridiani Planum from Opportunity and HiRISE observations of fresh craters. J. Geophys. Res. 2010, 115, E00F08. [Google Scholar] [CrossRef]
- Ward, W.R. Large-scale variations in the obliquity of Mars. Science 1973, 181, 260–262. [Google Scholar] [CrossRef] [PubMed]
- Laskar, J.; Levrard, B.; Mustard, J.F. Large-scale variations in the obliquity of Mars. Nature 2002, 419, 375–377. [Google Scholar] [CrossRef]
- Laue, M.; Friedrich, W.; Knipping, P. Die Wellentheorie der Röntgenstrahlen. Sitzungsb. K. Bayer. Akad. Wiss. Math.-Phys. Klasse 1912, 303–322. [Google Scholar]
- Ming, D.W.; Gellert, R.; Morris, R.V.; Arvidson, R.E.; Brückner, J.; Clark, B.C.; Cohen, B.A.; D’Uston, C.; Economou, T.; Fleischer, I.; et al. Geochemical properties of rocks and soils in Gusev crater, mars: Results of the alpha particle X-ray spectrometer from Cumberland Ridge to home plate. J. Geophys. Res. 2008, 113, E12S39. [Google Scholar] [CrossRef]
- Morris, R.V.; Klingelhöfer, G.; Schröder, C.; Fleischer, I.; Ming, D.W.; Yen, A.S.; Gellert, R.; Arvidson, R.E.; Rodionov, D.S.; Crumpler, L.S.; et al. Iron mineralogy and aqueous alteration from Husband Hill through Home Plate at Gusev crater, Mars: Results from the Mössbauer instrument on the Spirit Mars Exploration Rover. J. Geophys. Res. 2008, 113, E12S42. [Google Scholar] [CrossRef]
- McSween, H.Y., Jr.; Taylor, G.J.; Wyatt, M.B. Elemental composition of the Martian crust. Science 2009, 324, 736–739. [Google Scholar] [CrossRef]
- Taylor, S.R.; McLennan, S.M. Planetary Crusts: Their Composition, Origin and Evolution; Cambridge University Press: Cambridge, UK, 2009; 378p. [Google Scholar]
- Leshin, L.A.; Mahaffy, P.R.; Webster, C.R.; Cabane, M.; Coll, P.; Conrad, P.G.; Archer, P.D.; Atreya, S.K.; Brunner, A.E.; Buch, A.; et al. Volatile, isotope, and organic analysis of martian fines with the Mars Curiosity rover. Science 2013, 341, 1238937. [Google Scholar] [CrossRef]
- Rice, M.S.; Gupta, S.; Treiman, A.H.; Stack, K.M.; Calef, F.; Edgar, L.A.; Grotzinger, J.; Lanza, N.; Le Deit, L.; Lasue, J.; et al. Geologic overview of the Mars Science Laboratory rover mission at the Kimberley, Gale crater, Mars. J. Geophys. Res. Planets 2017, 122, 2–20. [Google Scholar] [CrossRef]
- Grotzinger, J.P.; Dietrich, W.E.; Gupta, S.; Sumner, D.Y.; Wiens, R.C.; Mangold, N.; Malin, M.C.; Edgett, K.S.; Maurice, S.; Forni, O.; et al. Variability in martian sinuous ridge form: Case study of Aeolis Serpens in the Aeolis Dorsa, Mars, and insight from the Mirackina paleoriver, South Australia. Science 2013, 340, 1068–1072. [Google Scholar] [CrossRef]
- Treiman, A.H.; Morris, R.V.; Agresti, D.G.; Graff, T.G.; Achilles, C.N.; Rampe, E.B.; Bristow, T.F.; Ming, D.W.; Blake, D.F.; Vaniman, D.T.; et al. Ferrian saponite from the Santa Monica Mountains (California, USA, Earth): Characterization as an analog for clay minerals on Mars with application to Yellowknife Bay in Gale Crater. Am. Min. 2014, 99, 2234–2250. [Google Scholar] [CrossRef]
- Farley, K.A.; Malespin, C.; Mahaffy, P.; Grotzinger, J.P.; Vasconcelos, P.M.; Milliken, R.E.; Malin, M.; Edgett, K.S.; Pavlov, A.A.; Hurowitz, J.A.; et al. In situ radiometric and exposure age dating of the Martian surface. Science 2014, 343, 1247166. [Google Scholar] [CrossRef] [PubMed]
- Ehlmann, B.L.; Mustard, J.F.; Murchie, S.L.; Bibring, J.-P.; Meunier, A.; Fraeman, A.A.; Langevin, Y. Evidence for low-grade metamorphism, hydrothermal alteration, and diagenesis on Mars from phyllosilicate mineral assemblages. Nature 2011, 479, 53–60. [Google Scholar] [CrossRef] [PubMed]
- Grotzinger, J.P.; Sumner, D.Y.; Kah, L.C.; Stack, K.; Gupta, S.; Edgar, L.; Rubin, D.; Lewis, K.; Schieber, J.; Mangold, N.; et al. A habitable fluvio-lacustrine environment at Yellowknife Bay, Gale Crater, Mars. Science 2014, 343, 1242777. [Google Scholar] [CrossRef] [PubMed]
- Treiman, A.H.; Bish, D.L.; Vaniman, D.T.; Chipera, S.J.; Blake, D.F.; Ming, D.W.; Morris, R.V.; Bristow, T.F.; Morrison, S.M.; Baker, M.B.; et al. Mineralogy and genesis of the Windjana sandstone, Kimberley area, Gale Crater, Mars. JGR Planets 2015, 121, 75–106. [Google Scholar] [CrossRef] [PubMed]
- Tu, V.M.; Rampe, E.B.; Bristow, T.F.; Thorpe, M.T.; Clark, J.V.; Castle, N.; Fraeman, A.A.; Edgar, L.A.; McAdam, A.; Bedford, C.; et al. A Review of the Phyllosilicates in Gale Crater as Detected by the CheMin Instrument on the Mars Science Laboratory, Curiosity Rover. Minerals 2021, 11, 847. [Google Scholar] [CrossRef]
- Mangold, N.; Dehouck, E.; Fedo, C.; Forni, O.; Achilles, C.; Bristow, T.; Downs, R.; Frydenvang, J.; Gasnault, O.; L’Haridon, J.; et al. Chemical alteration of fine-grained sedimentary rocks at Gale crater. In Proceedings of the Fourth International Conference on Early Mars, Flagstaff, AZ, USA, 2–10 October 2017. Bibcode: 2017LPICo2014,3013M. [Google Scholar]
- Fedo, C.; Grotzinger, J.; Gupta, S.; Stein, N.T.; Watkins, J.; Banham, S.; Edgett, K.S.; Minitti, M.; Schieber, J.; Sebach, K.; et al. Facies Analysis and Basin Architecture of the Upper Part of the Murray Formation, Gale Crater, Mars. In Proceedings of the Lunar and Planetary Science Conference 48, Woodlands, TX, USA, 20–24 March 2017; Available online: https://www.hou.usra.edu/meetings/lpsc2017/pdf/1689.pdf (accessed on 3 May 2024).
- Stein, N.; Grotzinger, J.P.; Schieber, J.; Mangold, N.; Newsom, H.; Minitti, M.; Sumner, D.; Edgett, K.S.; Stack, K.; Fedo, C.; et al. Facies Analysis and Basin Architecture of the Upper Part of the Murray Formation, Gale Crater, Mars. In Proceedings of the Lunar and Planetary Science Conference 48, Woodlands, TX, USA, 20–24 March 2017; Available online: https://www.hou.usra.edu/meetings/lpsc2017/pdf/2387.pdf (accessed on 3 May 2024).
- Rampe, E.B.; Bristow, T.F.; Morris, R.V.; Morrison, S.M.; Achilles, C.N.; Ming, D.W.; Vaniman, D.T.; Blake, D.F.; Tu, V.M.; Chipera, S.J.; et al. Mineralogy of Vera Rubin Ridge from the Mars Science Laboratory CheMin Instrument. J. Geophys. Res. Planets 2020, 125, e2019JE006306. [Google Scholar] [CrossRef]
- Stack, K.M.; Grotzinger, J.P.; Lamb, M.P.; Gupta, S.; Rubin, D.M.; Kah, L.C.; Edgar, L.A.; Fey, D.M.; Hurowitz, J.A.; McBride, M.; et al. Evidence for plunging river plume deposits in the Pahrump Hills member of the Murray formation, Gale crater, Mars. Sedimentology 2019, 66, 1768–1802. [Google Scholar] [CrossRef]
- Rampe, E.; Ming, D.; Blake, D.; Bristow, T.; Chipera, S.; Grotzinger, J.; Morris, R.; Morrison, S.; Vaniman, D.; Yen, A.; et al. Mineralogy of an ancient lacustrine mudstone succession from the Murray formation, Gale crater, Mars. Earth Planet. Sci. Lett. 2017, 471, 172–185. [Google Scholar] [CrossRef]
- Grotzinger, J.P.; Gupta, S.; Malin, M.C.; Rubin, D.M.; Schieber, J.; Siebach, K.; Sumner, D.Y.; Stack, K.M.; Vasavada, A.R.; Arvidson, R.E.; et al. Deposition, exhumation and paleoclimate of an ancient lake deposit, Gale crater, Mars. Science 2015, 350, aac7575. [Google Scholar] [CrossRef] [PubMed]
- Murad, E.; Cashion, J. Mössbauer Spectroscopy of Environmental Materials and Their Industrial Utilization; Springer: New York, NY, USA, 2004. [Google Scholar] [CrossRef]
- Jolivet, J.-P.; Tronc, E.J. Interfacial electron transfer in colloidal spinel iron oxide. Conversion of Fe3O4-γFe2O3 in aqueous medium. J. Colloid Interface Sci. 1988, 125, 688–701. [Google Scholar] [CrossRef]
- Hurowitz, J.A.; Grotzinger, J.P.; Fischer, W.W.; McLennan, S.M.; Milliken, R.E.; Stein, N.; Vasavada, A.R.; Blake, D.F.; Dehouck, E.; Eigenbrode, J.L.; et al. Redox stratification of an ancient lake in Gale crater, Mars. Science 2017, 356, eah6849. [Google Scholar] [CrossRef] [PubMed]
- Martin, P.E.; Farley, K.A.; Baker, M.B.; Malespin, C.A.; Schwenzer, S.P.; Cohen, B.A.; Mahaffy, P.R.; McAdam, A.C.; Ming, D.W.; Vasconcelos, P.M.; et al. A two-step K-Ar experiment on Mars: Dating the diagenetic formation of jarosite from Amazonian groundwaters. J. Geophys. Res.—Planets 2017, 122, 2803–2818. [Google Scholar] [CrossRef]
- Marchesini, B.; Tavani, S.; Mercuri, M.; Mondillo, N.; Pizzati, M.; Balsamo, F.; Aldega, L.; Carminati, E. Structural control on the alteration and fluid flow in the lithocap of the Allumiere-Tolfa epithermal system. J. Struct. Geol. 2024, 179, 105035. [Google Scholar] [CrossRef]
- Payré, V.; Siebach, K.; Thorpe, M.; Antoshechkina, P.; Rampe, E. Tridymite in a lacustrine mudstone in Gale Crater, Mars: Evidence for an explosive silicic eruption during the Hesperian. Earth Planet. Sci. Lett. 2022, 594, 117694. [Google Scholar] [CrossRef]
- Yen, A.S.; Morris, R.V.; Ming, D.W.; Schwenzer, S.P.; Sutter, B.; Vaniman, D.T.; Treiman, A.H.; Gellert, R.; Achilles, C.N.; Berger, J.A.; et al. Formation of tridymite and evidence for a hydrothermal history at gale crater, Mars. J. Geophys. Res. Planets 2021, 126, e2020JE006569. [Google Scholar] [CrossRef]
- Watkins, J.A.; Grotzinger, J.P.; Stein, N.T.; Banham, S.G.; Gupta, S.; Rubin, D.M.; Morgan, K.S.; Edgett, K.S.; Frydenvang, J.; Siebach, K.L.; et al. Burial and Exhumation of Sedimentary Rocks Revealed by the Base Stimson Erosional Unconformity, Gale Crater, Mars. J. Geophys. Res. Planets 2022, 127, e2022JE007293. [Google Scholar] [CrossRef]
- Banham, S.G.; Gupta, S.; Rubin, D.M.; Watkins, J.A.; Sumner, D.Y.; Edgett, K.S.; Grotzinger, J.P.; Lewis, K.W.; Edgar, L.A.; Stack-Morgan, K.M.; et al. Ancient Martian aeolian processes and palaeomorphology reconstructed from the Stimson formation on the lower slope of Aeolis Mons, Gale crater, Mars. Sedimentology 2018, 65, 993–1042. [Google Scholar] [CrossRef]
- Banham, S.G.; Gupta, S.; Rubin, D.M.; Bedford, C.C.; Edgar, L.A.; Bryk, A.B.; Dietrich, W.E.; Fedo, C.M.; Williams, R.M.; Caravaca, G.; et al. Evidence for Fluctuating Wind in Shaping an Ancient Martian Dune Field: The Stimson Formation at the Greenheugh Pediment, Gale Crater. J. Geophys. Res. Planets 2022, 127, e2021JE007023. [Google Scholar] [CrossRef]
- Yen, A.; Ming, D.; Vaniman, D.; Gellert, R.; Blake, D.; Morris, R.; Morrison, S.; Bristow, T.; Chipera, S.; Edgett, K.; et al. Multiple stages of aqueous alteration along fractures in mudstone and sandstone strata in Gale Crater, Mars. Earth Planet. Sci. Lett. 2017, 471, 186–198. [Google Scholar] [CrossRef]
- Szczerba, M.; Rampe, E.B.; Peretyazhko, T.S.; Bristow, T.F.; Morris, R.V.; Blake, D.F.; Vaniman, D.T.; Chipera, S.J.; Downs, R.T.; Hazen, R.M.; et al. Hematite Formation and Growth in Gale crater Seen through MSL CheMin X-ray Diffraction Data. In Proceedings of the 54th Lunar and Planetary Science Conference 2023, Houston, TX, USA, 13–17 March 2023; Available online: https://www.hou.usra.edu/meetings/lpsc2023/pdf/1956.pdf (accessed on 3 May 2024).
- Bibring, J.-P.; Langevin, Y.; Mustard, J.F.; Poulet, F.; Arvidson, R.; Gendrin, A.; Gondet, B.; Mangold, N.; Berthé, M.; Gomez, C.; et al. Global mineralogical and aqueous Mars history derived from OMEGA/Mars Express data. Science 2006, 312, 400–404. [Google Scholar] [CrossRef] [PubMed]
- Ehlmann, B.L.; Edwards, C.S. Mineralogy of the Martian surface. Annu. Rev. Earth Planet. Sci. 2014, 42, 291–315. [Google Scholar] [CrossRef]
- Murchie, S.L.; Mustard, J.F.; Ehlmann, B.L.; Milliken, R.E.; Bishop, J.L.; McKeown, N.K.; Dobrea, E.Z.N.; Seelos, F.P.; Buczkowski, D.L.; Wiseman, S.M.; et al. A synthesis of Martian aqueous mineralogy after 1 Mars year of observations from the Mars Reconnaissance Orbiter. JGR Planets 2009, 114, E2. [Google Scholar] [CrossRef]
- Bishop, J.L.; Lane, M.D.; Dyar, M.D.; Brown, A.J. Reflectance and emission spectroscopy study of four groups of phyllosilicates: Smectites, kaolinite-serpentines, chlorites and mica. Clay Miner. 2008, 43, 35–54. [Google Scholar] [CrossRef]
- Grant, J.A.; Irwin, R.P., III; Grotzinger, J.P.; Milliken, R.E.; Tornabene, L.L.; McEwen, A.S.; Weitz, C.M.; Squyres, S.W.; Glotch, T.D.; Thompson, B.J. HiRISE imaging of impact megabreccia and sub-meter aqueous strata in Holden Crater, Mars. Geology 2008, 36, 195–198. [Google Scholar] [CrossRef]
- Milliken, R.E.; Bish, D.L. Sources and sinks of clay minerals on Mars. Philos. Mag. 2010, 90, 2293–2308. [Google Scholar] [CrossRef]
- Fedo, C.M.; Bryk, A.B.; Edgar, L.A.; Bennett, K.A.; Fox, V.K.; Dietrich, W.E.; Banham, S.G.; Gupta, S.; Stack, K.M.; Williams, R.M.E.; et al. Geology and stratigraphic correlation of the Murray and Carolyn Shoemaker formations across the Glen Torridon region, Gale crater, Mars. J. Geophys. Res. Planets 2022, 127, e2022JE007408. [Google Scholar] [CrossRef]
- Downs, R.T.; Hall-Wallace, M. The American Mineralogist crystal structure database. Am. Miner. 2003, 95, 247–250. [Google Scholar] [CrossRef]
- Sheppard, R.Y.; Milliken, R.E.; Parente, M.; Itoh, Y. Updated perspectives and hypotheses on the mineralogy of lower Mt. Sharp, Mars, as seen from orbit. J. Geophys. Res. Planets 2021, 126, e2020JE006372. [Google Scholar] [CrossRef]
- Rampe, E.B.; Bristow, T.F.; Blake, D.F.; Chipera, S.J.; Vaniman, D.T.; Achilles, C.N.; Downs, R.T.; Ming, D.W.; Morris, R.V.; Morrison, S.M.; et al. Mineralogical Evidence for Environmental Change in the Clay-Sulfate Transition at Gale crater, Mars. In Proceedings of the 54th Lunar and Planetary Science Conference 2023, Houston, TX, USA, 13–17 March 2023; Available online: https://www.hou.usra.edu/meetings/lpsc2023/pdf/1554.pdf (accessed on 3 May 2024).
- Chipera, S.J.; Chipera, S.J.; Vaniman, D.T.; Vaniman, D.T.; Rampe, E.B.; Rampe, E.B.; Bristow, T.F.; Bristow, T.F.; Martínez, G.; Martínez, G.; et al. Mineralogical Investigation of Mg-Sulfate at the Canaima Drill Site, Gale Crater, Mars. JGR Planets 2023, 128, e2023JE008041. [Google Scholar] [CrossRef]
- Chipera, S.J.; Vaniman, D.T. Experimental stability of magnesium sulfate hydrates that may be present on Mars. Geochim. Cosmochim. Acta 2007, 71, 241–250. [Google Scholar] [CrossRef]
- Vaniman, D.T.; Chipera, S.J. Transformations of Mg-and Ca-sulfate hydrates in Mars regolith. Am. Miner. 2006, 91, 1628–1642. [Google Scholar] [CrossRef]
- Vaniman, D.T.; Chipera, S.J.; Bish, D.L.; Peterson, R.C. The Todilto Formation and Science Goals at North Meridiani. In Proceedings of the 7th International Conference on Mars, Houston, TX, USA, 9–13 July 2007. LPI Contribution No. 1353; Bibcode: 2007LPICo1353.3156V. [Google Scholar]
- Wang, A.; Freeman, J.J.; Jolliff, B.L. Formation Rate of Amorphous Magnesium Sulfates at Low Temperatures Approaching the Current Surface Conditions on Mars. In Proceedings of the LPSC 38, Houston, TX, USA, 12–16 March 2007; Available online: https://www.lpi.usra.edu/meetings/lpsc2007/pdf/1195.pdf (accessed on 3 May 2024).
- Wang, A.; Freeman, J.J.; Jolliff, B.L. Phase transition pathways of the hydrates of magnesium sulfate in the temperature range 50 °C to 5 °C: Implication for sulfates on Mars. J. Geophys. Res. 2009, 114, E04010. [Google Scholar] [CrossRef]
- Wang, A.; Freeman, J.J.; Chou, I.-M.; Jolliff, B.L. Stability of Mg-sulfates at −10 °C and the rates of dehydration/rehydration processes under conditions relevant to Mars. J. Geophys. Res. 2011, 116, E12006. [Google Scholar] [CrossRef]
- Vaniman, D.T.; Martinez, G.M.; Rampe, E.B.; Bristow, T.F.; Blake, D.F.; Yen, A.S.; Ming, D.W.; Rapin, W.; Meslin, P.-Y.; Morookian, J.M.; et al. Gypsum, bassanite, and anhydrite at Gale crater, Mars. Am. Miner. 2018, 103, 1011–1020. [Google Scholar] [CrossRef]
- Vaniman, D.T.; Chipera, S.J.; Martinez, G.; Rapin, W.; Rampe, E.B.; Bristow, T.; Blake, D.F.; Meusberger, J.; Ming, D.W.; Downs, R.T.; et al. Near-Surface Dehydration of Salt Hydrates at Gale Crater, Mars. In Proceedings of the 55th LPSC 2024, Houston, TX, USA, 11–15 March 2024; Available online: https://www.hou.usra.edu/meetings/lpsc2024/pdf/1327.pdf (accessed on 3 May 2024).
- Gellert, R.; Clark, B.C., III. The MER Science Teams. In Situ Compositional Measurements of Rocks and Soils with the Alpha Particle X-ray Spectrometer on NASA’s Mars Rovers. Elements 2015, 11, 39–44. [Google Scholar] [CrossRef]
- Rapin, W.; Meslin, P.-Y.; Maurice, S.; Wiens, R.; Laporte, D.; Chauviré, B.; Gasnault, O.; Schröder, S.; Beck, P.; Bender, S.; et al. Quantification of water content by laser induced breakdown spectroscopy on Mars. Spectrochim. Acta Part B At. Spectrosc. 2017, 130, 82–100. [Google Scholar] [CrossRef]
- McLennan. Sedimentary silica on Mars. Geology 2003, 31, 315–318. [Google Scholar] [CrossRef]
- Squyres, S.W.; Arvidson, R.E.; Ruff, S.; Gellert, R.; Morris, R.V.; Ming, D.W.; Crumpler, L.; Farmer, J.D.; Marais, D.J.D.; Yen, A.; et al. Detection of Silica-Rich Deposits on Mars. Science 2008, 320, 1063–1067. [Google Scholar] [CrossRef]
- McLennan, S.; Bell, J.F., III; Calvin, W.; Christensen, P.; Clark, B.; de Souza, P.; Farmer, J.; Farrand, W.; Fike, D.; Gellert, R.; et al. Provenance and diagenesis of the evaporite-bearing Burns formation, Meridiani Planum, Mars. Earth Planet. Sci. Lett. 2005, 240, 95–121. [Google Scholar] [CrossRef]
- Milliken, R.; Swayze, G.; Arvidson, R.; Bishop, J.; Clark; Ehlmann, B.; Green, R.; Grotzinger, J.; Morris, R.; Murchie, S.; et al. Opaline silica in young deposits on Mars. Geology 2008, 36, 847–850. [Google Scholar] [CrossRef]
- Maliva, R.G.; Knoll, A.H.; Siever, R. Secular Change in Chert Distribution: A Reflection of Evolving Biological Participation in the Silica Cycle. Palaios 1989, 4, 519–532. [Google Scholar] [CrossRef] [PubMed]
- Tosca, N.J.; Knoll, A.H. Juvenile chemical sediments and the long-term persistence of water at the surface of Mars. Earth Planet. Sci. Lett. 2009, 286, 379–386. [Google Scholar] [CrossRef]
- Achilles, C.N.; Rampe, E.B.; Downs, R.T.; Bristow, T.F.; Ming, D.W.; Morris, R.V.; Vaniman, D.T.; Blake, D.F.; Yen, A.S.; McAdam, A.C.; et al. Evidence for multiple diagenetic episodes in ancient fluvial-lacustrine sedimentary rocks in Gale crater, Mars. JGR Planets 2020, 125, e2019JE006295. [Google Scholar] [CrossRef] [PubMed]
- Dehouck, E.; Gaudin, A.; Mangold, N.; Lajaunie, L.; Dauzères, A.; Grauby, O.; Le Menn, E. Weathereing of olivine under CO2 atmosphere: A martian perspective. Geochim. Cosmochim. Acta 2014, 135, 170–189. [Google Scholar] [CrossRef]
- Smith, R.J.; McLennan, S.M.; Achilles, C.N.; Dehouck, E.; Horgan, B.H.N.; Mangold, N.; Rampe, E.B.; Salvatore, M.; Siebach, K.L.; Sun, V. X-ray Amorphous Components in Sedimentary Rocks of Gale Crater, Mars: Evidence for Ancient Formation and Long-Lived Aqueous Activity. JGR Planets 2021, 126, e2020JE006782. [Google Scholar] [CrossRef]
- Smith, R.J.; McLennan, S.M.; Sutter, B.; Rampe, E.B.; Dehouck, E.; Siebach, K.L.; Horgan, B.H.N.; Sun, V.; McAdam, A.; Mangold, N.; et al. X-ray Amorphous Sulfur-Bearing Phases in Sedimentary Rocks of Gale Crater, Mars. JGR Planets 2022, 127, e2021JE007128. [Google Scholar] [CrossRef]
- Sutter, B.; Mcadam, A.C.; Mahaffy, P.R.; Ming, D.W.; Edgett, K.S.; Rampe, E.B.; Eigenbrode, J.L.; Franz, H.B.; Freissinet, C.; Grotzinger, J.P.; et al. Evolved gas analyses of sedimentary rocks and eolian sediment in Gale Crater, Mars: Results of the Curiosity rover’s sample analysis at Mars instrument from Yellowknife Bay to the Namib Dune. JGR Planets 2017, 122, 2574–2609. [Google Scholar] [CrossRef]
- Grotzinger, J.; Beaty, D.; Dromart, G.; Gupta, S.; Harris, M.; Hurowitz, J.; Kocurek, G.; McLennan, S.; Milliken, R.; Ori, G.G.; et al. Mars sedimentary geology: Key concepts and outstanding questions. Astrobiology 2011, 11, 77–87. [Google Scholar] [CrossRef]
- Day, M.; Kocurek, G. Observations of an aeolian landscape: From surface to orbit in Gale Crater. Icarus 2016, 280, 37–71. [Google Scholar] [CrossRef]
- Kite, E.S.; Lewis, K.W.; Lamb, M.P.; Newman, C.E.; Richardson, M.I. Growth and form of the mound in Gale Crater, Mars: Slope wind enhanced erosion and transport. Geology 2013, 41, 543–546. [Google Scholar] [CrossRef]
- Borlina, C.S.; Ehlmann, B.L.; Kite, E.S. Modeling the thermal and physical evolution of Mount Sharp’s sedimentary rocks, Gale Crater, Mars: Implications for diagenesis on the MSL Curiosity rover traverse. J. Geophys. Res. Planets 2015, 120, 1396–1414. [Google Scholar] [CrossRef]
- Lewis, K.W.; Peters, S.; Gonter, K.; Morrison, S.; Schmerr, N.; Vasavada, A.R.; Gabriel, T. A surface gravity traverse on Mars indicates low bedrock density at Gale crater. Science 2019, 363, 535–537. [Google Scholar] [CrossRef] [PubMed]
- Palucis, M.C.; Dietrich, W.E.; Williams, R.M.E.; Hayes, A.G.; Parker, T.; Sumner, D.Y.; Mangold, N.; Lewis, K.; Newsom, H. Sequence and relative timing of large lakes in Gale crater (Mars) after the formation of Mount Sharp. J. Geophys. Res. Planets 2016, 121, 472–496. [Google Scholar] [CrossRef]
- National Academies of Sciences, Engineering, and Medicine. Origins, Worlds, and Life: A Decadal Strategy for Planetary Science and Astrobiology 2023–2032; The National Academies Press: Washington, DC, USA, 2022. [Google Scholar] [CrossRef]
- Hazen, R.M.; Downs, R.T.; Morrison, S.M.; Tutolo, B.M.; Blake, D.F.; Bristow, T.F.; Chipera, S.J.; McSween, H.Y.; Ming, D.; Morris, R.V.; et al. On the Diversity and Formation Modes of Martian Minerals. JGR Planets 2023, 128, e2023JE007865. [Google Scholar] [CrossRef]
- Hazen, R.M.; Papineau, D.; Bleeker, W.; Downs, R.T.; Ferry, J.M.; McCoy, T.J.; Sverjensky, D.A.; Yang, H. Mineral evolution. Am Miner. 2008, 93, 1693–1720. [Google Scholar] [CrossRef]
- Hazen, R.M.; Morrison, S.M. On the paragenetic modes of minerals: A mineral evolution perspective. Am. Miner. 2022, 107, 1262–1287. [Google Scholar] [CrossRef]
- Grant, J.A.; Golombek, M.P.; Parker, T.J.; Crisp, J.A.; Squyres, S.W.; Weitz, C.M. Selecting landing sites for the 2003 Mars Exploration Rovers. Planet. Space Sci. 2004, 52, 11–21. [Google Scholar] [CrossRef]
- Grant, J.A.; Golombek, M.P.; Grotzinger, J.P.; Wilson, S.A.; Watkins, M.M.; Vasavada, A.R.; Griffes, J.L.; Parker, T.J. The science process for selecting the landing site for the 2011 Mars Science Laboratory. Planet. Space Sci. 2011, 59, 1114–1127. [Google Scholar] [CrossRef]
- Grant, J.A.; Golombek, M.P.; Wilson, S.A.; Farley, K.A.; Williford, K.H.; Chen, A. The science process for selecting the landing site for the 2020 Mars rover. Planet. Space Sci. 2018, 164, 106–126. [Google Scholar] [CrossRef]
- Farley, K.A.; Williford, K.H.; Stack, K.M.; Bhartia, R.; Chen, A.; de la Torre, M.; Hand, K.; Goreva, Y.; Herd, C.D.K.; Hueso, R.; et al. Mars 2020 Mission Overview. Space Sci. Rev. 2020, 216, 142. [Google Scholar] [CrossRef]
- Rampe, E.B.; Bristow, T.F.; Blake, D.F.; Vaniman, D.T.; Chipera, S.J.; Downs, R.T.; Ming, D.W.; Morris, R.V.; Tu, V.M.; Thorpe, M.T.; et al. Mineralogical trends over the clay-sulfate transition in Gale Crater from the Mars Science Laboratory CheMin instrument. In Proceedings of the 53rd Lunar and Planetary Science Conference, Woodlands, TX, USA, 7–11 March 2022; Available online: https://www.hou.usra.edu/meetings/lpsc2022/pdf/1532.pdf (accessed on 3 May 2024).
- Rampe, E.B.; Sarrazin, P.; Blake, D.F.; Bristow, T.F.; Yen, A.S.; Downs, R.T.; Tu, V.M.; Zacny, K.; Lafuente, B.; Thompson, K.; et al. Advances in X-ray Instruments to Support Mars Sample Return. In Proceedings of the 55th Lunar and Planetary Science Conference, Woodlands, TX, USA, 11–15 March 2024; Available online: https://www.hou.usra.edu/meetings/lpsc2024/pdf/1510.pdf (accessed on 3 May 2024).
- Anderson, R.B.; Bell, J.F., III. Geologic mapping and characterization of Gale Crater and implications for its potential as a Mars Science Laboratory landing site. Int. J. Mars Sci. Explor. 2010, 5, 76–128. [Google Scholar] [CrossRef]
- Siebach, K.L.; Grotzinger, J.P. Volumetric estimates of ancient water on Mount Sharp based on boxwork deposits, Gale Crater, Mars. JGR Planets 2013, 119, 189–198. [Google Scholar] [CrossRef]


| Gale 2 | Meridiani | Gusev | ||
|---|---|---|---|---|
| Rocknest | Gobabeb | Average 3 | Average 3 | |
| SiO2 | 43.02 | 47.90 | 45.7 ± 1.3 | 46.1 ± 0.9 |
| TiO2 | 1.19 | 0.88 | 1.03 ± 0.12 | 0.88 ± 0.19 |
| Al2O3 | 9.38 | 9.78 | 9.25 ± 0.50 | 10.19 ± 0.69 |
| FeOT | 19.20 | 17.92 | 18.8 ± 1.2 | 16.3 ± 1.1 |
| MnO | 0.42 | 0.37 | 0.37 ± 0.02 | 0.32 ± 0.03 |
| MgO | 8.70 | 7.57 | 7.38 ± 0.29 | 8.67 ± 0.60 |
| CaO | 7.27 | 7.30 | 6.93 ± 0.32 | 6.3 ± 0.29 |
| Na2O | 2.70 | 2.75 | 2.21 ± 0.18 | 3.01 ± 0.30 |
| K2O | 0.49 | 0.49 | 0.48 ± 0.05 | 0.44 ± 0.07 |
| P2O5 | 0.95 | 0.79 | 0.84 ± 0.06 | 0.91 ± 0.31 |
| Cr2O3 | 0.49 | 0.39 | 0.41 ± 0.06 | 0.33 ± 0.07 |
| Cl | 0.69 | 0.50 | 0.65 ± 0.09 | 0.70 ± 0.16 |
| SO3 | 5.48 | 3.36 | 5.83 ± 1.04 | 5.78 ± 1.25 |
| Ni | 456 | 504 | 457 ± 97 | 476 ± 142 |
| Zn | 327 | 190 | 309 ± 87 | 270 ± 90 |
| Br | 34 | 37 | 100 ± 111 | 53 ± 46 |
| Location | Gusev 1 | Gale 2 | |
|---|---|---|---|
| Sample | Adirondack | Rocknest | Gobabeb |
| Plagioclase | 39 | 40.7 (5) | 36.5 (8) |
| Olivine | 20 | 20.5 (4) | 25.8 (4) |
| Augite | 15 | 18.1 (13) | 22.0 (4) |
| Pigeonite | 15 | 12.3 (12) | 10.6 (4) |
| Magnetite | 6 | 2.8 (5) | 2.1 (2) |
| Anhydrite | ---- | 1.4 (3) 3 | 1.3 (1) 3 |
| Hematite | ---- | 1.6 (1) 3 | 0.9 (1) 3 |
| Quartz | 0 | 1.3 (3) 3 | 0.8 (1) 3 |
| Ilmenite | 1 | ---- | 1.3 (5) 3 |
| Mg# 4 | ---- | 57(5) | 56 (6) |
| Ca# 5 | ---- | 50(4) | 63 (5) |
| Mineral | Rocknest | Gobabeb |
|---|---|---|
| Plagioclase | Ca0.49(4)Na0.51(4)Al1.49Si2.51O8 | Ca0.63(6)Na0.37(6)Al1.63Si2.37O8 |
| Olivine | Mg1.14(3)Fe0.86(3)SiO4 | Mg1.08(3)Fe0.92(3)SiO4 |
| Augite | Mg0.94(9)Ca0.72(4)Fe0.34(10)Si2O6 | Mg0.89(8)Ca0.73(3)Fe0.38(9)Si2O6 |
| Pigeonite | Mg0.97(8)Fe1.03(9)Si2O6 | Mg0.95(12)Fe0.99(17)Ca0.06(8)Si2O6 |
| Mineral | Confidence Hills | Mojave 2 | Telegraph Peak | Buckskin 1 |
|---|---|---|---|---|
| Plagioclase | 20.4 (2.3) | 23.5 (1.6) | 27.1 (2.8) | 17.1 (1.2) |
| Sanidine | 5.0 (0.7) | -- | 5.2 (2.2) | 3.4 (0.7) |
| Forsterite | 1.2 (0.7) | 0.2 (0.8) | 1.1 (1.2) | -- |
| Augite | 6.4 (2.2) | 2.2 (1.1) | -- | -- |
| Pigeonite | 5.3 (1.7) | 4.6 (0.7) | 4.2 (1.0) | -- |
| Orthopyroxene | 2.1 (3.1) | -- | 3.4 (2.6) | -- |
| Magnetite | 3.0 (0.7) | 3.0 (0.6) | 8.2 (0.9) | 2.8 (0.3) |
| Hematite | 6.8 (1.5) | 3.0 (0.6) | 1.1 (0.5) | -- |
| Quartz | 0.7 (0.5) | 0.8 (0.3) | 0.9 (0.4) | -- |
| Cristobalite | -- | -- | 7.3 (1.7) | 2.4 (0.3) |
| Tridymite | -- | -- | -- | 13.6 (0.8) |
| (H3O+, K+, Na+) Jarosite | 1.1 (0.7) | 3.1 (1.6) | 1.5 (1.8) | -- |
| Anhydrite | -- | -- | -- | 0.7 (0.2) |
| Fluorapatite | 1.3 (1.5) | 1.8 (1.0) | 1.9 (0.5) | -- |
| Phyllosilicate 2 | 7.6 | 4.7 | -- | -- |
| Amorphous | 39.2 ± 15 2 | 53 3 | 38.1 ± 15 2 | 60 3 |
| Edinburgh | Big Sky | Greenhorn | |
|---|---|---|---|
| Plagioclase | 39.6 | 45.7 | 42.1 |
| Tot. Px | 27.6 | 30.2 | 12.3 |
| Sanidine | 4.6 | 1.7 | -- |
| Magnetite | 14.0 | 12.6 | 17.3 |
| Hematite | 0.5 | 3.6 | 6.0 |
| Quartz | 1.6 | 2.2 | |
| Forsterite | 11.5 | -- | -- |
| Fluorapatite | 0.02 | 1.4 | -- |
| Anhydrite | 1.5 | 16.1 | |
| Tridymite 1 | -- | 1.8 1 | -- |
| Basanite | -- | 4.0 | |
| Total xtal. | 100% | 100% | 100% |
| % Amorphous | 20% | 20% | 65% |
| Drilled Sample | ||||
|---|---|---|---|---|
| Phase | Duluth | Stoer | Highfield | Rock Hall |
| Plagioclase | 27.1 (6) | 23.2 (10) | 19.9 (9) | 20.2 (22) |
| K-spar | 3.2 (4) | 1.6 (13) | 1.6 (5) | --- |
| Pyroxene | 4.5 (11) | 3.3 (9) | 4.2 (15) | 9.1 (10) |
| Hematite | 6.1 (10) | 14.7 (8) | 8.5 (5) | 2.9 (2) |
| Magnetite | 0.7 (4) | 0.3 (3) | 0.5 (5) | --- |
| Akaganeite | --- | 1.2 (7) | --- | 6.0 (5) |
| Jarosite | --- | 1.0 (3) | --- | 2.3 (5) |
| Anhydrite | 1.7 (4) | 3.1 (3) | 3.5 (5) | 11.2 (4) |
| Bassanite | 3.5 (3) | 0.5 (2) | 1.1 (3) | --- |
| Gypsum | 0.1 (1) | 2.4 (8) | 2.2 (5) | --- |
| Quartz | 1.0 (4) | 0.7 (4) | 0.5 (3) | --- |
| Fluorapatite | --- | --- | --- | 1.3 (4) |
| Phyllosilicate | 15 (4) | 10 (3) | 5 (1) | 13 (3) |
| Opal-CT | --- | --- | 4 (1) | --- |
| Amorphous | 37 2 | 38 2 | 49 2 | 38 (8) 3 |
| Mineral | Formula |
|---|---|
| Kieserite | MgSO4·H2O |
| Sanderite | MgSO4·2H2O |
| Starkeyite | MgSO4·4H2O |
| Cranswickite | MgSO4·4H2O |
| Pentahydrite | MgSO4·5H2O |
| Hexahydrite | MgSO4·6H2O |
| Epsomite | MgSO4·7H2O |
| Meridianiite | MgSO4·11H2O |
| Amorphous MgSO4 | MgSO4·nH2O (n varies from ~1 to 2) |
| Phase | 1st Night | 3rd Night | 13th Night |
|---|---|---|---|
| Starkeyite | 2.3 ± 0.3 | 0.1 ± 0.2 | --- |
| Andesine | 16.9 ± 0.6 | 15.5 ± 0.6 | 18.0 ± 0.5 |
| Gypsum | 4.0 ± 0.2 | 4.1 ± 0.2 | 1.5 ± 0.2 |
| Bassanite | 0.4 ± 0.3 | 0.8 ± 0.4 | 1.76 ± 0.3 |
| Anhydrite | 0.6 ± 0.3 | 1.0 ± 0.4 | 0.9 ± 0.5 |
| Hematite | 4.7 ± 0.4 | 4.7 ± 0.6 | 4.8 ± 0.5 |
| Goethite | 2.2 ± 0.6 | 2.2 ± 0.7 | 2.2 ± 0.6 |
| Quartz | 0.5 ± 0.2 | 0.5 ± 0.3 | 0.5 ± 0.2 |
| Sanidine | 3.2 ± 0.4 | 2.7 ± 0.6 | 3.4 ± 0.4 |
| Pyroxene | 3.2 ± 1.1 | 3.4 ± 0.8 | 3.7 ± 1.1 |
| Amorphous MgSO4·nH2O | 19.4 ± 3.5 | 20.9 ± 3.5 | 20.0 ± 3.5 |
| Other Amorphous | 29.5 ± 7.4 | 28.5 ± 7.1 | 28.7 ± 7.2 |
| Palagonite-Like Material | 13.0 ± 3.2 | 13.0 ± 3.2 | 14.3 ± 3.6 |
| Total | 100.0 | 100.0 | 100.0 |
| Oxide | Chemical Analysis (Wt%) 1,4 | Crystalline Component (Wt%) 2,4 | Amorphous Component (Wt %) 3,4 |
|---|---|---|---|
| SiO2 | 29.35 ± 0.37 | 14.1 ± 5.9 | 15.2 ± 5.7 |
| TiO2 | 0.77 ± 0.03 | --- | 0.77 ± 0.03 |
| Al2O3 | 5.67 ± 0.16 | 5.3 ± 2.2 | 0.4 ± 2.1 |
| Cr2O3 | 0.25 ± 0.01 | --- | 0.25 ± 0.01 |
| FeO(T) | 15.5 ± 0.17 | --- | 8.7 ± 2.6 |
| FeO | --- | 0.4 ± 0.4 | --- |
| Fe2O3 | --- | 6.7 ± 2.9 | --- |
| MnO | 0.18 ± 0.01 | --- | 0.18 ± 0.01 |
| MgO | 9.16 ± 0.21 | 1.2 ± 0.6 | 7.9 ± 0.6 |
| CaO | 4.25 ± 0.05 | 3.6 ± 1.5 | 0.7 ± 1.4 |
| Na2O | 1.88 ± 0.12 | 1.2 ± 0.6 | 0.7 ± 0.5 |
| K2O | 0.58 ± 0.02 | 0.3 ± 0.3 | 0.3 ± 0.2 |
| P2O5 | 0.75 ± 0.04 | --- | 0.75 ± 0.04 |
| SO3 | 16.48 ± 0.19 | 3.4 ± 1.4 | 13.0 ± 1.5 |
| Cl | 1.09 ± 0.03 | --- | 1.09 ± 0.03 |
| H2O | 14.20 ± 2.3 | 2.0 ± 0.8 | 12.1 ± 2.4 |
| Oxide % | Soil Avg. (RN, GB) | Bradbury Fm. (CM) | Murray Fm. (MJ 2) | Altered Murray Fm. (BK) | Stimson Fm. (BS) | Altered Stimson Fm. (GH) | Sulfate-Bearing Unit (CA) |
|---|---|---|---|---|---|---|---|
| SiO2 | 37.50 | 25.557 | 55.725 | 75.9 | 24.133 | 63.525 | 30.5 |
| TiO2 | 2.711 | 3.659 | 2.487 | 2.18 | 6.587 | 1.537 | 1.54 |
| Al2O3 | 4.253 | 0.000 | 7.196 | 0 | 0.123 | 0.000 | 0.8 |
| Cr2O3 | 1.765 | 1.700 | 0.773 | 0.179 | 3.359 | 0.692 | 0.5 |
| FeOT | 19.80 | 18.033 | 12.269 | 4.796 | 17.478 | 10.159 | 17.42 |
| MnO | 1.568 | 1.086 | 0.831 | 0.161 | 2.641 | 0.211 | 0.4 |
| MgO | 0.000 | 17.534 | 5.794 | 1.467 | 14.676 | 1.462 | 15.8 |
| CaO | 4.085 | 11.119 | 0.000 | 2.145 | 0.000 | 5.470 | 1.4 |
| Na2O | 4.387 | 1.658 | 1.819 | 1.15 | 6.030 | 2.076 | 1.4 |
| K2O | 1.903 | 0.532 | 1.111 | 0.847 | 1.402 | 0.461 | 0.6 |
| P2O5 | 3.469 | 3.179 | 0.754 | 2.237 | 1.686 | 1.767 | 1.5 |
| SO3 | 16.13 | 11.544 | 10.342 | 7.75 | 17.076 | 11.934 | 26 |
| Cl | 2.418 | 4.398 | 0.899 | 0.52 | 4.809 | 0.707 | 2.2 |
| F | -- | 0.000 | 0.159 | 0 | 0.049 | 0.000 | --- |
| Proportion 1 | 0.28 | 0.26 | 0.47 | 0.558 | 0.14 | 0.64 |
Disclaimer/Publisher’s Note: The statements, opinions and data contained in all publications are solely those of the individual author(s) and contributor(s) and not of MDPI and/or the editor(s). MDPI and/or the editor(s) disclaim responsibility for any injury to people or property resulting from any ideas, methods, instructions or products referred to in the content. |
© 2024 by the authors. Licensee MDPI, Basel, Switzerland. This article is an open access article distributed under the terms and conditions of the Creative Commons Attribution (CC BY) license (https://creativecommons.org/licenses/by/4.0/).
Share and Cite
Blake, D.; Tu, V.; Bristow, T.; Rampe, E.; Vaniman, D.; Chipera, S.; Sarrazin, P.; Morris, R.; Morrison, S.; Yen, A.; et al. The Chemistry and Mineralogy (CheMin) X-ray Diffractometer on the MSL Curiosity Rover: A Decade of Mineralogy from Gale Crater, Mars. Minerals 2024, 14, 568. https://doi.org/10.3390/min14060568
Blake D, Tu V, Bristow T, Rampe E, Vaniman D, Chipera S, Sarrazin P, Morris R, Morrison S, Yen A, et al. The Chemistry and Mineralogy (CheMin) X-ray Diffractometer on the MSL Curiosity Rover: A Decade of Mineralogy from Gale Crater, Mars. Minerals. 2024; 14(6):568. https://doi.org/10.3390/min14060568
Chicago/Turabian StyleBlake, David, Valerie Tu, Thomas Bristow, Elizabeth Rampe, David Vaniman, Steve Chipera, Philippe Sarrazin, Richard Morris, Shaunna Morrison, Albert Yen, and et al. 2024. "The Chemistry and Mineralogy (CheMin) X-ray Diffractometer on the MSL Curiosity Rover: A Decade of Mineralogy from Gale Crater, Mars" Minerals 14, no. 6: 568. https://doi.org/10.3390/min14060568
APA StyleBlake, D., Tu, V., Bristow, T., Rampe, E., Vaniman, D., Chipera, S., Sarrazin, P., Morris, R., Morrison, S., Yen, A., Downs, R., Hazen, R., Treiman, A., Ming, D., Downs, G., Achilles, C., Castle, N., Peretyazhko, T., De Marais, D., ... Vasavada, A. (2024). The Chemistry and Mineralogy (CheMin) X-ray Diffractometer on the MSL Curiosity Rover: A Decade of Mineralogy from Gale Crater, Mars. Minerals, 14(6), 568. https://doi.org/10.3390/min14060568