Article

Zircon, Monazite SHRIMP U-Th-Pb and Quartz Oxygen Isotopic Results from the Higher Himalayan Crystallines (HHC) of the Sikkim Himalayas

by
Shashank Prabha-Mohan
1,2,
Ian S. Williams
3 and
Sandeep Singh
1,*
1
Department of Earth Sciences, Indian Institute of Technology, Roorkee 247667, India
2
Université Clermont Auvergne, CNRS, IRD, OPGC, Laboratoire Magmas et Volcans, 63000 Clermont-Ferrand, France
3
Research School of Earth Sciences, Australian National University, Canberra, ACT 2601, Australia
*
Author to whom correspondence should be addressed.
Minerals 2024, 14(6), 572; https://doi.org/10.3390/min14060572
Submission received: 17 April 2024 / Revised: 24 May 2024 / Accepted: 27 May 2024 / Published: 30 May 2024

Abstract

:
Migmatites and partial melts are exposed in both the lower and upper package of the Higher Himalayan Crystallines (HHC) thrust sheet within the Sikkim Himalayas. Zircon monazite and quartz oxygen isotopic ratios from Yumthang Valley, North Sikkim, and Rathong Chuu, West Sikkim, have been used to identify their sources and equilibrium conditions. Monazites show homogeneous growth, whereas zircons show growth rings. U-Th-Pb data on monazite only indicate the latest metamorphic event. However, zircons show metamorphic rim growth between 36 and 24 Ma over their detrital core with trailing growth from 22 Ma to 15 Ma. Pervasive fluids have been interpreted in coeval development during metamorphism, as shown by monazite and zircon c. 30 Ma. The Th/U ratio of zircon is higher and variable with weak residual zoning in the samples from higher elevations. Quartz–metamorphic zircon oxygen fractionation suggests Teq > 600 °C, while quartz–monazite fractionation shows the same or lower temperatures. Multiple sources of melts in the HHC (even along a single valley) have been observed by δ18O of 7‰ to 10‰ in zircon and 5‰ to 9‰ in monazite. Zircon and monazite generated in the same rock have similar δ18O values. Monazite grown ~20 Ma in the lower elevation sample had a low δ18O, suggesting interaction with an external fluid.

1. Introduction

The Himalayan mountain range extends over a lateral length of more than 2400 km, confined between two syntaxial bends–Nanga Parbat in the west to Namche Barua in the east–with evident along-strike consistency in lithotectonic units as well as the tectonic boundaries (Figure 1). The Himalayan mountain chain evolved due to a continent–continent collision of the indenting Indian plate with the Eurasian plate not later than 57 Ma ago [1,2], whereas, based on various popular models of the evolution of the Himalayas, it is [3] interpreted that onset took place 59 ± 1 Ma ago.
Post-collisional metamorphism is prevalent in both the Indian Plate and the Eurasian Plate [4]. It starts with either blueschist facies metamorphism ([5] and references therein) or eclogite facies metamorphism ([1,6]; references therein) related to subduction tectonics. It is followed by regional Barrovian metamorphism in the Higher Himalayan Crystallines (HHC), which is characterized by inverted metamorphism ([6,7,8,9,10] and references therein) along with related main Himalayan deformational events ([8,11,12] and references therein). The Himalayan orogeny also encountered magmatism with crustal melt formation in the form of in situ melt or widespread anatectic mid-crustal melt generated from an extensive partial melting of the migmatite zone ([13,14,15,16,17] and references therein). During this orogenic activity, a gap in the sedimentary records has also been interpreted by various researchers to be from after the Middle Eocene [18,19,20,21,22,23].
Post-collisional crustal shortening was accommodated by east–west-trending tectonic boundaries, such as the Main Frontal Thrust (MFT), Main Boundary Thrust (MBT), Main Central Thrust (MCT), South Tibetan Detachment System (STDS), Indo-Tsangpo Suture Zone (ITSZ), and their splays ([7,9]; references therein). The Higher Himalayan Crystallines (HHC), which are exposed between the MCT and the STDS, are about 15–20 km thrust sheet packages of rocks along the mountain chain and are composed of Barrovian metamorphic rocks mapped as one large unit [3,6,7,9,10,16,24]. These rocks represent the crystallines of the Greater Indian domain [3]. They are separated from the supracrustal portion, i.e., the Lesser Himalayan Sedimentary Sequence, by the MCT in the south and from the Tethyan Sedimentary Sequence by the STDS in the north [16,24,25,26].
Migmatite has been a source of both in situ and anatectic melt within the HHC. Migmatites are heterogeneous silicate rocks with alternating leucosome (lighter layers containing quartz, feldspar, and muscovite) resulting from partial melting and segregation of melt from the partially molten surroundings and melanosome (darker layers comprising biotite and other dark-colored minerals–residuum) layers ([27] and references therein). Migmatites of the Himalayas are mainly present within the HHC and are concentrated in a very narrow zone [16,17,24] in the NW Himalayas. However, in the eastern Himalayas, they are present from the base of the HHC to the top between the MCT and the STDS [16,17,28,29,30,31,32,33,34,35]. Their heterogeneity is evident at every scale, from a microscope to a large outcrop.
The dominant accessory phases of migmatites and granites are monazite, zircon, apatite, and minor xenotime. Zircon chronometry with monazite is a powerful tool for the temporal reconstruction of the subsolidus and anatectic process in metamorphic terrain and has been attempted using U-Th-Pb geochronology with secondary ion mass spectrometry (SIMS) in the Himalayan context [1,2,6,24,26,34,36,37,38,39,40,41,42,43,44,45,46,47,48,49,50]. Unlike zircon, monazites show little inheritance except in a few cases [50,51] involving high-temperature diffusion that can happen close to the blocking temperature [52,53]. Zircon is an ideal chronometer for Himalayan metamorphic rocks, as they are very reactive during Barrovian metamorphism and possess the ability to preserve their chemical and isotopic composition. Researchers have also observed a discrete age population in zircon, whereas monazite dates are smoothly spread out [54]. Monazite has low solubility in the peraluminous melt [55,56] and is expected to undergo some dissolution during the dehydration melting of a metasedimentary rock and some new growth during melt crystallization [57,58]. Monazite can be consumed and produced again in a solid-state reaction [59,60]. Zircon has been known to grow in partial melt conditions [24]. Most importantly, the robust U-Pb system in zircon can survive many geological processes, including erosion, deformation, crustal anatexis, and high-grade metamorphism [61,62], and hence, can provide us with a more extended and comprehensive thermal history than monazites, which get reset during subsequent metamorphism/thermal events.
The oxygen isotopic compositions of zircon, monazite, and quartz from all the samples were measured in situ using the SHRIMP, and the zircon and monazite were also dated using the U-Th-Pb technique. The temporal evolution of oxygen isotopic composition in zircon cores and rims generally reflects the oxygen isotopic composition of the material or the environment in which they crystallized. A mantle source, a sediment-derived source, or maybe even a mixed source as well as recycling of surface-derived material/fluid into melt within the crust can be interpreted from oxygen isotopic compositions [63,64,65]. Many studies have proven this technique to be a reliable indicator of the source [62,64,66,67,68]. Combined with O isotopic analyses of quartz, zircon, and monazite, the O isotopic fractionation between the mineral pairs (Qtz-Zrn and Qtz-Mnz; [69]) gives us a first-order indication of the temperature of the final metamorphism.
This work incorporates zircon and monazite U-Th-Pb age determination along with oxygen isotopic studies on zircon, monazite, and quartz from the samples of migmatites from Yumthang Valley, North Sikkim, and Rathong Chuu, West Sikkim, in order to understand the mantle–crust interaction during Himalayan metamorphism.

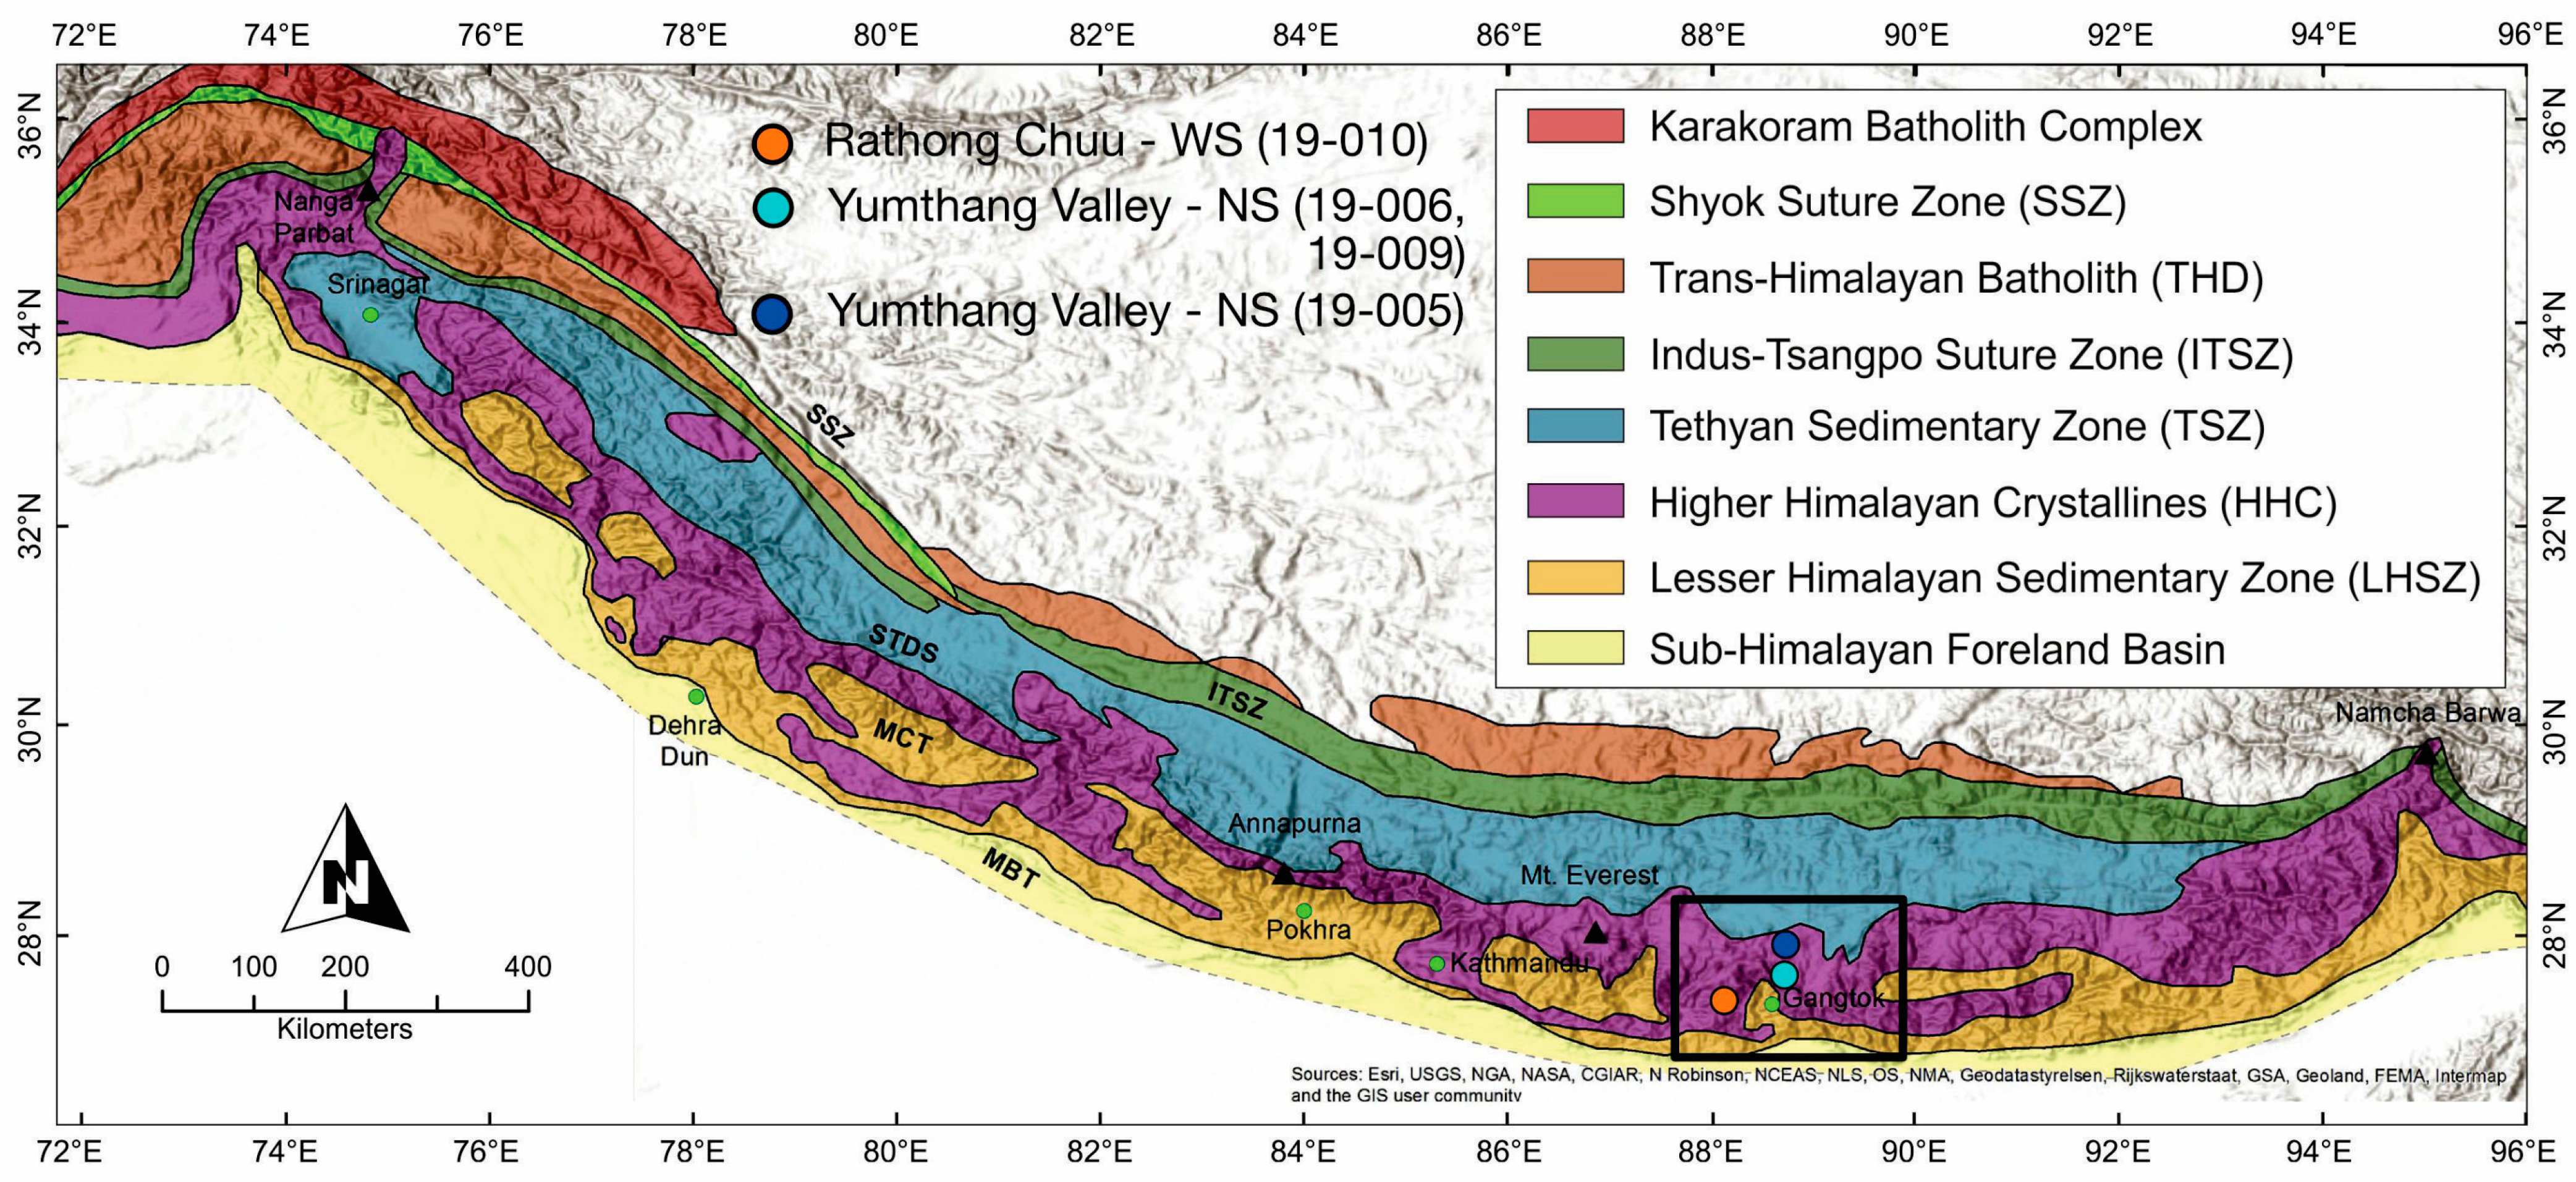
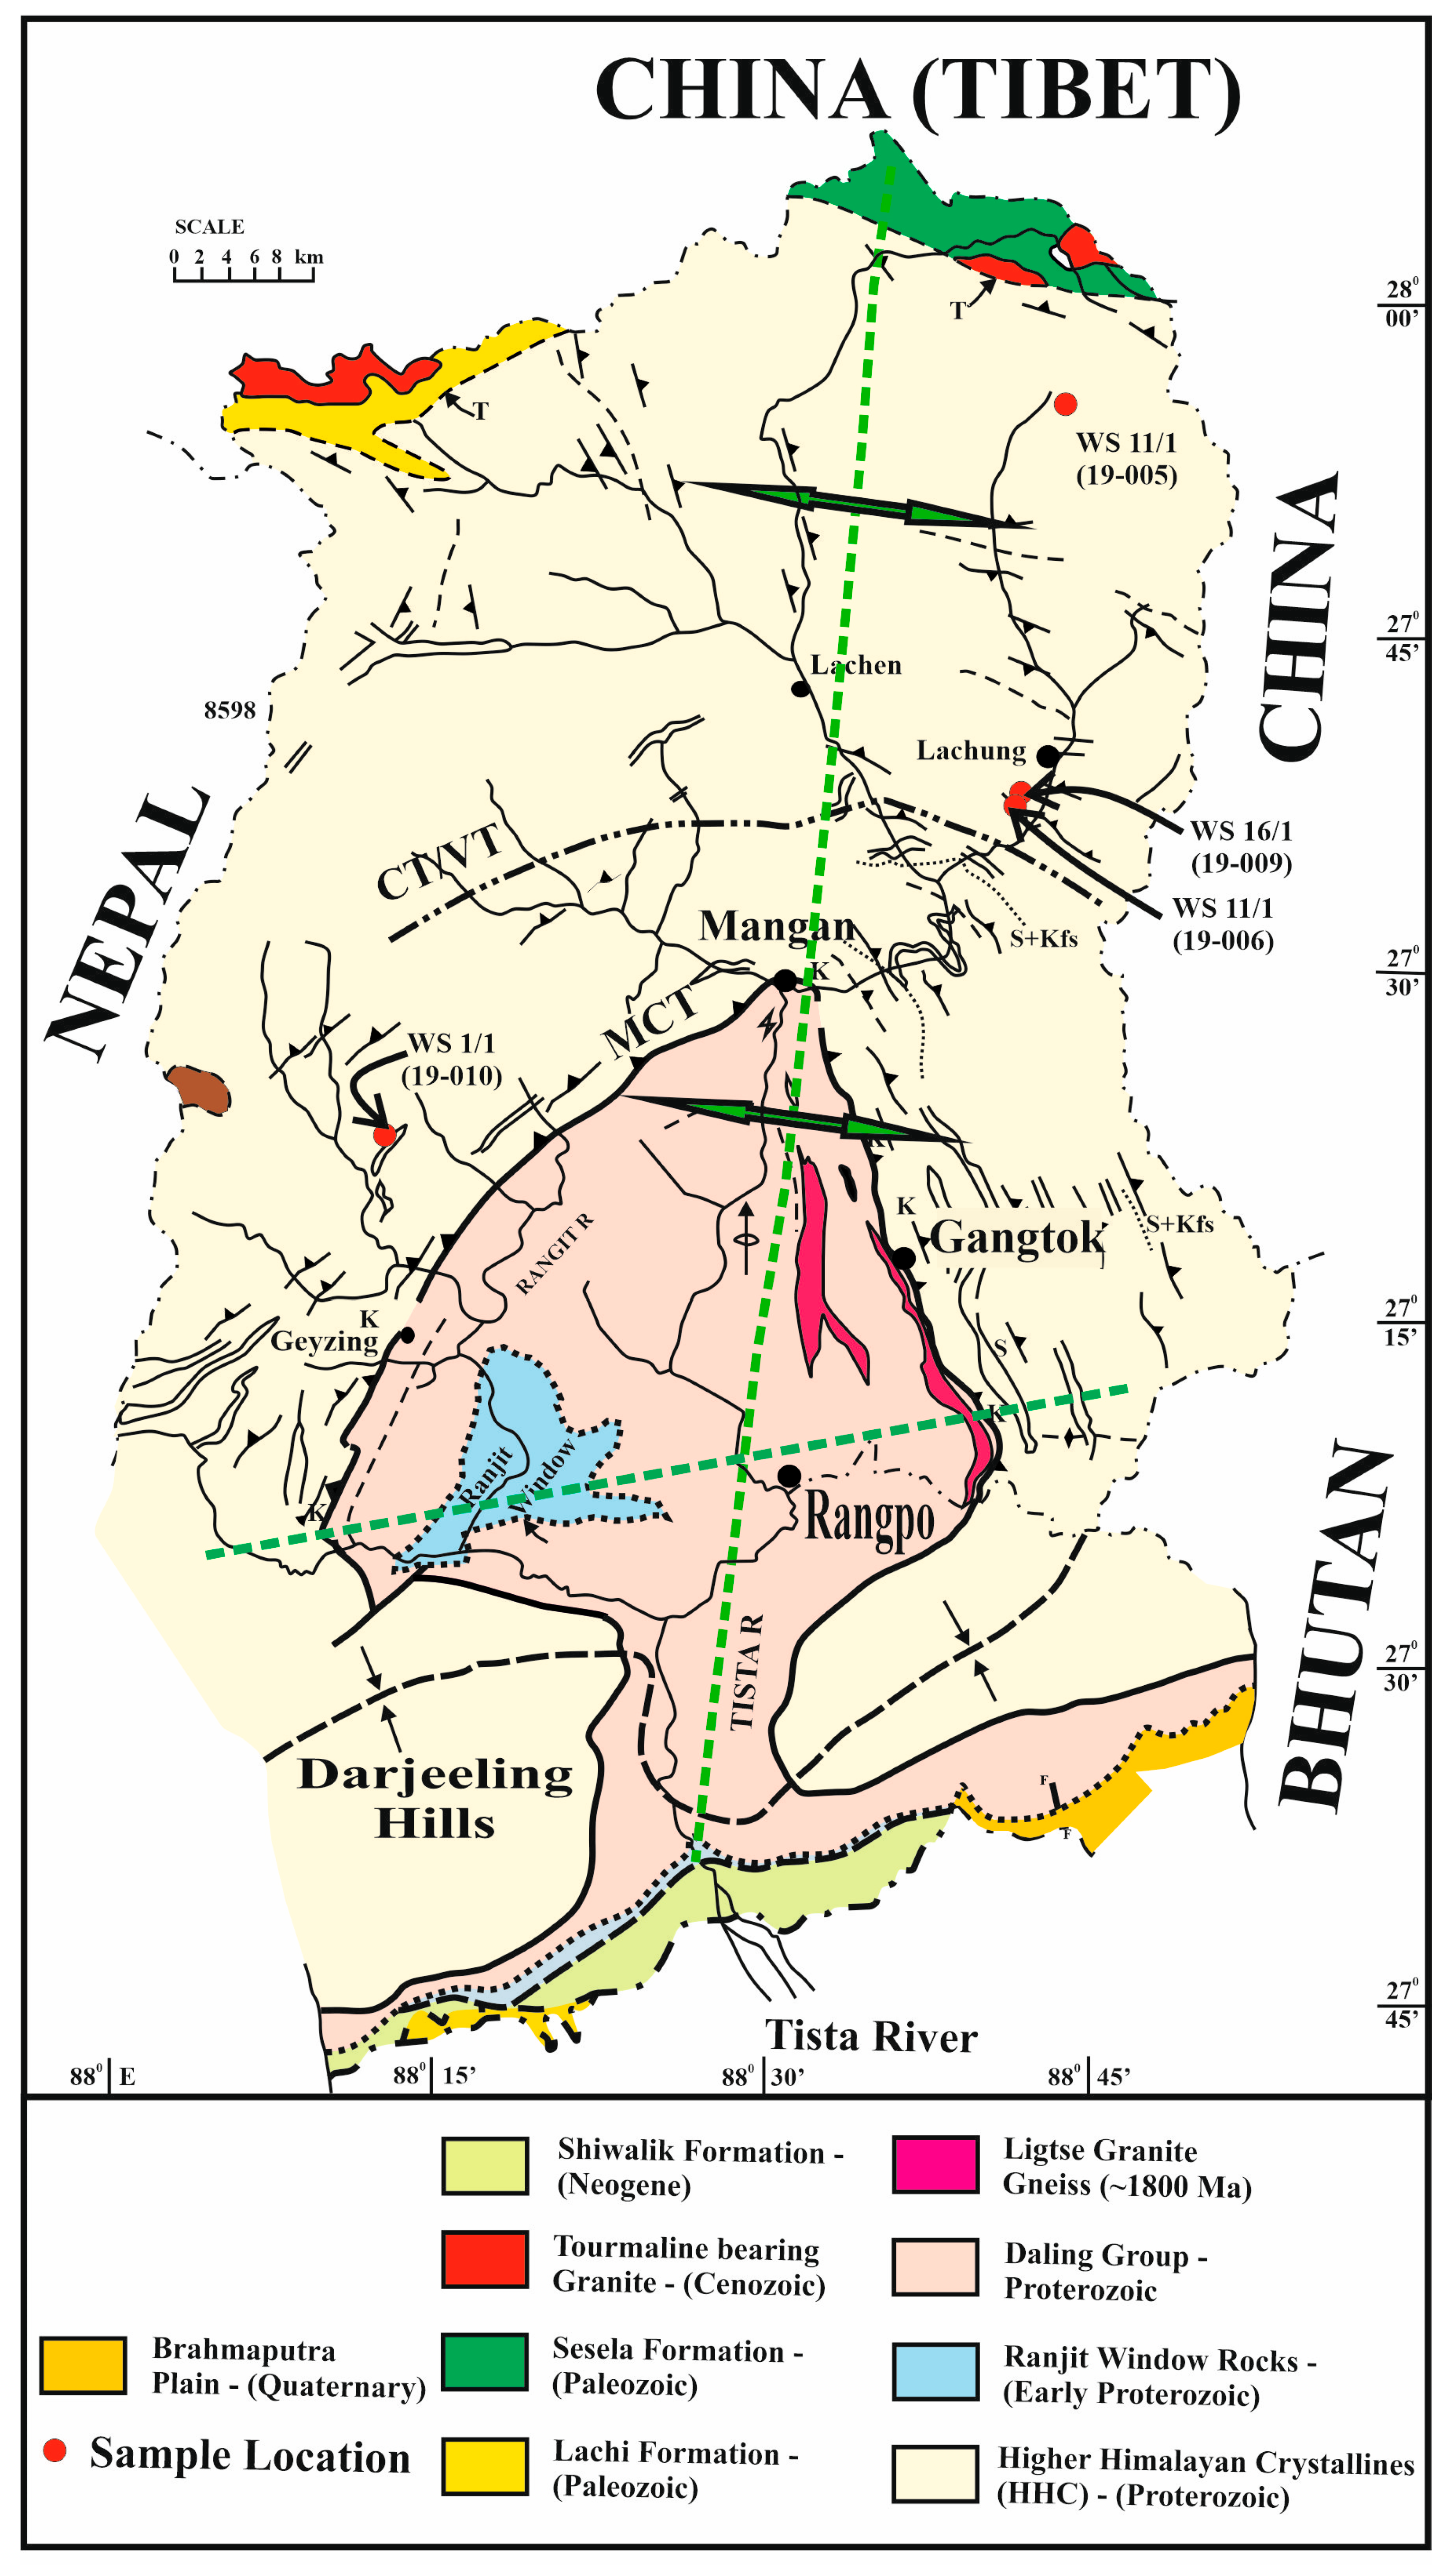
2. Geological Framework

The Sikkim Himalaya are sandwiched between Bhutan (east) and Nepal (west) and are characterized by a typical mushroom-shaped window structure that is not closed on all sides [29,30,70,71]. The reason for the half-window structure appears to be the interaction of tectonic structures and erosion, resulting in a complex mushroom-shaped window (Figure 2). The complex structures have evolved due to the straight east–west trending Main Boundary Thrust (MBT) separating Siwalik rocks from the Lesser Himalayan sedimentary (LHS) sequence. At the same time, the Main Central Thrust (MCT), irrespective of its locational controversy ([72] and references therein), shows cross-folding and affects the outcrop pattern in the Sikkim Himalaya (Figure 2).
The present work is not meant to undertake mapping but to look at the relationship between migmatites and in situ melt generation with collision-related tourmaline-bearing leucogranite in the Higher Himalayan Crystallines (HHC). The HHC is a 15–20 km thick sequence of metamorphic rocks exposed along the entire Himalayas with inverted metamorphic sequences [7,9,16,73] and has been mapped as one unit. However, in the Sikkim Himalaya, the HHC has been exposed as a ~40 km-thick section in northern and a ~20 km-wide section in western Sikkim [32]. Our field observations indicate that, like the HHC of the Northwest (NW) Himalayas, the Sikkim Himalayas also have two packages, i.e., a basal package made up of Kangchenjunga gneiss/Darjeeling gneiss (equivalent to the Munisari Formation of the NW Himalayas) comprised of banded/streaky migmatite, kyanite-staurolite-sillimanite bearing biotite augen gneiss and sillimanite granite gneiss ([71] and our observations). This basal package is overlain by the Upper Chungthan Formation (equivalent to the Vaikrita Group of the NW Himalayas) and is comprised of garnet-kyanite-sillimanite biotite schist, migmatites, psammites, calc-silicate and intrusive tourmaline-bearing granite ([71] and our observations—also see Figure 2). This has also been mapped as a suite of amphibolite to granulite facies metamorphic rocks [30,32,34,74,75,76] exposed between the South Tibetan Detachment System (STDS) and the MCT. The striking difference between the NW Himalayas and the Sikkim Himalayas is the presence of a migmatite zone. In the NW Himalayas, migmatites are present in a very narrow zone in an upper package of the HHC [24]. Meanwhile, in the Sikkim Himalayas, they are exposed starting close to the MCT within the basal package. These rocks have been further intruded by leucogranites emplaced between 23 and 12 Ma [16,17,31,32,34,76]. These ages have been constrained through zircon [34], monazite [31,34,35], Sm-Nd [32], and Lu-Hf aging on garnet [77].

3. Analytical Techniques

Sample Selection: Four samples have been collected from the Sikkim Himalayas (Figure 2), with three samples—19-005 (27°55′38.3″ N, 88°43′50.8″ E), 19-006 (27°37′44.8″ N, 88°41′20.6″ E), and 19-009 (27°37′23.5″ N, 88°41′20.6″ E)—having been collected along a N–S traverse of the Yumthang Valley in North Sikkim, mainly from the upper package of the HHC, and one sample—19-010 (27°22′07.7″ N, 88°12′22.0″ E)—from West Sikkim that was collected a few kilometers down the road from Yuksom, by the Rathong Chuu river belonging to the lower package of the HHC.
Field and hand specimen observations: Migmatites from the upper package show the development of two melting phases of stromatic migmatites with the presence of kyanite (Figure 3a). At places, migmatites show distinct leucosome and melanosome layers (Figure 3b,e) or emplacement along extensional fabric both in ductile regime (Figure 3c) and brittle regime (Figure 3d) or in situ melt pods (Figure 3a,f). The tourmaline-bearing leucogranite and country rocks have very sharp contacts (Figure 3e).
North Sikkim 19-005: In the hand specimen, schistose banding is observed with alternating layers of leucosome (mainly quartz and plagioclase) and melanosome (mostly biotite with other dark minerals). The melanosome is more prominent, accounting for about 70% of the volume. Pink garnet porphyroblasts (up to 5 mm) can be observed at the hand specimen scale.
North Sikkim 19-006: At the hand specimen scale, schistose banding is observed with alternating layers of light (mainly quartz and plagioclase) and dark (mostly biotite with other dark minerals) layers, with the light layers being the most prominent, accounting for about 80% of the volume. Garnet porphyroblasts (up to 5 mm) can be observed at the hand specimen scale. The sample appears to be a highly metamorphosed gneiss.
North Sikkim 19-009: In the hand specimen, gneissic banding is observed with alternating layers of light (mainly quartz and plagioclase) and dark (mostly biotite with other dark minerals) layers, with the lighter layers being more prominent, accounting for about 80% of the volume. Unlike the other samples, this one does not contain any visible garnet porphyroblasts.
West Sikkim 19-010: In the hand specimen, gneissic banding is observed with alternating layers of light (mainly quartz and plagioclase) and dark (mostly biotite with other dark minerals) layers, with both the layers being present roughly in similar amounts and possessing approximately the a thickness of ~5 mm. Plenty of garnet porphyroblasts (up to 5 mm) are also observed.
Petrographic Description: North Sikkim 19-005: The sample under the microscope shows the presence of quartz, K-feldspar, plagioclase feldspar, biotite, garnet, and acicular sillimanite as the dominant mineral constituents, with zircon and monazite occurring as accessory phases along with the development of melt (Figure 4a,b). The plagioclase is coarse grained and exhibits polysynthetic twinning. The garnet occurs as porphyroblasts and contains a variety of inclusions, mostly accessory minerals such as monazite. A myrmekitic texture is also observed at certain locations, with intergrowths of quartz in plagioclase. The quartz is relatively coarse grained and contains some inclusions, most likely fluid. The biotite crystals are generally lath shaped and are similarly oriented. The zircon crystals are very fine grained and are observed to be rounded or slightly elongated (Figure 4a). All of the crystals present are either anhedral or, in some cases, subhedral. Patches of melt observed in thin sections suggest that melting was driven by biotite dehydration, as evidenced by the visible breakdown of most of the visible grains of biotite, giving rise to fluids in the pre-existing rock. The quartz shows signs of melting and later recrystallization, as relict grains of similarly oriented quartz are seen within larger quartz crystals.
North Sikkim 19-006: The thin section indicates quartz, K-feldspar, plagioclase feldspar, and biotite as the dominant mineral constituents with zircon and monazite occurring as accessory phases and melts present with plagioclase feldspar and deformed boundary of quartz (Figure 4c,d). The quartz is very coarse grained, as are the K-feldspar and plagioclase, which exhibit polysynthetic twinning. The biotite occurrence is limited, and all of the crystals are similarly oriented. A rare staurolite with inclusions of quartz is also observed. Grains are mainly subhedral to anhedral in many cases. Relict grains of similarly oriented quartz are seen within larger grains of both quartz and plagioclase, suggesting melting and recrystallization. In some of the plagioclase, patches of melt are also observed.
North Sikkim 19-009: The thin section shows quartz, K-feldspar, plagioclase feldspar, biotite, and muscovite, which are observed to be the dominant mineral constituents. Zircon and monazite occur as accessory phases. The quartz is very coarse grained and anhedral, and on occasion, it contains inclusions. The K-feldspar ranges from medium to coarse grained and is mostly subhedral. Plagioclase is coarse grained and anhedral and displays polysynthetic twinning. Biotite and muscovite occur as similarly oriented lath-shaped crystals, and signs of alteration along cleavage planes are evident in the muscovite. There are no signs of melting or other unique textures, the significance of which is discussed later on in the results.
West Sikkim 19-010: Under microscope, quartz, K-feldspar, plagioclase feldspar, biotite, and garnets are present as major constituents. Zircon and monazite occur as accessory phases. The garnet occurs as porphyroblasts and contains a variety of mineral inclusions such as biotite and feldspars along with minor amounts of monazite and zircon. Plagioclase displays polysynthetic twinning. A myrmekitic texture is seen in the K-feldspar at its boundary with the quartz crystals. Excluding the quartz and feldspars occurring in the myrmekite, they are present as coarse-grained, anhedral crystals, often containing large mineral inclusions of biotite, feldspar, or quartz.
Isotopic Studies: Zircon, monazite, and quartz were separated from four samples–19-005, 19-006, 19-009, and 19-010—at the Research School of Earth Sciences, Australian National University, using optimized techniques designed to avoid trace mineral cross-contamination. About 350 g of rock was chipped for each sample, and the chips were cleaned ultrasonically in water and then crushed to minus 250 µm in a ring mill. After the powder had been deslimed in running water, heavy minerals were concentrated using tetrabromoethane (2.96 g/cc) followed by methylene iodide (3.3 g/cc). Afterward, a handheld magnet was used to remove the magnetic portions followed by a Frantz magnetic barrier separator. Further, monazite and zircon concentrates were separated using a binocular microscope. Quartz was extracted from the low-density fraction.
The sample yielded a large number of zircon and monazite grains that were handpicked for SHRIMP analysis. Over 300 grains of zircon per sample were selected at random and mounted in a 25 mm epoxy disc with zircon standards SL13 (U = 238 ppm), Temora 2 (206Pb/238U = 0.06679; [78]), and R33 (δ18O = +5.55‰; [64]). About 20 high-quality monazite grains (unbroken and free of large inclusions) were selected per sample and mounted in a 25 mm epoxy disc with monazite standard 44069 (U ≈ 2100 ppm, 206Pb/238U = 0.06813 Ma; [79], δ18O = +7.67‰; [80]). A variety of quartz grains were mounted in a 25 mm epoxy disc with quartz standard NBS 28 (δ18O = +9.2‰; [81]).
The mounts were first ground using 1200-grade SiC paper to expose the grains’ centers, then they were polished using 3 and 1 µm diamond paste, respectively. They were then photographed at high magnification in transmitted and normal reflected light. The zircon mount was also imaged by cathodoluminescence (CL) using a JEOL JSM-6610A SEM fitted with a Robinson CL detector. Prior to the U-Th-Pb isotopic analysis, the zircon and monazite mounts were thoroughly cleaned using petroleum spirit, warm RBS35 detergent solution, and Millipore water. Using a Leica EM ACE600 coater, they were then cleaned by glow discharge and coated with ~10 nm of high-purity Au. Before O isotopic analysis, the Au was removed, and the mount was recleaned and coated with ~12 nm of high-purity Al. The quartz mount was also coated with high-purity Al.
The zircons were analyzed for U-Th-Pb isotopes using the SHRIMP IIe at Geoscience Australia, Canberra, and a procedure based on that described by [82]. In brief, a ~2 nA, 10 kV primary beam of negative O2 ions was focused on a probe with a ~20 µm diameter. Positive secondary ions were extracted from the sample at 10 kV. The Zr, Pb, U, and Th atomic and molecular species of interest were analyzed at ~5000 mass resolution using a single ETP electron multiplier and magnetic peak switching. The Pb isotopic composition was measured directly, with no correction for mass-dependent isotopic mass fractionation required. Interelement fractionation was corrected using Temora 2 and a Pb/U-UO/U power law calibration equation [83]. Pb, U, and Th concentrations were measured relative to SL13. Common Pb corrections were made using 204Pb or 207Pb, depending on the zircon age, and a Pb isotopic composition commensurate with the age of each grain (Cumming and Richards, 1975 [84]). Uncertainties in the plots and data table are 1σ-precision estimates. Uncertainties in the calculated mean ages are 95% confidence limits (1σ). Ages were calculated using the constants recommended by the IUGS Subcommission in [85].
The monazites were analyzed for U-Th-Pb isotopes using the SHRIMP II at the Research School of Earth Sciences, Australian National University, Canberra, and a similar procedure, except that moderate energy filtering was used to remove a molecular isobaric interference with 204Pb, and Pb/U and Pb/Th were calibrated against 44069 independently using Pb/U-UO/U and Pb/Th-ThO/Th, respectively.
Prior to the O isotopic analysis, the zircon and monazite mounts were polished to remove any O implanted during the U-Th-Pb dating. The O analyses were then positioned as close as possible to the locations of the dated spots. The oxygen isotopic compositions of zircon, monazite, and quartz were measured using the ANU SHRIMP II and a procedure based on that described by [86]. In brief, a ~3 nA, 15 kV beam of positive Cs ions was focused on a probe ~25 µm diameter. Negative O secondary ions were extracted at 10 kV, mass separated at ~3000 R, and measured in current mode using multiple collectors equipped with dual Faraday cups [resistors 1011 Ω (16O), 1012 Ω (18O)]. Charge on the sample surface was neutralized using a 1.2 kV focused electron beam. Each analysis consisted of 2 min preconditioning, during which electrometer baselines were measured, followed by optimization of the beam steering and 6 × 20 s measurements of 18O/16O, resulting in a precision of ~0.1‰ s.e. (16O 1.7–2.1 GHz). Corrections for electron-induced secondary ion emission (EISIE) were made based on EISIE measurements before and after each analysis. Isotopic fractionation was monitored, and corrections were made using analyses of matrix-matched standards (zircon R33, monazite 44069, and quartz NBS 28) throughout the analytical session.

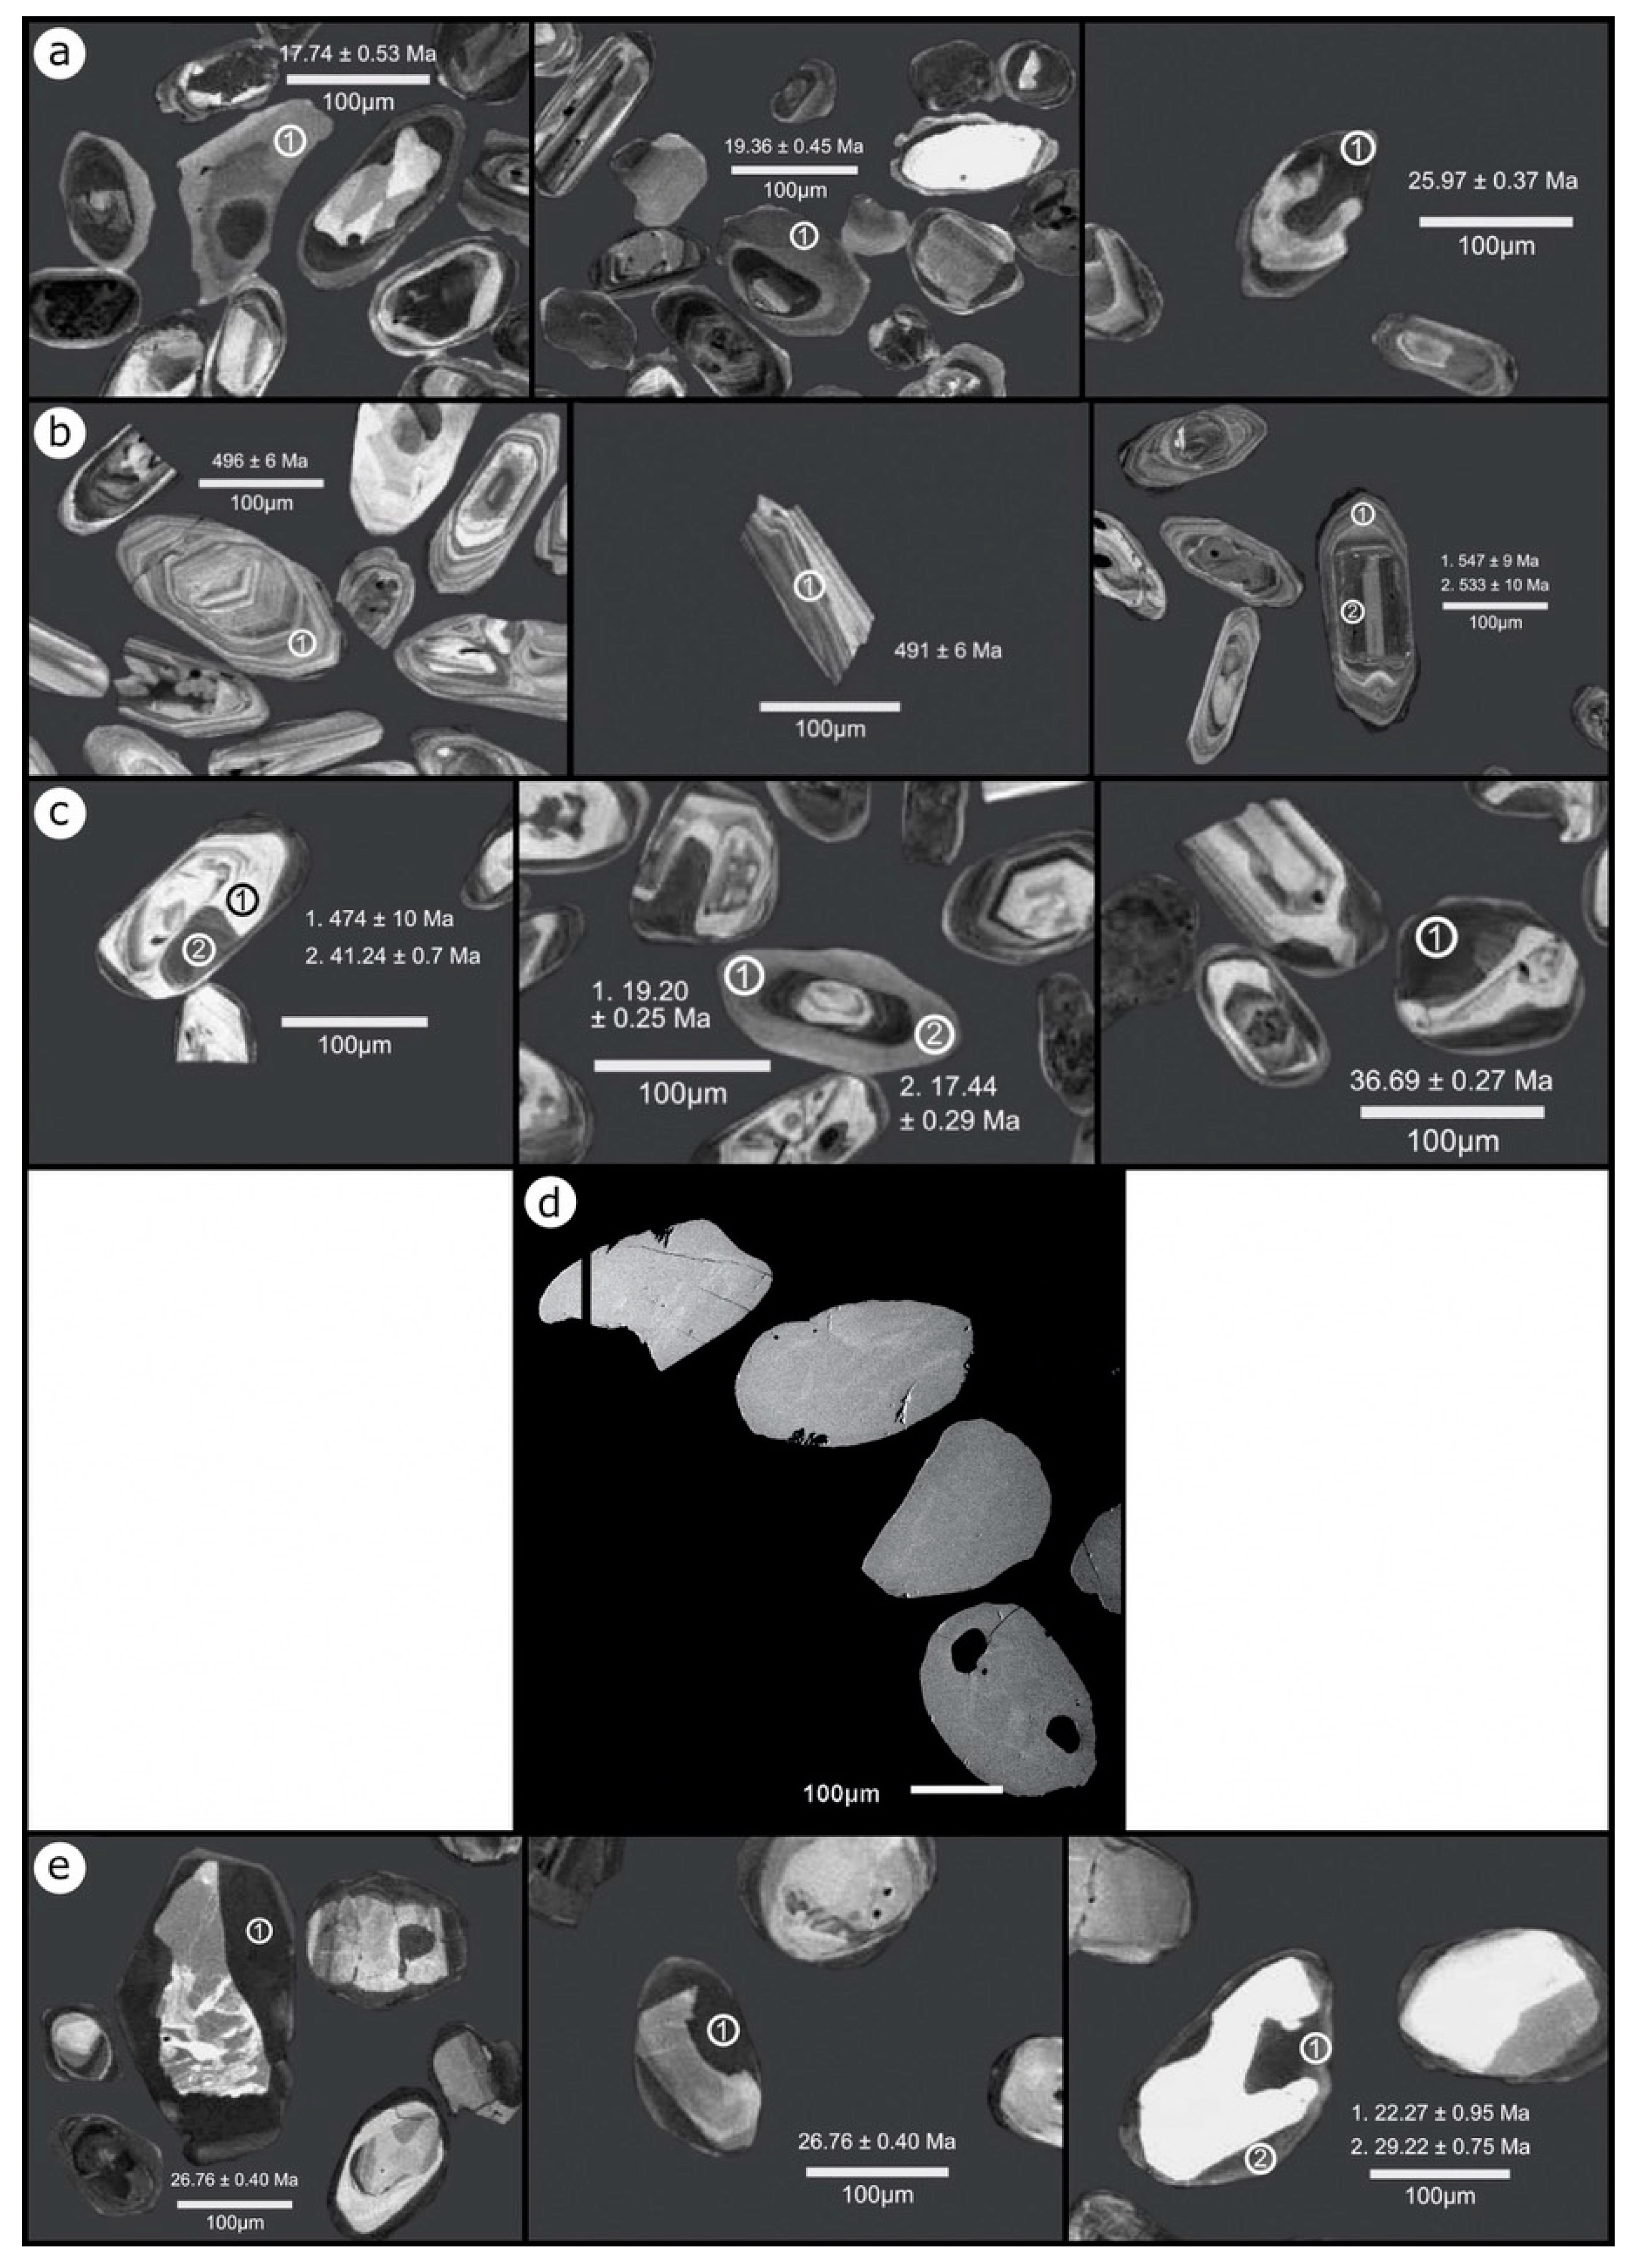
4. Internal Structure of Zircon and Monazite

4.1. North Sikkim 19-005

The zircon grains are generally smaller than 100 μm and rounded (Figure 5a). Almost all of the zircons from this sample have detrital cores that are unzoned or exhibit banded, sector, or concentric zoning [87]. All zircon crystals have at least one layer that can be made out to be metamorphic overgrowth. Many have 2–3 discernible concentric layers with varying shades of grey, with greyness decreasing with age (Figure 5a). The metamorphic overgrowths can be observed in many grains and seem to have caused deep embayment in the zircon and, in some cases, have affected the entire crystal leaving just a tiny remnant of the core. This suggests solid-state recrystallization.
The monazite grains are medium to coarse grained (50–250 µm), roughly equant, moderately angular, subhedral, pale yellowish-green crystals. About 20% of the crystals contain fine inclusions. The grains were uniform and displayed no zoning in BSE images.

4.2. North Sikkim 19-006

This sample was composed of entirely concentrically zoned igneous zircons with a very thin 1 to 2 µm overgrowth (assumed to be metamorphic) and detrital cores that are unzoned or exhibited banded, sector, or concentric zoning (Figure 5b). The grains are elongated and are 100 µm or more in length.
The monazite grains are medium grained (100–150 µm), roughly equant, mostly rounded, subhedral, brownish crystals, with fine- to medium-sized inclusions. The grains were uniform and displayed no zoning in BSE images.

4.3. North Sikkim 19-009

Zircon from this sample represents multiple zones (Figure 5c). It comprises the innermost unzoned detrital component followed by a concentric-zoned igneous component from the Cambro-Ordovician. This is then followed by at least two generations of thick, metamorphic overgrowths that are distinguished by a grey CL response. The younger overgrowths are a lighter grey as compared to the older overgrowths. Unlike sample 19-005, the zircon grains are not embayed by the younger metamorphic overgrowths, suggesting growth in the presence of a metamorphic fluid. The grains range in size from 30 µm up to 200 µm and vary in shape from round to elongated.
The monazite grains are medium to coarse grained (80–200 µm), equant, rounded, subhedral to euhedral, pale green crystals. About half of the crystals contain fine to rather large inclusions of what appears to be fluid in most cases and/or some opaque minerals observed with a transmitted light microscope. The grains are not uniform, and in the BSE images, faint zoning in some of the grains is evident (Figure 5d).

4.4. West Sikkim 19-010

Zircon from this sample consists of detrital zircon with at least two generations of concentric metamorphic overgrowths (Figure 5e). The detrital cores are unzoned or exhibit banded, sector, or concentric zoning. The younger growth is a lighter shade of grey as compared to the older ones. The grains range from about 50 µm up to 200 µm in size and are either rounded or slightly elongated (Figure 5e).
The monazite grains are medium to coarse grained (50–250 µm), approximately equant, moderately angular, anhedral, pale green crystals. Roughly 20% of the crystals contain fine- to medium-sized inclusions of fluid and/or transparent minerals, as observed with a transmitted light microscope. The grains appear to be fragments of larger crystals. In BSE images, the grains are uniform and display no zoning.

5. Results of the Zircon Dating
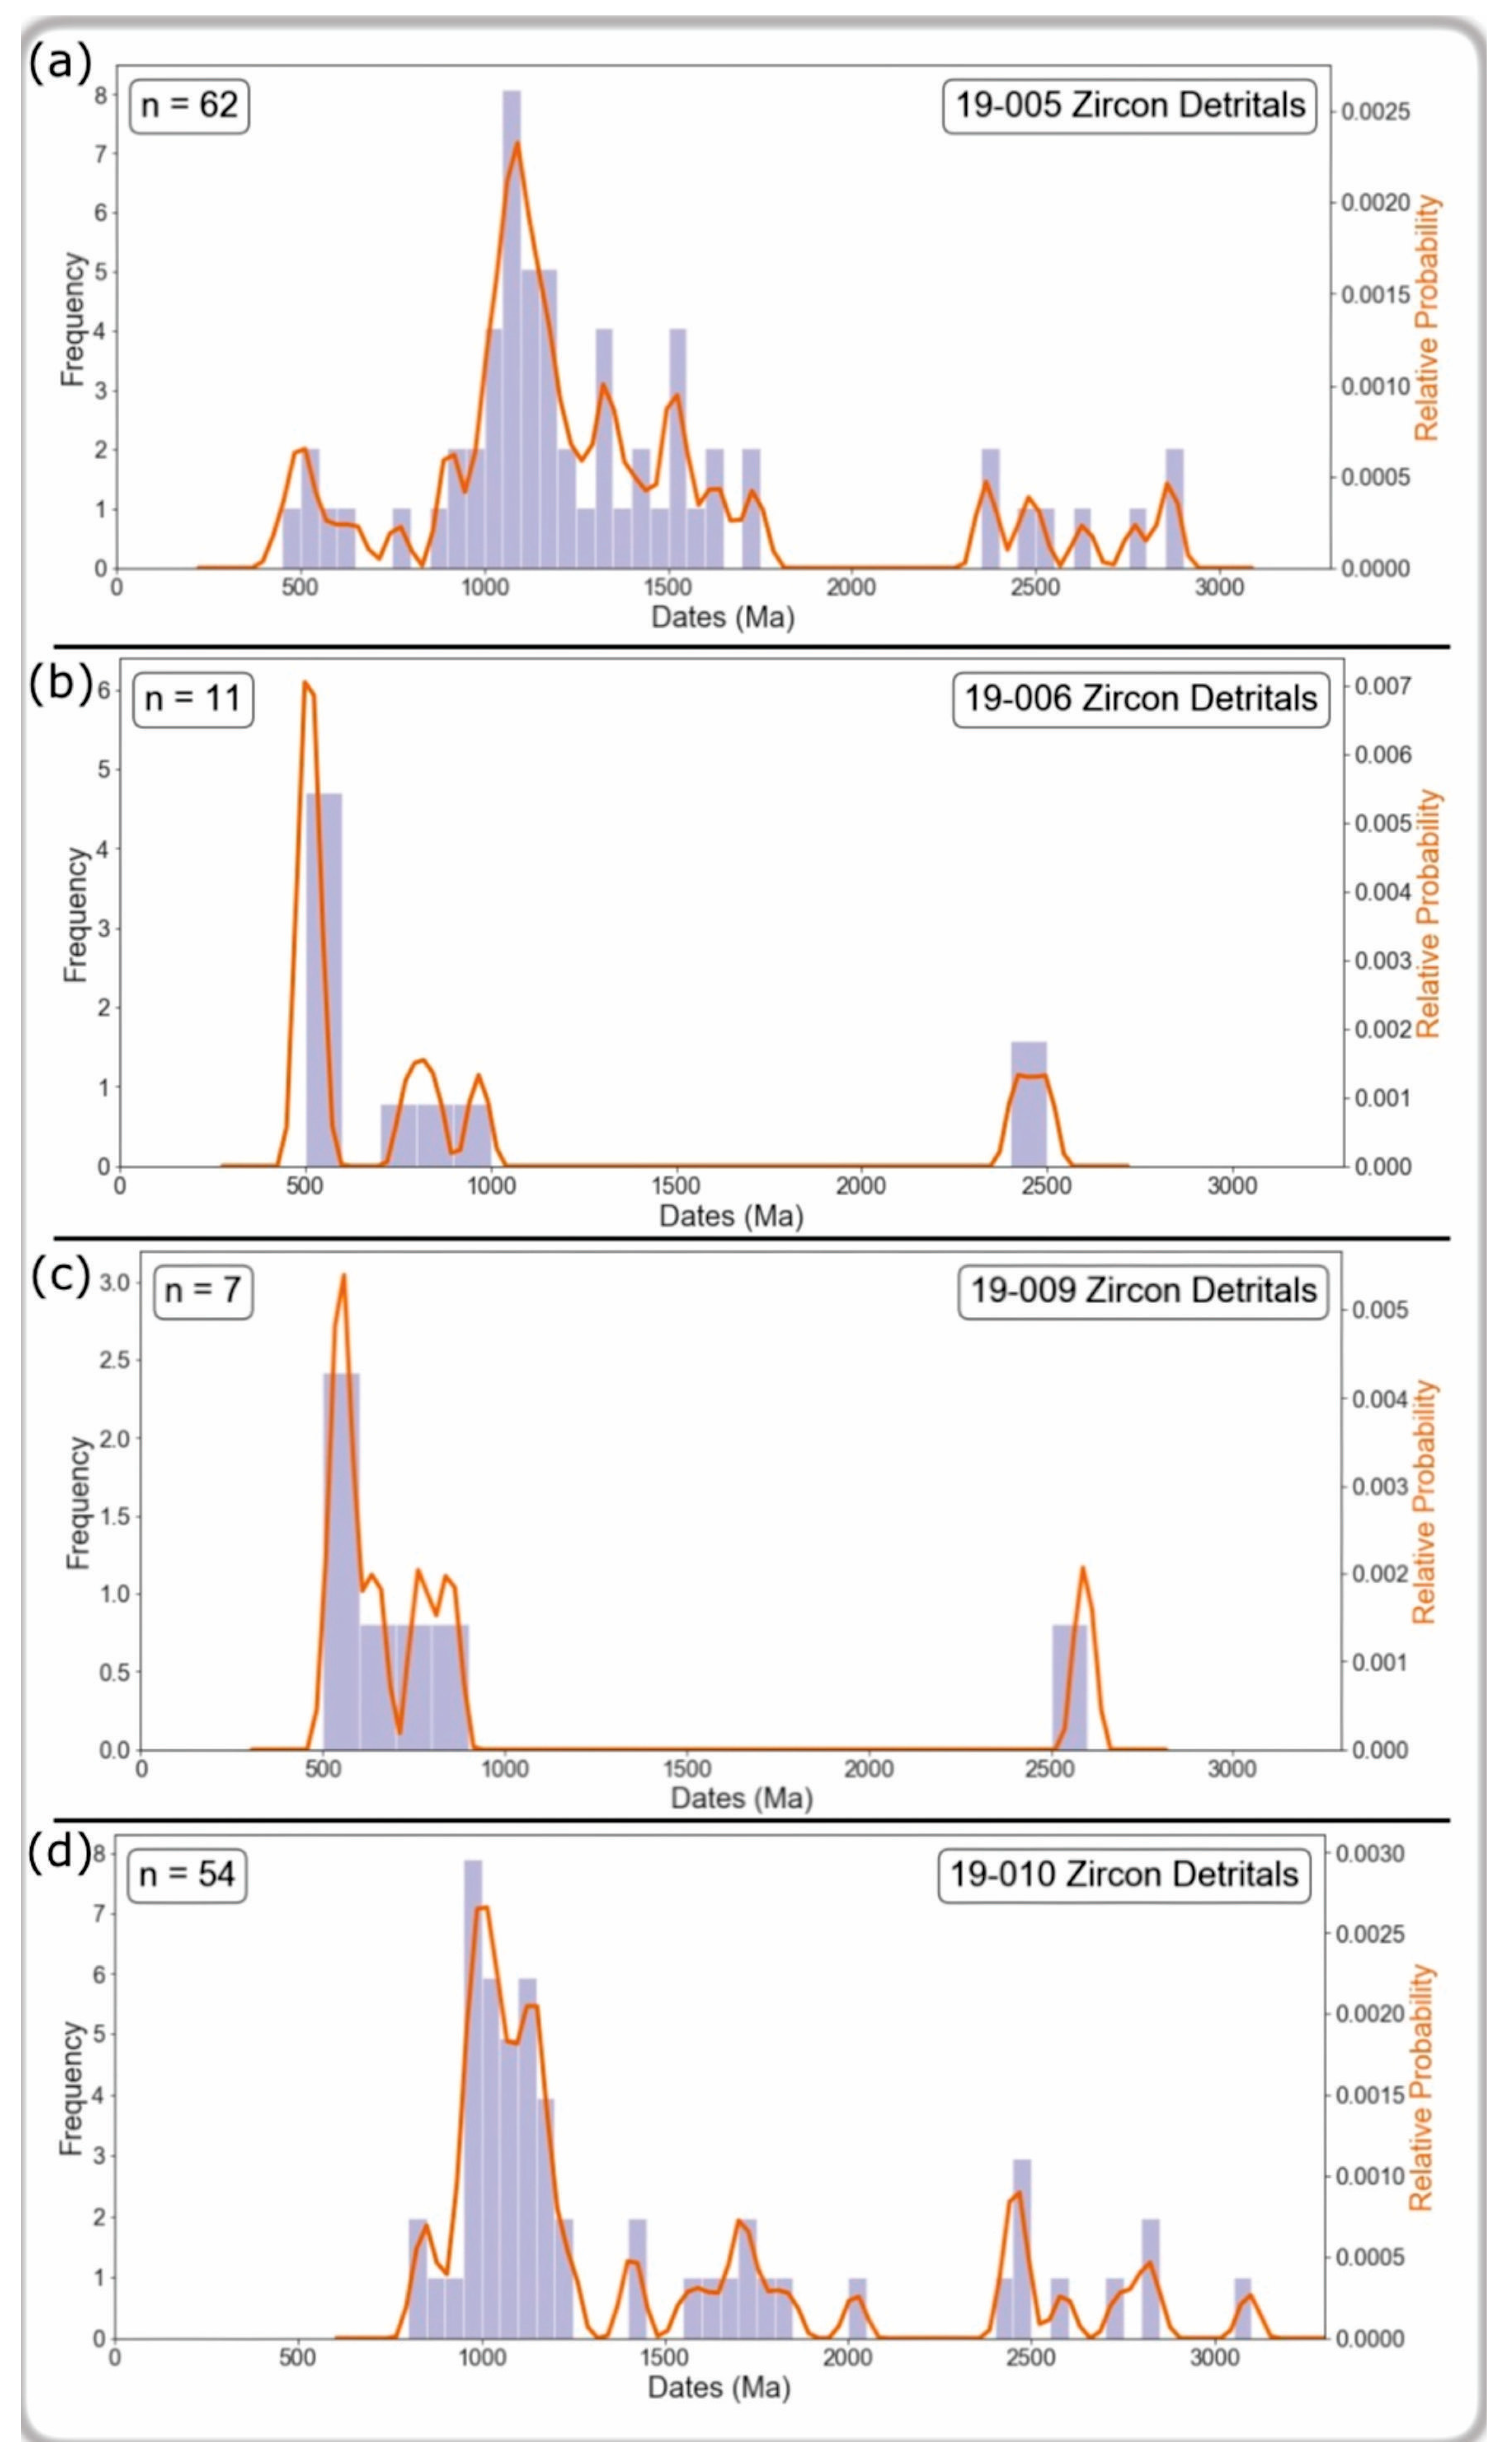
5.1. Protolith

The dates are based on radiogenic 206Pb/238U for cores < 1.2 Ga and on radiogenic 207Pb/206Pb for cores > 1.2 Ga or discordant analyses. The detrital component of zircon from the Sikkim Himalayas shows a similar result as that characterized in the NW Himalayas [26,62,88]. Zircon from the northern Sikkim samples marks the maximum age of deposition of the upper package to be up to 500 Ma. However, the zircon population (19-010) of the lower package lacks a zircon component lower than Neoproterozoic time (Figure 6). The data for all of the detrital measurements have been provided in the Supplementary Materials Tables S1–S4 and the concordia diagram presented in Supplementary Figure S1a–d.

5.1.1. North Sikkim 19-005

A total of 62 analyses were carried out, with the youngest detrital age group measured to be c. 500 Ma (8% of all cores). Older prominent groups include some at c. 1200 Ma (23%) and c. 1600 Ma (13%), along with a few analyses that are as old as c. 2800 Ma (5%) (Figure 6a).

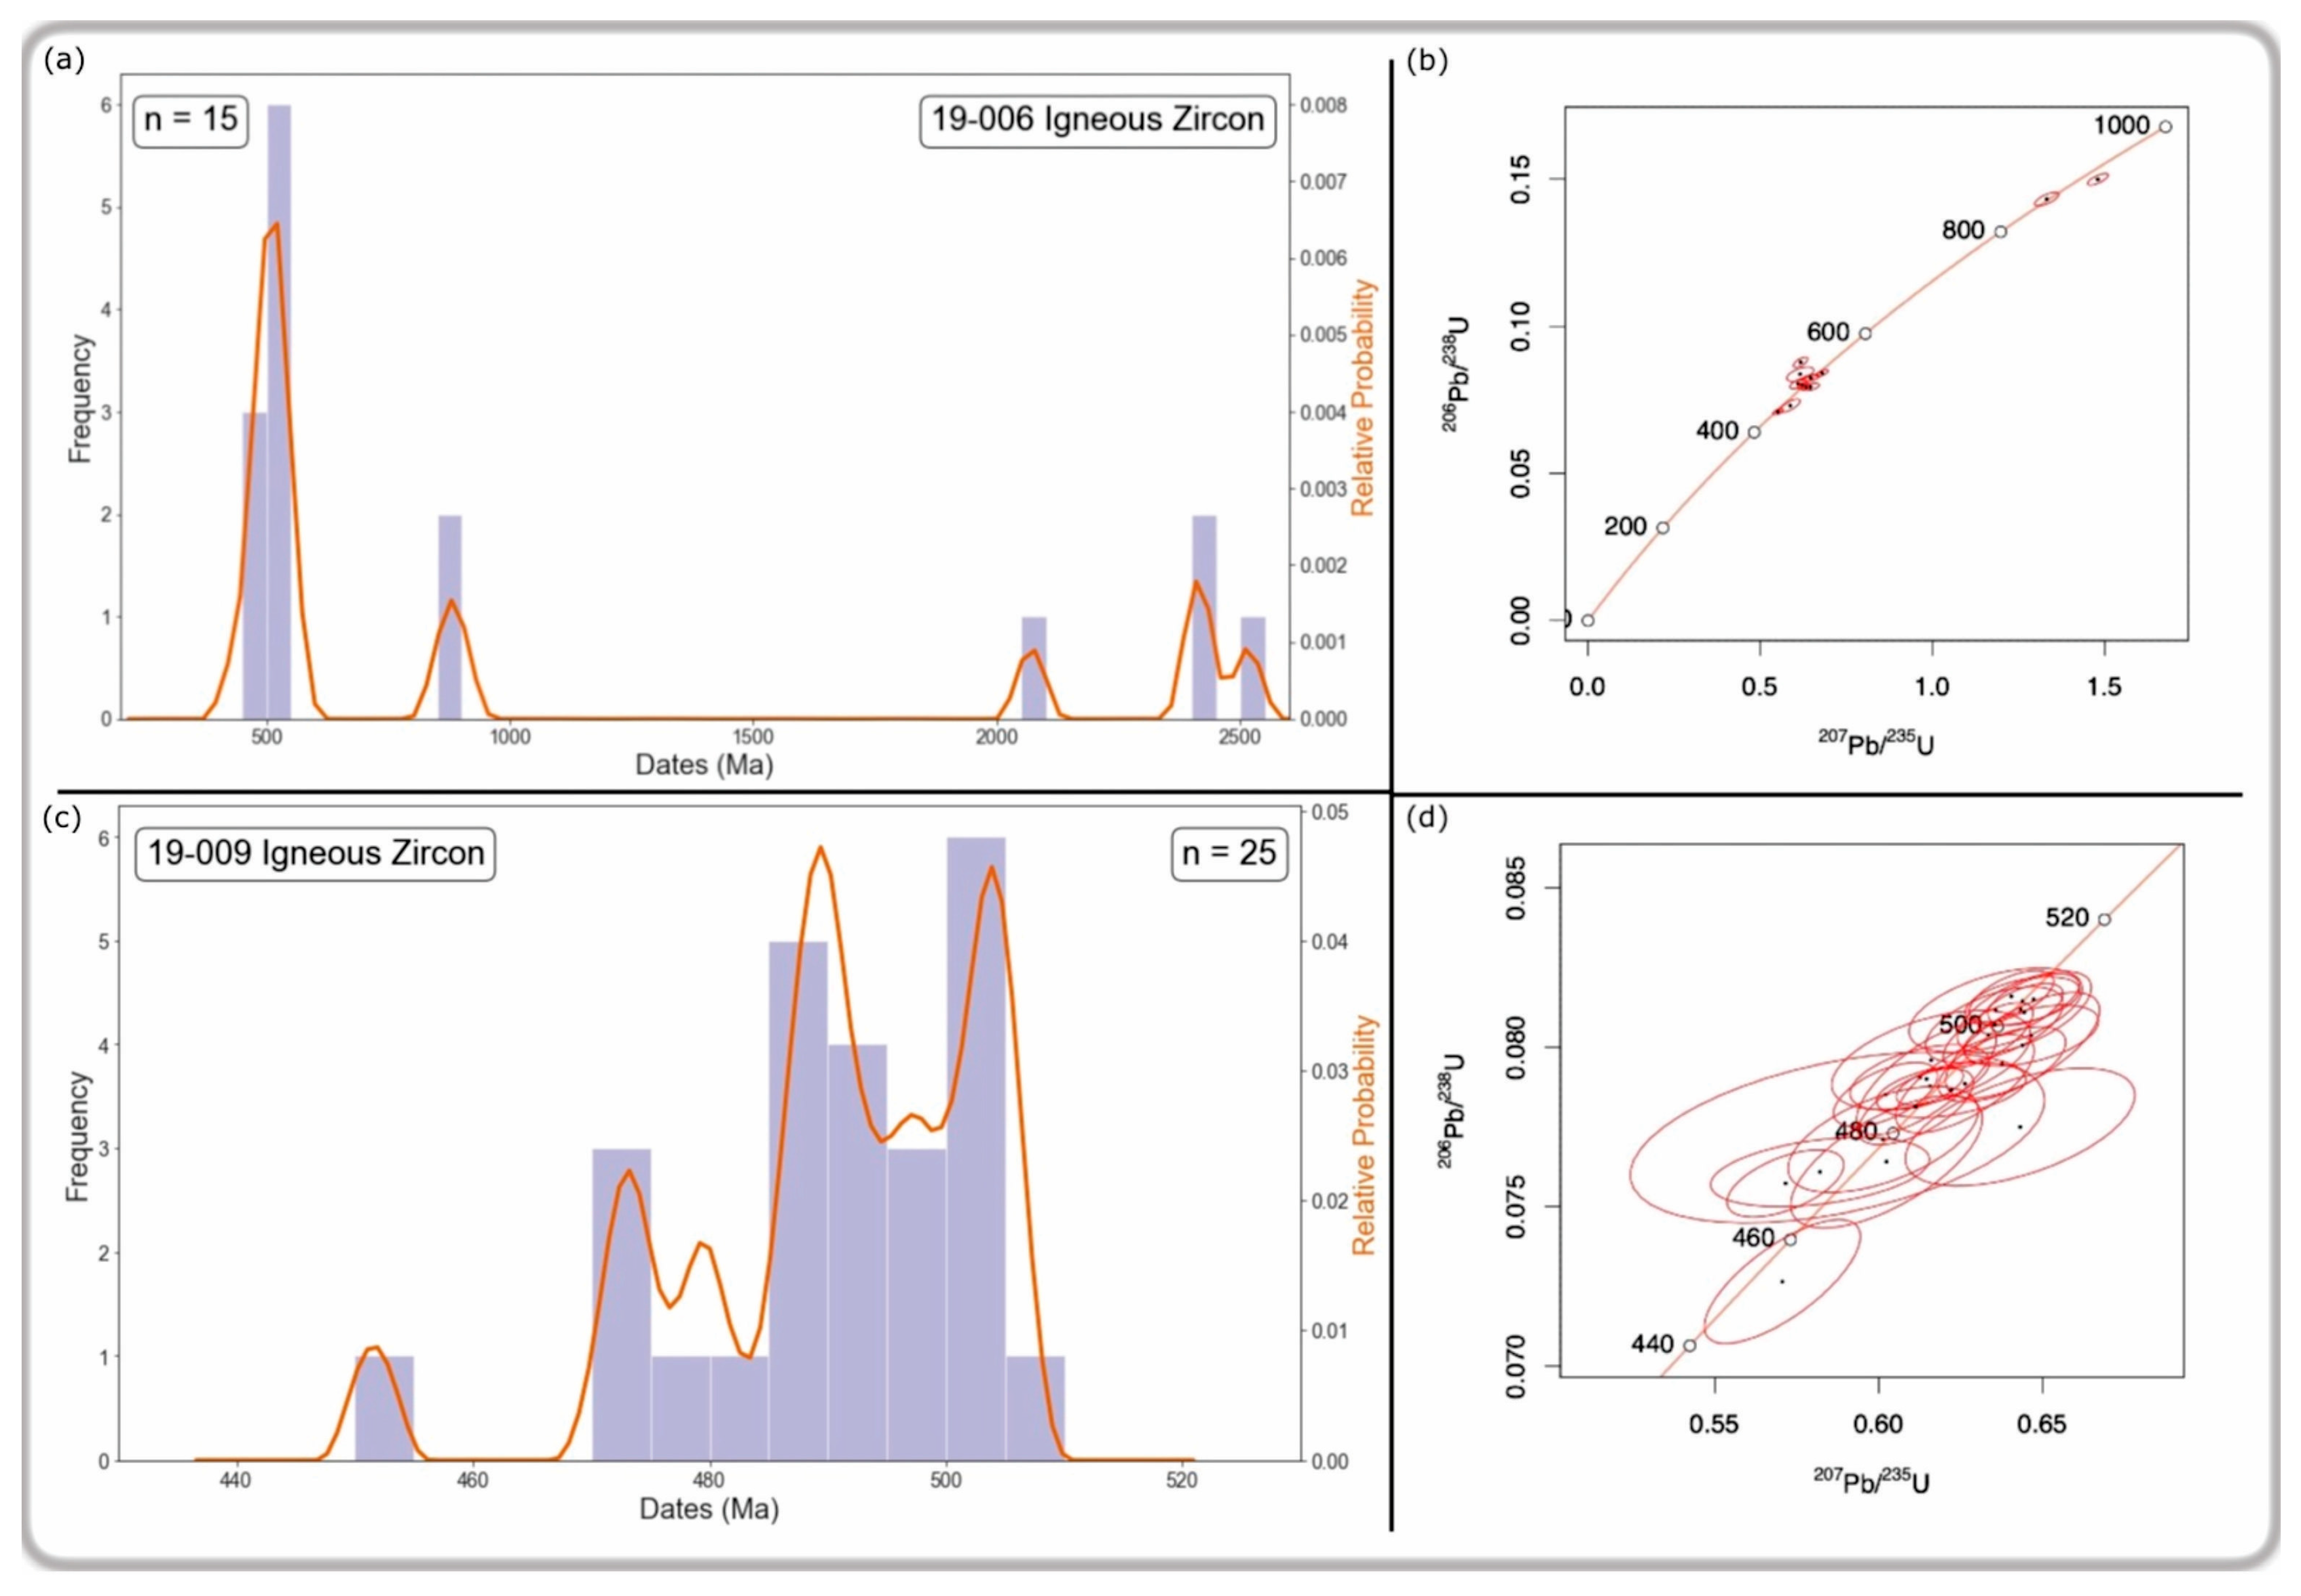
5.1.2. North Sikkim 19-006

Over 50% of the measurements on this sample indicate a c. 500 Ma group (6 out of 11 cores), consistent with the sample mentioned above. The oldest analyses are c. 2400 Ma (Figure 6b).

5.1.3. North Sikkim 19-009

Even with just seven measurements on this sample, we still get a clear indication that the youngest detrital components are around c. 500 Ma (3 out of 7 cores), with the oldest ones being c. 2500 Ma. This is consistent with all the other samples from North Sikkim and those of the NW Himalayas (Figure 6c), and marks the maximum age of deposition for the region at ~500 Ma.

5.1.4. West Sikkim 19-010

With a total of 54 measurements on this sample, most of the dates (57%) lie in the range 820–1240 Ma. The youngest detrital component is from c. 800 Ma. Also, clear evidence of groups is present at c. 1100 Ma (27% of all cores), c. 1700 Ma (9%), and c. 2500 Ma (7%). The oldest measurement on this sample is c. 3100 Ma (Figure 6d). The West Sikkim sample lacks the c. 500 Ma component in its detrital suite, suggesting its accretion from a different terrane during the Phanerozoic time. Assuming no significant lead loss, the maximum age of deposition of sediments from this sample is ~800 Ma.

5.2. Igneous Ages

Like the NW Himalayas, which display widespread Cambro-Ordovician magmatism marked by the emplacement of a chain of granitic plutons within the HHC [15,89], some of our samples display evidence of a Cambro-Ordovician magmatic event, with well-established outcrops of granite occurring near the MCT (Chungthang granite). Only two samples have igneous zircon populations of Cambro-Ordovician age (Figure 7).
North Sikkim 19-006: All 11 analyses carried out are concordant or within analytical uncertainty. The 206Pb/238U dates range from ~441 to 512 Ma. The analyses fall into one main group at 505.5 ± 4.7 Ma (n = 10) (Figure 7a—Supplementary Materials Table S2) with a Th/U of 0.0586 to 0.8209.
North Sikkim 19-009: All 11 analyses carried out are concordant or within analytical uncertainty. The 206Pb/238U dates range from ~451 to 506 Ma. The analyses fall into one main group at 491.6 ± 3.2 Ma (n = 20) (Figure 7c—Supplementary Materials Table S3) with Th/U values ranging from 0.01089 to 1.3869, indicative of primary magmatic origin.

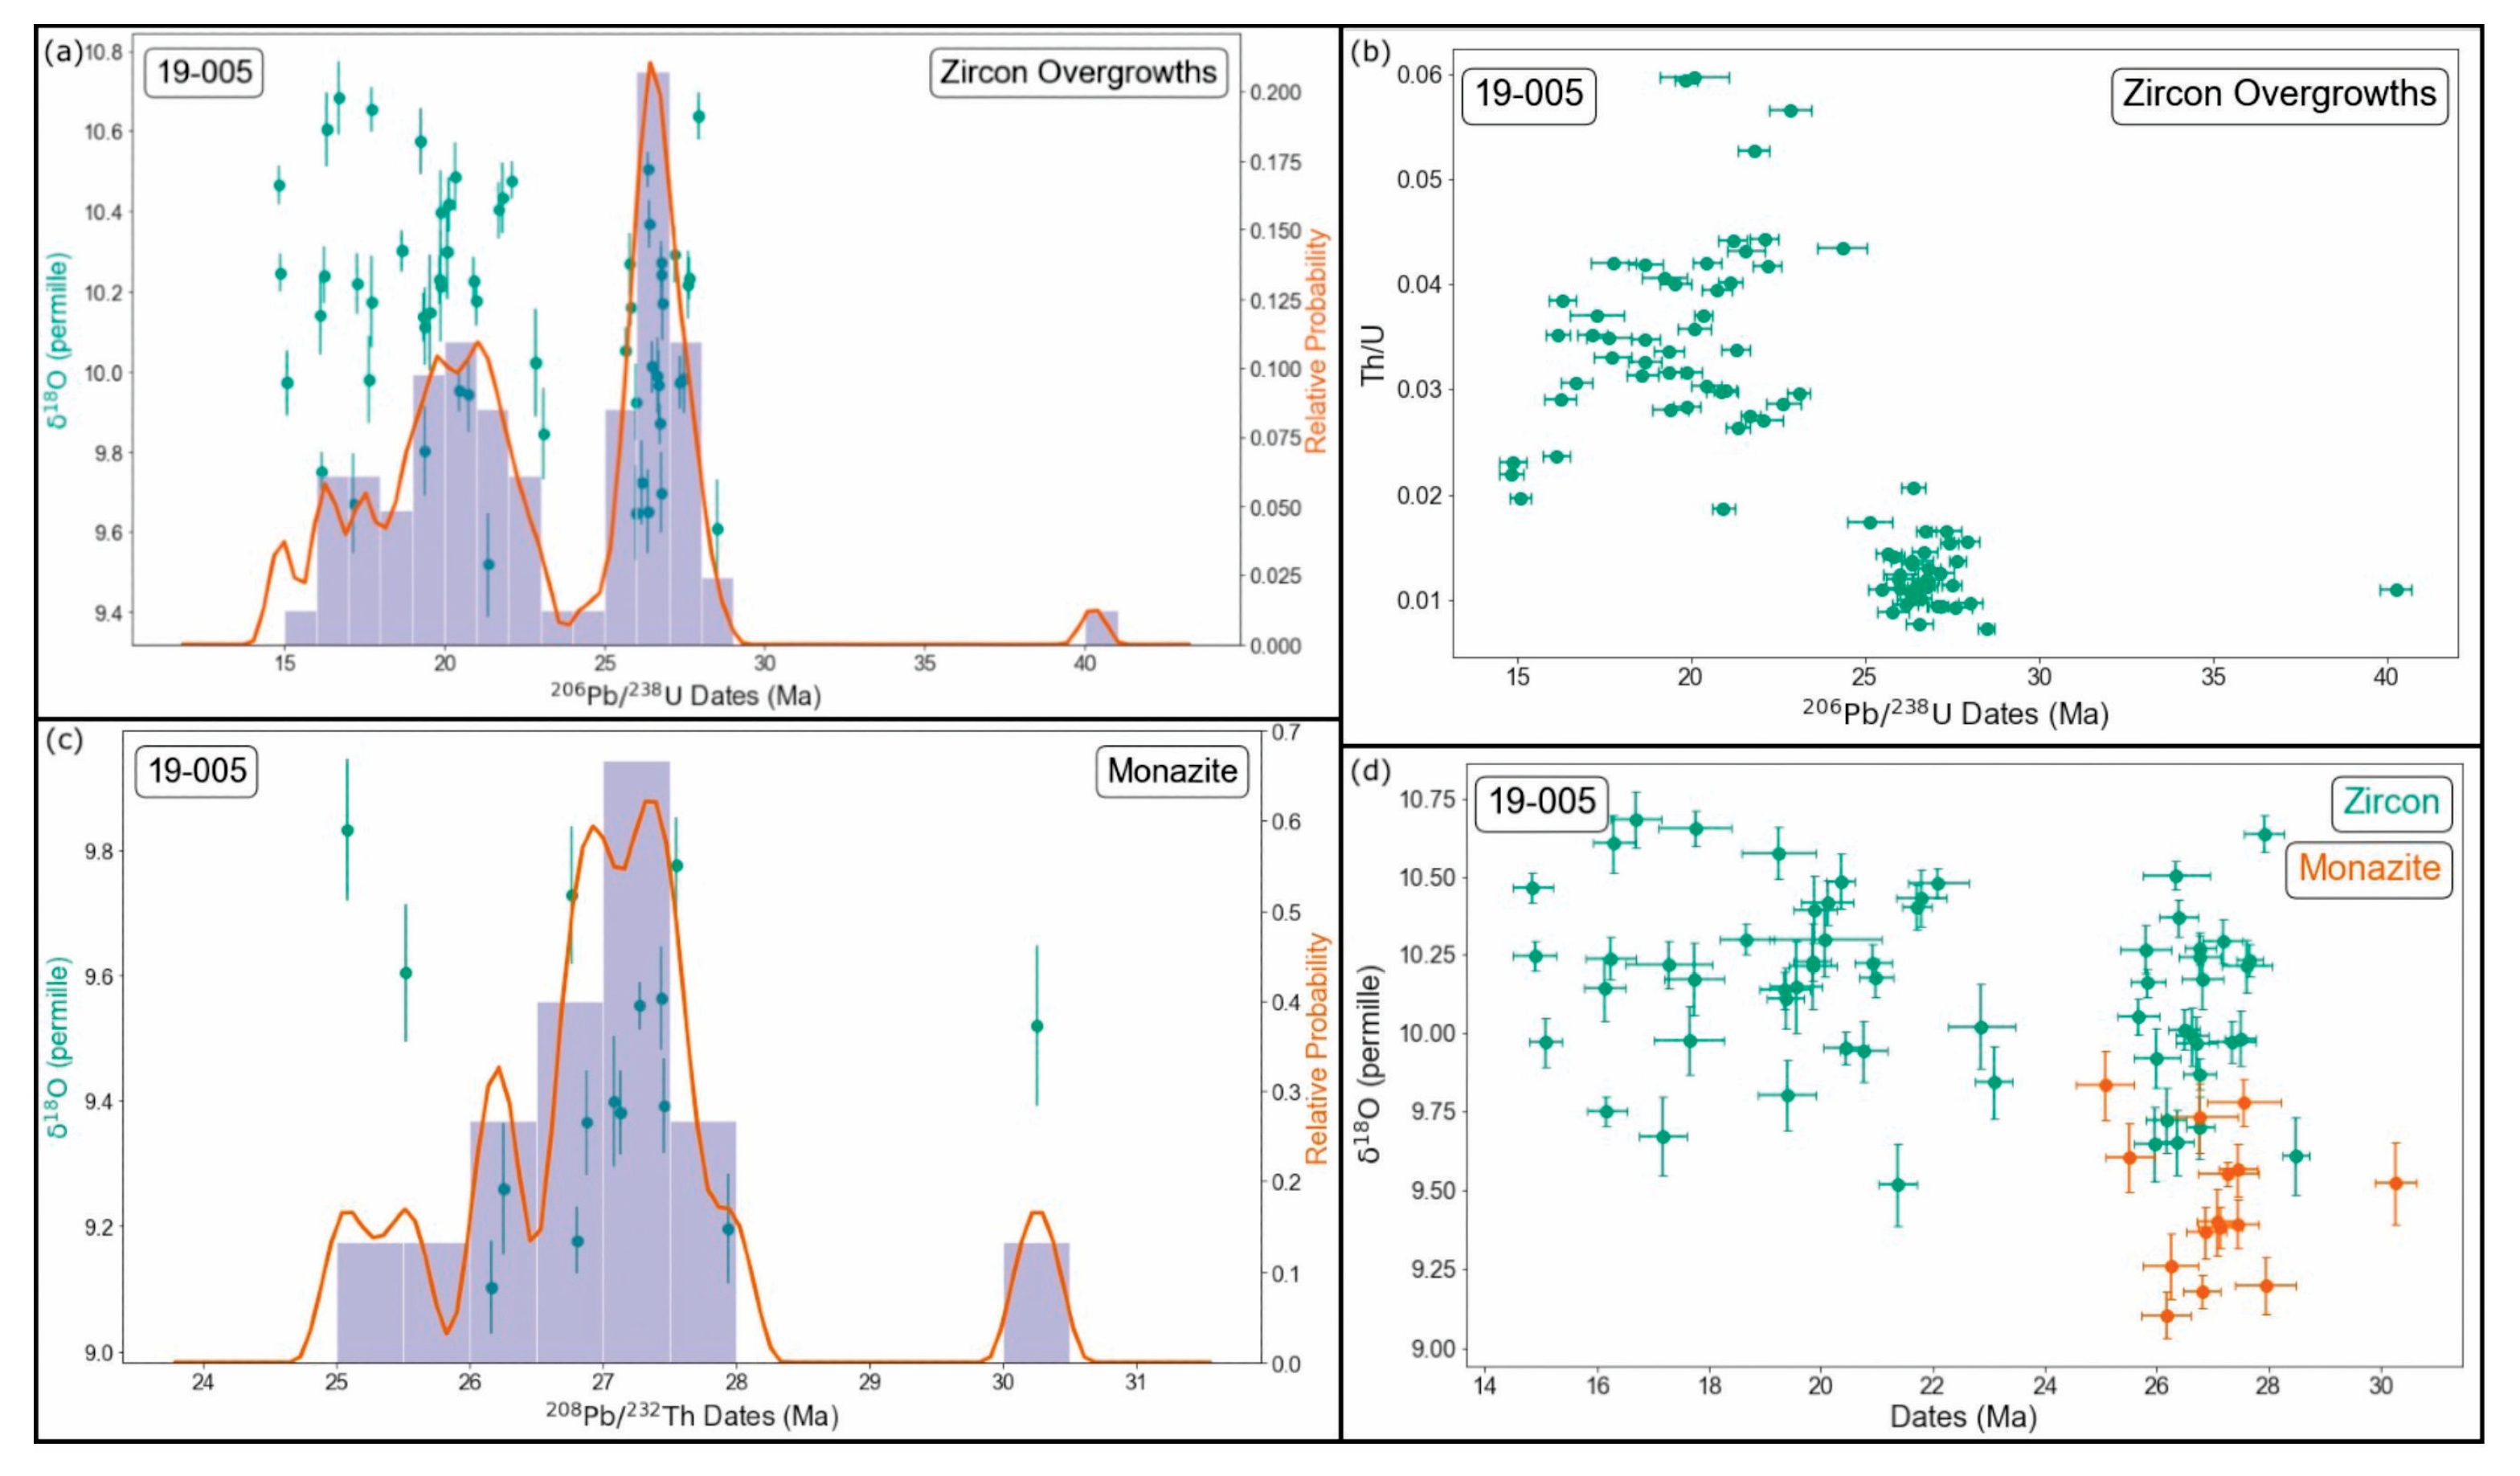
5.3. Metamorphic Ages

The data for all the metamorphic measurements have been provided in the supplementary data tables. The zircons from sample 19-006 did not have large enough metamorphic rims that could be analyzed.

5.3.1. North Sikkim 19-005

The 84 analyses of overgrowths are all concordant with analytical uncertainty, even before correction for the very small amount of common Pb present. A significant range in the 206Pb/238U dates is observed, ~15–28 Ma, with an isolated analysis at c. 40 Ma. This large range, however, can be separated into two groups on the basis of the Th/U or U (ppm) values and dates. The first (and older) group indicates a 206Pb/238U age at 26.6 ± 0.17 Ma (n = 24) with a low and consistent value of Th/U between 0.00720 and 0.02068 (high values of U ranging from ~1100 to 2500 ppm). The second (and younger) group indicates trailing growth from about 22 Ma until 15 Ma (n = 47) (Figure 8a—Supplementary Materials Table S1). The Th/U values of this generation of overgrowth are more varied and range from 0.01863 to 0.05975 and possess lower U, ~270–1000 ppm (Figure 8b).

5.3.2. North Sikkim 19-009

The 45 analyses of overgrowths are all concordant with analytical uncertainty, even before correction for the very small amount of common Pb present. A considerable range in the 206Pb/238U dates is observed, ~15–55 Ma (Figure 9a—Supplementary Materials Table S3). This large range can be segregated into four episodes of metamorphic overgrowth. The older generations are embayments in the zircon crystals, and the younger ones are regular overgrowths. The 206Pb/238U age of the first event is 54.5 ± 3.0 Ma (n = 2) with a Th/U range of 0.01679–0.02362. The second event has a 206Pb/238U age of 36.4 ± 0.30 Ma (n = 9) with a Th/U of 0.0128–0.02011. The third event has a 206Pb/238U age of 29.2 ± 0.50 Ma (n = 4), possessing Th/U values in the range 0.01105–0.01963. These three metamorphic events are not particularly distinct, with a few zircons recording dates in between these values. The three events are followed by trailing growth from 22 Ma to 15 Ma (n = 6); these overgrowths have Th/U values ranging from 0.00583 to 0.01163 (Figure 9a,b—Supplementary Materials Table S3). A weak trend of decreasing values of Th/U with age can be observed in this sample; the U contents of the overgrowths too seem to follow this trend, suggesting extreme depletion of Th by the crystallization of other Th-rich minerals such monazite, allanite, etc., occurring simultaneously (Figure 9b). This is the opposite of what is observed in sample 19-005.

5.3.3. West Sikkim 19-010

All 22 analyses of overgrowths are concordant within analytical uncertainty, even before correcting for the very small amount of common Pb present. The 206Pb/238U dates range from ~20 to 30 Ma (Figure 10a—Supplementary Materials Table S4). This range can be split into three different episodes of metamorphic overgrowth. The older overgrowths occur as embayments in the crystals, while the younger ones occur as regular overgrowths. The first event has a 206Pb/238U age of 28.6 ± 1.0 Ma (n = 4) with a Th/U range of 0.0058–0.01161. The second event has a 206Pb/238U age of 26.4 ± 0.50 Ma (n = 6), possessing a slightly higher Th/U value ranging from 0.00809 to 0.01448. The third and final event has a 206Pb/238U age of 23.3 ± 0.5 Ma (n = 6) with a much higher Th/U range of 0.01442–0.02445 (Figure 10a,b—Supplementary Materials Table S4). A trend of increasing Th/U ratios of the overgrowths with decreasing age can be observed, and this effect can be attributed to concentrations of U decreasing with the dates of the metamorphic overgrowths (Figure 10b).

6. Results of the Monazite Dating

6.1. North Sikkim 19-005

A total of 12 of the 15 grains of monazite were analyzed to have the same 208Pb/232Th within analytical uncertainty, giving a weighted mean age of 26.99 ± 0.32 Ma. The independently calibrated U-Pb isotopic compositions are also very internally consistent but provide a slightly higher weighted mean 206Pb/238U age of 27.46 ± 0.54 Ma, even after a downward correction to account for the presence of initial 230Th. Due to the higher precision of the mean 208Pb/232Th age and its independence from the need for a disequilibrium correction, 26.99 ± 0.32 Ma is the best estimate of the monazite age. This coincides well with the older metamorphic overgrowth on the zircon (Figure 8c—Supplementary Materials Table S5).

6.2. North Sikkim 19-006

A total of 13 out of 15 analyses of five grains of the monazite have the same 208Pb/232Th within analytical uncertainty, giving a weighted mean age of 24.29 ± 0.25 Ma (Figure 11Supplementary Materials Table S6). The independently calibrated U-Pb isotopic compositions are also very internally consistent and provide a similar weighted mean 206Pb/238U age of 24.34 ± 0.36 Ma post a correction to account for the presence of initial 230Th. Though both the ages are very similar, the 208Pb/232Th age of 24.29 ± 0.25 Ma is the best estimate of monazite age. It has slightly higher precision and is independent of a disequilibrium correction.

6.3. North Sikkim 19-009

A total of 14 analyses of 12 grains of the monazite were made. They are separated into two groups of analyses, each possessing the same 208Pb/232Th within analytical uncertainty, giving us a weighted mean age of 24.99 ± 0.41 Ma (n = 7) for the older group and a weighted mean age of 21.65 ± 0.75 Ma (n = 3) for the younger group (Figure 9c—Supplementary Materials Table S7). Crystals accompany these ages with dates of ~19 Ma (n = 2) and ~16 Ma (n = 1). The independently calibrated U-Pb isotopic compositions are also very internally consistent but give a slightly higher weighted mean 206Pb/238U age for 25.66 ± 0.46 Ma (n = 6) for the older group and 22.91 ± 0.73 Ma (n = 4) for the younger group. Considering the higher precision of the mean 208Pb/232Th age and its independence from the need for a disequilibrium correction, 24.99 ± 0.41 Ma and 21.65 ± 0.75 Ma are the best estimates of the monazite ages.

6.4. West Sikkim 19-010

The 14 monazite grains analyzed all have the same radiogenic 208Pb/232Th within analytical uncertainty, giving a weighted mean age of 27.03 ± 0.30 Ma (Figure 10c—Supplementary Materials Table S8). The independently calibrated U-Pb isotopic compositions are also very internally consistent and give a similar weighted mean 206Pb/238U age of 26.92 ± 0.46 Ma post a downwards correction to account for the presence of initial 230Th. Though both the ages are very similar, the 208Pb/232Th age of 27.03 ± 0.30 Ma is the best estimate of monazite age, as it has higher precision and is independent of a disequilibrium correction.

7. Results of the Oxygen Analyses

7.1. Zircon

All quoted values have standard deviations similar to those of the reference zircon measurements. The δ18O value of mantle zircon has been measured to be ~5.3‰ by [64], and the δ18O value of zircons from partial melts of mature sedimentary rocks was measured to be up to ~12‰ by [65,90]. These values have been referenced multiple times in the text below.

7.1.1. North Sikkim 19-005

The zircons for both age groups had roughly similar δ18O values: 9.98 ± 0.10‰ for the ~26 Ma overgrowth and 10.24 ± 0.05‰ for the ~22–15 Ma overgrowths (Figure 8a,d—Supplementary Materials Table S9). These values are much higher than mantle zircon values and almost as high as those found in zircon from partial melts of mature sedimentary rocks. A mild increase in δ18O values is noted with decreasing age. The δ18O values are thereby indicative of derivation from an immature crustal/sediment-derived source.

7.1.2. North Sikkim 19-006

δ18O measurements were carried out only on the igneous zircon. The δ18O recorded for the ~500 Ma magmatic event is 9.62 ± 0.20‰ (Supplementary Materials Table S10). This value is significantly higher than that reported from other Cambro-Ordovician igneous zircons from the NW Himalayas (Prabha-Mohan et al., 2021 [62]). The δ18O suggests a recycled/sediment-derived crustal magma source.

7.1.3. North Sikkim 19-009

The δ18O for both the igneous zircon and metamorphic overgrowths were measured. The δ18O recorded for the ~490 Ma magmatic event was 9.79 ± 0.08‰, similar to the sample above (19-006), characteristic of an immature, sediment-derived crustal magma source. Based on the δ18O values, we can surmise that both samples’ melt sources were most likely the same. The δ18O values for each of the metamorphic generations identified, in decreasing order of age, are 6.90 ± 0.10‰ (~54 Ma), 7.34 ± 0.31‰ (~36 Ma), 6.85 ± 0.10‰ (~29 Ma), and 6.91 ± 0.29‰ (~22–15 Ma) (Figure 9a,d—Supplementary Materials Table S11). Even though there are slight variations in the δ18O, it has remained virtually constant at around 7 ‰ throughout the Cenozoic. These values are only slightly higher than values recorded in mantle zircon and are much lower than what has been recorded in zircon higher up in the valley. During the growth of the zircon rims, prior to 36 Ma and after 29 Ma, the growth seems to have occurred from a mixed source but with strong influence from certain undetermined, depleted fluids, as there is no evidence of mantle-derived fluids or melt within this timeframe in the Sikkim Himalayas. This is supported by the fact that only micaceous alteration was visible in the thin section, with no signs of parting melting.

7.1.4. West Sikkim 19-010

The δ18O values were measured for each of the metamorphic generations identified. An increase in δ18O values is noted with decreasing age: 7.21 ± 0.28 ‰ for the ~28 Ma overgrowth, 7.76 ± 0.18 ‰ for the ~26 Ma overgrowth, and 8.15 ± 0.21 ‰ for the ~23 Ma overgrowth (Figure 10a,d—Supplementary Materials Table S12). this is a clear indication that the metamorphic fluid from which the zircon had been crystallizing was getting heavier with time.

7.2. Monazite

The measured δ18O needed to be corrected for the difference in chemical composition between the sample and standard. All corrections were applied, assuming mainly a cheralite substitution and a Th content the same as that of the dated spot [80].

7.2.1. North Sikkim 19-005

The correction applied raised the calculated δ18O by 0.2–0.4‰. The δ18O of 15 analyzed spots is the same within analytical uncertainty, giving a mean δ18O of 9.73 ± 0.05‰ (Figure 8c,d—Supplementary Materials Table S9), marginally lower than that measured in the zircon of a similar age (9.98 ± 0.10‰). This is inconsistent with the fractionation expected between zircon and monazite at any metamorphic temperature [69]. Hence, it can be inferred that the isotopic equilibrium between zircon and monazite had not been attained at the time of metamorphism.

7.2.2. North Sikkim 19-006

The correction applied raised the calculated δ18O by 0.3–0.7‰. The δ18O of 14 out of the 16 analyzed spots was the same within analytical uncertainty, giving a mean δ18O of 8.56 ± 0.09‰, indicative of a mixed fluid source (Figure 11Supplementary Materials Table S10). This value cannot be compared, as the zircon had no measurable metamorphic overgrowths.

7.2.3. North Sikkim 19-009

The correction applied raised the calculated δ18O by 0.4–1.0‰. The δ18O of 15 analyzed spots can be split into two groups within analytical uncertainty. The δ18O of the group corresponding to the ~25 Ma metamorphic event recorded in the monazite is 6.32 ± 0.08‰, and the δ18O of the < 22 Ma metamorphic event is 5.92 ± 0.12‰ (Figure 9c,d—Supplementary Materials Table S11). It can be observed that there is a slight downtrend of δ18O with decreasing age, indicating that, during the growth of the monazite, the fluid it crystallized/grew must have been influenced strongly by the presence of surface waters. The values measured are also much lower than what was estimated on the corresponding zircon, opposite to the fractionation expected between the two minerals at any metamorphic temperature, confirming that the isotopic equilibrium had not been preserved at the time of metamorphism.

7.2.4. West Sikkim 19-010

The correction applied raised the calculated δ18O by 0.2–0.7‰. With a single exception, the δ18O of the 14 analyzed spots was the same within analytical uncertainty, 7.75 ± 0.06 ‰ (Figure 10c,d—Supplementary Materials Table S12), roughly the same as the zircon of a similar age; again, this is contrary to the fractionation expected between the two minerals at any metamorphic temperature (Vho et al., 2019 [69]), letting us know that the isotopic equilibrium between zircon and monazite had not been attained at the time of metamorphism.

7.3. Quartz

The quartz was homogenous within all the samples, providing confirmation that they were re-equilibrated simultaneously. While carrying out temperature estimations, the assumption was made (for all samples) that the quartz crystallized in oxygen isotopic equilibrium with the youngest zircon and/or monazite.

7.3.1. North Sikkim 19-005

Fourteen quartz grains were analyzed, all of which gave the same δ18O (12.32 ± 0.10‰, Supplementary Materials Table S9) within the expected analytical uncertainty. Given our assumption, the equilibration temperatures estimated from the size of isotopic fractionation with quartz are ~940 °C (zircon) and ~610ºC (monazite). The temperature indicated by the zircon is large enough to produce partial melting during migmatization (>700 °C). This suggests that the zircon grew during the peak thermal conditions, as it can be assumed that the zircon O did not re-equilibrate following the last thermal event, given its resistance to O isotopic exchange at high temperatures (Valley, 2003 [64]). The monazite-derived temperature cannot be considered accurate, as the monazite pre-dates the youngest zircon, and therefore, there is a high probability that the quartz–monazite equilibrium was not preserved. According to our earlier assumption of zircon O not re-equilibrating after the last thermal event, the δ18O of the quartz is about 1.2‰ lower than expected, and the δ18O of the monazite is about 1‰ lower.

7.3.2. North Sikkim 19-006

Fourteen quartz grains were analyzed, all of which gave the same δ18O (11.53 ± 0.08‰, Supplementary Materials Table S10) within the expected analytical uncertainty. As per our assumption, the equilibration temperature estimated from the size of isotopic fractionation with quartz is ~530 °C (monazite). This is within the margin of error of the temperature at which monazite begins to grow during the metamorphism of pelite (550–600 °C, [91,92]). This suggests that the quartz–monazite equilibrium has been maintained post the ~24 Ma metamorphic event recorded by the monazite in this sample.

7.3.3. North Sikkim 19-009

Twelve quartz grains were analyzed, all of which gave the same δ18O (9.87 ± 0.14‰, Supplementary Materials Table S11) within the expected analytical uncertainty. Given our assumption, the equilibration temperatures estimated from the size of isotopic fractionation with quartz are ~690 °C (zircon) and ~390 °C (monazite). The temperature indicated by the zircon is within the margin of error of the temperature required to produce partial melting during migmatization (>700 °C). This can be interpreted as the zircon recording the presence of partial melting conditions. As we suggested earlier, the monazite δ18O seems to have been lowered noticeably by some external fluid; thus, the temperature estimated is relatively low and not reliable. If the zircon O did not re-equilibrate following the last thermal event, given its resistance to O isotopic exchange at high temperatures [64], then the δ18O of the quartz is about 0.2‰ lower than expected, while the δ18O of the monazite is 1.7‰ lower, providing us with a quantifiable measure of how much the external fluid has lowered the δ18O of the monazite.

7.3.4. West Sikkim 19-010

Seven quartz grains were analyzed, all of which gave the same δ18O (10.39 ± 0.15‰, Supplementary Materials Table S12) within the expected analytical uncertainty. Accounting for our assumption, the equilibration temperatures estimated from the size of isotopic fractionation with quartz are ~880 °C (zircon) and ~600 °C (monazite). The temperature indicated by the zircon is higher than required to produce partial melting during migmatization (>700 °C), suggesting that the zircon grew during the peak thermal conditions. The monazite temperature is sufficiently high to enable growth during the metamorphism of pelites (550–600 °C, [91,92]). Assuming that the zircon O did not re-equilibrate following the last thermal event, given its resistance to O isotopic exchange at high temperatures [64], the δ18O of the quartz is about 0.9‰ lower than expected, while the δ18O of the monazite is 1.1‰ lower. This leaves us with the implication that the O in the quartz and monazite carried on re-equilibrating while the zircon O did not change as the temperature gradually dropped after the last thermal event.

8. Discussion

The Himalayan metamorphism having the same character indicates an inverted character along the mountain chain’s entire strike. Migmatite is exposed in the highest metamorphic grade within the Higher Himalayan Crystallines (HHC) and forms most existing mixed igneous and metamorphic associations undergoing anataxis during the main Himalayan regional metamorphism. These migmatite zones are narrow in the NW Himalayas and in the middle of the HHC [16,17,24], whereas, in the Eastern Himalayas, they are exposed throughout the HHC, whether in Sikkim [16,17,31,32,70,74] or in the Bhutan Himalayas [93,94,95].
The HHC is a 15–20 km-thick package with two protolith packages of high-grade metamorphic rocks having a lower package with a zircon component older than the Neoproterozoic era; the upper package is characterized by the zircon component up to 500 Ma. These data are in agreement with other published data from the Himalayan orogeny ([26] and references therein).
Various earlier workers have provided age data using zircon [34], monazite [31,34,35], and garnet [32], which are presented in Table 1 from the Sikkim Himalayas. Catlos et al. [31] reported the first monazite ages from North Sikkim, identifying two age clusters of ~22 Ma and ~13 Ma. The data were clearly separated by the Chungthang Thrust, with an age of ~13 Ma even below the MCT. Monazite age clusters of ~22 Ma and ~13 Ma have also been discovered in Eastern Sikkim [31]. Rubatto et al. [34] reported zircon ages ranging from 31.4 Ma to 18.2 Ma and monazite ages ranging from ~37 Ma to ~20 Ma in samples above the Chungthang Thrust in North Sikkim, as well as monazite ages ranging from ~27 Ma to ~19 Ma in Eastern Sikkim. Motram et al. [35] found monazite ages of around 22 million years above the Chungthang Thrust in Eastern Sikkim. Harris et al. [32] determined the Sm-Nd garnet age from leucosomes to be around 23 Ma from the core and 16 Ma from the rim.
The ages reported by earlier researchers from various sections of Sikkim are identical to those documented by us in this work. However, the age and oxygen isotopic data published in this article are primarily from the migmatitic rocks of the Sikkim Himalayas’ northern and western sectors.
Zircon, being a robust mineral, has always been preferred to trace the magmatic process using oxygen isotopic analysis along with U-Pb geochronology [96]. The pressure, temperature, and fluid composition lead to recrystallization-caused metamorphism. Stable isotopic studies provide us with a unique opportunity to retrieve information about metamorphism (Sharp, 2017 [97]). The zircon δ18O record is generally preserved, even though other minerals have been reset by high-grade metamorphism or intense hydrothermal alteration. A large number of studies have shown that non-metamict zircon kept its δ18O value from the time of crystallization; hence, oxygen isotope ratios in zircons can be correlated with age or trace elemental composition [64].
Most analyzed zircon grains have δ18O values ranging from 6.85 to 10.24‰, indicating that the fluids involved during the growth of the metamorphic zircon were derived from an extensive source region of higher δ18O segments of the crust. The relationship of quartz and zircon with δ18O values indicates that the fluids evolved from the host metasedimentary rock for the migmatites (Figure 12). However, the lower-elevation samples indicate interaction with surficial water. Quartz from migmatite samples shows homogenous oxygen isotopic values (9.87–12.32‰); however, zircon (6.85–10.24‰) displays oxygen isotopic heterogeneity (>2.0‰). The variation in oxygen isotopic ratio clearly indicates that it is a product of an open system, as a closed system produces only small differences [98,99,100]. This has also been narrated by Sharp [97] in that above greenschist facies, the system becomes open, and fluids and/or melt may escape through a fracture and network with the surroundings (Figure 12).
The study’s oxygen isotopic thermometric values generally agree with each other, except in cases when the last thermal event, as recorded by the zircon and monazite, differs in age considerably, such as in sample 19-005. In which case, we shall consider the temperature derived from the more recently equilibrated system to be the better and most likely answer. Temperatures derived for the sample 19-010 show the best agreement with each other.

9. Conclusions

The present work clearly indicates two packages of thrust sheets within the Higher Himalayan Crystallines (HHC) of the Sikkim Himalayas with clear detrital history and a strong Cambro-Ordovician magmatic activity followed by a Himalayan thermal event leading to the formation of metamorphic zircons in an episodic manner. However, monazite shows a single prominent metamorphic event. It also appears that the growth of zircon rims, before 29 Ma and after 22 Ma, came from a mixed source but was somewhat influenced by the depleted fluids. At the same time, monazite grains recorded a constant value irrespective of their dates, indicating that, during fluid crystallizing/growing, the monazite must have been influenced strongly by the presence of surface waters at a lower elevation. The δ18O values of quartz, zircon, and monazite also indicate that fluid involved during metamorphic zircon and monazite growth was derived from the metasedimentary host rock (Figure 12).

Supplementary Materials

The following supporting information can be downloaded at: https://www.mdpi.com/article/10.3390/min14060572/s1, Figure S1: Concordia diagram from Supplementary Data Tables S1–S4. (a) Concordia diagram showing radiogenic U-Pb analyses of the zircon from sample WS 11/1 (19-005). (b) Concordia diagram showing radiogenic U-Pb analyses of the zircon from sample WS 15/1 (19-006). (c) Concordia diagram showing radiogenic U-Pb analyses of the zircon from sample WS 16/1 (19-009). (d) Concordia diagram showing radiogenic U-Pb analyses of the zircon from sample WS 1/1 (19-010); Table S1: SHRIMP U-Pb Zircon Data of the Sikkim Sample—19-005 (WS11/1); Table S2: SHRIMP U-Pb Zircon Data of the Sikkim Sample—19-006 (WS15/1); Table S3: SHRIMP U-Pb Zircon Data of the Sikkim Sample—19-009 (WS16/1); Table S4: SHRIMP U-Pb Zircon Data of the Sikkim Sample—19-010 (WS1/1); Table S5: SHRIMP U-Th-Pb Monazite Data of the Sikkim Sample—19-005 (WS11/1); Table S6: SHRIMP U-Th-Pb Monazite Data of the Sikkim Sample—19-006 (WS15/1); Table S7: SHRIMP U-Th-Pb Monazite Data of the Sikkim Sample—19-009 (WS16/1); Table S8: SHRIMP U-Th-Pb Monazite Data of the Sikkim Sample—19-010 (WS1/1); Table S9: SHRIMP Oxygen Isotope Data of the Sample—19-005 (WS 11/1); Table S10: SHRIMP U-Pb Oxygen Isotope Data of the Sample—19-006 (WS 15/1); Table S11: SHRIMP Oxygen Isotope Data of the Sample—19-009 (WS 16/1); Table S12: SHRIMP Oxygen Isotope Data of the Sample—19-010 (WS 1/1).

Author Contributions

Conceptualization, S.S. and I.S.W. methodology, S.P.-M., S.S. and I.S.W.; software, S.P.-M., S.S. and I.S.W.; validation, S.P.-M., S.S. and I.S.W.; formal analysis, S.P.-M.; investigation, S.P.-M., S.S. and I.S.W.; resources, S.S. and I.S.W.; data curation, S.P.-M., S.S. and I.S.W.; writing—original draft preparation, S.P.-M., S.S. and I.S.W.; writing—review and editing, S.P.-M., S.S. and I.S.W.; visualization, S.S. and I.S.W.; supervision, S.S. and I.S.W.; project administration, S.S. and I.S.W.; funding acquisition, S.P.-M., S.S. and I.S.W. All authors have read and agreed to the published version of the manuscript.

Funding

Future Research Talent (FRT) Travel Award, Australian National University, Ministry of Earth Sciences, New Delhi, research project (grant no. MoES/P.O. (Geosci)/27/2014 & MOES/16/40/09-RDEAS).

Data Availability Statement

Data has been listed in Supplementary Materials.

Acknowledgments

S.P.-M. thanks the College of Science, Australian National University, for funding a visit to Canberra through the Future Research Talent (FRT) Travel Award. S.P.-M. also thanks the Australian Scientific Instruments (ASI), Ian S Williams, and the Research School of Earth Sciences, ANU, for providing him with valuable SHRIMP time. SS thanks Lukas Baumgartner of UNIL for the motivation to take up the δ18O study. Financial support provided by a research project (grant no. MoES/P.O. (Geosci)/27/2014 & MOES/16/40/09-RDEAS) is thankfully acknowledged. The initial manuscript improved substantially after suggestions made by Robert Stern. We also thank guest editors for inviting us to contribute the manuscript. Comments from three anonymous reviewers improved the early version.

Conflicts of Interest

The authors declare that they have no known competing financial interests or personal relationships that could have appeared to influence the work presented in this paper.

References

  1. Leech, M.L.; Singh, S.; Jain, A.K.; Klemperer, S.L.; Manickavasagam, R.M. The onset of India-Asia continental collision: Early, steep subduction required by the timing of UHP metamorphism in the western Himalaya. Earth Planet. Sci. Lett. 2005, 234, 83–97. [Google Scholar] [CrossRef]
  2. Leech, M.L.; Singh, S.; Jain, A.K. Continuous Metamorphic Zircon Growth and Interpretation of U-Pb SHRIMP Dating: An Example from the Western Himalaya. Int. Geol. Rev. 2007, 49, 313–328. [Google Scholar] [CrossRef]
  3. Parsons, A.J.; Hosseini, K.; Palin, R.M.; Sigloch, K. Geological, geophysical and plate kinematic constraints for models of the India-Asia collision and the post-Triassic central Tethys oceans. Earth Sci. Rev. 2020, 208, 103084. [Google Scholar] [CrossRef]
  4. Singh, S.; Barley, M.E.; Jain, A.K. Tale of two migmatites and leucogranite generation within the Himalayan Collisional Zone: Evidences from SHRIMP U-Pb zircon ages from Higher Himalayan Metamorphic Belt and Trans-Himalayan Karakoram Metamorphic Belt, India. Himal. J. Sci. 2004, 2, 251–252. [Google Scholar] [CrossRef]
  5. Le Fort, P. Metamorphism and magmatism during the Himalayan Collision. In Collision Tectonics; Coward, M.P., Ries, A., Eds.; Special Publication; Geological Society: London, UK, 1986; Volume 19, pp. 159–172. [Google Scholar]
  6. Kohn, M.J. Himalayan metamorphism and its tectonic implications. Annu. Rev. Earth Planet. Sci. 2014, 42, 381–419. [Google Scholar] [CrossRef]
  7. Jain, A.K.; Singh, S.; Manickavasagam, R.M. Himalayan Collision Tectonics. Gondwana Res. Group Mem. 2002, 7, 114. [Google Scholar]
  8. Jain, A.K.; Manickavasagam, R.M. Inverted metamorphism in the intracontinental ductile shear zone during Himalayan collision tectonics. Geology 1993, 21, 407–410. [Google Scholar] [CrossRef]
  9. Yin, A. Cenozoic tectonic evolution of the Himalayan orogen as constrained by along-strike variation of structural geometry, exhumation history, and foreland sedimentation. Earth-Sci. Rev. 2006, 76, 1–131. [Google Scholar] [CrossRef]
  10. Goscombe, B.; Gray, D.; Foster, D.A. Metamorphic response to collision in the Central Himalayan Orogen. Gondwana Res. 2018, 57, 191–265. [Google Scholar] [CrossRef]
  11. Singh, S. Collision Tectonics: Metamorphic and Geochronological Constraints from Parts of Himachal Pradesh, NW-Himalaya. Ph.D. Thesis, University of Roorkee, Roorkee, India, 1993. [Google Scholar]
  12. Singh, S.; Jain, A.K. Deformation and strain pattern in parts of the Jutogh Nappe along the Sutlej valley in Jeori-Wangtu region, Himachal Pradesh, India. J. Himal. Geol. 1993, 4, 41–55. [Google Scholar]
  13. Singh, S.; Jain, A.K. Himalayan Granitoids. J. Virtual Explor. 2003, 11, 1–20. [Google Scholar] [CrossRef]
  14. Searle, M.P.; Cottle, J.M.; Streule, M.J.; Waters, D.J. Crustal melt granites and migmatites along the Himalaya: Melt source, segregation, transport and granite emplacement mechanisms. Earth Environ. Sci. Trans. R. Soc. Edinb. 2009, 100, 219–233. [Google Scholar] [CrossRef]
  15. Singh, S. Himalayan magmatism through space and time. Episodes 2020, 43, 358–368. [Google Scholar] [CrossRef]
  16. Singh, S.; Rit, B.; Prabha Mohan, S.; Kushwaha, A. Crustal melting evidence in migmatites of Higher Himalayan Crystallines (HHC) along Bhagirathi, Dhauliganga valleys, and Sikkim Himalayas, India. J. Geol. Soc. India 2022, 98, 69–73. [Google Scholar] [CrossRef]
  17. Singh, S.; Kushwaha, A. Melt Enhanced Deformation in Migmatites of Higher Himalayan Crystallines (HHC), India. J. Geol. Soc. India 2023, 99, 9–12. [Google Scholar] [CrossRef]
  18. Najman, Y.M.R.; Pringle, M.S.; Johnson, M.R.W.; Robertson, A.H.F.; Wijbrans, J.R. Laser 40Ar/39Ar dating of single detrital muscovite grains from early foreland basin sediments in India: Implications for early Himalayan evolution. Geology 1997, 25, 535–538. [Google Scholar] [CrossRef]
  19. Najman, Y.; Johnson, C.; White, N.M.; Oliver, G. Constraints on foreland basin and orogenic evolution from detrital mineral fission track analyses and sediment facies of the Himalayan foreland basin, NW India. Basin Res. 2004, 16, 1–24. [Google Scholar] [CrossRef]
  20. Najman, Y.; Carter, A.; Oliver, G.; Garzanti, E. Provenance of early foreland basin sediments, Nepal: Constraints to the timing and diachroneity of early Himalayan orogenesis. Geology 2005, 33, 309–312. [Google Scholar] [CrossRef]
  21. DeCelles, P.G.; Gehrels, G.E.; Quade, J.; Ojha, T.P. Eocene-early Miocene foreland basin development and the history of Himalayan thrusting, western and central Nepal. Tectonics 1988, 17, 741–765. [Google Scholar] [CrossRef]
  22. Najman, Y.; Garzanti, E. Reconstructing early Himalayan tectonic evolution and paleogeography from Tertiary foreland basin sedimentary rocks, northern India. Geol. Soc. Am. Bull. 2000, 112, 435–449. [Google Scholar] [CrossRef]
  23. White, N.M.; Pringle, M.; Garzanti, E.; Bickle, M.; Najman, Y.; Chapman, H.; Friend, P. Constraints on the exhumation and erosion of the High Himalayan Slab, NW India, from foreland basin deposits. Earth Planet. Sci. Lett. 2002, 195, 29–44. [Google Scholar] [CrossRef]
  24. Singh, S. Protracted zircon growth in migmatites and in situ melt of Higher Himalayan Crystallines: U–Pb ages from Bhagirathi valley, NW Himalaya, India. Geosci. Front. 2019, 10, 793–809. [Google Scholar] [CrossRef]
  25. Singh, S.; Jain, A.K.; Barley, M.E. SHRIMP U-Pb c. 1860 Ma anorogenic magmatic signatures from the NW Himalaya: Implications for Palaeoproterozoic assembly of the Columbia Supercontinent. Geol. Soc. Lond. Spec. Publ. 2009, 323, 283–300. [Google Scholar] [CrossRef]
  26. Mukherjee, P.K.; Jain, A.K.; Singhal, S.; Singha, N.B.; Singh, S.; Kumud, K.; Seth, P.; Patel, R.C. U-Pb zircon ages and Sm-Nd isotopic characteristics of the Lesser and Great Himalayan sequences, Uttarakhand Himalaya, and their regional tectonic implications. Gondwana Res. 2019, 75, 282–297. [Google Scholar] [CrossRef]
  27. Brown, M. Orogeny, migmatites and leucogranites: A review. J. Earth Syst. Sci. 2001, 110, 313–336. [Google Scholar] [CrossRef]
  28. Grujic, D.; Hollister, L.S.; Parrish, R.R. Himalayan metamorphic sequence as an orogenic channel: Insight from Bhutan. Earth Planet. Sci. Lett. 2002, 198, 177–191. [Google Scholar] [CrossRef]
  29. Neogi, S.; Dasgupta, S.; Fukuoka, M. High P-T polymetamorphism, dehydration melting and generation of migmatites and granites in the Higher Himalayan Crystalline complex, Sikkim, India. J. Petrol. 1998, 39, 61–99. [Google Scholar] [CrossRef]
  30. Chakraborty, S.; Dasgupta, S.; Neogi, S. Generation of migmatites and the nature of partial melting in a continental collision zone setting: An example from the Sikkim Himalaya. Indian J. Geol. Aniruddha De Meml. 2003, 75, 38–53. [Google Scholar]
  31. Catlos, E.J.; Dubey, C.S.; Harrison, T.M.; Edwards, M.A. Late Miocene movement within the Himalayan Main Central Thrust shear zone, Sikkim, Northeast India. J. Metamorph. Geol. 2004, 22, 207–226. [Google Scholar] [CrossRef]
  32. Harris, N.B.W.; Caddick, M.; Kosler, J.; Goswami, S. The pressure-temperature-time path of migmatites from the Sikkim Himalaya. J. Metamorph. Geol. 2004, 22, 249–264. [Google Scholar] [CrossRef]
  33. Imayama, T.; Takeshita, T.; Yi, K.; Cho, D.L.; Kitajima, K.; Tsutsumi, Y.; Kayama, M.; Nishido, H.; Okumura, T.; Yagi, K.; et al. Two-stage partial melting and contrasting cooling history within the higher Himalayan crystalline sequence in the far-eastern Nepal Himalaya. Lithos 2012, 134–135, 1–22. [Google Scholar] [CrossRef]
  34. Rubatto, D.; Chakraborty, S.; Dasgupta, S. Timescales of crustal melting in the Higher Himalayan Crystallines (Sikkim, Eastern Himalaya) inferred from trace element-constrained monazite and zircon chronology. Contrib. Mineral. Petrol. 2013, 165, 349–372. [Google Scholar] [CrossRef]
  35. Mottram, C.M.; Argles, T.W.; Harris NB, W.; Parrish, R.R.; Horstwood MS, A.; Warren, C.J.; Gupta, S. Tectonic interleaving along the Main Central Thrust, Sikkim Himalaya. J. Geol. Soc. Lond. 2014, 171, 255–286. [Google Scholar] [CrossRef]
  36. Smith, H.A.; Chamberlain, C.P.; Zeitler, P.K. Timing and duration of himalayan metamorphism within the India plate, northwest Himalaya, Pakistan. J. Geol. 1994, 102, 493–508. [Google Scholar] [CrossRef]
  37. DeCelles, P.G. Tectonic Implications of U-Pb Zircon Ages of the Himalayan Orogenic Belt in Nepal. Science 2000, 288, 497–499. [Google Scholar] [CrossRef] [PubMed]
  38. White, N.M.; Parrish, R.R.; Bickle, M.J.; Najman, Y.M.R.; Burbank, D.; Maithani, A. Metamorphism and exhumation of the NW Himalaya constrained by U-Th-Pb analyses of detrital monazite grains from early foreland basin sediments. J. Geol. Soc. 2001, 158, 625–635. [Google Scholar] [CrossRef]
  39. Catlos, E.J.; Harrison, T.M.; Manning, C.E.; Grove, M.; Rai, S.M.; Hubbard, M.S.; Upreti, B.N. Records of the evolution of the Himalayan orogen from in situ Th–Pb ion microprobe dating of monazite: Eastern Nepal and western Garhwal. J. Asian Earth Sci. 2002, 20, 459–479. [Google Scholar] [CrossRef]
  40. Lee, J.; Whitehouse, M.J. Onset of mid-crustal extensional flow in southern Tibet: Evidence from U/Pb zircon ages. Geology 2007, 35, 45–48. [Google Scholar] [CrossRef]
  41. Martin, A.J.; Gehrels, G.E.; DeCelles, P.G. The tectonic significance of (U, Th)/Pb ages of monazite inclusions in garnet from the Himalaya of central Nepal. Chem. Geol. 2007, 244, 1–24. [Google Scholar] [CrossRef]
  42. Booth, A.L.; Chamberlain, C.P.; Kidd, W.S.F.; Zeitler, P.K. Constraints on the metamorphic evolution of the eastern Himalayan Syntaxis from geochronologic and petrologic studies of Namche Barwa. Geol. Soc. Am. Bull. 2009, 121, 385–407. [Google Scholar] [CrossRef]
  43. Larson, K.P.; Cottle, J.M.; Godin, L. Petrochronologic record of metamorphism and melting in the upper Greater Himalayan sequence, Manaslu-Himal Chuli Himalaya, west-central Nepal. Lithosphere 2011, 3, 379–392. [Google Scholar] [CrossRef]
  44. Lederer, G.W.; Cottle, J.M.; Jessup, M.J.; Langille, J.M.; Ahmad, T. Time-scales of partial melting in the Himalayan middle crust: Insight from the Leo Pargil dome, northwest India. Contrib. Mineral. Petrol. 2013, 166, 1415–1441. [Google Scholar] [CrossRef]
  45. Rehman, H.U.; Kobayashi, K.; Tsujimori, T.; Ota, T.; Yamamoto, H.; Nakamura, E.; Hirajima, T. Ion microprobe U–Th–Pb geochronology and study of micro-inclusions in zircon from the Himalayan high- and ultrahigh-pressure eclogites, Kaghan Valley of Pakistan. J. Asian Earth Sci. 2013, 63, 179–196. [Google Scholar] [CrossRef]
  46. Kellett, D.A.; Grujic, D.; Coutand, I.; Cottle, J.; Mukul, M. The South Tibetan detachment system facilitates ultra rapid cooling of granulite-facies rocks in Sikkim Himalaya. Tectonics 2013, 32, 252–270. [Google Scholar] [CrossRef]
  47. Montomoli, C.; Iaccarino, S.; Carosi, R.; Langone, A.; Visonà, D. Tectonometamorphic discontinuities within the Greater Himalayan Sequence in Western Nepal (Central Himalaya): Insights on the exhumation of crystalline rocks. Tectonophysics 2013, 608, 1349–1370. [Google Scholar] [CrossRef]
  48. Larson, K.P.; Cottle, J.M. Initiation of Crustal Shortening in Himalaya. Terra Nova 2015, 27, 169–174. [Google Scholar] [CrossRef]
  49. Wang, J.M.; Rubatto, D.; Zhang, J.J. Timing of Partial Melting and Cooling across the Greater Himalayan Crystalline Complex (Nyalam, Central Himalaya): In-sequence Thrusting and its Implications. J. Petrol. 2015, 56, 1677–1702. [Google Scholar] [CrossRef]
  50. Palin, R.M.; Treloar, P.J.; Searle, M.P.; Wald, T.; White, R.W.; Mertz-Kraus, R. U–Pb monazite ages from the Pakistan Himalaya record pre-Himalayan Ordovician orogeny and Permian continental breakup. Geol. Soc. Am. Bull. 2018, 130, 2047–2061. [Google Scholar] [CrossRef]
  51. Copeland, P.; Parrish, R.R.; Harrison, T.M. Identification of inherited radiogenic Pb in monazite and its implications for U-Pb systematics. Nature 1988, 333, 760–763. [Google Scholar] [CrossRef]
  52. Parrish, R.P.; Tirrul, R. U-Pb ages of the Baltoro granite, northwest Himalaya, and implications for zircon inheritance and monazite U-Pb systematics. Geology 1989, 17, 1076–1079. [Google Scholar] [CrossRef]
  53. Parrish, R.R. U–Pb dating of monazite and its application to geological problems. Can. J. Earth Sci. 1990, 7, 1431–1450. [Google Scholar] [CrossRef]
  54. Weinberg, R.F.; Wolfram, L.C.; Nebel, O.; Hasalová, P.; Závada, P.; Kylander-Clark, A.R.C.; Becchio, R. Decoupled U-Pb date and chemical zonation of monazite in migmatites: The case for disturbance of isotopic systematics by coupled dissolution-reprecipitation. Geochim. Cosmochim. Acta 2020, 269, 398–412. [Google Scholar] [CrossRef]
  55. Montel, J.M. Experimental determinationof the solubility of Ce-monazite in SiO2-Al2O3-K2O-Na2O melts at 800 °C, 2 kbar, under H20-saturated conditions. Geology 1986, 14, 659–662. [Google Scholar] [CrossRef]
  56. Rapp, R.P.; Ryerson, F.J.; Miller, C.F. Experimental evidence bearing on the stability of monazite during crustal anatexis. Geophys. Res. Lett. 1987, 14, 307–310. [Google Scholar] [CrossRef]
  57. Kelsey, D.E.; Clark, C.; Hand, M. Thermobarometric modelling of zircon and monazite growth in melt-bearing systems: Examples using model metapelitic and metapsammitic granulites. J. Metamorph. Geol. 2008, 26, 199–212. [Google Scholar] [CrossRef]
  58. Yakymchuk, C.; Brown, M. Consequences of open-system melting in tectonics. J. Geol. Soc. Lond. 2014, 171, 21–40. [Google Scholar] [CrossRef]
  59. Kohn, M.J.; Malloy, M.A. Formation of monazite via prograde metamorphic reactions among common silicates: Implications for age determinations. Geochim. Cosmochim. Acta 2004, 68, 101–113. [Google Scholar] [CrossRef]
  60. Skipton, D.R.; Schneider, D.A.; McFarlane, C.R.M.; St-Onge, M.R.; Jackson, S.E. Multi-stage zircon and monazite growth revealed by depth profiling and in situ U–Pb geochronology: Resolving the Paleoproterozoic tectonics of the Trans-Hudson Orogen on southeastern Baffin Island, Canada. Precambrian Res. 2016, 285, 272–298. [Google Scholar] [CrossRef]
  61. Košler, J.; Fonneland, H.; Sylvester, P.; Tubrett, M.; Pedersen, R.-B. U–Pb dating of detrital zircons for sediment provenance studies—A comparison of laser ablation ICPMS and SIMS techniques. Chem. Geol. 2002, 182, 605–618. [Google Scholar] [CrossRef]
  62. Prabha-Mohan, S.; Williams, I.S.; Singh, S. Direct zircon U–Pb evidence for pre-Himalayan HT metamorphism in the Higher Himalayan Crystallines, eastern Garhwal Himalaya, India. Geol. J. 2021, 57, 133–149. [Google Scholar] [CrossRef]
  63. Valley, J.W.; Kinny, P.D.; Schulze, D.J.; Spicuzza, M.J. Zircon megacrysts from kimberlite: Oxygen isotope variability among mantle melts. Contrib. Mineral. Petrol. 1998, 133, 1–11. [Google Scholar] [CrossRef]
  64. Valley, J.W. Oxygen Isotopes in Zircon. Rev. Mineral. Geochem. 2003, 53, 343–385. [Google Scholar] [CrossRef]
  65. Valley, J.W.; Lackey, J.S.; Cavosie, A.J.; Clechenko, C.; Spicuzza, M.J.; Basei, M.A.S.; Bindeman, I.N.; Ferreira, V.P.; Sial, A.N.; King, E.M.; et al. 4.4 billion years of crustal maturation: Oxygen isotope ratios of magmatic zircon. Contrib. Mineral. Petrol. 2005, 150, 561–580. [Google Scholar] [CrossRef]
  66. Claesson, S.; Bibikova, E.V.; Shumlyanskyy, L.; Whitehouse, M.J.; Billström, K. Can oxygen isotopes in magmatic zircon be modified by metamorphism? A case study from the Eoarchean Dniester-Bug Series, Ukrainian Shield. Precambrian Res. 2016, 273, 1–11. [Google Scholar] [CrossRef]
  67. Ayers, J.C.; Loflin, M.; Miller, C.F.; Barton, M.D.; Coath, C.D. In situ oxygen isotope analysis of monazite as a monitor of fluid infiltration during contact metamorphism: Birch Creek Pluton aureole, White Mountains, eastern California. Geology 2006, 34, 653–656. [Google Scholar] [CrossRef]
  68. Gauthiez-Putallaz, L.; Rubatto, D.; Hermann, J. Dating prograde fluid pulses during subduction by in situ U–Pb and oxygen isotope analysis. Contrib. Mineral. Petrol. 2016, 171, 15. [Google Scholar] [CrossRef]
  69. Vho, A.; Lanari, P.; Rubatto, D. An Internally-Consistent Database for Oxygen Isotope Fractionation Between Minerals. J. Petrol. 2019, 60, 2101–2130. [Google Scholar] [CrossRef]
  70. Gupta, S.; Das, A.; Goswami, S. Evidence for structural discordance in the inverted metamorphic sequence of Sikkim Himalaya: Towards resolving the Main Central Thrust controversy. J. Geol. Soc. India 2010, 75, 313–322. [Google Scholar] [CrossRef]
  71. GSI Miscellaneous Publication. Geology and Mineral Resources of Sikkim. Geol. Surv. India Misc. Publ. 2012, 30, 54. [Google Scholar]
  72. Mukhopadhyay, D.K.; Chakraborty, S.; Trepmann, C.; Rubatto, D.; Anczkiewicz, R.; Gaidies, F.; Dasgupta, S.; Chowdhury, P. The nature and evolution of the Main Central Thrust: Structural and geochronological constraints from the Sikkim Himalaya, NE India. Lithos 2017, 282–283, 447–463. [Google Scholar] [CrossRef]
  73. Jain, A.K.; Banerjee, D.M.; Kale, V.S. Tectonics of the Indian Subcontinent; Society of Earth Scientists Series; Springer Publication: Cham, Switzerland, 2020; 576p. [Google Scholar] [CrossRef]
  74. Dasgupta, S.; Ganguly, J.; Neogi, S. Inverted metamorphic sequence in the Sikkim Himalayas: Crystallization history, P–T gradient and implications. J. Metamorph. Geol. 2004, 22, 395–412. [Google Scholar] [CrossRef]
  75. Ganguly, J.; Dasgupta, S.; Cheng, W.; Neogi, S. Exhumation history of a section of the Sikkim Himalayas, India: Records in the metamorphic mineral equilibria and compositional zoning of garnet. Earth Planet. Sci. Lett. 2000, 183, 471–486. [Google Scholar] [CrossRef]
  76. Sorcar, N.; Hoffe, U.; Dasgupta, S.; Chakaraborty, S. High temperature cooling histories of migmatites from the High Himalayan Crystallines in Sikkim, India-rapid cooling unrelated to exhumation. Contrib. Mineral. Petrol. 2014, 167, 957. [Google Scholar] [CrossRef]
  77. Anczkiewicz, R.; Chakraborty, S.; Dasgupta, S.; Mukhopadhyay, D.; Kołtonik, K. Timing, duration, and inversion of prograde Barrovian metamorphism constrained by high-resolution Lu–Hf garnet dating: A case study from the Sikkim Himalaya, NE India. Earth Planet. Sci. Lett. 2014, 407, 70–81. [Google Scholar] [CrossRef]
  78. Black, L.P.; Kamo, S.L.; Allen, C.M.; Davis, D.W.; Aleinikoff, J.N.; Valley, J.W.; Mundil, R.; Campbell, I.H.; Korsch, R.J.; Williams, I.S.; et al. Improved 206Pb/238U microprobe geochronology by the monitoring of a trace-element-related matrix effect; SHRIMP, ID-TIMS, ELA-ICP-MS and oxygen isotope documentation for a series of zircon standards. Chem. Geol. 2004, 205, 115–140. [Google Scholar] [CrossRef]
  79. Aleinikoff, J.N.; Schenck, W.S.; Plank, M.O.; Srogi, L.; Fanning, C.M.; Kamo, S.L.; Bosbyshell, H. Deciphering igneous and metamorphic events in high-grade rocks of the Wilmington Complex, Delaware: Morphology, cathodoluminescence and backscattered electron zoning, and SHRIMP U-Pb geochronology of zircon and monazite. Geol. Soc. Am. Bull. 2006, 118, 39–64. [Google Scholar] [CrossRef]
  80. Rubatto, D.; Putlitz, B.; Gauthiez-Putallaz, L.; Crépisson, C.; Buick, I.S.; Zheng, Y.F. Measurement of in-situ oxygen isotope ratios in monazite by SHRIMP ion microprobe: Standards, protocols and implications. Chem. Geol. 2014, 380, 84–96. [Google Scholar] [CrossRef]
  81. Kusakabe, M.; Matsuhisa, A. Oxygen three-isotope ratios of silicate reference materials determined by direct comparison with VSMOW-oxygen. Geochem. J. 2008, 42, 309–317. [Google Scholar] [CrossRef]
  82. Williams, I.S. U-Th-Pb Geochronology by Ion Microprobe. In Applications of Microanalytical Techniques to Understanding Mineralizing Processes: Reviews in Economic Geology; McKibben, M.A., Shanks, W.C., III, Ridley, W.I., Eds.; Society of Economic Geologists: Littleton, CO, USA, 1998; Volume 7, pp. 1–35. [Google Scholar]
  83. Claoué-Long, J.C.; Compston, W.; Roberts, J.; Fanning, C.M. Two Carboniferous ages: A comparison of SHRIMP zircon dating with conventional zircon ages and 40Ar/39Ar analysis. In Geochronology, Timescales and Global Stratigraphic Correlation; Berggren, W.A., Kent, D.V., Aubry, M.-P., Hardenbol, J., Eds.; SEPM Special Publication; SEPM Society for Sedimentary Geology: Claremore, OK USA, 1995; Volume 54, pp. 3–21. [Google Scholar]
  84. Cumming, G.L.; Richards, J.R. Ore lead isotope ratios in a continuously changing earth. Earth Planet. Sci. Lett. 1975, 28, 155–171. [Google Scholar] [CrossRef]
  85. Steiger, R.H.; Jäger, E. Subcommission on geochronology: Convention on the use of decay constants in geo-and cosmochronology. Earth Planet. Sci. Lett. 1977, 36, 359–362. [Google Scholar] [CrossRef]
  86. Ickert, R.B.; Hiess, J.; Williams, I.S.; Holden, P.; Ireland, T.R.; Lanc, P.; Schram, N.; Foster, J.J.; Clement, S.W. Determining high precision, in situ, oxygen isotope ratios with a SHRIMP II: Analyses of MPI-DING silicate-glass reference materials and zircon from contrasting granites. Chem. Geol. 2008, 257, 114–128. [Google Scholar] [CrossRef]
  87. Corfu, F.; Hanchar, J.M.; Hoskin, P.W.O.; Kinny, P. Atlas Zircon Textures. Rev. Mineral. Geochem. 2003, 53, 469–500. [Google Scholar] [CrossRef]
  88. Spencer, C.J.; Harris, R.A.; Dorais, M.J. Depositional provenance of the Himalayan metamorphic core of Garhwal region, India: Constrained by U-Pb and Hf isotopes in zircons. Gondwana Res. 2012, 22, 26–35. [Google Scholar] [CrossRef]
  89. Dhiman, R.; Singh, S. Neoproterozoic and Cambro-Ordovician magmatism: Episodic growth and reworking of continental crust, Himachal Himalaya, India. Int. Geol. Rev. 2021, 63, 422–436. [Google Scholar] [CrossRef]
  90. Jeon, H.; Williams, I.S.; Chappell, B.W. Magma to mud to magma: Rapid crustal recycling by Permian granite magmatism near the eastern Gondwana margin. Earth Planet. Sci. Lett. 2012, 319, 104–117. [Google Scholar] [CrossRef]
  91. Williams, I.S. Response of detrital zircon and monazite, and their UePb isotopic systems, to regional metamorphism and host-rock partial melting, Cooma Complex, southeastern Australia. Aust. J. Earth Sci. 2001, 48, 557–580. [Google Scholar] [CrossRef]
  92. Rubatto, D.; Williams, I.S.; Buick, I.S. Zircon and monazite response to prograde metamorphism in the Reynolds Range, central Australia. Contrib. Mineral. Petrol. 2001, 140, 458–468. [Google Scholar] [CrossRef]
  93. Long, S.; McQuarrie, N.; Tobgay, T. Tectonostratigraphy of the Lesser Himalaya of Bhutan: Implications for the along strike stratigraphie continuity of the northern Indian margin. Geol. Soc. Am. Bull. 2011, 123, 1406–1426. [Google Scholar] [CrossRef]
  94. Jain, A.K.; Sushmita Singh, S.; Mukherjee, P.K. Migmatization, granite generation and melt accumulation in the Himalayan Orogenic Channel, Central and Eastern Bhutan. Curr. Sci. 2018, 114, 1903–1912. Available online: http://www.jstor.org/stable/26495339 (accessed on 14 May 2018). [CrossRef]
  95. Phillips, S.E.; Argles, T.W.; Warren, C.J.; Harris, N.B.W.; Kunz, B.E. Kyanite petrogenesis in migmatites: Resolving melting and metamorphic signatures. Contrib. Mineral. Petrol. 2023, 178, 10. [Google Scholar] [CrossRef]
  96. Wotzlaw, J.-F.; Bindeman, I.N.; Watts, K.E.; Schmitt, A.K.; Caricchi, L.; Schaltegger, U. Linking rapid magma reservoir assembly and eruption trigger mechanisms at evolved Yellowstone-type supervolcanoes. Geology 2014, 42, 807–810. [Google Scholar] [CrossRef]
  97. Sharp, Z. Principles of Stable Isotope Geochemistry, 2nd ed.; Prentice Hall: Hoboken, NJ, USA, 2017. [Google Scholar] [CrossRef]
  98. Taylor, H.P.; Sheppard, S.M.F. Igenous rocks: I. Processes of isotopic fractionation and isotope systematics. In Stable Isotopes in High Temperature Geological Processes. Reviews in Mineralogy; Valley, J.W., Taylor, H.P., O’Neil, J.R., Eds.; Mineralogical Society of America: Washington, DC, USA, 1986; pp. 227–271. [Google Scholar]
  99. Chappell, B.W.; White, A.J.R. I- and S-Type Granites in the Lachlan Fold Belt. Trans. R. Soc. Edinb. Earth Sci. 1992, 83, 1–26. [Google Scholar] [CrossRef]
  100. King, E.M.; Valley, J.W. The source, magmatic contamination, and alteration of the Idaho batholith. Contrib. Mineral. Petrol. 2001, 142, 72–88. [Google Scholar] [CrossRef]
Figure 1. Geological sketch map of the Himalayas (after Singh, 2019) showing the locations where the samples were obtained. The age of the various lithotectonic units from south to north are as follows: Sub-Himalayan Foreland Basin (Neogene); Lesser Himalayan Sedimentary Zone (Late Proterozoic to Eocene); Higher Himalayan Crystallines (Proterozoic); Tethyan Sedimentary Zone (Neoproterozoic to Early Eocene); Indus Tsangpo Suture Zone (Cretaceous); Trans-Himalayan Himalayan Batholith (Early Cretaceous to Paleocene); Shoyk Suture Zone (Lower Cretaceous to Paleogene); and Karakoram Batholith Complex (Cretaceous to Eocene).
Minerals 14 00572 g001
Figure 2. Geological sketch map of Sikkim marked with the sample locations after GSI Misc. Publication, 2012, and our own observations. CT/VT—Chungthang Thrust/Vaikrita Thrust; MCT—Main Central Thrust.
Minerals 14 00572 g002
Figure 3. Field photographs showing (a) the development of in situ melt in stromatic migmatite and kyanite presence within the two melting phases of the stromatic migmatite zone; (b) development of melanosome and leucosome in migmatite; (c) migmatite with leucosome and melanosome along with in situ melt generation along the extensional fabric in a ductile zone regime; (d) migmatite with leucosome and melanosome along with in situ melt generation along the extensional fabric in a brittle zone regime; (e) sharp contact between leucogranite and country rock; (f) development of in situ melt in the form of pods within the migmatite zone.
Minerals 14 00572 g003
Figure 4. (a) Backscattered electrons (BSE) image of 19-005 showing the development of melt; (b) sample 19-005 contains quartz + K-feldspar + plagioclase feldspar+ biotite + garnet + sillimanite (fibrolite) + (zircon + monazite) + melt; (c) sample 19-006 contains quartz + K-feldspar + plagioclase feldspar + muscovite + melt. (d) Melts are present within plagioclase feldspar and defused boundaries of quartz in sample 19-006.
Minerals 14 00572 g004
Figure 5. Cathodoluminescence images of selected zircon crystals representative of those dated and a BSE image of one of the monazite crystals dated. Circles indicate the location of SHRIMP analyses and are 20 µm in diameter. Numbers indicate dates with 1σ uncertainties. (a)—19-005 Zircon from North Sikkim, (b)—19-006 Zircon from North Sikkim, (c)—19-009 Zircon from North Sikkim, (d)—19-009 Monazite from North Sikkim, (e)—19-010 Zircon from West Sikkim.
Minerals 14 00572 g005
Figure 6. (a) Histogram and cumulative probability distribution curves of detrital zircon measurements (bin size 50 Ma) for the northernmost sample, WS 11/1 (19-006), part of the upper thrust package of the HHC. (b) Histogram and cumulative probability distribution curves of detrital zircon measurements (bin size 100 Ma) for the northernmost sample, WS 15/1 (19-006), part of the upper thrust package of the HHC. (c) Histogram and cumulative probability distribution curves of detrital zircon measurements (bin size 100 Ma) for the northernmost sample, WS 16/1 (19-009), part of the upper thrust package of the HHC. (d) Histogram and cumulative probability distribution curves of detrital zircon measurements (bin size 50 Ma) for the northernmost sample, WS 1/1 (19-010), part of the lower thrust package of the HHC. Analyses are listed in Supplementary Materials Tables S1–S4 and the concordia diagram presented in Supplementary Figure S1a–d.
Minerals 14 00572 g006
Figure 7. (a) Histogram and cumulative probability distribution curves of igneous zircon measurements of sample WS 15/1 (19-006). (b) Concordia diagram showing radiogenic U-Pb analyses of the zircon from sample WS 15/1 (19-006), uncertainties 1σ. (c) Histogram and cumulative probability distribution curves of igneous zircon measurements of sample WS 16/1 (19-009). (d) Concordia diagram showing radiogenic U-Pb analyses of the zircon from sample WS 16/1 (19-009), uncertainties 1σ. Analyses are listed in Supplementary Materials Tables S2 and S3.
Minerals 14 00572 g007
Figure 8. (a) Histogram and cumulative probability distribution curves of zircon overgrowths for sample WS 11/1 (19-005) combined with plots of δ18O vs. dates. (b) Plot of Th/U vs. dates of zircon overgrowths. (c) Histogram and cumulative probability distribution curves of monazite for sample WS 11/1 (19-005) combined with plots of δ18O vs. dates. (d) Plot of δ18O vs. dates for both zircon and monazite. Analyses are listed in Supplementary Materials Tables S1, S5 and S9.
Minerals 14 00572 g008
Figure 9. (a) Histogram and cumulative probability distribution curves of zircon overgrowths for sample WS 16/1 (19-009) combined with plots of δ18O vs. dates. (b) Plot of Th/U vs. dates of zircon overgrowths. (c) Histogram and cumulative probability distribution curves of monazite for sample WS 16/1 (19-009) combined with plots of δ18O vs. dates. (d) Plot of δ18O vs. dates for both zircon and monazite. Analyses are listed in Supplementary Materials Tables S3, S7 and S11.
Minerals 14 00572 g009
Figure 10. Histogram and cumulative probability distribution curves of sample WS 1/1 (19-010) combined with plots of δ18O vs. dates for (a) zircon overgrowths and (b) monazite. (c) Plot of Th/U vs. dates. (d) Plot of δ18O vs. dates for both zircon and monazite. Analyses are listed in Supplementary Materials Tables S4, S8 and S12.
Minerals 14 00572 g010
Figure 11. Histogram and cumulative probability distribution curves of sample WS 15/1 (19-006) combined with plots of δ18O vs. dates for monazite. Analyses are listed in Supplementary Materials Tables S6 and S10.
Minerals 14 00572 g011
Figure 12. Cross-section of the Sikkim Himalayas showing migmatite zones and concordant sheets of leucogranite bodies in upper reaches along with multiple fluid migrations at mid-crustal levels around migmatite zones with distinct δ18O values at different times.
Minerals 14 00572 g012
Table 1. Age data reported from Sikkim Himalayas.
LocationSample NumberAgeReferences
North Sikkim
Above Chungthang Thrust
(Zircon ages)
CLN-831.4 Ma, 24.5 Ma[34]
LNT20.5 Ma, 19.0 Ma, 18.5 Ma[34]
TG819.9 Ma, 18.2 Ma[34]
TG921.1 Ma, 22.0 Ma, 19.9 Ma[34]
Above Chungthang Thrust
(Monazite ages)
CLN-8
(migmatite metapelites)
22.7 ± 0.3 Ma [31]
21.9 ± 1.1 Ma[31]
31.4 Ma[34]
CLN-629.0 Ma, 25.3 Ma,
27.7 Ma, 23.8 Ma
[34]
CLN-528.0 Ma,26.8 Ma,
28.8 Ma, 25.6 Ma
[34]
LNT-223.3–20.9 Ma, 23.5–20.7 Ma[34]
LNT-536.9–24.0–19.2 Ma
36.9–21.0 Ma, 36.4–35.6 Ma
[34]
TG-9 (migmatite and metapelite)24.5–22.5 Ma, 23.5–20.2 Ma[34]
TG-9 (Leucosome)23.5–20.7 Ma, 24.5-22.5 Ma,
23.5–20.2 Ma, 21.4–16.9 Ma, 23.0–16.5 Ma
[34]
TG-8 (migmatite metapelite)25.5-20.6 Ma, 26.2 Ma [34]
Below Chungthang Thrust
(Monazite ages)
13.8 ± 1.0 Ma[31]
Below MCT
(Monazite ages)
13.0 ± 0.2 Ma
12.3 ± 0.6 Ma
[31]
Eastern Sikkim
Above Chungthang Thrust
(Monazite ages)
14122.0 ± 0.3 Ma[31]
24.0–18.9 Ma, 26.7–21.2 Ma, [34]
26.5–18.8 Ma
22.7 ± 0.3 Ma
21.9 ± 1.1 Ma
[35]
Below Chungthang Thrust
(Monazite ages)
13.0 ± 0.4 Ma 12.7 ± 0.1 Ma [31]
15.9 ± 1.0 Ma[35]
Around MCT
(Monazite ages)
~21–12 Ma (Core and Rim of Gt)
~21–16 Ma (Core and Rim of Gt)
12.8 ± 0.2 Ma (in Staurolite)
11.8 ± 0.2 Ma Matrix
[35]
Western Sikkim
Sm-Nd Gt from leucosome 16.1 ± 2.4 Ma RIM
23.0 ± 2.8 Ma CORE
[32]
Disclaimer/Publisher’s Note: The statements, opinions and data contained in all publications are solely those of the individual author(s) and contributor(s) and not of MDPI and/or the editor(s). MDPI and/or the editor(s) disclaim responsibility for any injury to people or property resulting from any ideas, methods, instructions or products referred to in the content.

