Article

Assessing an Abandoned Pyrite Cinder Deposit in Southeast Spain with Electrical Resistivity Tomography: A Case Study

by
Marco D. Vásconez-Maza
1,2,3,
Marcos A. Martínez-Segura
3,*,
Pedro Martínez-Pagán
3,
María C. Bueso
4,
Ximena Capa-Camacho
5,
Oussama Jabrane
6 and
Ángel Faz
5
1
British Geological Survey, Nottingham NG12 5GG, UK
2
CNRS, EPHE, UMR 7619 METIS, Sorbonne Université, 75005 Paris, France
3
Applied Near-Surface Geophysics Research Group, Departamento de Ingeniería Minera y Civil, Universidad Politécnica de Cartagena, Paseo Alfonso XIII 52, 30203 Cartagena, Spain
4
Departamento de Matemática Aplicada y Estadística, Universidad Politécnica de Cartagena, Dr. Fleming s/n, 30202 Cartagena, Spain
5
Sustainable Use, Management and Reclamation of Soil and Water Research Group, ETSIA, Universidad Politécnica de Cartagena, Paseo Alfonso XIII 48, 30203 Cartagena, Spain
6
SIGER Laboratory, Faculty of Science and Technology, Sidi Mohamed Ben Abdellah University, Fez BP2202, Morocco
*
Author to whom correspondence should be addressed.
Minerals 2024, 14(7), 652; https://doi.org/10.3390/min14070652
Submission received: 27 October 2023 / Revised: 5 June 2024 / Accepted: 19 June 2024 / Published: 26 June 2024
(This article belongs to the Special Issue Electrical Resistivity Imaging Applied to Mining Legacy Site)

Abstract

:
Industrial activities have historically generated significant quantities of by-products, including pyrite cinders, a residue produced during the synthesis of sulphuric acid. This study presents a multidisciplinary approach to characterise an abandoned pyrite cinder deposit. Combining geophysical (electrical resistivity tomography—ERT), geochemical, and statistical methods, we assess the physicochemical properties of the deposit and its environmental implications. Our findings reveal the presence of heavy metals, with lead (7017.5 mg.kg−1) being the most concentrated element on the surface of the deposit, exceeding local legal thresholds by more than 163 times, posing environmental risks and inhibiting vegetation growth. Subsurface characterisation indicates a decreasing concentration trend of metals with depth, alongside variations in pH and electrical conductivity. Clustering analysis identifies groups of similar behaviours between resistivity, the most abundant heavy metals, and other variables, providing valuable insights into the complex interplay within the deposit. Our study underscores the importance of integrated approaches in assessing and managing hazardous waste sites, with implications for environmental remediation strategies.

1. Introduction

Industrial activities were largely developed in Europe during the early 19th century, generating not only products but also by-products. An example of this is the production of pyrite cinders during the synthesis of sulphuric acid (H2SO4) through the roasting of pyrite process. Roasting pyrites involves heating the pyrite ore to high temperatures (600–1000 °C), causing the iron sulphide to oxidise, releasing sulphur dioxide gas, and leaving behind pyrite cinders [1].
Pyrite cinders consist of the residual pyrite residue and other solid materials that remain after the conversion process into sulphuric acid. This waste is rich in iron oxides and commonly contains heavy metals and trace elements such as arsenic (As), cadmium (Cd), chromium (Cr), copper (Cu), mercury (Hg), nickel (Ni), lead (Pb), and zinc (Zn), among others. Pyrite cinders predominantly comprise hematite (Fe2O3) and often include other minerals such as magnetite (Fe3O4), quartz (SiO2), and anhydrite (CaSO4). Less common minerals include sphalerite (ZnS) and anglesite (PbSO4). The presence of additional minerals like micas or other elements depends on the origin of the pyrite ore [2]. To date, pyrite cinders have been extensively characterised [3,4] and utilised as raw materials [5], with environmental amendments such as biochar being implemented [6]. Due to its chemical composition, this waste is considered a valuable source of iron and other components, prompting research into innovative and efficient methods for metal recovery [7,8,9].
In the past, these cinders were often disposed of in nearby landfills without proper management plans or measures to protect against erosion. The European Environment Agency [10] estimates that there are 2.8 million potentially contaminated sites in the European Union. These waste materials pose a significant environmental liability due to several factors. Firstly, they can leach harmful substances such as heavy metals and trace elements into the surrounding soil and water, contaminating ecosystems and potentially entering the food chain [11]. Additionally, the physical presence of these waste piles can disrupt local habitats and landscapes, leading to biodiversity loss and habitat degradation. Furthermore, if left unaddressed, the gradual weathering and breakdown of these waste materials can release pollutants into the environment over an extended period, prolonging the risk to both the environment and human health.
Long-term exposure to heavy metals has been documented to be harmful and dangerous for human health [12], emphasising the need for efficient methodologies to assess this type of waste and ultimately promote a remediation process. Therefore, it is crucial to assess and manage these waste sites efficiently to mitigate their environmental and human health impacts. Geophysics can respond to this necessity, especially with the electrical resistivity tomography (ERT) method which is one of the most popularised techniques due to its great and proven ability to provide significant information in soil science and environmental applications [13,14].
ERT has been largely used in environmental studies [15,16], mine tailing characterisations [17,18,19,20,21,22], landslides [23,24], karstic environments [25], archaeological excavations [26], and so forth. Also, new approaches and techniques have been employed along with ERT (e.g., statistics, geochemistry, time-lapse monitoring) enabling the extraction and inference of more information from the soil electrical response [27,28]. Therefore, the synergy found in combining the capabilities of ERT and statistical tools is remarkable and provides an opportunity to develop a new, fast, and economically viable strategy to precisely and reliably assess hazardous waste deposits.
This information will be essential to give support to the understanding of hydrogeological and geochemical processes that control the transport of contaminants in the deposit and to inform the design of remediation strategies. Consequently, the objectives of this study are to (i) characterise physicochemically an abandoned pyrite cinder deposit using geophysical and geochemical methods and (ii) identify the variable(s) that influence the resistivity of the deposit through the application of statistical techniques.

2. Materials and Methods

2.1. Study Area

The southeast of Spain is characterised by a semiarid Mediterranean climate, which has an annual average temperature of 18 °C with high peaks of temperature during summer and mild winters; the precipitation and evapotranspiration rate is 275 mm and 900 mm, respectively [29]. “El Hondón” is the name of the study area; it is in the “Campo de Cartagena” region in the southeast of Spain near Cartagena city; see Figure 1c. The “Campo de Cartagena” region is formed by the deposition of Tortonian conglomerates, Messinian limestone and Pliocene sandstones. The mineral deposits within these formations are not particularly varied or complex: galena (PbS) and fluorite (CaF2) predominate by far, the former always present and often argentiferous. Occasionally, there are significant concentrations of sphalerite (ZnS), but it is generally subordinate to PbS as inclusions of this. Other primary species include barite (BaSO4), pyrite (FeS2), chalcopyrite (CuFeS2), and Pb and Cu sulfosalts [30]. Historically, the “El Hondón” zone was a hub of mining-related industrial activity, with several heavy factories operating in the area [31].
However, today this industrial activity has been shut down, and only the waste deposits remain as a testimony of that important activity and transforming this area into an abandoned and unhealthy open space, which requires urgent intervention by the Cartagena Municipality. In order to assist with that goal, this study will concentrate on the waste generated by the activity of synthesising sulphuric acid in nearby pyrite-based ore mining works. It is worth noting that the entire area is greatly exposed to significant erosion actions by wind and water runoff since measures to avoid any mobility of heavy metals have not been adopted yet. So, the biggest deposit of pyrite cinders was selected to perform all the techniques and laboratory analyses and to provide its characterisation. Figure 1d shows the experimental design for the studied deposit.

2.2. Direct Current Method

ERT stands as a geophysical technique involving the application of direct current. This technique employs a set of electrodes referred to as AB for current injection, coupled with another pair labelled MN for potential difference measurement [32]. By employing inversion algorithms, the acquired data undergo processing to create a resistivity model [33]. This model delineates variations in the electrical properties of the underlying subsurface [34].
This study was carried out by deploying four ERT profiles with georeferenced stainless steel electrodes and a Syscal R1 Switch 72 resistivity meter [35] for recording the apparent electrical resistivity values in the field. Table 1 describes the characteristics of the ERT profiles. To facilitate the correlation between electrical resistivity and chemical data, the ERT profiles were strategically aligned with the drilled boreholes. Figure 1d illustrates the layout of the ERT profiles. The selection of the Wenner–Schlumberger array was based on its established ability to provide a good compromise between resolution and the signal-to-noise ratio [36,37].
Upon the completion of field data acquisition, the subsequent post-processing entailed the filtration of the dataset to eliminate anomalous measurements utilising PROSYS II software (V3, IRIS Instruments, Orleans, France). Subsequently, GPS coordinates were incorporated, followed by the inversion of the apparent resistivity values utilising RES2DINV software (V3.57, Geotomo Software, Penang, Malaysia). These procedures yielded 2D inverted models of ERT with the corresponding topographic corrections of the deposit.

2.3. Geochemistry Analysis

Initially, a shallow characterisation was carried out with a regular grid of ten samples distributed on the deposit surface. Ten composite samples were collected with a maximum depth of 0.3 m; the triangle-shape markers in Figure 1d illustrate the positions of surficial samples. Then, for subsurface geochemical characterisation, five boreholes were drilled within the deposit reaching the natural soil (~2.5 m). Most of these boreholes were positioned on points that were crossed by the ERT profiles, assuring the electrical data correlativeness with the chemical results (Figure 1d). Undisturbed core samples for chemical analysis were gathered from each borehole in accordance with their length, obtaining 35 samples in total.
Before conducting the chemical analyses, all samples were conditioned. The conditioning process consisted of drying the sample for 72 h at 35 °C, sieving to 2 mm, and grinding with a Retsch RM 100 device. Electrical conductivity (EC) and pH were measured in an aqueous extraction 1:2.5 w/v and 1:5 w/v, respectively. The total metal concentration of arsenic (As), cadmium (Cd), chromium (Cr), copper (Cu), mercury (Hg), nickel (Ni), lead (Pb), and zinc (Zn) content was determined by transferring 0.5 g of each sample into vessels with 10 mL of 65% nitric acid and digested in a MARS 6 microwave following the US-EPA method 3051 [38] and, finally, determined by using an Inductively Coupled Plasma Mass Spectrometer (ICP-MS).
The achieved metal recovery ranged from 91% to 102%, employing certified reference material BAM-U110 [39] from the Federal Institute for Materials Research and Testing and blanks as quality control samples during the analyses. This paper employs the legal thresholds for soil contamination from the Murcia Region referred to as NGR within the text. The Spanish Royal Decree sets a list of anthropic activities likely to inflict contamination to the soil and establishes standards and criteria for declaring soil as contaminated [40].

2.4. Statistical Analysis

In this study, R free software [41] was utilised as the primary tool to analyse chemical and ERT data. Both sets of data were examined separately to gain an understanding of their global behaviour using boxplots, scatterplots, and statistical indicators such as mean, standard deviation, quartiles, and interquartile range. This analysis revealed patterns in the concentrations of metallic elements; see Figure 2. To further investigate the potential relationships between the geophysical and geochemical parameters measured, a hierarchical clustering analysis was carried out to identify groups of similar parameters measured. Specifically, an agglomerative hierarchical clustering procedure was used with a similarity metric defined in terms of the Pearson correlation coefficient and considering Ward’s minimum variance algorithm.
The clustering results were visualised by means of a dendrogram, a graphical representation akin to a tree where data sharing the same branch exhibit similarities. This dendrogram was complemented by a heatmap, a visualisation tool adept at representing data matrices by assigning colours to cells based on their respective values. Furthermore, cluster heatmaps utilised the outcomes of hierarchical clustering to rearrange matrix rows and/or columns [42].

3. Results and Discussion

3.1. Geochemistry of the Pyrite Cinders

Table 2 presents the results of the surficial chemical characterisation and a brief statistical summary of the measured parameters. We have also included the NGR values as a reference, which represent the local legal thresholds for heavy metals. It is observed that the deposit under study exceeds the NGR, which likely hinders vegetation growth on its surface. Notably, the most concentrated metal on the surface is Pb, with an average value of 7017.5 mg·Kg−1, which is alarming given that the NGR for Pb is 43 mg·Kg−1, indicating a significant exceedance of the legal limit by 163 times.
pH values range from 2 to 7 (in S9), suggesting that environmental agents have interacted with the deposit, altering the surface properties of the deposit. Gabarron et al. [27] suggest that mine tailings could be a significant source of heavy metals, easily transported from one place to another. These metal concentrations, along with the pH and EC on the surface of the deposit, will certainly impact the electrical properties of the studied site, and it also informs us that this is a source of heavy metals that could be spread relatively easily.
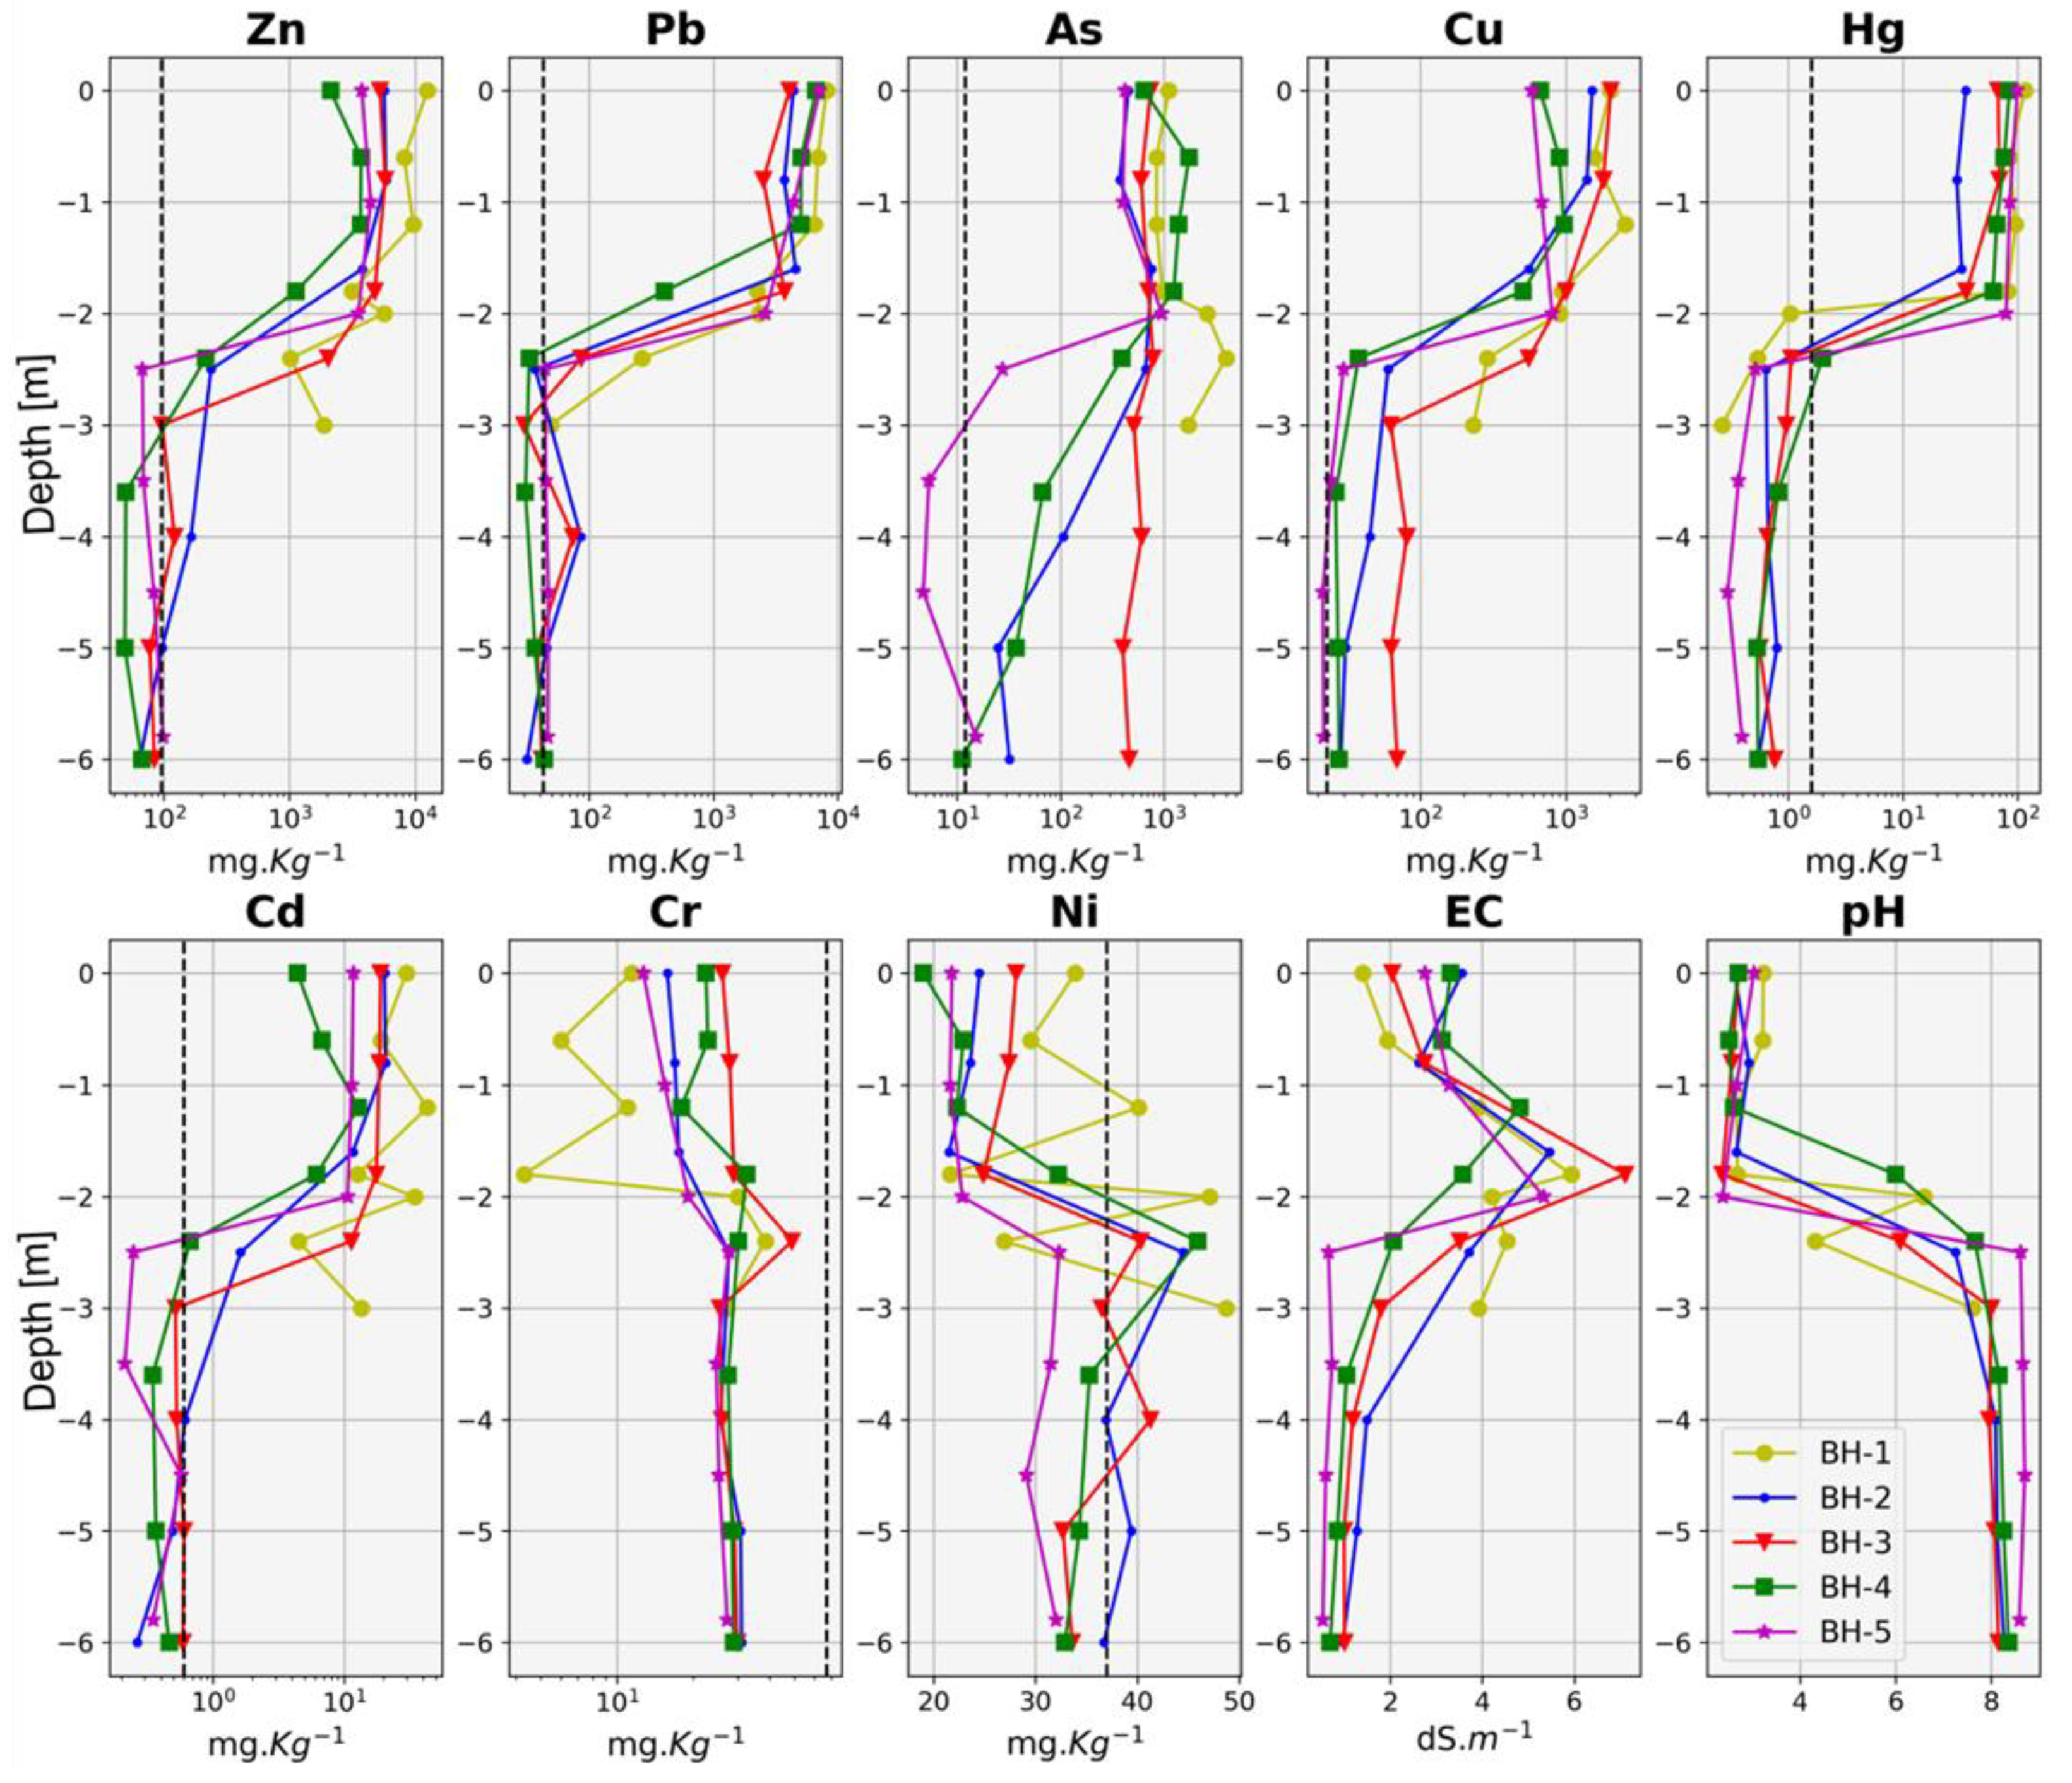
Furthermore, the subsurface characterisation has confirmed that there are two well-differentiated layers. The highest metal concentration is in the top layer, consistent with the geology and pedology of the deposit, showing a decreasing metal concentration trend of Zn > Pb > As > Cu > Hg > Cd > Cr > Ni. Figure 2 (top) illustrates the distribution pattern of the most concentrated metals, indicating that below a depth of 2 m, the concentration notably decreases. There is then a transition zone until approximately 3 m depth, after which the concentration falls definitively, reaching values even lower than the NGR for Cd, Cu, Pb, Zn, and Hg; see Figure 2 bottom.
The pH remains acidic in the upper layer (<2.5 m depth), while in the substrate, pH values increase up to approximately 8 m depth, indicating that soil under pyrite cinders (top layer) is basic, and core samples revealed that it is composed mainly of sandy clays. Similar behaviour occurs with the EC measured in the laboratory which presents higher values in the upper layer, and they decrease progressively according to the depth. The acidic pH in the pyrite cinders is primarily due to the oxidation of residual pyrite. This oxidation process releases sulphuric acid, significantly lowering the pH of the surrounding environment. This process not only influences the pH but also impacts the mobility and availability of heavy metals within the deposit. The acidic conditions enhance the solubility of many heavy metals, increasing their mobility and potential environmental impact.
These findings align with the observations of Blowes et al. [43], who noted that residual pyrite oxidation in mine tailings can significantly lower pH and increase heavy metal mobility. This acidity not only impacts the mobility of heavy metals but also influences the electrical properties and environmental behaviour of the deposit.

3.2. Electrical Resistivity Tomography and Statistical Analysis

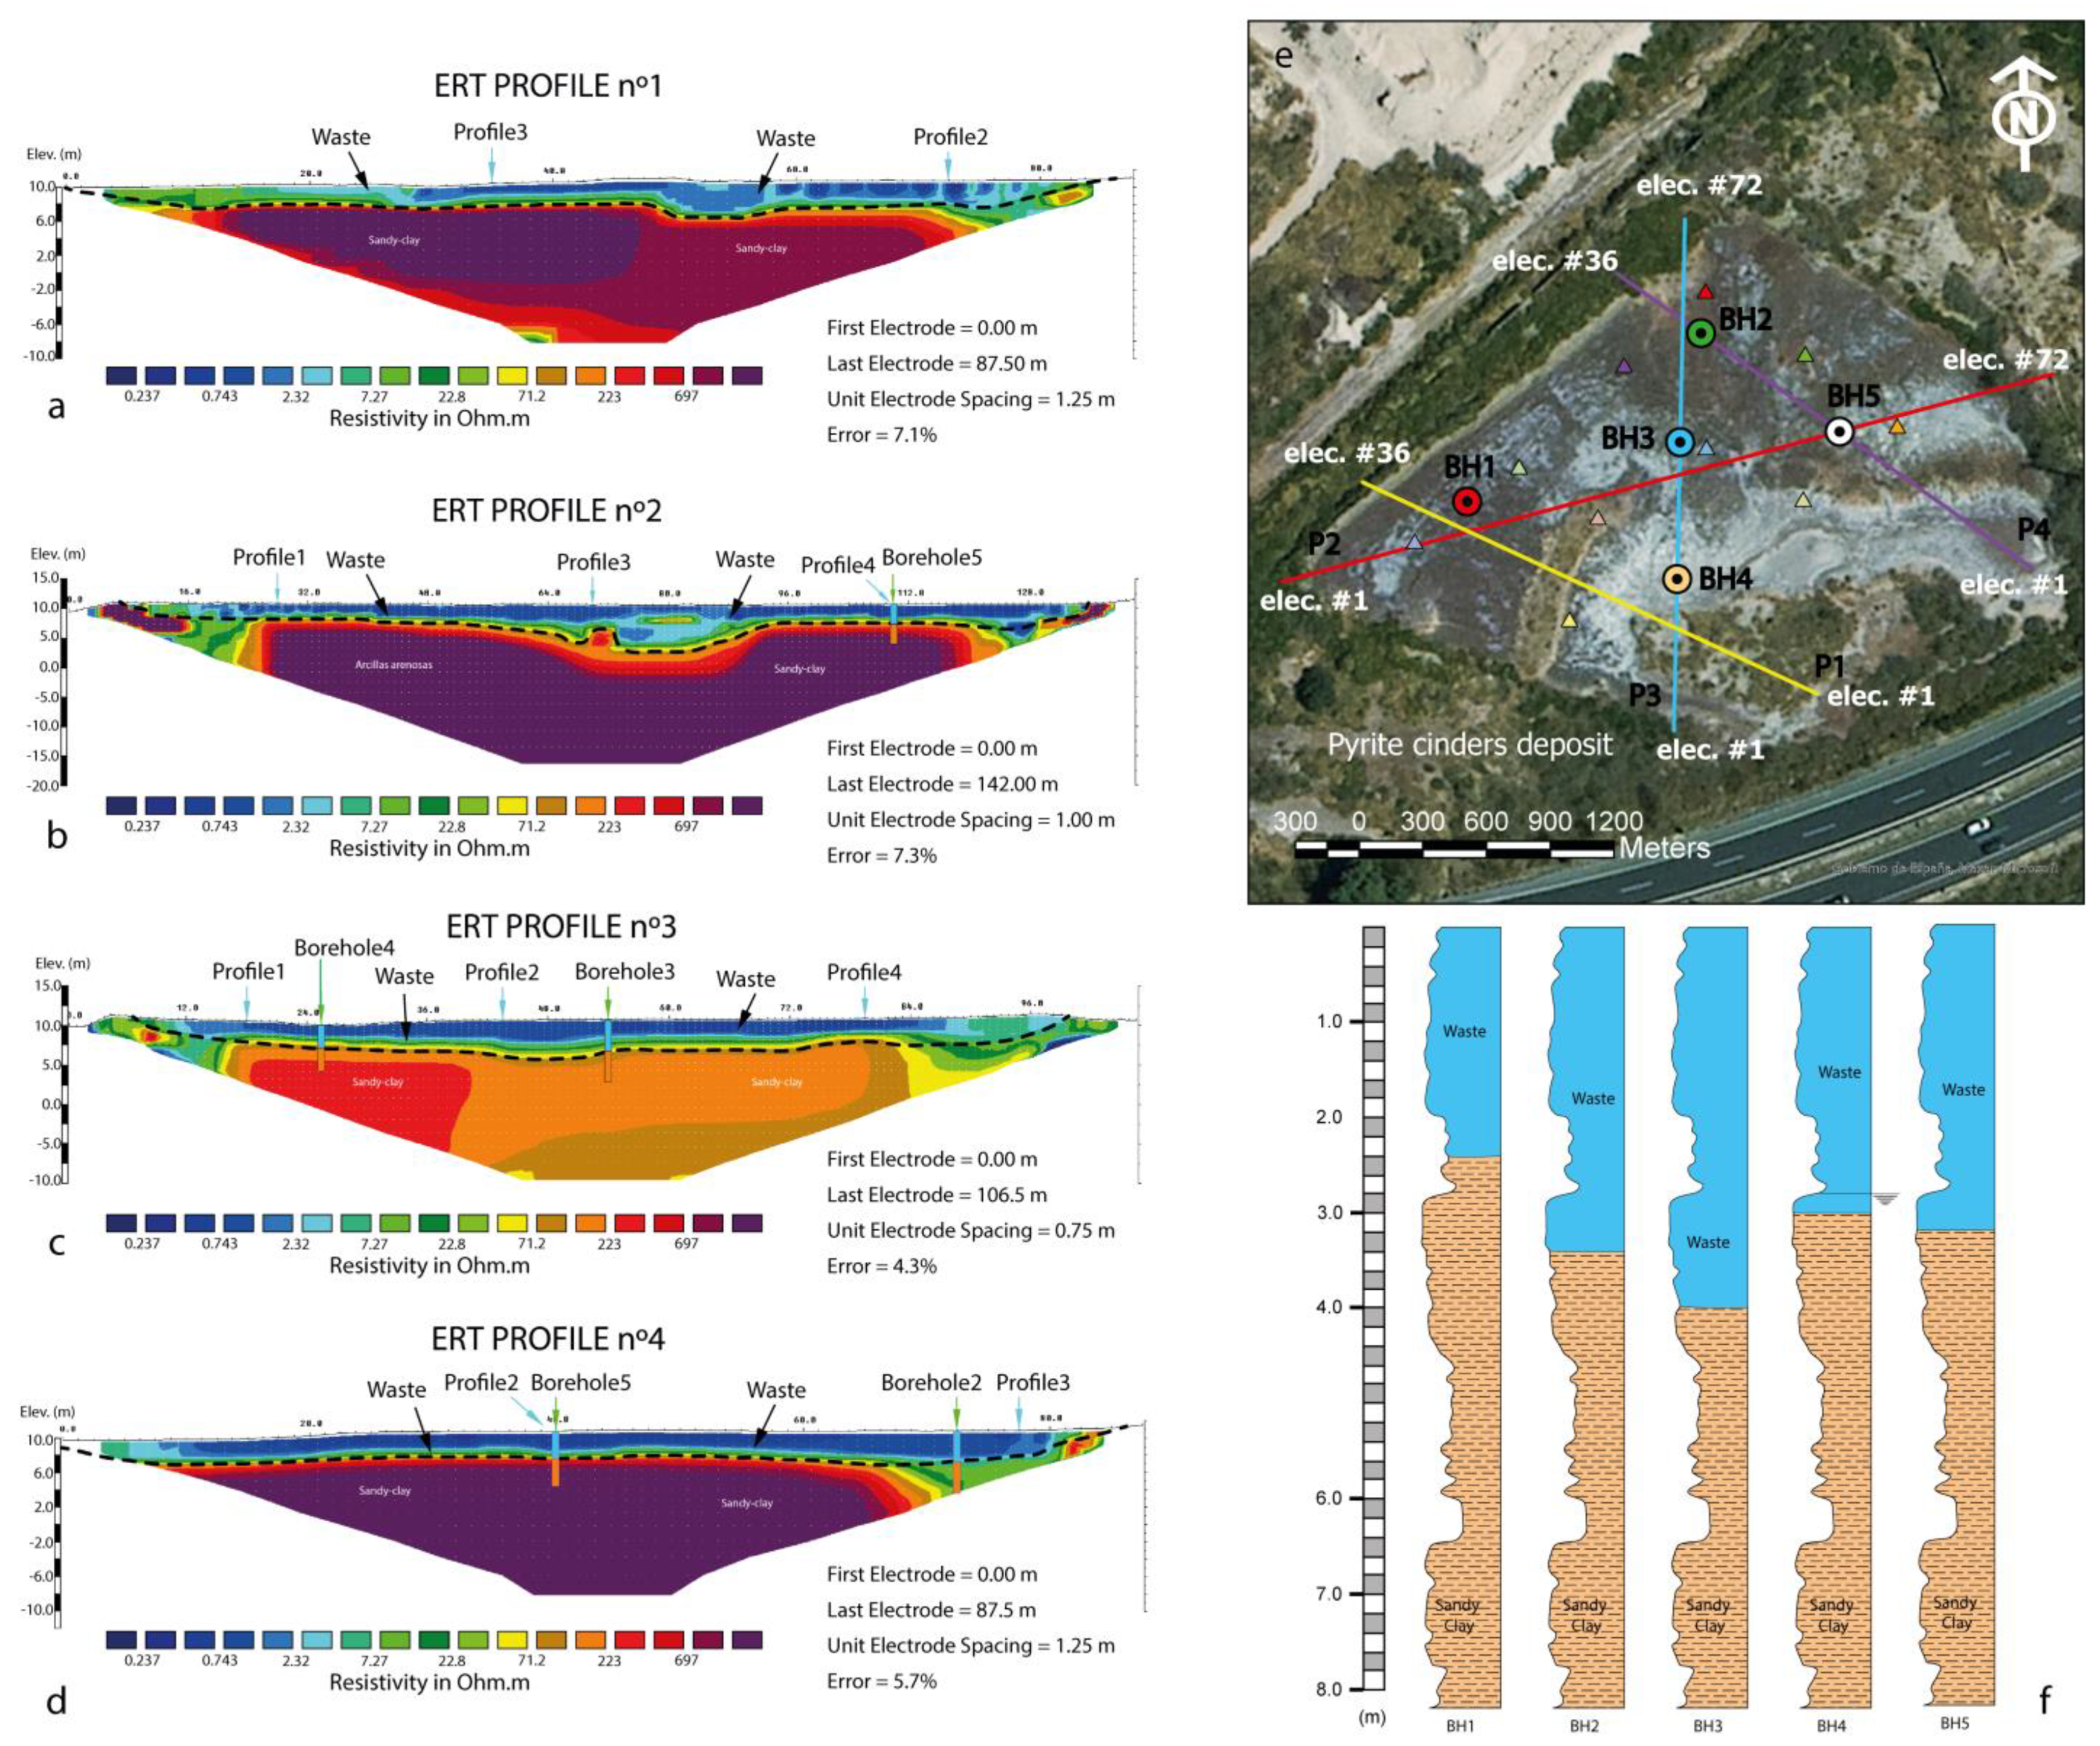
As expected, the ERT survey detected two distinct layers (Figure 3a–d) which agrees with borehole results. The upper layer exhibiting an average resistivity value below 10 Ohm·m, corresponding to the waste layer (pyrite cinders), whereas the lower layer, with resistivity exceeding 300 Ohm·m, represents the natural terrain mainly comprising sandy clays. The position of the boundary between these two layers has been accurately determined through borehole data. This synergetic combination of boreholes and ERT for accurately determining the layer thickness approach has been employed before by Vasconez-Maza et al. [44] and Rey et al. [45].
The top layer is consistent across all resistivity models, represented by blue colours in the colormap. Additionally, the boundary between the pyrite cinders and the natural terrain is clearly defined. Models 1, 2, and 4 display similar characteristics in the lower layer, with resistivity levels ranging between 300 and 700 Ohm·m, approximately. However, model 3 shows unexpected resistivity values in the natural terrain, ranging from 200 to 450 Ohm·m, approximately.
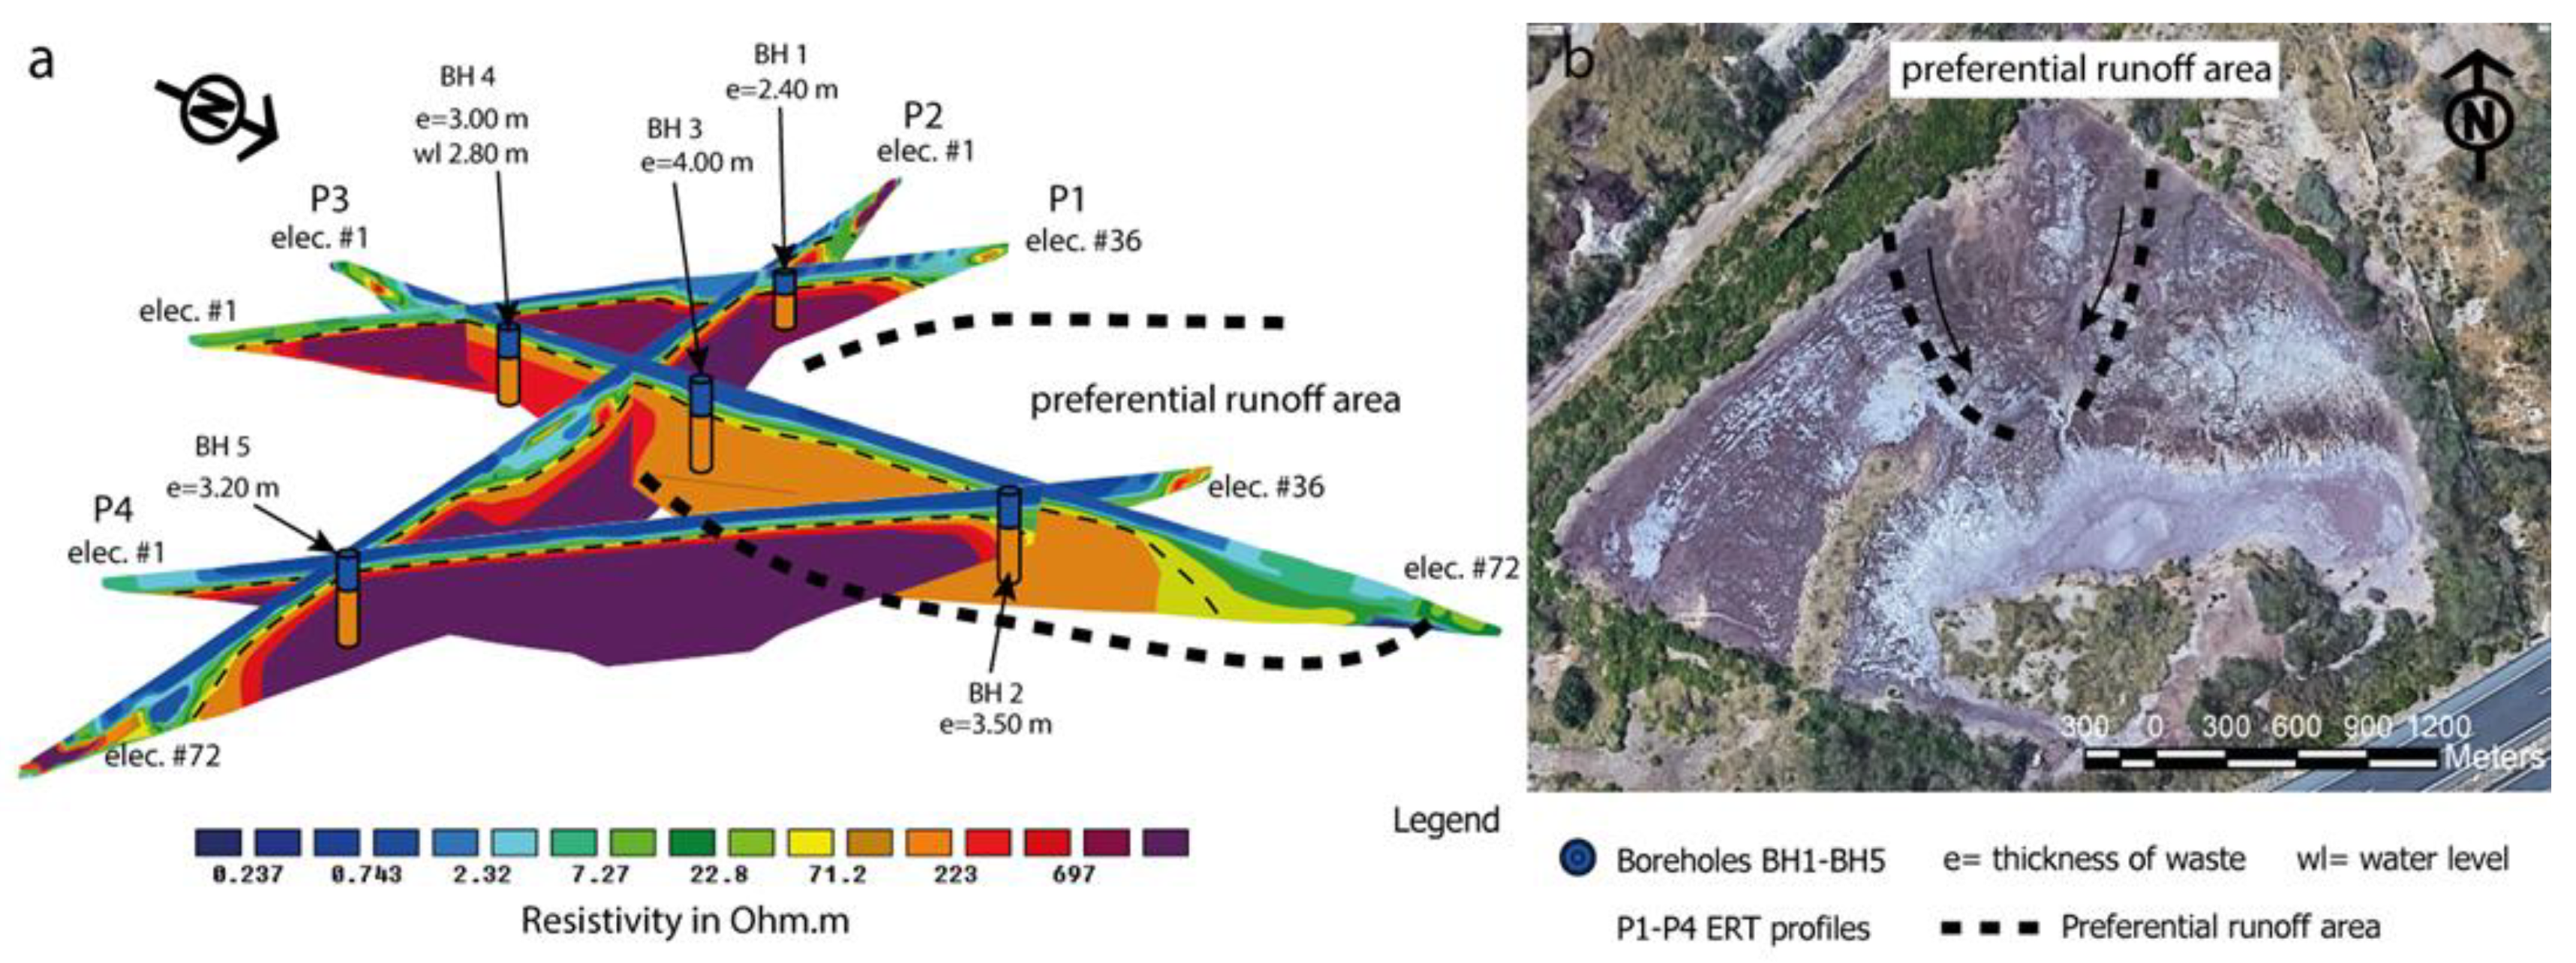
One potential explanation for this deviation in resistivity values is the placement of ERT profile 3 along the runoff trajectory of the deposit, located at UTM coordinates (679727, 4164560), 30 N, WGS84. Consequently, electrical properties may have been altered in this specific area. Additionally, borehole 4 indicates a water table at a depth of approximately 2.8 m, whereas other boreholes did not detect any water table, suggesting possible water accumulation in this region of the deposit. This accumulation could influence resistivity in the area, potentially accounting for the variation observed in the resistivity model (see Figure 4a).
The pseudo-3D model provides further insights into the intersection between model 1 and model 3, where resistivity values undergo changes. In Figure 3a, model 1 demonstrates a decrease in resistivity towards the end, transitioning to red tones in the colour scale. Conversely, in Figure 3c, model 3 exhibits a complete shift to red, indicating a reduction in resistivity. As previously mentioned, these changes are corroborated by the presence of a water table observed in the borehole data. This discovery underscores the effectiveness of combining ERT with borehole analysis for accurate characterisation.
Our primary objective is to characterise the pyrite cinder deposit. The arrangement of the profiles aims to cover the deposit’s surface comprehensively to gather extensive data. This methodology is commonly employed in the geoenvironmental characterisation of mining tailings [46,47]. With this strategy, we have successfully identified and delineated the waste layer. By integrating inverted resistivity values with chemical data and utilising statistical tools, we can further refine our understanding of the dataset, following the approach of Isunza Manrique et al. [48] in their study.
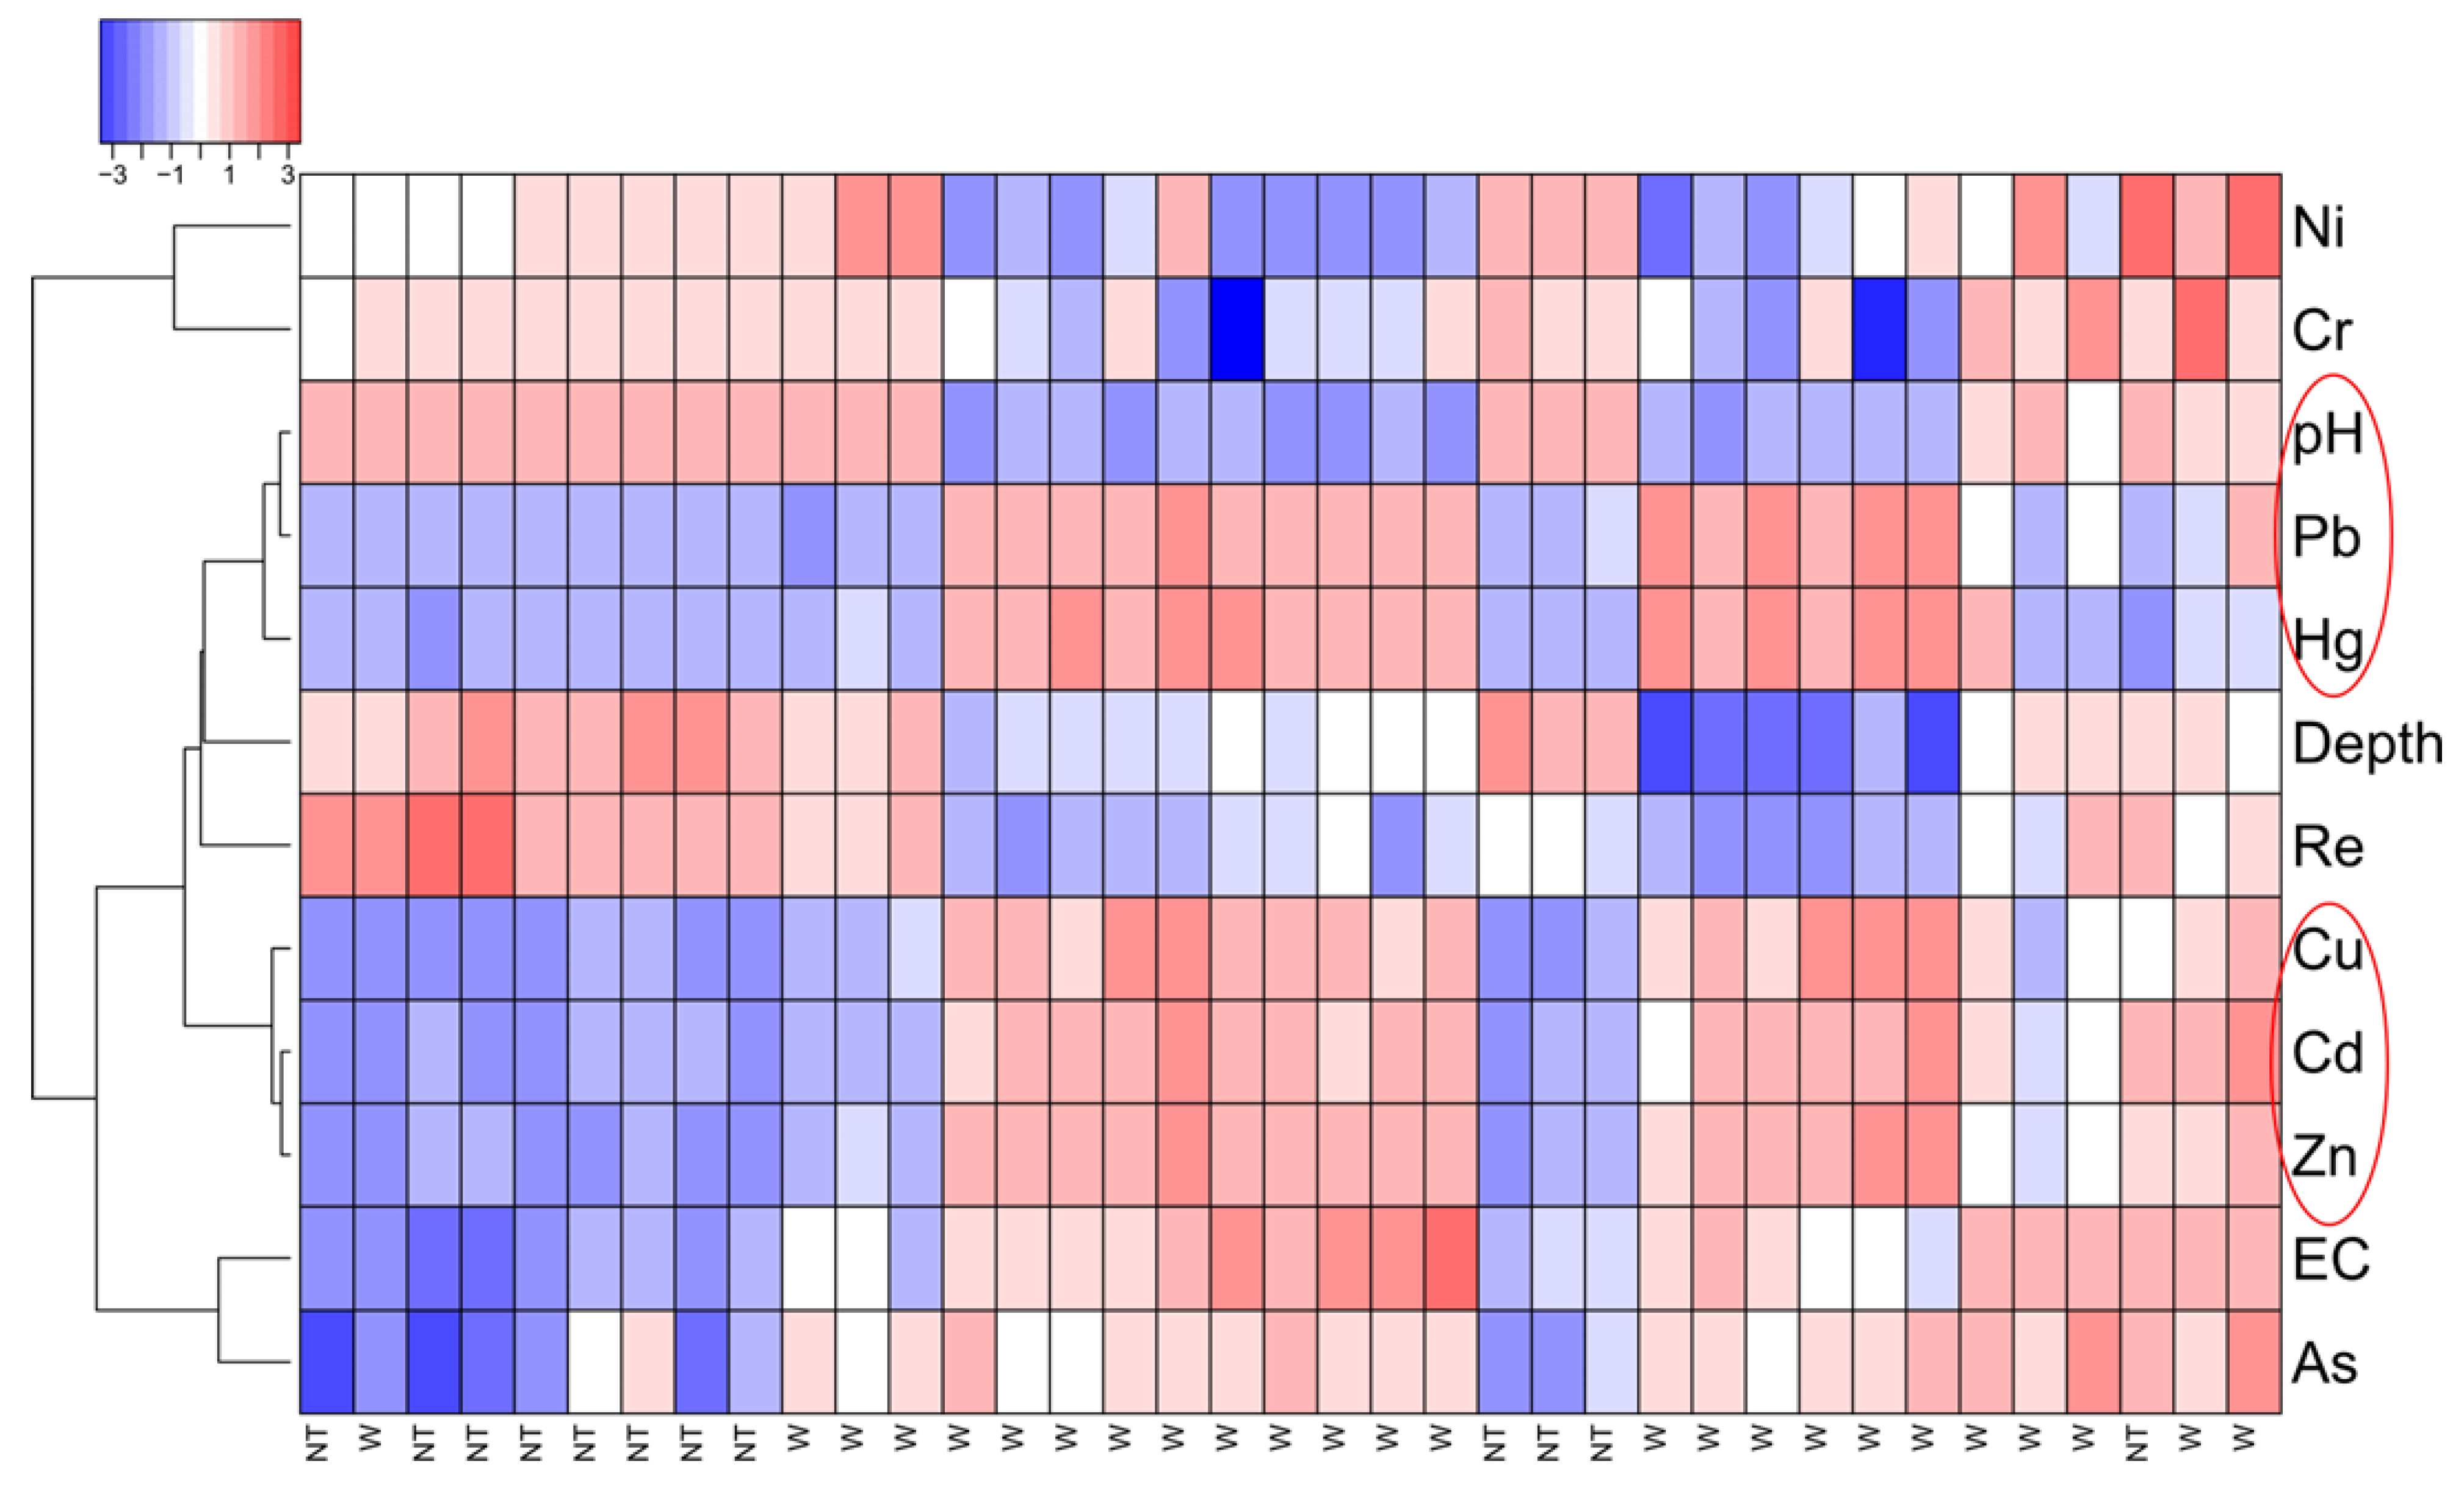
Figure 5 shows the heatmap and the dendrogram generated from the dataset after applying clustering to identify groups with similar variables. On the left side of the figure, the tree graph illustrates the division of the variables into two major clusters. The first cluster contains the least concentrated metals, with Ni and Cr being the defining variables. This observation is in line with our initial findings, indicating that resistivity is less influenced by these metals due to their low concentration.
The second bigger cluster is composed of the rest of the variables, which are correlated to the resistivity. As expected, depth is closely related to resistivity; it increases or decreases according to depth. The cluster of pH, Pb, and Hg together suggests that these variables may be related to one another, but the cause of this relationship is unclear and requires further investigation. Additionally, the formation of another cluster with Cu, Cd, and Zn is also noteworthy as it highlights the potential interplay between these variables in affecting the resistivity of the samples. The mineralogy of the study area supports these findings. The strong correlation between Zn and Cd is consistent with the known substitution of Cd for Zn in sphalerite [49], suggesting that sphalerite was part of the original ore. The correlation with Cu indicates the potential presence of chalcopyrite.
This mineralogical composition corroborates the statistical results, suggesting that the original pyrite deposit contained sphalerite and chalcopyrite. The presence of these minerals is crucial for understanding the mobility of heavy metals, especially under the acidic conditions observed in the deposit. The acidic pH enhances the solubility of these metals, increasing their environmental mobility and potential impact.
Overall, the dendrogram analysis indicates no clear relationship between resistivity and any single metal or property. This complexity necessitates further studies to explore these relationships using robust statistical tools. Understanding these correlations is crucial for assessing the environmental impact of the deposit, particularly the mobility of heavy metals under varying pH and resistivity conditions.

4. Conclusions

This study comprehensively investigated an abandoned pyrite cinder deposit in the ‘El Hondón’ area of southeast Spain, characterising its physicochemical properties using a combination of geophysical and geochemical methods. The results revealed the presence of various heavy metals and trace elements exceeding local legal thresholds, posing environmental risks and inhibiting vegetation growth. The subsurface characterisation indicated a decreasing concentration trend of metals with depth, alongside pH variations. The utilisation of ERT proved effective in delineating the waste layer and identifying subsurface features, with a notable correlation observed between resistivity and the presence of certain metals. Clustering analysis further elucidated the relationships between different variables, highlighting the complex interplay between pH, heavy metals, and resistivity.
Overall, this study underscores the importance of employing integrated approaches, such as geophysical and geochemical methods, along with statistical analyses, to comprehensively assess and manage hazardous waste deposits. The findings contribute to our understanding of hydrogeological and geochemical processes, aiding in the design of remediation strategies to mitigate environmental and human health risks associated with such sites. Further research is warranted to explore the nuanced relationships between variables and resistivity using robust statistical tools, enhancing our ability to address environmental pollution and its impacts effectively.

Author Contributions

For Conceptualisation, M.D.V.-M. and M.A.M.-S.; methodology, M.D.V.-M. and M.A.M.-S.; software, M.C.B., M.D.V.-M. and M.A.M.-S.; validation, M.C.B., M.D.V.-M. and M.A.M.-S.; formal analysis, M.D.V.-M., M.C.B. and M.A.M.-S.; investigation, M.D.V.-M. and M.A.M.-S.; resources, M.D.V.-M. and M.A.M.-S.; data curation, M.D.V.-M. and M.C.B.; writing—original draft preparation, M.D.V.-M.; writing—review and editing, M.D.V.-M., M.A.M.-S., P.M.-P., M.C.B., X.C.-C., O.J. and Á.F.; visualisation M.D.V.-M., M.A.M.-S., P.M.-P., M.C.B., X.C.-C., O.J. and Á.F.; supervision, M.A.M.-S.; project administration, Á.F.; funding acquisition, Á.F. All authors have read and agreed to the published version of the manuscript.

Funding

This research received no external funding.

Data Availability Statement

The data contributions presented in the study are included in the article.

Acknowledgments

Authors acknowledge the support from the Margarita Salas (Universidad Politécnica de Cartagena) postdoctoral grant within the program of Requalification of the Spanish University System financed by the Spanish Ministry of Universities with Next Generation funds from the European Union–NextGeneration EU, and the support of local government of Cartagena city.

Conflicts of Interest

The authors declare no conflicts of interest.

References

  1. Alp, I.; Deveci, H.; Yazıcı, E.; Türk, T.; Süngün, Y. Potential use of pyrite cinders as raw material in cement production: Results of industrial scale trial operations. J. Hazard. Mater. 2009, 166, 144–149. [Google Scholar] [CrossRef]
  2. Zhao, H.; Wang, J.; Gan, X.; Hu, M.; Tao, L.; Qin, W.; Qiu, G. Role of pyrite in sulfuric acid leaching of chalcopyrite: An elimination of polysulfide by controlling redox potential. Hydrometallurgy 2016, 164, 159–165. [Google Scholar] [CrossRef]
  3. Soriano-Disla, J.M.; Spille, U.; Gabarrón, M.; Faz, Á.; Acosta, J.A. Evaluation of strategies for mitigating risks associated with metals in pyrite ash. J. Environ. Manag. 2018, 217, 403–410. [Google Scholar] [CrossRef] [PubMed]
  4. Bendz, D.; Tiberg, C.; Kleja, D.B. Mineralogical characterization and speciation of sulfur, zinc and lead in pyrite cinder from Bergvik, Sweden. Appl. Geochem. 2021, 131, 105010. [Google Scholar] [CrossRef]
  5. Li, W.; Wang, S.; Han, Y.; Tang, Z.; Zhang, Y. Recovery of iron from pyrite cinder by suspension magnetization roasting-magnetic separation method: Process optimization and mechanism study. Sep. Purif. Technol. 2024, 332, 125652. [Google Scholar] [CrossRef]
  6. Fan, X.-H.; Deng, Q.; Gan, M.; Wang, H.-B. Effect of biochar as reductant on magnetizing-roasting behavior of pyrite cinder. J. Iron Steel Res. Int. 2015, 22, 371–376. [Google Scholar] [CrossRef]
  7. Han, G.; Wen, S.; Wang, H.; Feng, Q. Selective adsorption mechanism of salicylic acid on pyrite surfaces and its application in flotation separation of chalcopyrite from pyrite. Sep. Purif. Technol. 2020, 240, 116650. [Google Scholar] [CrossRef]
  8. Han, G.; Wen, S.; Wang, H.; Feng, Q.; Bai, X. Pyrogallic acid as depressant for flotation separation of pyrite from chalcopyrite under low-alkalinity conditions. Sep. Purif. Technol. 2021, 267, 118670. [Google Scholar] [CrossRef]
  9. Bai, X.; Liu, J.; Wen, S.; Lin, Y. Selective separation of chalcopyrite and pyrite using a novel organic depressant at low alkalinity. Miner. Eng. 2022, 185, 107677. [Google Scholar] [CrossRef]
  10. European Environment Agency. Progress in the Management of Contaminated Sites in Europe. Available online: https://www.eea.europa.eu/en/analysis/indicators/progress-in-the-management-of (accessed on 1 September 2023).
  11. Kumar, S.; Prasad, S.; Yadav, K.K.; Shrivastava, M.; Gupta, N.; Nagar, S.; Bach, Q.-V.; Kamyab, H.; Khan, S.A.; Yadav, S.; et al. Hazardous heavy metals contamination of vegetables and food chain: Role of sustainable remediation approaches—A review. Environ. Res. 2019, 179 Pt A, 108792. [Google Scholar] [CrossRef]
  12. ATSDR. Toxic Substances Portal. Available online: https://wwwn.cdc.gov/TSP/substances/SubstanceAZ.aspx?SST=A1 (accessed on 14 May 2024).
  13. Samouëlian, A.; Cousin, I.; Tabbagh, A.; Bruand, A.; Richard, G. Electrical resistivity survey in soil science: A review. Soil Tillage Res. 2005, 83, 173–193. [Google Scholar] [CrossRef]
  14. Loiseau, B.; Carrière, S.D.; Jougnot, D.; Singha, K.; Mary, B.; Delpierre, N.; Guérin, R.; Martin-StPaul, N.K. The geophysical toolbox applied to forest ecosystems—A review. Sci. Total. Environ. 2023, 899, 165503. [Google Scholar] [CrossRef] [PubMed]
  15. Dahlin, T.; Bernstone, C.; Loke, M.H. A 3-D resistivity investigation of a contaminated site at Lernacken, Sweden. Geophysics 2002, 67, 1692–1700. [Google Scholar] [CrossRef]
  16. Cuong, L.P.; Van Tho, L.; Juzsakova, T.; Rédey, Á.; Hai, H. Imaging the movement of toxic pollutants with 2D electrical resistivity tomography (ERT) in the geological environment of the Hoa Khanh Industrial Park, Da Nang, Vietnam. Environ. Earth Sci. 2016, 75, 286. [Google Scholar] [CrossRef]
  17. Martín-Crespo, T.; Gómez-Ortiz, D.; Martín-Velázquez, S.; Martínez-Pagán, P.; José, C.d.I.-S.; Lillo, J.; Faz, Á. Abandoned Mine Tailings Affecting Riverbed Sediments in the Cartagena–La Union District, Mediterranean Coastal Area (Spain). Remote Sens. 2020, 12, 2042. [Google Scholar] [CrossRef]
  18. Martínez-Pagán, P.; Gómez-Ortiz, D.; Martín-Crespo, T.; Martín-Velázquez, S.; Martínez-Segura, M. Electrical Resistivity Imaging Applied to Tailings Ponds: An Overview. Mine Water Environ. 2021, 40, 285–297. [Google Scholar] [CrossRef]
  19. Martínez-Segura, M.A.; Vásconez-Maza, M.D.; García-Nieto, M.C. Volumetric characterisation of waste deposits generated during the production of fertiliser derived from phosphoric rock by using LiDAR and electrical resistivity tomography. Sci. Total. Environ. 2020, 716, 137076. [Google Scholar] [CrossRef] [PubMed]
  20. Dimech, A.; Cheng, L.; Chouteau, M.; Chambers, J.; Uhlemann, S.; Wilkinson, P.; Meldrum, P.; Mary, B.; Fabien-Ouellet, G.; Isabelle, A. A Review on Applications of Time-Lapse Electrical Resistivity Tomography Over the Last 30 Years: Perspectives for Mining Waste Monitoring. Surv. Geophys. 2022, 43, 1699–1759. [Google Scholar] [CrossRef] [PubMed]
  21. Moreira, C.A.; Netto, L.G.; Camarero, P.L.; Bertuluci, F.B.; Hartwig, M.E.; Domingos, R. Application of electrical resistivity tomography (ERT) in uranium mining earth dam. J. Geophys. Eng. 2022, 19, 1265–1279. [Google Scholar] [CrossRef]
  22. Sabor, K.; Jougnot, D.; Guerin, R.; Steck, B.; Henault, J.-M.; Apffel, L.; Vautrin, D. A data mining approach for improved interpretation of ERT inverted sections using the DBSCAN clustering algorithm. Geophys. J. Int. 2021, 225, 1304–1318. [Google Scholar] [CrossRef]
  23. Boon, D.P.; Chambers, J.E.; Hobbs, P.R.; Kirkham, M.; Merritt, A.J.; Dashwood, C.; Pennington, C.; Wilby, P.R. A combined geomorphological and geophysical approach to characterising relict landslide hazard on the Jurassic Escarpments of Great Britain. Geomorphology 2015, 248, 296–310. [Google Scholar] [CrossRef]
  24. Guinea, A.; Bicknell, J.; Cox, N.; Swan, H.; Simmons, N. Characterization of legacy landfills with electrical resistivity tomography; a comparative study. J. Appl. Geophys. 2022, 203, 104716. [Google Scholar] [CrossRef]
  25. Cheng, Q.; Tao, M.; Chen, X.; Binley, A. Evaluation of electrical resistivity tomography (ERT) for mapping the soil–rock interface in karstic environments. Environ. Earth Sci. 2019, 78, 439. [Google Scholar] [CrossRef]
  26. Evangelista, L.; de Silva, F.; D’onofrio, A.; Di Fiore, V.; Silvestri, F.; di Santolo, A.S.; Cavuoto, G.; Punzo, M.; Tarallo, D. Application of ERT and GPR geophysical testing to the subsoil characterization of cultural heritage sites in Napoli (Italy). Measurement 2017, 104, 326–335. [Google Scholar] [CrossRef]
  27. Gabarrón, M.; Faz, A.; Acosta, J. Use of multivariable and redundancy analysis to assess the behavior of metals and arsenic in urban soil and road dust affected by metallic mining as a base for risk assessment. J. Environ. Manag. 2018, 206, 192–201. [Google Scholar] [CrossRef] [PubMed]
  28. Vásconez-Maza, M.D.; Bueso, M.C.; Faz, A.; Acosta, J.; Martínez-Segura, M.A. Assessing the behaviour of heavy metals in abandoned phosphogypsum deposits combining electrical resistivity tomography and multivariate analysis. J. Environ. Manag. 2021, 278 Pt 1, 111517. [Google Scholar] [CrossRef] [PubMed]
  29. AEMET. Predicción Por Municipios. San Javier (Murcia). Available online: https://www.aemet.es/es/eltiempo/prediccion/municipios/san-javier-id30035 (accessed on 15 May 2024).
  30. IGME. Geological Map of Cartagena, Spain. Available online: http://info.igme.es/cartografiadigital/datos/mgd50/memorias/Memoria977.pdf (accessed on 15 May 2024).
  31. Ayuntamiento de Cartagena. Available online: https://www.cartagena.es/barrios_diputaciones.asp (accessed on 15 May 2024).
  32. Everett, M.E. Near-Surface Applied Geophysics; Cambridge University Press (CUP): Cambridge, UK, 2013. [Google Scholar]
  33. Loke, M.H.; Chambers, J.E.; Rucker, D.F.; Kuras, O.; Wilkinson, P.B. Recent developments in the direct-current geoelectrical imaging method. J. Appl. Geophys. 2013, 95, 135–156. [Google Scholar] [CrossRef]
  34. Reynolds, J.M. An Introduction to Applied and Environmental Geophysics, 2nd ed.; John Wiley & Son: Hoboken, NJ, USA, 2011. [Google Scholar]
  35. IRIS-Instruments. Available online: http://www.iris-instruments.com/er-product.html#electrical-resistivity (accessed on 28 August 2023).
  36. Loke, M.H. Tutorial: 2-D and 3-D Electrical Imaging Surveys. Available online: https://sites.ualberta.ca/~unsworth/UA-classes/223/loke_course_notes.pdf (accessed on 1 January 2020).
  37. Vasconez-Maza, M.D.; Thiesson, J.; Guerin, R.; Delarue, F.; Mendieta, A.; Jougnot, D. Optimisation of an ERT acquisition for soil-plant interaction in presence of biochar. In Proceedings of the EGU General Assembly Conference Abstracts, Vienna, Austria, 23–28 April 2023. [Google Scholar]
  38. U.S. EPA. EPA Method 3051A: Microwave Assisted Acid Digestion of Sediments, Sludges, and Oils. Available online: https://www.epa.gov/esam/us-epa-method-3051a-microwave-assisted-acid-digestion-sediments-sludges-and-oils (accessed on 24 March 2020).
  39. BAM. Homepage—Trace Elements in Contaminated Soil. Available online: https://rrr.bam.de/RRR/Content/EN/Downloads/RM-Certificates/RM-cert-environment/bam_u110de.html (accessed on 29 August 2023).
  40. Real Decreto 9/2005, de 14 de Enero, Por El Que SE Establece la Relación de Actividades Potencialmente Contaminantes Del Suelo Y Los Criterios Y Estándares Para la Declaración de Suelos Contaminados. 2005. Available online: https://www.boe.es/eli/es/rd/2005/01/14/9 (accessed on 1 September 2023).
  41. R Core Team. R: The R Project for Statistical Computing. Available online: https://www.r-project.org/ (accessed on 20 July 2023).
  42. Engle, S.; Whalen, S.; Joshi, A.; Pollard, K.S. Unboxing cluster heatmaps. BMC Bioinform. 2017, 18, 63. [Google Scholar] [CrossRef] [PubMed]
  43. Blowes, D.W.; Ptacek, C.J.; Jambor, J.L.; Weisener, C.G.; Paktunc, D.; Gould, W.D.; Johnson, D.B. The geochemistry of acid mine drainage. In Treatise on Geochemistry, 2nd ed.; Elsevier: Amsterdam, The Netherlands, 2014. [Google Scholar] [CrossRef]
  44. Maza, M.D.V.; Martínez-Segura, M.A.; Bueso, M.C.; Faz, Á.; García-Nieto, M.C.; Gabarrón, M.; Acosta, J.A. Predicting spatial distribution of heavy metals in an abandoned phosphogypsum pond combining geochemistry, electrical resistivity tomography and statistical methods. J. Hazard. Mater. 2019, 374, 392–400. [Google Scholar] [CrossRef]
  45. Rey, J.; Martínez, J.; Hidalgo, M.C.; Mendoza, R.; Sandoval, S. Assessment of Tailings Ponds by a Combination of Electrical (ERT and IP) and Hydrochemical Techniques (Linares, Southern Spain). Mine Water Environ. 2020, 40, 298–307. [Google Scholar] [CrossRef]
  46. Gabarrón, M.; Martínez-Pagán, P.; Martínez-Segura, M.A.; Bueso, M.C.; Martínez-Martínez, S.; Faz, Á.; Acosta, J.A. Electrical Resistivity Tomography as a Support Tool for Physicochemical Properties Assessment of Near-Surface Waste Materials in a Mining Tailing Pond (El Gorguel, SE Spain). Minerals 2020, 10, 559. [Google Scholar] [CrossRef]
  47. Martin-Crespo, T.; Gomez-Ortiz, D.; Velázquez, S.M.; Martínez-Pagán, P.; De Ignacio, C.; Lillo, J.; Faz, Á. Geoenvironmental characterization of unstable abandoned mine tailings combining geophysical and geochemical methods (Cartagena-La Union district, Spain). Eng. Geol. 2018, 232, 135–146. [Google Scholar] [CrossRef]
  48. Manrique, I.I.; Caterina, D.; Nguyen, F.; Hermans, T. Quantitative interpretation of geoelectric inverted data with a robust probabilistic approach. Geophysics 2023, 88, B73–B88. [Google Scholar] [CrossRef]
  49. Deer, W.A.; Howie, R.A.; Zussman, J. An Introduction to the Rock-Forming Minerals; Mineralogical Society of Great Britain and Ireland: Twickenham, UK, 2013. [Google Scholar]
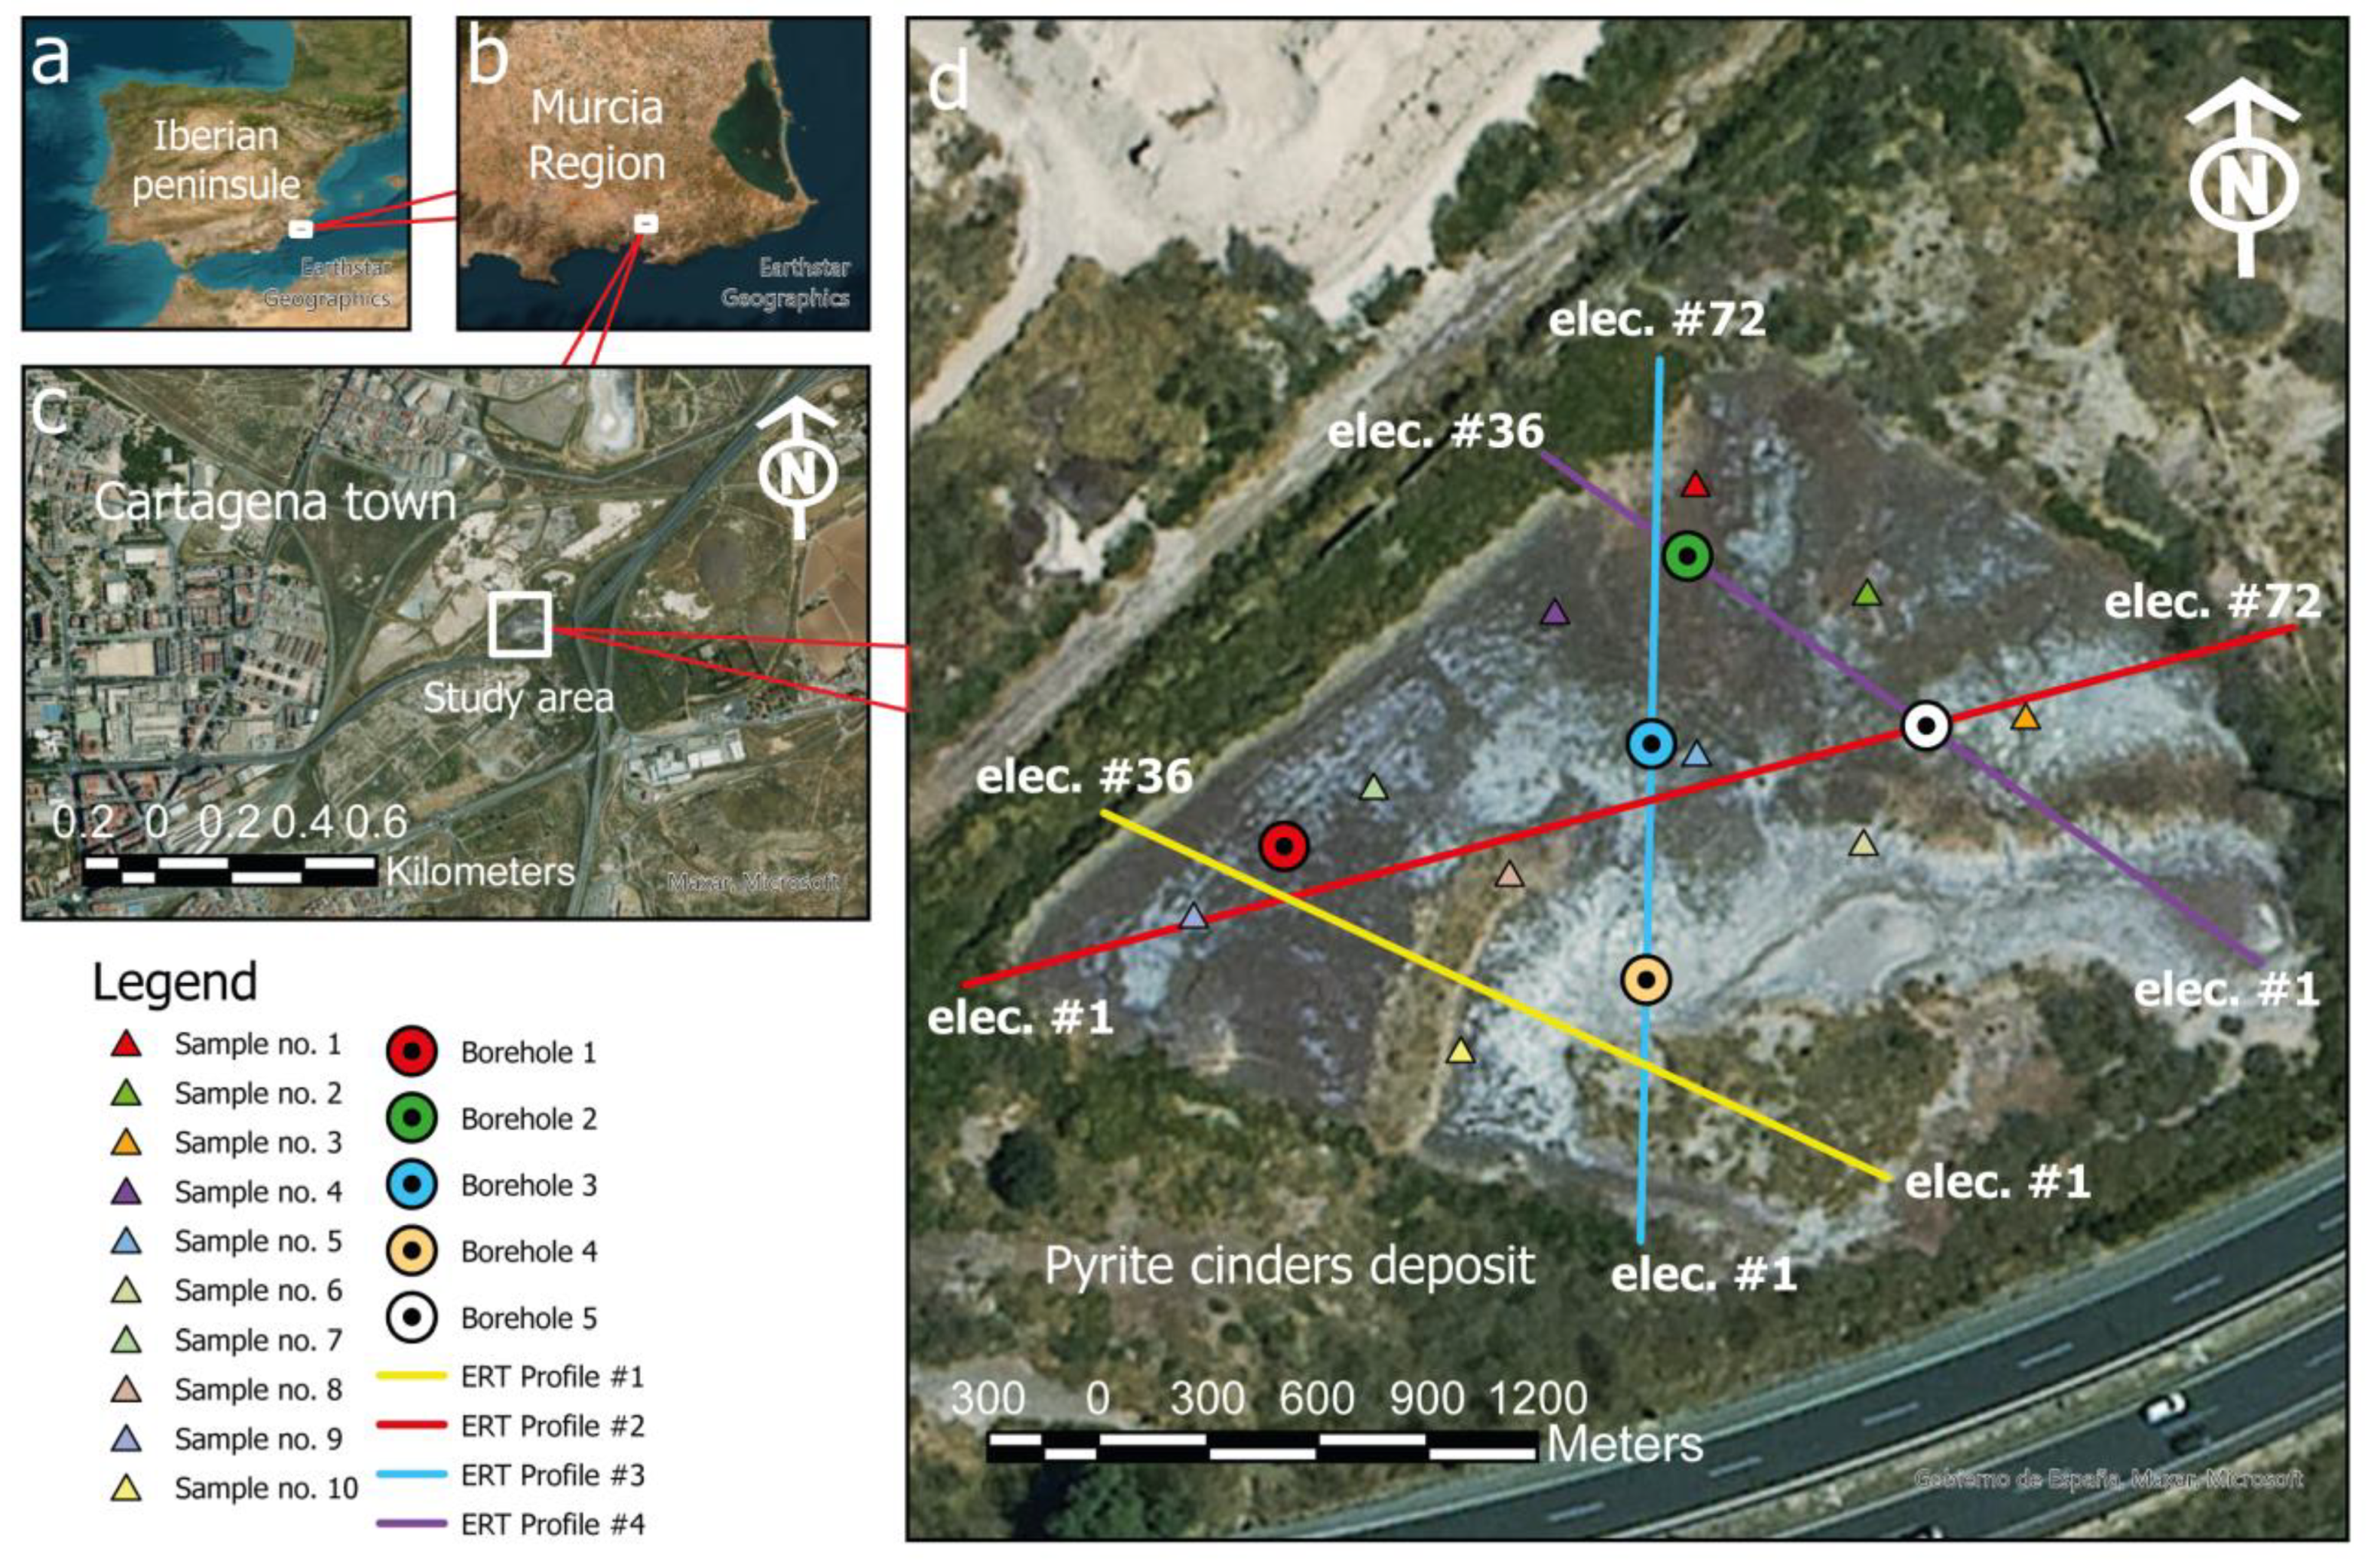
Figure 1. (ac) The schematic location of the study area. (d) Experimental design schema: straight lines represent the electrical resistivity tomography profiles, round-shape markers indicate the position of the boreholes, and the triangle markers indicate the position of the surficial samples for laboratory analysis.
Minerals 14 00652 g001
Figure 2. The distribution of chemical parameters measured in the laboratory according to depth, with markers representing each drilled borehole. The vertical dashed line represents the NGR threshold for each metal. Metals are arranged based on concentration, with the most concentrated metal positioned at the upper left and decreasing progressively. Additionally, physical properties such as electrical conductivity (EC) and pH are plotted for reference.
Minerals 14 00652 g002
Figure 3. (ad) Two-dimensional resistivity models that were obtained from the ERT survey. These models provide a visual representation of the subsurface structure of the deposit. (e) Spatial distributions of the boreholes and ERT profile layout. (f) A stratigraphical column of the studied deposit obtained from the borehole core samples.
Minerals 14 00652 g003
Figure 4. (a) Pseudo-3D resistivity model, the dashed line marks the runoff area of the deposit; blue and orange cylinders represent the position and the size of the boreholes. (b) An aerial view of the deposit; arrows show the preferential runoff area.
Minerals 14 00652 g004
Figure 5. A heatmap and dendrogram obtained by Ward’s hierarchical clustering algorithm applied to the dataset analysed. NT denotes the samples from the natural terrain and W those from the waste layer (pyrite cinders). The left part of the figure represents a tree-like representation of variable affinity. Regions of similar colours suggest groups of data points (samples or variables) with similar characteristics.
Minerals 14 00652 g005
Table 1. ERT profiles summary.
#ElectSep (m)Length (m)
Profile 1362.587.5
Profile 2722.0142
Profile 3721.5106.5
Profile 4362.587.5
Table 2. The chemical results of the surficial chemical characterisation.
SampleCdAsCrCuNiPbZnHgECpH
mg·kg−1dS·m−1
S118.72518.08.51708.014.26720.07307.024.02.94.0
S27.37137.08.4564.03.85577.01839.031.05.03.1
S35.37354.05.1449.03.88768.01733.0150.04.92.8
S45.56859.07.0345.04.96264.02045.043.05.43.4
S54.14356.05.0720.03.25399.01839.095.03.03.5
S67.021,423.07.9527.023.610,352.01849.087.05.42.7
S714.73132.06.3852.017.36380.07945.016.06.95.9
S81.52231.03.2419.02.38841.01002.0108.01.73.4
S94.46002.09.9205.014.22996.01445.013.03.17.0
S101.24535.05.1678.05.78878.01409.049.01.13.4
Mean7.06554.76.6646.79.37017.52841.361.63.93.9
SD5.35273.12.0396.67.02071.22413.143.61.71.3
NGR0.612.067.023.037.043.096.01.6
NGR: Legal thresholds of Murcia Region.
Disclaimer/Publisher’s Note: The statements, opinions and data contained in all publications are solely those of the individual author(s) and contributor(s) and not of MDPI and/or the editor(s). MDPI and/or the editor(s) disclaim responsibility for any injury to people or property resulting from any ideas, methods, instructions or products referred to in the content.