Article

Deciphering Igneous Rock Crystals: Unveiling Multifractal Patterns in Crystal Size Dynamics

1
Pooyeshgaran Kansar Limited Company, Science and Technology Paradise, Tehran 1765685338, Iran
2
CSIRO Mineral Resources, Australian Resources Research Centre, Kensington, WA 6151, Australia
3
Earth and Sustainability Science Research Centre, School of Biological, Earth and Environmental Sciences, University of New South Wales, Kensington, NSW 2052, Australia
*
Authors to whom correspondence should be addressed.
Minerals 2024, 14(7), 660; https://doi.org/10.3390/min14070660
Submission received: 27 March 2024 / Revised: 5 June 2024 / Accepted: 14 June 2024 / Published: 27 June 2024
(This article belongs to the Special Issue Texture and Microstructural Analysis of Crystalline Solids, Volume II)

Abstract

:
Understanding magma plumbing systems hinges upon an intricate comprehension of crystal populations concerning size, chemistry, and origin. We introduce an innovative, yet elegantly simple approach—the ‘number–length of crystals (N-LoC) multifractal model’—to classify crystal sizes, unveiling compelling insights into their distribution dynamics. This model, a departure from conventional crystal size distribution (CSD) diagrams, reveals multifractal patterns indicative of distinct class sizes within igneous rock crystals. By synthesizing multiple samples from experimental studies, natural occurrences, and numerical models, we validate this method’s efficacy. Our bi-logarithmic N-LoC diagrams for cooling-driven crystallized samples transcend the confines of traditional CSD plots, identifying variable thresholds linked to cooling rates and quenching temperatures. These thresholds hint at pulsative nucleation and size-dependent growth events, offering glimpses into crystallization regimes and post-growth modifications like coalescence and coarsening. Examining multifractal log–log plots across time-series samples unravels crystallization histories during cooling or decompression. Notably, microlites within volcano conduits delineate thresholds influenced by decompression rate and style, mirroring nucleation and growth dynamics observed in experimental studies. Our fractal methodology, presenting a more direct approach with fewer assumptions than the classic CSD method, stands poised as a potent alternative or complementary tool. We delve into its potential, facilitating comparisons between eruptive styles in volcanoes while deliberating on inherent limitations. This work not only advances crystal size analysis methodologies but also holds promise for inferring nuanced volcanic processes and offers a streamlined avenue for crystal size evaluation in igneous rocks.

1. Introduction

The textures of igneous rocks reflect physical processes during crystallization and solidification. The most common method of texture quantification is discriminating crystal populations based on their size, i.e., crystal size distribution (CSD) [1,2,3]. Initially developed for steady-state crystallizers, CSD analysis has been used to extract the nucleation rate and residence time of crystals in magmatic systems, assuming a linear shape of the CSD and a constant growth rate [4,5,6,7]. However, recent studies have shown that the nucleation and growth rates in magmatic systems may be time- and size-dependent [8,9,10], with pauses or accelerations [11,12] during cooling or decompression, all of which greatly affect the size of the crystals, despite being reported linear CSDs. Nevertheless, the CSD approach is a powerful tool for identifying critical petrological processes like textural coarsening [13], magma mixing [14,15], polybaric crystal fractionation, and the temporal evolution of magmatic processes [7,16,17].
Despite the advantages of the CSD approach, many authors suggest that it must not be used in isolation [18]. Moreover, some corrections are needed when converting raw 2D intersection measurements to 3D corrections, especially small-sized crystals [19]. Assuming a constant shape for all the crystals in a sample to reconstruct its CSD leads to oversimplification. This is challenging, especially in the case of volcanic systems with a complex history of crystallization [20]. Another simple approach for discriminating crystal populations based on their size may be fractal geometry methods, as will be described in this paper.
Since its introduction [21,22], fractal geometry has been utilized as a practical approach in geosciences, specifically for 2D and 3D modeling [23,24,25]. The practicality of fractal modeling is rooted in the non-linear mathematical sciences that this field is based on, replicating physical processes in nature. Fractal geometry relies on some special properties like ‘self-similarity’, that is, similar shape at all scales (scale-invariance). It is now widely acknowledged that many petrological macro- and microstructures and processes exhibit fractal characteristics, meaning they are scale-invariant. For instance, fractal patterns have been recorded in magma mixing structures [26,27], the CSD data of olivine crystals in mantle xenoliths [28], and the spatial distribution of minerals in granitoids [29]. These fractal patterns have been used to deduce some petrological processes. Over the past three decades, several new types of fractal models have been developed in geosciences, e.g., the number–size (N–S) model in 3D [30], the concentration–concentration model [31], category-based fractal modeling [32], the concentration–area model [33], the spectrum–area model [34], and the concentration–distance from the centroids (C-DC) model [35].
The present research aims to apply a fractal/multifractal technique, the number–length of crystals (N-LoC) model, which is an innovative form of the number–size fractal method. This technique is employed to discriminate between crystal populations from six sample groups from published experimental and natural studies and numerical modeling, which, according to the original papers, are mainly related to either cooling or decompression-driven crystallization. Then, the limitations of both CSD and the proposed method are discussed, along with their applications and potential future directions.
The primary accomplishment of this study is identifying a method to categorize microlites that develop during decompression in volcano conduits, displaying distinct patterns in log–log plots. These variations can be associated with the decompression rate and path, both of which significantly influence the eruptive characteristics (explosive versus effusive).

2. Materials and Methods

2.1. Number–Length (N-LoC) Fractal Geometry Method

This method is a modified version of the number–size (N–S) fractal geometry method initially introduced by Mandelbrot (1967) [21] The key distinction between this approach and other fractal methods is its ability to depict and simulate the distribution of populations, such as geochemical and geological populations, without the need for prior estimations, thus reducing errors. It relies on the interplay between the number of samples analyzed and the magnitude of their characteristics, such as concentration, distance, and so forth. The N–S model is defined by the following equation [22]:
N   ( ρ ) = F ρ D
where ρ denotes the elemental concentration, N (≥ρ) represents the cumulative number of samples with concentration values greater than or equal to ρ, F is a constant, and D is the scaling exponent or fractal dimension of the distribution of elemental concentrations. The log–log plots of N (≥ρ) versus ρ show straight line segments with different slopes (−D), which correspond to different intervals.
Based on the N–S model, some other innovative models were proposed [36]. As an illustration, the ‘concentration–size’ fractal model was proposed to describe the spatial distribution of geochemical data in giant mineral deposits [37]. The N–S method in 3D modeling was utilized [30,36,38] to outline the mineralized zones and wall rocks, which presented better results than the C-V model. Moreover, the innovative simulated size–number (SS-N) model has been proposed [36], combining the N–S model and simulation methods for mineral resource classification.
In this research, the aim parameter, as size, is the length of the plagioclases in the matrix of the petrological thin sections of the studied sample datasets. Given this fact, the number–length (N-LoC) fractal model was proposed, which is expressed by the following equation:
N   ( L ) = F L D
where L denotes the length of the aim crystals, N (≥L) represents the cumulative number of samples with length values greater than or equal to L, F is a constant, and D is the scaling exponent or fractal dimension of the distribution of size measurements.
In the N–L log–log plot, the threshold values obtained represent the breakpoints of straight lines fitted through least squared (LS) regression [39]. To evaluate the accuracy of discriminated thresholds, it is necessary that the coefficient of determination (R2) of the regression line exceeds 0.95. Nevertheless, values greater than 0.9 can be accepted for the straight lines on the left and right sides of the diagram.

2.2. Sample Description and Data Acquisition

To test the validity of the fractal analysis and meaningful interpretation of thresholds, we have selected some published studies that applied the CSDs in natural and experimental samples as well as numerical modeling results. The plagioclases were selected as the target mineral given their ubiquitous nature in almost all magmatic systems, the numerous published CSD and textural studies [40], their stability in a wide range of pressure and temperature conditions, and their micro-texture sensitivity to many physicochemical processes. The first set of samples consists of published data from cooling-driven crystallization experiments [10,41] and a natural example of crystallization primarily induced by cooling, i.e., the study of sill emplacement in the framework of CSD and other geochemical criteria [42]. The second group comprises examples of decompression-induced crystallization, including an evaluation of plagioclase shape changes with size during ascent through conduits and the examination of microlites from dome and tephra samples from the 2021 eruption of the La Soufrière volcano [43]. The third set involves the multifractal analysis of numerical modeling results related to decompression-induced crystallization using the Supersaturation Nucleation and Growth of Plagioclase (SNGPlag) model [11]. The details regarding the sample datasets and the reasons for their selection are presented in Appendix A.

3. Results

3.1. Multifractal Analysis of Experimental Samples

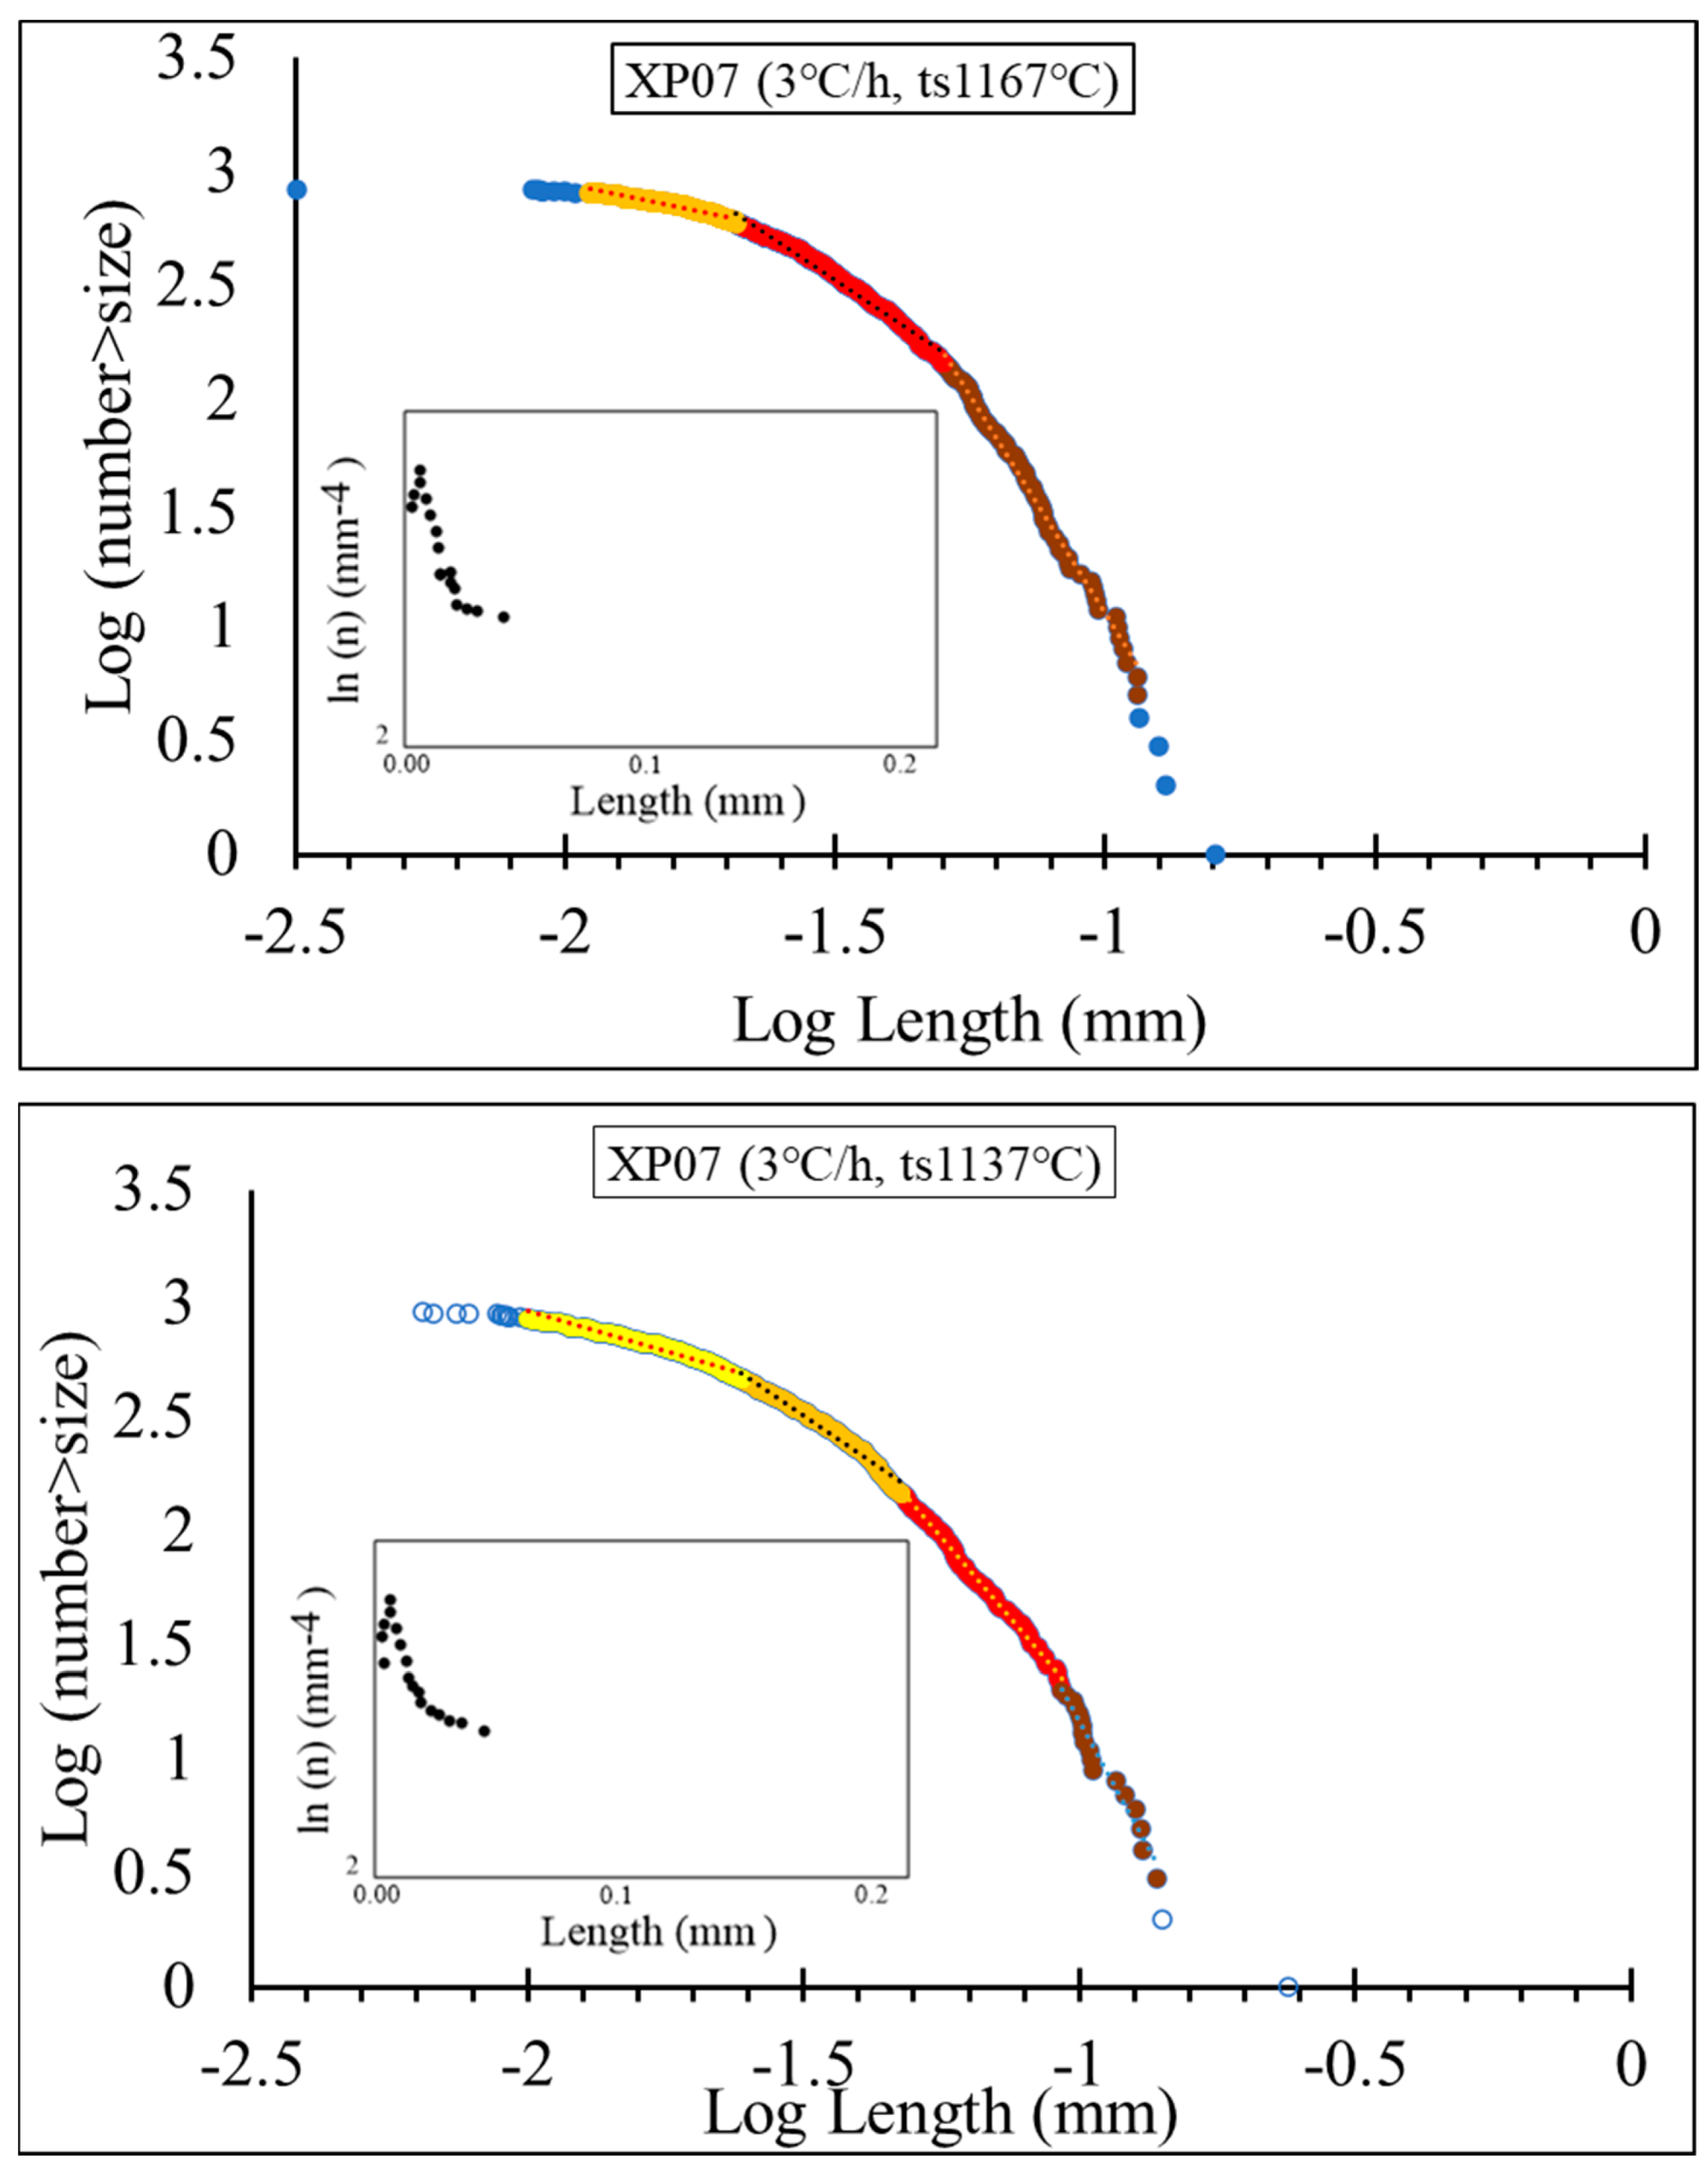
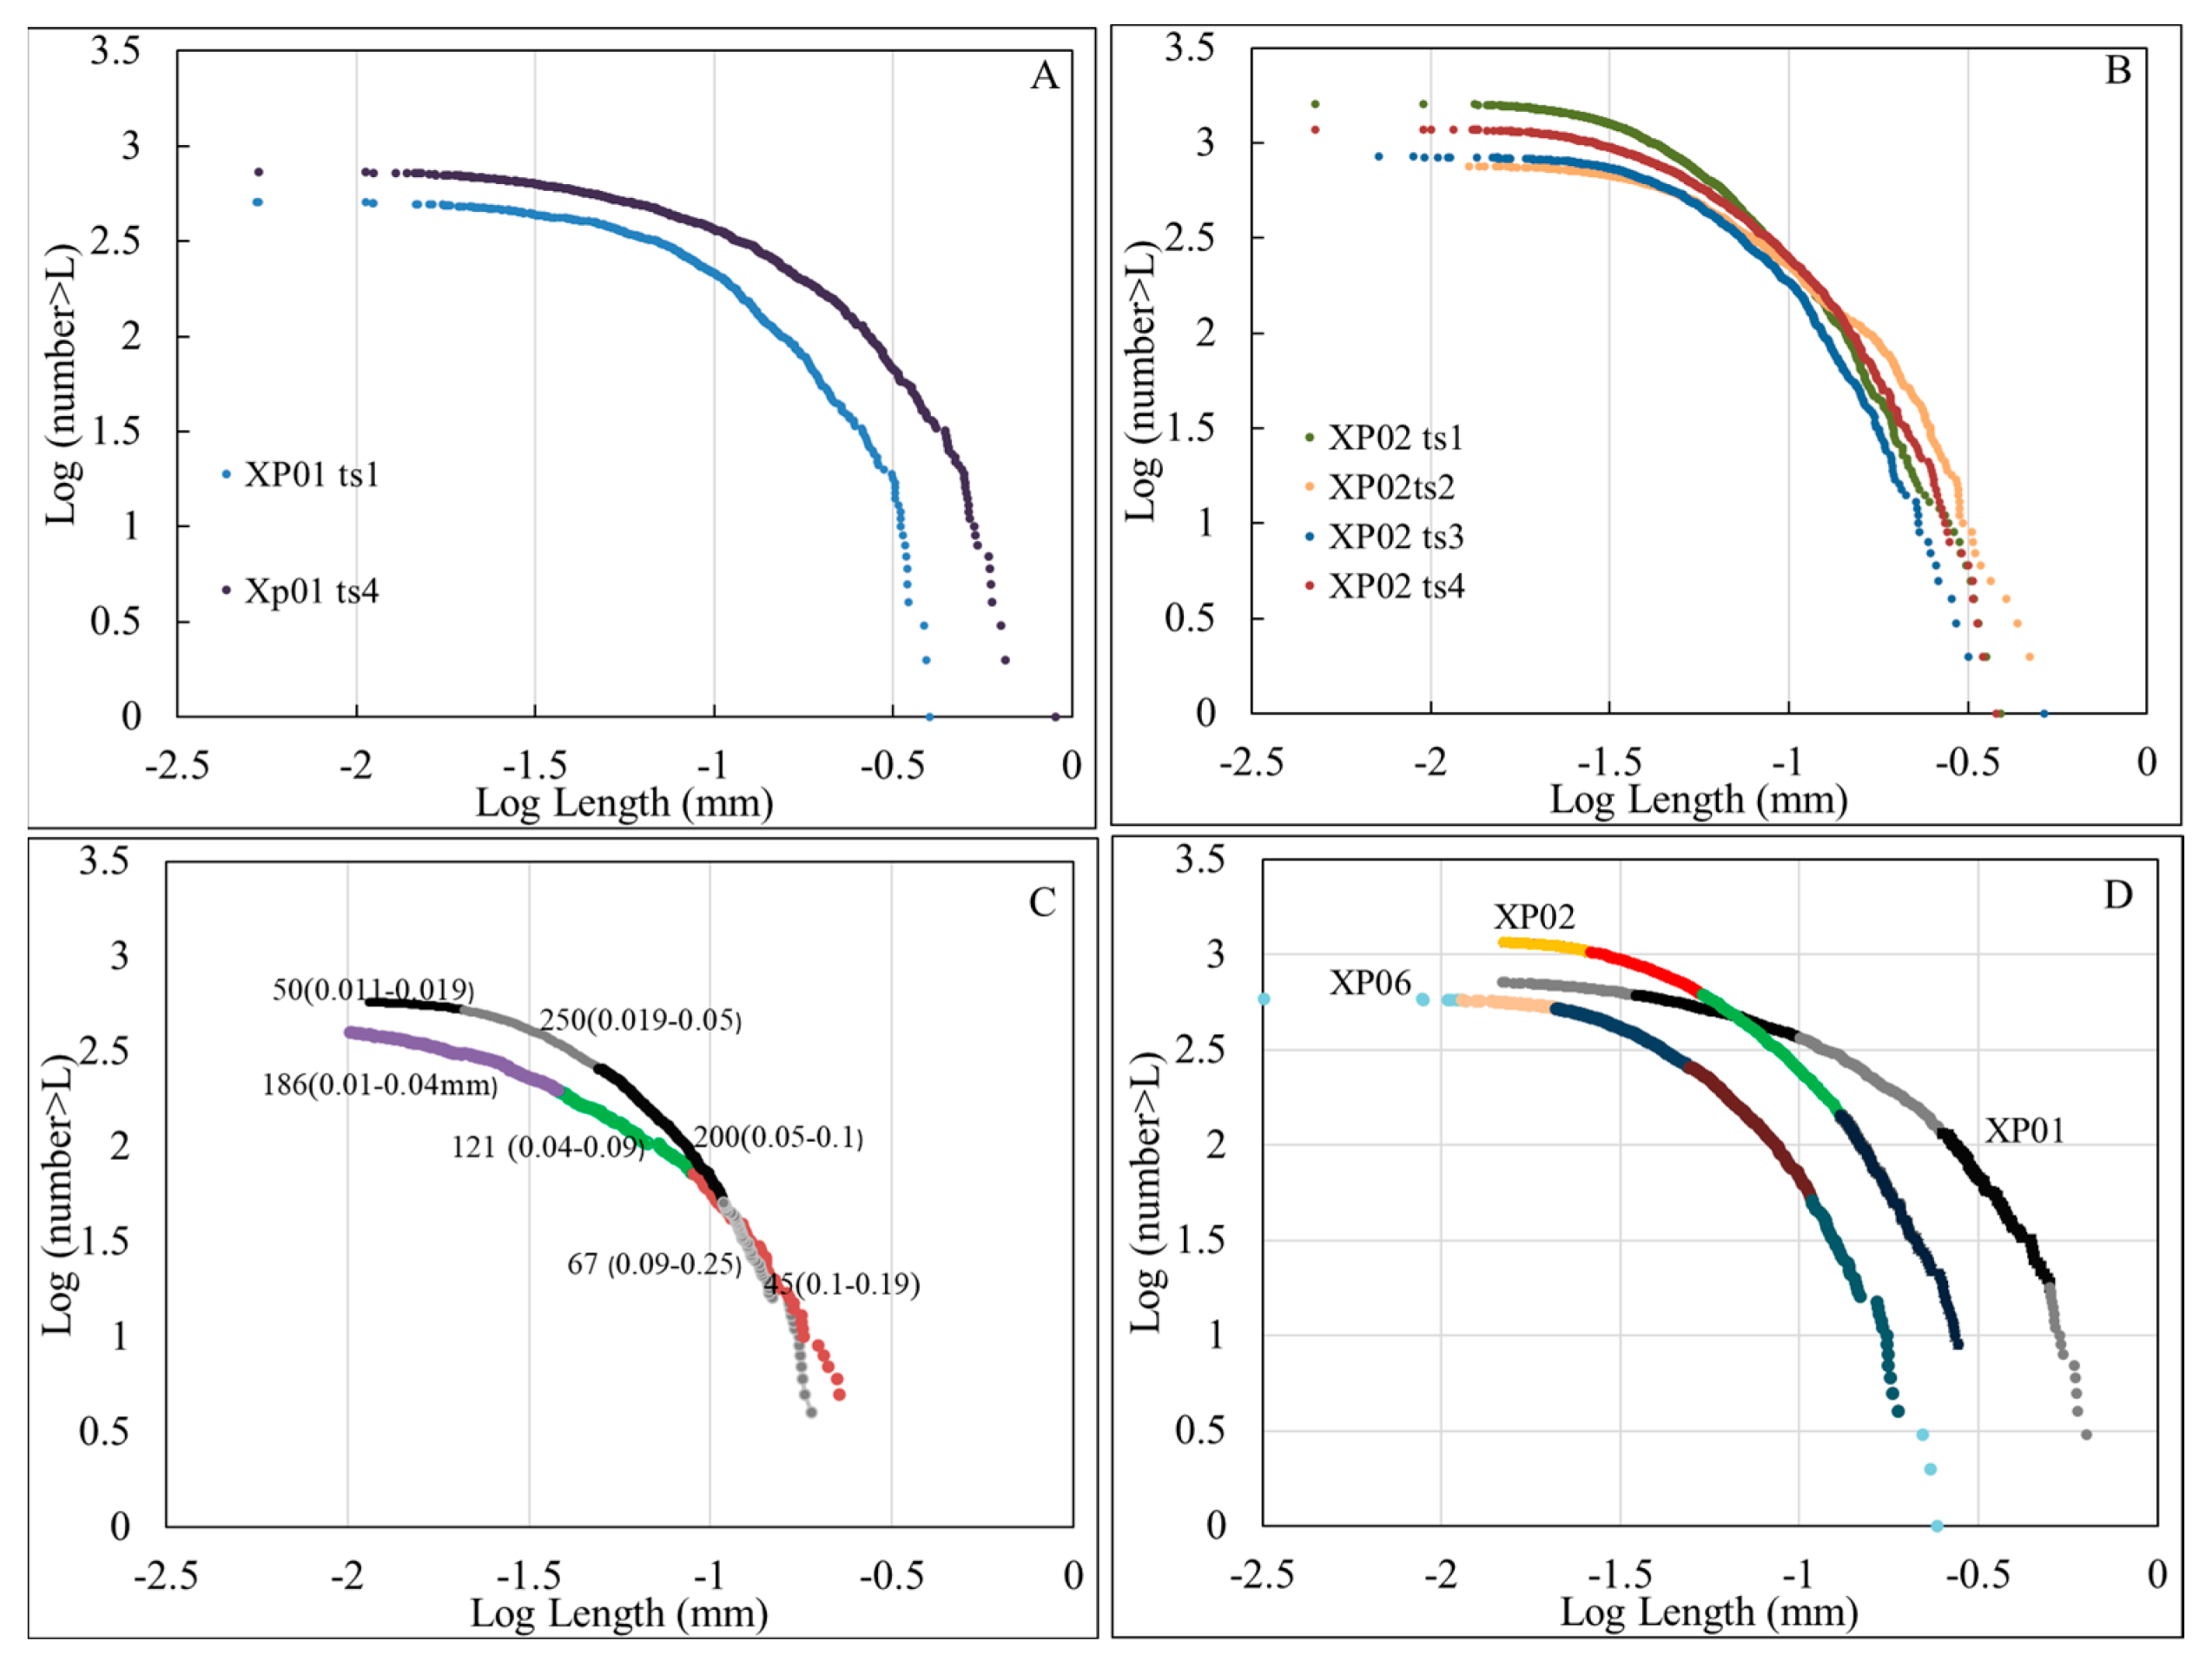
Applying multifractal analysis to each experiment of [10] led to different thresholds in terms of number and value (Figure 1, Table 1, and Supplementary Figure S1). In 0.2 °C/h cooling experiments (XP01), for instance, five thresholds (corresponding to four size classes) can be determined for samples quenched at 1139 °C, and six thresholds (corresponding to five size classes) can be determined for samples quenched at 1109 °C. The maximum size of crystals progressively shifts toward higher values, and an additional threshold appears at large crystal sizes at the lowest quenching temperature. On the other hand, at higher cooling rate experiments (3 °C/h), the number of thresholds varies from four at a high quenching temperature (ts: 1167 °C) to five for samples that were formed at the lowest quenching temperature (ts: 1137 °C). The additional threshold in the ts 1137 °C experiment lies in medium to large sizes (Figure 2 and Table 2).
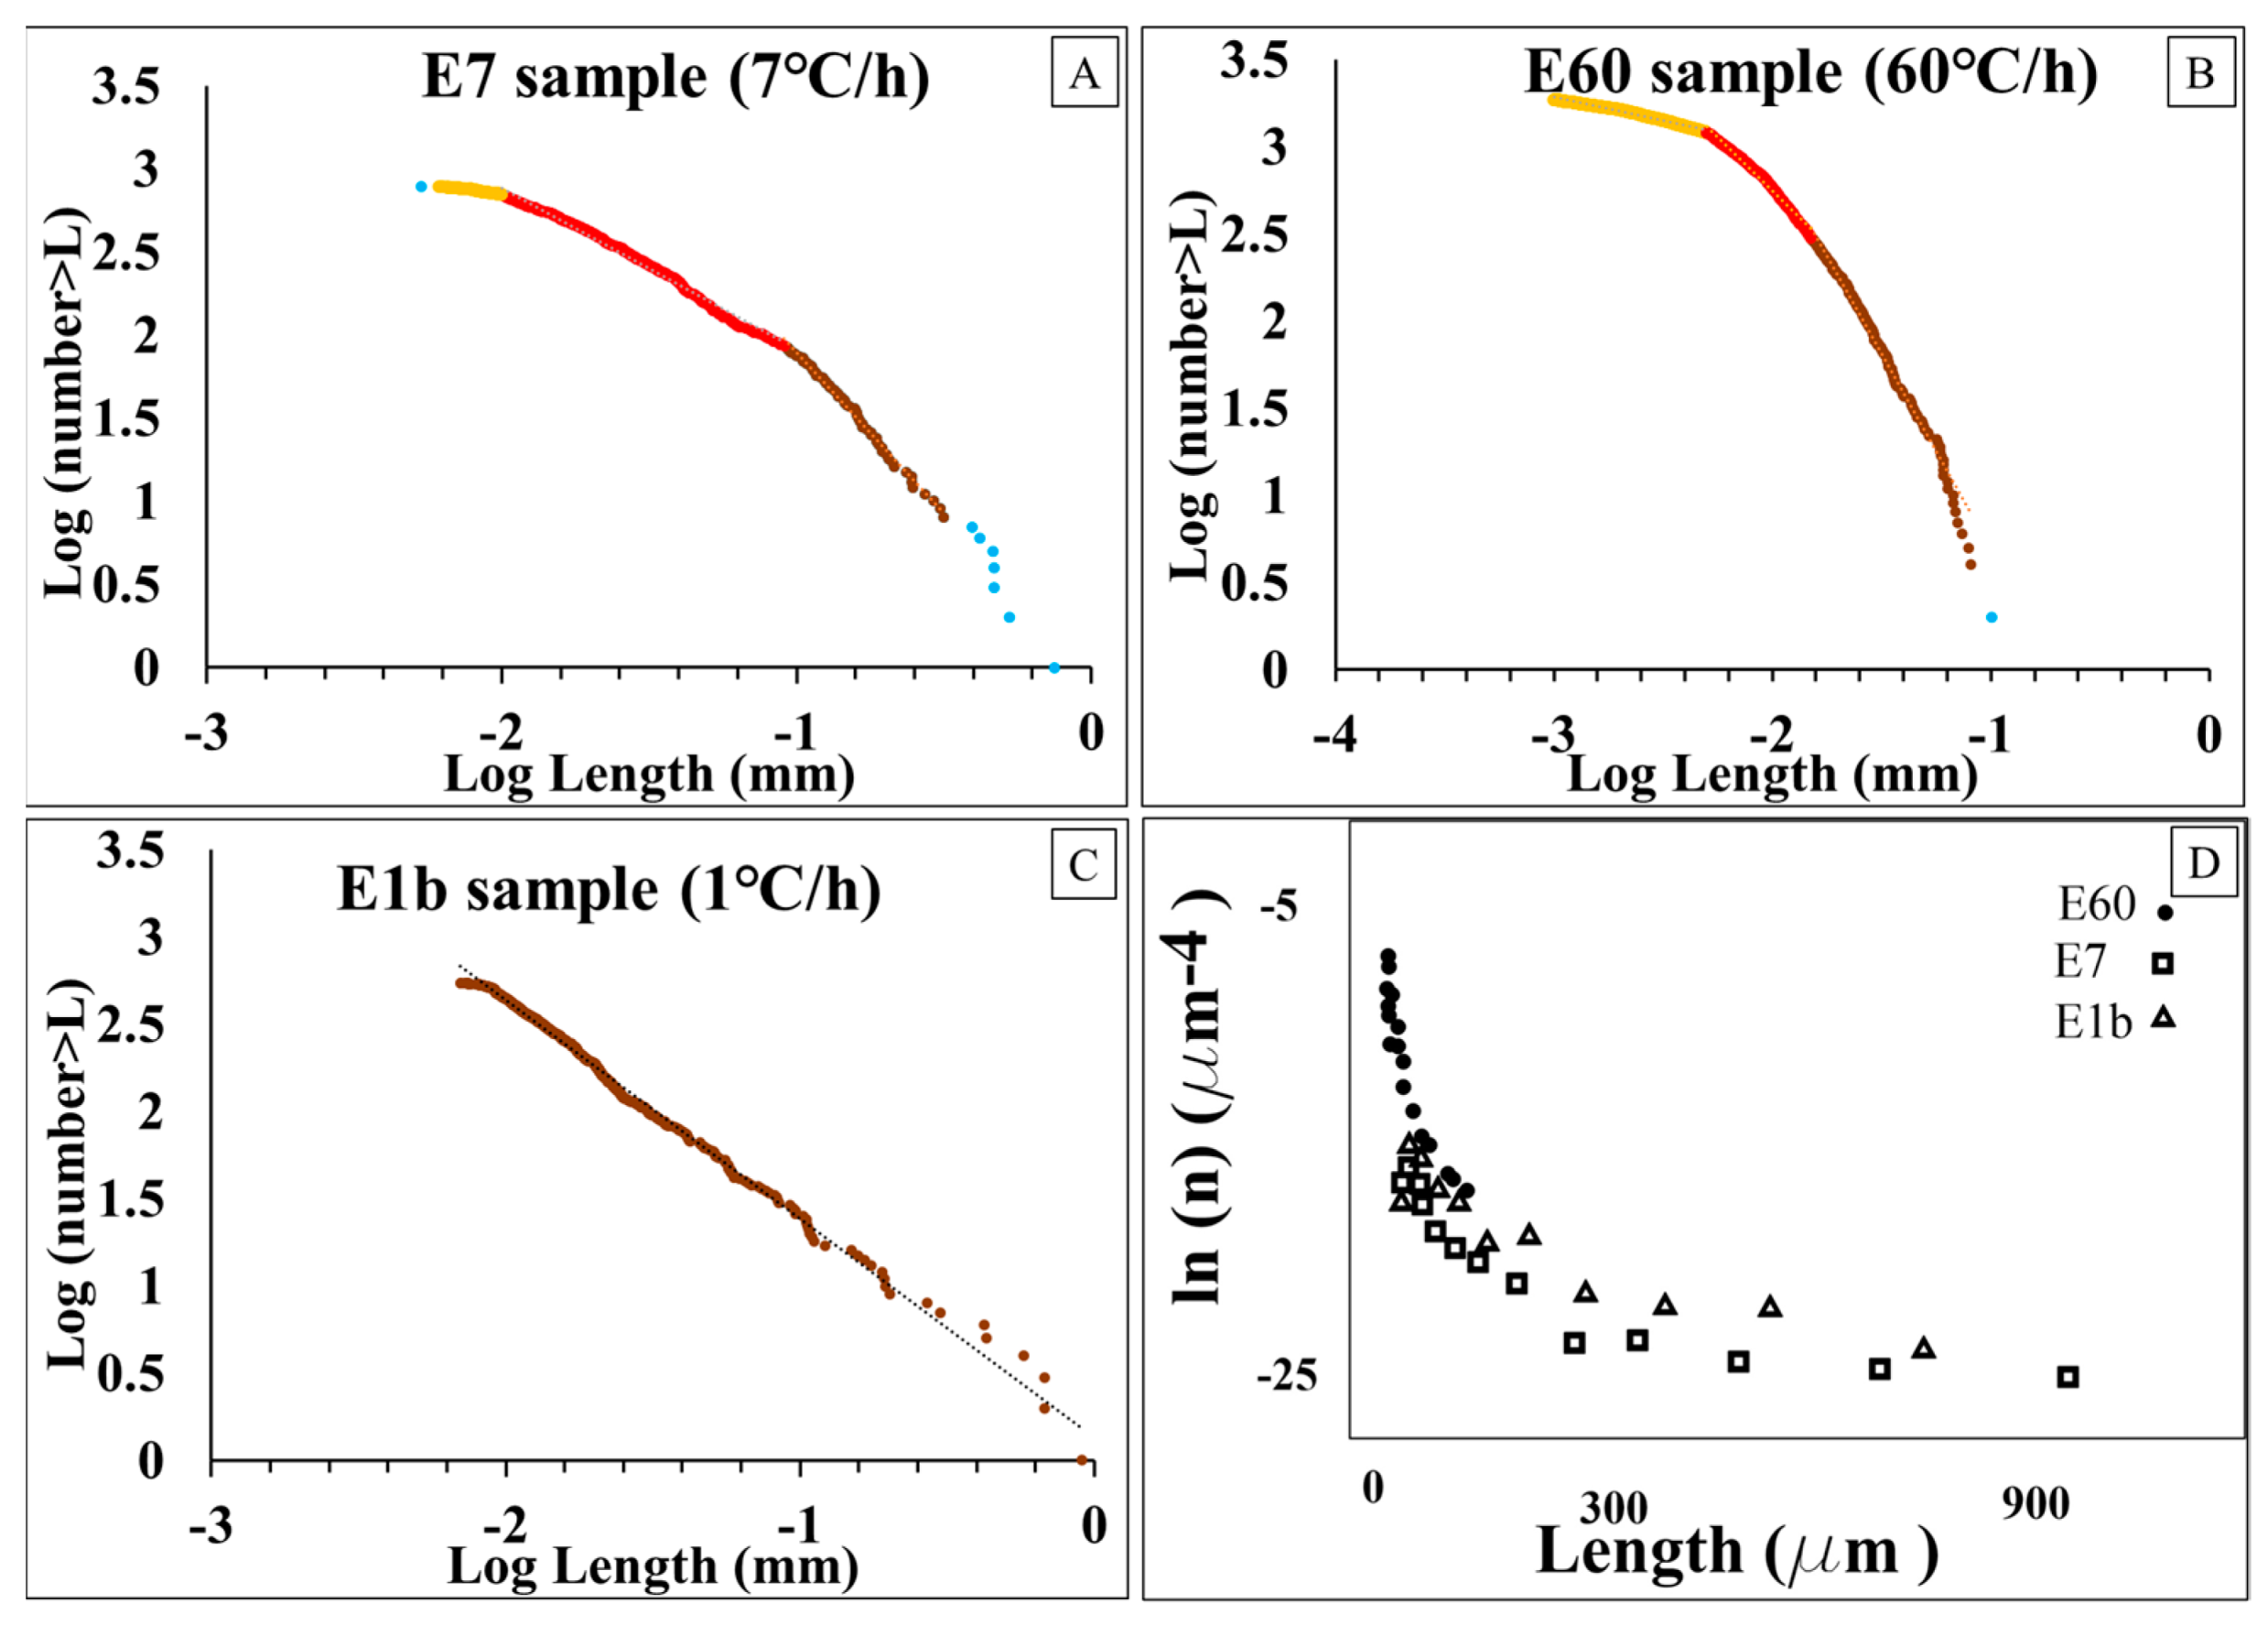
The log–log plot of the crystal lengths of the sample quenched at 800 °C with a low cooling rate of 1 °C/h [41] shows a semi-straight line for plagioclase sizes with two small legs at 0.01 mm and 0.02 mm; however, all the data can be fitted in a regression line with R2 = 0.99 (Figure 3 and Supplementary Figure S2). On the other hand, four thresholds (three intervals) can be discriminated for two other samples containing plagioclase (for the samples with a cooling rate of 7 °C/h and 60 °C/h). However, the slope of the regression lines for the 7 °C/h experiment is smaller than the 60 °C/h experiment, i.e., a smoother curve in the first case. The range of the measured crystal lengths at 1 °C/h is from 0.007 to 0.9 mm, while for 7 °C/h, the range is from 0.005 to 0.7 mm, and for 60 °C/h, it is from 0.001 to 0.1 mm. These ranges show that both small and large sizes shift toward higher values with the decreasing cooling rate. The first threshold appears at 0.01 mm for 1 °C/h and 7 °C/h experiments, while for the 60 °C/h, this value falls to 0.005 mm, and the second threshold occurs at 0.01 mm.

3.2. Multifractal Analysis of Natural Samples

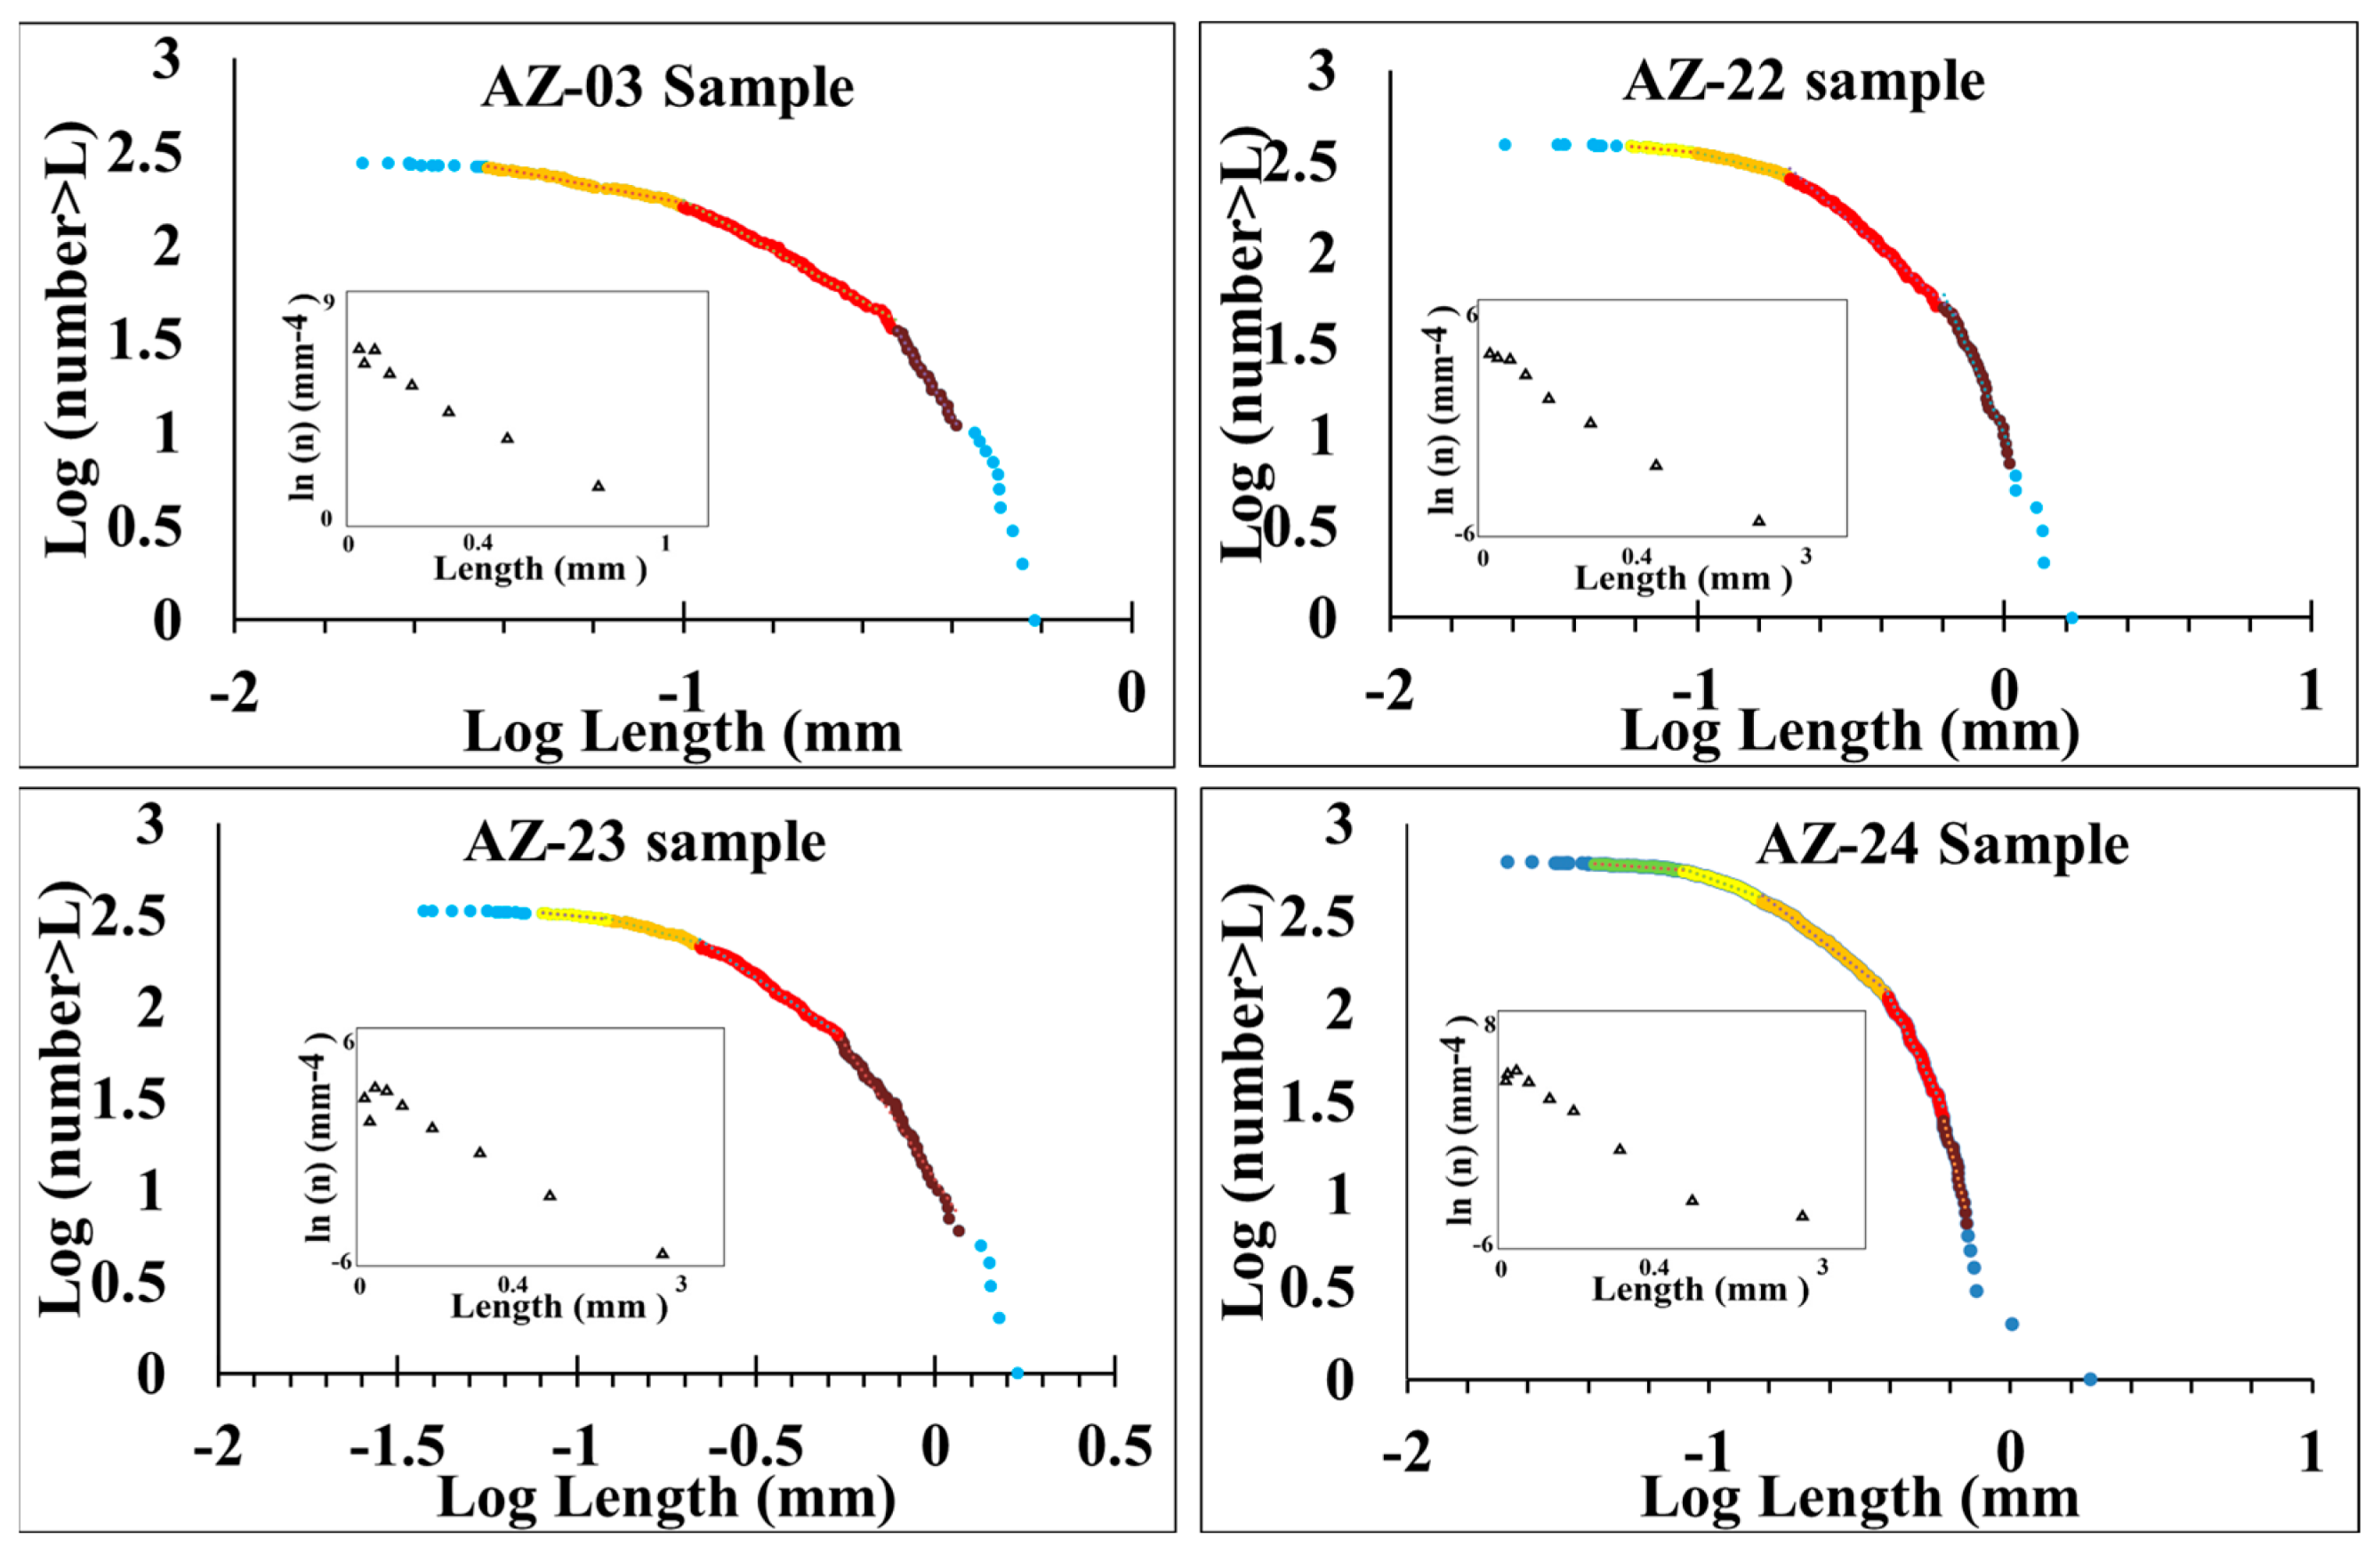
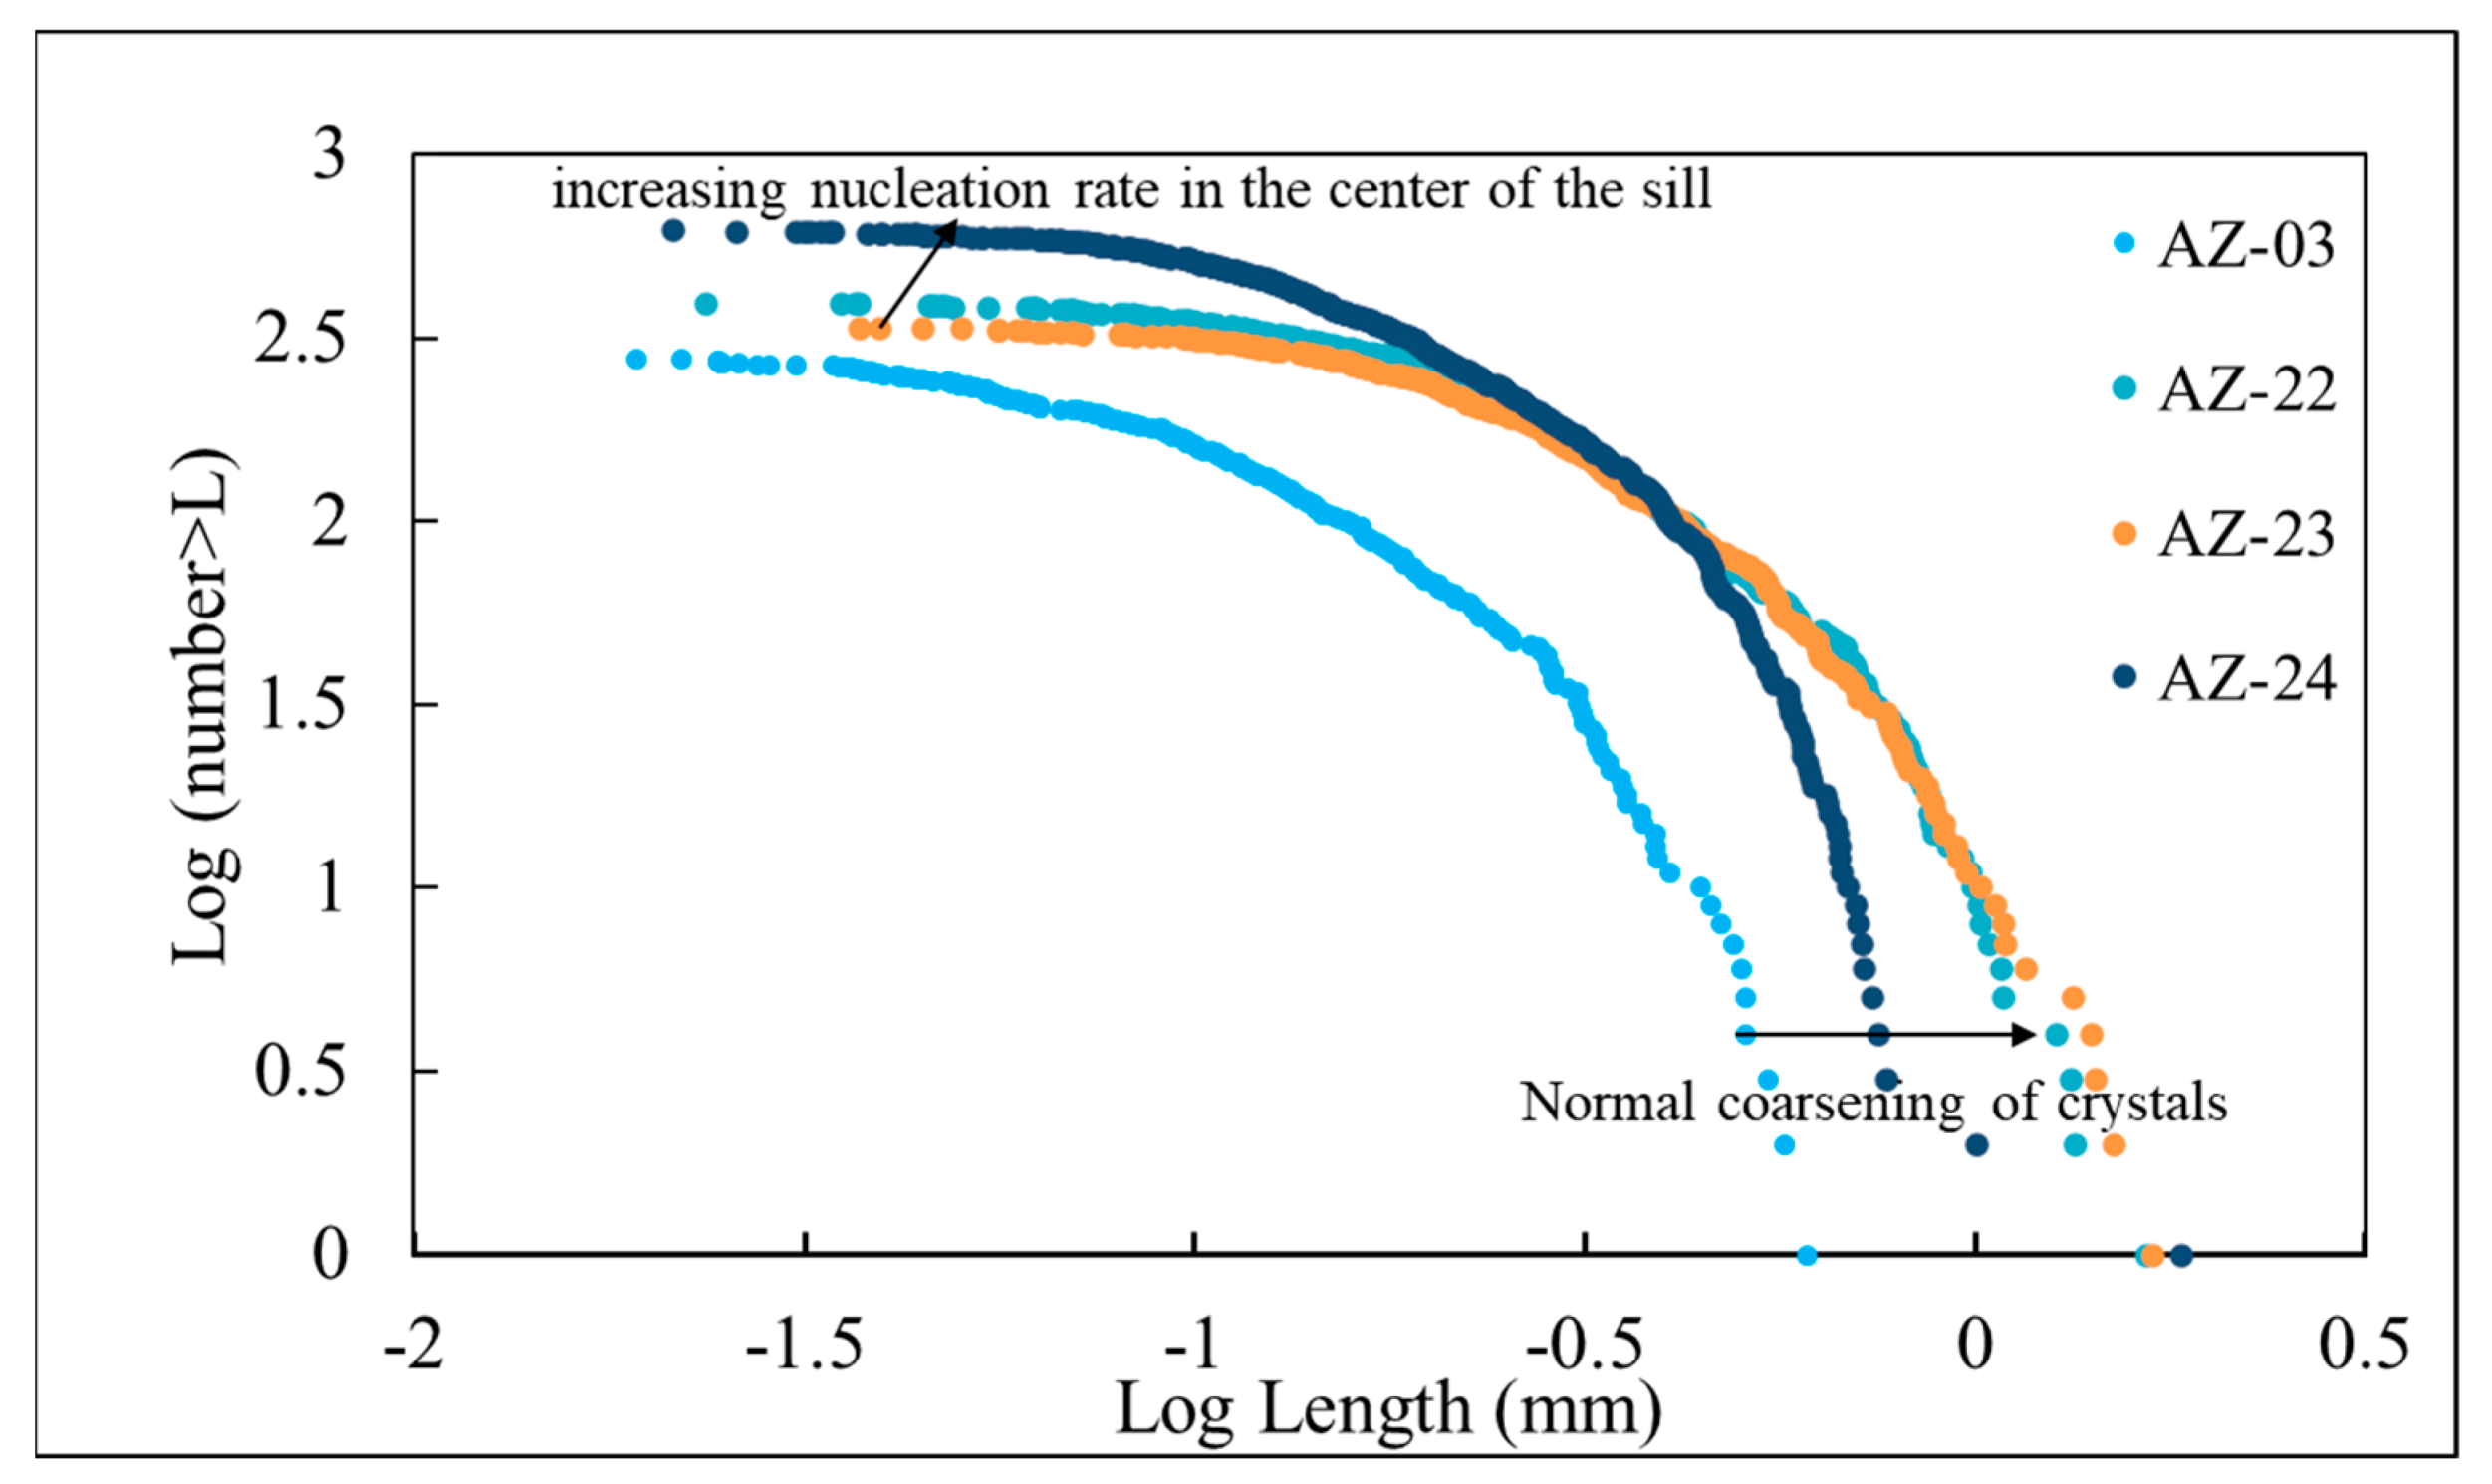
The multifractal analysis of the size data of the Beacon Sill samples (Figure 4, Table 3, and Supplementary Figure S3) reveals that the number of thresholds varies between four to six (the three-to-five size class of crystals), depending on the stratigraphic position of the samples taken. The samples from the chilled margins (AZ-03 is shown in Figure 4 as an example) show four thresholds (three intervals) with values ranging from 0.03 to 0.4 mm on their fractal diagram. In contrast, for the samples from the inner part of the sill, the five thresholds can be seen in the log–log diagram, in which additional thresholds appear at higher values (the AZ-22 and AZ-23 samples are shown in Figure 5). Also, AZ-23 has a higher number density of large crystals and a gentler slope of regression lines than the adjacent AZ-22 sample, which is stratigraphically lower. On the other hand, the AZ-24 sample in the center of the sill has a finer background and higher crystal number density than the neighboring AZ-23 sample [42]. AZ-24 has six thresholds, while the largest threshold lies at 0.71 mm for AZ-24 and 1.12 mm for AZ23. Contrastingly, the high number density of fine crystals in AZ-24 leads to the smallest threshold value of 0.04 mm for AZ-24 (compared to 0.08 mm in the AZ-23 sample). The percentage of medium-to-large-sized crystals confined within thresholds is also higher in the AZ-23 sample than its neighboring samples, which is consistent with the higher population densities in these size classes mentioned in the original paper.
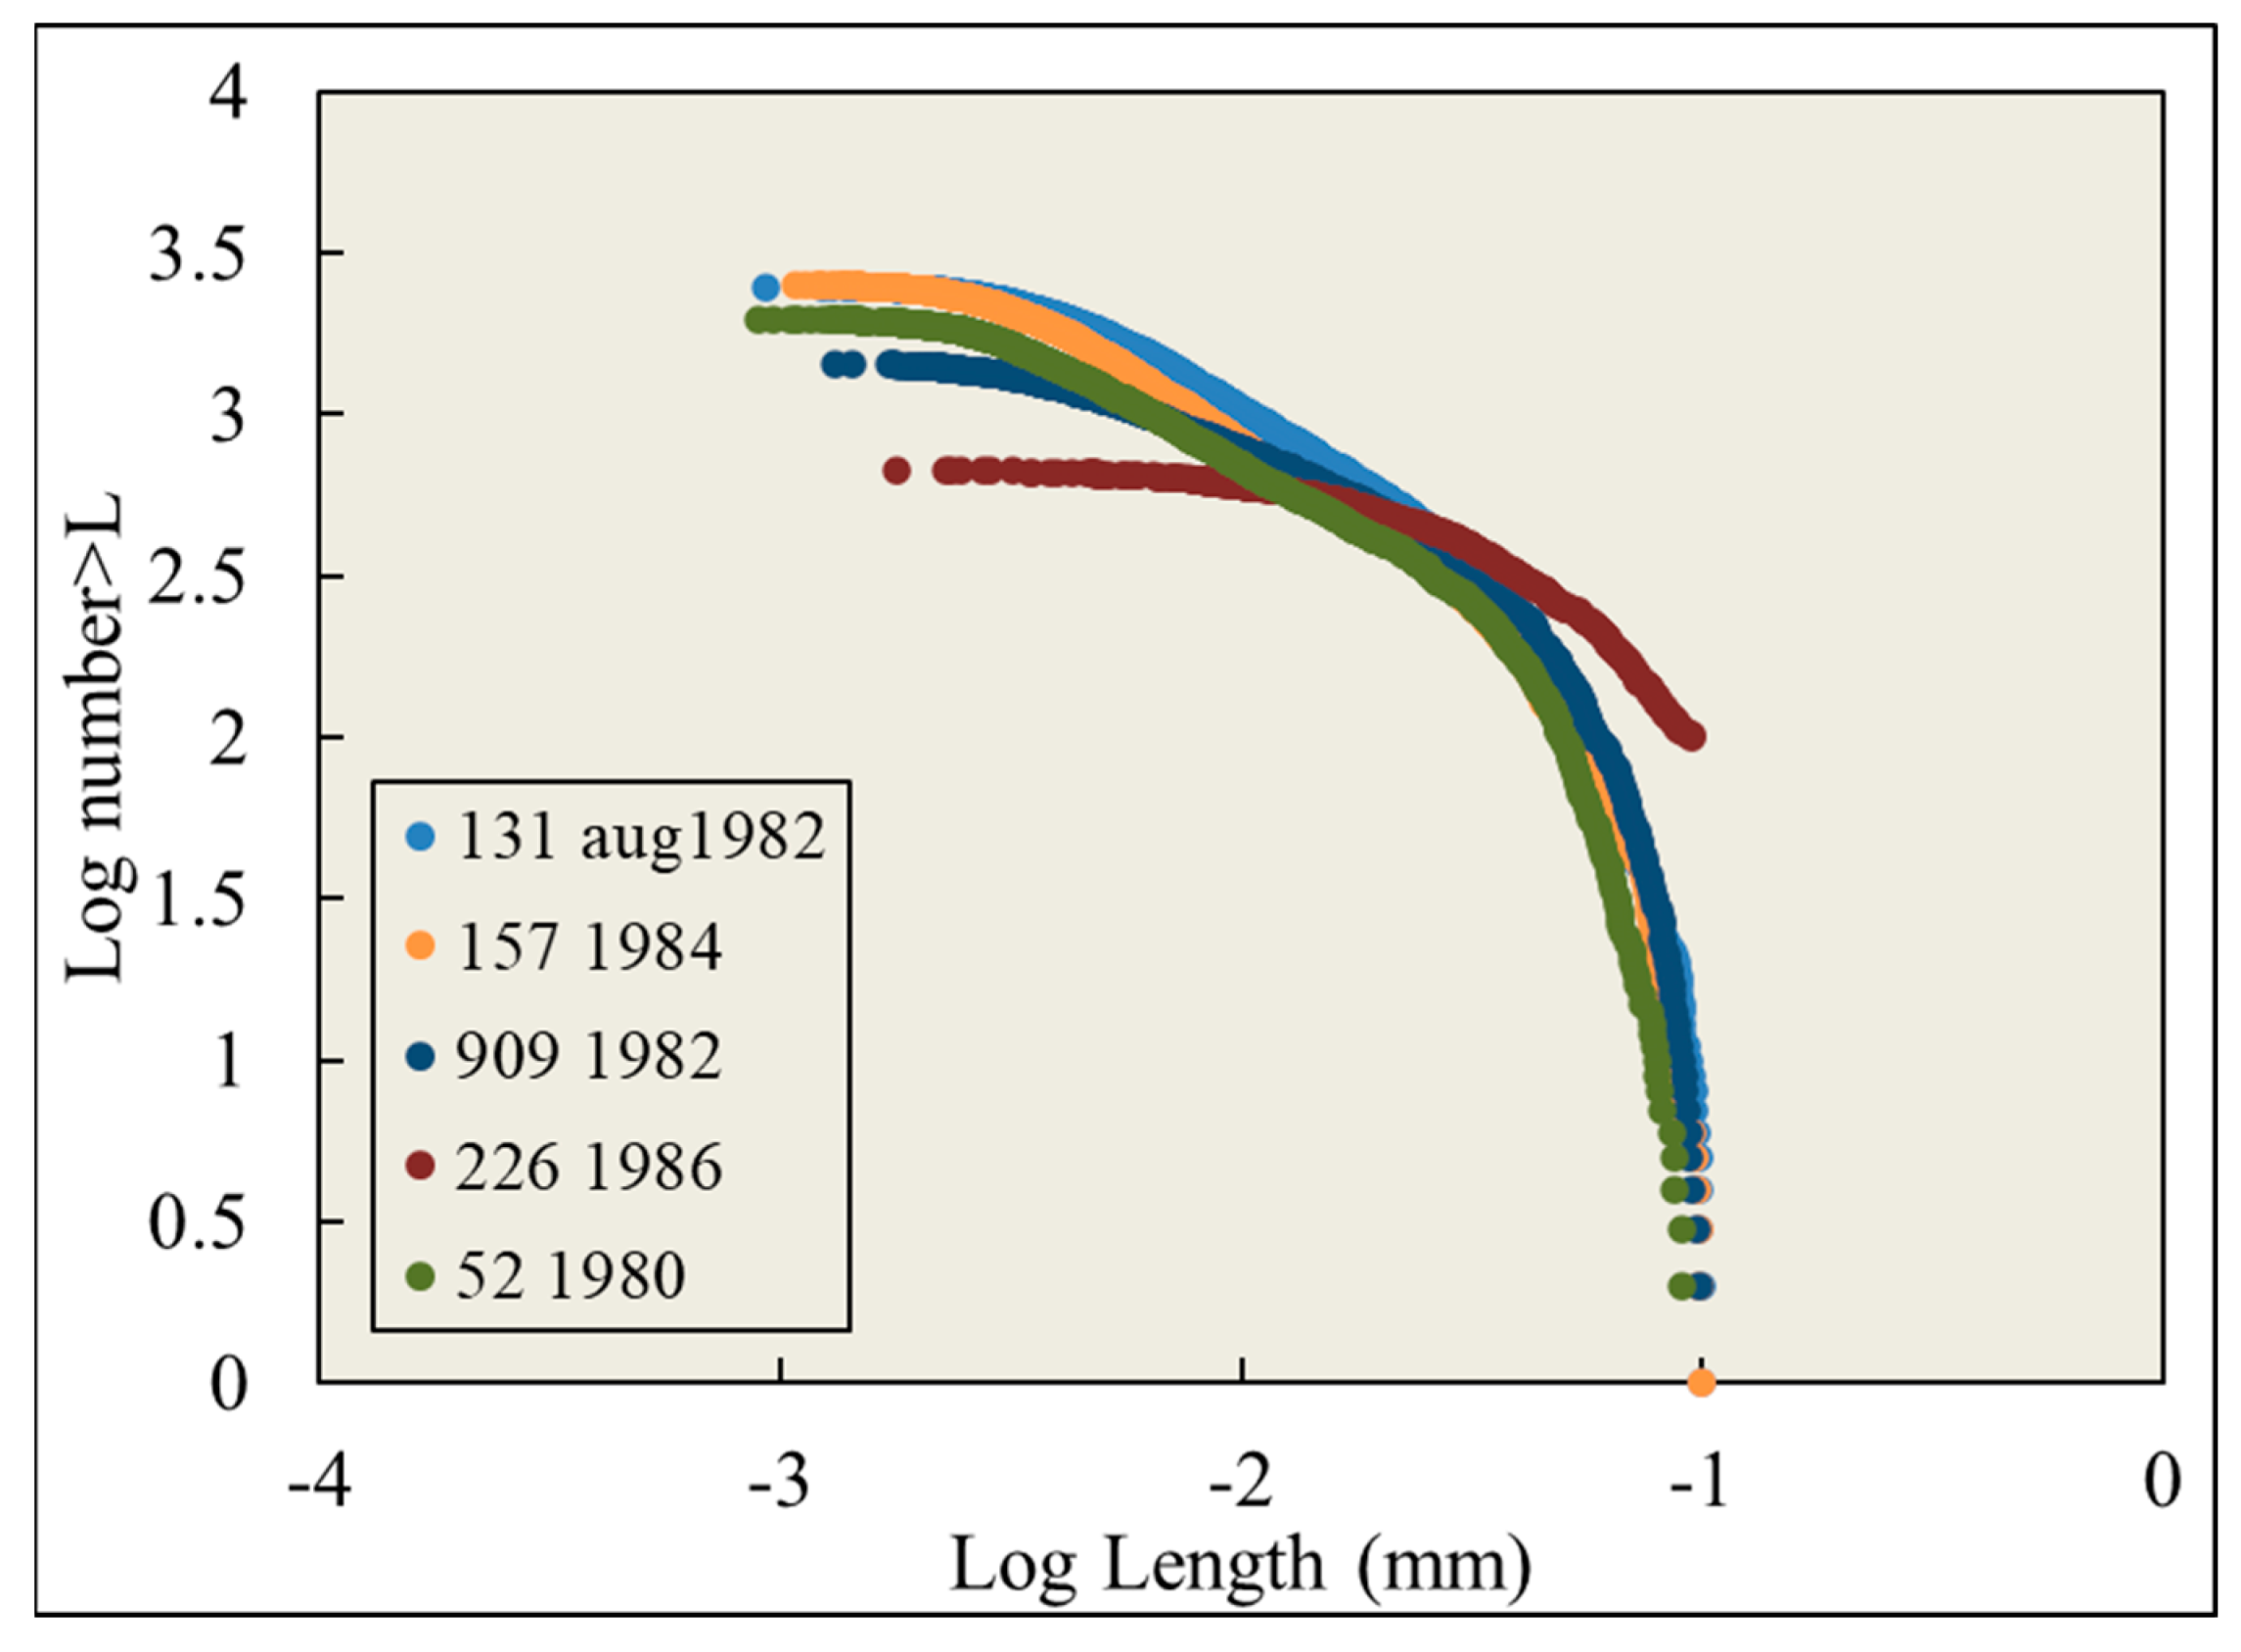
The bi-logarithmic plots of dome rock samples from Mt. St. Helens [20] show seven thresholds for the microlites of the samples that erupted during slow ascent and six thresholds for samples that erupted during fast ascent rates (Table 4 and Figure 5; see Supplementary Figure S4 for other samples). In the case of sample Sh-226 from the October 1986 eruption with a faster ascent rate, six class sizes are distinguished. However, unlike the other samples, in which only groundmass crystals smaller than 0.1 mm were considered, the data of this sample contain some measurements larger than 0.2 mm, which may be crystallized earlier than the final phase of ascent and shallow stalling. Ignoring size ranges exceeding 0.1 mm would result in the elimination of two thresholds.
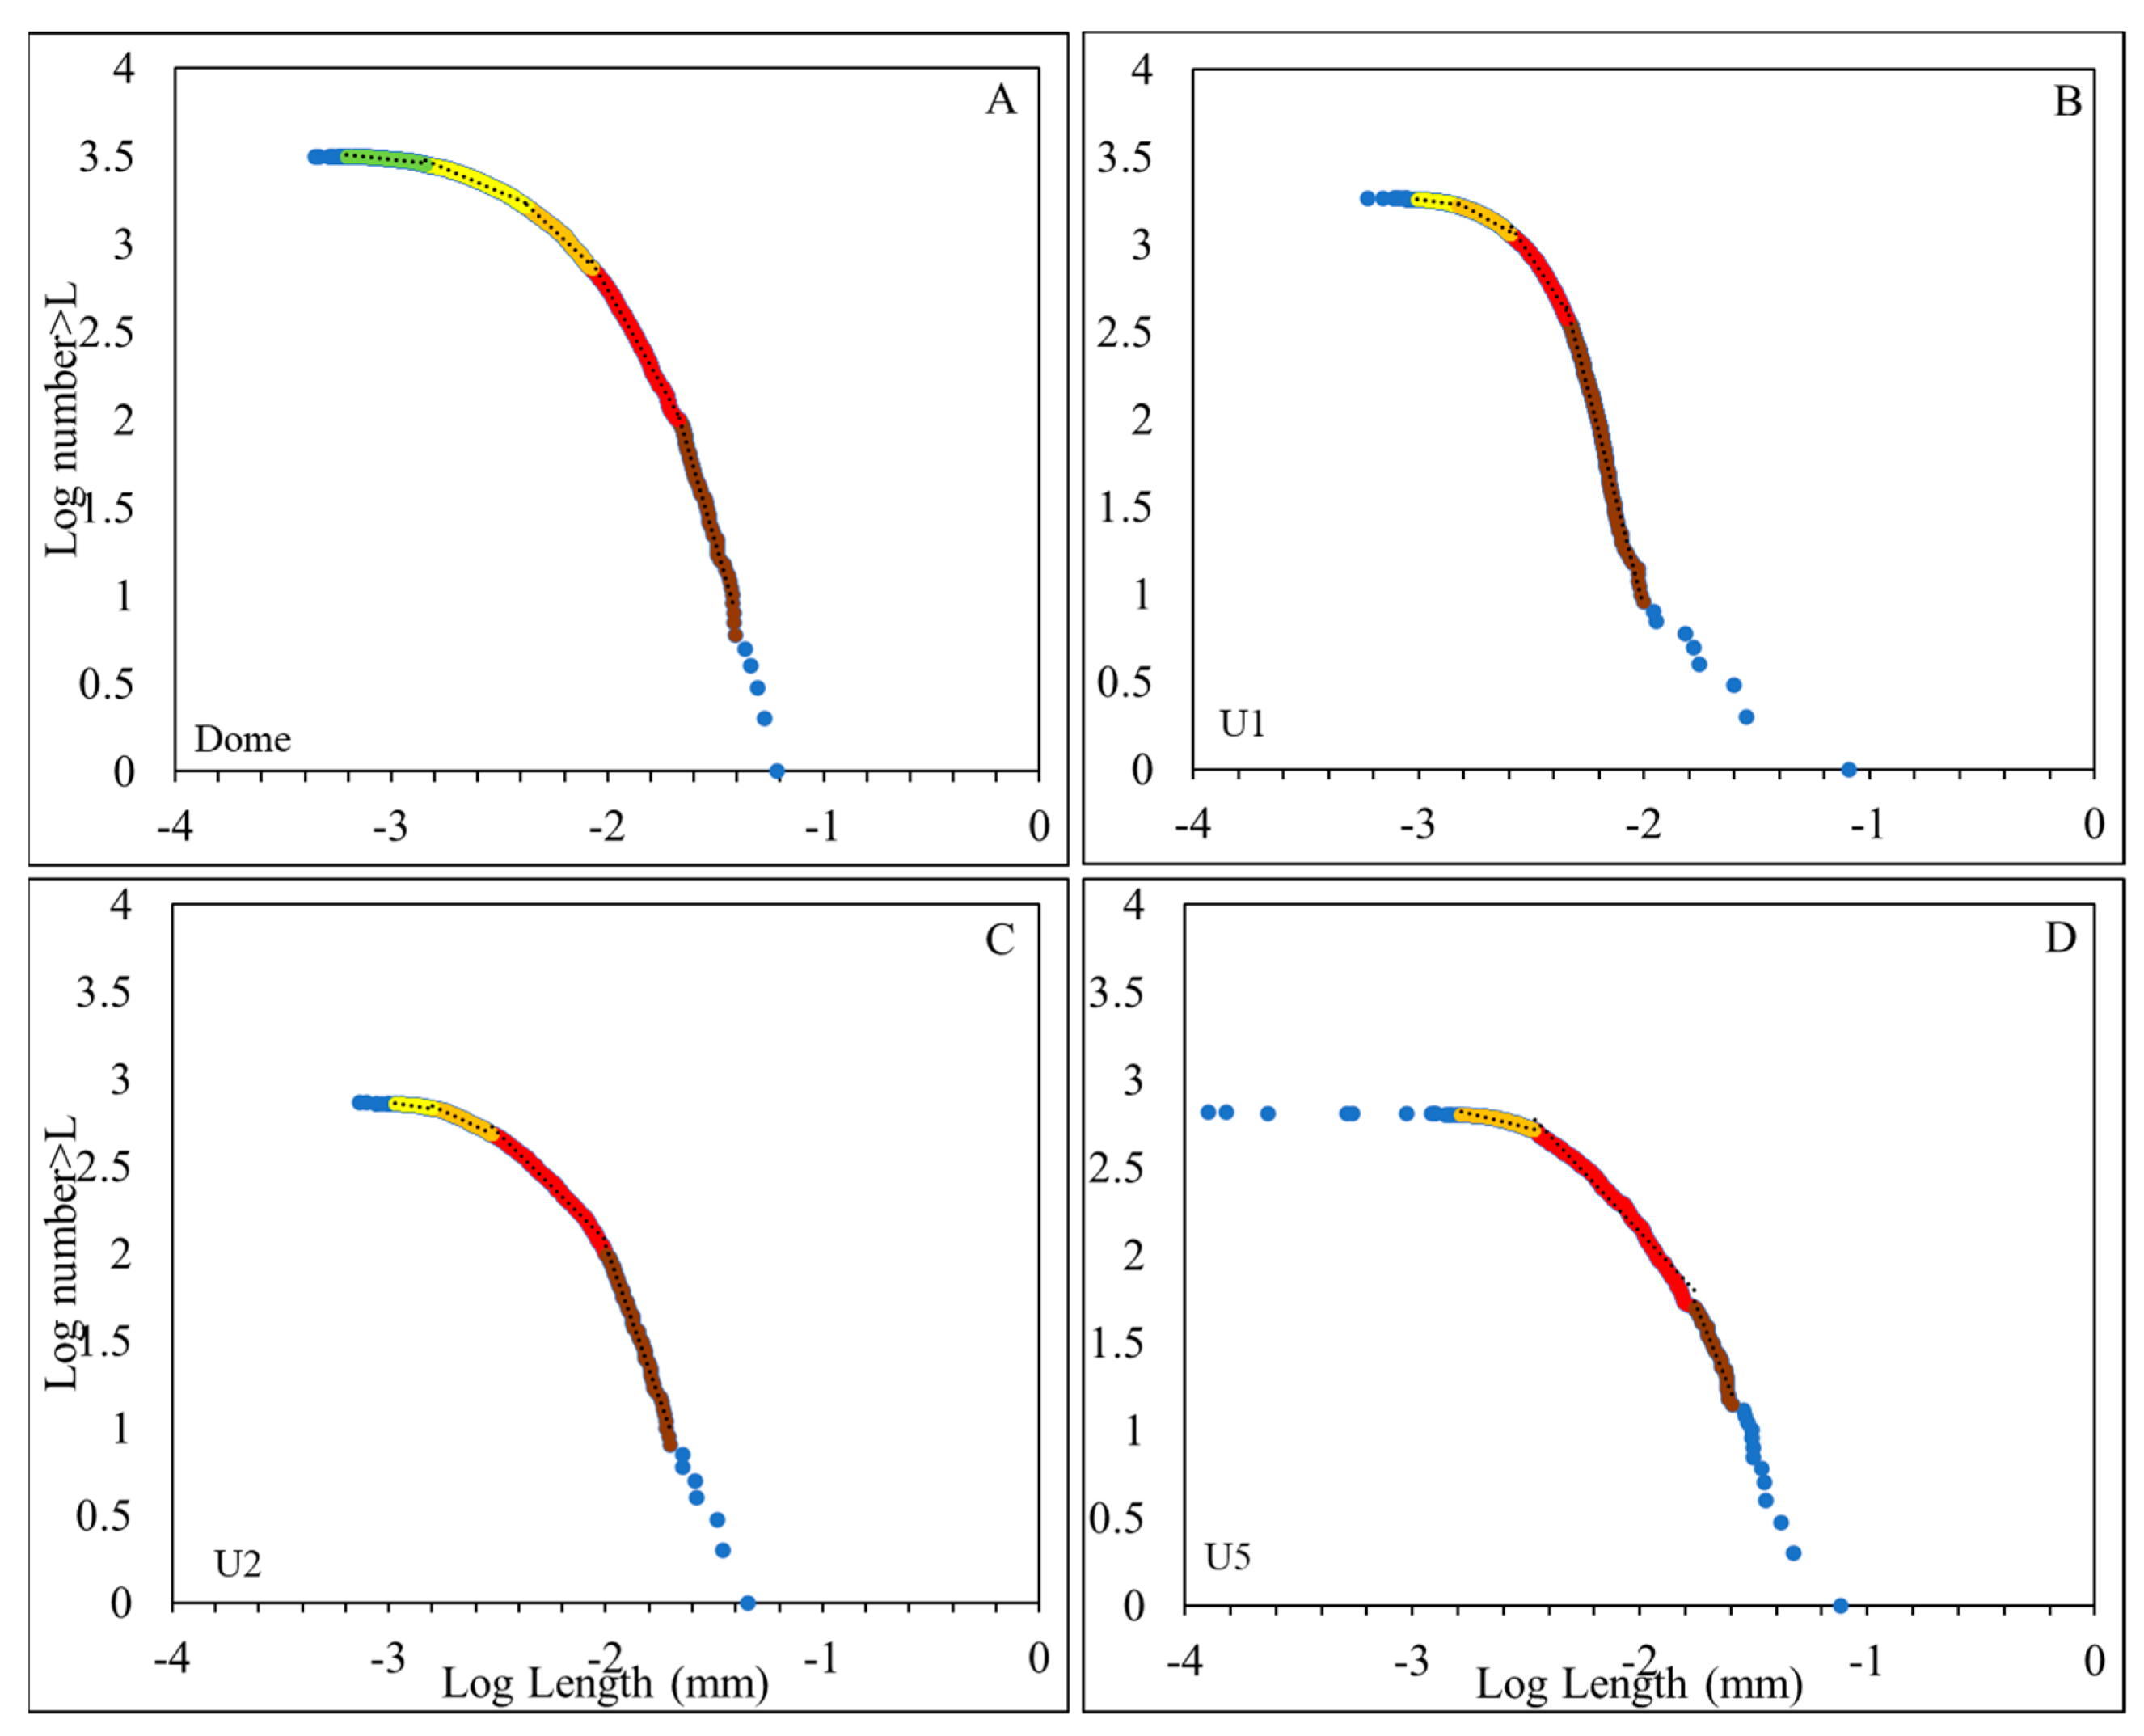
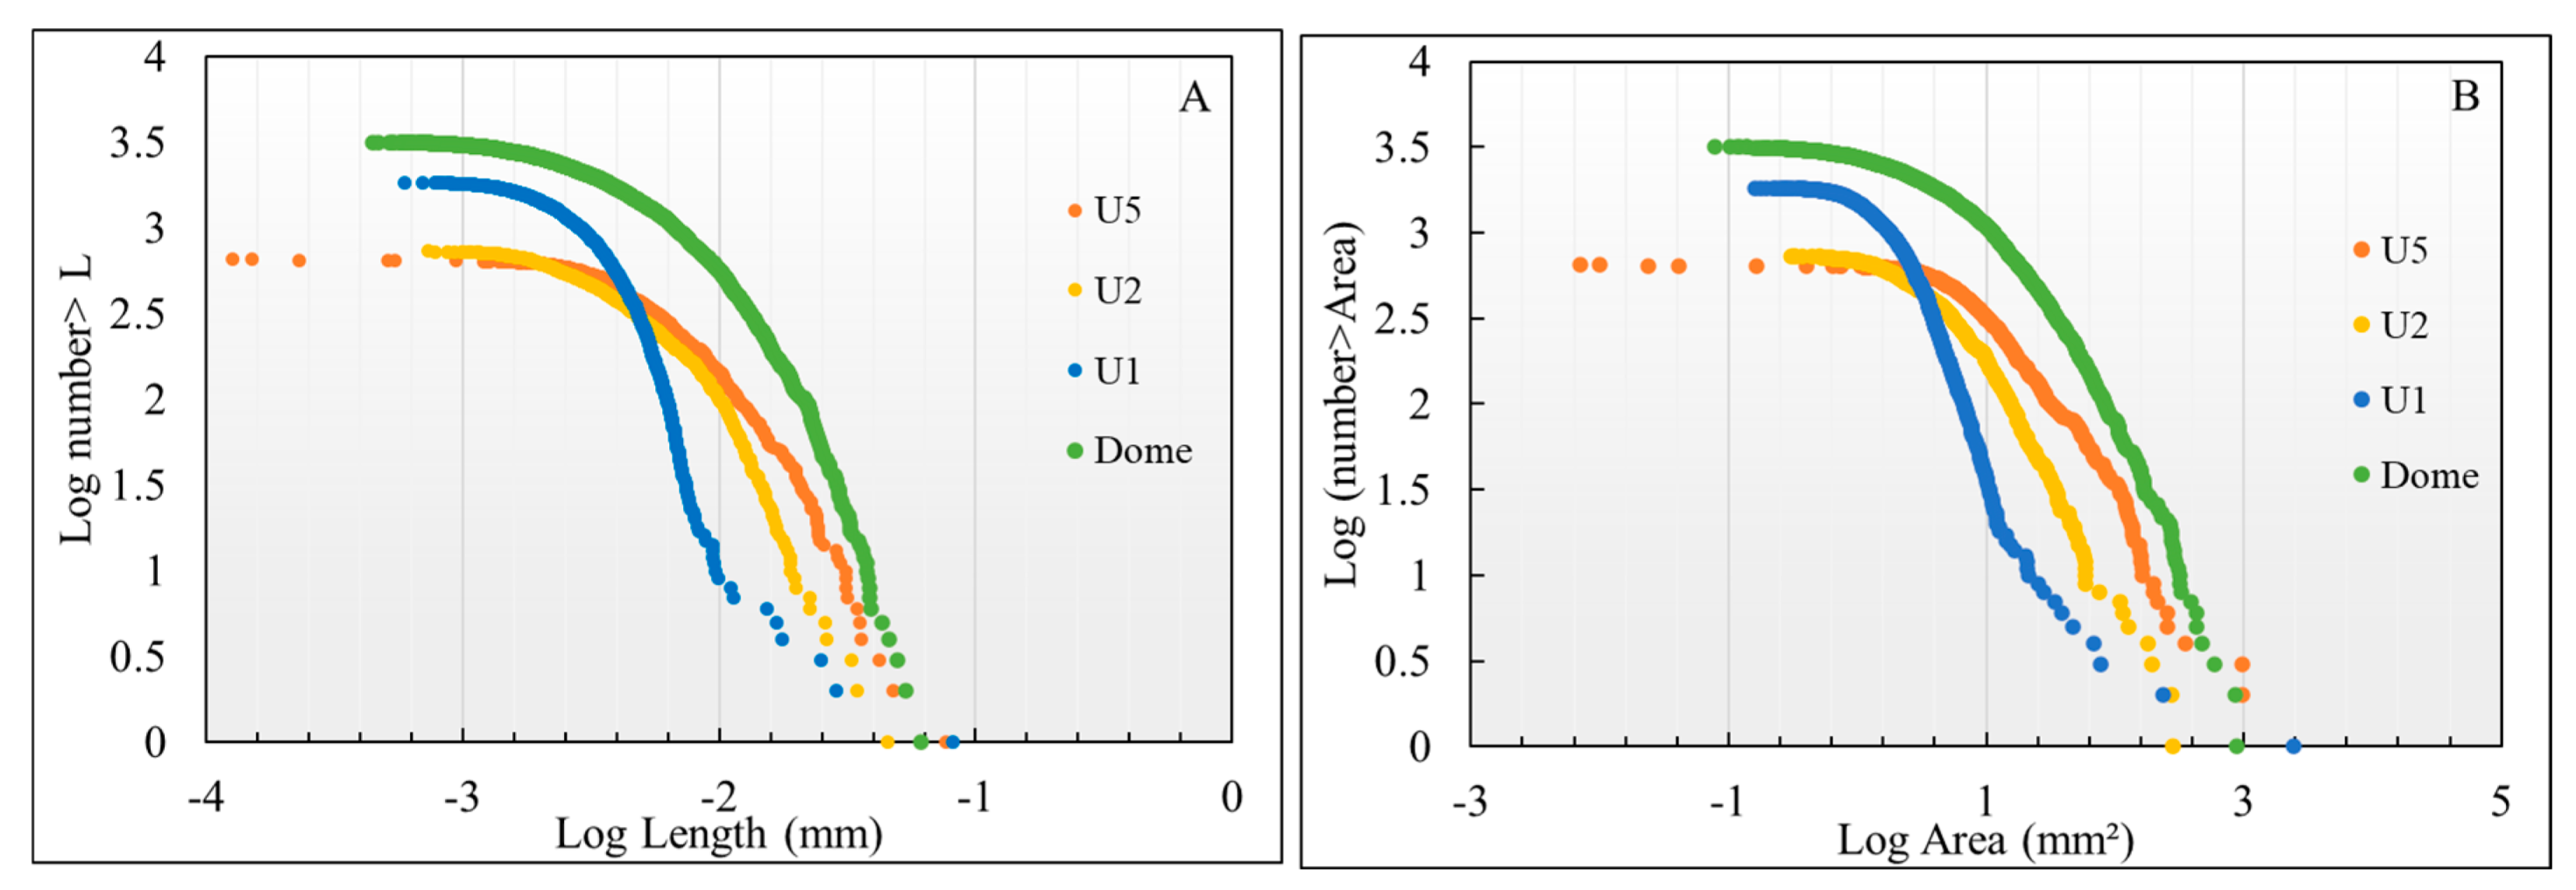
As expected, the plagioclase sizes in the April 2021 eruption of the La Soufrière volcano, St Vincent [43], show distinctive trends depending on the stratigraphic position of the eruptive product (Figure 6 and Table 5). The dome sample displays six thresholds, with a higher percentage of the groundmass crystals falling within the thresholds of 0.001, 0.004, 0.008, and 0.02 mm. The scoria sample from the first explosions (U1) has more crystallinity compared to other explosive deposits, with crystal sizes distributed across four thresholds in a different distribution pattern from subsequent samples. The U5 sample from the latest explosions demonstrates four thresholds and the lowest crystallinity, featuring a heterogeneous distribution of crystals larger than 0.03 mm.

3.3. Multifractal Analysis of Numerical Modeling Results

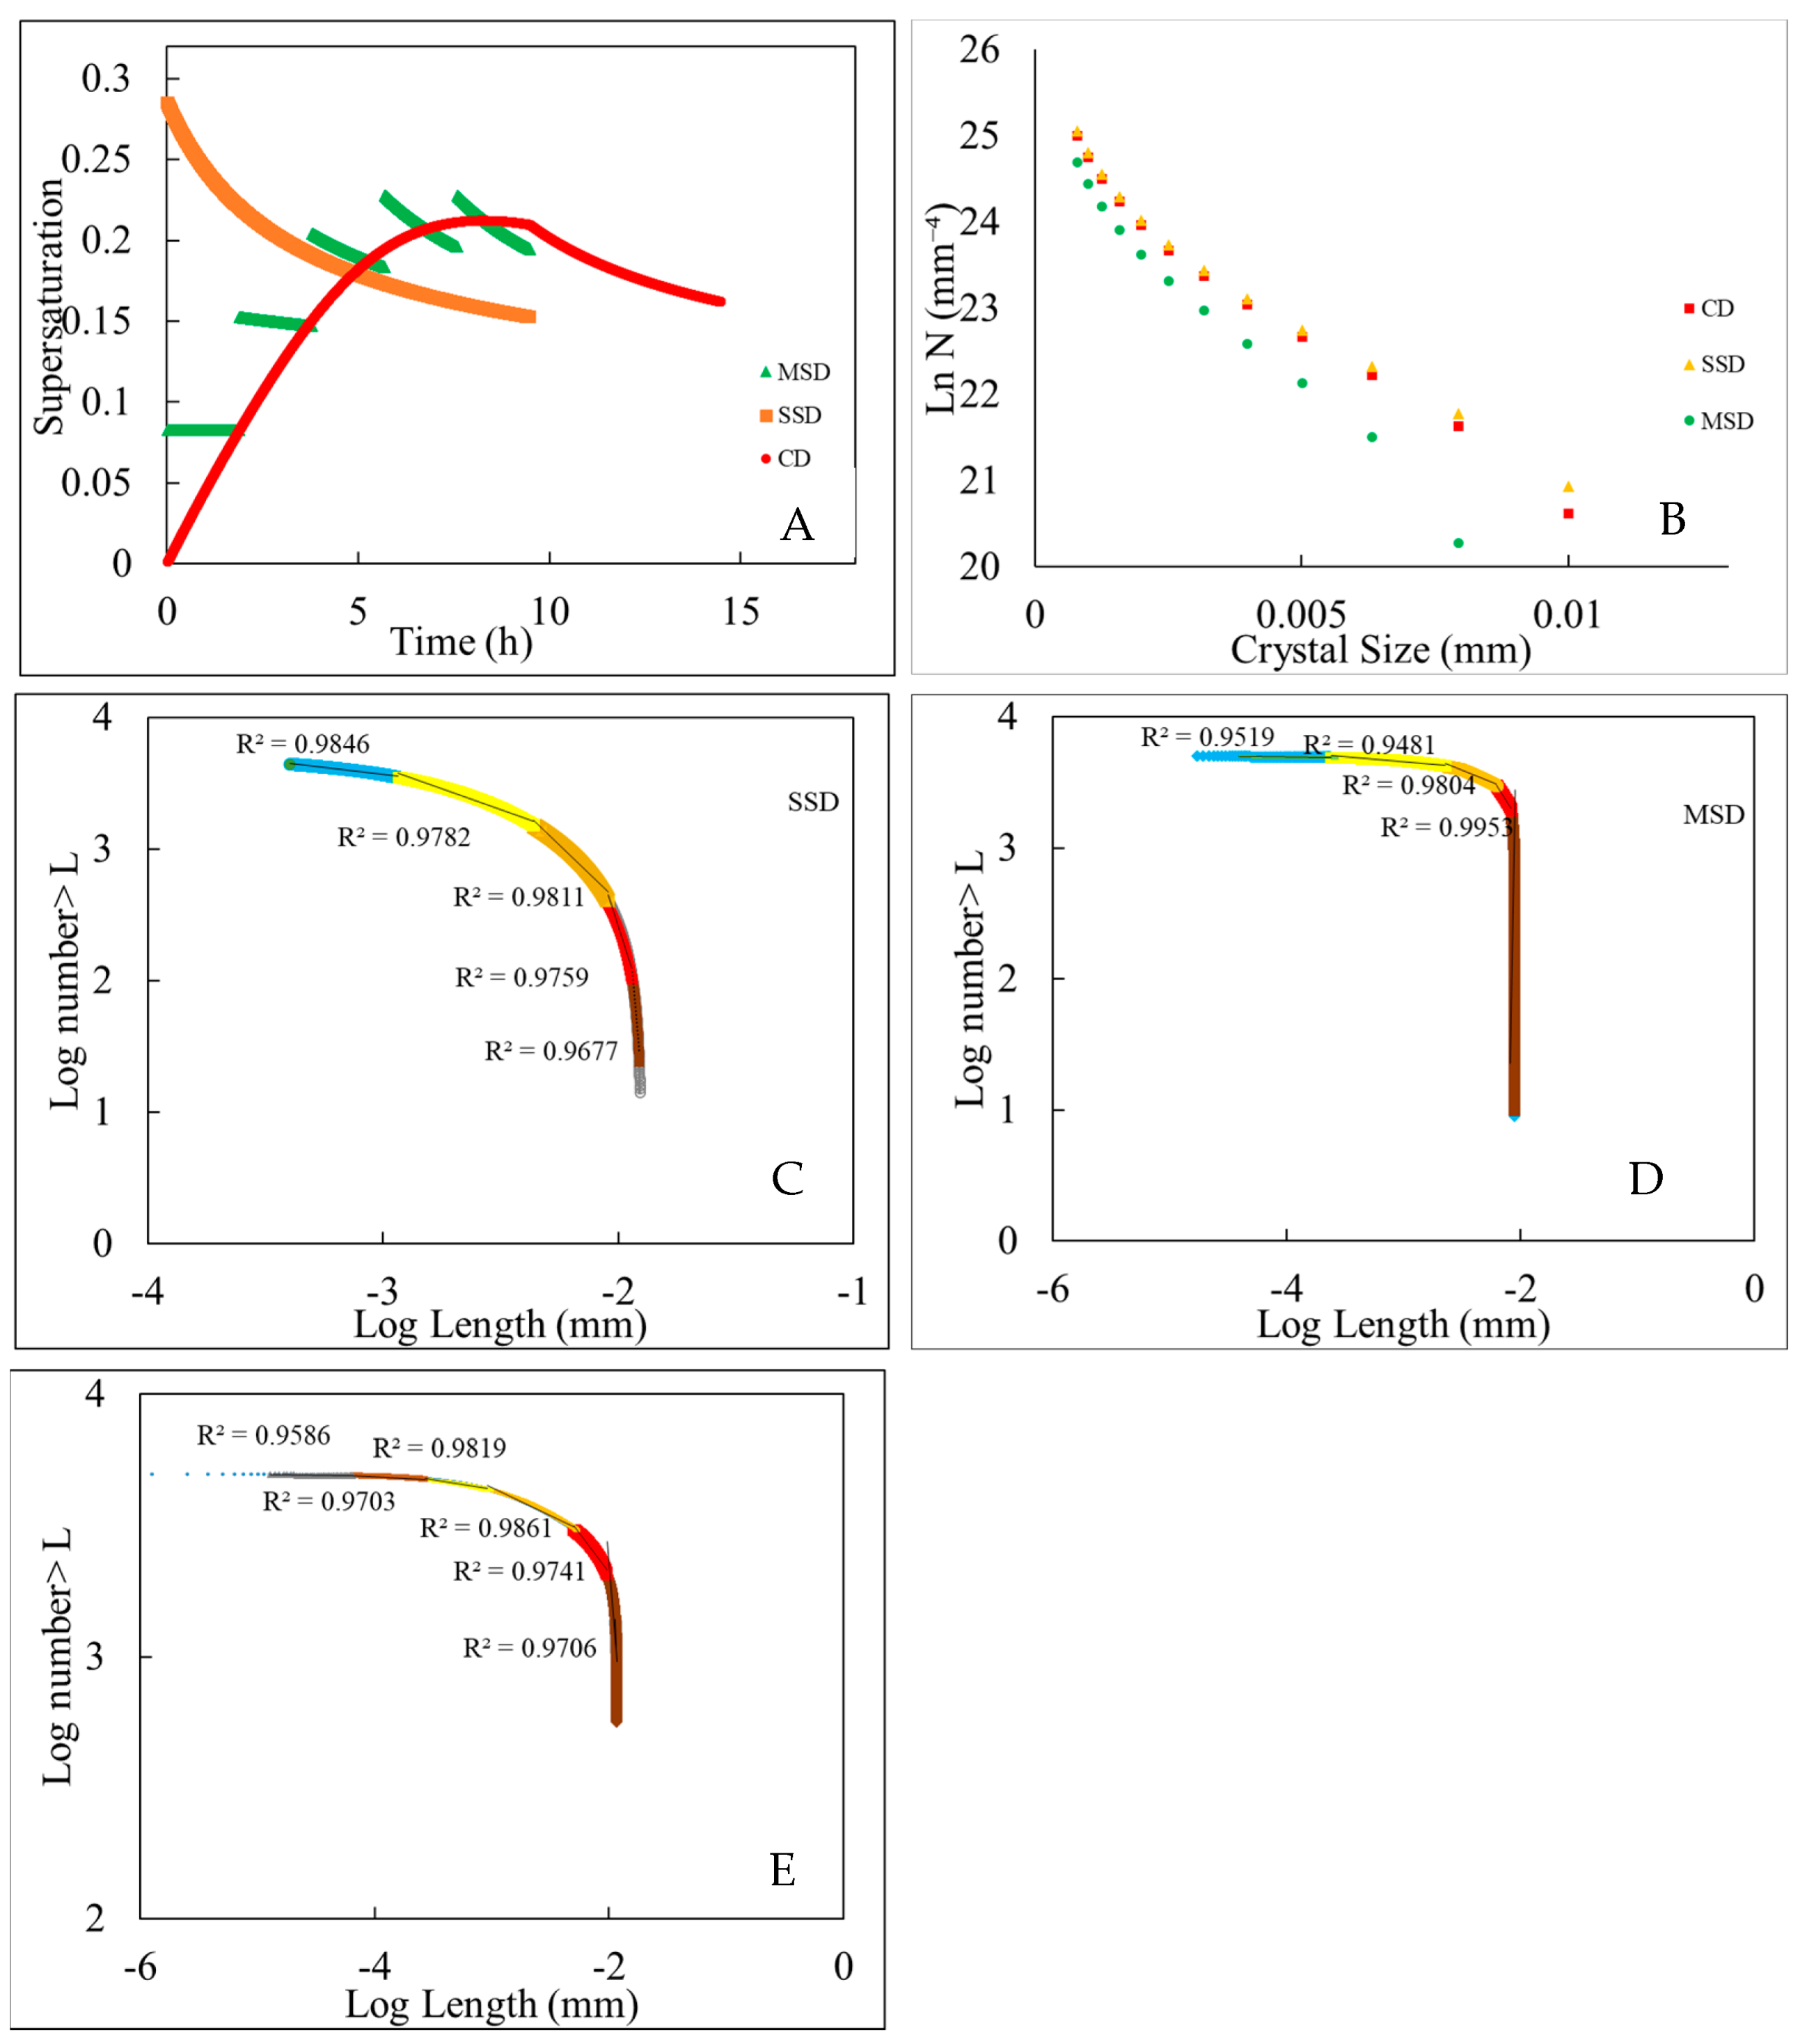
The different thresholds are discriminated on the log–log plots based on the selected decompression rates and styles (Figure 7 and Figure 8). The curves also exhibit different patterns in cases of a change in the decompression path at a given rate (Figure 7) and among the various decompression rates (Figure 8). Due to the very narrow range of microlite sizes and the large number of reported crystals (5000 crystal sizes per numerical model), some parts of the diagram appear as straight lines, with very similar crystal sizes. This is more evident in CD and MSD models at fast decompression rates, while at slow ascent rates and or in SSD models, the more variable range of crystal sizes causes thresholds with more different values. As will be discussed, such variability can be explained by the specific decompression path and subtle supersaturation changes in the initial stages of decompression. At a given decompression rate, more thresholds are needed to classify microlites formed on the CD path than the MSD path, while the SSD path curves require fewer thresholds.
In the case of a decompression rate of 20 MPa h−1, numerical models of CD (with a pause) and SSD show highly similar CSDs (Figure 7B), while the MSD path displays a distinct CSD with a lower population density of larger sizes, as expected due to the lower supersaturation rates in three steps. Although the duration of crystallization in the CD model is higher (15 h due to the pause) than in the SSD model (~10 h), both have the same crystallinity and characteristic microlite size. However, the SSD model produces a smaller number of microlites, with sizes larger than 0.009mm (the second threshold in Figure 7C), compared to the CD model. This difference can be attributed to the longer total time available for crystallization, allowing more growth of early-nucleated crystals in the CD model, and the sharp decrease in supersaturation (Figure 7A), leading to fast nucleation rates during the early stages of crystallization in the SSD model. The results for both the CD and the SSD models are more crystalline than the MSD model results. The results of the SSD style display high crystallinity but more uniformity and a low abundance of microlites with large sizes. In this case, sudden decompression to 30 MPa generates a peak at supersaturation, which causes rapid crystallization. In turn, initial fast nucleation and growth rates yield sharp reductions in supersaturation. Thus, they move into increasingly slower nucleation and growth regimes. The MSD and CD models start with lower degrees of supersaturation and corresponding slow nucleation rates, resulting in the nucleation and growth of a few crystals (less than 1000, compared to 5000 crystals in the final output). The crystallization accelerates by a gradual (CD model) and stepwise (MSD model) increase in supersaturation (Figure 7A). When the supersaturation exceeds 0.2, instantaneous nucleation rates increase, while the fast growth rates tend to lower supersaturation. The supersaturation amounts in the two final steps of decompression in the MSD model extend to a higher value than the CD model. However, a 5 h hold time at 30 MPa in the CD model favors an episode of growth of pre-existing and newly nucleated crystals. This results in more thresholds with larger values in the size discrimination of microlites generated from CD modeling.
The generated CSDs from 5, 20, and 50 MPa h−1 with ten hours of pause at 80 MPa show high similarities, with slight curvatures, which can be divided into two linear segments (Figure 8C). However, the CSD of the slowest decompression rate has a gentler slope in larger sizes, although these CSDs do not fully reflect the non-linear variation in the supersaturation response to decreasing pressure (Figure 8A). As expected, according to the established crystallization theory, the crystallinity and microlite number density increase as the decompression rate decreases. The changes in microlite sizes are more informative when compared to the supersaturation value changes (Figure 8A) and their distribution pattern in log–log plots (Figure 8D). In addition to the shift in the diagram to the upper right side due to the growth of larger crystals at a slow decompression rate, several thresholds can be discriminated for all the models, similar to the CD model results in Figure 7E. However, the positions of the thresholds and the percentage of crystals within them vary, showing correlations with the degree of supersaturation changes. All CD modeling starts with low levels of supersaturation, resulting in a nucleation delay. As the pressure decreases, a gradual increase in supersaturation and the rates of nucleation and growth occurs. During this stage, a few crystals nucleate and grow, which reach their maximum sizes at the final stages of crystallization because at the following stages, with increasing supersaturation, growth of pre-existing crystals, together with the nucleation of new crystals, are interactive processes. The appearance of thresholds with highly similar values on the right side of the diagram is related to this stage. After reaching a peak in the supersaturation amount that occurs at pressures lower than 100 MPa in all cases (Figure 8B), different decompression rates induce different supersaturation degrees. The fastest decompression rate peaks at a higher supersaturation amount than the other rates, and then, nucleation breasts occur at about 80 MPa. This coincides with the hold time, which favors the growth of pre-nucleated crystals. At a decompression rate of 5 MPa h−1, the supersaturation peak is at lower values than other rates but remains constant at a significant period of decompression, allowing steady crystallization. Most of the plagioclase crystallization occurs at pressures lower than 100 MPa (mainly 80–30 MPa), in agreement with relevant experimental studies. In fast decompression rates, the melts reach these pressures in a short time; therefore, the threshold between larger microlites (the right side of the diagram) and the newly nucleated crystals at low pressures lies at a smaller value (0.0079 mm at a rate of 50 MPa h−1 in comparison to 0.0089 mm at a rate of 20 MPa h−1). However, at the slowest decompression rate, at which large crystals grow and record substantial crystallization, this threshold, which marks the trigger of new nucleation, lies at a larger value (0.01 mm).

4. Discussion

The process of crystallization involves both crystal nucleation and nuclei growth, with their rates dictated by magma supersaturation, which provides the thermodynamic drive for crystal formation. In the case of cooling-driven crystallization, supersaturation is described by effective undercooling (ΔTeff), which is the temperature difference between the magma and its saturation temperature. For decompression-driven crystallization, supersaturation (Δf) for any particular phase is defined as the difference between the equilibrium crystallinity (e.g., the crystallinity at the starting pressure) and the crystallinity of the phase of interest at given pressure–temperature conditions [9,40,44,45,46,47].
The abundance and size distribution of crystals in igneous rocks are determined by relative rates of crystal nucleation (J) and growth (G) [40,48]. When the level of supersaturation or undercooling amount is high, nucleation is a dominant process, while the lower amount leads to the growth of pre-existing crystals [49,50]. Crystallization serves to decrease supersaturation and drive systems toward equilibrium. At a given overall crystallinity, a fast nucleation process results in the formation of numerous small crystals. Conversely, when growth occurs at a limited number of sites at a high rate, it leads to the production of fewer but larger crystals [11]. We suggest that the thresholds in the multifractal analysis of size distribution are pivot points at which a probable change in J/G ratio occurs during crystallization as a result of supersaturation or undercooling changes. The number of thresholds and their value, the number and percentage of crystals between two successive thresholds, and the comparison of the overall pattern of distributions in a series of temporally or spatially taken samples could all help to deduce petrological information regarding crystallization history, which will be discussed by several examples in the following sections. The number and percentage of crystals in each interval (between two neighboring thresholds) and size differences among them determine the length and slope of each interval, which are also good indicators of the extent of crystallization on the specified condition. As the crystallization progresses, the size-dependent growth of previously nucleated crystals and the nucleation of new crystals occur, which, depending on the time available for crystallization and the domination of the nucleation or growth regime, different scenarios would be possible [10,11,40]. The textures produced by kinetic crystallization are further modified by dynamic and/or equilibrium processes [13]. As the system approaches equilibrium, e.g., at very slow cooling rates or a long duration of crystallization, post-growth modifications such as the coarsening, agglomeration, and coalescence of crystals, further modify the size and area of crystals [10,49] and their distribution; hence, more thresholds appear at large size intervals. However, the higher number of thresholds does not necessarily mean the more physical processes acted on magmatic plumbing systems. It is possible that microlites formed during slow decompression and a nucleation-dominated regime, creating more thresholds than the whole assemblage of crystal sizes formed in cooling-driven crystallized samples such as sills (e.g., Figure 4 and Figure 5). Therefore, to interpret the thresholds and patterns of curves in log–log plots, first, we should check whether crystallization occurred under a nucleation-dominated or a growth-dominated regime and during isothermal decompression or variable effective undercooling.
The main assumption in CSD theory is exponential nucleation at a constant growth rate. However, several studies demonstrate that in an igneous crystallization medium, as multicomponent systems, nucleation and growth rates (usually in a non-linear manner) vary with time, pressure, and/or temperature in response to variable supersaturations [8,9,10,11,40,46]. The variation in supersaturation has been illustrated by experimental studies of decompression-induced crystallization, which have been performed under various conditions at variable rates and styles (Figure 7 and Figure 8). The recent advancements in acquiring real-time experimental data, e.g., 4D X-ray microtomography have also revealed that both nucleation and growth can occur as multiple pulses with variable rates [50,51].

4.1. Cooling-Driven Crystallization

Several thresholds discriminate among the crystal sizes of experimentally solidified samples [10,41]. This is in contrast to their CSD diagrams, which are fitted with one or two regression lines. The variations in threshold numbers at variable cooling rates are closely related to factors controlling experiments and can be explained with processes mentioned in the original paper [10]. The early studies of CSD suggested that for closed-batch-system crystallization due to cooling, the shape of CSD diagrams is linear as a result of the exponential increase in nucleation rate with time and undercooling at a constant growth rate, which can be used to derive the nucleation rate and duration of crystallization [1,2,4]. However, the authors of [10] showed evidence of fluctuations in the nucleation rate of plagioclases in their experimental studies. Other studies confirm that neither nucleation nor growth rate could be considered constant during a cooling event [8,10,52,53]. The nucleation may occur as multiple pulses [41,51,52,53], and the growth rate may depend on crystal sizes [53] during crystallization.
The evolution of crystal sizes due to a decrease in cooling rate with time, as suggested for natural systems [42], cannot be applied to the constant cooling rate experiments to explain a progressive increase in crystal sizes from the highest to the lowest quenching temperatures in a given cooling rate experiment (Figure 1, Figure 2 and Figure 9). It is worth noting that in the 0.2 °C/h cooling experiments, the delay in the nucleation of plagioclases occurred until 1140 °C; hence, at the first quenching temperature (1139 °C), nucleation and growth occurred in a short period of time (5 h). Thus, the thresholds can be ascribed to multiple nucleation events, followed by growth. In this case, due to slow cooling and a long crystallization time for the lowest quenching temperature (1109 °C), crystal growth is more dominant than nucleation according to theories of nucleation and growth, yielding additional thresholds at large sizes. Although the time needed for the 0.2 °C/h experiment at a quenching temperature of 1109 °C is much longer (155 h) than the quenching temperature of 1139 °C, the percentages of small crystal sizes (below the threshold value of ~0.1 mm) do not decrease significantly. This suggests that nucleation pulses may occur until the final stages of crystallization due to cooling, as observed experimentally [50,51]. This may also imply that the effect of Ostwald ripening (decreasing the number of small crystals at the expense of the growth of the large crystals) at constant cooling rates is negligible in a timescale of the experimental conditions, as suggested by [54]. Size-dependent growth is a better explanation for the coarsening of both small and large crystals with variable rates, as can be seen in the overall pattern of the bi-logarithmic diagrams (Figure 9A). This is also confirmed when the overall patterns of size distributions are compared at the various quenching temperatures. The spacing between the intervals of the larger sizes is significantly greater than that between the smaller sizes, indicating a more rapid growth rate for larger crystals in comparison to smaller ones (Figure 9A). In the 1 °C/h cooling rate experiments, the number of crystals larger than the threshold of 0.09 mm increased, and the number of crystals smaller than this threshold decreased in the sample quenched at a temperature of 1139 °C compared to the sample quenched at 1109 °C, leading to a rotation in the bi-logarithmic diagram (Figure 9B). However, the size distribution patterns of middle quenching temperatures do not follow this trend. The first quenching temperature at this cooling rate generated a high number of crystals (1606 crystals), while, at the middle quenching temperatures (1129 and 1119 °C), the number of crystals decreased abruptly (754 and 845 crystals) and then increased slightly at the lowest temperature (1181 crystals). Both middle quenching temperatures have the lowest number of crystals smaller than the threshold of 0.09 mm. Although the number of crystals larger than this threshold is also at the lowest at 1129 °C, the highest number of large crystals can be seen at a quenching temperature of 1119 °C. These discrepancies clearly show that the nucleation and growth rates change non-linearly during constant cooling depending on the duration of crystallization. In addition to size-dependent growth, decreasing the number of small-sized crystals could be a result of crystal aggregation due to the high fraction of crystals at the initial stages of crystallization at this cooling rate.
The 3 °C/h cooling rate experiments show an increasing trend in the number of medium-to-small-sized crystals (<0.1 mm), from the highest (1139 °C) to the lowest quenching temperature (1109 °C), which yields more thresholds at these sizes (Figure 2). However, the number and size of larger crystals do not change significantly between these quenching temperatures. These variations are opposite to the exponential increase in the nucleation rate at a constant growth rate during cooling. At the first quenching temperature, there is a short time (5 h) for crystallization. However, the faster cooling rate causes faster nucleation and growth rates [50], and, even in the shorter duration of in situ 3D time-dependent experiments, the nucleation and growth were reported to be multiple pulses. These observations support the occurrence of thresholds as a discriminator of crystal sizes at fast cooling rates (Figure 2 and Figure 9). On the other hand, the middle quenching temperatures (1129 and 1119 °C) produced the highest number of small-to-large-sized crystals and, consequently, more thresholds. At high cooling rates (3 °C/h), the nucleation-dominated regime could lead to a high number density of small crystals, increasing the chance of the coalescence of neighboring crystals, which was also observed in situ in the experimental samples [10]. This crystal agglomeration (also called synneusis) process can lead to a diversity of crystal sizes in all cooling rate experiments, especially at the high cooling rate and lower quenching temperatures, which can be inferred from several thresholds (Figure 2) and the overall patterns of the size distribution (Figure 9) in our study and concave-up CSDs with two linear segments. Moreover, textural observations during experiments [10,49] including touching crystals, the coalescence of neighboring crystals, and the evolving shape of crystals that support crystal agglomeration. The comparison of bi-logarithmic diagrams from various cooling rates at a given quenching temperature suggests the evolution of crystal sizes with increasing undercooling. The number and percentage of medium to large crystal sizes (larger than a threshold value of 0.1 mm) increase from a fast to a slow cooling rate, reaching the highest values at the slowest cooling rate (Figure 9D). At the lowest quenching temperature (1109 °C), the 0.2 °C/h cooling experiment sample has fewer thresholds at sizes <0.1 mm than the 1 °C/h and 3 °C/h experiments and more thresholds at sizes >0.1 mm. These differences may indicate that in the final rock texture, the early transient textures may disappear [10,49] due to the occurrence of time- and size-proportionate growth or post-growth modifications, such as crystal agglomeration, overgrowth and/or Ostwald ripening. On the other hand, the number of crystals with sizes smaller than a threshold of ~0.1 mm and the number of thresholds increase with an increase in undercooling. However, depending on the quenching temperature and the time available for crystallization, the proportion of crystal sizes and the number of thresholds slightly vary in the 1 °C/h and 3 °C/h experiments.
The semi-straight line obtained for the 1 °C/h experiment [41] shows that not all the number–length analyses on the crystal sizes lead to curves within which the thresholds could be discriminated. The long duration of this experiment (21 days) provided sufficient time for crystallization to reach equilibrium. It is noteworthy that these experiments have been conducted at higher superliquidus temperatures and longer dwell times above the liquidus, than the experiments [10] described earlier. Both of these parameters have a strong effect on the crystal sizes and their distribution, causing a delay or even preventing nucleation. The arbitrary distinction of the three plagioclase size classes in the 7 and 60 °C/h experiments [41] is somewhat consistent with the discriminated size classes in our proposed method, suggesting that there were at least three nucleation pulses [10,51] in all the cooling rate experiments. The size-dependent growth and coarsening of crystals due to Ostwald ripening and overgrowth were more effective at slower cooling rates, which resulted in a decrease in small crystals and can be demonstrated by the smoothing of lines in the diagrams from high cooling to slow cooling rate experiments (Figure 10) and vanishing thresholds in the 1 °C/h experiment. The scattered pattern of population density versus the size of the crystals (CSD diagrams (Figure 3)) supports the non-linear nucleation and growth rates and post-growth modifications of crystal sizes.
The emplacement of sills is mainly followed by cooling-driven crystallization; hence, the case is somewhat similar to the cooling experiments mentioned above. Using multifractal analysis on the size data of the Beacon Sill samples (Figure 4 and Table 3) confirmed the oscillatory behavior of the number density of crystals akin to the population density vs. stratigraphic position diagram. The lower number density of crystals and the number of thresholds (Table 3) in the AZ-03 sample from the Beacon Sill is consistent with crystallization in a nucleation-dominated regime due to the initial emplacement of the sill in cold country rock. Toward the inner parts of the sill, as expected, the coarsening of crystals is evident from the texture and crystal sizes (samples AZ22 and AZ23 in Figure 4 and Figure 11), which yields additional thresholds in sizes >0.6 mm (the maximum size of crystals in AZ-03). This trend is consistent with the normal coarsening of the crystals from the chilled margin toward the center of the intrusion. However, the AZ24 sample deviates from the normal coarsening trend. This suggests that the additional threshold in the AZ-24 sample appeared in smaller sizes but not in large sizes, which is probably a result of a nucleation burst. These results confirm the occurrence of fine textures inside the sill (Figure 11), which was interpreted as a renewing magma injection event and cooling in a nucleation-dominated regime.
While there is an expectancy that fine-grained samples (for instance, those taken from the margin of the sill) should display a straight line in either the CSD or the fractal diagram, the occurrence of pre-existing phenocrysts (i.e., antecrysts) in mushy magma may perturb the size distribution of crystals that result from fast cooling rates [40,42]. The deviation of large size classes from the main curve of the fractal diagram confirms the different crystallization mediums for these crystals (Figure 4 and Figure 11). Moreover, the idea of simply ignoring the curvatures in small and large class sizes (i.e., downward kinking in the left part of the CSD and flattening in large class sizes containing a small number of crystals) and assuming a linear CSD (to obtain the slope and intercept) has been challenged [42] because these parts of the CSD may have important petrological interpretations. The fractal analysis method introduced in this study highlights all parts of a crystal size distribution pattern, and as suggested by [42], the crystal number density within size thresholds could be considered individually for a series of samples taken temporally or spatially to investigate textural evolution.

4.2. Decompression-Induced Crystallization

During the ascent of magma through the conduits, crystallization is mainly controlled by decompression and degassing, whose rate and pathways profoundly affect microlite nucleation and growth [9,11,12,44,45]. The main factor controlling supersaturation is the decompression rate and final pressure and thus, the time available for crystallization. However, several styles of decompression have been proposed, including SSD, MSD, and CD with pauses, accelerations, or decelerations [11] which also have a strong effect on microlite textures.
Several thresholds for the microlite size data (0.001–0.1 mm) of the 1980–1986 Mt. St. Helens dome samples (Figure 5) are consistent with extensive groundmass crystallization during a slow ascent rate (~2 MPa/h) and shallow stalling before the eruption [20]. During decompression, the growth of pre-existing crystals substantially changes the size distribution [40,44,45], shape, and volumetric proportion of crystals, which is more evident in slow rates and single-step decompression (SSD) paths [9] or in cases with anneal duration [19,40,44,45,47] or pauses along a shallower path [55,56,57]. This rim growth gave rise to a separate population of crystals (additional thresholds at larger sizes), which produced CSDs with marked curvature and concavity-up in experimental studies. However, linear CSDs were reported for the microlites (groundmass plagioclase crystals) of the eruptive products of the 1980–1986 Mt. St. Helens samples [4,6].
The higher number density of crystal lengths confined within 0.002 mm to 0.03 mm and discrimination of four thresholds in this size range in slow-ascent-rate samples (Figure 5 and Figure 12 and Supplementary Figure S4) in comparison to higher-ascent-rate samples suggests that nucleation and growth during slow ascent were quasi-continuous [11,20] or multi-step with stalls at shallower depths [56,57] and that nucleation and growth rates varied with decompression path [12,19], which is also supported by an extensive range in crystal shape. In contrast, the higher-ascent-rate sample shows fewer thresholds at sizes smaller than 0.1 mm (Figure 5), suggesting the suppression of nucleation during ascent with a probable nucleation burst at a shallow depth. Generally, at a given size range of 0.001–0.1 mm, samples crystallized due to decompression show a higher number of thresholds compared to cooling-driven crystallized samples. This is in agreement with the experimental studies that noticed that at higher degrees of undercooling and the nucleation-dominated regime, the nucleation rates are higher for decompression than cooling due to slower diffusivities or larger nucleation barriers in the cooling runs [58].
The number and position of discriminated thresholds in numerical modeling results (Figure 7 and Figure 8) can be explained by the decompression rate and style and thus, the supersaturation variation (since other effective parameters, including pre-existing crystals, melt composition, and temperature, are assumed constant in all models). At the fastest decompression rates, which lead to less crystallization and greater supersaturation in short-duration experiments, the position of thresholds shifts toward smaller size values because of the domination of the nucleation regime. However, since the fastest nucleation and growth rates also occur at high disequilibrium, i.e., high supersaturation [9,12], the number of thresholds does not change significantly, while the pattern and the position of the thresholds display more variability. At slow decompression rates, at the initial stages of continuous decompression, when supersaturation is very low, slight nucleation occurs with the growth of pre-existing crystals. However, as decompression shifts to lower pressures, the steady change in supersaturation reaches a peak, resulting in faster nucleation and growth rates, with a large fraction of growth also occurring on pre-existing crystals (either phenocrysts or antecrysts).
The styles of the decompression also greatly affect the microlite crystallization in terms of crystallinity and number density [9,11,12] and thus, the number of thresholds and percentage of crystals within intervals. The initial tests using the SNGPlag model [11] for the 1991 eruption of Mount Pinatubo highlight a different number of thresholds and percentages of crystals for various rates and paths of decompression (Figure 7 and Figure 8). Moreover, the patterns of microlite size distribution on log–log plots vary depending on the rate and style of decompression. The correlation of the threshold numbers and distribution pattern with the decompression rate and style can be explained by the supersaturation variation (Figure 7A and Figure 8A), which, in turn, modifies the nucleation and growth rates [11,40,47].
The continuous decompression experiments, along with the results of numerical models (e.g., Figure 7B and Figure 8C), reported non-linear concave-up CSDs [19,47], which are always discriminated into two linear segments. According to the experimental set-ups, these linear segments are interpreted as two crystal populations, which are formed in two distinct nucleation regimes during the annealing period (larger sizes) and decompression (small-sized crystals). During decompression, the observed and measured growth of pre-existing crystals (either antecrysts, phenocrysts, or previously nucleated microlites) substantially changes the size and volume of the crystals and creates separate populations while preventing the nucleation of new crystals. However, the two linear segments of CSDs, i.e., two crystal populations, are in contrast to the supersaturation variation during decompression (Figure 7 and Figure 8). The instantaneous nucleation and growth rates estimated from time-sequential measurements are both faster and slower than the time-averaged value derived from the final experiment alone [9,47], and the nucleation rate is not an exponential function of time. The fluctuating trends of supersaturation are better reflected in the multifractal modeling of crystal sizes (Figure 7 and Figure 8).

4.3. Applications and Volcanic Hazard Implications

The multifractal analysis method is a robust and fast method of classifying crystals based on their size. Some authors, somewhat arbitrarily, classified the raw crystal sizes in their sample before converting them to CSD diagrams to explain the trends produced during crystallization either by cooling [41] or decompression [20]. The normal cooling history of dykes and sills, successive emplacements [43], or the emplacement of lava flows [51] is reflected in the distribution of the size (number of thresholds) and number (percentage within thresholds) of crystals if systematic sampling is conducted. The comparison of the overall pattern of size distribution in log–log plots (Figure 9, Figure 10 and Figure 11) could also provide valuable insights in this regard. The study of the evolution of groundmass crystallization during eruptive episodes and syn-eruptive crystallization history could be one of the most fruitful applications of multifractal analysis of microlite sizes since there are marked differences regarding the number of thresholds and percentage of microlite sizes among the erupted materials depending on the rate and style of magma ascent and abundance of the pre-existing crystals [11,20].
The different distribution patterns of microlite sizes might be related to alternative periods of effusive and explosive activities. This can be seen in time-series samples of the explosive eruptions of the La Soufrière volcano, St Vincent in April 2021 [43]. Each dome sample, i.e., the sample from the first phase of the explosive eruption and subsequent eruptions, has a specific style of size distribution in log–log plots for plagioclase microlites (Figure 6 and Figure 13). In this case, the compositional mapping of microlites provided the opportunity to track the variation in size and composition as a result of variable ascent and decompression. The dome sample represents extensive groundmass crystallization due to the slow ascent rates. This is characterized by a gradual change in the size and area distributions of crystals in log–log plots (Figure 13) and the appearance of more thresholds (Figure 6). Moreover, the growth of pre-existing crystals (sizes > 0.02 mm) with a diverse compositional range [43] can be inferred from the occurrence of two thresholds at 0.04 mm and 0.02 mm in the dome sample. There were a few crystals larger than 0.04 mm in this sample and other tephra samples, which have a scattered distribution that deviates from the main data trend. According to the original paper, these crystals are phenocrysts and antecrysts that were entrained from earlier crystal-rich melt batches.
The U1 sample from the first explosions exhibits a different pattern of cumulative size distribution and crystal area, along with fewer thresholds compared to the dome sample. This indicates a change in the crystallization regime due to faster ascent rates and the assembly of early-formed microlites with a compositional difference (an inherited population of microlites) from the vent. However, the U1 sample has higher crystallinity than the samples from subsequent explosive phases (U2 and U5) and more thresholds than the U5 sample, resulting in a distinct distribution pattern. Although more thresholds of U1 are found in groundmass crystals (<0.01 mm), the other samples contain more crystals that are larger than 0.02 mm. This is evident from a threshold at about 0.02 mm and another at 0.03 mm in the U5 diagram. The additional threshold between 0.02 and 0.03 mm can be explained by a mixed population of microlites. However, crystals larger than 0.03 mm are probably related to the higher incorporation of glomerocrysts and xenocrysts. On the other hand, the faster ascent rate during the final explosions (U2 and U5, i.e., representative samples) has been reported based on the seismic and petrological data, including the more vesicular texture of eruptive deposits. Such fast ascent rates are also reflected in the lower amount of the groundmass crystals and fewer thresholds of the U5 sample compared to the other samples. The cause of variation in decompression rates and stalling times might be the presence of temporary plugs in the conduit, which acted as a barrier to further ascent and led to over-pressurization.
If the proposed multifractal size discrimination is combined with the phase compositional mapping [6] of microlites and current progress in tracing nanolites [59], we can distinguish the cycles of crystallization in the upper conduits, which might help to anticipate the future behavior of magma plumbing systems.

4.4. Multifractal and CSD Methods: Limitations and Future Trends

The power-law size distribution of crystals has also been documented in CSD diagrams as linear trends in Ln (crystal number > size) versus Ln (size) [6,28,60]. While multifractal behavior can also be deduced if there is an acceptable size range of crystals, there was no documented attempt in this regard because of the low number of reconstructed size bins in CSD diagrams. The significant difference between this approach and our proposed N-LoC fractal method is the use of population densities in the former case and raw 2D measured lengths and widths in the latter case. This difference arises from the grouping of the size data; that is, when they are converted from raw measurements to 3D size data by stereological methods, they are defined as crystal numbers for different size bins [3]. This grouping of size data leads to the availability of a few crystal numbers (a maximum of 10 in our case), which is considerably lower than the grouped raw size data based on our proposed method.
To reconstruct classic CSD diagrams, a constant shape for all crystals is always assumed [61], regardless of the range of sizes and how they appear in microscopic images. However, this assumption has been challenged by several authors [10,20]. The changes in crystal shapes in a unique sample should be considered while constructing CSDs because of the diagrams’ sensitivity to shape factors. The other assumptions, such as corrections for the cut-section effect and intersection probability effect, have been reported to be sources of error in CSD reconstruction, especially for the smallest sizes [19,44,45].
There are also limitations regarding the application of the multifractal analysis method (Table 5). The first limitation is the number of measurements, which should be more than 250 crystals to provide a statistically meaningful result, akin to the CSD analysis [62,63]. However, to ensure capturing the entire textural evolution and reliable results, it is recommended to involve more than 500 measurements with a full range of crystal sizes in each sample in multifractal analysis. Examples of failure in thresholding in log–log plots can be seen in the XP13 quenched experiments [10] with a small number of crystals (less than 150 measurements). The second limitation is related to the shape of the crystals. While the shape factor is not a prerequisite for multifractal analysis, we surmise that the method is more suitable for crystal sizes with tabular to equant shapes because highly acicular shapes may display a different number of thresholds for the length and width of the crystals. More research should be performed to prove the effect of the crystal’s shape. In the future, combining the number–length method with other measurements, such as the area and volume of crystals, could resolve the probable shortcomings in the variation in the length and width of crystals. We replaced the length of the crystals with the area of the crystals in the log–log plots of the La Soufrière volcano samples (Figure 13), which yielded highly similar results in terms of the number of thresholds and patterns of distribution. A direct comparison of CSDs from 2D and 3D measurements revealed that the cumulative area distribution in 2D closely mirrors the cumulative volume distribution in 3D [40,63] For the natural volcanic systems with a complex history of crystallization, encompassing a large range of crystal sizes, from nanolite to macrocrysts [64], there is a need for a complete database of measurements to infer the process of crystallized magmatic products. However, such an extensive range of measurements has rarely been performed for a volcanic system to validate the model. The main advantages and limitations of both CSD and multifractal analysis method are presented in Table 6.
The main shortcoming of both CSD and multifractal analysis methods is distinguishing the large crystals as one or a few populations (e.g., Figure 4). While phenocrysts larger than 0.1 mm might experience different growth events and crystallization history [18,65], considering them as a single population (for instance, to infer residence times by assuming a constant growth rate) is highly misleading [40]. Therefore, a more precise interpretation of size distributions and their links to a specified process will be obtained when these data are substantiated with background geological information, qualitative petrographical observations, crystal chemistry, and derivative-intensive variables [66]. Further data, including microisotopic analysis on minerals [67], are necessary to identify sources of crystal population and enrich reconstruction models of the storage, ascent, and emplacement of the magma plumbing system [40,68].

5. Concluding Remarks

The analysis of the size distribution of plagioclase crystals using the introduced multifractal method provides a reliable tool for the fast delineation of crystal populations based on all the raw geometrical measurements. However, interpreting the results and threshold numbers and values requires additional information, including the background of the crystallization medium, textural information, and the chemistry of the studied samples, akin to the CSD method. The linear CSDs should not always be interpreted as an exponential increase in the nucleation rate at a constant growth rate. Instead, several thresholds in the multifractal analysis are in agreement with the proposed variable nucleation rates, multiple nucleation events, and size-dependent growth in simple cooling and decompression-driven crystallization experiments and in natural samples. The variability of threshold numbers and the percentage of crystals within them, as well as the overall pattern of the data in log–log plots, can be used to evaluate the temporal evolution of cooling in dykes and sills, and the rate and style of decompression-induced microlite crystallization. Understanding the textural evolution during transitions in the activity of volcanoes could be a potential application to help anticipate future activities.
The results of the synthesized data from a range of documentation show that the number of thresholds does not necessarily indicate the diversity of geological processes; as shown in the constant cooling rate experiments, only stepwise nucleation pulses and size-dependent growth can produce several thresholds. The number of thresholds primarily relies on the number of nucleation pulses, which, in turn, depends on changes in the crystallization medium due to cooling or decompression and the rate of perturbations in pressure and temperature. The following pulses of size-dependent growth, dissolution, overgrowth, and post-growth modifications such as Ostwald ripening and the coalescence of crystals dictate the number and position of the final thresholds.
More work is required to prove the applicability of the method for complex magmatic systems. However, based on the current knowledge, both CSD and multifractal analysis methods can only be used to decipher a general view of the crystallization history of large crystals.
To sum up, this study shows that the distribution of crystal sizes in magmatic plumbing systems is a function of nucleation and growth rates, which evolve non-linearly through supersaturation variation, which, in turn, instantaneously changes through the integration of several processes, including magma composition and its initial temperature and storage level, the volatile and crystal content of magma batches, the rate and style of magma ascent, and the time available for the crystallization of stalled magma. Therefore, the distribution of crystal sizes could be evaluated by non-linear mathematical methods, including fractal/multifractal analysis.

Supplementary Materials

The following supporting information can be downloaded at: https://www.mdpi.com/article/10.3390/min14070660/s1.

Author Contributions

Conceptualization, methodology, software, validation, formal analysis, investigation, data curation, A.E. and B.S.; resources, writing—original draft preparation, A.E.; writing—review and editing, visualization, supervision, project administration, A.E. and B.S. All authors have read and agreed to the published version of the manuscript.

Funding

This research received no external funding.

Data Availability Statement

The data obtained and analyzed within the framework of this study are available in the Supplementary Materials and also available from the corresponding authors upon reasonable request.

Conflicts of Interest

Amir Eskandari was employed by Pooyeshgaran Kansar Limited Company. The remaining authors declare that the research was conducted in the absence of any commercial or financial relationships that could be construed as a potential conflict of interest.

Appendix A

To investigate the net effect of kinetic processes, a series of constant cooling rate experiments of basalts have been conducted [10] at constant cooling rates of 0.2, 1, and 3 °C/h, varying initial superliquidus temperatures, and quenching temperatures from 1179 °C to 1109 °C. Their experiments closely resemble closed batch systems. They concluded that all experiments yield CSDs with a log-linear portion in the central part, but in some cases, kinking and concavity-up in the diagrams were reported, as well as a downturn in the left side of the diagram. They ascribed these deviations to other processes, such as heterogeneous nucleation, size-dependent growth, and post-growth modifications, such as Ostwald ripening (the disappearance of small crystals at the expense of the growth of large crystals) and crystal agglomeration.
Ref. [41] conducted a series of crystal size and shape analyses on the experimentally solidified basaltic sample under a wider temperature range (1300 to 800). For slow cooling rate experiments, CSD diagrams for plagioclase were composed of two linear segments with more curvature. The authors suggested that such CSD trends are related to multiple pulses of nucleation, followed by growth and Ostwald ripening, which was confirmed by the downturn of CSD in small sizes. Based on textural data and the occurrence of a 30 m thick interval of fine-grained rock at the sill center, which is opposite to the normal coarsening of crystals toward the center of a sill, the authors of [42] suggested that the emplacement of the Beacon Sill occurred in at least two and probably four stages as multiple reinjections of magma over 100 years. They presented their data as population density versus stratigraphic height, which had an oscillatory pattern. The CSD diagrams for all the samples had a semi-straight line in their central part, with slight kinking from the center of the sill for some samples and downward kinking on their left side.
Synthesizing the data of crystal sizes showed that there is a systematic relationship between the shape of the crystals and their size, for instance, the change in the habit of plagioclases from prismatic in small-sized microlites to tabular in large-sized microlites (length < 0.1 mm) [20]. The application of their program to estimate the crystal habit of the dome-building eruption samples (1980 to 1986 eruptions) from Mt. St. Helens showed four stages for the development of groundmass textures in slow ascent rates and two stages in fast ascent rates. However, CSD diagrams for such samples displayed linear trends for plagioclase sizes smaller than 0.1 mm [6].
To further investigate the results of the introduced method with kinetic information obtained from the experimental studies, we performed numerical modeling of decompression-induced microlite crystallization using SNPlag software [11], which was based on the experimental data [9,12]. This model predicts the nucleation and growth of plagioclase crystals in a decompressing magma as a function of time. To this end, first, the equilibrium plagioclase mode, as a function of pressure and temperature, for a user-defined magma composition is determined using the MELTS web service [69]. Then, the model evaluates the difference between the calculated crystallinity and equilibrium crystallinity for a given pressure and temperature at each time step. This difference is considered to be supersaturation, and then, the estimated degrees of supersaturation are used to set the plagioclase nucleation and growth rates. The output of the model includes total crystallinity, number density, crystal size distribution, and the characteristic size of microlite crystals, as well as a time series of crystallinity, which can be compared to quantitative textures in natural volcanic rocks.
We used the rhyolite sample from the climactic 1991 Pinatubo eruption as the starting material. This composition and the other required inputs were the same as the original experimental conditions upon which the model was built [9,11]. The initial pressure was 220 MPa and the final quench pressure was 30 MPa, with 25 vol.% plagioclase antecrysts (average size of 0.01 mm and a shape factor of a = 0.05), in agreement with the proposed pre-eruptive conditions of the 1991 eruption of Pinatubo [9,56].
To test the effect of decompression rates on crystal sizes and their distribution, the decompression rates of 50, 20, and 5 MPa h−1 were used for continuous (CD) decompression with ten hours of pause at 80 MPa. Moreover, a set of modeling was performed using the assumption of single-step decompression (SSD), multi-step (MSD) decompression with five steps at 38 MPa intervals, and CD with 4 hours of pause at 30 MPa to evaluate the effect of different decompression styles. These rates and styles are close to the estimations made by the textural analysis and experimental studies of the pre-eruptive conditions of the 1991 Pinatubo eruption [9,56].
The La Soufrière volcano, situated on the Eastern Caribbean Island of St. Vincent, displays both effusive and explosive activities. After over three months of effusive eruptions and the growth of a lava dome, an explosive eruption started on April 9th, 2021 [43]. A stratigraphically constrained sampling of the explosive deposits from these series [43] provided the opportunity to do a time-series analysis and verify the application of the proposed method in distinguishing textural variations during the change in the activity of a volcano. This dataset allowed us to compare the size distribution variation of microlites that formed during the lava dome extrusion to those formed during the transition to a series of explosive eruptions in a short timescale (the first 48 h of the deposits from the explosive eruptions). The textural and compositional features of four samples from the initially constructed dome and scoria samples of the subsequent explosive deposits (all with basaltic andesite composition) were measured by [43]; we extracted the raw data from the Supplementary Materials of that paper.

References

  1. Marsh, B.D. Crystal Size Distribution (CSD) in Rocks and the Kinetics and Dynamics of Crystallization I. Theory. Contrib. Mineral. Petrol. 1988, 99, 277–291. [Google Scholar] [CrossRef]
  2. Cashman, K.V.; Marsh, B.D. Crystal Size Distribution (CSD) in Rocks and the Kinetics and Dynamics of Crystallization II: Makaopuhi Lava Lake. Contrib. Mineral. Petrol. 1988, 99, 292–305. [Google Scholar] [CrossRef]
  3. Higgins, M.D. Measurement of Crystal Size Distributions. Am. Mineral. 2000, 85, 1105–1116. [Google Scholar] [CrossRef]
  4. Cashman, K.V. Crystallization of Mount St. Helens 1980–1986 Dacite: A Quantitative Textural Approach. Bull. Volcanol. 1988, 50, 194–209. [Google Scholar] [CrossRef]
  5. Marsh, B.D. On the Interpretation of Crystal Size Distributions in Magmatic Systems. J. Petrol. 1998, 39, 553–599. [Google Scholar] [CrossRef]
  6. Muir, D.D.; Blundy, J.D.; Rust, A.C. Multiphase Petrography of Volcanic Rocks Using Element Maps: A Method Applied to Mount St. Helens, 1980–2005. Bull. Volcanol. 2012, 74, 1101–1120. [Google Scholar] [CrossRef]
  7. Salisbury, M.J.; Bohrson, W.A.; Clynne, M.A.; Ramos, F.C.; Hoskin, P. Multiple Plagioclase Crystal Populations Identified by Crystal Size Distribution and In Situ Chemical Data: Implications for Timescales of Magma Chamber Processes Associated with the 1915 Eruption of Lassen Peak, CA. J. Petrol. 2008, 49, 1755–1780. [Google Scholar] [CrossRef]
  8. Ni, H.; Keppler, H.; Walte, N.; Schiavi, F.; Chen, Y.; Masotta, M.; Li, Z. In Situ Observation of Crystal Growth in a Basalt Melt and the Development of Crystal Size Distribution in Igneous Rocks. Contrib. Mineral. Petrol. 2014, 167, 1003. [Google Scholar] [CrossRef]
  9. Befus, K.S.; Andrews, B.J. Crystal Nucleation and Growth Produced by Continuous Decompression of Pinatubo Magma. Contrib. Mineral. Petrol. 2018, 173, 92. [Google Scholar] [CrossRef]
  10. Pupier, E.; Duchene, S.; Toplis, M.J. Experimental Quantification of Plagioclase Crystal Size Distribution during Cooling of a Basaltic Liquid. Contrib. Mineral. Petrol. 2008, 155, 555–570. [Google Scholar] [CrossRef]
  11. Andrews, B.J.; Befus, K.S. Supersaturation Nucleation and Growth of Plagioclase: A Numerical Model of Decompression-Induced Crystallization. Contrib. Mineral. Petrol. 2020, 175, 23. [Google Scholar] [CrossRef]
  12. Hammer, J.E.; Rutherford, M.J. An Experimental Study of the Kinetics of Decompression-Induced Crystallization in Silicic Melt. J. Geophys. Res. Solid Earth 2002, 107, ECV 8-1–ECV 8-24. [Google Scholar] [CrossRef]
  13. Higgins, M.D. Textural Coarsening in Igneous Rocks. Int. Geol. Rev. 2011, 53, 354–376. [Google Scholar] [CrossRef]
  14. Higgins, M.D. Magma Dynamics beneath Kameni Volcano, Thera, Greece, as Revealed by Crystal Size and Shape Measurements. J. Volcanol. Geotherm. Res. 1996, 70, 37–48. [Google Scholar] [CrossRef]
  15. Witter, M.; Furman, T.; Lafemina, P.; Feineman, M. Understanding Magmatic Processes at Telica Volcano, Nicaragua: Crystal Size Distribution and Textural Analysis. Am. Mineral. 2016, 101, 1052–1060. [Google Scholar] [CrossRef]
  16. Preece, K.; Gertisser, R.; Barclay, J.; Charbonnier, S.J.; Komorowski, J.C.; Herd, R.A. Transitions between Explosive and Effusive Phases during the Cataclysmic 2010 Eruption of Merapi Volcano, Java, Indonesia. Bull. Volcanol. 2016, 78, 54. [Google Scholar] [CrossRef]
  17. Innocenti, S.; del Marmol, M.A.; Voight, B.; Andreastuti, S.; Furman, T. Textural and Mineral Chemistry Constraints on Evolution of Merapi Volcano, Indonesia. J. Volcanol. Geotherm. Res. 2013, 261, 20–37. [Google Scholar] [CrossRef]
  18. van der Zwan, F.M.; Chadwick, J.P.; Troll, V.R. Textural History of Recent Basaltic-Andesites and Plutonic Inclusions from Merapi Volcano. Contrib. Mineral. Petrol. 2013, 166, 43–63. [Google Scholar] [CrossRef]
  19. Brugger, C.R.; Hammer, J.E. Crystal Size Distribution Analysis of Plagioclase in Experimentally Decompressed Hydrous Rhyodacite Magma. Earth Planet. Sci. Lett. 2010, 300, 246–254. [Google Scholar] [CrossRef]
  20. Mangler, M.F.; Humphreys, M.C.S.; Wadsworth, F.B.; Iveson, A.A.; Higgins, M.D. Variation of Plagioclase Shape with Size in Intermediate Magmas: A Window into Incipient Plagioclase Crystallisation. Contrib. Mineral. Petrol. 2022, 177, 64. [Google Scholar] [CrossRef]
  21. Mandelbrot, B. How Long Is the Coast of Britain? Statistical Self-Similarity and Fractional Dimension. Science 1967, 156, 636–638. [Google Scholar] [CrossRef]
  22. Mandelbrot, B.B.; Wheeler, J.A. The Fractal Geometry of Nature. Am. J. Phys. 1983, 51, 286–287. [Google Scholar] [CrossRef]
  23. Bölviken, B.; Stokke, P.R.; Feder, J.; Jössang, T. The Fractal Nature of Geochemical Landscapes. J. Geochem. Explor. 1992, 43, 91–109. [Google Scholar] [CrossRef]
  24. Cheng, Q.; Agterberg, F.P. Multifractal Modeling and Spatial Statistics. Math. Geol. 1996, 28, 1–16. [Google Scholar] [CrossRef]
  25. Cheng, Q.; Agterberg, F.P.; Ballantyne, S.B. The Separation of Geochemical Anomalies from Background by Fractal Methods. J. Geochem. Explor. 1994, 51, 109–130. [Google Scholar] [CrossRef]
  26. De Rosa, R.; Donato, P.; Ventura, G. Fractal Analysis of Mingled/Mixed Magmas: An Example from the Upper Pollara Eruption (Salina Island, Southern Tyrrhenian Sea, Italy). Lithos 2002, 65, 299–311. [Google Scholar] [CrossRef]
  27. Diego, P.; Giampiero, P. Chaotic Dynamics and Fractals in Magmatic Interaction Processes: A Different Approach to the Interpretation of Mafic Microgranular Enclaves. Earth Planet. Sci. Lett. 2000, 175, 93–103. [Google Scholar] [CrossRef]
  28. Armienti, P.; Tarquini, S. Power Law Olivine Crystal Size Distributions in Lithospheric Mantle Xenoliths. Lithos 2002, 65, 273–285. [Google Scholar] [CrossRef]
  29. Peternell, M.; Kruhl, J.H. Automation of Pattern Recognition and Fractal-Geometry-Based Pattern Quantification, Exemplified by Mineral-Phase Distribution Patterns in Igneous Rocks. Comput. Geosci. 2009, 35, 1415–1426. [Google Scholar] [CrossRef]
  30. Sadeghi, B.; Moarefvand, P.; Afzal, P.; Yasrebi, A.B.; Saein, L.D. Application of Fractal Models to Outline Mineralized Zones in the Zaghia Iron Ore Deposit, Central Iran. J. Geochem. Explor. 2012, 122, 9–19. [Google Scholar] [CrossRef]
  31. Sadeghi, B. Concentration-Concentration Fractal Modelling: A Novel Insight for Correlation between Variables in Response to Changes in the Underlying Controlling Geological-Geochemical Processes. Ore Geol. Rev. 2021, 128, 103875. [Google Scholar] [CrossRef]
  32. Sadeghi, B.; Cohen, D.R. Category-Based Fractal Modelling: A Novel Model to Integrate the Geology into the Data for More Effective Processing and Interpretation. J. Geochem. Explor. 2021, 226, 106783. [Google Scholar] [CrossRef]
  33. Sadeghi, B. Concentration-Area Plot. In Encyclopedia of Mathematical Geosciences; Daya Sagar, B.S., Cheng, Q., McKinley, J., Agterberg, F., Eds.; Springer International Publishing: Cham, Switzerland, 2023; pp. 169–175. ISBN 978-3-030-85040-1. [Google Scholar]
  34. Sadeghi, B. Spectrum-Area Method. In Encyclopedia of Mathematical Geosciences; Daya Sagar, B.S., Cheng, Q., McKinley, J., Agterberg, F., Eds.; Springer International Publishing: Cham, Switzerland, 2023; pp. 1398–1403. ISBN 978-3-030-85040-1. [Google Scholar]
  35. Sadeghi, B.; Cohen, D. Concentration-Distance from Centroids (C-DC) Multi-Fractal Model: A Model to Recognize Geochemical Anomalies Based on the Distance of Samples from the Known Mineralization Areas. In Proceedings of the IAMG 2019–20th Annual Conference of the International Association for Mathematical Geosciences, State College, PA, USA, 10–16 August 2019. [Google Scholar]
  36. Sadeghi, B. Simulated-Multifractal Models: A Futuristic Review of Multifractal Modeling in Geochemical Anomaly Classification. Ore Geol. Rev. 2021, 139, 104511. [Google Scholar] [CrossRef]
  37. Agterberg, F. Multifractal Modelling of the Sizes and Grades of Giant and Supergiant Deposits. Glob. Tecton. Metallog. 1996, 6, 131–136. [Google Scholar] [CrossRef]
  38. Sadeghi, B.; Khalajmasoumi, M.; Afzal, P.; Moarefvand, P. Discrimination of Iron High Potential Zones at the Zaghia Iron Ore Deposit, Bafq, Using Index Overlay GIS Method. Iran. J. Earth Sci. 2015, 6, 91–98. [Google Scholar]
  39. Agterberg, F.P.; Cheng, Q.; Brown, A.; Good, D. Multifractal Modeling of Fractures in the Lac Du Bonnet Batholith, Manitoba. Comput Geosci 1996, 22, 497–507. [Google Scholar] [CrossRef]
  40. Cashman, K.V. Crystal Size Distribution (CSD) Analysis of Volcanic Samples: Advances and Challenges. Front. Earth Sci. 2020, 8, 291. [Google Scholar] [CrossRef]
  41. Giuliani, L.; Iezzi, G.; Vetere, F.; Behrens, H.; Mollo, S.; Cauti, F.; Ventura, G.; Scarlato, P. Evolution of Textures, Crystal Size Distributions and Growth Rates of Plagioclase, Clinopyroxene and Spinel Crystallized at Variable Cooling Rates from a Mid-Ocean Ridge Basaltic Melt. Earth Sci. Rev. 2020, 204, 103165. [Google Scholar] [CrossRef]
  42. Zieg, M.J.; Marsh, B.D. Multiple Reinjections and Crystal-Mush Compaction in the Beacon Sill, McMurdo Dry Valleys, Antarctica. J. Petrol. 2012, 53, 2567–2591. [Google Scholar] [CrossRef]
  43. Frey, H.M.; Manon, M.R.; Barclay, J.; Davies, B.V.; Walters, S.A.; Cole, P.D.; Christopher, T.E.; Joseph, E.P. Petrology of the Explosive Deposits from the April 2021 Eruption of La Soufrière Volcano, St Vincent: A Time-Series Analysis of Microlites. Geol. Soc. Lond. Spec. Publ. 2024, 539, 201–230. [Google Scholar] [CrossRef]
  44. Brugger, C.R.; Hammer, J.E. Crystallization Kinetics in Continuous Decompression Experiments: Implications for Interpreting Natural Magma Ascent Processes. J. Petrol. 2010, 51, 1941–1965. [Google Scholar] [CrossRef]
  45. Riker, J.M.; Cashman, K.V.; Rust, A.C.; Blundy, J.D. Experimental Constraints on Plagioclase Crystallization during H2O- and H2O–CO2-Saturated Magma Decompression. J. Petrol. 2015, 56, 1967–1998. [Google Scholar] [CrossRef]
  46. Brandeis, G.; Jaupart, C.; Allegre, C.J. Nucleation, Crystal Growth and the Thermal Regime of Cooling Magmas. J. Geophys. Res. 1984, 89, 10161–10177. [Google Scholar] [CrossRef]
  47. Hammer, J.E. Experimental Studies of the Kinetics and Energetics of Magma Crystallization. Rev. Mineral. Geochem. 2008, 69, 9–59. [Google Scholar] [CrossRef]
  48. Mollo, S.; Hammer, J. Dynamic Crystallization in Magmas. EMU Notes Miner. 2017, 16. [Google Scholar] [CrossRef]
  49. Schiavi, F.; Walte, N.; Keppler, H. First in Situ Observation of Crystallization Processes in a Basaltic-Andesitic Melt with the Moissanite Cell. Geology 2009, 37, 963–966. [Google Scholar] [CrossRef]
  50. Le Gall, N.; Arzilli, F.; La Spina, G.; Polacci, M.; Cai, B.; Hartley, M.E.; Vo, N.T.; Atwood, R.C.; Di Genova, D.; Nonni, S.; et al. In Situ Quantification of Crystallisation Kinetics of Plagioclase and Clinopyroxene in Basaltic Magma: Implications for Lava Flow. Earth Planet. Sci. Lett. 2021, 568, 117016. [Google Scholar] [CrossRef]
  51. Polacci, M.; Arzilli, F.; La Spina, G.; Le Gall, N.; Cai, B.; Hartley, M.E.; Di Genova, D.; Vo, N.T.; Nonni, S.; Atwood, R.C.; et al. Crystallisation in Basaltic Magmas Revealed via in Situ 4D Synchrotron X-Ray Microtomography. Sci. Rep. 2018, 8, 8377. [Google Scholar] [CrossRef]
  52. Burkhard, D.J.M. Nucleation and Growth Rates of Pyroxene, Plagioclase and Fe-Ti Oxides in Basalt [Abs.]. In Eos, Transactions, American Geophysical Union; Wiley: Hoboken, NJ, USA, 2003; Volume 84. [Google Scholar]
  53. Kile, D.E.; Eberl, D.D. On the Origin of Size-Dependent and Size-Independent Crystal Growth: Influence of Advection and Diffusion. Am. Mineral. 2003, 88, 1514–1521. [Google Scholar] [CrossRef]
  54. Cabane, H.; Laporte, D.; Provost, A. An Experimental Study of Ostwald Ripening of Olivine and Plagioclase in Silicate Melts: Implications for the Growth and Size of Crystals in Magmas. Contrib. Mineral. Petrol. 2005, 150, 37–53. [Google Scholar] [CrossRef]
  55. Armienti, P.; Pareschi, M.T.; Innocenti, F.; Pompilio, M. Effects of Magma Storage and Ascent on the Kinetics of Crystal Growth. Contrib. Mineral. Petrol. 1994, 115, 402–414. [Google Scholar] [CrossRef]
  56. Hammer, J.E.; Cashman, K.V.; Hoblitt, R.P.; Newman, S. Degassing and Microlite Crystallization during Pre-Climactic Events of the 1991 Eruption of Mt. Pinatubo, Philippines. Bull. Volcanol. 1999, 60, 355–380. [Google Scholar] [CrossRef]
  57. Cashman, K.V.; McConnell, S.M. Multiple Levels of Magma Storage during the 1980 Summer Eruptions of Mount St. Helens, WA. Bull. Volcanol. 2005, 68, 57. [Google Scholar] [CrossRef]
  58. Shea, T.; Hammer, J.E. Kinetics of Cooling- and Decompression-Induced Crystallization in Hydrous Mafic-Intermediate Magmas. J. Volcanol. Geotherm. Res. 2013, 260, 127–145. [Google Scholar] [CrossRef]
  59. Mujin, M.; Nakamura, M. A Nanolite Record of Eruption Style Transition. Geology 2014, 42, 611–614. [Google Scholar] [CrossRef]
  60. Higgins, M.D. Verification of Ideal Semi-Logarithmic, Lognormal or Fractal Crystal Size Distributions from 2D Datasets. J. Volcanol. Geotherm. Res. 2006, 154, 8–16. [Google Scholar] [CrossRef]
  61. Higgins, M.D. Numerical Modeling of Crystal Shapes in Thin Sections: Estimation of Crystal Habit and True Size. Am. Mineral. 1994, 79, 113–119. [Google Scholar]
  62. Morgan, D.J.; Jerram, D.A. On Estimating Crystal Shape for Crystal Size Distribution Analysis. J. Volcanol. Geotherm. Res. 2006, 154, 1–7. [Google Scholar] [CrossRef]
  63. Jerram, D.A.; Mock, A.; Davis, G.R.; Field, M.; Brown, R.J. 3D Crystal Size Distributions: A Case Study on Quantifying Olivine Populations in Kimberlites. Lithos 2009, 112, 223–235. [Google Scholar] [CrossRef]
  64. Zellmer, G.F. Gaining Acuity on Crystal Terminology in Volcanic Rocks. Bull. Volcanol. 2021, 83, 78. [Google Scholar] [CrossRef]
  65. Jeffery, A.J.; Gertisser, R.; Troll, V.R.; Jolis, E.M.; Dahren, B.; Harris, C.; Tindle, A.G.; Preece, K.; O’Driscoll, B.; Humaida, H.; et al. The Pre-Eruptive Magma Plumbing System of the 2007–2008 Dome-Forming Eruption of Kelut Volcano, East Java, Indonesia. Contrib. Mineral. Petrol. 2013, 166, 275–308. [Google Scholar] [CrossRef]
  66. Cashman, K.; Blundy, J. Petrological Cannibalism: The Chemical and Textural Consequences of Incremental Magma Body Growth. Contrib. Mineral. Petrol. 2013, 166, 703–729. [Google Scholar] [CrossRef]
  67. Morgan, D.J.; Jerram, D.A.; Chertkoff, D.G.; Davidson, J.P.; Pearson, D.G.; Kronz, A.; Nowell, G.M. Combining CSD and Isotopic Microanalysis: Magma Supply and Mixing Processes at Stromboli Volcano, Aeolian Islands, Italy. Earth Planet. Sci. Lett. 2007, 260, 419–431. [Google Scholar] [CrossRef]
  68. Hammer, J.E.; Cashman, K.V.; Voight, B. Magmatic Processes Revealed by Textural and Compositional Trends in Merapi Dome Lavas. J. Volcanol. Geotherm. Res. 2000, 100, 165–192. [Google Scholar] [CrossRef]
  69. Gualda, G.A.R.; Ghiorso, M.S.; Lemons, R.V.; Carley, T.L. Rhyolite-MELTS: A Modified Calibration of MELTS Optimized for Silica-Rich, Fluid-Bearing Magmatic Systems. J. Petrol. 2012, 53, 875–890. [Google Scholar] [CrossRef]
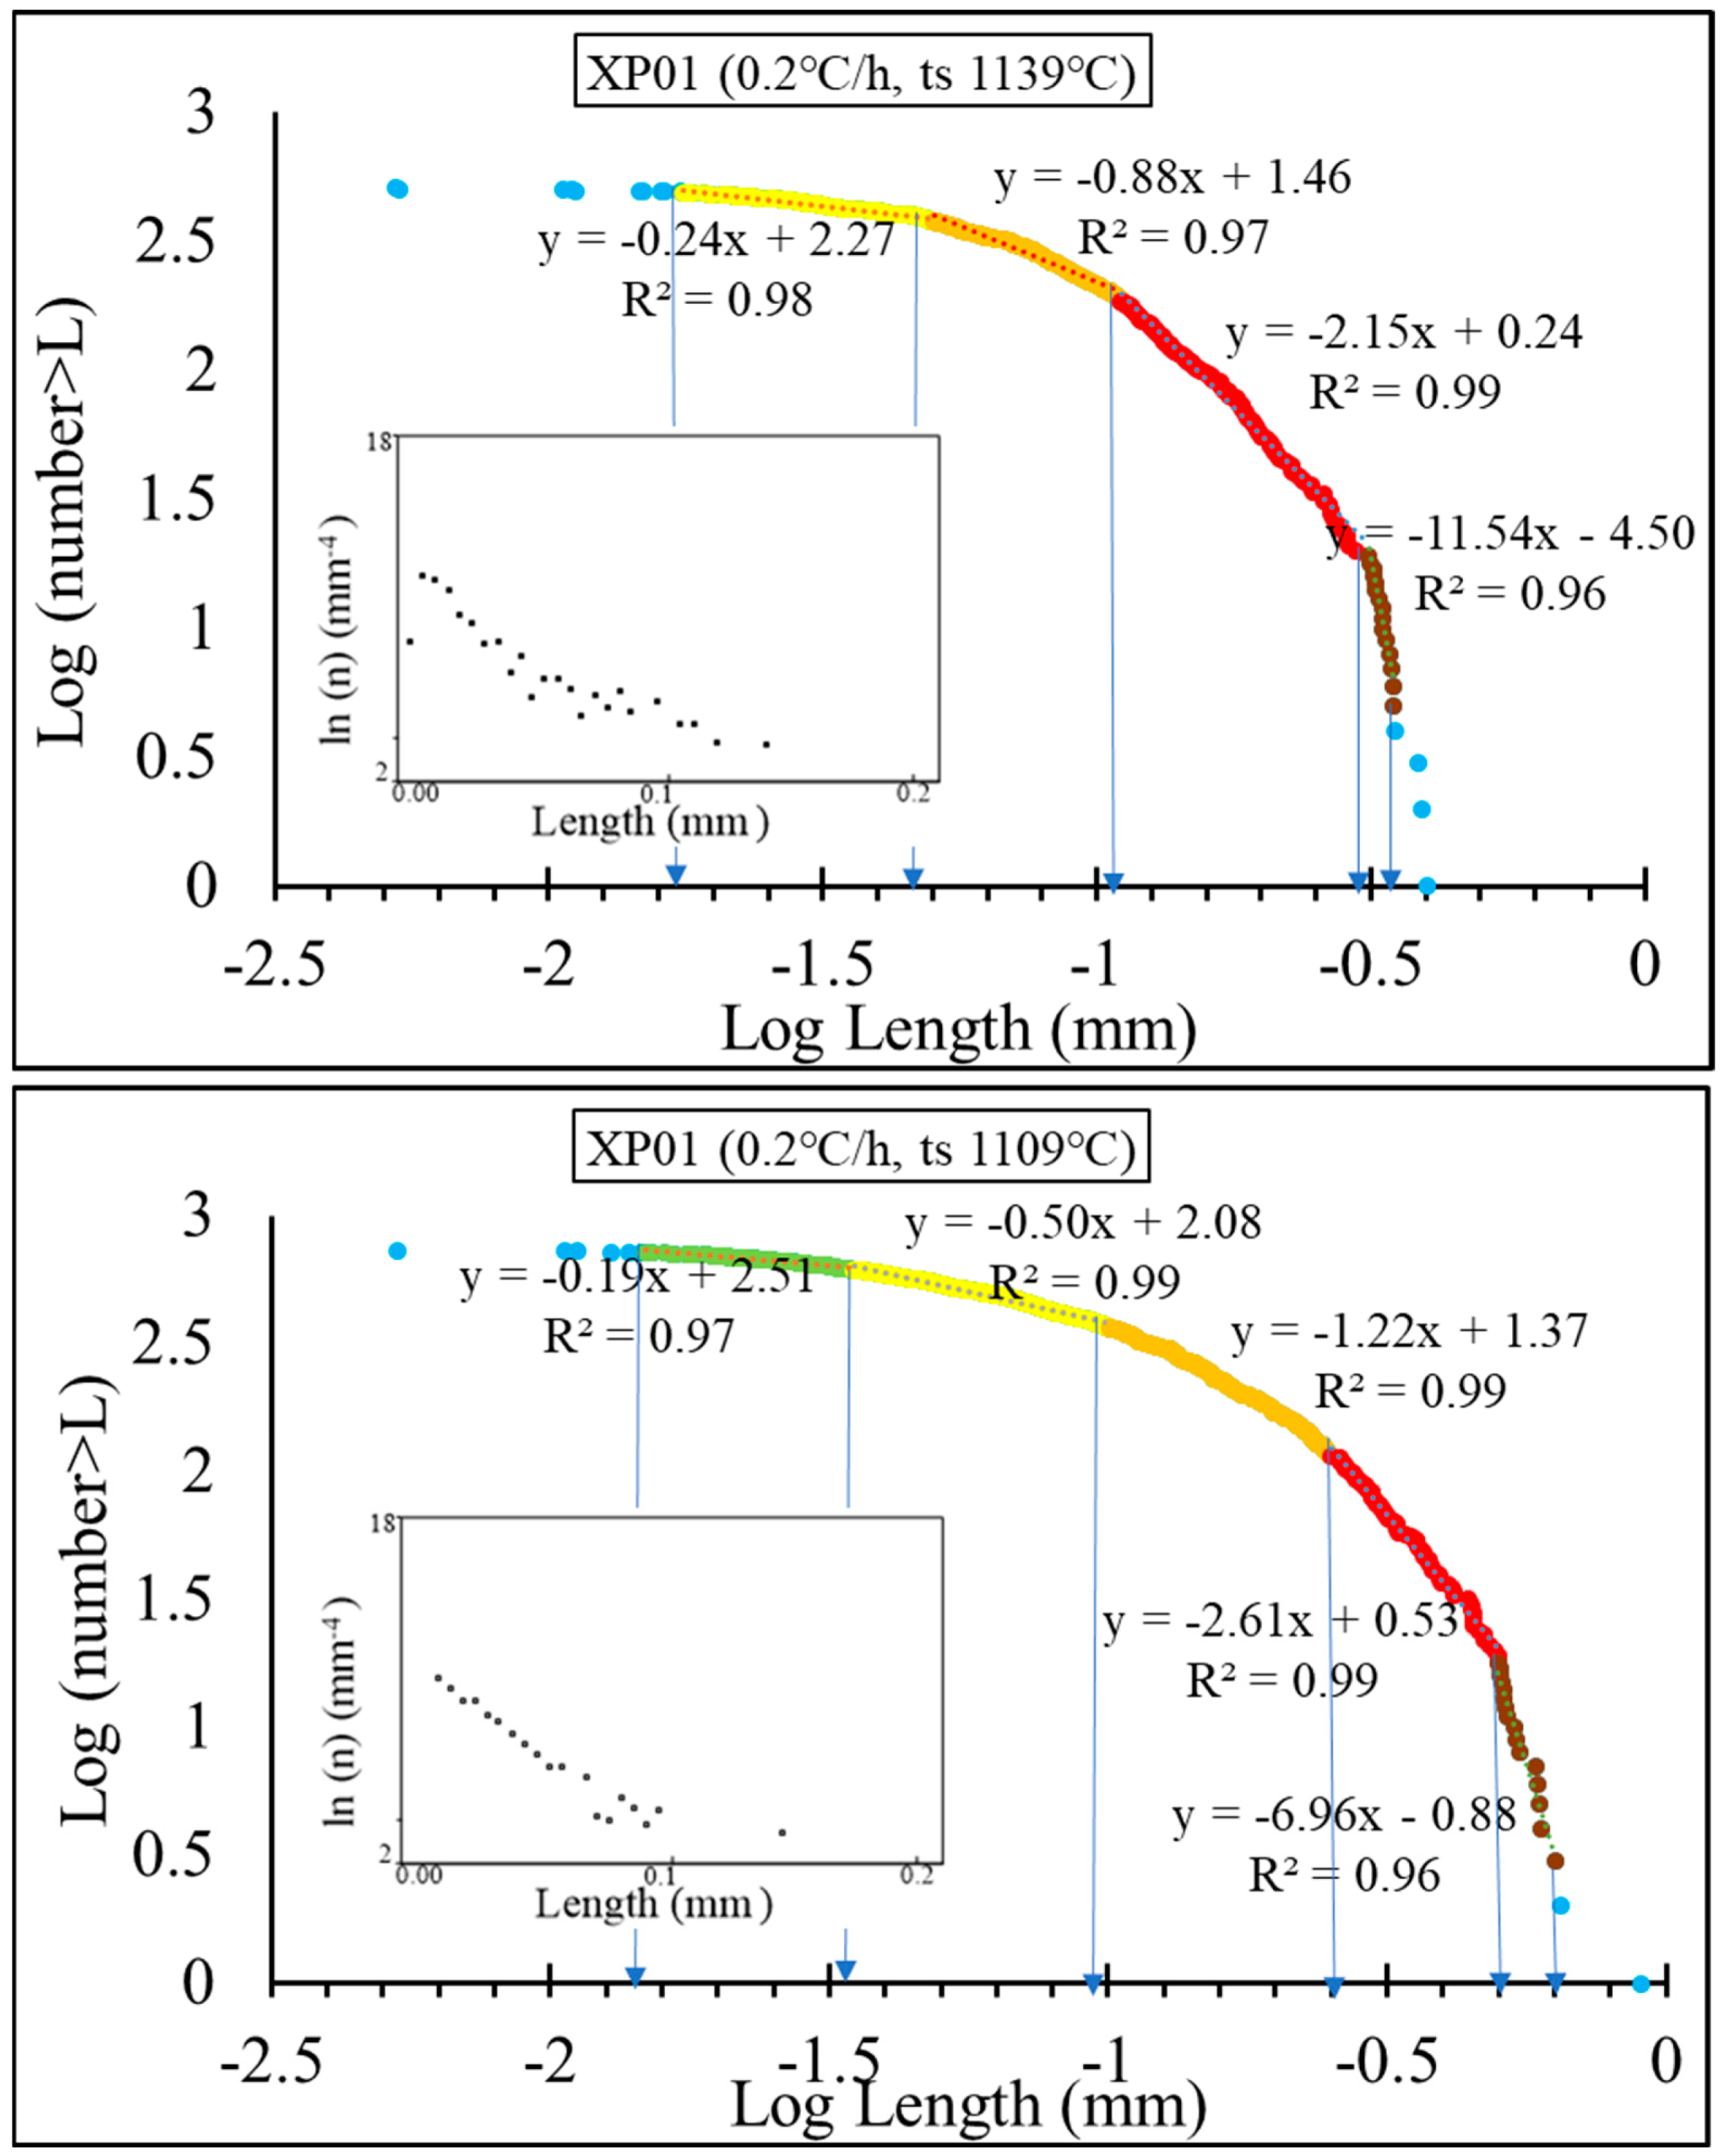
Figure 1. The log–log diagrams and resulting multifractal analysis method for the XP01 experiment [10] (cooling rate of 0.2 °C/h and two quenching temperatures (ts) of 1139 and 1109 °C). The scattered data from the left and right sides of the diagram were excluded to avoid the effect of truncating and censoring. The inset images show the CSD diagrams for plagioclases crystallized in each run of the experiment (redrawn from [10]).
Minerals 14 00660 g001
Figure 2. The results of the multifractal analysis method for the XP07 experiment [10], with a cooling rate of 3 °C/h and quenching temperatures of 1167 and 1137 °C. The inset images show the CSD diagrams for plagioclases crystallized in each run of the experiment (redrawn from [10]).
Minerals 14 00660 g002
Figure 3. (AC) Results of multifractal analysis performed on samples cooled experimentally at 3 cooling rates and their CSD (D), redrawn from [41]. Note the change in curvature from slow to high cooling rate experiments.
Minerals 14 00660 g003
Figure 4. Results of crystal size discrimination based on the number–size fractal method applied to natural samples from the Beacon Sill [42]. The AZ-3 sample is from the chilled margin of the sill. The AZ-22 and AZ-23 are two adjacent samples from the center of the sill, and AZ-24 is a sample with porphyritic texture, adjacent to AZ-23. The inset images show the CSD diagrams for plagioclases crystallized in each run of the experiment (redrawn from [42]).
Minerals 14 00660 g004
Figure 5. N-LoC plots for crystal lengths from samples SH157 (right) and SH226 (left) from the 1984 and 1986 eruptions of Mt. St. Helens. The multifractal modeling of other samples shows high similarities with sample SH157 in terms of the number of thresholds and the length of intervals (see the Supplementary Figure S4).
Minerals 14 00660 g005
Figure 6. Results of crystal size discrimination of plagioclase microlites based on the number–size fractal method in samples from the 2021 eruption of the La Soufrière volcano (data measured by [43]). (A) dome sample. (BD) represent tephra samples from the first (U1), second (U2), and latest explosions (U5). Note the change of interval slopes, threshold values, and size classes between effusive and explosive samples and also among the tephra samples.
Minerals 14 00660 g006
Figure 7. The results of multifractal analysis on microlite size outputs of the decompression-induced crystallization using the SNGPlag model [11]. (A) The variation in supersaturation versus time in response to decompression paths at a decompression rate of 20 MPa h−1. The non-linear changes in supersaturation, which, in turn, define the instantaneous nucleation and growth rates, are evident in the diagram. The composition of the starting material is Pinatubo rhyolitic melt, the selected initial pressure is 220 MPa, and the final quench pressure is 30 MPa. For the SSD model, crystallization is a steady process, but in the MSD, it occurs as a series of pulses following each 38 MPa decompression, and with a 5 h hold time in the CD model. All the other effective parameters including the pre-existing crystals and their shape were consistent (25% vol antecrysts with shape factor a = 0.5). (B) The model-generated CSDs display relatively similar patterns, which can be fitted with one (for the SSD style) or two linear segments. (A) The variation in supersaturation versus time for various styles of decompression. (CE) The results of fractal analysis on the microlite size outputs of the SNGPlag model for the SSD, MSD, and CD styles, respectively.
Minerals 14 00660 g007
Figure 8. The results of the numerical modeling of continuous decompression of Pinatubo rhyolitic melt from 220 MPa to 30 MPa at decompression rates of 5, 20, and 50 MPa h−1, with ten hours of pause at 80 MPa. The other set-ups are similar to the previous models in Figure 7 to avoid the effect of variable size and shape of the pre-existing crystals. (A) The supersaturation variation in 5 (CD5), 20 (CD20), and 50 (CD50) MPa h−1 decompression rates versus crystal size. (B) The pressure (MPa) variation during decompression versus the duration of crystallization (hours). (C) The CSD outputs of the SNGPlag model. The slowest decompression rate creates higher crystallinity and large crystals, producing a slight kink at a large size class, and there are strong similarities between CSD diagrams in terms of slope. (D) However, the non-linear patterns in log–log plots proposing multifractal distribution are more consistent with the non-linear behavior of supersaturation variation during decompression, which induces variable nucleation and growth rates.
Minerals 14 00660 g008
Figure 9. The comparative log–log diagrams for plagioclase lengths crystallized during constant cooling rate experiments [10]. (A) The log–log diagram for crystal lengths produced during a constant cooling rate (0.2 °C/h) experiment of basaltic melt at two quenching temperatures of 1139 °C (XP01 ts1) and 1109 °C (XP01 ts4). Note the increasing distance between two diagrams from small to large sizes, which may indicate the size-proportionate growth. (B) Comparison of N-LoC log–log plots for plagioclases crystallized during constant cooling of 1 °C/h at quenching temperatures of 1139 °C (ts1), 1129 °C (ts2), 1119 °C (ts3), and 1109 °C (ts4). (C) The results of multifractal analysis on crystal lengths at a cooling rate of 3 °C/h (XP06 experiment) at quenching temperatures of 1139 °C (color intervals) and 1109 °C (black and gray intervals). The intervals are labeled with numbers, which represent the number of crystals on that interval (the left numbers), and thresholds (numbers in parentheses), which limit the intervals. (D) Comparison of the size distribution of plagioclases crystallized at a quenching temperature of 1109 °C at three cooling rates, namely, 0.2 °C/h (XP01), 1 °C/h (XP02), and 3 °C/h (XP06).
Minerals 14 00660 g009
Figure 10. Comparison of N-LoC log–log plots for plagioclases crystallized at cooling rates of 1 °C/h (XP01), 7 °C/h (XP07), and 60 °C/h (XP60) [41]. The experiments were performed on basaltic melt at initial and final temperatures of 1300 and 800 °C, respectively.
Minerals 14 00660 g010
Figure 11. Comparison of the size distribution of plagioclases crystallized at the chilled margin (AZ-03), the center of the Beacon Sill (AZ-22 and AZ-23), and the location of the presumed second injection of magma into the sill (stratigraphically after the location of AZ-23). AZ-03 has the lowest number of crystals within three thresholds (Figure 4).
Minerals 14 00660 g011
Figure 12. Comparison of the size distribution pattern of microlites from dome samples from the 1980–1986 eruptions of Mt. St. Helens. The numbers in the legend refer to the sample number and the year of the eruption. Note that in the case of sample 226 from 1986, the crystals larger than 0.1 mm were omitted from the diagram because they were assumed to be antecrysts.
Minerals 14 00660 g012
Figure 13. The number–length (A) and the number–area (B) log–log plots of plagioclase microlites from different deposits of the April 2021 eruption of the La Soufrière volcano. The number–area (N-AoC) method is, similar to the N-LoC model, defined as follows: Area is the area of the aim crystals vs. the cumulative number of crystals with area values greater than those of the aim crystals, i.e., N (≥A).
Minerals 14 00660 g013
Table 1. The main parameters obtained from the multifractal analysis of crystal sizes at two quenching temperatures in the XP01 experiment (t is the threshold in mm, n is the number of sizes confined within thresholds, and p is the percentage of crystals in intervals). The raw data are from [10]. The last rows show the maximum crystal lengths and the number and percentage of crystals confined within the largest threshold and the maximum length. However, these values, together with lengths smaller than the lowest threshold (first row), were excluded as an interval in our interpretations to avoid censoring and truncating effects. This procedure was adopted for all subsequent diagrams and tables.
XP01 (ts 1139 °C)XP01 (ts 1109 °C)
t (mm)np (%)t (mm)nP (%)
0.02163.230.01121.74
0.0510721.570.038812.74
0.1118837.900.1023033.29
0.3016934.070.2525536.90
0.33142.820.509714.04
0.4051.010.6330.43
0.92
Table 2. The main parameters obtained from the multifractal analysis of crystal sizes at two quenching temperatures in the XP07 experiment.
XP07 (ts 1167 °C)XP07 (1137 °C)
t (mm)npt (mm)np
0.01152.070.01162.41
0.0215821.850.0324636.99
0.0540856.430.0528042.11
0.1113718.950.0914021.05
0.1660.830.13182.71
0.2360.90
Table 3. The main parameters obtained from the multifractal analysis of crystal sizes (Figure 4) in 4 samples taken from Beacon Sill [42].
AZ-03AZ-22AZ-23AZ-24
t (mm)npt (mm)npt (mm)npt (mm)np
0.04217.60.06164.10.08195.70.04172.8
0.109935.60.10318.00.13257.50.08518.5
0.2912444.60.208922.90.227823.40.1515926.6
0.42238.30.6320753.20.5414242.50.3825642.9
0.61114.01.124110.51.126519.50.609015.1
1.6661.51.6951.50.71183.0
1.861.0
Table 4. The main parameters obtained from the fractal analysis of crystal sizes in two samples from the 1984 and 1986 eruptions of Mt. St. Helens [20].
SH226SH157
t (mm)npt (mm)np
0.00571.00.001140.6
0.01310515.70.002612.8
0.02812218.30.00330613.9
0.05419629.40.010102946.8
0.12616024.00.03051123.2
0.263588.70.07124411.1
0.57781.20.089321.5
0.09980.4
Table 5. The main parameters obtained from the fractal analysis of crystal sizes for samples from the April 2021 eruption of the La Soufrière volcano, St Vincent.
DOMEU1U2U5
t (mm)npT (mm)npt (mm)npt (mm)np
0.00158160.580.00089301.930.0010081.10.001585162.6
0.003982509.040.001581217.800.00158405.70.00398111017.6
0.00794100036.150.0028240025.790.0028218025.80.01778345071.9
0.0199580028.920.0049065041.910.0100037253.30.028184365.8
0.0398160021.690.0100034222.050.019959012.90.079433142.2
0.06310943.400.0794380.520.0446781.1
0.0794350.18
Table 6. Summary of advantages and disadvantages of both crystal size analysis methods (CSD and multifractal).
CSD AnalysisMultifractal Analysis
AdvantagesDisadvantagesAdvantagesDisadvantages
Calculation of kinetic parametersAssuming a constant crystal shapeIndependent from crystal shapeUsing 2D size and area measurements
Obtaining 3D size intervalsSeveral assumptionsA few assumptionsRequires a large number of crystal measurements (recommended > 500 measurements)
Widely used methodSingle population for all phenocrystsSensitivity to subtle J/G ratesLess efficient for large crystals
Overestimation of the number density of small crystalsFast delineation of crystal populations
Applicable in the classification of the size, area, and volume of crystals
Disclaimer/Publisher’s Note: The statements, opinions and data contained in all publications are solely those of the individual author(s) and contributor(s) and not of MDPI and/or the editor(s). MDPI and/or the editor(s) disclaim responsibility for any injury to people or property resulting from any ideas, methods, instructions or products referred to in the content.