Article

Study of a Copper Oxide Leaching in Alkaline Monosodium Glutamate Solution

1
Department of Mining Engineering, Universidad de Chile, Beauchef 850, Santiago 8370448, Chile
2
Advanced Mining Technology Center, Universidad de Chile, Tupper 2007, Santiago 8370451, Chile
3
Department of Mining Engineering and Metallurgical Engineering, Western Australian School of Mines, Curtin University, Kalgoorlie, WA 6430, Australia
4
Shimin Engineering, Carmencita 25, Santiago 7550157, Chile
*
Author to whom correspondence should be addressed.
Minerals 2024, 14(7), 714; https://doi.org/10.3390/min14070714
Submission received: 23 June 2024 / Revised: 9 July 2024 / Accepted: 11 July 2024 / Published: 15 July 2024

Abstract

:
Oxide copper minerals are commonly extracted via acidic leaching, using acids such as H2SO4, HCl, or HNO3. These strong acids are the most widely used because of their high dissolution kinetics. However, their main concern is the high acid consumption because copper oxide deposits contain large amounts of acid-consuming gangue. This paper proposes using an alternative aqueous alkaline monosodium glutamate (MSG) system to leach copper oxide minerals. Tenorite (CuO) was used as the copper oxide mineral under study. The influence of process variables (such as temperature and glutamate concentration) and kinetics of this system on copper leaching from tenorite were studied. The results showed that temperature has a significant effect on copper dissolution rates. Increased temperature from 15 °C to 60 °C enhanced the copper extraction from 9.1% to 97.7% after 2 h. Leaching kinetics were analyzed using the shrinking core model (SCM) under various conditions, indicating that the leaching rate presented a mixed control. This method, however, fails to describe leaching for broad particle sizes due to its requirement for single-sized solid grains. This study demonstrated that a large particle size distribution in tenorite supported a successful extension of the SCM for leaching it from mixed glutamate solutions. The activation energy for the 15–60 °C temperature range was calculated to be 102.6 kJ/mol for the chemical control.

1. Introduction

Copper has different uses in the domestic and industrial sectors because it has exceptional physical and chemical properties, including high ductility, malleability, electrical and thermal conductivity, and excellent corrosion resistance. As a result, copper has attained a prominent position among industrial metals, ranking third in production and consumption, following iron and aluminum [1]. Due to global climate initiatives like the United Nations’ “Climate Action” policy and the Paris Agreements, which prioritize the reduction in CO2 emissions, copper’s role is poised to change significantly [2]. Projections anticipate a substantial increase in copper demand, rising from about 20 million tons (MT) in 2021 to over 90 MT by 2100, reflecting its pivotal role in achieving carbon neutrality by 2050 through renewable energy technologies and electric vehicles [2,3].
The surging demand for copper presents multifaceted economic, social, and environmental challenges, spanning from extraction to final production. For example, the gradual depletion of the world’s reserves of high-grade copper ores is generating the need to develop alternative copper recovery technologies from low-grade ores. In the mining industry, hydrometallurgical methods are employed to recover copper from low-grade ores. Due to the low capital investment required to extract a given metal and the relatively low operating cost [4], hydrometallurgical methods are widely used to recover copper from low-grade ores. Typically, nitric acid, hydrochloric acid, and sulfuric acid serve as leaching agents for copper oxide ores in acidic environments, with sulfuric acid being the most prevalent due to economic viability [5]. However, sulfuric acid interacts with altered and layer silicate-generating gel formation and interacts with some oxide minerals to solubilize a variety of metal cations such as K+, Na+, Mg2+, Al3+, Ca2+, Fe3+, and Mn2+. Together with impurities build-up, these silica gels can generate severe operational challenges in solvent extraction circuits and loss of permeability in leaching heaps. Moreover, high ion loading can impact water treatment and neutralization costs [6].
Other alternatives, such as organic acids, have been researched for these reasons. Different organic acids, including citric acid [7,8], oxalic acid [9], and lactic acid [10], whose leaching is carried out under mildly acidic conditions, have been used in several studies. However, due to their low acidity, low boiling point, and easy degradation, these organic acids cannot be utilized as leaching agents for extremely stable substances [8]. Therefore, alkaline solutions are an attractive alternative to reducing acid consumption and increasing oxide copper ores’ dissolution. Several investigations have been developed using different alkaline reagents, such as cyanide [11], ammonia [5,12], and amino acids [13,14]. These reagents could present many advantages over the acidic medium, such as higher selectivity in many cases, lower corrosivity, and lower reagent consumption. Alkaline leaching agents may have some drawbacks due to their weak gangue minerals attack, which reduces the ore exposure time to the reagent [6]. Additionally, due to their high reagent consumption, ease of decomposition, toxicity concerns, volatility, and recovery challenges [6,15,16,17,18], conventional alkaline leaching agents like cyanide and ammonia may not be recommended for industrial use [18,19].
Recently, the use of amino acids as other alkaline leach options has also been studied. For example, glycine leaching of copper oxide ore was studied by Tanda et al. (2017), who found that alkaline glycine solutions could be used as leaching reagents to dissolve copper from oxidized minerals such as azurite, chrysocolla, cuprite, and malachite [6,20]. Alkaline MSG solutions have also been reported as a potentially suitable lixiviant for leaching base (Cu and Zn) and precious metals from pure foils and waste (such as electrical and electronic wastes and electric arc furnace waste). Table 1 shows some studies performed with MSG and the optimized conditions for the metals leaching from these materials.
Unlike the other alternatives, the copper minerals in alkaline amino acid solutions (such as glycine and glutamate) are selective, rejecting impurities such as Fe, Ca, Mg, and Si in the leached residue. Additionally, amino acids are not environmentally harmful (Bahfie et al., 2022 [26]; Jamett et al., 2023 [13]). This process is suitable for processing oxide ores, which can be handled in environmentally open systems such as heap leaching and in situ leaching [20]. The latter study reported that copper can be recovered more efficiently from waste electrical and electronic equipment using alkaline monosodium glutamate with hydrogen peroxide than glycine, making glutamate an excellent alternative for copper extraction [27]. Nevertheless, studies are yet to be conducted to establish the behavior and determine the rate-limiting steps during the leaching of copper oxide or another copper ore in alkaline MSG. This study presents novel findings on the kinetic control of tenorite leaching, offering insights into the efficiency and mechanisms of copper extraction in MSG systems. Thus, this study will contribute to understanding the kinetic control of copper oxide minerals, particularly tenorite, in the leaching of MSG systems in the perspective of future applications to more complex ores.

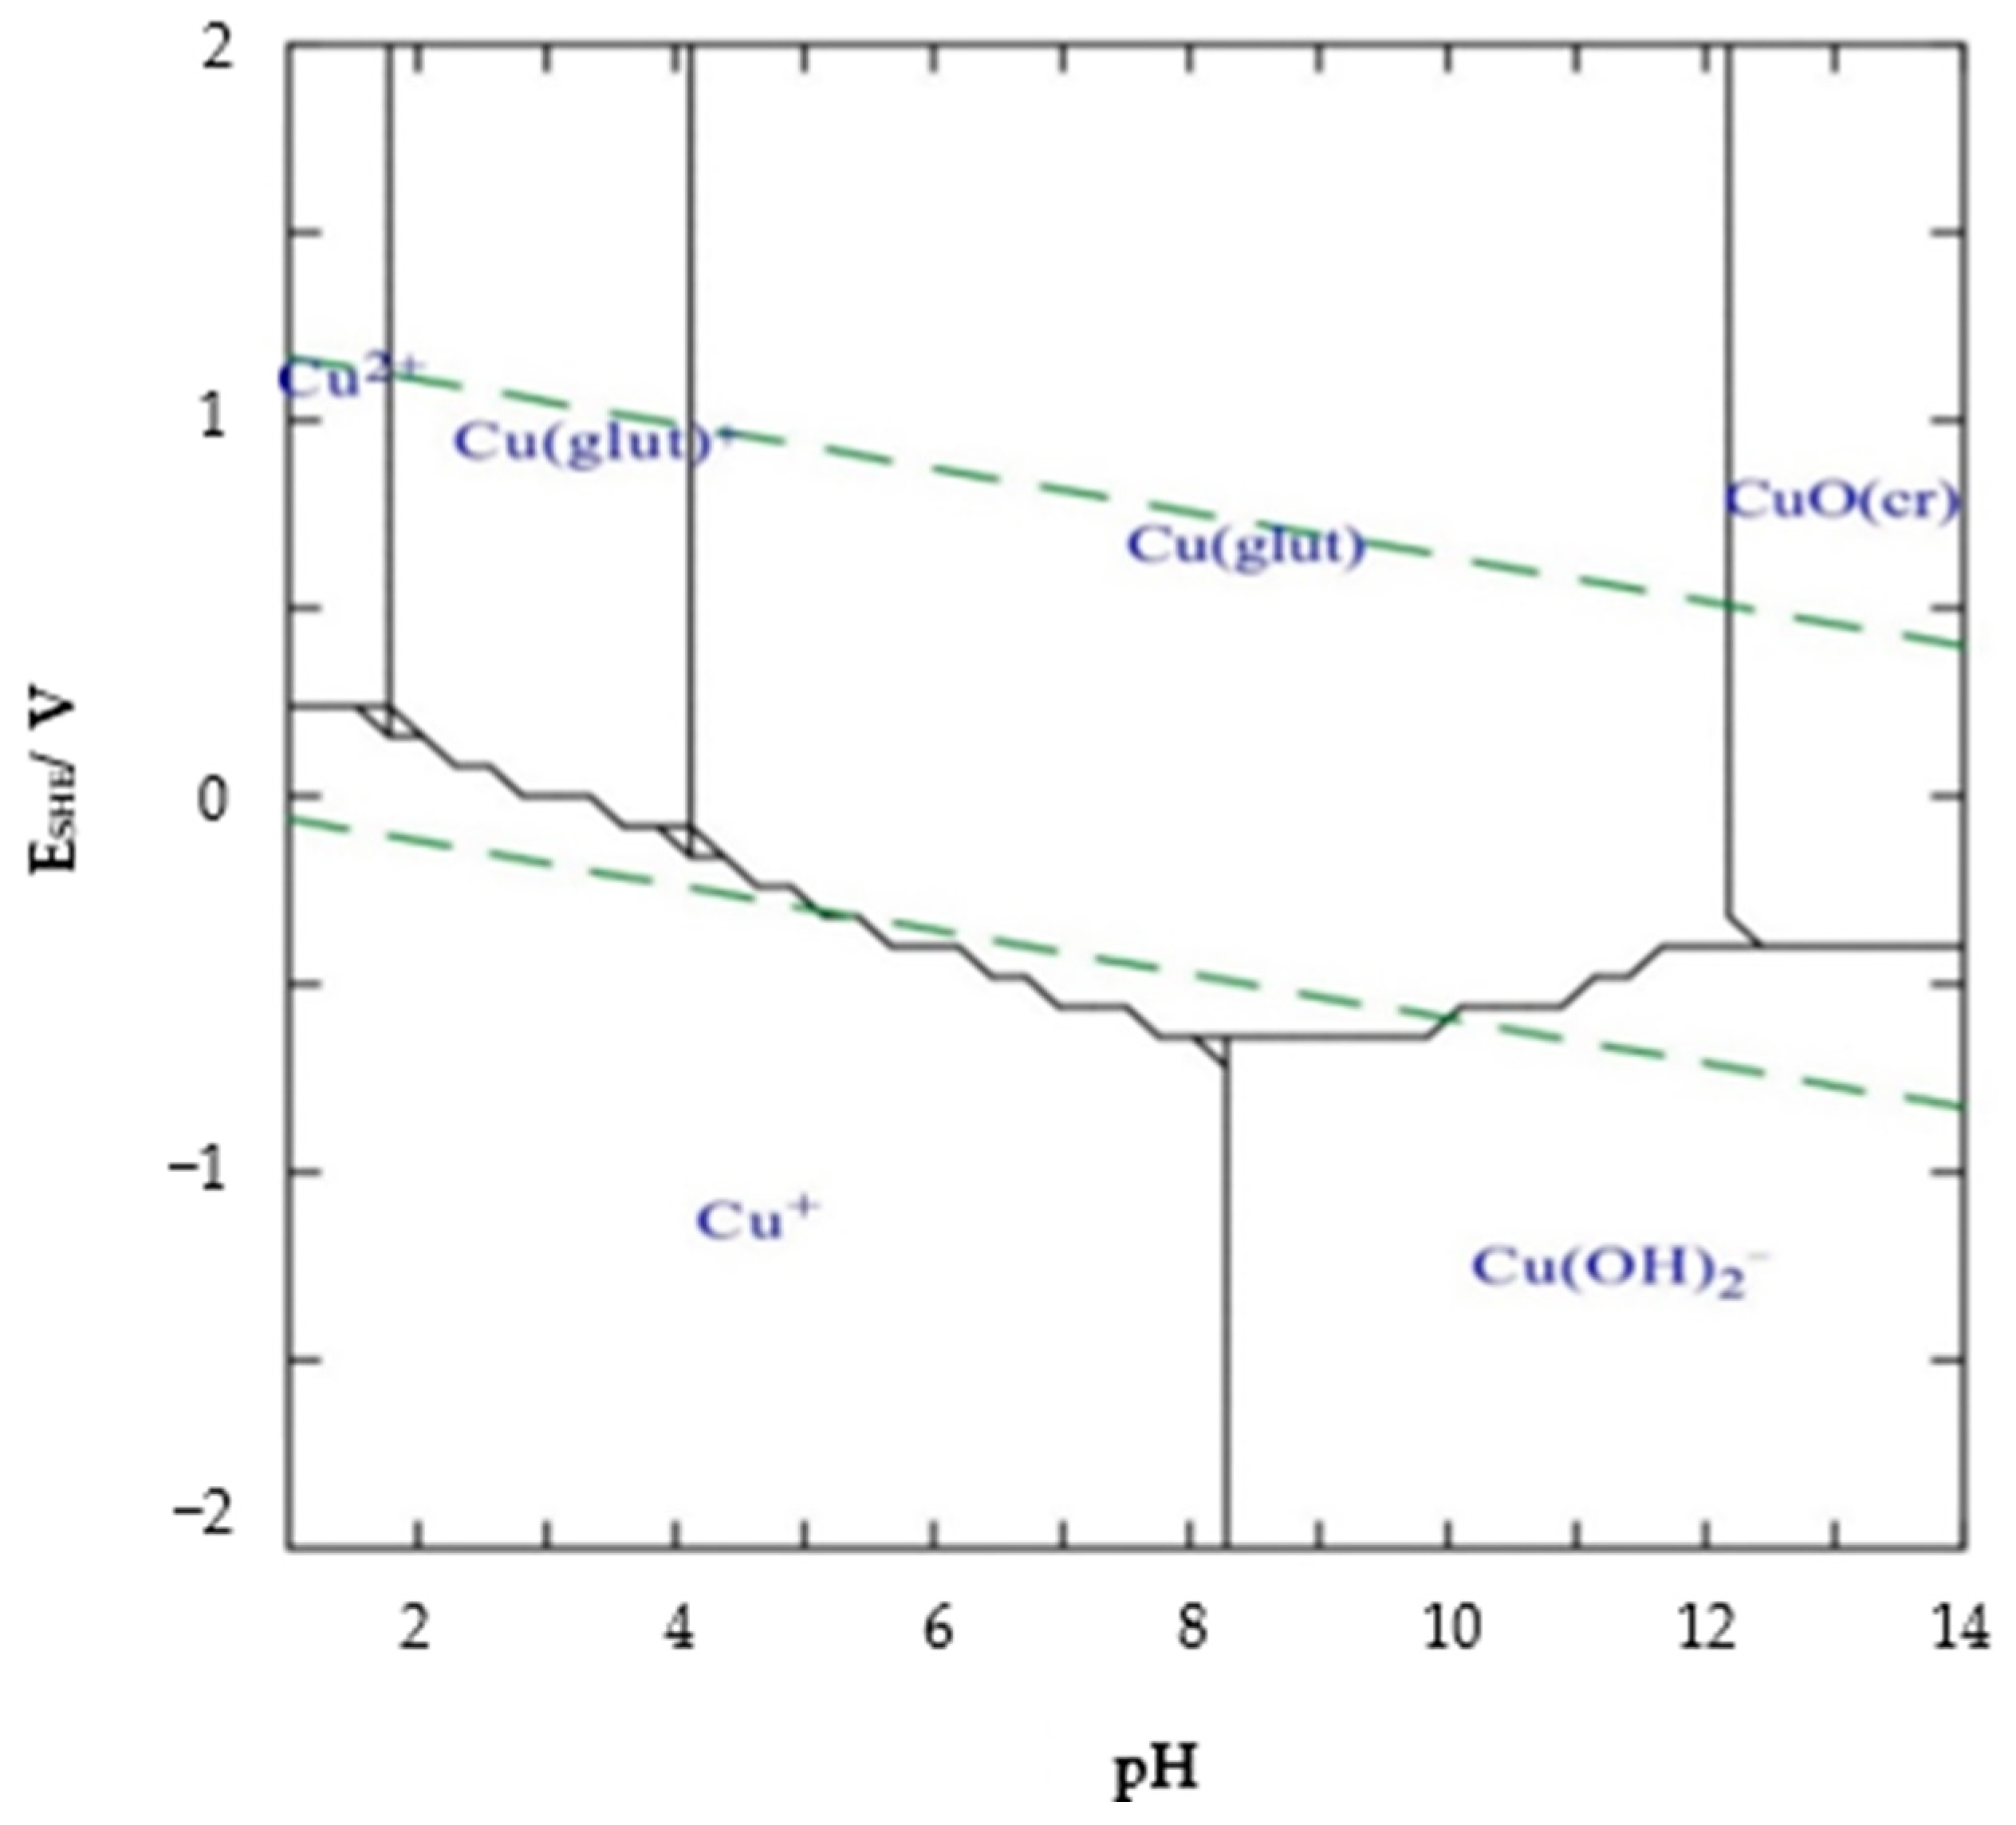
Chemical Composition and Leaching Mechanisms for Tenorite

Monosodium glutamate is a sodium salt derived from glutamic acid, which has the advantage of being selective and is capable of forming stable complexes with cuprous (Cu+) and cupric (Cu+2) ions in alkaline conditions [22]. In this case, the main leaching reactions of tenorite in glutamate alkaline solution can be written as follows:
C 5 H 8 N O 4 N a + H 2 O C 5 H 7 N O 4 2 + N a + + H 3 O +
2 C u O + 2 H 3 O + C u 2 + + 2 H 2 O + C u ( O H ) 2
C u ( O H ) 2 + 2 H 3 O + C u 2 + + 4 H 2 O
In reaction (1), monosodium glutamate is hydrolyzed to release the glutamic ion. In reactions (2) and (3), tenorite is shown to be dissolved by the hydronium ion (H3O+), which provides to CuO the protons it needs to dissolve [5]. After that, the copper ions form copper glutamine complexes with glutamate, preventing the precipitation of copper in an alkaline environment. As a result of the production of these complexes, the rate at which tenorite dissolves in the solution increases. That is because, when the concentration of Cu2+ is reduced to create the copper–glutamate complex, the equilibrium is upset, increasing the solid’s dissolution kinetics in the solution. Consequently, the complete chemical reaction equation of glutamate and tenorite in an aqueous solution can be written as follows:
4 C u O + 4 C 5 H 8 N O 4 N a 4 C u ( C 5 H 7 N O 4 ) + 4 N a + + 2 H 2 O + O 2
The Eh–Ph diagram for the Cu–Glut–H2O system at 25 °C was built using the Hydro-Medusa program [28] and considering a 0.0314 M copper concentration and monosodium glutamate concentration of 0.5 M, as shown in Figure 1. This diagram indicates that the formation of complexes with Cu(glut)+ and Cu(glut) are possible. However, the area of predominance of Cu(glut) is within a wide Eh (−0.5 to 2 volts) and pH (from 4 to 12) range. Therefore, at the operation conditions (pH = 9.4), the copper–glutamate complex Cu(glut) is very stable. Moreover, the copper oxide is stable at higher pH values and Eh > 0. In comparison, at higher pH values and Eh < 0, copper hydroxides (Cu(OH)2) are formed, which could reduce copper in solution, cause surface passivation, and affect the leaching kinetics.

2. Materials and Methods
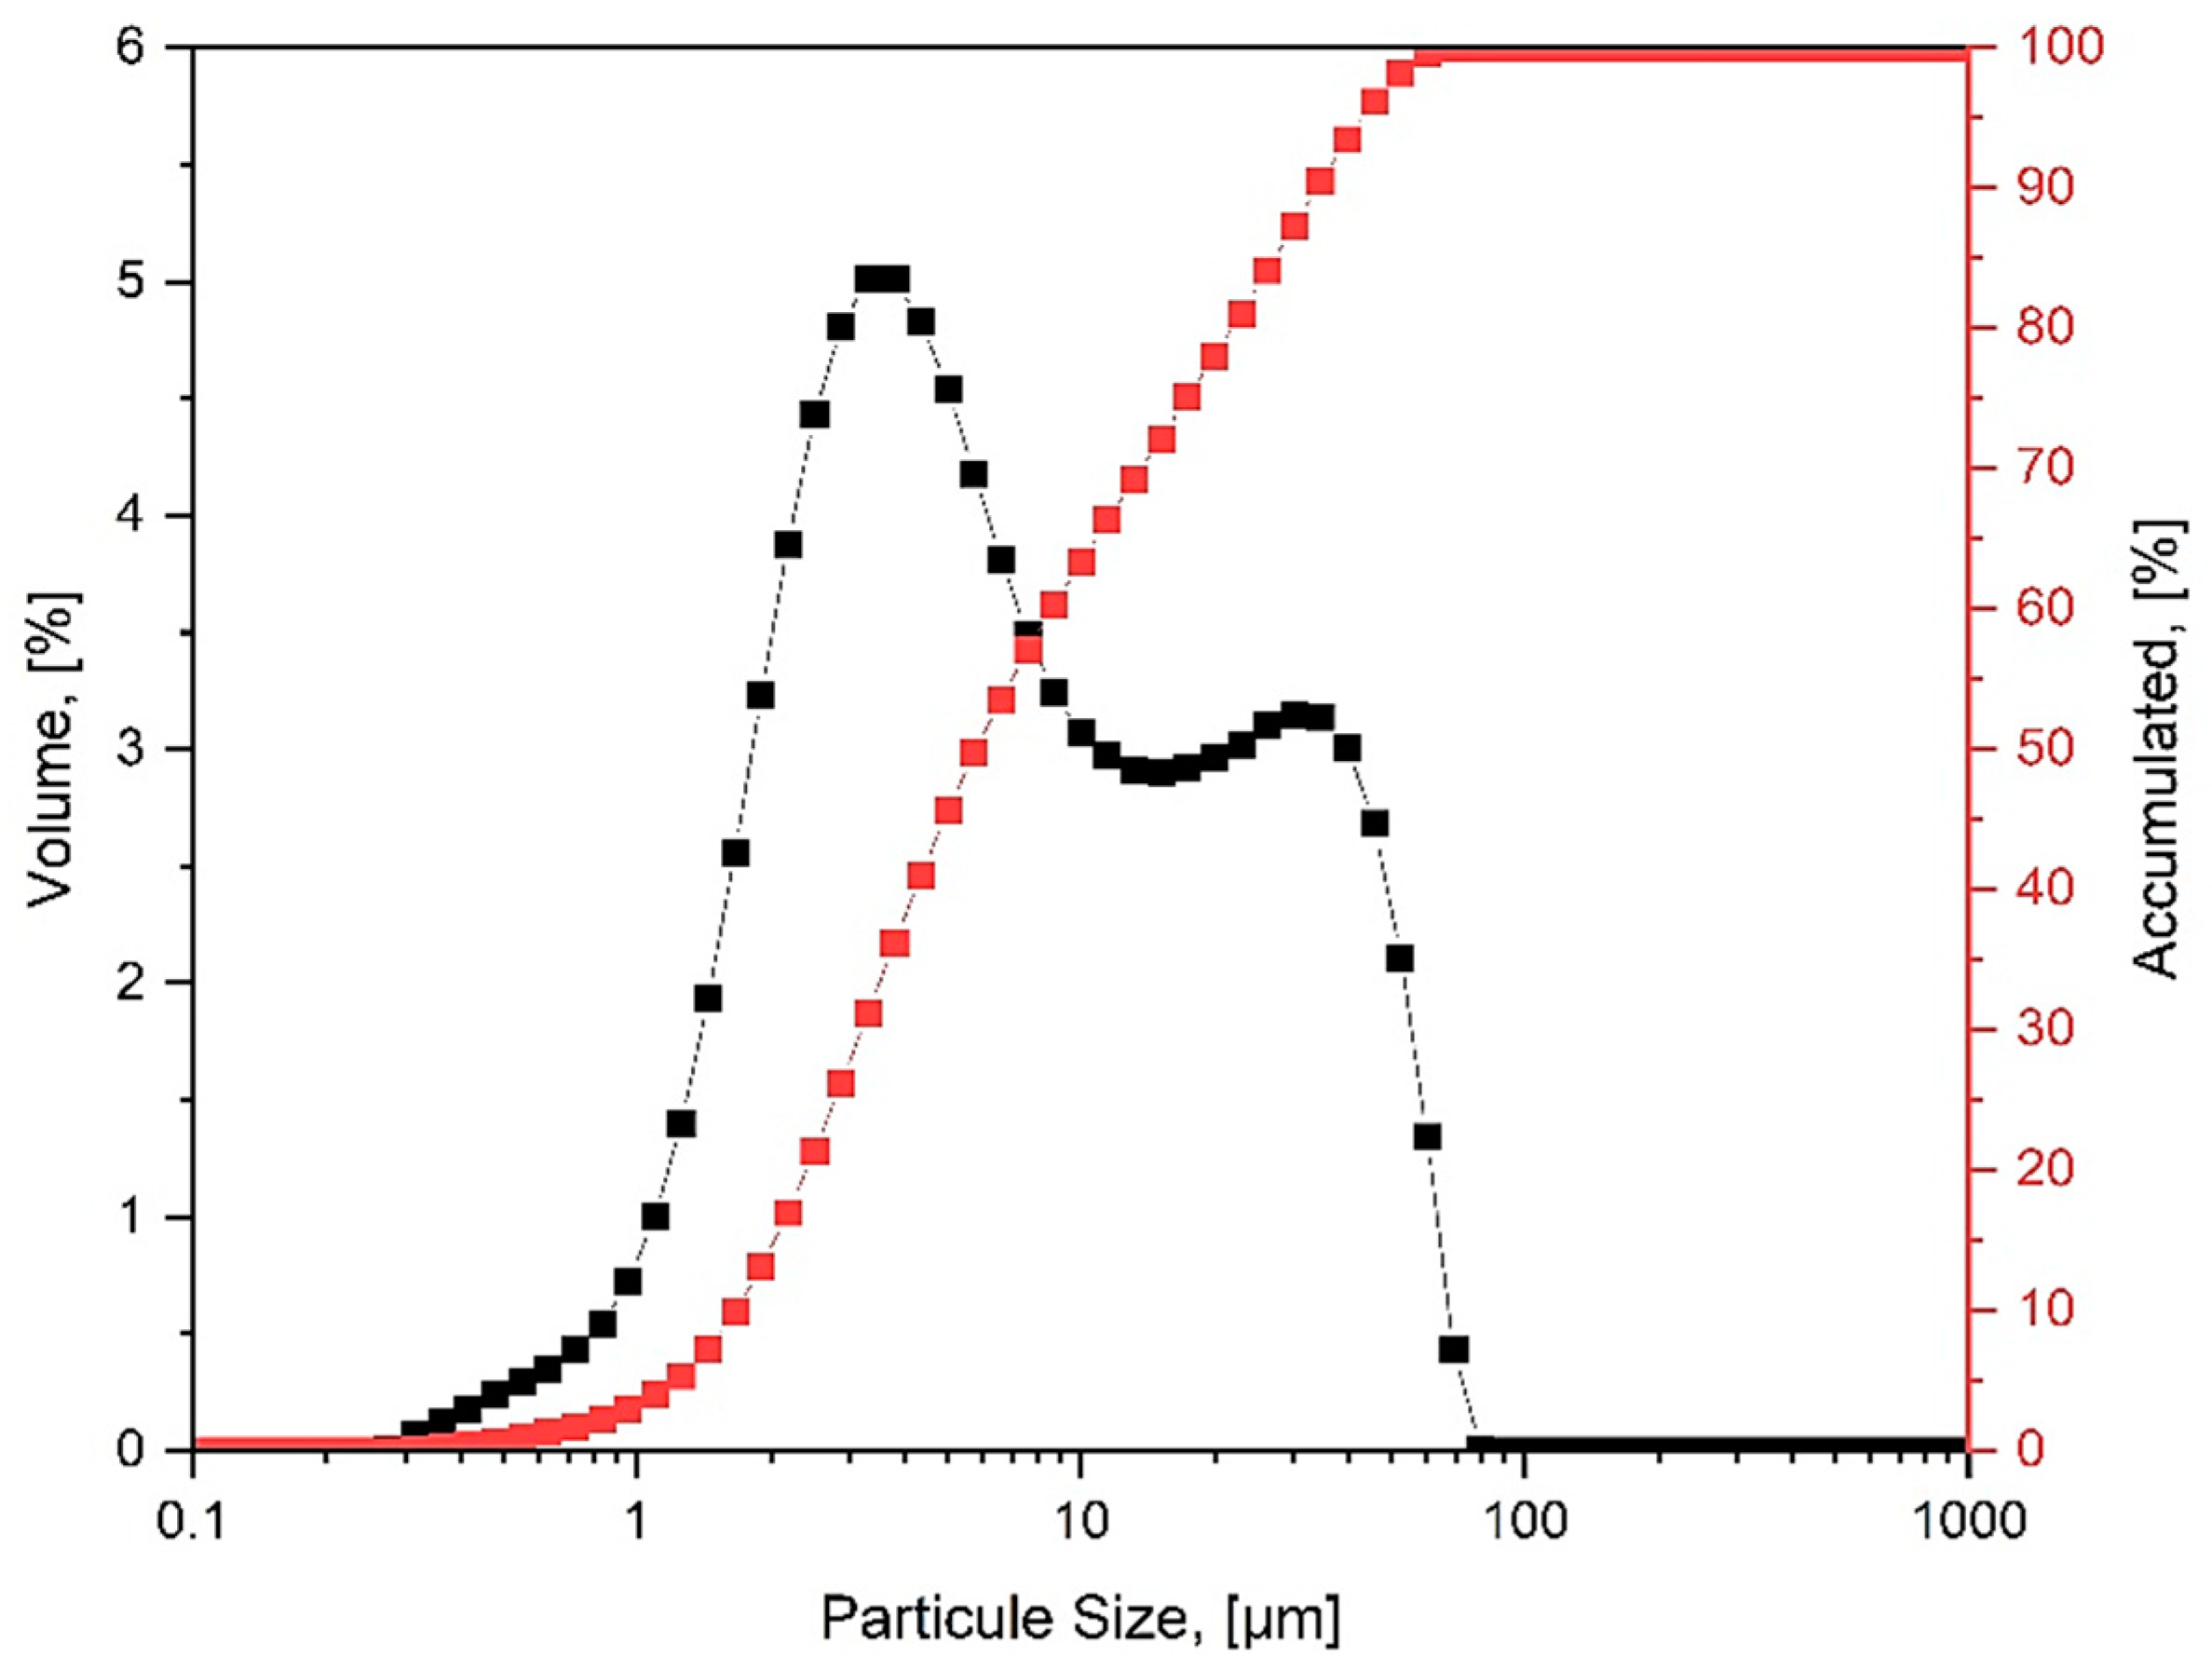
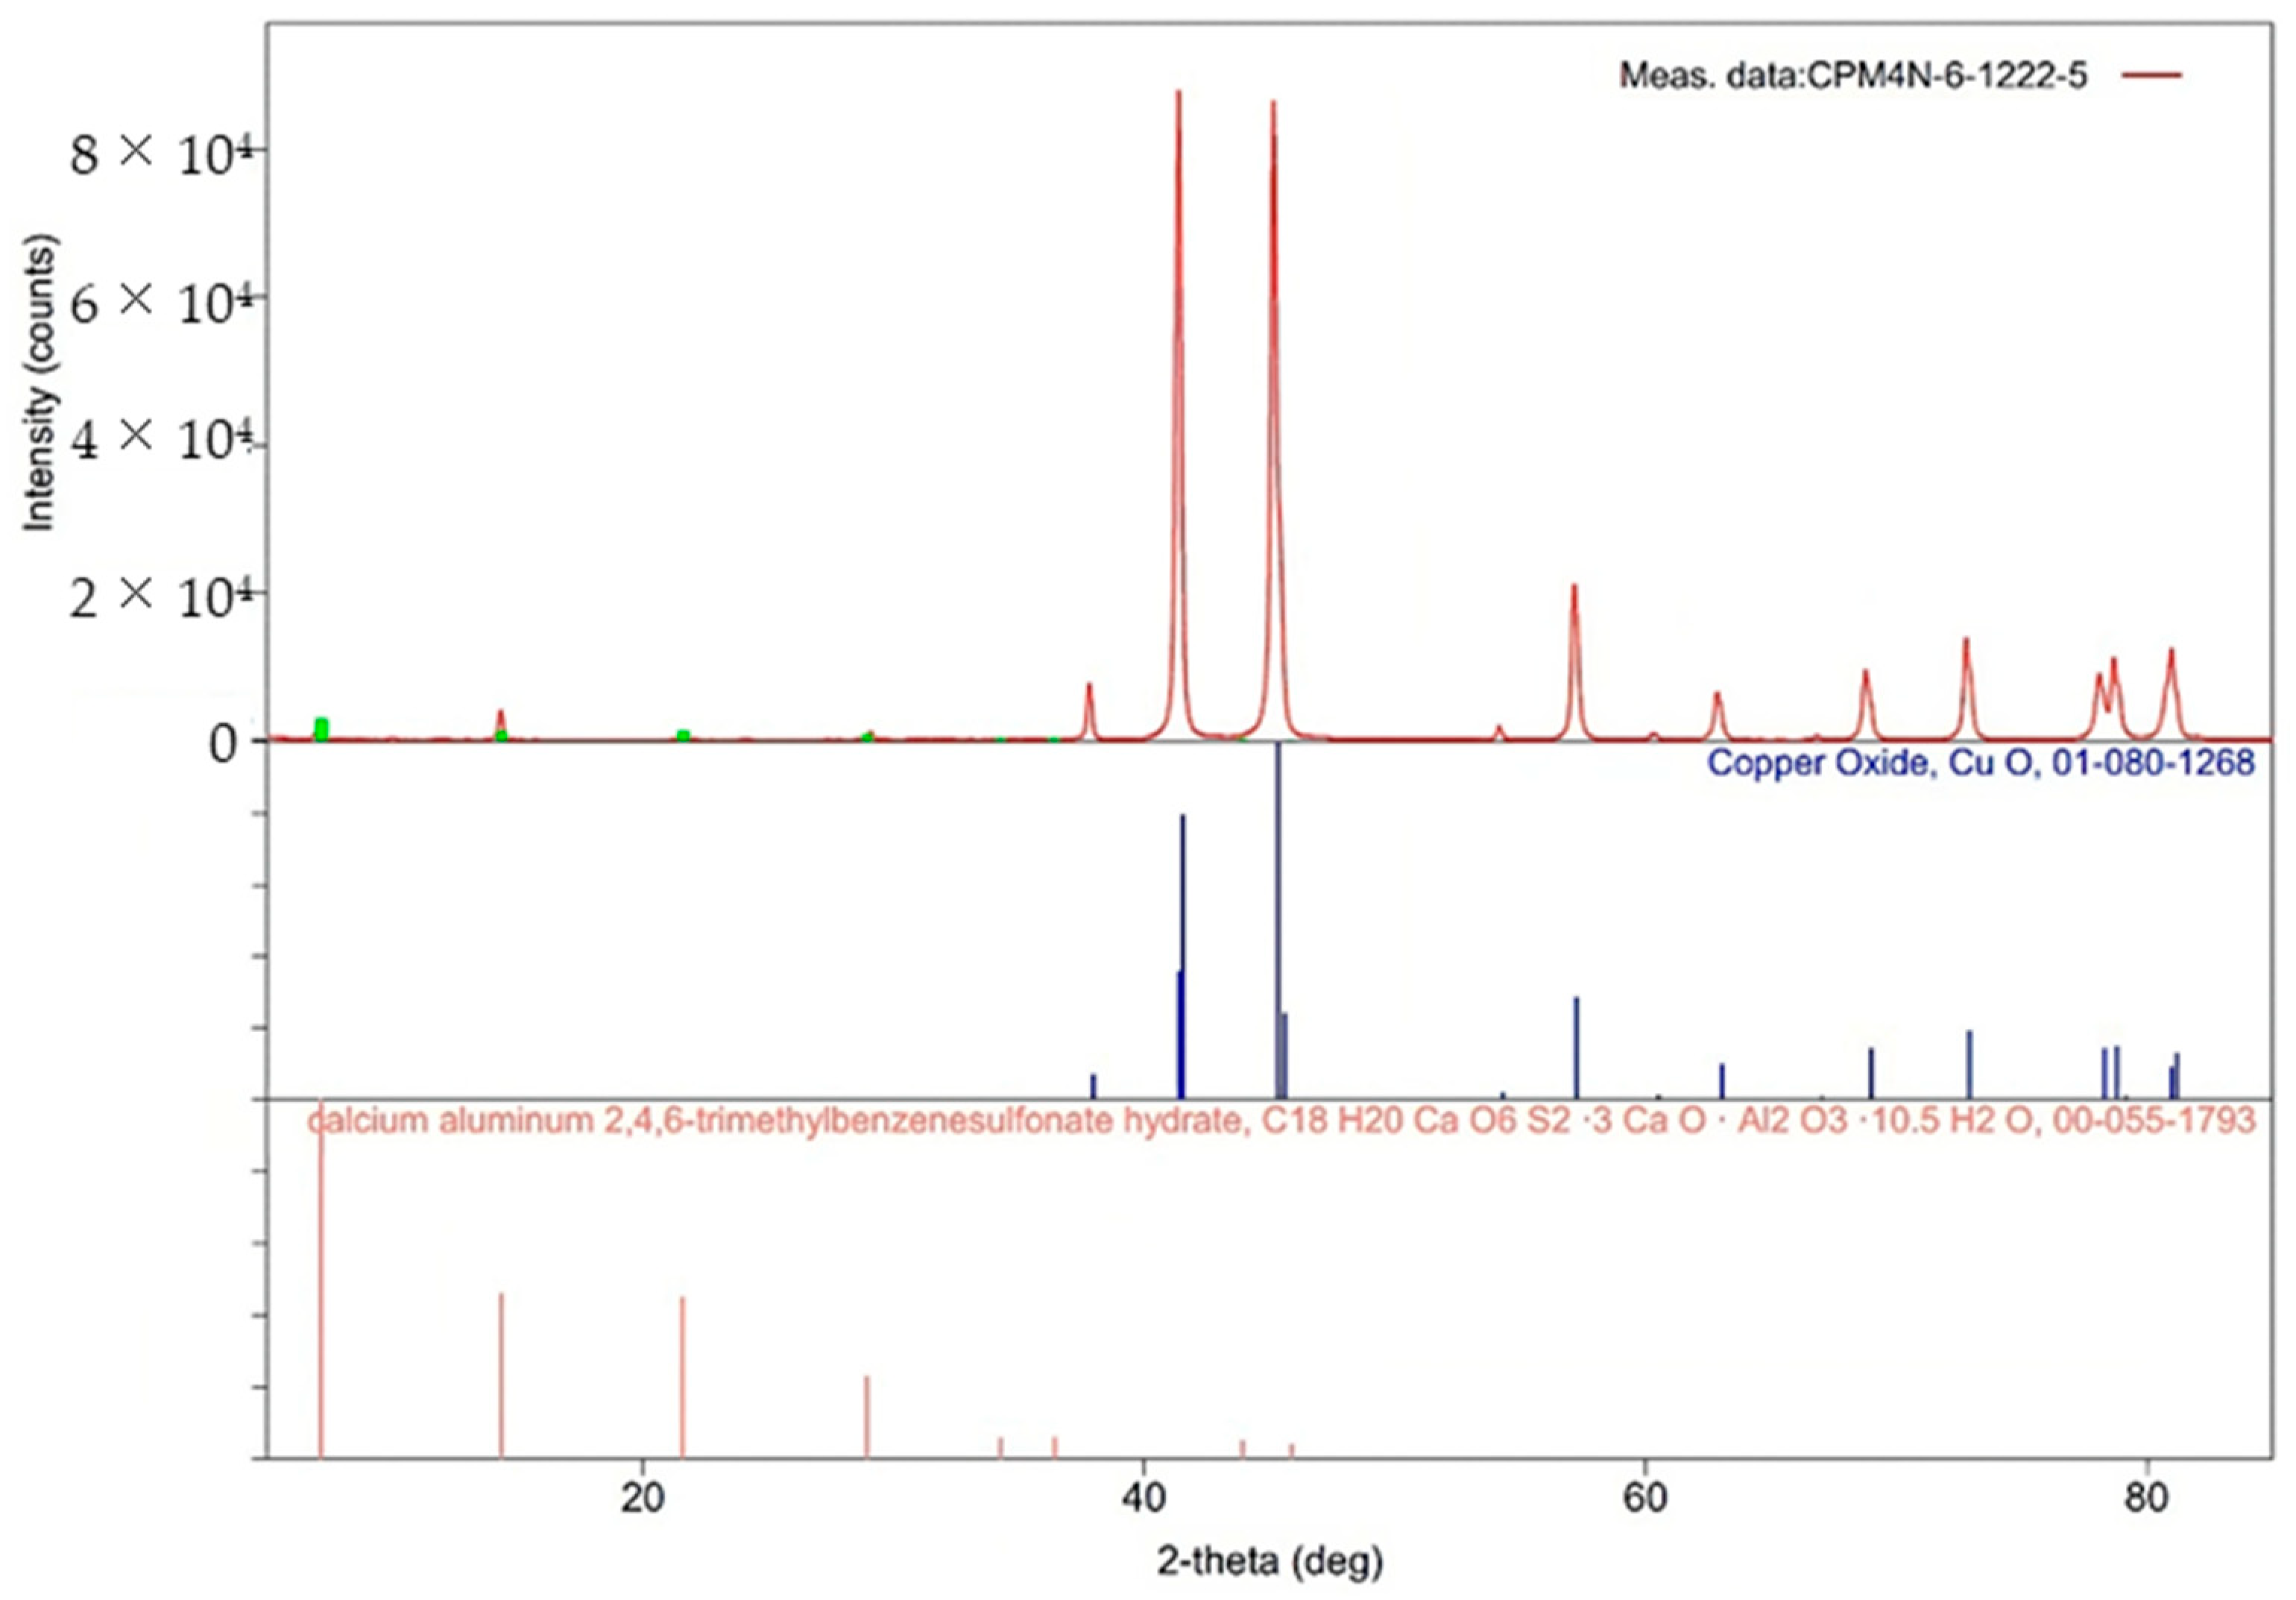
2.1. Materials

All experiments used high-concentration tenorite (CuO) samples from Sigma Aldrich, Chile. This almost pure mineral was used to evaluate the copper leaching efficiency and eliminate gangue’s influence on reagent consumption and reaction rate. The particle size distribution of the synthetic ore sample was characterized using a Malvern Mastersizer 2000 instrument, which revealed that the ore is within the fine particle size range, i.e., with 90% under 39 µm, as shown in Figure 2.
The tenorite samples were characterized to verify the purity grade and chemical composition. The components of the ore samples were determined via Quantitative X-ray diffraction (Q-XRD; D/teX Ultra) using a voltage and current of 40 kV and 15 mA, respectively, and a scanning range of 5° to 85°. As shown in Figure 3, the analysis to determine the mineralogy of the sample indicated that 96% of this is tenorite, and the remaining 4% is calcium aluminum 2, 4, 6-trimethylbenzene sulfonate hydrate. Also, the chemical composition analysis of the sample was performed using X-ray fluorescence spectrometry (XRF; Shimadzu EDX-720), and the results are presented in Table 2. Cu accounted for 73.9% of the ore, which corresponds to 92% as tenorite, a value slightly lower than Q-XRD analysis. Minerals containing Cl, Si, and Al were also found.
In the experiments, deionized water with a resistivity of 0.01 µS/cm was used as the solvent. Analytically pure Monosodium glutamate produced by Scharlab S.L. was used as a leaching reagent, and sodium hydroxide (NaOH) of analytical grade produced by Winkler was used for pH adjustment and, in turn, to avoid introducing another cation such as calcium or magnesium in the solution, which could affect in another way the process.

2.2. Methods

Batch isothermal leaching experiments were carried out in a 0.25 L glass reactor to quantify the effect of different factors on the copper leaching kinetics from tenorite synthetic samples in alkaline monosodium glutamate solutions. All experiments were designed in agitated reactors at variable operating conditions and carried out in duplicate. Glutamate concentration and temperature were the independent variables studied. These factors and their levels can be observed in Table 3. It was decided to perform the leaching tests with these glutamate concentrations because, in some studies with similar amino acids such as glycine, it has been observed that copper recovery is low at concentrations below this range. In contrast, higher recovery is achieved at concentrations close to 0.5 M [18,20,29]. Since the formation of the copper–glutamate complex requires one mole of glutamate for every mole of copper due to the capability to bind in a tridentate fashion with metal ions (Perea, et al., 2021 [22]), the minimum glutamate concentration of 0.2 M ensured that the necessary glutamate to copper ratio of 1:1 in solution is obtainable if complete copper dissolution occurs. In addition, it has been possible to propose the chemical composition and leaching mechanisms for tenorite based on previous studies on the copper–glutamate system and thermodynamic analysis performed for the CuO–glut–H2O system using the Hydra-Medusa program [28]. The results showed that copper oxidation and Cu(glut)2 formation are stable between pH levels 5 and 13. Also, previous research has achieved higher copper dissolution from waste with a pH between 9 and 10 [22,23,25]. Therefore, the leaching tests were conducted at a pH of 9.45 ± 0.05.
The leaching process was carried out in 0.2 L alkaline monosodium glutamate solutions at the temperature conditions shown in Table 1 through water-bath heating at atmospheric pressure and employing magnetic stirring at 300 rpm. Once the solution was cooled or heated to the test temperature and the pH adjusted to 9.4 using around 4 g/L NaOH, 1 g of solid sample was loaded into the reactor. Leaching was carried out for 24 h, when 10 intermediate samples were collected. This involved stopping magnetic stirring, allowing it to stand for 1 min to allow the solids to settle partially, and then withdrawing 3 mL of slurry and filtering it using a syringe–membrane filter (pore size 0.45 µm). An atomic absorption spectrometer (AAS; Pin AAcle 900 F—Perkin Elmer) was used to determine the concentration of copper in the filtrate. The percentage of copper dissolution was calculated from the following equation:
x n = V n α n + i = 1 n 1 V s α i M w
where n is the sampling time; x n is the dissolved copper percentage of the nth sampling, %; V n is the leach solution volume of the n t h sampling, mL; V s is the constant sampling volume, 3 mL; M is the mass of tenorite sample, mg; w is the mass fraction of copper in a tenorite sample determined via AAS, %; and α i and α n are the mass concentrations of copper in the leach solution for the i t h and n t h sampling, mg/mL.

2.3. Kinetic Model

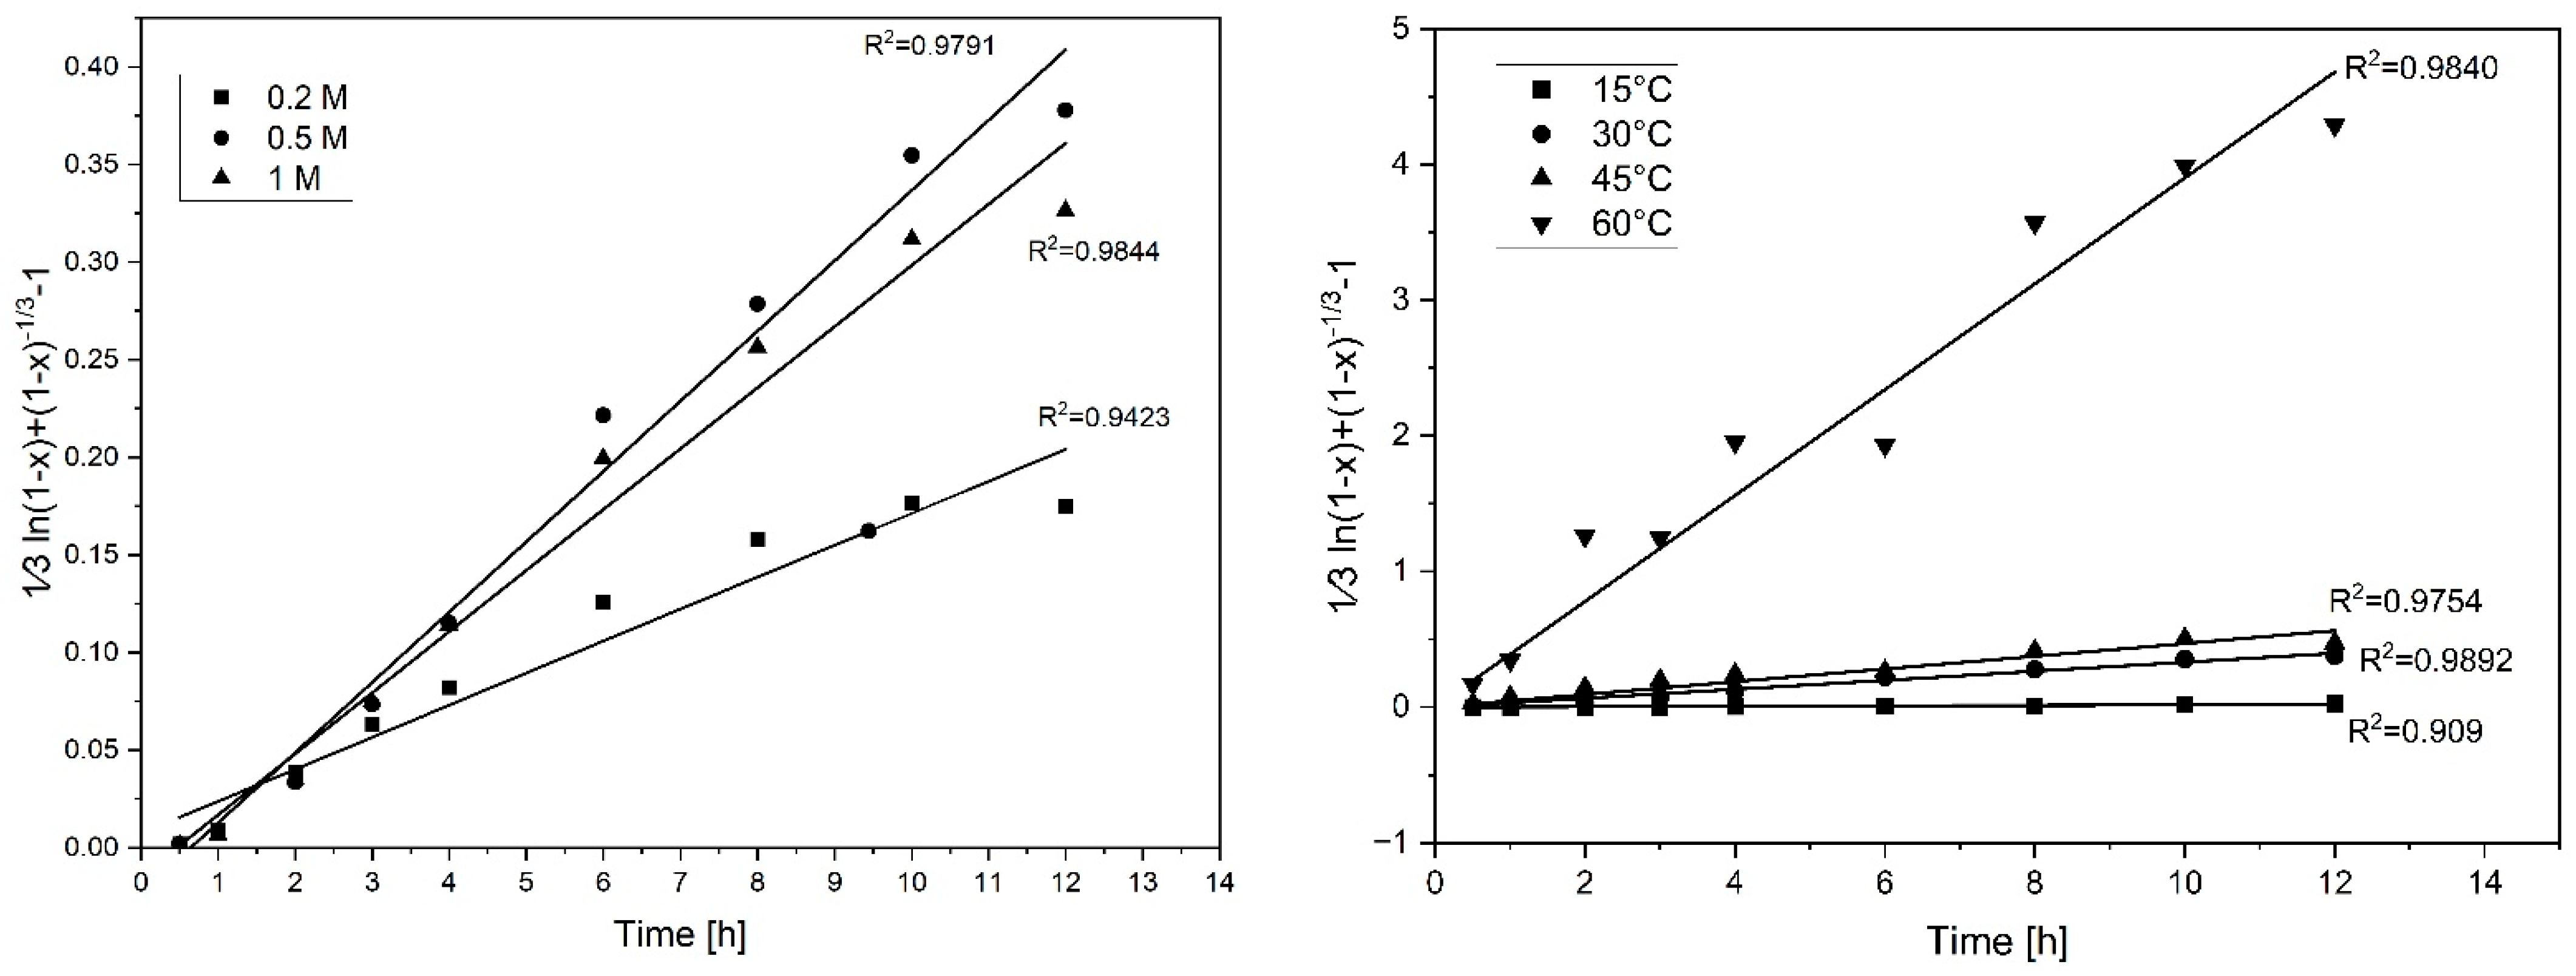
2.3.1. Rate Controlling Factor Based on the Shrinking Core Model (SCM)

Most hydrometallurgical processes are heterogeneous, so we find solid–liquid interfaces that can generate aqueous products, solids, or, in many cases, a combination of both during the reaction process [30]. A simplified representation of the leaching process reactions is as follows:
a A + b B c C + d D
The shrinking core model is one of the most accepted methods to model the kinetic rate at which these reactions occur [31]. In this model, the reaction is considered to occur first at the particle surface, where the reaction moves inward into the particle leaving behind a fully converted material and an inert solid. Yagi and Kunii considered that these solid–liquid reactions during the leaching process occur in five successive stages [32]: (1) diffusion of the reactant through the liquid film surrounding the particle to the particle surface, (2) diffusion of the liquid reactant through the solid product layer to the unreacted core surface, (3) reaction of the liquid reactant with the solid at this reaction surface, (4) diffusion of the formed liquid products through the solid product layer to the outer surface of the solid, and, finally, (5) diffusion of the liquid products through the liquid film back to the main body of the fluid. Levenspiel (2004) [32] proposed that, according to the shrinking core model, the leaching process of a pure mineral can be controlled by three stages represented by the following expressions [32]:
Film diffusion controls:   k l t = x
Product layer diffusion controls:   k d t = 1 3 ( 1 x ) 2 3 + 2 ( 1 x )
Chemical reaction controls:   k r t = 1 ( 1 x ) 1 3
here x represents the solid particle conversion fraction, k l , k d , and k r represent the apparent rate constants for each controlling step, and t represents the reaction time. The process step that is most resistant to the reaction is afterwards regarded as the rate-controlling phase. Nevertheless, the assumption that a single chemical or diffusional step can explain leaching kinetics may only partially explain some leaching reactions. To fill this gap, Wadsworth and Miller (1979) [30] and Dickinson and Heal (1999) [33] have proposed a mixed control model that assumes that both the interfacial mass transfer and solid-film diffusion affect the reaction kinetics [10]. This model has the following expression:
k t = 1 3 l n 1 x 1 ( 1 x ) 1 3
Considering the case in which a solid product layer does not form during leaching, the particle size changes during leaching. In that case, only three steps are considered:
  • Diffusion from the main body of the solution to the solid surface through the liquid film;
  • Reaction between the solid and reactant at the surface;
  • Diffusion from the solid surface into the solution through the film.
When the surface chemical reaction controls the process, the behavior is the same as that of unchanging size, which means Equation (9) is applicable. When there is no product layer present, film diffusion controls the rate, resulting in the following integrated rate expression [20]:
k t = 1 ( 1 x ) 2 3
The right-hand side of each model equation is plotted versus time using experimental data to identify the governing step considering the following:
  • The particles are assumed to have an average size of less than 39 μm;
  • Spherical particles are assumed. That is, the effects that the shape of the particle may generate are neglected;
  • The effect of product concentration is neglected;
  • The concentration of MSG is assumed constant because, with the excess of MSG and the low content of solids used, the change in concentration would be too small, which can be considered negligible.
Therefore, the leaching process will be assumed to be controlled by the model when its corresponding correlation coefficient is close to one.

2.3.2. Rate Controlling Factor Based on the Activation Energies

The activation energy describes the dependence of reaction rates on temperature. For this reason, activation energy is another important parameter that can justify the rate-determining factor in hydrometallurgical processes through the Arrhenius expression (Equation (12)) [34].
k = A   e x p E a R T
where k is the reaction rate constant (min−1), A is the exponential factor (min−1), E a is the activation energy (J mol−1), R is the gas constant (8.314 J mol−1 K−1), and T is the leaching temperature (K).
The activation energy for copper dissolution was calculated from a plot of rate constants vs. 1/T to determine whether the copper–glutamate dissolution mechanism is chemically controlled or diffusion controlled. Based on the leaching tests performed at 15, 30, 45, and 60 °C, a straight line is obtained, whose slope can be used to calculate the activation energy through the following equation:
s = E a / R T

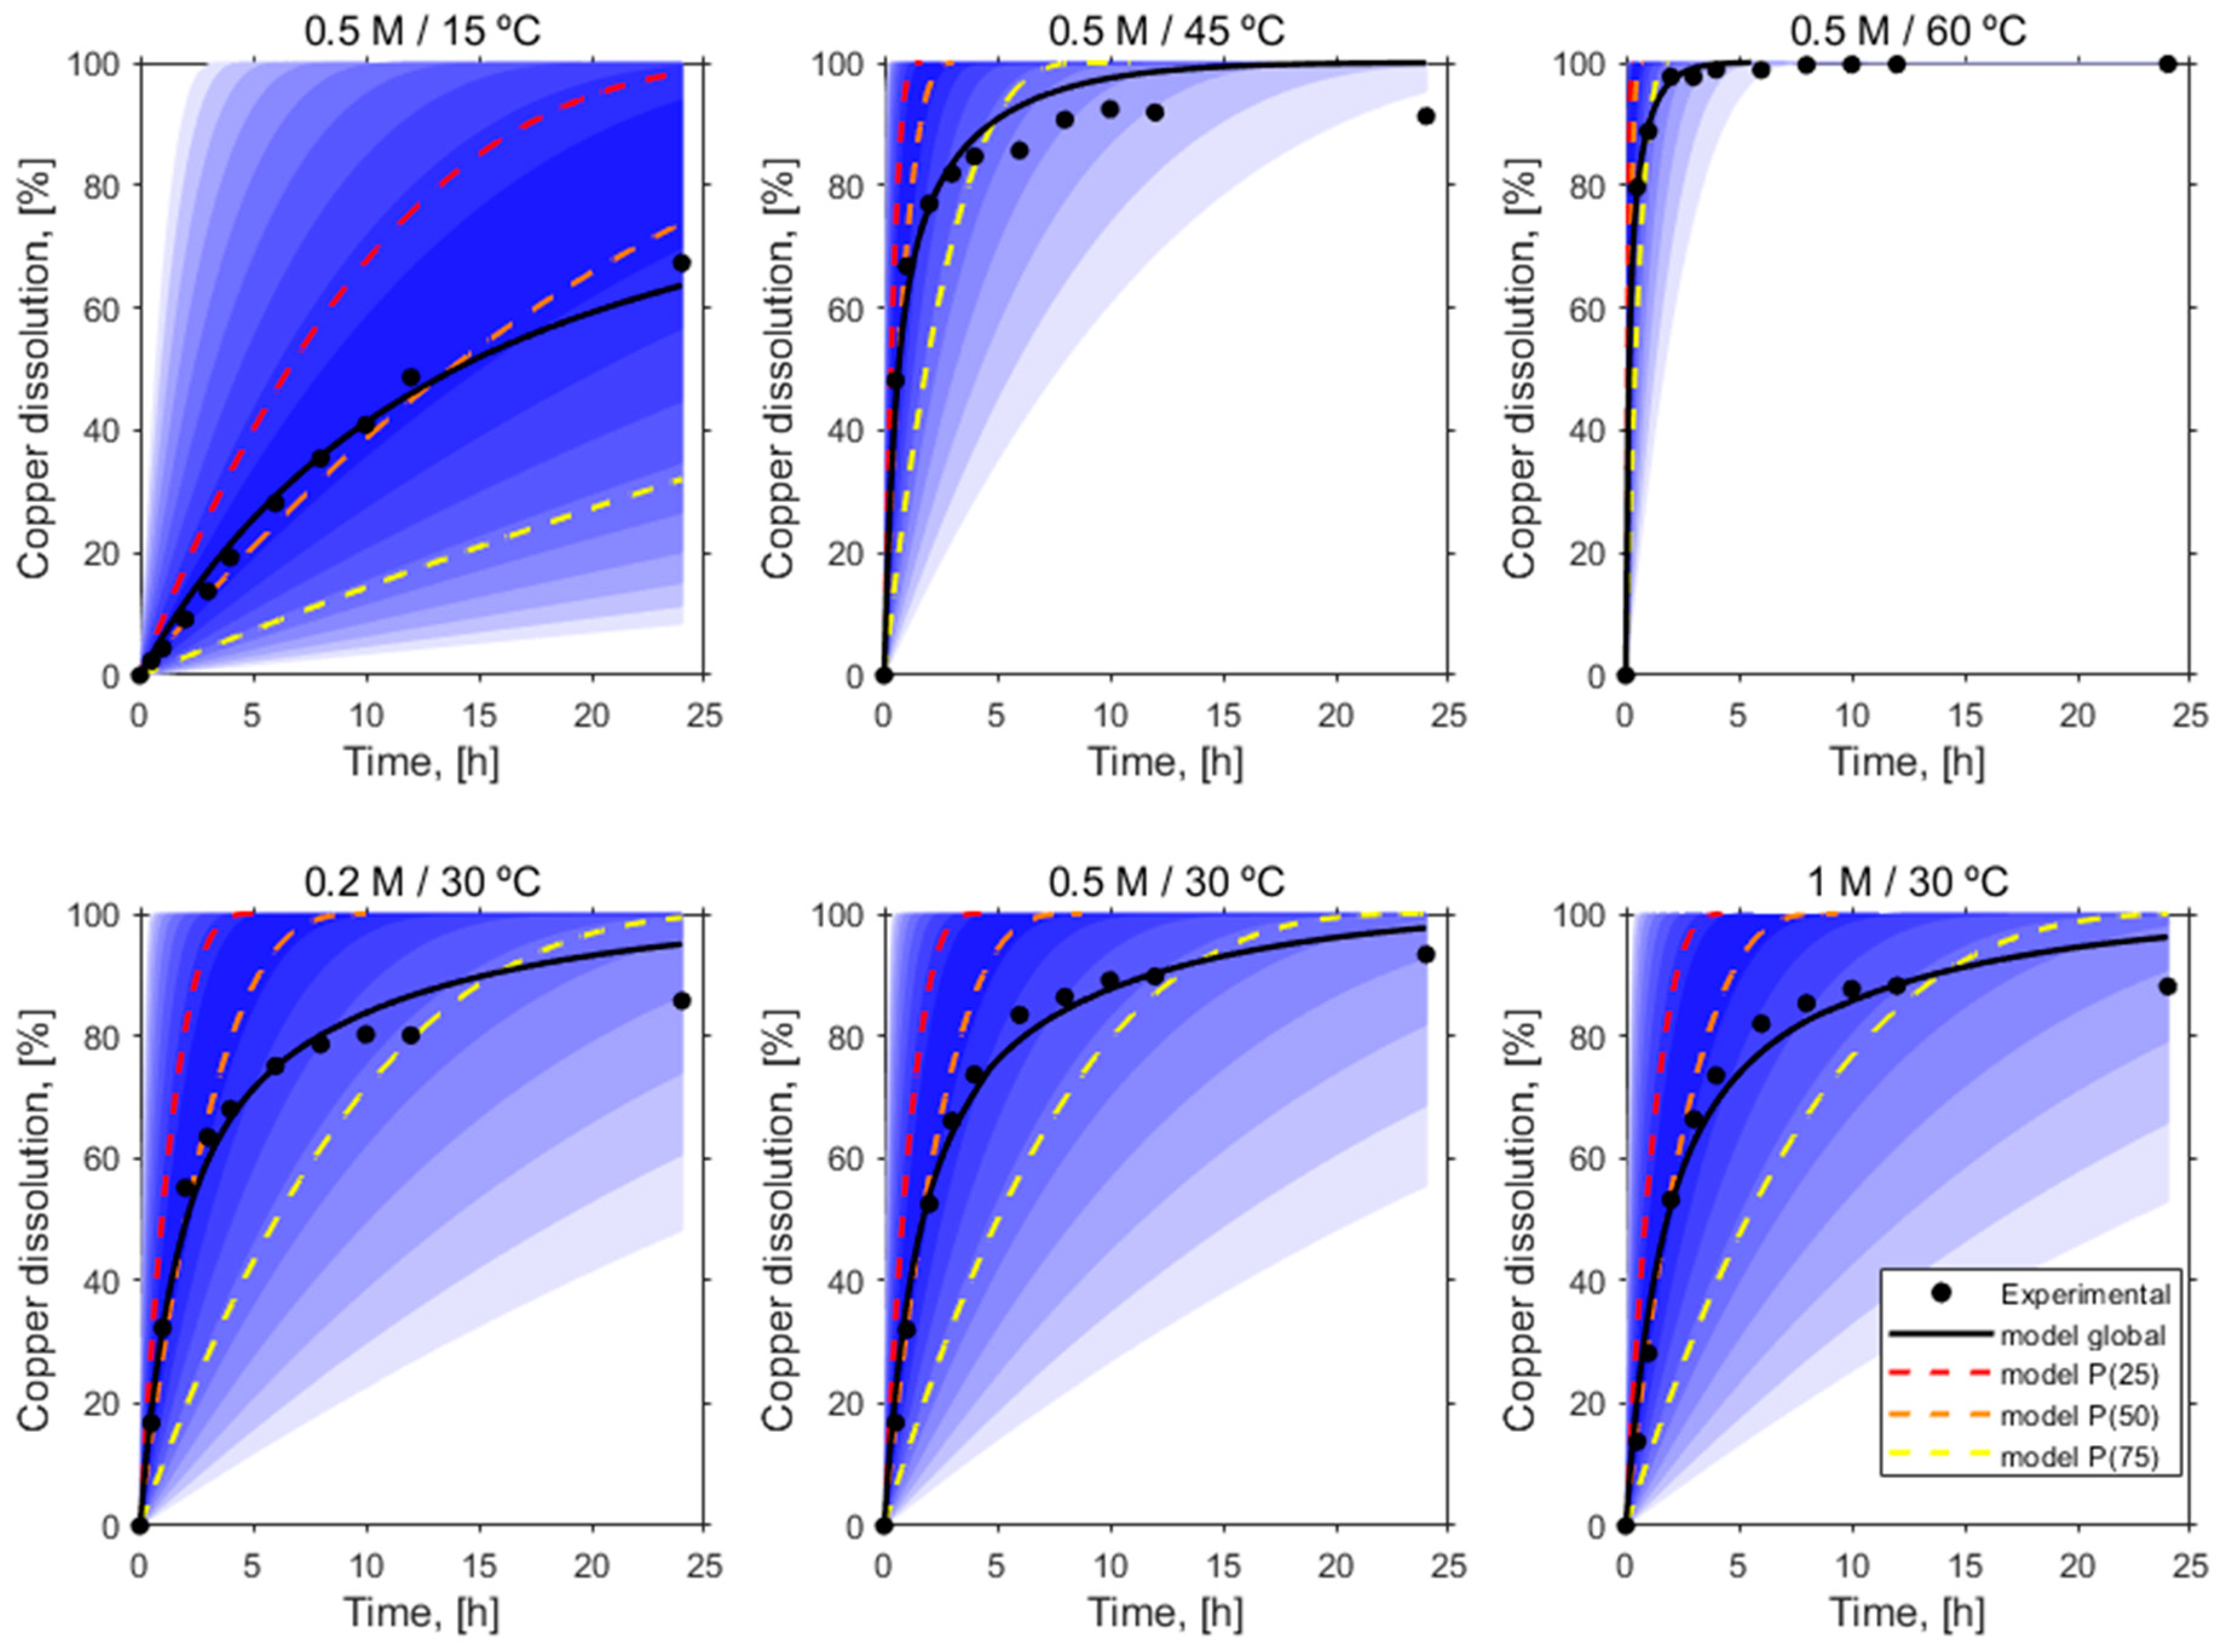
2.3.3. The Effect of PSD on the SCM

In this study, particle size distributions (PSD) are incorporated into shrinking core models (SCMs) for three kinetic control regimes: chemical reaction control, ash layer diffusion control, and film diffusion control, based on Gbor and Jia (2004) [35]. As a result of this integration, errors and shifts in kinetic control regimes due to variations in particle size can be accurately analyzed and evaluated. In mono-sized particles with a diameter D that undergo shrinking core dissolution, the unconverted fraction is a function of particle size and time. PSD incorporates particle size variability, which affects the unconverted fraction and overall kinetic behavior in the SCM, allowing it to represent dissolution processes efficiently, as shown in the following expressions [35,36,37]:
Film diffusion controls:   k l D t = x D
Product layer diffusion controls:   k d D 2   t = 1 3 ( 1 x D ) 2 3 + 2 ( 1 x D )
Chemical reaction controls:   k r D t = 1 ( 1 x D ) 1 3
Mixed controls:   t = k r D 1 1 ( 1 x D ) 1 3 + k d D 2   1 1 3 ( 1 x D ) 2 3 + 2 1 x D
where k l = k l D and k r = k r D are independent of particle size since k l and k r are inversely proportional to D. Moreover, k d = k d D and is independent of particle size since k d is inversely proportional to D2.
To obtain the global conversion, a particle size distribution for the specific mineral is required to integrate over the diameter sizes:
x ( t ) = D m i n D m a x x D ( t ) p D d D
For a practical and straightforward approach, the discretized values of the density function p(D) obtained from the Master Sizer were utilized directly, eliminating the need to determine the distribution type and fit its parameters, as depicted in Figure 2. Regarding the kinetic constant obtention, it was carried out by least square error of the global conversion for each controller stage at a time following the minimization of the mean square error (MSE) [38]:
min k M S E = i = 1 N x e x p e r i m e n t a l t i x m o d e l ( t i ) 2
Regarding numerical implementation, MATLAB 23.2 was used for calculations, specifically fsolve for non-linear equation solving and particle swarm optimization to find the best kinetic constant that minimizes the error.

3. Results and Discussion

3.1. Assessment of Monosodium Glutamate Concentration

The copper extraction from tenorite using MSG at different concentrations (0.2–1 M) is shown in Figure 4. The results show that during the first 3 h, the copper extraction rate is similar for all glutamate concentrations. However, at 0.2 M glutamate concentration, the percentage of copper dissolved was slightly lower than 0.5 M after 3 h, reaching a maximum leaching copper rate of 85.7% and 93.4%, respectively. On the other hand, during the first 12 h, the copper extraction at 1 M glutamate concentration was similar to that obtained at 0.5 M. However, after this time, the maximum leaching copper rate at 1 M is slightly lower than 0.5 M. This shows that the influence of glutamate content on the leaching rate has reached a plateau. These results were similar to those obtained by Tanda et al. (2017), who studied the dissolution of copper from copper oxide ore using glycine. Their result indicated that using glycine with the Gly:Cu molar ratios of 4:1 and 8:1 obtained approximately the same copper extraction of 90% from cuprite in 48 h [6]. Recently, studies on copper extraction from electric arc furnace dust and waste of electric and electronic equipment reported that the optimum recovery of Cu is achieved at 0.5 M MSG concentration, and higher concentrations did not significantly increase the recovery [23].

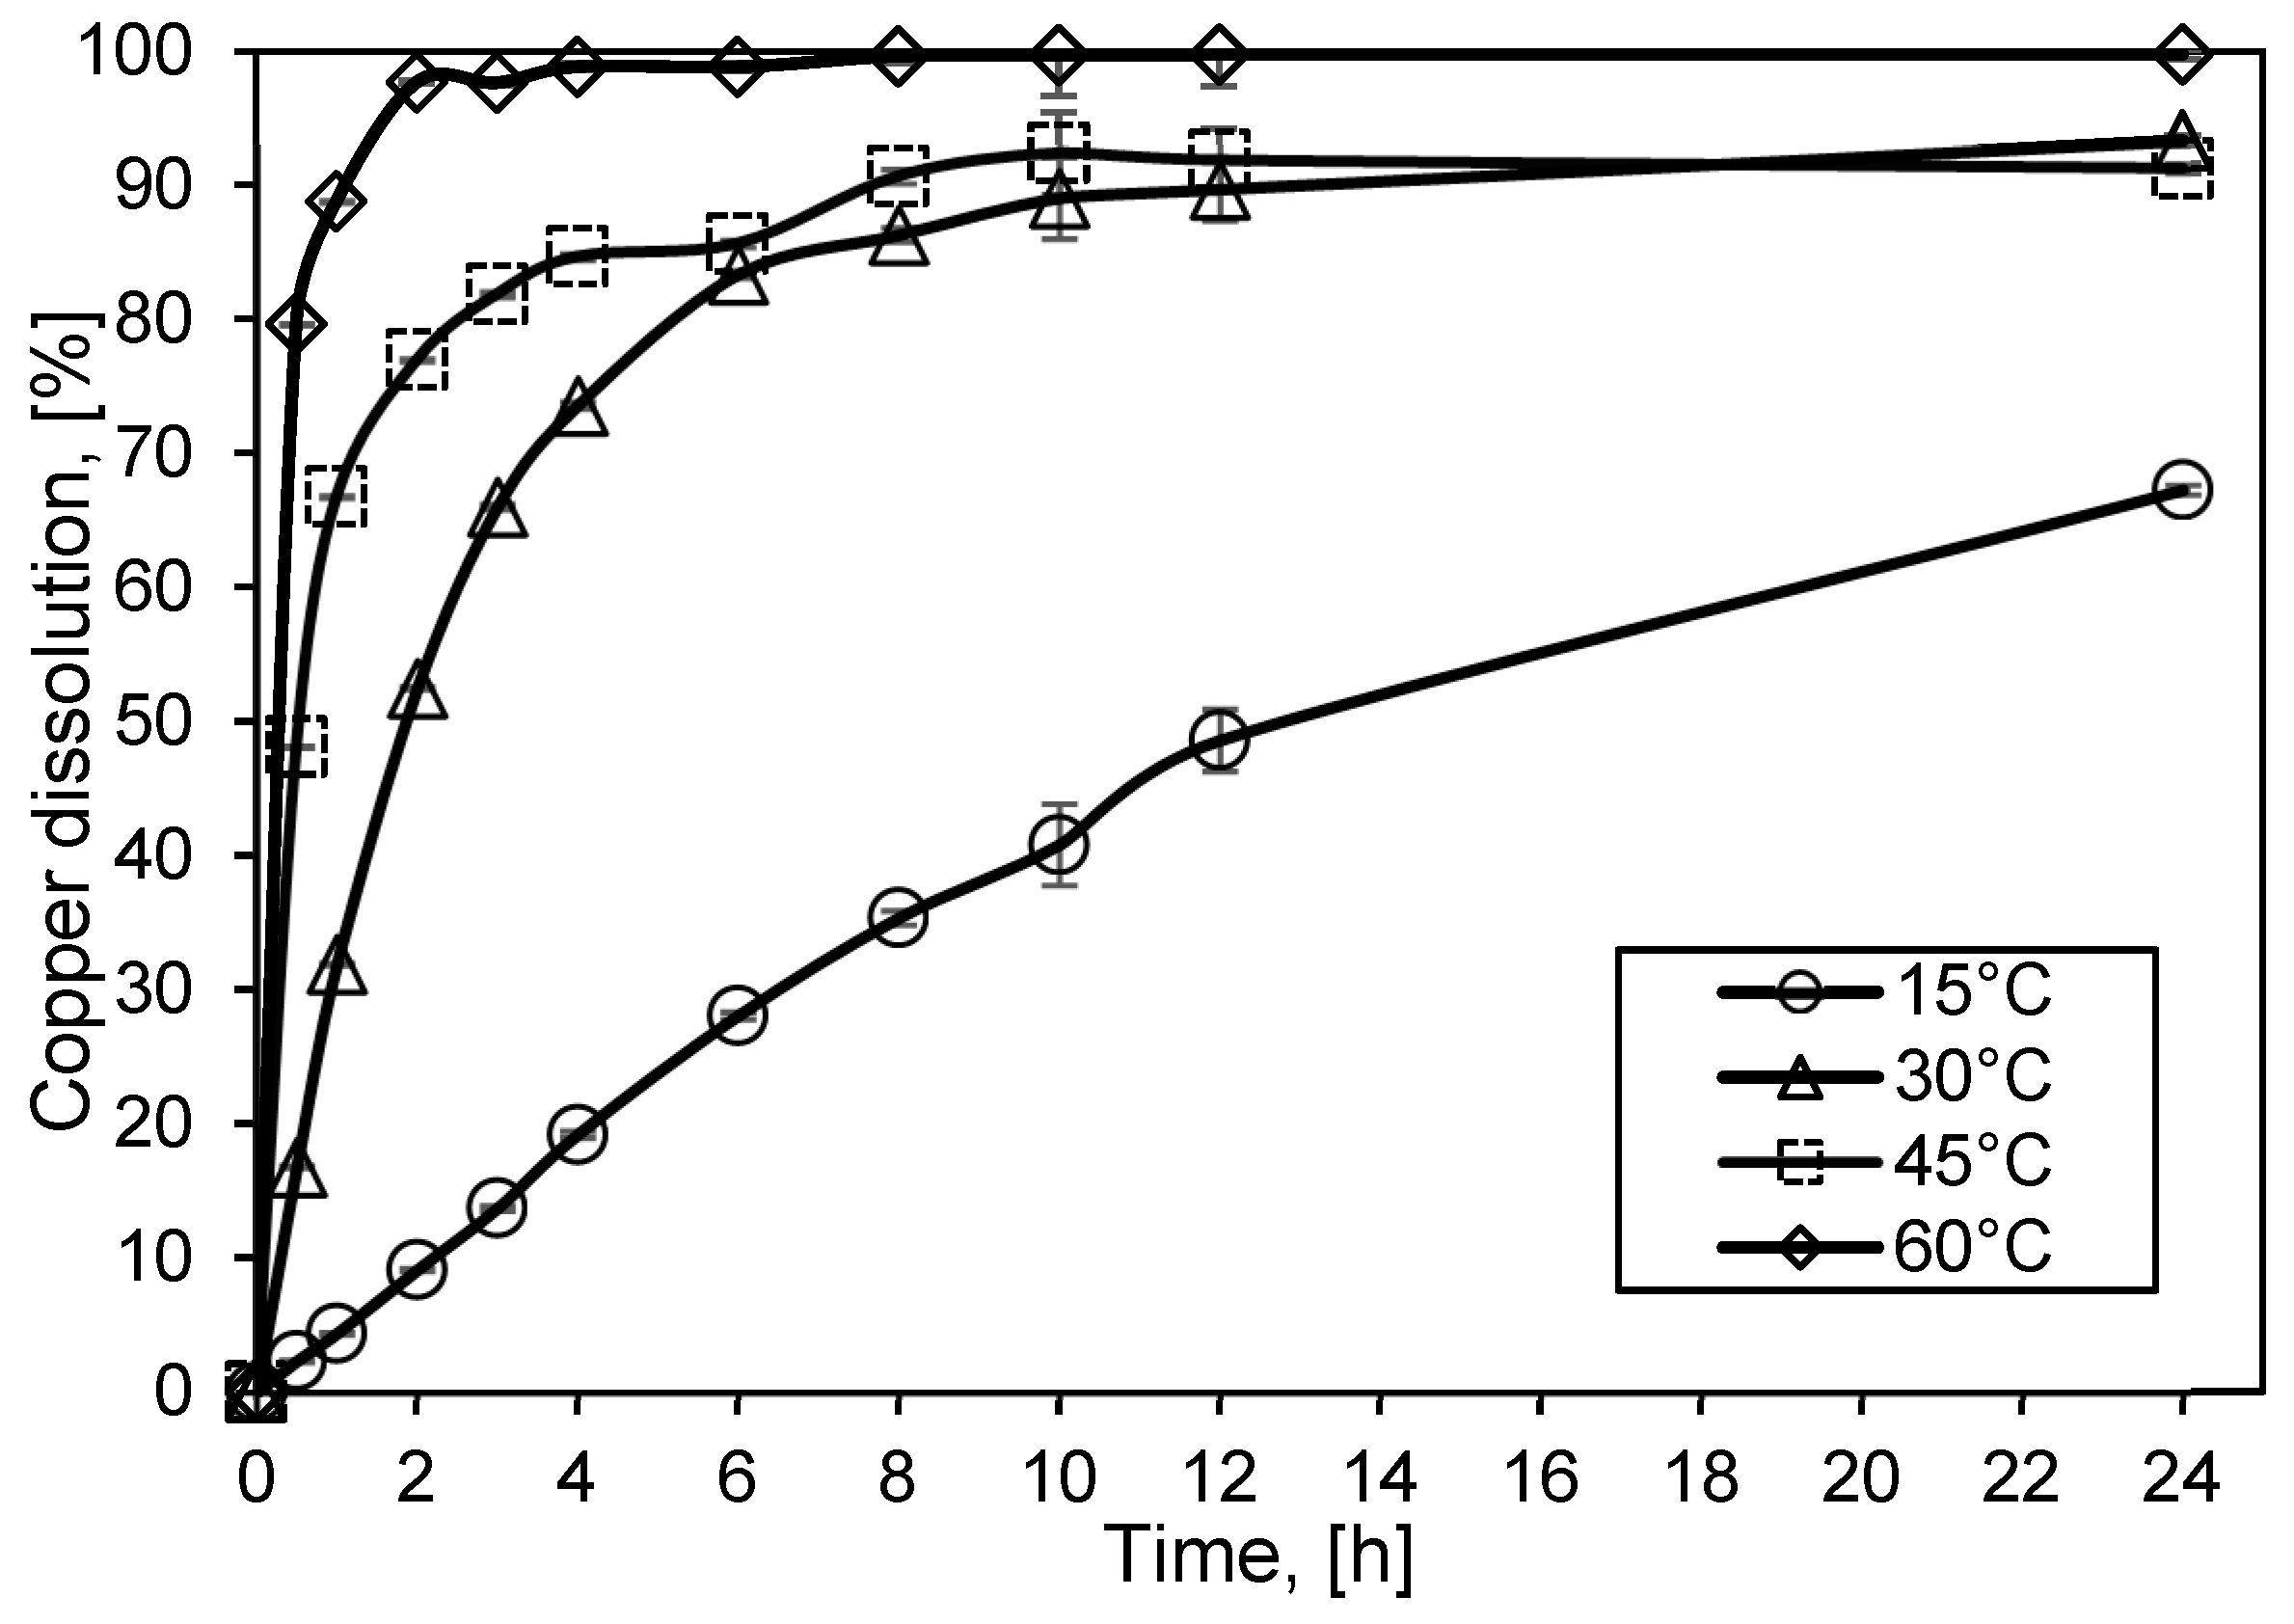
3.2. Assessment of Temperature

Figure 5 illustrates the effect of temperature on copper dissolution rate. Copper extraction rates increase remarkably with increasing temperature from 15 to 60 °C in 2 h, indicating that temperature plays a significant role in copper extraction. After 24 h, complete copper dissolution was obtained at 60 °C, 91% at 45 °C, 93% at 30 °C, and 67% at 15 °C. Temperature does not affect copper extraction linearly, which might be due to the surface chemical reaction and the intrinsic physicochemical properties of the solution that influence mass transport. A similar high-temperature dependence for malachite leaching has also been observed by Tanda, Oraby, et al., (2018) [20], who obtained 83.6% and 22.3% copper dissolution in 5 min at 50°C and 25 °C.

3.3. Kinetic Analysis

Temperature has a much more significant effect on the rate of a chemical reaction than on the diffusion. Therefore, changing the reaction temperature can indicate whether the alkaline leaching process is chemically or diffusion controlled. Figure 5 clearly shows the effect of temperature on the leaching kinetics, going from a 67% copper extraction at 15 °C in 24 h to an almost complete dissolution of copper at 60 °C in just over 2 h. However, a decrease in leaching kinetics can also be observed after 2 and 4 h at 30 and 45 °C, respectively. At these temperatures, it can also be observed that the copper leaching is almost null after 12 h. That shows that the leaching process may present the second step, i.e., mixed control. Therefore, the leaching rate data of copper for the first 12 h at different temperatures and glutamate concentrations shown in Figure 3 and Figure 4 were substituted and fitted into Equations (4)–(7), and the results can be seen in Table 4. This table shows that all the experimental data fit well with the mixed control model except for the tests at 15 °C that show copper leaching occurs only through a chemical reaction with a fitting coefficient of 0.9993. That is because copper leaching is slow at this temperature, and the transition in the control mechanism did not occur after 24 h at 15 °C. While at other temperatures and different concentrations of glutamate, model mixed control can be adopted to describe the copper leaching process in alkaline monosodium glutamate solutions. In Figure 6, plots of Equation (6) versus time for different glutamate concentrations and temperatures show a good fit (R2 > 0.9510 and R2 > 0.9).
Figure 7 shows the plot of ln k vs. 1/T and the fitted results for copper dissolution in the mixed control. From the slope of the fitted equation in Figure 6, the apparent activation energy of the first control stage was 21.8 kJ/mol. According to Marsden and House, 2006 [34], diffusional and chemically controlled reactions have an activation energy between 5 and 20 kJ/mol and 40 and 400 kJ/mol, respectively. Therefore, the observed activation energy indicates that the dissolution mechanism of copper in glutamate solution has a mixed controlling mechanism. However, according to the kind of mineral and the conditions used in the experiments, the chemical reaction would be expected to be the controlling step. This result may be caused by particle size.
According to Gbor and Jia (2004), the effect of the particle size distribution on the kinetics parameters can be related to the covariance (CV) of the distribution. If the particle size distribution has a CV ˂ 0.3, the shrinking core model does not require the particle size distribution to be included. However, the PSD can affect the interpretation of the kinetics mechanisms at large CV values. As a result of the cumulative particle size distribution shown in Figure 2, CV was calculated to be 0.63. Considering that the CV value was so high, the equation representing diffusion in the ash layer and the mixed control equation for particles of the same size (23) fitted very well at a range of glutamate concentrations and temperatures. Comparatively, chemical control was not linearly related to monosized particles. Leaching data obtained at different glutamate concentrations and temperatures were analyzed using (14)–(17) to determine the copper leaching step. Following this, the Arrhenius equation was used to calculate the activation energy. The experimental data fit very well with the chemical and mixed control models, as shown in Table 5. In contrast, the rate constant (Krn) and the mean squared errors (MSE) are presented in Table 6, suggesting that chemical control describes the experimental values well. Therefore, the linear relationship observed between diffusion through the product layer and mixed control was caused by the broad particle size distribution.
An Arrhenius plot (Figure 8) shows the activation energy derived from Krn values at different temperatures. Ea was found to be 102.5 kJ/mol, which confirms that the rate-determining step is a chemical reaction.
The kinetic analysis under the specific mineral PSD according to Equation (18) of our proposed chemical control of the unreacted core model (16) is illustrated in Figure 9. This figure shows the model curves for the different glutamate concentrations and temperatures. The blue shades represent the detail of all intermediate particle sizes, while the segmented lines show some specific percentiles (25, 50, and 90). The first thing that can be observed is that the model (black line) in all conditions is near the experimental points, in coherence with the correlation coefficients’ R2 shown in Table 5, which validates our proposed model where the chemical control predominates.
It is interesting the detail that allows estimating this model through the intermediate percentiles and how it is related to the global behavior (black line); it does not necessarily follow the trajectory of a specific percentile (75, for example), which suggests that the global weighted curve transitions between the extreme cases of high velocities of the fines and slow velocities of the larger sizes. In addition, this behavior is highly sensitive to the operational conditions themselves.

4. Conclusions

Two parameters (temperature and glutamate concentration) studied in this work have been found to influence the leaching of copper from the tenorite. The temperature was noted to have the most significant influence on the leaching rate, with more than 95% copper dissolution in just less than 2 h at 60 °C. While at 30 °C, almost 90% of the dissolution of copper was obtained in 24 h. At the same time, glutamate concentrations from 0.2 M to 0.5 M improve the copper leaching. However, at a concentration of glutamate higher than 0.5 M, it was observed that the copper extraction did not exhibit any significant improvement, showing that the influence of glutamate content on the leaching rate reaches a plateau at concentrations higher than this. That behavior has also been reported with glycine concentrations higher than 0.5 M, requiring further studies to elucidate possible explanations. In summary, the MSG aqueous alkaline solution was an efficient agent for copper leaching from tenorite.
The leaching kinetics of copper from tenorite conforms to the shrinking core model. The leaching process presents mixed control. The first stage is controlled by a chemical reaction in the early stage, followed by the solid product layer diffusion. The activation energy of the mixed control model was 21.8 kJ/mol. However, incorporating particle size distribution in the SCM was required and enabled the determination of an activation energy value consistent with the chemical control. The activation energy of the chemical control model was 102.6 kJ/mol.
The agreement between experimental data and theoretical data according to Equation (18) and the proposed chemical control model (16) shows a good agreement between the experimental and global calculated copper dissolution, which indicates that the chemical model including PSD explains very well the kinetics of the copper leaching process from tenorite in alkaline monosodium glutamate solutions.

Author Contributions

Conceptualization, C.G.P.; methodology, C.G.P.; investigation, C.G.P.; writing—original draft preparation, C.G.P.; writing—review and editing, C.I., L.D., S.D.Q., and H.E.; Tisoftware simulation, S.D.Q.; supervision, C.I., L.D., and H.E.; funding acquisition C.G.P., C.I., L.D., and H.E. All authors have read and agreed to the published version of the manuscript.

Funding

This research was funded by ANID Chile through the ANID-PFCHA/National doctorate/2020-21200126, ANID projects AFB220002/AFB230001, Fondecyt Project 1211044, Anillo Project ACT210027, CODELCO through the “Piensa Minería” contest.

Data Availability Statement

Data are available on request from the authors. The data are not publicly available due to Laboratory data.

Acknowledgments

Authors gratefully acknowledge the support from Advance Mining Technology Center (AMTC) of Universidad de Chile and Western Australian School of Mines (WASM) of Curtin University.

Conflicts of Interest

Christian Ihle is employed by Shimin Engineering. The paper represents the views of the scientists and not those of the company.

References

  1. U.S. Geological Survey Copper Statistics and Information. Available online: https://www.usgs.gov/centers/nmic/copper-statistics-and-information (accessed on 20 January 2023).
  2. Tabelin, C.B.; Park, I.; Phengsaart, T.; Jeon, S.; Villacorte-Tabelin, M.; Alonzo, D.; Yoo, K.; Ito, M.; Hiroyoshi, N. Copper and Critical Metals Production from Porphyry Ores and E-Wastes: A Review of Resource Availability, Processing/Recycling Challenges, Socio-Environmental Aspects, and Sustainability Issues. Resour. Conserv. Recycl. 2021, 170, 105610. [Google Scholar] [CrossRef]
  3. Schipper, B.W.; Lin, H.C.; Meloni, M.A.; Wansleeben, K.; Heijungs, R.; van der Voet, E. Estimating Global Copper Demand until 2100 with Regression and Stock Dynamics. Resour. Conserv. Recycl. 2018, 132, 28–36. [Google Scholar] [CrossRef]
  4. Mwanat, M.H.M.; Kasongo, K.B.; Muliangala, M.F.; Kayembe, M.M.; Kapiamba, K.F.; Ngenda, B.R. Simulation of Simultaneous Leaching of Copper and Cobalt Minerals in Acid-Reductive Media: Sensitivity Analysis and Optimization. J. Sustain. Metall. 2022, 8, 837–850. [Google Scholar] [CrossRef]
  5. Aracena, A.; Vivar, Y.; Jerez, O.; Vásquez, D. Kinetics of Dissolution of Tenorite in Ammonium Media. Miner. Process. Extr. Metall. Rev. 2015, 36, 317–323. [Google Scholar] [CrossRef]
  6. Tanda, B.C.; Eksteen, J.J.; Oraby, E.A. An Investigation into the Leaching Behaviour of Copper Oxide Minerals in Aqueous Alkaline Glycine Solutions. Hydrometallurgy 2017, 167, 153–162. [Google Scholar] [CrossRef]
  7. Shabani, M.A.; Irannajad, M.; Azadmehr, A.R. Investigation on Leaching of Malachite by Citric Acid. Int. J. Miner. Metall. Mater. 2012, 19, 782–786. [Google Scholar] [CrossRef]
  8. Habbache, N.; Alane, N.; Djerad, S.; Tifouti, L. Leaching of Copper Oxide with Different Acid Solutions. Chem. Eng. J. 2009, 152, 503–508. [Google Scholar] [CrossRef]
  9. Biswas, S.; Mulaba-bafubiandi, A.F. Extraction of Copper and Cobalt from Oxidized Ore Using Organic Acids. In Proceedings of the Hydrometallurgy Conference 2016: Sustainable Hydrometallurgical Extraction of Metals, Cape Town, South Africa, 1–3 August 2016; Available online: https://www.researchgate.net/publication/305851241_Extraction_of_Copper_and_Cobalt_from_Oxidized_Ore_using_Organic_Acids (accessed on 22 June 2024).
  10. Deng, J.; Wen, S.; Deng, J.; Wu, D.; Yang, J. Extracting Copper by Lactic Acid from Copper Oxide Ore and Dissolution Kinetics. J. Chem. Eng. Jpn. 2015, 48, 538–544. [Google Scholar] [CrossRef]
  11. Rojas, N.; Bustamante, O. Disolución de Cobre En Cianuración Convencional Proveniente de Ferrita Cúprica. Dyna 2007, 74, 151–157. [Google Scholar]
  12. Oudenne, P.D.; Olson, F.A. Leaching Kinetics of Malachite in Ammonium Carbonate Solutions. Metall. Trans. B 1983, 14, 33–40. [Google Scholar] [CrossRef]
  13. Jamett, I.; Carrasco, P.; Olmos, M. Glycine/Glutamate: “Green” Alternatives to Recover Metals from Minerals/Residues—Review of Current Research. Minerals 2023, 13, 22. [Google Scholar] [CrossRef]
  14. Li, H.; Deng, Z.; Oraby, E.; Eksteen, J. Amino Acids as Lixiviants for Metals Extraction from Natural and Secondary Resources with Emphasis on Glycine: A Literature Review. Hydrometallurgy 2023, 216, 106008. [Google Scholar] [CrossRef]
  15. Hao, J.; Wang, Y.; Wu, Y.; Guo, F. Metal Recovery from Waste Printed Circuit Boards: A Review for Current Status and Perspectives. Resour. Conserv. Recycl. 2020, 157, 104787. [Google Scholar] [CrossRef]
  16. Li, H.; Oraby, E.; Eksteen, J. Extraction of Copper and the Co-Leaching Behaviour of Other Metals from Waste Printed Circuit Boards Using Alkaline Glycine Solutions. Resour. Conserv. Recycl. 2020, 154, 104624. [Google Scholar] [CrossRef]
  17. Eksteen, J.J.; Oraby, E.A.; Tanda, B.C. A Conceptual Process for Copper Extraction from Chalcopyrite in Alkaline Glycinate Solutions. Miner. Eng. 2017, 108, 53–66. [Google Scholar] [CrossRef]
  18. Tanda, B.C.; Eksteen, J.J.; Oraby, E.A.; O’Connor, G.M. The Kinetics of Chalcopyrite Leaching in Alkaline Glycine/Glycinate Solutions. Miner. Eng. 2019, 135, 118–128. [Google Scholar] [CrossRef]
  19. Conejeros, V.; Pérez, K.; Jeldres, R.I.; Castillo, J.; Hernández, P.; Toro, N. Novel Treatment for Mixed Copper Ores: Leaching Ammonia–Precipitation–Flotation (L.A.P.F.). Miner. Eng. 2020, 149, 106242. [Google Scholar] [CrossRef]
  20. Tanda, B.C.; Oraby, E.A.; Eksteen, J.J. Kinetics of Malachite Leaching in Alkaline Glycine Solutions. Miner. Process. Extr. Metall. Trans. Inst. Min. Metall. 2018, 130, 16–24. [Google Scholar] [CrossRef]
  21. Perea, C.G.; Restrepo, O.J. Uso De Aminoácidos Para La Disolución De Cobre a Partir De Residuos De Aparatos Eléctricos Y Electrónicos_V2. In Proceedings of the VII Latinometalurgia Conference, Cusco, Peru, 25–27 October 2017; Available online: https://www.scribd.com/document/363047178/VII-LATINOMETALURGIA-CONGRESO-INTERNACIONAL-EN-CUSCO-PERU-Libro-de-Ponencias-y-Resumenes (accessed on 10 July 2024).
  22. Perea, C.G.; Restrepo Baena, O.J.; Ihle, C.F.; Estay, H. Copper Leaching from Wastes Electrical and Electronic Equipment (WEEE) Using Alkaline Monosodium Glutamate: Thermodynamics and Dissolution Tests. Clean. Eng. Technol. 2021, 5, 100312. [Google Scholar] [CrossRef]
  23. Prasetyo, E.; Anderson, C.; Nurjaman, F.; Al Muttaqii, M.; Handoko, A.S.; Bahfie, F.; Mufakhir, F.R. Monosodium Glutamate as Selective Lixiviant for Alkaline Leaching of Zinc and Copper from Electric Arc Furnace Dust. Metals 2020, 10, 644. [Google Scholar] [CrossRef]
  24. Khetwunchai, N.; Akeprathumchai, S.; Thiravetyan, P. Recovery of Copper and Gold from Waste Printed Circuit Boards Using Monosodium Glutamate Supplemented with Hydrogen Peroxide. Minerals 2023, 13, 321. [Google Scholar] [CrossRef]
  25. Perea, C.G.; Restrepo, O.J. Use of Amino Acids for Gold Dissolution. Hydrometallurgy 2018, 177, 79–85. [Google Scholar] [CrossRef]
  26. Bahfie, F.; Supriadi, M.R.; Oediyani, S.; Nurjaman, F.; Astuti, W.; Prasetyo, E.; Susanti, D. Use of Monosodium Glutamate (MSG) for Green Leaching Process: An Overview. Period. Mineral. 2022, 91, 155–162. [Google Scholar] [CrossRef]
  27. Perea, C.G.; Ihle, C.; Estay, H.; Dyer, L. An Investigation into the Leaching Behavior of Tenorite in Aqueous Alkaline Monosodium Glutamate Solutions. In Proceedings of the Copper 2022 International Conference; The Chilean Institute of Mining Engineers, (IIMCh), Ed.; The Chilean Institute of Mining Engineers: Santiago, Chile, 2022; Volume 4, pp. 254–262. [Google Scholar]
  28. KTH Royal Institute of Technology; Puigdomenech, I. Hydra-Medusa 2015. Available online: https://www.kth.se/che/medusa/downloads-1.386254 (accessed on 10 July 2024).
  29. Tanda, B.C.; Eksteen, J.J.; Oraby, E.A. Kinetics of Chalcocite Leaching in Oxygenated Alkaline Glycine Solutions. Hydrometallurgy 2018, 178, 264–273. [Google Scholar] [CrossRef]
  30. Wadsworth, M.E.; Miller, J.D. Hydrometallurgical Processes. In Rate Processes of Extractive Metallurgy; Sohn, H.Y., Wadsworth, M.E., Eds.; Springer: Berlin, Germany, 1979; pp. 133–244. [Google Scholar]
  31. Bartlett, R.W. Solution Mining: Leaching and Fluid Recovery of Materials; Routledge: London, UK; Psychology Press: Hove, UK, 1998; ISBN 9056996339. [Google Scholar]
  32. Levenspiel, O. Ingeniería De Las Reacciones Químicas, 3rd ed.; Conesa, J., Arriola Guevara, E., Eds.; Limusa Wiley: México City, México, 2004; ISBN 968-18-5860-3. [Google Scholar]
  33. Dickinson, C.F.; Heal, G.R. Solid-Liquid Diffusion Controlled Rate Equations. Thermochim. Acta 1999, 340–341, 89–103. [Google Scholar] [CrossRef]
  34. Marsden, J.O.; House, C.I. Principles of Gold Hydrometallurgy. In The Chemistry of Gold Extraction; Society for Mining Metallurgy: Colorado, CO, USA, 2006; pp. 111–145. [Google Scholar]
  35. Gbor, P.K.; Jia, C.Q. Critical Evaluation of Coupling Particle Size Distribution with the Shrinking Core Model. Chem. Eng. Sci. 2004, 59, 1979–1987. [Google Scholar] [CrossRef]
  36. Veloso, T.C.; Peixoto, J.J.M.; Pereira, M.S.; Leao, V.A. Kinetics of Chalcopyrite Leaching in Either Ferric Sulphate or Cupric Sulphate Media in the Presence of NaCl. Int. J. Miner. Process. 2016, 148, 147–154. [Google Scholar] [CrossRef]
  37. Ranjbar, M.; Hamghavandi, M.R.; Fazaelipoor, M.H.; Schaffie, M.; Manafi, Z. Development of a Kinetic Model of the Bacterial Dissolution of Copper Concentrate. Min. Eng. 2019, 71, 55–56. [Google Scholar] [CrossRef]
  38. Elmisaoui, S.; Latifi, A.M.; Khamar, L. Analysis of the Dissolution of Phosphate Ore Particles in Phosphoric Acid: Influence of Particle Size Distribution. Hydrometallurgy 2024, 223, 106197. [Google Scholar] [CrossRef]
Figure 1. Eh–pH stability diagram for the CuO–glut–H2O system at 25 °C; [Cu] = 3.14 × 10⁻² M and [glut] = 0.5 M.
Minerals 14 00714 g001
Figure 2. Particle size distribution in tenorite samples via laser diffraction using Malvern Mastersizer 2000.
Minerals 14 00714 g002
Figure 3. X-ray diffraction pattern of tenorite sample.
Minerals 14 00714 g003
Figure 4. Effect of monosodium glutamate concentration on the dissolution of tenorite. Working conditions: pH = 9.4, temperature = 30 °C, and solids content = 0.5% w/v.
Minerals 14 00714 g004
Figure 5. Effect of temperature on dissolution of tenorite. Working conditions: pH = 9.4, glutamate = 0.5 M, and solids content = 0.5% w/v.
Minerals 14 00714 g005
Figure 6. Plots of 1 3 l n 1 x + ( 1 x ) 1 3 1 versus time at different glutamate concentrations and temperatures.
Minerals 14 00714 g006
Figure 7. Arrhenius plot for copper dissolution in the mixed control stage.
Minerals 14 00714 g007
Figure 8. Arrhenius plot for copper dissolution in the chemical control stage considering the particle size distribution.
Minerals 14 00714 g008
Figure 9. Validation plot of the chemical control with PSD kinetic model and experimental values of the copper dissolution.
Minerals 14 00714 g009
Table 1. Summary of research with MSG for the leaching of copper, zinc, and gold from pure foils and waste.
MaterialReaction ConditionsMetal Recovery (wt%)References
Electrical and electronic waste0.5 M MSG, 0.03 M
H2O2, pH 9.4, for 2 h at room temperature.
92% Cu[21,22]
Electrical and electronic waste0.5 M MSG, 0.03 M
KMnO4, pH 9.4, after 20 h at room temperature.
79% Cu[21,22]
Electric arc furnace dust1 M MSG, pH 9, solid–liquid ratio: 50 g/L, at room temperature, 2 and 4 h for Zn and Cu, respectively.86% Cu and 99% Zn[23]
Printed circuit boards waste0.75 M MSG, 0.5% (w/v) H2O2 initial pH 7, 150 rpm, for 3 h at 30 °C.93% Cu[24]
Printed circuit boards waste1 M MSG, 0.25% (w/v) H2O2 initial pH 7, 150 rpm, for 3 h at 30 °C.86% Au[24]
Electrical and electronic waste0.5 M MSG, 0.03 M
KMnO4, pH 9.4, after 24 h at room temperature.
11.8% Au[25]
Table 2. Percentage of the elemental composition of the tenorite sample determined with XRF. wt% element concentration.
SampleAlSiPClCaCuThLE
10.60.720.281.960.1875.530.7919.77
20.630.690.271910.1773.620.7521.8
30.550.70.271.910.1772.480.7423.01
Average0.590.70.271.930.1773.880.7621.52
LE: Light elements, that cannot be detected, include O, Na, C, and N.
Table 3. Experimental design of the leaching tests.
# TestVariablesT (°C)Glutamate Concentration (M)
1Temperature150.5
2300.5
3450.5
4600.5
5Glutamate concentration300.2
6301
Table 4. Correlation coefficient values for kinetic models.
Coefficient of Variation for the Evaluated Models: R2
VariablesChemical Reaction ControlsDiffusion through Product Layer ControlsMixed ControlNo Product Layer Formation-Film Diffusion Controls
1 ( 1 x ) 1 / 3 1 3 ( 1 x ) 2 / 3 + 2 ( 1 x ) 1 3 l n 1 x + ( 1 x ) 1 3 1 1 ( 1 x ) 2 / 3
Glutamate concentration
0.20.89270.94710.94230.8147
0.50.93090.97160.98440.8505
10.92450.96610.97910.8466
Temperature
150.99930.94100.90900.9984
300.93090.97160.98920.9005
450.83410.89440.97540.7928
600.78330.56070.98400.7185
Table 5. Correlation coefficient values for kinetic models considering the effect of PSD.
Coefficient of Variation for the Evaluated Models: R2
VariablesChemical Reaction ControlsDiffusion through Product Layer ControlsMixed Control
1 ( 1 x ) 1 / 3 1 3 ( 1 x ) 2 / 3 + 2 ( 1 x ) 1 3 l n 1 x + ( 1 x ) 1 3 1
Glutamate concentration
0.20.990.890.99
0.50.960.830.96
10.960.820.96
Temperature
150.970.750.97
300.960.830.96
451.000.911.00
600.970.680.97
Table 6. Values of Krn and MSE at different glutamate concentrations and temperatures by chemical reaction and mixed control.
VariablesChemical Reaction ControlsMixed Control
KrnMSEKrn1Krn2MSE
Glutamate concentration
0.20.05370.0071.00 × 10−160.05540.007
0.50.12130.0431.00 × 10−160.11900.041
10.26060.0441.00 × 10−160.26060.044
Temperature
151.10740.0131.00 × 10−161.09750.012
300.12130.0431.00 × 10−160.11900.041
450.03830.0031.00 × 10−160.03970.004
600.00260.0291.00 × 10−160.00500.023
Disclaimer/Publisher’s Note: The statements, opinions and data contained in all publications are solely those of the individual author(s) and contributor(s) and not of MDPI and/or the editor(s). MDPI and/or the editor(s) disclaim responsibility for any injury to people or property resulting from any ideas, methods, instructions or products referred to in the content.

