Article

Preparation of High-Purity Quartz Sand by Vein Quartz Purification and Characteristics: A Case Study of Pakistan Vein Quartz

State Key Laboratory of Lithospheric and Environmental Coevolution, University of Science and Technology of China, Hefei 230026, China
*
Author to whom correspondence should be addressed.
Minerals 2024, 14(7), 727; https://doi.org/10.3390/min14070727 (registering DOI)
Submission received: 11 June 2024 / Revised: 15 July 2024 / Accepted: 16 July 2024 / Published: 19 July 2024
(This article belongs to the Special Issue Physicochemical Properties and Purification of Quartz Minerals)

Abstract

:
This study focuses on the purification and evaluation of the high-purity quartz (HPQ) potential of vein quartz ore from Pakistan. Vein quartz is grayish-white and translucent, with its mineral composition mainly comprising quartz crystal. Processed quartz sand is obtained from quartz raw ore through purifying technologies, including crushing, ultrasonic desliming, flotation, high-temperature calcination, water quenching, hot pressure acid leaching, and chlorination roasting. The microscopic characteristics show that the vein quartz raw ore has a medium-coarse granular metacrystalline structure, high quartz content, with only a small quantity of fine-grained K-feldspar. The inclusions primarily consist of large-sized primary inclusions and secondary fluid inclusions developed along the micro-fractures, and the content of inclusions in most areas of the crystal is very low or even nonexistent. The quartz ore with such inclusion characteristics is considered a relatively good raw material for quartz. Component analysis shows that the main impurity elements in the quartz ore are Al, K, Ca, Na, Ti, Fe, and Li, with a total impurity element content of 128.86 µg·g−1. After purification, only lattice impurity elements Al, Ti, and Li remain in the processed quartz sand, resulting in a total impurity element content of 24.23 µg·g−1, an impurity removal rate of 81.20%, and the purity of SiO2 reaching 99.998 wt.%. It is suggested that when the quartz raw ore contains high content of lattice impurity elements, such as Al, Li, and Ti, it is difficult to remove them by the current purification method. In industrial production, considering the economic cost, if quartz sand still contains high content of lattice impurity elements Al, Ti, and Li after flotation, it cannot be used as a raw material for high-end HPQ.

1. Introduction

Quartz is a type of mineral resource with stable physical and chemical properties [1]. The 21st century has heralded the future of silicon-based materials, with the rapid development of high-tech industries such as semiconductors, photovoltaics, electronic information, optical communications, and electric light sources. Consequently, the demand for high-purity quartz (HPQ) as a raw material has increased significantly [2,3,4,5,6]. HPQ is processed from naturally occurring crystals, granite pegmatite quartz, and vein quartz as raw material ores [7,8], which are mainly used to make high-quality optical devices, optical fibers, quartz glass, synthetic quartz wafers, crucibles for the production of solar-grade silicon, quartz cotton, and electronic fibers [9,10,11,12]. During the crystallization process of quartz crystals, various imperfections such as point defects, dislocations, planar defects, melts/fluids, and mineral micro-inclusions can enter the quartz crystal due to alteration, irradiation, diagenesis, or metamorphism at different P-T conditions [13]. As a result, quartz crystals contain various inclusions and lattice impurities [14]. To obtain HPQ sand, these impurities must be removed through subsequent processes including crushing, calcination, water quenching, screening, magnetic separation, color separation, flotation, acid leaching, chlorination, and other purification methods [15,16,17,18,19,20,21,22,23]. The SiO2 content of HPQ sand is usually more than 99.9%, and that of ultra-HPQ is more than 99.999% (with Al < 8 µg·g−1, Fe < 0.05 µg·g−1, Ti < 1.3 µg·g−1, etc.). Taking Unimin Corporation of the United States as an example, its IOTA standard has been internationally recognized, and the purity of its HPQ products reaches 99.9994% [24].
With the gradual depletion of crystal resources, the process of separating HPQ (especially ultra-HPQ) from natural quartz ores with relatively abundant reserves and wide distribution, such as granite pegmatite rocks and vein quartz, has become a current and future research hotspot [25]. Due to its coarse grain size, easy dissociation, and high SiO2 content, vein quartz crystallized in hydrothermal veins is an ideal raw material ore for processing HPQ as a substitute for natural crystal [8,26]. In the past few decades, several research works on vein quartz as a raw material ore for HPQ have been conducted. Müller et al. (2012) [27] found that the lattice trace elements Al (15.0–20.0 µg·g−1), Ti (2.0 µg·g−1), Ge (1.0 µg·g−1), and Li (5 µg·g−1) were low in Nesodden and Kvalvik vein quartz from Norway. Therefore, Nesodden and Kvalvik vein quartz are excellent raw material ores for the preparation of HPQ. Zhong et al. (2022) [28] used the quartz vein ore in Dabie Mountain, Anhui Province as raw material, and obtained HPQ sand with a content of SiO2 higher than 99.997% by purification. Among them, the concentration of K and Na impurities is 1.0 µg·g−1, and that of Al impurities is about 12 µg·g−1. Wang et al. (2022) [29] carried out an experimental study on the purification of quartz samples from the Fujiashan Mountains in southeastern Hubei Province. The total impurities content of the processed quartz sand is 48.7 µg·g−1 with Al (28.2 µg·g−1), Ti (4.5 µg·g−1), Fe (0.7 µg·g−1), Li (3.7 µg·g−1), and B (0.4 µg·g−1), and K, Na, and Ca are all below the upper content limits of HPQ designated by Müller et al. (2012) [27].
In this study, the mineralogical characteristics of vein quartz samples from KPk Province, Pakistan were studied using optical microscopy, Raman spectroscopy, and scanning electron microscopy (SEM). The quality of quartz ore after purification was evaluated by crushing, flotation, calcination, water quenching, acid leaching, and chlorination. Furthermore, based on the changes in impurity element contents before and after purification, the occurrence state and distribution of impurity elements in quartz were analyzed. This analysis provides a certain guiding significance for the selection of HPQ raw materials and the improvement of purification technology in the future.

2. Hand Specimen of Sample

One of the methods to evaluate the quality of HPQ raw materials is by observing the structure, grain size, color, transparency, cracks, and impurity components of ore hand specimens visible to the naked eye. Combining theory with experience, the mineral composition of quartz raw ore is mainly quartz, without a large number of different associated minerals visible to the naked eye, with high transparency and uniform grain size, which are the basic characteristics of HPQ raw materials [30].
The hand specimen of B6-1 quartz sample exhibits a block structure, dense and hard, with uniform grain size. It is translucent grayish-white, brittle, and has an oil luster, shell-like fracture, along with a small number of surface cracks, and no cleavage surface. The mineral composition is mainly quartz crystal, with light yellowish-brown rust visible on the naked eye (Figure 1a,b). From the hand specimen, B6-1 quartz has the basic characteristics of HPQ raw materials.

3. Purification Process

3.1. Experiment Reagents

The reagents used in purification process are as follows: dodecylamine (CHN, AR), sodium dodecyl benzene sulfonate (CHNaO3S, AR), hydrochloric acid (HCl, GR), nitric acid (HNO3, GR), hydrofluoric acid (HF, GR), sulfuric acid (H2SO4, AR), sodium hydroxide (NaOH, AR), and manganese dioxide (MnO2, AR), all of which were purchased from Sinopharm Chemical Reagent Co., Ltd., Shanghai, China. Ultrapure deionized water with a resistivity of 18.25 MΩ·cm was used in all experiments.

3.2. Experimental Procedures

Quartz purification techniques involve several steps: pre-treatment, physical separation methods, chemical treatments, and advanced treatments. Pre-treatment includes crushing, scrubbing, desliming, screening, and grinding [31,32]. Physical separation methods include radiometric sorting, dense media separation, gravity separation, magnetic-electric separation, and flotation [15,16,17]. Chemical treatments involve high-temperature calcination–water quenching, and acid leaching [18,23]. Advanced treatments include chlorination, roasting, and vacuum refining [20]. Each method corresponds to the characteristics of different impurities, and the characteristics of quartz ore impurities are often used to adopt the corresponding purification methods; combining different methods logically is good strategy for achieving the purpose of purification [33].
The purity of vein quartz is usually high, and the main impurities in the raw ore are in the form of a small number of gangue minerals, inclusions, and lattice impurity elements. Therefore, this experiment intends to separate gangue minerals through processes such as grinding, screening, ultrasonic cleaning, and flotation. Additionally, it seeks to break down inclusions and remove impurities by means of calcination–water quenching, hot pressing, acid leaching, and high-temperature chlorination [15,16,17,18,19,20,21,22,23]. The specific experimental flow chart is shown in Figure 2.
Crushing and screening: 1 kg of quartz raw ore was separated into decimeter-scale pieces with a hammer. Subsequently, all quartz fragments were washed and brushed in water to remove any surface contamination, especially clay minerals and iron oxide coatings. Then, the small block of quartz was crushed into quartz sand using a jaw crusher (PE−F100 × 125). Standard nylon sieves were used to divide quartz sands into different fractions, with particle sizes of −0.425 +0.074 mm (40–200 mesh) collected for next experiments. Because the quartz sand crushed by the crusher contains more mechanical entrained iron, and considering the limited laboratory conditions, strong magnets were used to identify the appropriately sized quartz sand particles for magnetic absorption and remove the mechanical iron content. This approach can yield better experimental results when using a strong magnetic separator.
Ultrasonic scrubbing–desliming: the prepared −0.425 +0.074 mm qualified quartz sand underwent ultrasonic scrubbing–desliming: Fixed scrub slurry concentration at 50%, and each scrubbing session lasted for 30 min. The water was replaced every 10 min, and ultrasonic scrubbing is carried out three times, followed by two washes to obtain ultrasonically scrubbed quartz sand.
Flotation: The flotation experiment was carried out using an XFD-12 (0.5 L) flotation machine, with a stirring rate of 1500 rpm. In this work, a 100 g quartz sand sample was dispersed in a flotation cell filled with ultrapure deionized water. The flotation temperature was maintained between 50 and 60 °C, and the pH value was adjusted to 2.5 using hydrofluoric acid. After stirring for 2 min, 2 mL dodecylamine (DDA) collector and 2 mL sodium dodecyl benzene sulfonate (SDBS) foaming agent were sequentially added to the cell, air flow rate was 0.25 m3/h, and the first flotation process lasted for about 10 min. Similar to the first flotation, the second flotation experiment was performed with half amount of the DDA and SDBS, and some ultrapure water was also added to maintain the slurry level during the flotation experiment. The pH of the slurry during the whole flotation procedure was adjusted to a fixed value of 2.5. The sink quartz sand was collected and dried.
Calcination–water quenching: The flotation quartz sand was calcined at 1050 °C for 1 h with calcination heating rate of 10 °C/min in a muffle furnace (KSl-1200X, KEJING, HeFei, China). The calcined quartz sand was rapidly poured in ultrapure water (18.2 MΩ·CM), cleaned three times using ultrasonic and then dried for further acid leaching experiment.
Acid leaching: 10.0 g of quenched quartz sand was accurately weighed and placed in a polytetrafluoroethylene hydrothermal reactor cleaned with ultrapure water. In the HCl-HF-HNO3 mixed acid system (with a mass ratio of 3:1:1), the liquid/solid ratio was 1:1, the reaction temperature was 80 °C, and the reaction time was 24 h. After the acid leaching process, the quartz sand was ultrasonically cleaned with ultrapure water until reaching a neutral pH and then dried.
Chlorination roasting: Figure 3 illustrates the experimental setup used for chlorination roasting. A 25 g quantity of MnO2 was precisely measured and placed in a round-bottomed flask. Subsequently, 250 mL of HCL was added to a long-neck funnel and the reaction temperature was carefully controlled at 80 °C. One bubble was generated every second in a H2SO4 drying flask. To begin the process, 8.0 g of acid-leached quartz sand was weighed accurately and heated to a high temperature of 1050 °C in a Cl2 atmosphere for 2 h. After completion of the experiment, argon gas was injected to purge any excess Cl2, which was then absorbed by a NaOH solution.

4. Analytical Method

4.1. Optical Microscopy Observation

Double-polished thin sections were prepared for microscopic scrutiny from the B6-1 vein quartz ore sample. A transmitted polarizing microscope (TPM, Nikon DS-RI2, Tokyo, Japan) was used to characterize the petrological features of the quartz raw ore and the processed quartz sand, including granular size, fluid and mineral micro-inclusion assemblage, and microstructure.

4.2. Scanning Electron Microscope

Backscattered electron (BSE) imaging of the quartz raw ore and the processed quartz sand, and identification of unknown minerals were conducted using TESCAN MIRA3 scanning electron microscope (SEM) equipped with EDAX GENESIS APEX Apollo System energy-dispersive spectrometer (EDS) at CAS Key Laboratory of Crust–Mantle Materials and Environments at the University of Science and Technology of China (USTC), Hefei, with working conditions of 15 kV and 15 nA for BSE imaging and EDS analysis.

4.3. Raman Spectrometry Measurement

Fluid and mineral micro-inclusions in the quartz raw ore and the processed quartz sand were identified by a JY HORIBA LabRam HR Evolution confocal Raman micro-spectrometer (HORIBA, Tokyo, Japan) equipped with a confocal optics, an air-cooled CCD detector, and 532 nm Ar laser excitation with 500 mW power, at CAS Key Laboratory of Crust–Mantle Materials and Environments in USTC, Hefei. The analytical conditions included a 1 μm beam diameter, 200 μm slit width, 100 μm confocal aperture, 600 grooves/mm gratings, 100× objective, 2× accumulations, and 3 s acquisition time. The polycrystalline and monocrystalline silicon were analyzed at the start and end of each analytical session of the samples to check the stability of the instrument and ensure the reliability of the data (520.7 cm−1 for a silicon metal standard).

4.4. Bulk Chemical Composition Analysis by ICP-MS

The impurity contents in quartz were measured at the CAS Key laboratory of Crust–Mantle Materials and Environments, University of Science and Technology of China, using an Agilent 7700e quadrupole ICP-MS. Approximately 50 mg of quartz samples and GBW07837 quartz reference material were dissolved with purified HNO3 and HF. The sample solution was analyzed using ICP-MS with an RF power of 1350 W and a nebulized gas flow rate of 1.0 L/min. In order to eliminate the interferences of polyatomic ion impurities, 3.5 mL/min of helium was introduced as the collision gas during the analysis. The standard correction curve solution for calculating the sample solution contents was prepared by 13 elements mixing standard solution NCS181036 from NCS Testing Technology Co. Ltd. (Beijing, China).

5. Results and Discussion

5.1. Characteristics of Vein Quartz

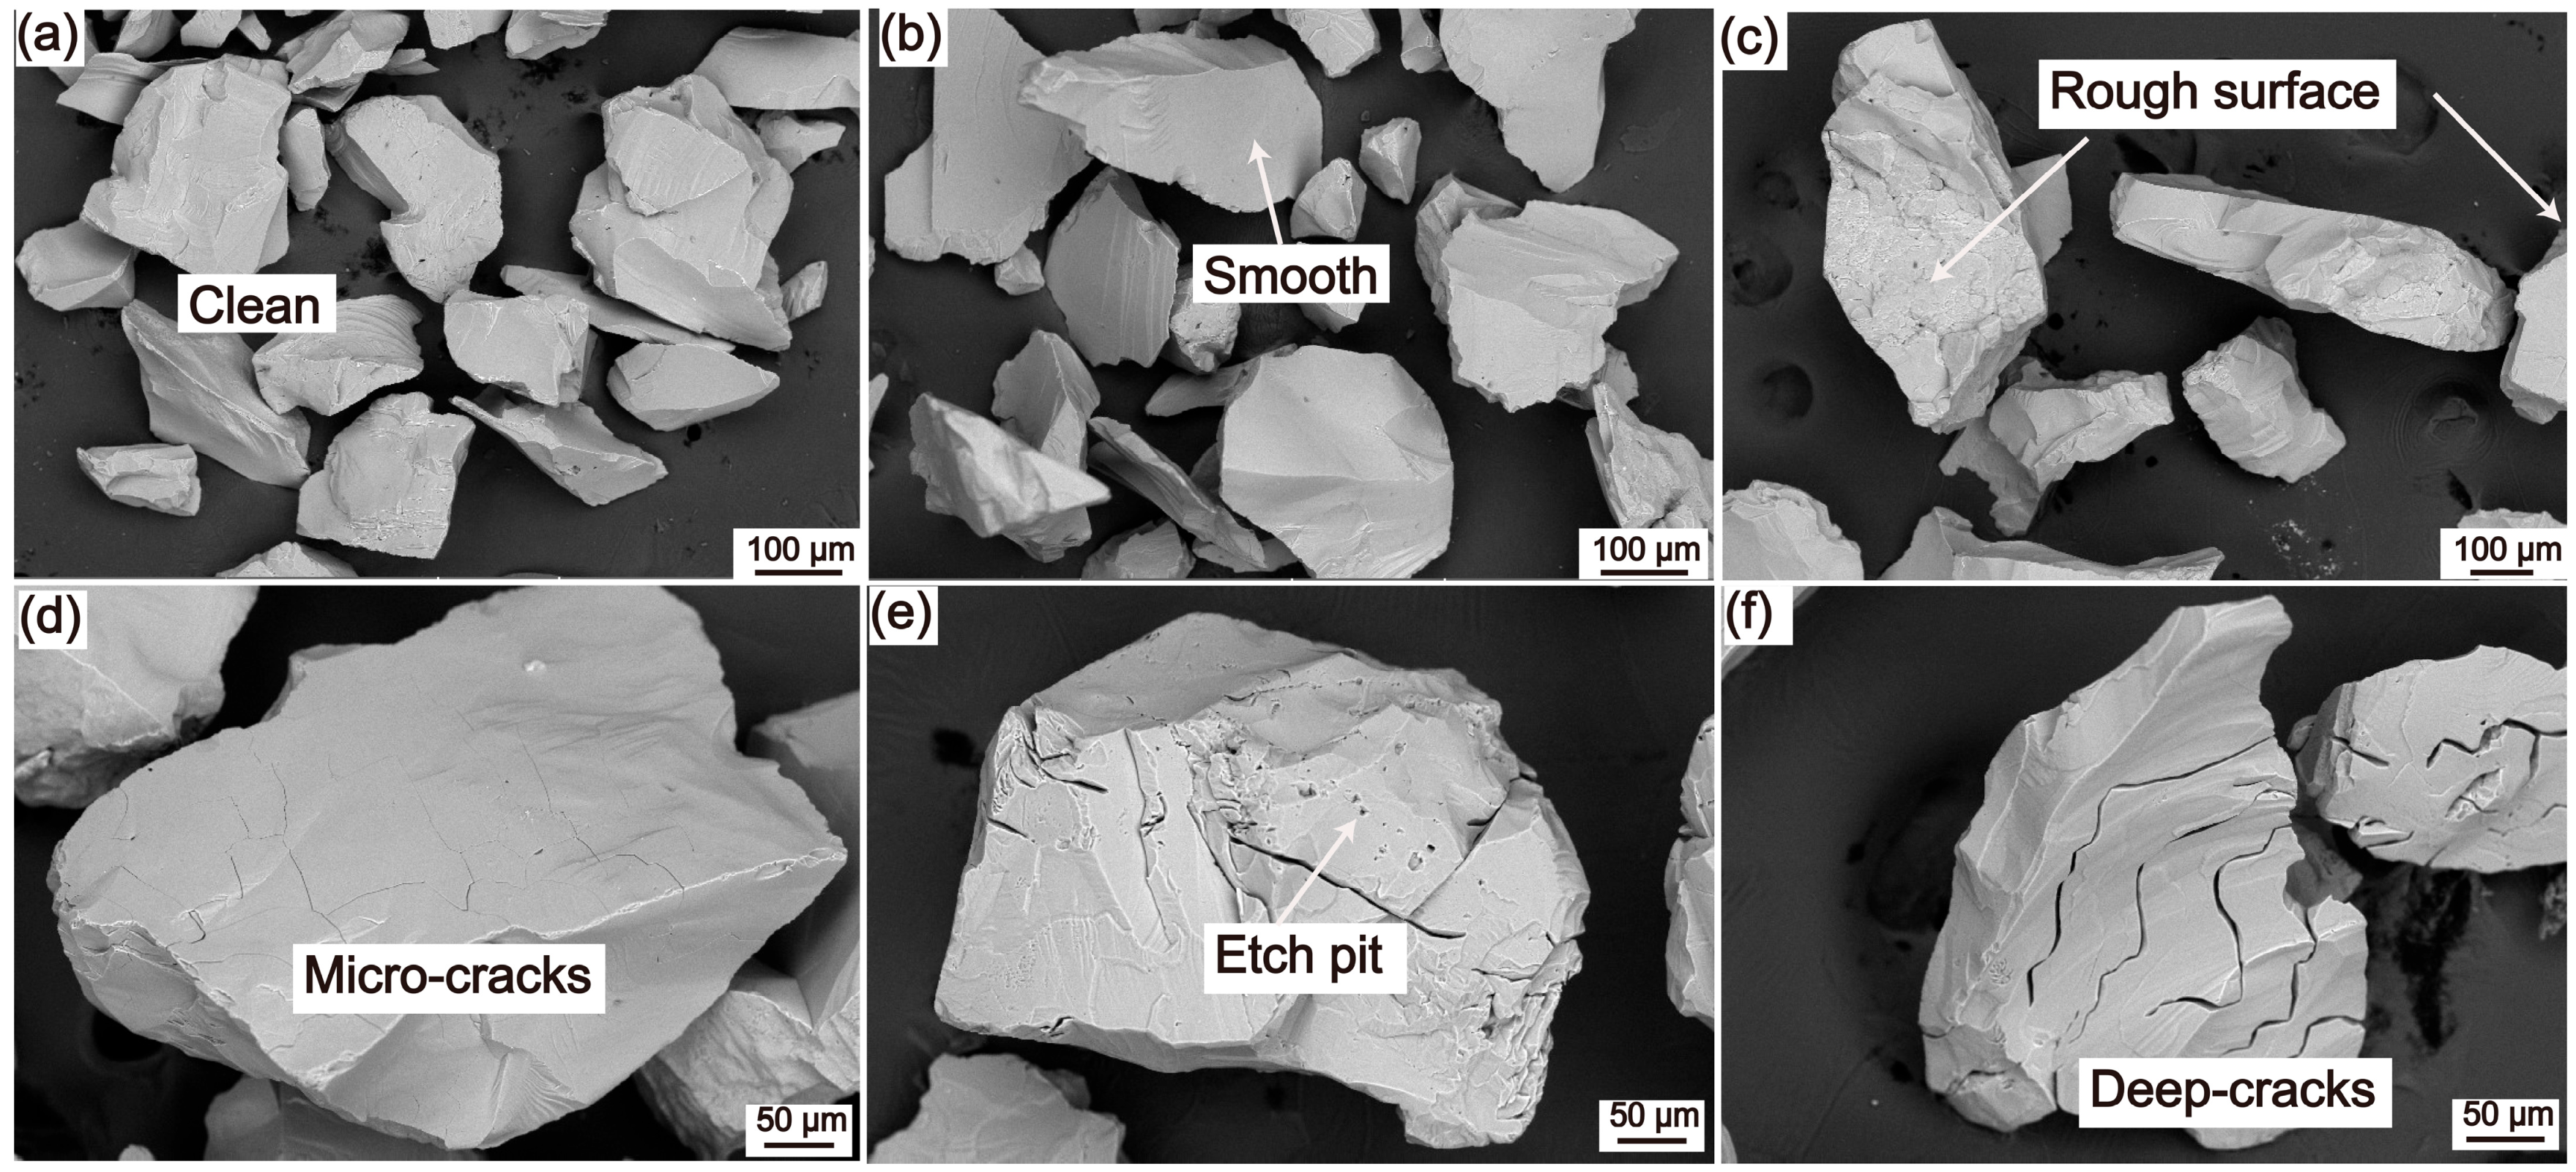
5.1.1. Microstructure Characteristics

The B6-1 raw ore was prepared into thickened probe sheets (100 μm) for studying the structure, associated mineral species, and inclusions of the quartz ore. Figure 3 shows the microscopic morphology of B6-1 vein quartz observed under single polarization, orthogonal polarization, and SEM. Under single polarized light, quartz is colorless and transparent, with complete grains and good crystallinity, as well as large grains, and more internal microcracks (Figure 4a). Under orthogonal polarization, the interference color of quartz in the normal probe piece is gray–gray-white, while the interference color of the probe piece thickness is green, red, and blue. Quartz is xenomorphic granular, some grains exhibit uneven undulatory extinction, with a medium-coarse granular metacrystalline structure. The grain size is 0.2–5 mm, and the grain boundary is relatively clear, mostly linear and jagged (Figure 4b,c). SEM microscopic observation shows that B6-1 vein quartz is associated with a small amount of fine-grained K-feldspar with a grain size of 0.03–0.20 mm (Figure 4d–f). We speculate that the quartz content is as high as 98%. K-feldspar may be the main source of impurity elements such as Al and K.

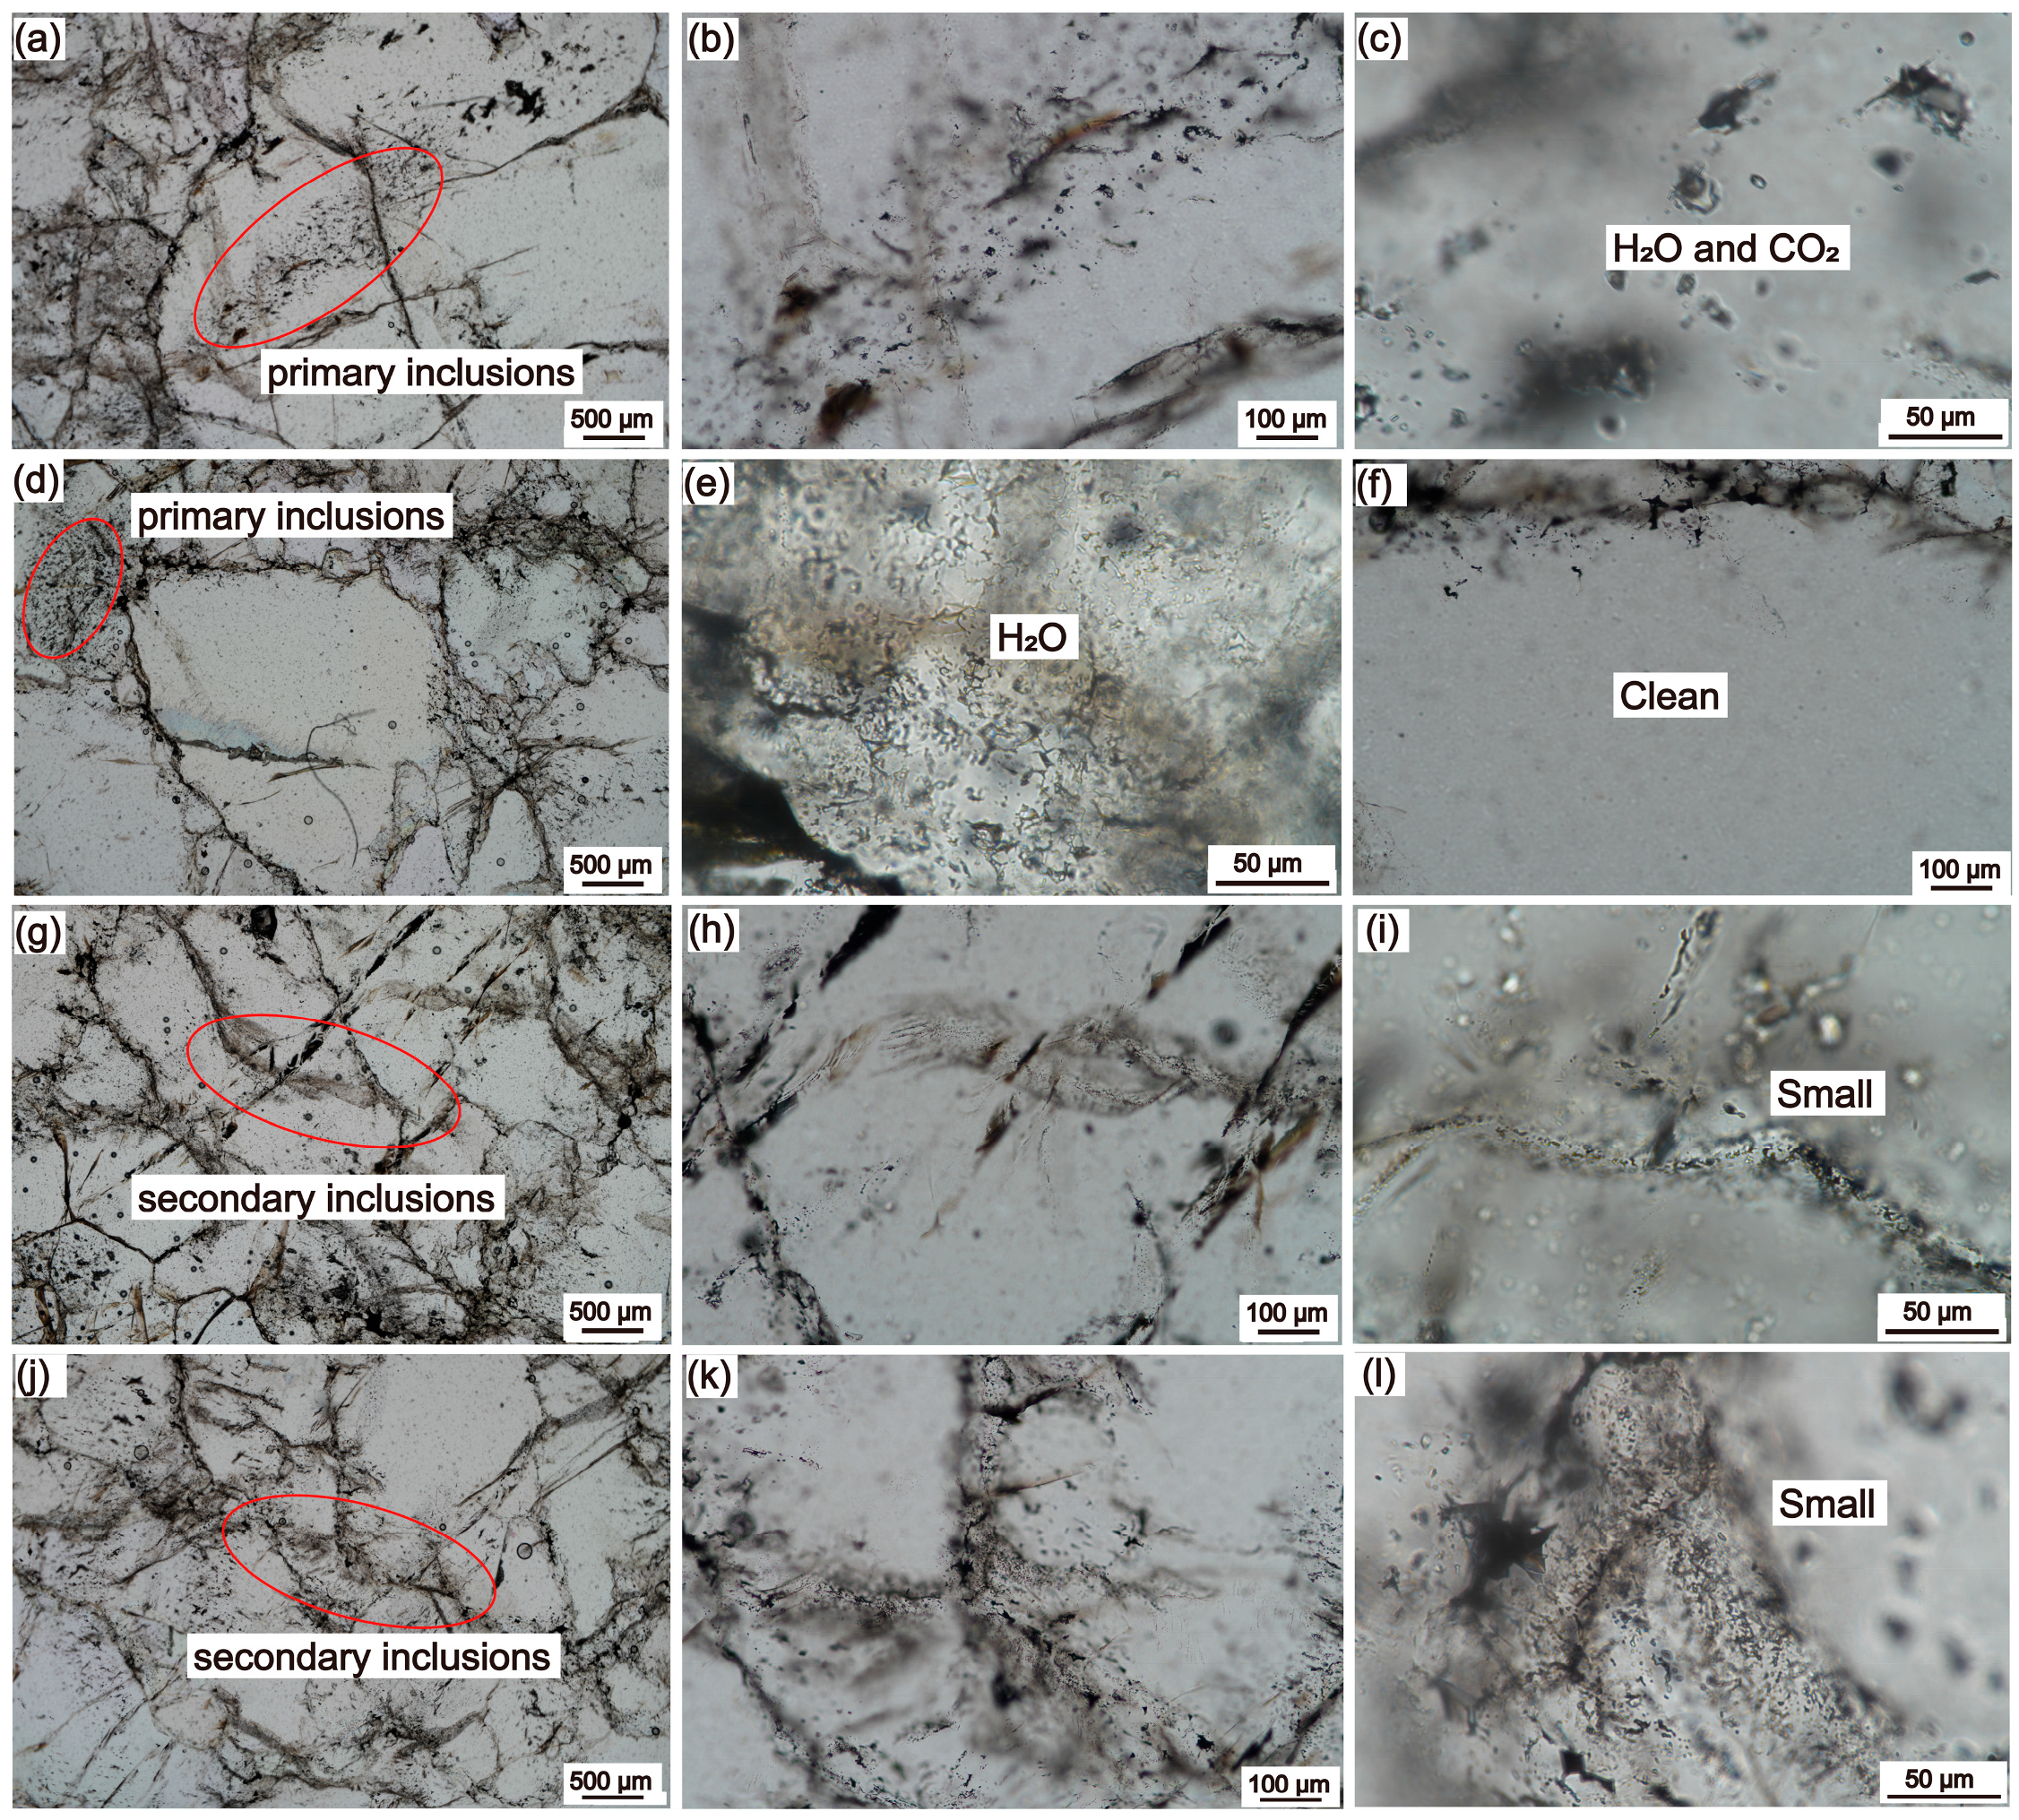
5.1.2. Inclusion Characteristics

Mineral and fluid inclusions are the main impurities in natural quartz. The quantity, size, distribution, composition, and morphological characteristics of these inclusions are important factors affecting the quality of vein quartz raw materials [34]. Because inclusions are encapsulated within quartz crystals, and they are challenging to remove through beneficiation processes. High-quality vein quartz raw materials contain almost no mineral inclusions, while fluid inclusions are more common. These inclusions can be categorized into three types based on their origin: primary inclusions, secondary inclusions, and pseudosecondary inclusions. More than 90% of the liquid inclusions in vein quartz are secondary inclusions [35]. Primary fluid inclusions are inherently trapped during crystal growth, whereas secondary fluid inclusions can be trapped at any time after the growth of the host crystal. Fluid inclusions in microcracks formed during crystal growth are referred to as ‘pseudosecondary’. These fluid inclusions are generally small in quantity, large in volume, and small in distribution range, making them easy to burst and crush under high temperature and pressure, which is conducive to purification [27]. However, for HPQ, inclusions significantly restrict the purification potential of vein quartz raw materials.
According to optical microscope observation, B6-1 vein quartz contains almost no mineral inclusions except for a small amount of K-feldspar (Figure 4d–f). There are a certain number of isolated or clustered primary fluid inclusions and secondary fluid inclusions developed along the microcracks in the quartz crystal, mainly secondary fluid inclusions. The primary inclusions are mostly gas–liquid two-phase inclusions and pure liquid inclusions, which are mostly elliptical or irregular in shape. The gas–liquid components consist of H2O and CO2, as determined by Raman spectroscopy (Figure 5a–e). The secondary inclusions are distributed in bands or clusters along the fractures, typically measuring less than 5 μm. They are characterized by small volume, large number, and wide distribution (Figure 5g–l). Due to their small size, it is difficult to distinguish the types of inclusions. In the process of making HPQ, the secondary inclusions in quartz are easy to mechanically burst due to the development along the crystal micro-fractures, but the primary inclusions are relatively difficult to burst. Among them, inclusions larger than 10 μm can be burst by high-temperature calcination–water quenching. The burst inclusions can release the gases, water, and a certain quantity of salt solution-containing elements such as Na, Mg, and Ca, which can be removed by subsequent acid leaching. If there are many primary inclusions smaller than 10 μm in the quartz ore, because the size of such inclusions is significantly smaller than that of quartz sand, they are easy to wrap with quartz sand in the process of sand making, and not easy to burst at high temperature. Therefore, they are not easy to remove by later purification processes [7,13,20,27]. The presence of a large number of tiny inclusions containing CO, CO2, and other gases can cause defects in subsequent melting products [36] and cannot be used as HPQ raw materials. The primary inclusions in B6-1 vein quartz are relatively large in size and low in content. These inclusions are mainly secondary and are developed along the micro-fractures of the crystal. In most areas of the crystal, the content of inclusions is very low or even nonexistent (Figure 5f). Therefore, from the perspective of inclusion characteristics, B6-1 vein quartz is considered a relatively good raw material ore.

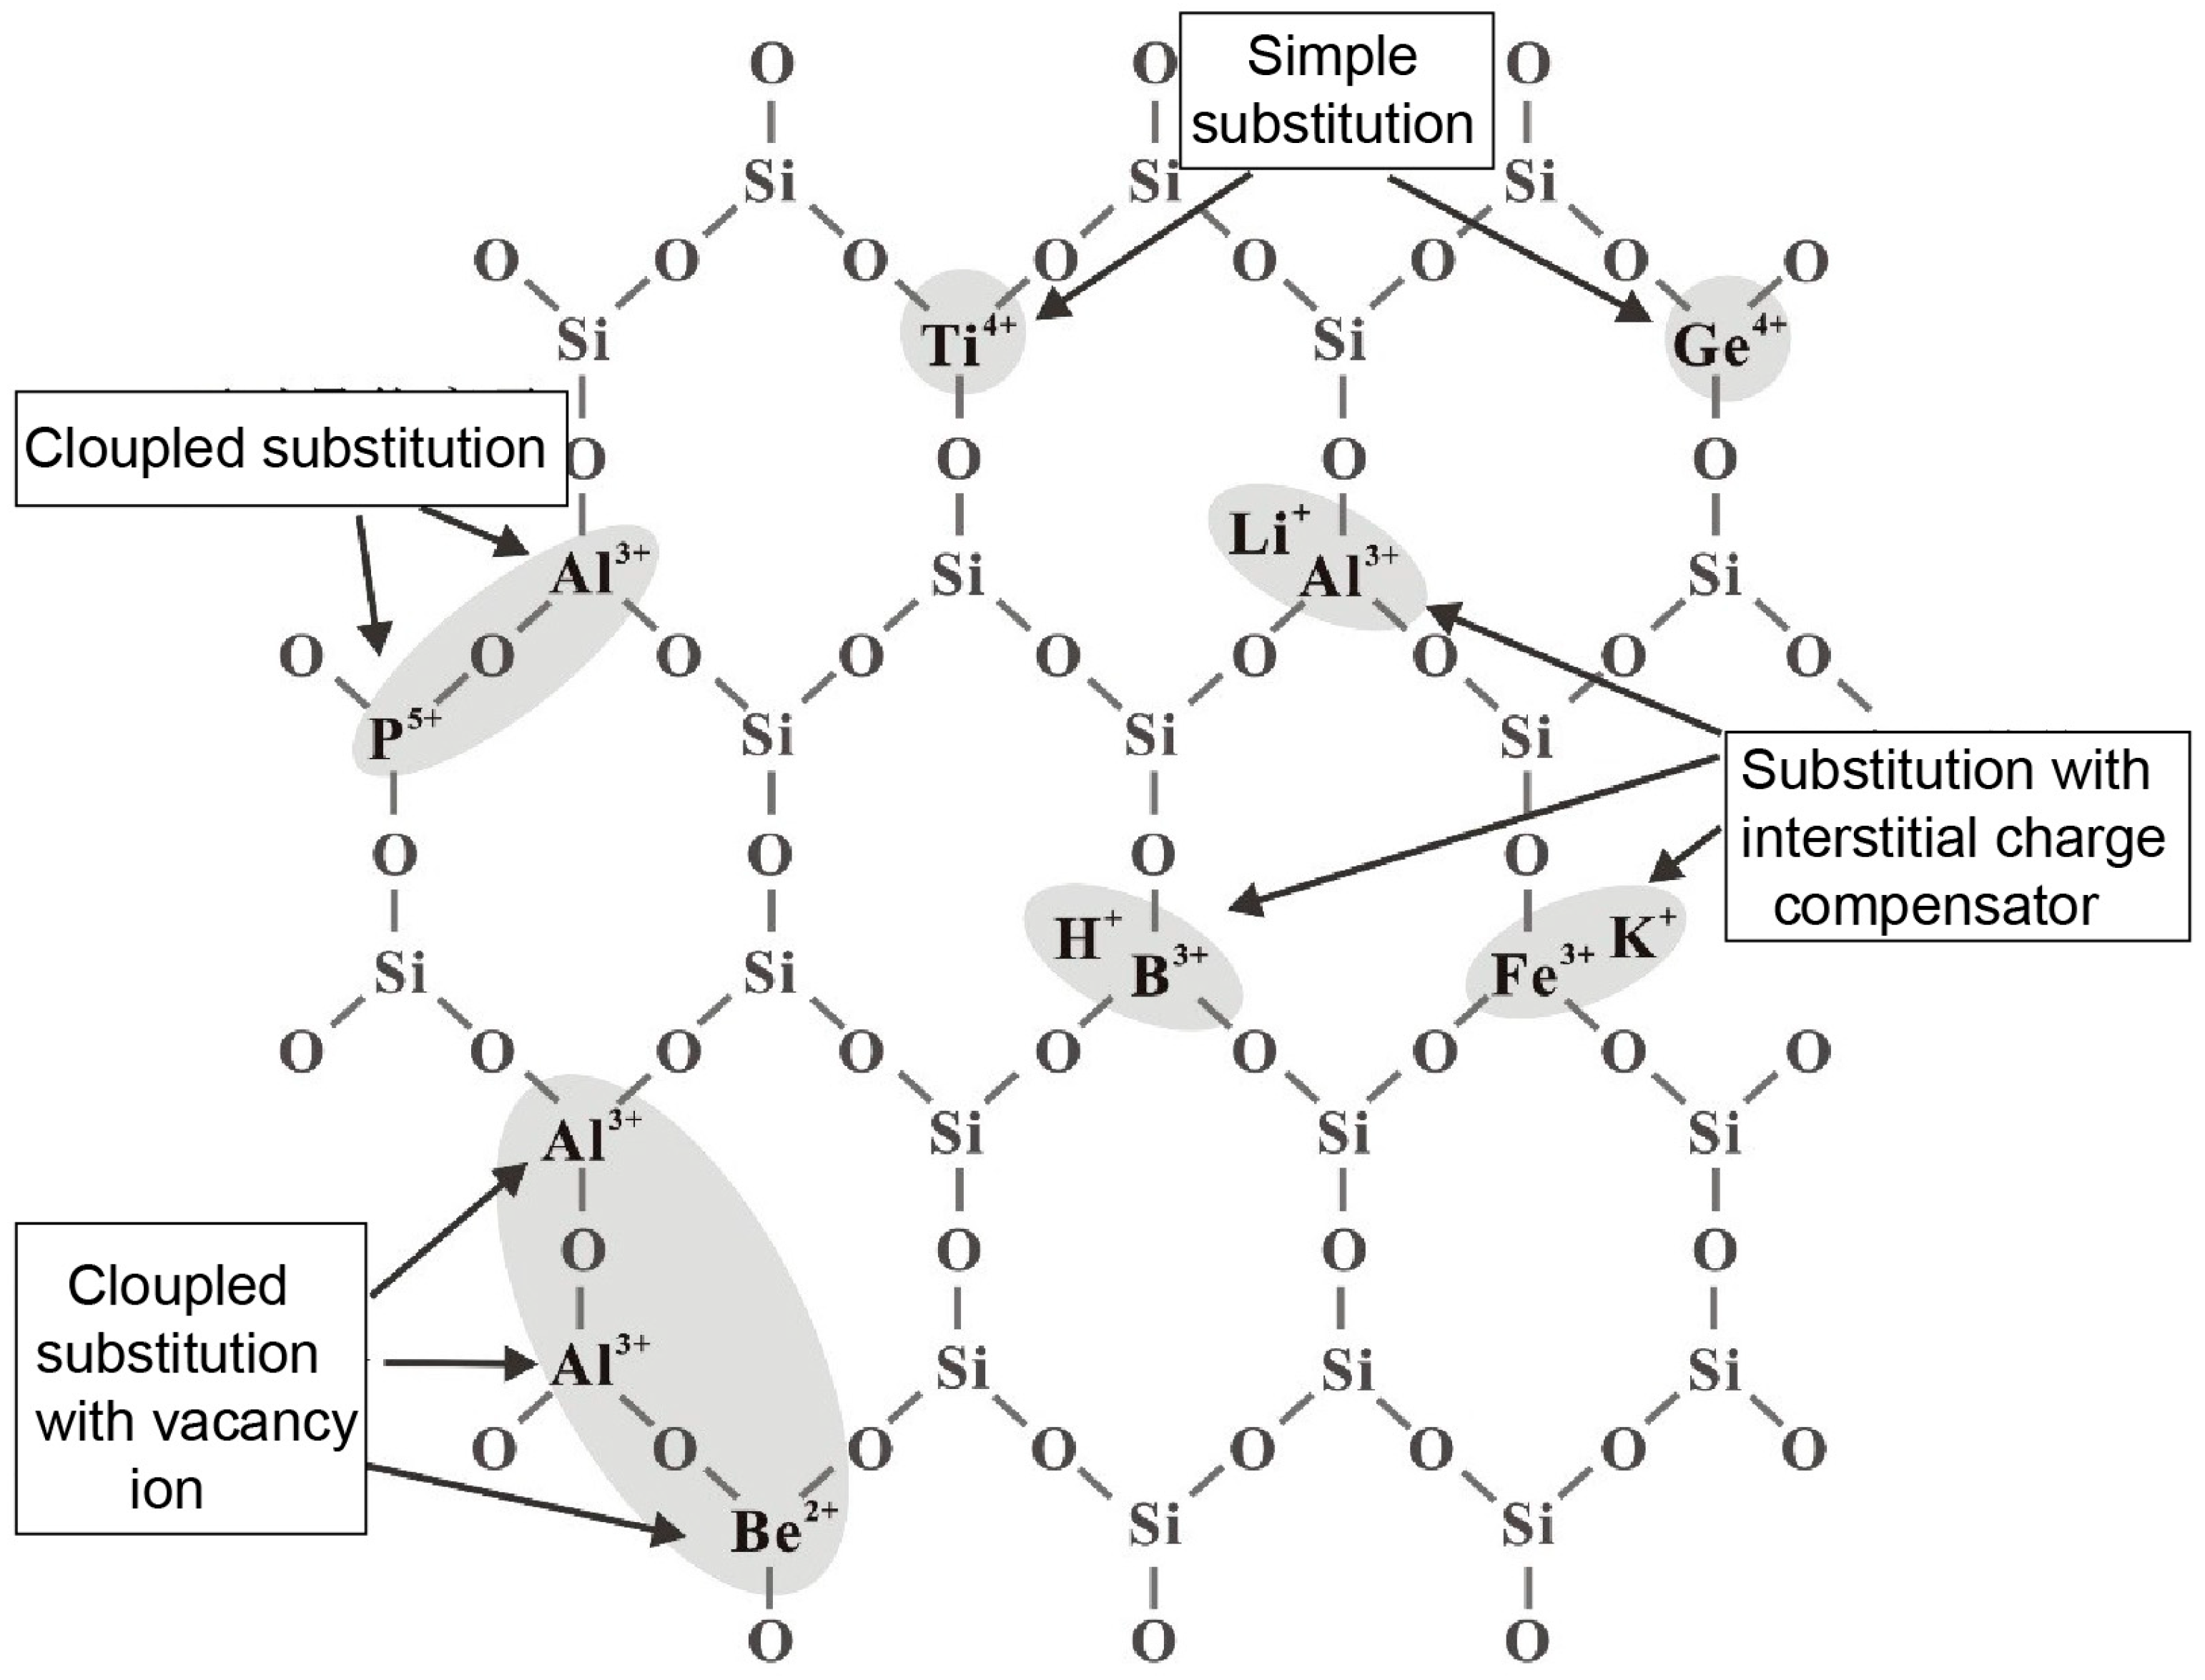
5.1.3. Chemical Composition

The contents of SiO2 and impurities in the raw ore affect the quality and purification potential of quartz, which in turn determines the economic value and application field of quartz raw material ore in the later period. The contents of main metallic elements in the quartz ore determined by solution ICP-MS analysis are summarized in Table 1. As shown in Table 1 and Figure 6, the content of SiO2 in raw ore is 99.987%, with main metallic elements including Al (54.05 µg·g−1), K (34.66 µg·g−1), Ca (22.55 µg·g−1), Na (6.65 µg·g−1), Ti (5.06 µg·g−1), Fe (2.82 µg·g−1), and Li (2.38 µg·g−1), with the total sum of impurities being 128.86 µg·g−1. The results of the chemical composition analysis show that although the raw ore looks relatively pure to the naked eye, the content of impurity elements is still higher than the quality requirements of HPQ. Therefore, it is necessary to clearly understand the types of impurity minerals and the occurrence state of impurity elements based on the relevant purification process to effectively improve the purity of SiO2 in the ore. Based on a combination of TPM and SEM analysis, impurity elements such as Al and K mainly occur in the associated mineral K-feldspar. Those of Fe and Ti may be present in undetected iron oxides and rutile inclusions, or alternatively, as lattice-bound Fe and Ti. Na and Ca contents are also relatively high, which could be referred to fluid inclusions and/or undetected solid inclusions, such as albite and so on.

5.2. Processing of Quartz Sand

5.2.1. Crushing to Make Quartz Sand

The purpose of crushing is to achieve monomer dissociation of quartz and associated minerals in the ore, while also fully exposing the impurities wrapped in the quartz [37]. The desired particle size for HPQ sand is −0.425 +0.074 mm (−40 mesh +200 mesh). As shown in Table 2, the qualified particle size of quartz sand is about 52.0%, while the yield of +0.425 mm is about 40.0%, and the yield of −0.074 mm is about 8.0%. Among them, the coarse particles of +0.425 mm can be sieved after rod or ball grinding to improve the quartz sand yield.

5.2.2. Ultrasonic Scrubbing–Desliming

The grade of SiO2 in quartz sand decreases with the granularity of quartz sand, while the grade of impurity minerals containing Fe and Al elements exhibit the opposite trend. This phenomenon is particularly evident in quartz sand that contains a large number of clayey minerals [38]. Although B6-1 vein quartz ore is relatively pure, a certain amount of clay minerals rich in Fe and Al elements are still attached to its surface during mining. Therefore, it is necessary to wash and use ultrasonic desliming to remove the film of iron, adhesive, and muddy impurity minerals from the surface of the quartz sand. Zhao et al. (2004) [39] demonstrated that iron impurities adhering to the surface of quartz particles easily detach and enter the liquid phase under the influence of ultrasonic waves. Compared to other mechanical scrubbing methods, this method not only removes impurities on the surface of the mineral, but also removes the impurities at the grain cleavage gap, making it more effective in removing iron. It can be seen from Figure 7a that the surface of quartz sand is clean after three rounds of ultrasonic cleaning, and the light yellow-brown rust and clayey minerals attached to the surface of the raw ore were basically removed.

5.2.3. Flotation

Based on the differences in hydrophobicity and hydrophilicity of different minerals, flotation is a common separation and purification method in the mineral processing industry [40,41,42]. The properties of silicate minerals such as feldspar and mica are similar to those of quartz, but their crystal structure and surface properties are different. According to the surface properties of mineral particles, especially the differences in surface hydrophobicity, flotation can efficiently separate quartz from silicate minerals such as feldspar and mica. Among these methods, froth flotation is the most important for impurity removal in the HPQ deep impurity removal process [43,44,45]. Through the interaction between mineral particles and collectors, depressants, activators, and pH regulators, the hydrophobicity difference among the surfaces of different particles can be effectively increased, and this realizes the separation of minerals [46,47,48,49]. Optical microscope observation indicates that B6-1 vein quartz contains only a small amount of K-feldspar, meaning that the flotation experiment is mainly focused on separating quartz and K-feldspar. Traditional flotation methods to separate quartz and feldspar generally include acid flotation, alkaline flotation, and neutral flotation. In acid flotation and neutral flotation, the hydrophobic feldspar particles adhere to bubbles and rise to the top of the flotation cell, while hydrophilic quartz particles remain at the bottom of the flotation cell; conversely, alkaline-flotation yields the opposite result [43,50,51,52,53,54,55,56]. In order to obtain quartz sand as pure as possible, this experiment adopts the efficient and convenient flotation method involving fluorine acid. Feldspar is separated from the quartz using HF as the activator and the alkyl amine surfactants as the cationic collectors at pH 2–3 [57,58,59].
SEM observation shows that the surface of the flotation quartz sand is generally smooth, with some surfaces showing an uneven or irregular shape. There are no cracks or impurity minerals attached to the surface (Figure 7b). TPM observation shows that quartz particles can be divided into pure and impure particles; the pure particles are transparent and have almost no inclusions inside (Figure 8a). The fluid inclusions are unevenly distributed in the impure particles, mainly in clusters and with a linear distribution, with an irregular shape and small size, most of them are less than 10 μm, consisting of gas–liquid two-phase and pure liquid inclusions (Figure 8b,c). The composition analysis of flotation quartz sand showed that the impurity elements such as Al, K, and Ca decreased significantly after flotation treatment. This indicates that the flotation process effectively removed a certain quantity of the main gangue minerals such as k-feldspar and calcium feldspar; the removal rate of impurities was 39.92%, resulting in flotation quartz sand with total impurity element content of 77.42 µg·g−1 and a SiO2 purity of 99.992% (Table 1 and Figure 6). However, flotation quartz sand still contains high levels of impurity elements such as Al, Li, Na, Ca, k, and Fe, which need to be further removed through chemical purification.

5.2.4. High Temperature Calcination–Water Quenching

High-temperature calcination–water quenching is an important process in the purification of HPQ. After the high-temperature calcination of quartz, its crystal structure and the occurrence of impurity elements change according to the calcination temperature, holding time, and the purity of quartz itself. Usually, α quartz is transformed into β quartz at 573 °C, and given sufficient time at 870 °C, the transformation of β quartz to cristobalite can occur. During this process, quartz is accompanied by crystal type transformation, volume change, and inclusion expansion and bursting, all of which lead to a large number of microcracks in quartz. After being calcined at high temperatures, the quartz is then quenched and cooled, which promotes the formation and deepening of microcracks due to the high thermal stress gradient during rapid quenching [35,60]. Once the quartz ore is broken into sand, the particles become finer, and the specific surface area is larger. This allows for impurities to escape more easily during calcination and increases the cooling rate and thermal stress during quenching. As a result, minerals and fluid inclusions that were previously wrapped in quartz are exposed to a greater extent, and the process of high-temperature phase transformation enriches elements such as Al, Li, Na, and K on the quartz surface, so as to better remove these impurities [61].
Figure 7c,d show the micromorphology of the quartz sand after calcination. It can be seen that the surface of quartz sand after calcination–water quenching is rough and has decrepitation pits, and there is a large number of microcracks arranged in parallel or nearly parallel. The formation of these decrepitation pits on the quartz surface mainly caused by the decrepitation of fluid inclusions within the quartz crystal. Additionally, the presence of inorganic salts rich in elements, such as Ca, Mg, K, and Na, among others, dissolved in the fluid is subsequently removed during the acid leaching process [62]. The microcracks observed on the quartz surface are predominantly located at the grain boundaries of quartz grains. These grain boundaries are interconnected by van der Waals forces, with impurity inclusions mostly located within these parts. The grain boundaries between the crystals are mostly parallel. Therefore, these microcracks form approximately parallel fractures along the crystal growth direction during the high-temperature calcination and water quenching process (Figure 7d). These microcracks continue to extend into the quartz, which is highly beneficial to the penetration of acid solution in the subsequent acid leaching treatment, and the acid solution can penetrate into the interior of the particles along the cracks—causing the cracks to deepen and expand—and accelerates the dissolution of impurity inside the particles by the acid solution [35,59,60,61,62].

5.2.5. Hot Pressing and Acid Leaching

Quartz is insoluble in most acids, except for hydrofluoric acid (HF). However, other impurities can be dissolved in acid. Acid leaching is an effective method for removing various metal impurities present on the surface layer, cracks, or lattice of the quartz ore, as well as a small quantity of residual silicate minerals such as feldspar and mica, resulting in a higher level of purification. The acids commonly used in acid leaching processes include H2SO4 [63], HCL [64], oxalic acid (H2C2O4) [65,66], HF, etc. Among them, HF can quickly dissolve the residual mica, feldspar, and other silicate minerals, and it is also highly corrosive. Moderate dissolution of the quartz surface can expose some of the inclusions contained in the quartz. In addition, it is easy to diffuse into the quartz lattice, so that the leaching solution reacts with the metal atoms filled in the quartz lattice and dissolves. Therefore, the addition of a certain amount of HF is beneficial to the purification effect of acid leaching [67,68]. However, the amount of HF should be appropriate to avoid dissolving more quartz. Zhong (2015) [35] conducted a study on the atmospheric pressure acid leaching of quartz sand and found that a single inorganic acid demonstrated a certain level of purification for quartz raw ore. Among the inorganic acids tested, H2SO4 showed the most effective removal of impurities, followed by HF and HCl, whereas HNO3 was the least effective. Among the impurity elements, Fe and Mn had the best removal, Al and K had moderate removal, while Ca and Na had the least removal, and the overall impurity content remained high. Further studies have demonstrated that a combination of mixed acids can produce a synergistic effect, resulting in more efficient impurity removal when using HCl-HF-HNO3 with a mass ratio of 3:1:1. Furthermore, more efficient hot pressing–acid leaching was used for deep purification of quartz sand [28,69]. The mixed acid leaching reaction equation containing HF is as follows in Equations (1)–(4) [61,70,71]:
2NaAlSi3O8 + 28HF + 4H+ → 2Na+ + 2AlF2+ + 6SiF4↑ + 16H2O
2KAlSi3O8 + 28HF + 4H+ → 2K+ + 2AlF2+ + 6SiF4↑ + 16H2O
KAl3Si3O10(OH)2 + 18HF + 4H+ → K+ + 3AlF2+ + 3SiF4↑ + 12H2O
4SiO2 + 18HF → 3H2SiF6 + H2SiO3 +5H2O
SEM observations revealed the presence of numerous corrosion pits and cracks on the surface of acid-leached quartz sand particles. The cracks were observed to be deepened and approximately parallel (Figure 7e,f). During the hot pressure leaching process, the increase in reaction temperature and pressure intensifies the movement of mixed acid, accelerating decomposition reaction of quartz and impurity minerals [36]. The active HF and H+ in the leaching solution are rapidly adsorbed at the active sites of the microcracks, and a chemical reaction occurred, which aggravated the corrosion in the decrepitation pits and widened the microcracks. This corrosion extended to the inside of the crystal, providing more activation interfaces for the lattice impurities. As a result, impurities that are wrapped in the quartz lattice and present at the grain boundaries between the crystals are decomposed and dissolved, enabling the removal of metal impurity ions [72]. The TPM observation showed that the quartz particles were still divided into pure and impure particles (Figure 8d), and there was still a certain number of fluid inclusions in the impure quartz particles, most of which were below 10 μm. However, the content was significantly lower than that of the flotation sand (Figure 8a,d–f). The composition analysis of acid-leached quartz sand showed that the total impurity elements were further reduced from 77.42 to 29.06 µg·g−1 after chemical leaching of flotation sand. Compared with the impurities in the raw ore, the removal rate reached 77.45%, and the purity of SiO2 of acid-leached quartz sand was as high as 99.997%. The impurity elements Al decreased from 54.05 µg·g−1 to 13.08 µg·g−1, K decreased from 16.32 µg·g−1 to 1.22 µg·g−1, and the leaching effects of Mg, Ca, and Fe were also better, all of which decreased to less than 1.0 µg·g−1 (Table 1 and Figure 6). It can be seen that after the physical and chemical purification of quartz raw sand, associated minerals such as K-feldspar and a certain number of fluid inclusions are removed; however, lattice impurity elements such as Li, Al, and Ti cannot be removed by conventional purification processes. The impurity element Na can be used as a charge compensation element and can be deposited in tiny fluid inclusions, but the purification effect is not significant.

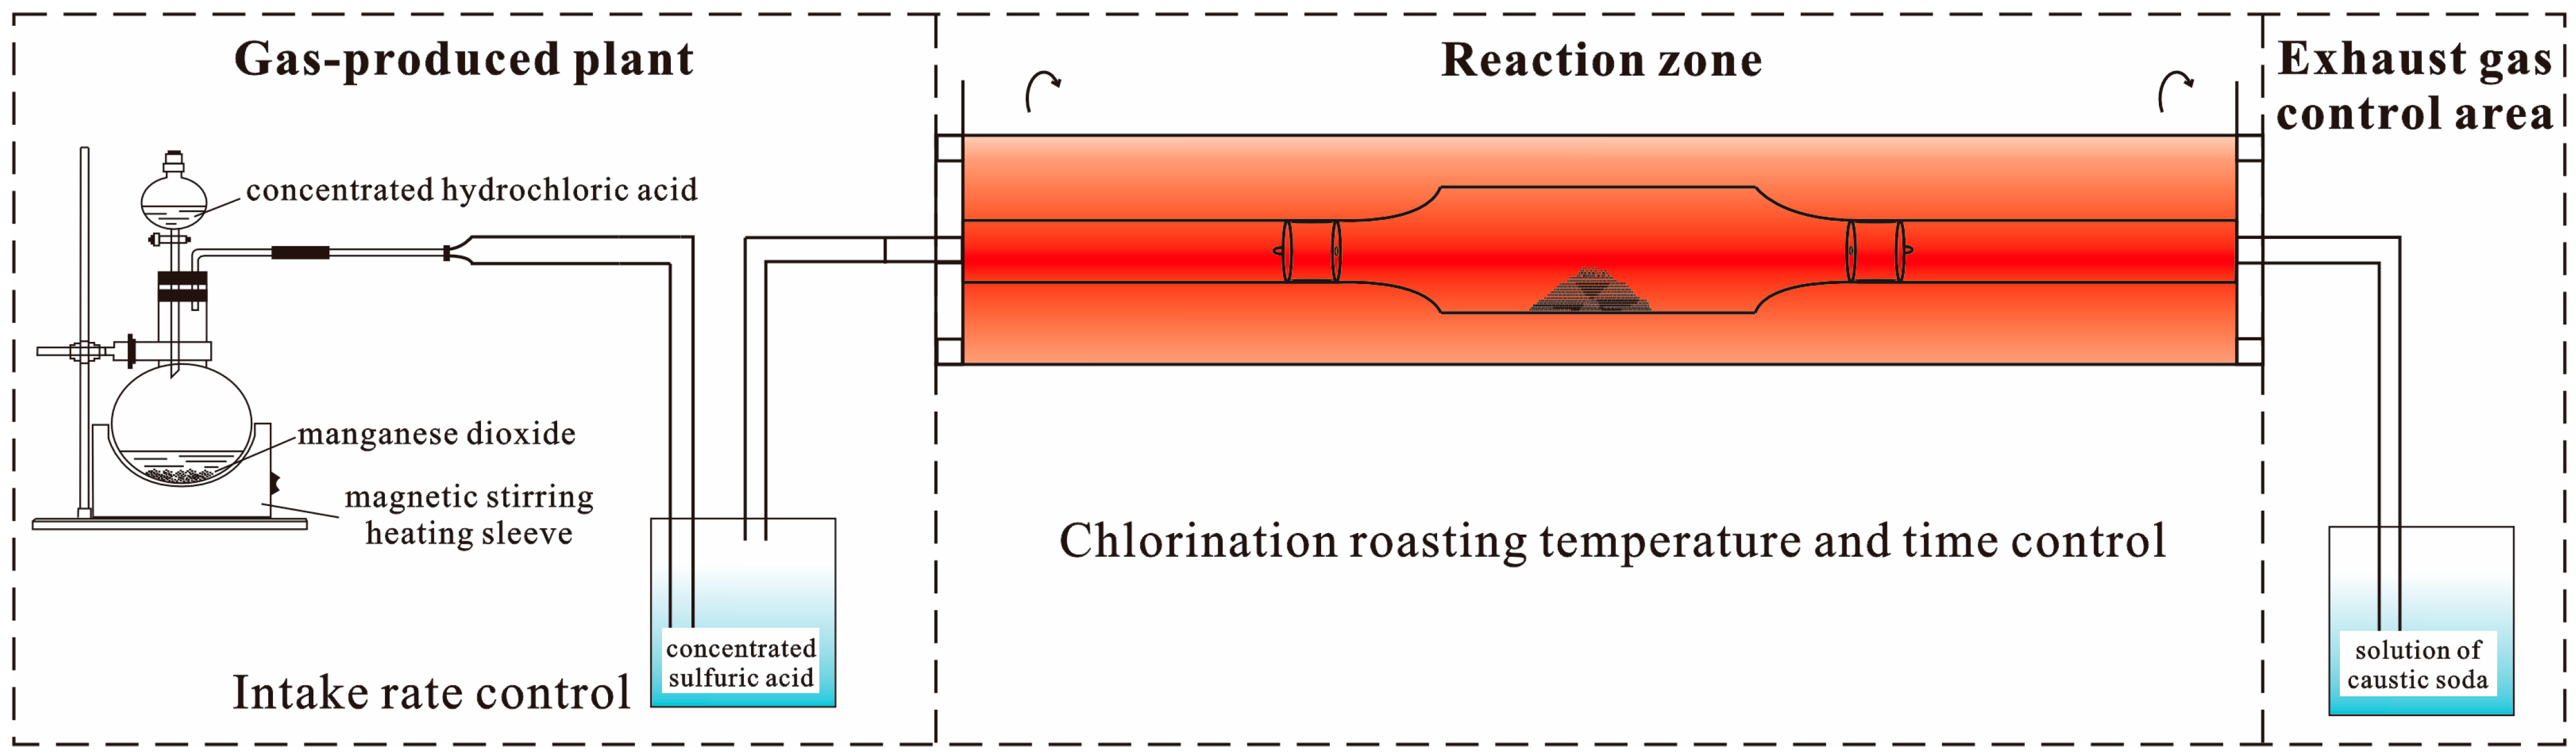
5.2.6. Chlorination Roasting

After the raw ore was purified through crushing, ultrasonic desliming, flotation, high-temperature calcination, water quenching, hot pressing, and acid leaching, the purity of SiO2 reached 99.997%. However, there was still a certain amount of lattice impurity elements and tiny gas–liquid inclusions in the processed quartz sand, which do not meet the standard of ultra-HPQ sand. In order to further remove these impurities, a chlorination experiment was carried out on the acid-leached quartz sand. Under certain temperature and atmospheric conditions, the chlorination process causes the metal oxides in quartz sand to become metal chlorides and dissolve or volatilize through the introduction of chlorinating agents. This process achieves the separation of metal elements, creating a chemical gradient between the surface and the interior of the quartz. This gradient facilitates the discharge of inclusions and impurities within the quartz through diffusion to achieve a deeper purification effect [73,74,75]. Commonly used chlorinating agents are C12, HCl, NaCl, NH4Cl, etc. [73,74,75,76,77]. Taking Cl2 as an example, it exhibits strong oxidation at high temperature, because the oxidation of Cl2 is greater than that of O2, so it can remove metal impurities by chlorination reaction with metal oxides such as Al2O3, Fe2O3, Na2O, etc. However, TiO2 is more stable than TiCl4, and Ti is difficult to remove through chlorination roasting [61]. The reaction equations between some metal elements and Cl2 are as follows [74,75]:
2Al2O3 + 6Cl2 → 4AlCl3↑ + 3O2
2FeO + 2Cl2 → 2FeCl2↑ + O2
2FeCl2 + Cl2 → 2FeCl3
2CaO + 2Cl2 → 2CaCl2↑ + O2
2MgO + 2Cl2 → 2MgCl2↑ + O2
2Na2O + 2Cl2 → 4NaCl↑ + O2
2K2O + 2Cl2 → 4KCl↑ + O2
The TPM observation showed that most of the quartz particles were pure and almost free of inclusions, and only a small number of gas–liquid inclusions were observed inside a few particles, and the content of inclusions was much lower compared to the quartz sand prepared from common vein quartz (Figure 8g–i). The composition analysis of chlorinated quartz fine sand showed that the total impurity elements decreased to 24.23 µg·g−1 after chlorination. Compared with the impurities in the original ore, the removal rate reached 81.20%, and the final purity of SiO2 of quartz sand was 99.998%. The lattice impurities Li, Al, and Ti were not removed, but the impurity elements Na and K were reduced from 5.09 µg·g−1 to 0.72 µg·g−1 and from 1.22 µg·g−1 to 0.35 µg·g−1, respectively, indicating a significant purification effect (Table 1 and Figure 6). According to the comprehensive analysis and research of the relevant standard data of crucibles prepared by previous enterprises, the six key impurity elements affecting the application performance of HPQ are Al, Ti, Ca, K, Na, and Li, and their content requirements are Al < 14 µg·g−1, Ti < 4 µg·g−1, Ca < 2 µg·g−1, K < 1 µg·g−1, Na < 1 µg·g−1, and Li < 1 µg·g−1 [78]. Although the SiO2 purity of the quartz sand produced by B6-1 vein quartz is the same as that of IOTA-STD quartz products produced by Unimin, both reach 99.998% (4N8, Table 1) [79], the content of lattice impurity elements Li and Ti in the processed quartz sand is much higher than that of Unimin’s IOTA-STD products, which cannot be removed by purification process and limit its application as a crucial semiconductor material.
The quality of quartz ore depends on the impurities in the quartz. There are three kinds of impurities according to the difficulty of purification: associated minerals, inclusions, and lattice impurities. Generally, quartz common associated minerals such as hematite, magnetite, feldspar, mica, etc., can be removed by crushing, magnetic separation, and flotation, and most inclusions greater than 10 μm can also be removed by high-temperature calcination and acid leaching. For impurities inside quartz, such as lattice impurity elements and inclusions less than 10 μm, it is difficult to completely remove them by existing purification processes. Quartz lattice impurity elements are introduced by point defects in quartz crystals. As shown in Figure 9, the elements (Al3+, B3+, Fe3+, Ge4+, Ti4+, and P5+) will substitute for part of Si4+ in the quartz lattice and form lattice impurities. Furthermore, the impurity ions (H+, Li+, Na+, K+, and Fe2+) enter the interstitial to maintain the charge balance. In the study of Kyanite quartzite and Melkfjell quartzite in different regions of Norway, Müller et al. (2007) [26] found that when Al, Ti, and Li existed in quartz crystals in the form of lattice impurity elements, it was difficult to remove them in the purification process of quartz raw ore. After crushing, magnetic separation, cleaning, flotation, and acid leaching, the associated mineral K-feldspar and a large number of secondary inclusions in B6-1 vein quartz were removed. Chlorination roasting further removed the impurity elements, Na and K, and the residual lattice impurity elements Li, Al, and Ti could not be removed by traditional purification experiments. At present, the deep purification processes for the removal of lattice impurity elements, especially inclusions less than 10 μm, mainly include chlorination roasting, vacuum calcination, and microwave calcination, and these purification processes can be combined in the future to maximize the removal of lattice impurity elements in quartz. In industrial production, the removal of high lattice impurity content elements by chemical cleaning leads to high production cost. Therefore, the content of lattice impurity elements Al, Ti, and Li in quartz are the main factor restricting the purity and application direction of quartz. If quartz sand still contains high content of lattice impurity elements Al, Ti, and Li after flotation, it cannot be used as a raw material for HPQ.

6. Summary and Conclusions

A combined purification process consisting of crushing, ultrasonic desliming, flotation, high-temperature calcination, water quenching, hot pressure acid leaching, and chlorination was developed to obtained processed quartz sand from Pakistani vein quartz. The effects of this processing procedure on the raw quartz material were discussed. The types and contents of impurities in quartz raw ore and processed quartz sand were systematically analyzed using a combination of optical microscopy, scanning electron microscopy, and bulk solution ICP-MS. The characteristics, limitations, and application value of quartz raw material ore were evaluated. The conclusions are drawn as follows:
(1)
The raw ore of Pakistani vein quartz has a high content of quartz, with only a small amount of fine-grained K-feldspar, and the inclusions are mainly primary inclusions with large size, along with secondary fluid inclusions developed along micro-fractures. The majority of the grain areas have a very low inclusion percentage.
(2)
The processed quartz sand has a smooth surface, low gas–liquid inclusion content, with only a small quantity of impurity elements such as Ti and Li remaining; the total impurity elements are 24.23 µg·g−1, the impurity removal rate is 81.20%, and the purity of SiO2 reaches 99.998% (4N8).
(3)
The size of the primary inclusions in the raw quartz ore is relatively large, with low content, mainly containing secondary inclusions developed along the crystal micro-fractures, and the content of inclusions in most areas of the crystal is very low or even nonexistent. The quartz ore with such inclusion characteristics is considered a relatively good raw material for quartz.
(4)
The content of lattice impurity elements Al, Ti, and Li in quartz is the main factor restricting the purity and application direction of quartz. In industrial production, considering the economic cost, if quartz sand still contains high content of lattice impurity elements Al, Ti and Li after flotation, it cannot be used as a raw material for high-end HPQ.

Author Contributions

Investigation, methodology and writing—original draft preparation, M.X.; project administration and data curation, Z.H.; resources, writing—review and editing, X.Y. All authors have read and agreed to the published version of the manuscript.

Funding

This study is financially supported by grants from Supported by the Strategic Priority Research Program of Chinese Academy of Sciences (XDA0430203) and the National Natural Science Foundation of China (Nos. 42230801 and 42030801).

Data Availability Statement

Data is contained in the article material.

Acknowledgments

We are grateful to Shao-yi-qing Qu, Li-ting Sun, Yue Qiu, Jamuna, and Ibrar Khan for their help with purification experiments, and Shao-yi-qing Qu for his assistance with the ICP-MS analysis.

Conflicts of Interest

The authors declared that they have no conflicts of interest to this work. We declare that we do not have any commercial or associative interest that represents a conflict of interest in connection with the work submitted.

References

  1. Ding, Y.Z.; Lu, J.W.; Yin, W.Z. Research on purifying low-grade quartz ore by flotation. Metal Mine 2009, 5, 84–87, (In Chinese with English Abstract). [Google Scholar]
  2. Haus, R. High demands on high purity. Ind. Miner. 2005, 10, 62–67. [Google Scholar]
  3. Haus, R.; Prinz, S.; Priess, C. Assessment of High Purity Quartz Resources. In Quartz: Deposits, Mineralogy and Analytics; Springer: Berlin/Heidelberg, Germany, 2012; pp. 29–51. [Google Scholar]
  4. Müller, A.; Ihlen, P.M.; Wanvik, J.E.; Flem, B. High-purity quartz mineralisation in kyanite quartzites, Norway. Miner. Depos. 2007, 42, 523–535. [Google Scholar] [CrossRef]
  5. Shen, S.F. The actuality of study and manufacture in higher purity quartz. China Non-Met. Min. Ind. Her. 2006, 5, 13–16, (In Chinese with English Abstract). [Google Scholar]
  6. Moore, P. High-purity quartz. Ind. Miner. 2005, 455, 53–57. [Google Scholar]
  7. Götze, J.; Möckel, R. (Eds.) Quartz: Deposits, Mineralogy and Analytics.; Springer: Berlin/Heidelberg, Germany; New York, NY, USA; Dordrecht, The Netherlands; London, UK, 2012; pp. 307–330. [Google Scholar]
  8. Yang, X.Y.; Sun, C.; Cao, J.Y.; Shi, J.B. Research progress and development trend of high purity quartz. Earth Sci. 2021, 1, 231–244. [Google Scholar] [CrossRef]
  9. Gao, B.; Nakano, S.; Kakimoto, K. Influence of reaction between silica crucible and graphite susceptor on impurities of multicrystalline silicon in a unidirectional solidification furnace. J. Cryst. Growth 2011, 314, 239–245. [Google Scholar] [CrossRef]
  10. Schreiber, A.; Kühn, B.; Arnold, E.; Schilling, F.J.; Witzke, H.D. Radiation resistance of quartz glass for VUV discharge lamps. J. Phys. D Appl. Phys. 2005, 38, 3242–3250. [Google Scholar] [CrossRef]
  11. Schlanz, J.W. High Pure and Ultra-High Pure Quartz. In Industrial Minerals & Rocks, 7th ed.; Kogel, J.E., Trivedi, N.C., Barker, J.M., Krukowski, S.T., Eds.; Society for Mining, Metallurgy, and Exploration, Inc.: Littleton, CO, USA, 2009; pp. 833–837. [Google Scholar]
  12. Dal, M.E.; Tranell, G.; Gaal, S.; Raaness, O.S.; Tang, K.; Arnberg, L. Study of pellets and lumps as raw materials in silicon production from quartz and silicon carbide. Metall. Mater. Trans. B 2011, 42, 939–950. [Google Scholar]
  13. Götze, J. Chemistry, textures and physical properties of quartz—Geological interpretation and technical application. Mineral. Mag. 2009, 73, 645–671. [Google Scholar] [CrossRef]
  14. Bayaraa, B.; Greg, B.; Noriyoshi, T. Hydrothermal quartz vein formation, revealed by coupled SEM-CL imaging and fluid inclusion microthermometry: Shuteen complex, south Gobi, Mongolia. Resour. Geol. 2005, 55, 1–8. [Google Scholar]
  15. Yin, W.; Wang, D.; Drelich, J.W.; Yang, B.; Li, D.; Zhu, Z.; Yao, J. Reverse flotation separation of hematite from quartz assisted with magnetic seeding aggregation. Miner. Eng. 2019, 139, 105873. [Google Scholar] [CrossRef]
  16. Rohem Peçanha, E.; da Fonseca de Albuquerque, M.D.; Antoun Simao, R.; de Salles Leal Filho, L.; de Mello Monte, M.B. Interaction forces between colloidal starch and quartz and hematite particles in mineral flotation. Colloids Surf. A Physicochem. Eng. Asp. 2019, 562, 79–85. [Google Scholar] [CrossRef]
  17. Yang, L.; Li, W.; Li, X.; Yan, X.; Zhang, H. Effect of the turbulent flow pattern on the interaction between dodecylamine and quartz. Appl. Surf. Sci. 2020, 507, 145012. [Google Scholar] [CrossRef]
  18. Khalifa, M.; Ouertani, R.; Hajji, M.; Ezzaouia, H. Innovative technology for the production of high-purity sand silica by thermal treatment and acid leaching process. Hydrometallurgy 2019, 185, 204–209. [Google Scholar] [CrossRef]
  19. Shaban, M.; Abukhadra, M.R. Enhancing the Technical Qualifications of Egyptian White Sand Using Acid Leaching; Response Surface Analysis and Optimization. Int. J. Miner. Process. Extr. Metall. 2016, 1, 33–40. [Google Scholar]
  20. Lin, M.; Lei, S.; Pei, Z.; Liu, Y.; Xia, Z.; Xie, F. Application of hydrometallurgy techniques in quartz processing and purification: A review. Metall. Res. Technol. 2018, 115, 303. [Google Scholar] [CrossRef]
  21. Zhang, Q.D.; Li, X.L.; Song, Y.S.; Zhou, G.Y. Experimental Research on Preparation Technics of High-Purity Quartz Material. Key Eng. Mater. 2017, 748, 17–21. [Google Scholar] [CrossRef]
  22. Buttress, A.J.; Rodriguez, J.M.; Ure, A.; Ferrari, R.S.; Dodds, C.; Kingman, S.W. Production of high purity silica by microfluidic-inclusion fracture using microwave pretreatment. Miner. Eng. 2019, 131, 407–419. [Google Scholar] [CrossRef]
  23. Li, F.; Jiang, X.; Zuo, Q.; Li, J.; Ban, B.; Chen, J. Purification mechanism of quartz sand by combination of microwave heating and ultrasound assisted acid leaching treatment. Silicon 2021, 13, 531–541. [Google Scholar] [CrossRef]
  24. Vatalis, K.I.; Charalampides, G.; Platias, S.; Benetis, N.P. Market developments and industrial innovative applications of high purity quartz refines. Procedia Econ. Financ. 2014, 14, 624–633. [Google Scholar] [CrossRef]
  25. Zhou, Y.H. Study on refining quartz powder by leaching in HF acid solution. J. Mineral. Petrol. 2005, 25, 23–26. [Google Scholar]
  26. Wang, L. Industrial types and application characteristics of quartz deposits. Conserv. Util. Miner. Resour. 2019, 6, 39–47. [Google Scholar]
  27. Müller, A.; Wanvik, J.E.; Ihlen, P.M. Petrological and Chemical Characterisation of High-Purity Quartz Deposits with Examples from Norway. In Quartz: Deposits, Mineralogy and Analytics; Springer: Berlin/Heidelberg, Germany, 2012; pp. 71–118. [Google Scholar]
  28. Zhong, T.S.; Yu, W.H.; Shen, C.; Wu, X.W. Research on Preparation and Characterisation of High-purity Silica Sands by Purification of Quartz Vein Ore from Dabie Mountain. Silicon 2022, 14, 4723–4729. [Google Scholar] [CrossRef]
  29. Wang, J.Y.; Xie, Z.F.; Wang, C.L.; Hu, Y.F. Trace Element Concentrations and Mineralogy of Quartz Vein Deposits from Southeastern Hubei Province, China. Minerals 2022, 12, 814. [Google Scholar] [CrossRef]
  30. Ning, S.Y.; Pan, B.K.; Chen, Y.G.; Chen, H.R.; Zhang, Z.Y. Microstructure and inclusions characteristics of vein quartz in Yangjiang area, Guangdong. China Non-Met. Miner. Ind. 2020, 5, 65–68. [Google Scholar]
  31. Kohobhange, S.P.K.; Manoratne, C.H.; Pitawala, H.M.T.G.A.; Rajapakse, R.M.G. The effect of prolonged milling time on comminution of quartz. Powder Technol. 2018, 330, 266–274. [Google Scholar] [CrossRef]
  32. Yang, L.; Li, X.; Li, W.; Yan, X.; Zhang, H. Intensification of interfacial adsorption of dodecylamine onto quartz by ultrasonic method. Sep. Purif. Technol. 2019, 227, 115701. [Google Scholar] [CrossRef]
  33. Al-maghrabi, N.H. Improvement of low-grade silica sand deposits in Jeddah Area. J. King Abdulaziz Univ.-Eng. Sci. 2004, 15, 113–128. [Google Scholar] [CrossRef]
  34. Götze, J. Mineralogy, geochemistry and cathodoluminescence of authigenic quartz from different sedimentary rocks. In Quartz: Deposits, Mineralogy and Analytics; Götze, J., Möckel, R., Eds.; Springer: Berlin/Heidelberg, Germany, 2012; pp. 287–306. [Google Scholar]
  35. Zhong, L.L. Study on Purifing Preparation and Mechanism. Master’s Thesis, Wuhan University of Technology, Wuhan, China, 2015. [Google Scholar]
  36. Zhang, L.Y.; Gao, H.M.; Liu, L.G. Experimental study on the preparation of high-purity quartz powder from high-grade vein quartzite. Glass 1996, 23, 6–9. [Google Scholar]
  37. Pang, Q.L.; Shen, J.X.; Cheng, C.B.; Guo, H.C.; Sun, X.; Li, W. Processing technology and application of high purity quartz. Jiangsu Ceram. Acad. Res. 2020, 53, 43–47. [Google Scholar]
  38. Zhu, Y.B.; Peng, Y.J.; Gao, H.M. Research on mineral processing of coastal quartz sand mine. J. Wuhan Polytech. Univ. 1999, 21, 37–39. [Google Scholar]
  39. Zhao, H.L. Experimental study on iron removal from quartz sand by ultrasonic wave. Glass Enamel 2004, 23, 44–49. [Google Scholar]
  40. Mckee, D.J. Automatic flotation control—A review of 20 years of effort. Miner. Eng. 1991, 4, 653–666. [Google Scholar] [CrossRef]
  41. Wang, Y.; Hu, Y.; He, P.; Gu, G. Reverse flotation for removal of silicates from diasporic-bauxite. Miner. Eng. 2004, 17, 63–68. [Google Scholar] [CrossRef]
  42. Han, G.; Wen, S.M.; Wang, H.; Feng, Q.C. Selective adsorption mechanism of salicylic acid on pyrite surfaces and its application in flotation separation of chalcopyrite from pyrite. Sep. Purif. Technol. 2020, 240, 116650. [Google Scholar] [CrossRef]
  43. Larsen, E.; Kleiv, R.A. Flotation of quartz from quartz-feldspar mixtures by the HF method. Miner. Eng. 2016, 98, 49–51. [Google Scholar] [CrossRef]
  44. Crundwell, F.K. On the mechanism of the flotation of oxides and silicates. Miner. Eng. 2016, 95, 185–196. [Google Scholar] [CrossRef]
  45. Von Rybinski, W.; Schwuger, M. Adsorption of surfactant mixtures in froth flotation. Langmuir 1986, 2, 639–643. [Google Scholar] [CrossRef]
  46. Jiang, X.S.; Chen, J.; Ban, B.Y.; Song, W.F.; Chen, C.; Yang, X.Y. Application of competitive adsorption of ethylenediamine and polyetheramine in direct float of quartz from quartz feldspar mixed minerals under neutral pH conditions. Miner. Eng. 2022, 188, 107850. [Google Scholar] [CrossRef]
  47. Jiang, X.S.; Chen, J.; Wei, M.N.; Li, F.F.; Ban, B.Y.; Li, J.W. Effect of impurity content difference between quartz particles on flotation behavior and its mechanism. Powder Technol. 2020, 375, 504–512. [Google Scholar] [CrossRef]
  48. Wang, Z.; Wu, H.; Xu, Y.; Shu, K.; Yang, J.; Luo, L.; Xu, L. Effect of dissolved fluorite and barite species on the flotation and adsorption behavior of bastnaesite. Sep. Purif. Technol. 2020, 237, 116387. [Google Scholar] [CrossRef]
  49. Xu, L.; Tian, J.; Wu, H.; Lu, Z.; Sun, W.; Hu, Y. The flotation and adsorption of mixed collectors on oxide and silicate minerals. Adv. Colloid Interface Sci. 2017, 250, 1–14. [Google Scholar] [CrossRef] [PubMed]
  50. Shehu, N.; Spaziani, E. Separation of feldspar from quartz using EDTA as modifier. Miner. Eng. 1999, 12, 1393–1397. [Google Scholar] [CrossRef]
  51. Vidyadhar, A.; Rao, K.H. Adsorption mechanism of mixed cationic/anionic collectors in feldspar-quartz flotation system. J. Colloid Interface Sci. 2007, 306, 195–204. [Google Scholar] [CrossRef]
  52. El-Salmawy, M.S.; Nakahiro, Y.; Wakamatsu, T. The role of alkaline earth cations in flotation separation of quartz from feldspar. Miner. Eng. 1993, 6, 1231–1243. [Google Scholar] [CrossRef]
  53. Liu, Y.; Gong, H.; Zhang, K. Mechanism of the function of sodium hexametaphophate. J. Northeast. Univ. Natural. Sci. 1993, 14, 231–235. [Google Scholar]
  54. Ata, S.; Jameson, G.J. The formation of bubble clusters in flotation cells. Int. J. Miner. Process. 2005, 76, 123–139. [Google Scholar] [CrossRef]
  55. Wang, L.; Liu, R.; Hu, Y.; Liu, J.; Sun, W. Adsorption behavior of mixed cationic/anionic surfactants and their depression mechanism on the flotation of quartz. Powder Technol. 2016, 302, 15–20. [Google Scholar] [CrossRef]
  56. Sahoo, H.; Sinha, N.; Rath, S.S.; Das, B. Ionic liquids as novel quartz collectors: Insights from experiments and theory. Chem. Eng. 2015, 273, 46–54. [Google Scholar] [CrossRef]
  57. Shimoiizaka, J.; Nakatsuka, K.; Katayanagi, T. Separation of Feldspar from Quartz by a New Flotation Process; World Mining and Metals Technology Port City Press: Baltimore, MD, USA, 1976; pp. 428–438. [Google Scholar]
  58. Crozier, R.D. Non-metallic mineral flotation. Ind. Miner. 1990, 269, 55–65. [Google Scholar]
  59. Demir, C.; Gülgonul, I.; Bentli, I.; Çelik, M. Differential separation of albite from microcline by monovalent salts in HF medium. Min. Met. Process 2003, 20, 120–124. [Google Scholar] [CrossRef]
  60. Zuo, Q.X.; Liu, J.W.; Chen, J. Study on deep purification and kinetics of Fengyang quartz sand by calcination, quenching and acid leaching. Conserv. Util. Miner. Resour. 2022, 5, 76–81. [Google Scholar]
  61. Pan, X.D. Resource, characteristic, purification and application of quartz: A review. Miner. Eng. 2022, 183, 107600. [Google Scholar] [CrossRef]
  62. Lin, M.; Pei, Z.Y.; Lei, S.M. Mineralogy and processing of hydrothermal vein quartz from hengche, Hubei Province (China). Minerals 2017, 7, 161. [Google Scholar] [CrossRef]
  63. Tuncuk, A.; Akcil, A. Iron removal in production of purified quartz by hydrometallurgical process. Int. J. Miner. Process 2016, 153, 44–50. [Google Scholar] [CrossRef]
  64. Yang, C.; Li, S.; Yang, R.; Bai, J.; Guo, Z. Recovery of silicon powder from kerf loss slurry waste using superconducting high gradient magnetic separation technology. J. Mater. Cycles Waste Manag. 2018, 20, 937–945. [Google Scholar] [CrossRef]
  65. Du, F.; Li, J.; Li, X.; Zhang, Z. Improvement of iron removal from silica sand using ultrasound-assisted oxalic acid. Ultrason. Sonochem. 2011, 18, 389–393. [Google Scholar] [CrossRef] [PubMed]
  66. Lee, S.O.; Tran, T.; Jung, B.H.; Kim, S.J.; Kim, M.J. Dissolution of iron oxide using oxalic acid. Hydrometallurgy 2007, 87, 91–99. [Google Scholar] [CrossRef]
  67. Zeng, H.; Lei, S.; Liu, Y.; Zhang, F. Effect and Complexation Mechanism of Complex Ion in Quartz Purification by Oxidation Leaching. Min. Res. Dev. 2012, 32, 67–70. [Google Scholar]
  68. Su, Y.; Zhou, Y.; Huang, W.; Gu, Z. Study on reaction kinetics between silica glasses and hydrofluoric acid. J. Chin. Ceram. Soc. 2004, 32, 287–293. [Google Scholar]
  69. Zhong, L.; Lei, S.; Wang, E.; Pei, Z.; Li, L.; Yang, Y.Y. Research on removal impurities from vein quartz sand with complexing agents. Appl. Mech. Mater. 2013, 454, 194–199. [Google Scholar] [CrossRef]
  70. Luo, X.; Yang, W.; Li, R.; Gao, L. Effects of pH on the solubility of the feldspar and the development of secondary porosity. Bull. Mineral. Petrol. Geochem. 2001, 20, 103–107. [Google Scholar]
  71. Xiong, K.; Pei, Z.; Zang, F.; Lin, M. Process and Mechanism of High-purity Quartz Prepared by Mixed Acid Leaching. Non-Met. Mines 2016, 39, 60–62. [Google Scholar]
  72. Lin, M.; Pei, Z.; Li, Y.; Liu, Y.; Wei, Z.; Lei, S. Separation mechanism of lattice-bound trace elements from quartz by KCl-doping calcination and pressure leaching. Miner. Eng. 2018, 125, 42–45. [Google Scholar] [CrossRef]
  73. Wu, X. Study on Raw Material Selection Evaluation and Purification Technology of High Purity Quartz. Master’s Thesis, Southwest University of Science and Technology, Mianyang, China, 2013. [Google Scholar]
  74. Pan, J.L. Experimental Study on Preparation of 4N8 Standard High Purity Quartz by Chlorination Roasting. Master’s Thesis, Chengdu University of Technology, Chengdu, China, 2015. [Google Scholar]
  75. Zhang, D.H. Experimental Study on Processing 5N High Purity Quartz with Vein Quartz as Raw Material. Master’s Thesis, Chengdu University of Technology, Chengdu, China, 2016. [Google Scholar]
  76. Mao, L.W.; Gu, C.H.; Wu, J.X. Experimental study on production of high purity quartz sand by replacing crystal with vein quartz. World Build. Mater. 2010, 31, 1–4. [Google Scholar]
  77. Zhang, S.X. Study on purification of quartz minerals. J. Jinzhou Norm. Univ. Nat. Sci. Ed. 2001, 22, 28–30. [Google Scholar]
  78. Zhang, H.Q.; Tan, X.M.; Ma, Y.M.; Chen, C.L.; Zhang, S.H.; Wang, L.; Liu, L.; Zhu, L.K.; Guo, L.X.; Zhang, H.L.; et al. Geological characteristics and 4N8 grade product preparation technology of Altai pegmatite type high purity quartz deposit in Xinjiang. Conserv. Util. Miner. Resour. 2022, 5, 1–7. [Google Scholar]
  79. Wang, L. The concept of high purity quartz and the classification of raw materials. Conserv. Util. Miner. Resour. 2022, 5, 55–63. [Google Scholar]
Figure 1. Hand specimen of B6-1 vein quartz. (a) Translucent grayish-white. (b) Light yellowish-brown rust.
Minerals 14 00727 g001
Figure 2. Flow chart of purification experiment.
Minerals 14 00727 g002
Figure 3. The experimental setup used for chlorination roasting. Arrow represents rotation.
Minerals 14 00727 g003
Figure 4. Microphotographs (TPM and BSE) of the B6-1 raw vein quartz. (a) Single-polarized photos. (b,c) Orthographic polarized photos. (df) SEM microphotographs: K-feldspar.
Minerals 14 00727 g004
Figure 5. Microphotographs (TPM) of fluid inclusions in the B6-1 raw vein quartz. (af) TPM of 2.5×, 10× and 20× of primary inclusions. A certain number of isolated or clustered primary fluid inclusions, mainly H2O and CO2. (gl) TPM of 2.5×, 10×, and 20× of secondary inclusions. A large number of small secondary inclusions distributed in bands or clusters along the fractures.
Minerals 14 00727 g005
Figure 6. The content of SiO2 and impurity elements in in raw ore and different processed quartz sand. Acid leaching sand: flotation + acid leaching. (a) The content of SiO2. (b) The content of impurity elements. Chlorinated sand: flotation + acid leaching + chlorination roasting.
Minerals 14 00727 g006
Figure 7. Microphotographs (BSE) of B6-1 quartz sand. (a) Ultrasonic scrubbing quartz sand. (b) Flotation quartz sand. (c,d) Calcination quartz sand. (e,f) Acid leaching quartz sand.
Minerals 14 00727 g007
Figure 8. Microphotographs (TPM) of B6-1 quartz sand. (ac) Flotation quartz sand. (df) Acid leaching quartz sand. (gi) Chlorination quartz sand. Acid leaching quartz sand: flotation + acid leaching. Chlorinated quartz sand: flotation + acid leaching + chlorination roasting.
Minerals 14 00727 g008
Figure 9. Typical isomorphic substitution in quartz crystal.
Minerals 14 00727 g009
Table 1. The contents (µg·g−1) of main metallic elements in the quartz ore and processed quartz sand determined by solution ICP-MS analysis.
ElementRaw OreFlotation SandAcid Leaching SandChlorinated SandIOTA-STD
Li2.38 2.44 2.26 2.37 0.90
Bbdl0.19 0.48 0.55 0.08
Na6.65 6.47 5.09 0.72 0.90
Mg0.50 1.11 0.20 0.30 <0.05
Al54.05 34.85 13.08 13.50 16.20
K34.66 16.32 1.22 0.35 0.60
Ca22.55 6.09 0.95 0.78 0.50
Ti5.06 5.13 5.22 5.23 1.10
Crbdl0.52 0.02 0.01 <0.05
Mn0.02 0.10 0.06 0.06 <0.05
Fe2.82 4.06 0.30 0.24 0.23
Ni0.02 0.17 0.15 0.10 <0.05
Cu0.16 bdl0.03 0.02 <0.05
Σ128.86 (Σ0) 77.42 (Σ1) 29.06 (Σ2)24.23(Σ3) <19.66
Removal rate-39.92%77.45%81.20%-
SiO2 (wt%)99.987 99.992 99.997 99.998 >99.998
IOTA-STD is the main product of United States Unimin Corporation. bdl: below the detection line; removal rate = (Σi− Σ0)/Σ0; SiO2 (wt%) = (1 − Σi /1,000,000) * 100.
Table 2. The results of particle size sieve analysis.
Size Range (mm)Yield (g)Productive Rate/%
+0.42540040.0
−0.425 +0.07452052.0
−0.074808.0
Disclaimer/Publisher’s Note: The statements, opinions and data contained in all publications are solely those of the individual author(s) and contributor(s) and not of MDPI and/or the editor(s). MDPI and/or the editor(s) disclaim responsibility for any injury to people or property resulting from any ideas, methods, instructions or products referred to in the content.

