Article

Reevaluating Hendy Test with Modern Cave Calcite from the Monsoon Region of China

1
Key Laboratory of Cenozoic Geology and Environment, Institute of Geology and Geophysics, Chinese Academy of Sciences, Beijing 100029, China
2
Center for Agricultural Resources Research, Institute of Genetics and Developmental Biology, Chinese Academy of Sciences, Shijiazhuang 050021, China
3
Institute of Geomechanics, Chinese Academy of Geological Sciences, Beijing 100081, China
4
Center for Climate Physics, Institute for Basic Science, Pusan National University, Busan 46241, Republic of Korea
5
State Key Laboratory of Biogeology and Environmental Geology, School of Geography and Information Engineering, China University of Geosciences, Wuhan 430074, China
6
Hunan Provincial Key Laboratory for Eco-Environmental Changes and Carbon Sequestration of the Dongting Lake Basin, School of Geographical Sciences, Hunan Normal University, Changsha 410081, China
7
Institute of Vertebrate Paleontology and Paleoanthropology, Chinese Academy of Sciences, Beijing 100044, China
8
Institute of Global Environmental Change, Xi’an Jiaotong University, Xi’an 712000, China
*
Authors to whom correspondence should be addressed.
Minerals 2024, 14(8), 747; https://doi.org/10.3390/min14080747
Submission received: 18 June 2024 / Revised: 16 July 2024 / Accepted: 23 July 2024 / Published: 25 July 2024
(This article belongs to the Special Issue Stalagmite Geochemistry and Its Paleoenvironmental Implication)

Abstract

:
The Hendy Test is widely used for assessing whether isotopic equilibrium was reached in speleothems by examining the δ18O and δ13C correlation along a single growth layer. However, stalagmite micro-layers are typically only a few micrometers thick and taper off from the center towards the sides, making it challenging to sample within the same growth layer in practice. To address this, we selected three caves in the monsoon region of China (Shihua Cave in the north, Heshang Cave in the central, and Baojinggong Cave in the south) to verify whether the modern cave calcite has reached equilibrium fractionation with drip water. We examined the spatial variations in the δ18O and δ13C values of farmed calcite on glass plates, which are analogous to a single growth layer. The δ18O and δ13C correlations of farmed calcite from different cave sites are consistently strong, suggesting that kinetic fractionation effects are prevalent, especially at the drip sites with lower drip rates due to longer CO2 degassing. The δ18O–δ13C covariations can also occur along speleothem growth axes on short time scales, while isotopic variations over longer time scales are still in response to climate change. We propose that the Hendy Test criteria might not be prerequisites to isotopic equilibrium, and a Replication Test provides a more reliable indication of the integrity of isotopic proxies in paleoclimate research.

1. Introduction

Stable isotope compositions of oxygen and carbon (δ18O and δ13C) in stalagmites have become a new benchmark for global paleoclimate comparison due to their high-precision absolute age scale [1,2]. Speleothem δ18O records from the monsoon region of China (MRC) have been utilized to interpret the fluctuations of the East Asian summer monsoon [3,4,5,6,7,8], which is based on the assumption that stalagmite δ18O is a reliable indicator of meteoric precipitation δ18O [9,10,11]. Although the use of speleothems in paleoenvironmental reconstructions is increasing, there are only a few studies that assess the degree to which isotopic equilibrium is achieved during speleothem formation [12,13,14]. As the climatic interpretation of speleothem isotopic proxies remains a hotly debated issue in the MRC, it is necessary to confirm that the actively growing stalagmites were formed in isotopic equilibrium with their corresponding drip water.
In 1971, Hendy detailed the different equilibrium and kinetic processes that control the δ18O and δ13C values in the formation of calcite speleothems [15]. There are two criteria of the Hendy Test that determine whether speleothem isotopic composition can serve as a proxy for past environmental conditions: (1) speleothem δ18O values remain constant along a single growth layer; (2) there is no progressive enrichment in δ13C and δ18O from center to edge along the laminae. Thus, the absence of correlation between δ18O and δ13C values suggests that calcite precipitation occurred under consistent isotopic equilibrium conditions. Conversely, the covariation of the δ18O and δ13C along the laminae indicated the kinetic effects affected the isotopic ratios.
However, it is important to note that there are limitations to the Hendy Test criteria [16]. The concept of sampling along a single growth layer has been criticized as flawed in both theory and practice. Stalagmite micro-layers are typically only a few micrometers thick and taper off from the center to the flanks, making it challenging to sample within the same layer in practice. Additionally, some studies have pointed out that the test may not be a valid control of equilibrium conditions because isotopic equilibrium could theoretically occur in the center of the speleothem while kinetic fractionation occurs at the flanks [17,18,19].
To address this, we selected three caves in the MRC (Shihua Cave in the north, Heshang Cave in the central, and Baojinggong Cave in the south) to verify whether the modern stalagmite calcite had reached equilibrium fractionation. We examined the spatial variations in the δ18O and δ13C values of farmed calcite on glass plates, which are analogous to a single growth layer. Based on our modern “Hendy Test” on farmed calcite, we propose that Hendy Test criteria might not be prerequisites to isotopic equilibrium. Instead, a “Replication Test” provides a more reliable indication of the integrity of isotopic equilibrium in paleoclimate research [16,20].

2. Materials and Methods

2.1. Cave Settings

A 3-year-long (from May 2011 to April 2014) on-site cave monitoring program has been carried out in the MRC [11]. A previous study has investigated the seasonal variations of precipitation δ18O at a regional scale and the transmission of isotopic signals from precipitation to different drip sites [11]. However, isotopic results of modern stalagmite calcite farmed on the glass plates have not been reported, and whether the modern stalagmite calcite reached equilibrium fractionation has not been verified for this cave monitoring program. To address this, we selected three caves in the MRC (Shihua Cave in the north, Heshang Cave in the central, and Baojinggong Cave in the south) to examine the spatial variations in δ18O and δ13C values of farmed calcite on the glass plates.
The locations of three monitoring caves in the MRC are illustrated in Figure 1, and the basic information for each cave is summarized in Table 1. Shihua (SH) Cave was described in [21]; Heshang (HS) Cave was described in [22]; and Baojinggong (BJG) Cave was described in [23]. Situated within the MRC, all three caves have wet-hot summers and dry-cold winters. The summer monsoon season, which spans from May to October, accounts for over 70% of the annual precipitation for all cave sites. Both BJG and HS have a sub-tropical monsoon climate, whereas SH has a temperate monsoon climate. The annual precipitation and average annual temperature for the three cave sites increase from north to south. There are also discrepancies in cave geology among the three caves (Table 1).

2.2. Collection of Farmed Calcite

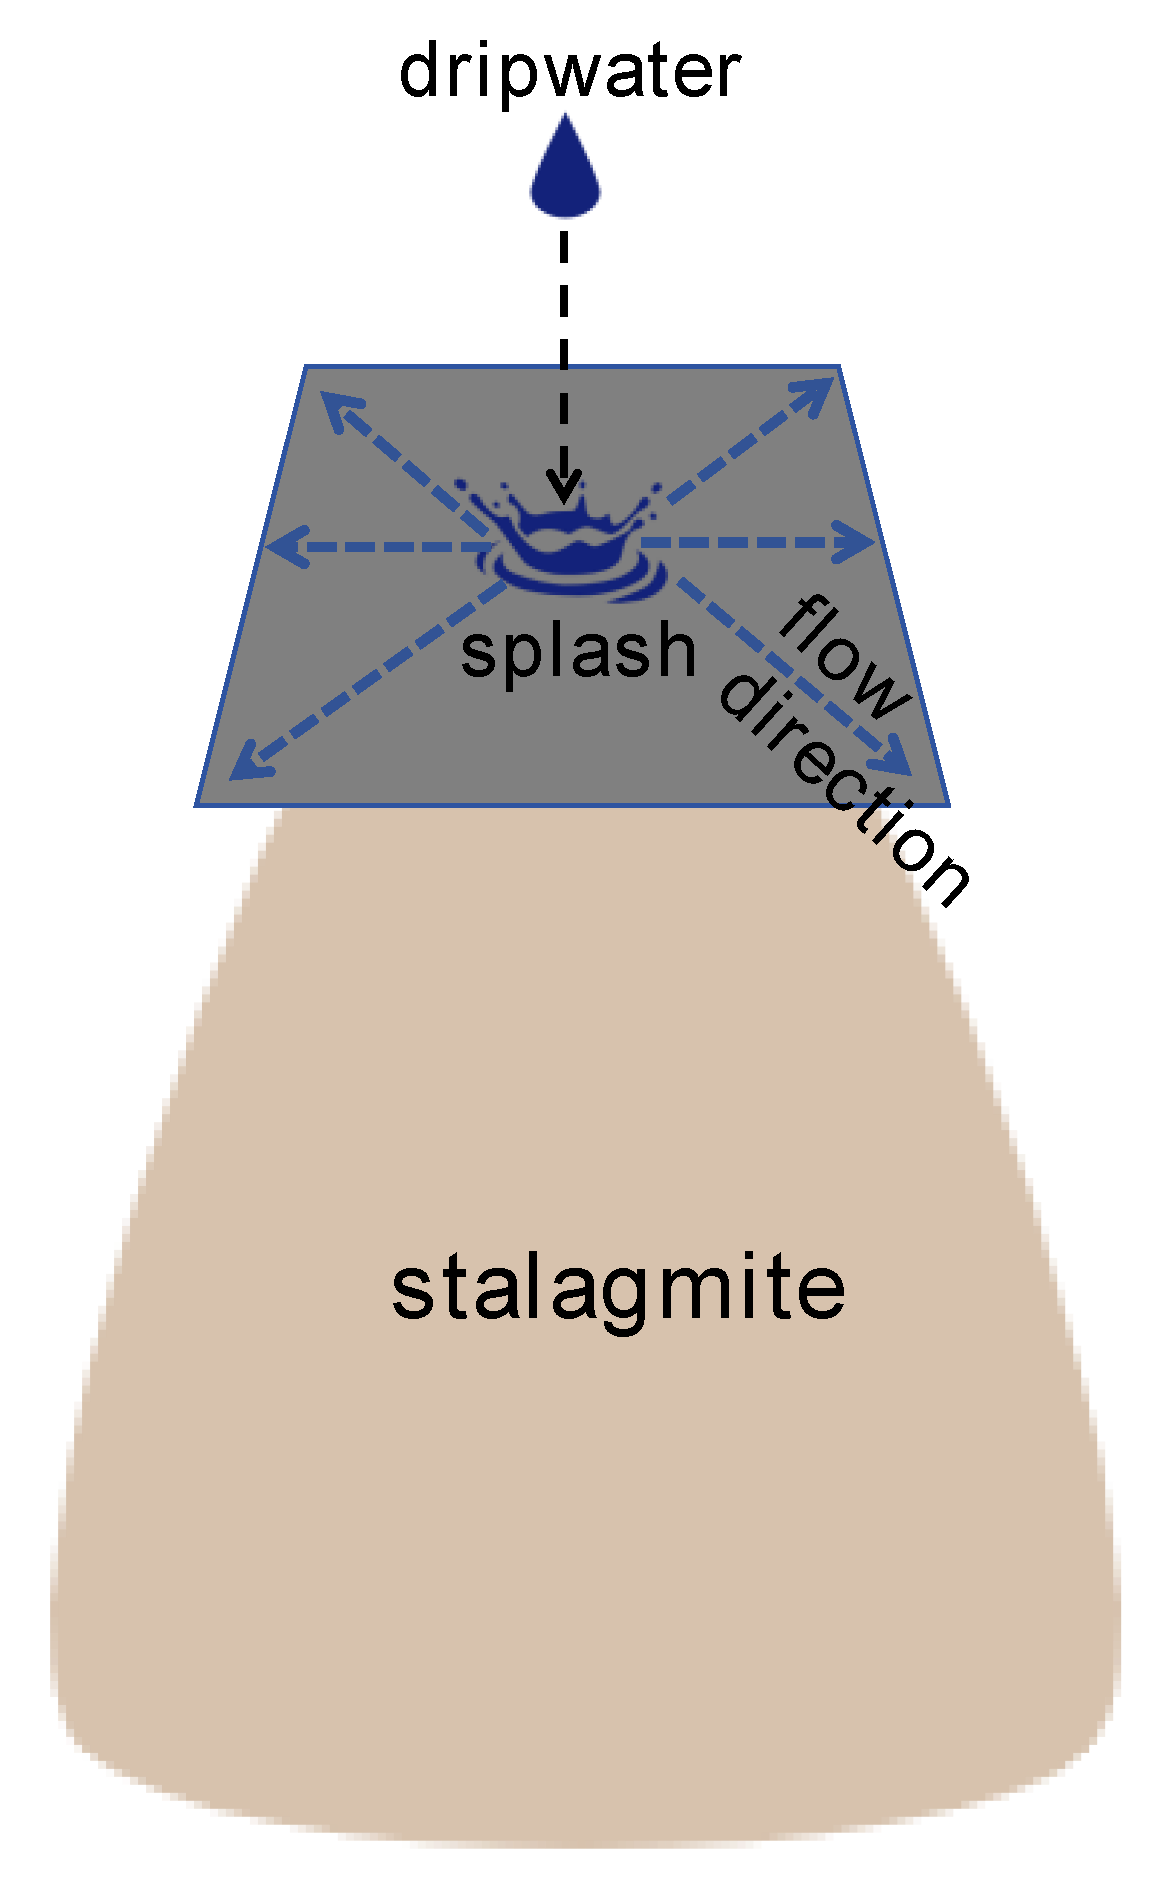
We have assessed speleothem isotopic equilibrium [25] by adapting the glass plate method, as previously reported by Mickler et al. [26]. Frosted glass plates (10 cm × 10 cm) were placed on actively growing stalagmites (5 sites in SH, 4 sites in HS, and 5 sites in BJG) for future collection of farmed calcite [11]. First, a plastic bag was placed over the growing stalagmites, and then a clay base was built on top of the bag. The plates were positioned horizontally on the clay base, with the drip water falling precisely in the center of the plate (Figure 2). After visual verification of calcite growth, glass plates were periodically removed and replaced (1–3 months). Recovered plates were rinsed with deionized water, then dried and weighed. Calcite growth and crystal habit were verified using a Leica DVM6 digital microscope (Leica Microsystems, Wetzlar, Hesse-Darmstadt, Germany).
By comparing the weights of the glass plates before placement and after collection, we selected two plates with the most significant calcite deposition on each for multi-point isotopic analysis (at least 5 points for each glass plate). The spatial variability in the δ13C and δ18O values of modern stalagmite calcite was evaluated by collecting the entire thickness of calcite samples using a dental drill. This is analogous to sampling an ancient speleothem along a single growth layer. Each calcite sample must contain more than 20 micrograms for further isotopic analysis. Thus, sample points with thinner calcite thickness need to be drilled into a cycle area with a larger diameter.

2.3. Stable Isotope Analysis

Drip water and contemporary calcite samples were collected and prepared for isotopic analysis, following the methods detailed in [11]. Stable oxygen isotope analyses of drip water were performed via a Picarro L2130-i water isotope analyzer (Picarro Inc., Santa Clara, CA, USA) in the Key Laboratory of Tibetan Environment Change and Land Surface Processes, Chinese Academy of Sciences. The measurement precision for δ18O was 0.1‰. We did not measure the δ13C value of dissolved inorganic carbon (DIC) in drip water.
Stable carbon and oxygen isotope analyses of the farmed calcite samples were performed in the Institute of Geology and Geophysics, Chinese Academy of Sciences, using a MAT-253 mass spectrometer connected to a Kiel Carbonate Device IV device (Thermo Fisher Scientific, Waltham, MA, USA) for the reaction of carbonate powder with 100% H3PO4 at 75 °C. All δ13C and δ18O values are reported in parts per mil (‰) relative to Vienna Pee Dee Belemnite (VPDB). Based on the reproducibility of the standard runs, the one-sigma errors were estimated to be 0.05‰ for δ13C and 0.1‰ for δ18O.

3. Results

3.1. Shihua Cave

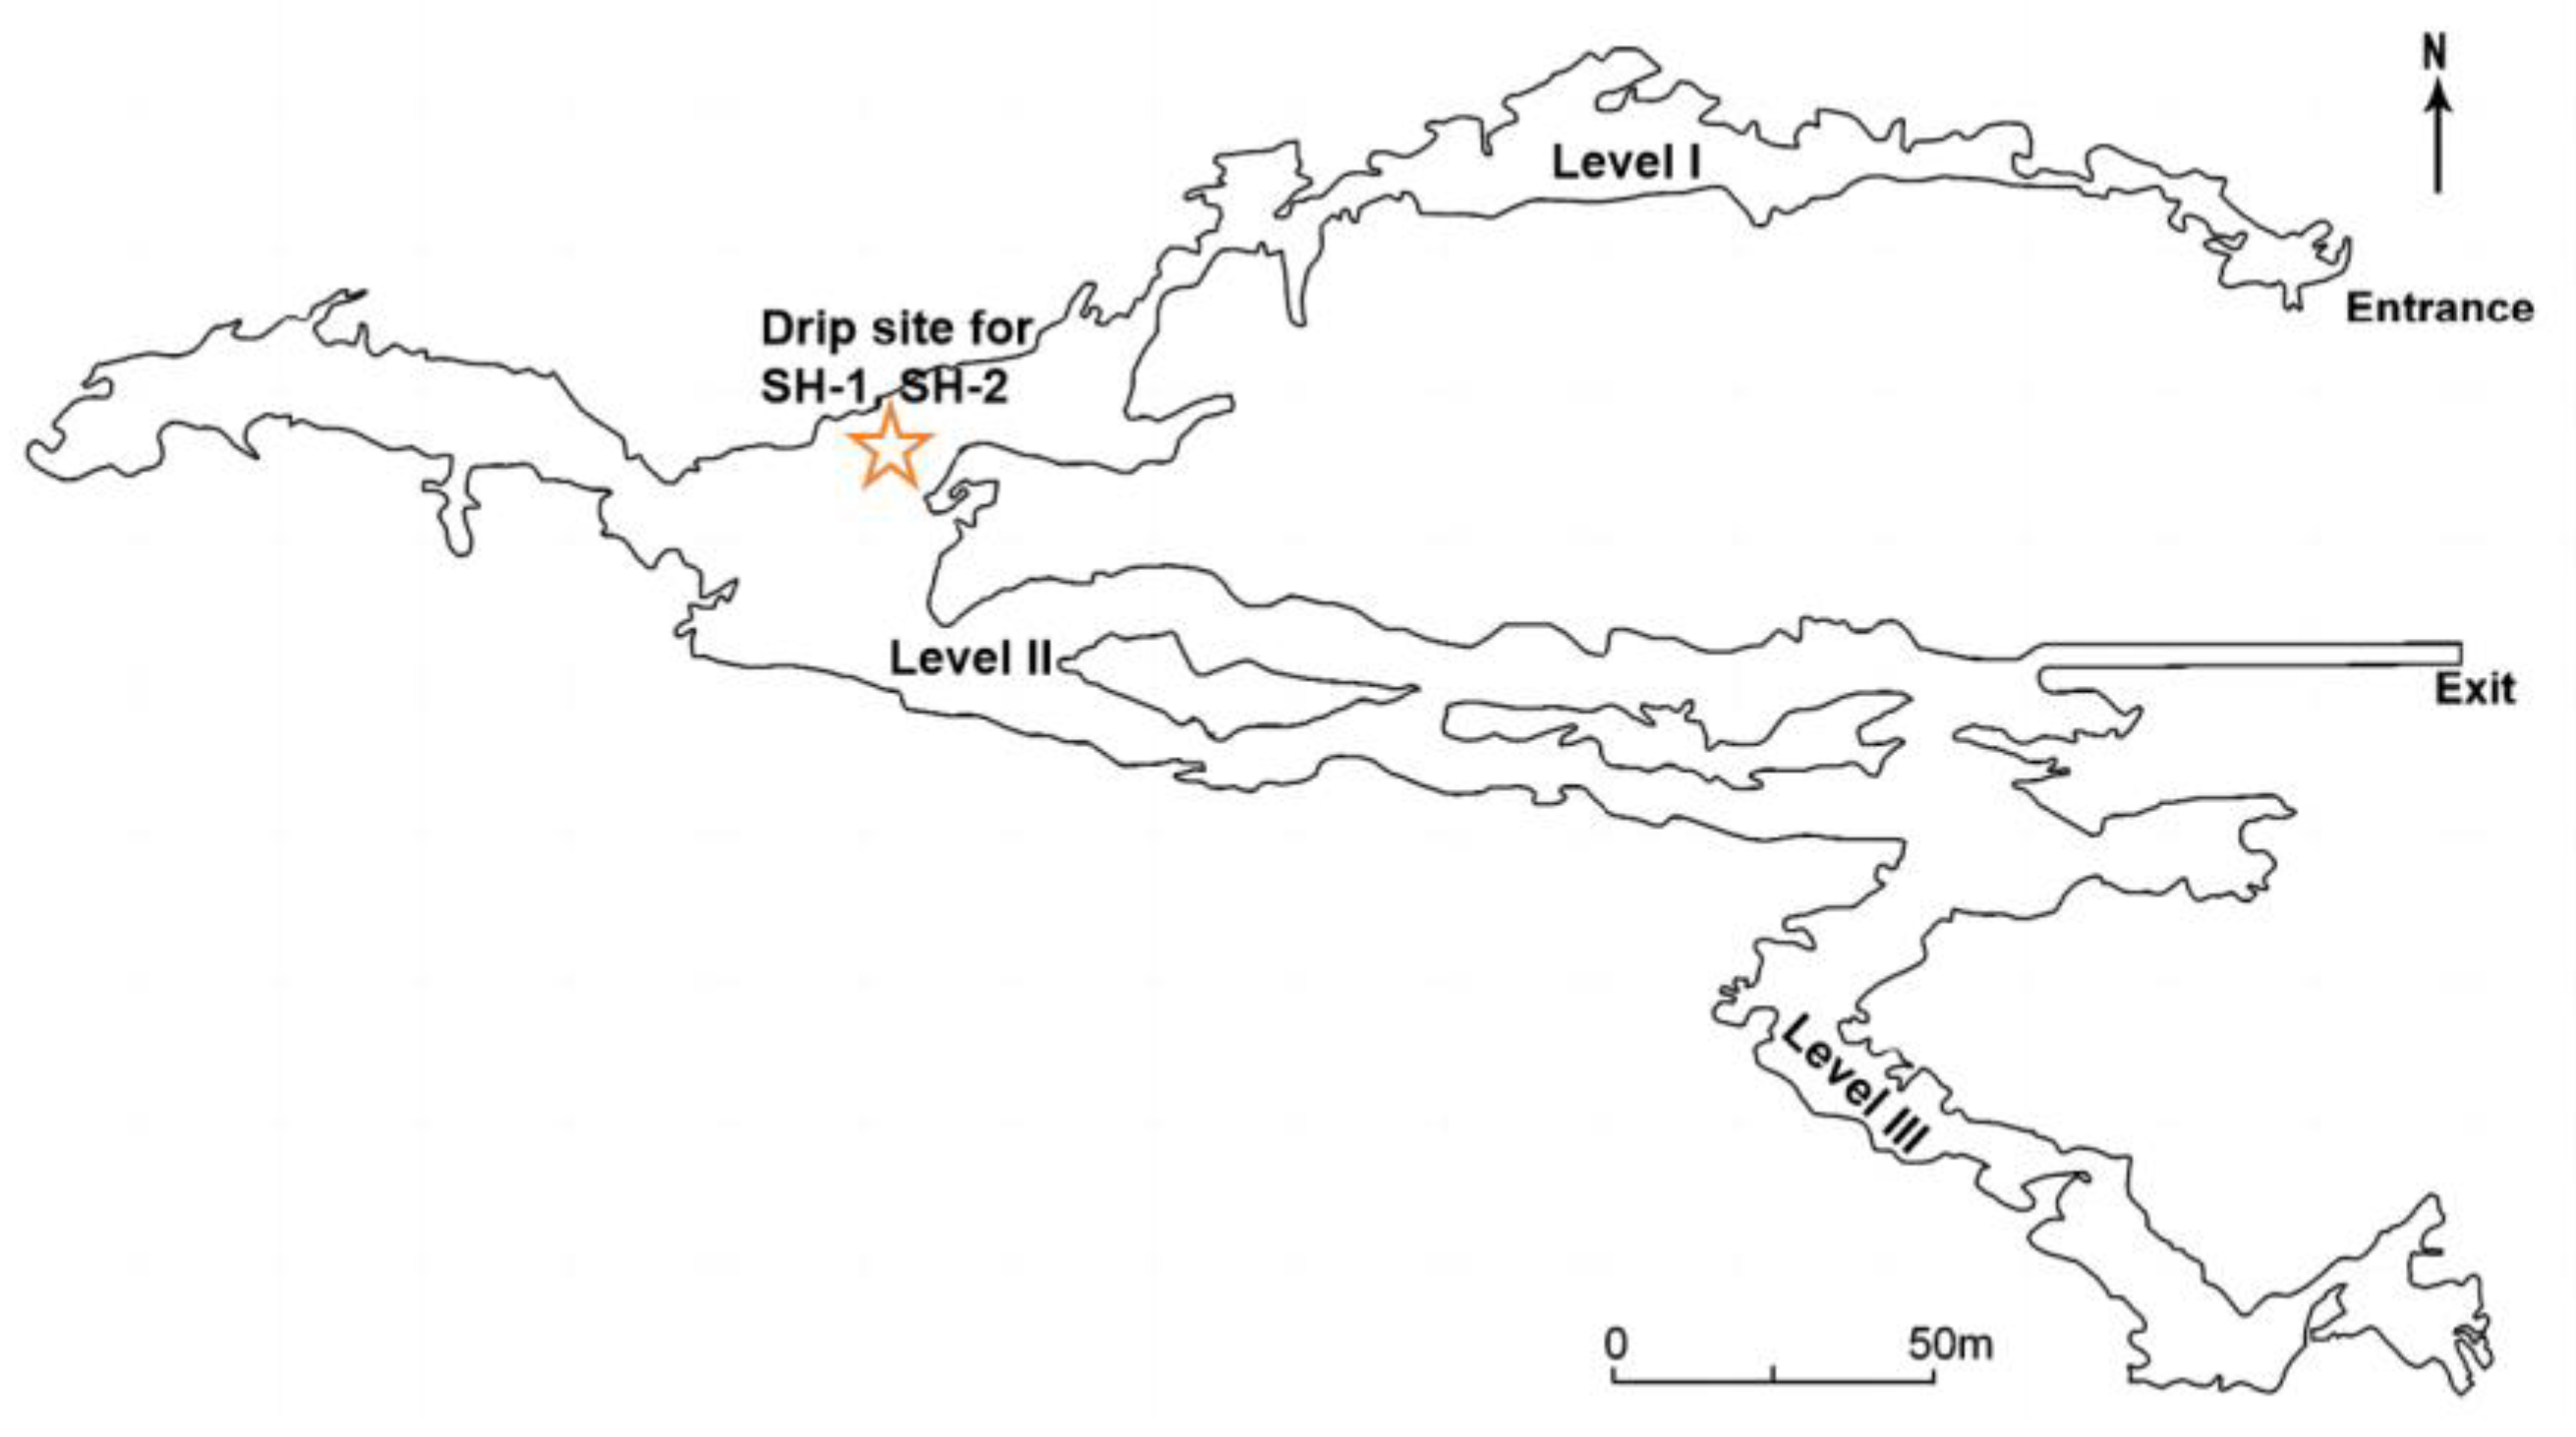
SH Cave (39°47′ N, 115°56′ E, 251 m a.s.l.), located on the northern rim of the North China Plain, is close to the northern edge of the modern summer monsoon [21]. The drip site for SH Cave is 200 m away from the cave entrance (Figure 3). Thus, this location maintains a stable microclimate due to the minimal impact of cave ventilation. Glass plate SH-1 was placed on 8 February 2013 and collected on 8 March 2013, while SH-2 was placed on 28 March 2012 and collected on 14 June 2012. During the growth periods, mean cave air temperatures were 15.1 °C (SH-1) and 16.4 °C (SH-2); average CO2 concentrations were 864 ppm (SH-1) and 1142 ppm (SH-2); relative humidities (RH) were 100% (SH-1) and 88.2% (SH-2); and drip rates were 0.34 drip/min (SH-1) and 0.38 drip/min (SH-2). The corresponding δ18O values of drip water (δ18OW) during the growth period were −8.71 (SH-1) and −8.62 (SH-2).
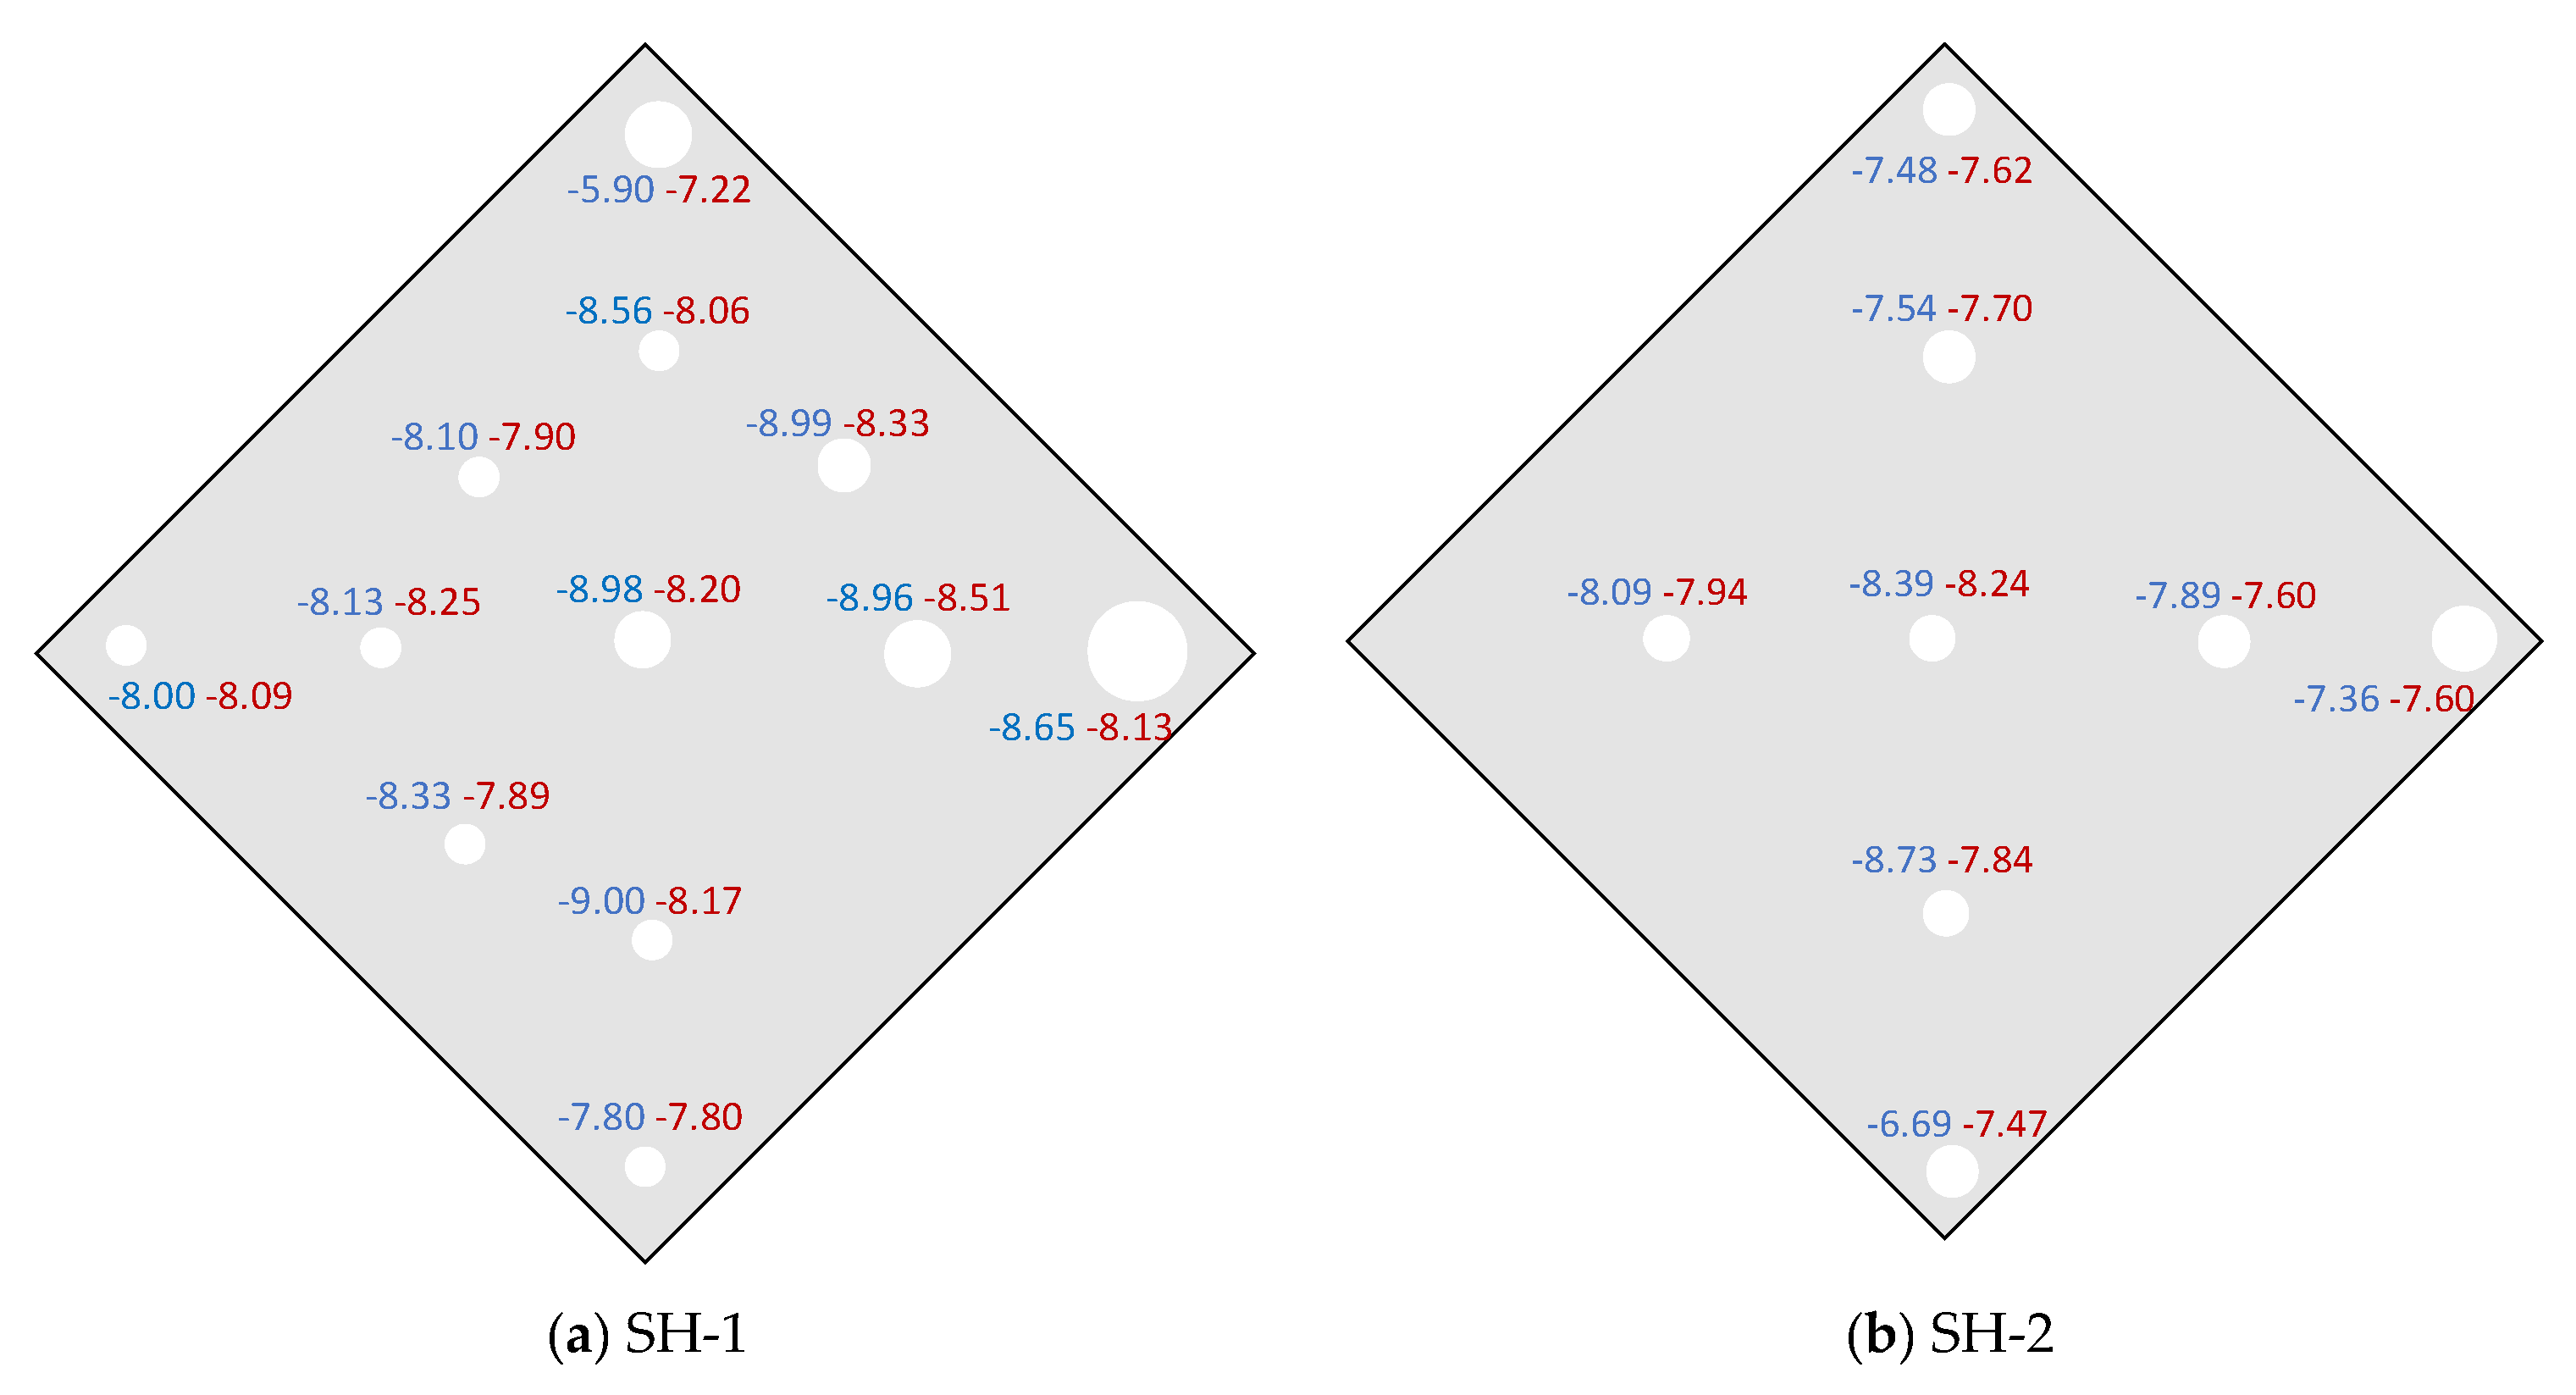
For glass plate SH-1 (Figure 4a), δ13C values ranged from −9.00‰ to −5.90‰, with an average of −8.28‰; δ18O values ranged from −8.51‰ to −7.22‰, with an average of −8.05‰. For glass plate SH-2 (Figure 4b), δ13C values ranged from −9.00‰ to −5.90‰, with an average of −8.28‰; δ18O values ranged from −8.73‰ to −6.69‰, with an average of −7.77‰. Both δ13C and δ18O values exhibited the lowest levels in the center, with an enriched trend toward the edge of the glass plates. There was a strong correlation between δ18O and δ13C for glass plate SH-1 (R2 = 0.82, N = 12), while there was a moderate correlation for glass plate SH-2 (R2 = 0.58, N = 7).

3.2. Heshang Cave

HS Cave (30°27′ N, 110°25′ E, 294 m a.s.l.) is located in the Qingjiang Valley, near the central Yangtze River valley, Hubei Province, central China [22]. The drip sites for HS Cave are closer to the cave entrance, and these sites have an unstable microclimate due to the strong influence of cave ventilation (Figure 5). Glass plate HS-1 was placed on 30 May 2011 and collected on 29 June 2011, while HS-2 was placed on 30 November 2011 and collected on 30 December 2011. During the growth periods, mean cave air temperatures were 19 °C (HS-1) and 17 °C (HS-2); drip rates were 4 drip/min (HS-1) and 3 drip/min (HS-2); and low average CO2 concentrations (<500 ppm) were low RH < 100% for both periods. The corresponding δ18OW values during the growth period are −8.10 (HS-1) and −7.78 (HS-2).
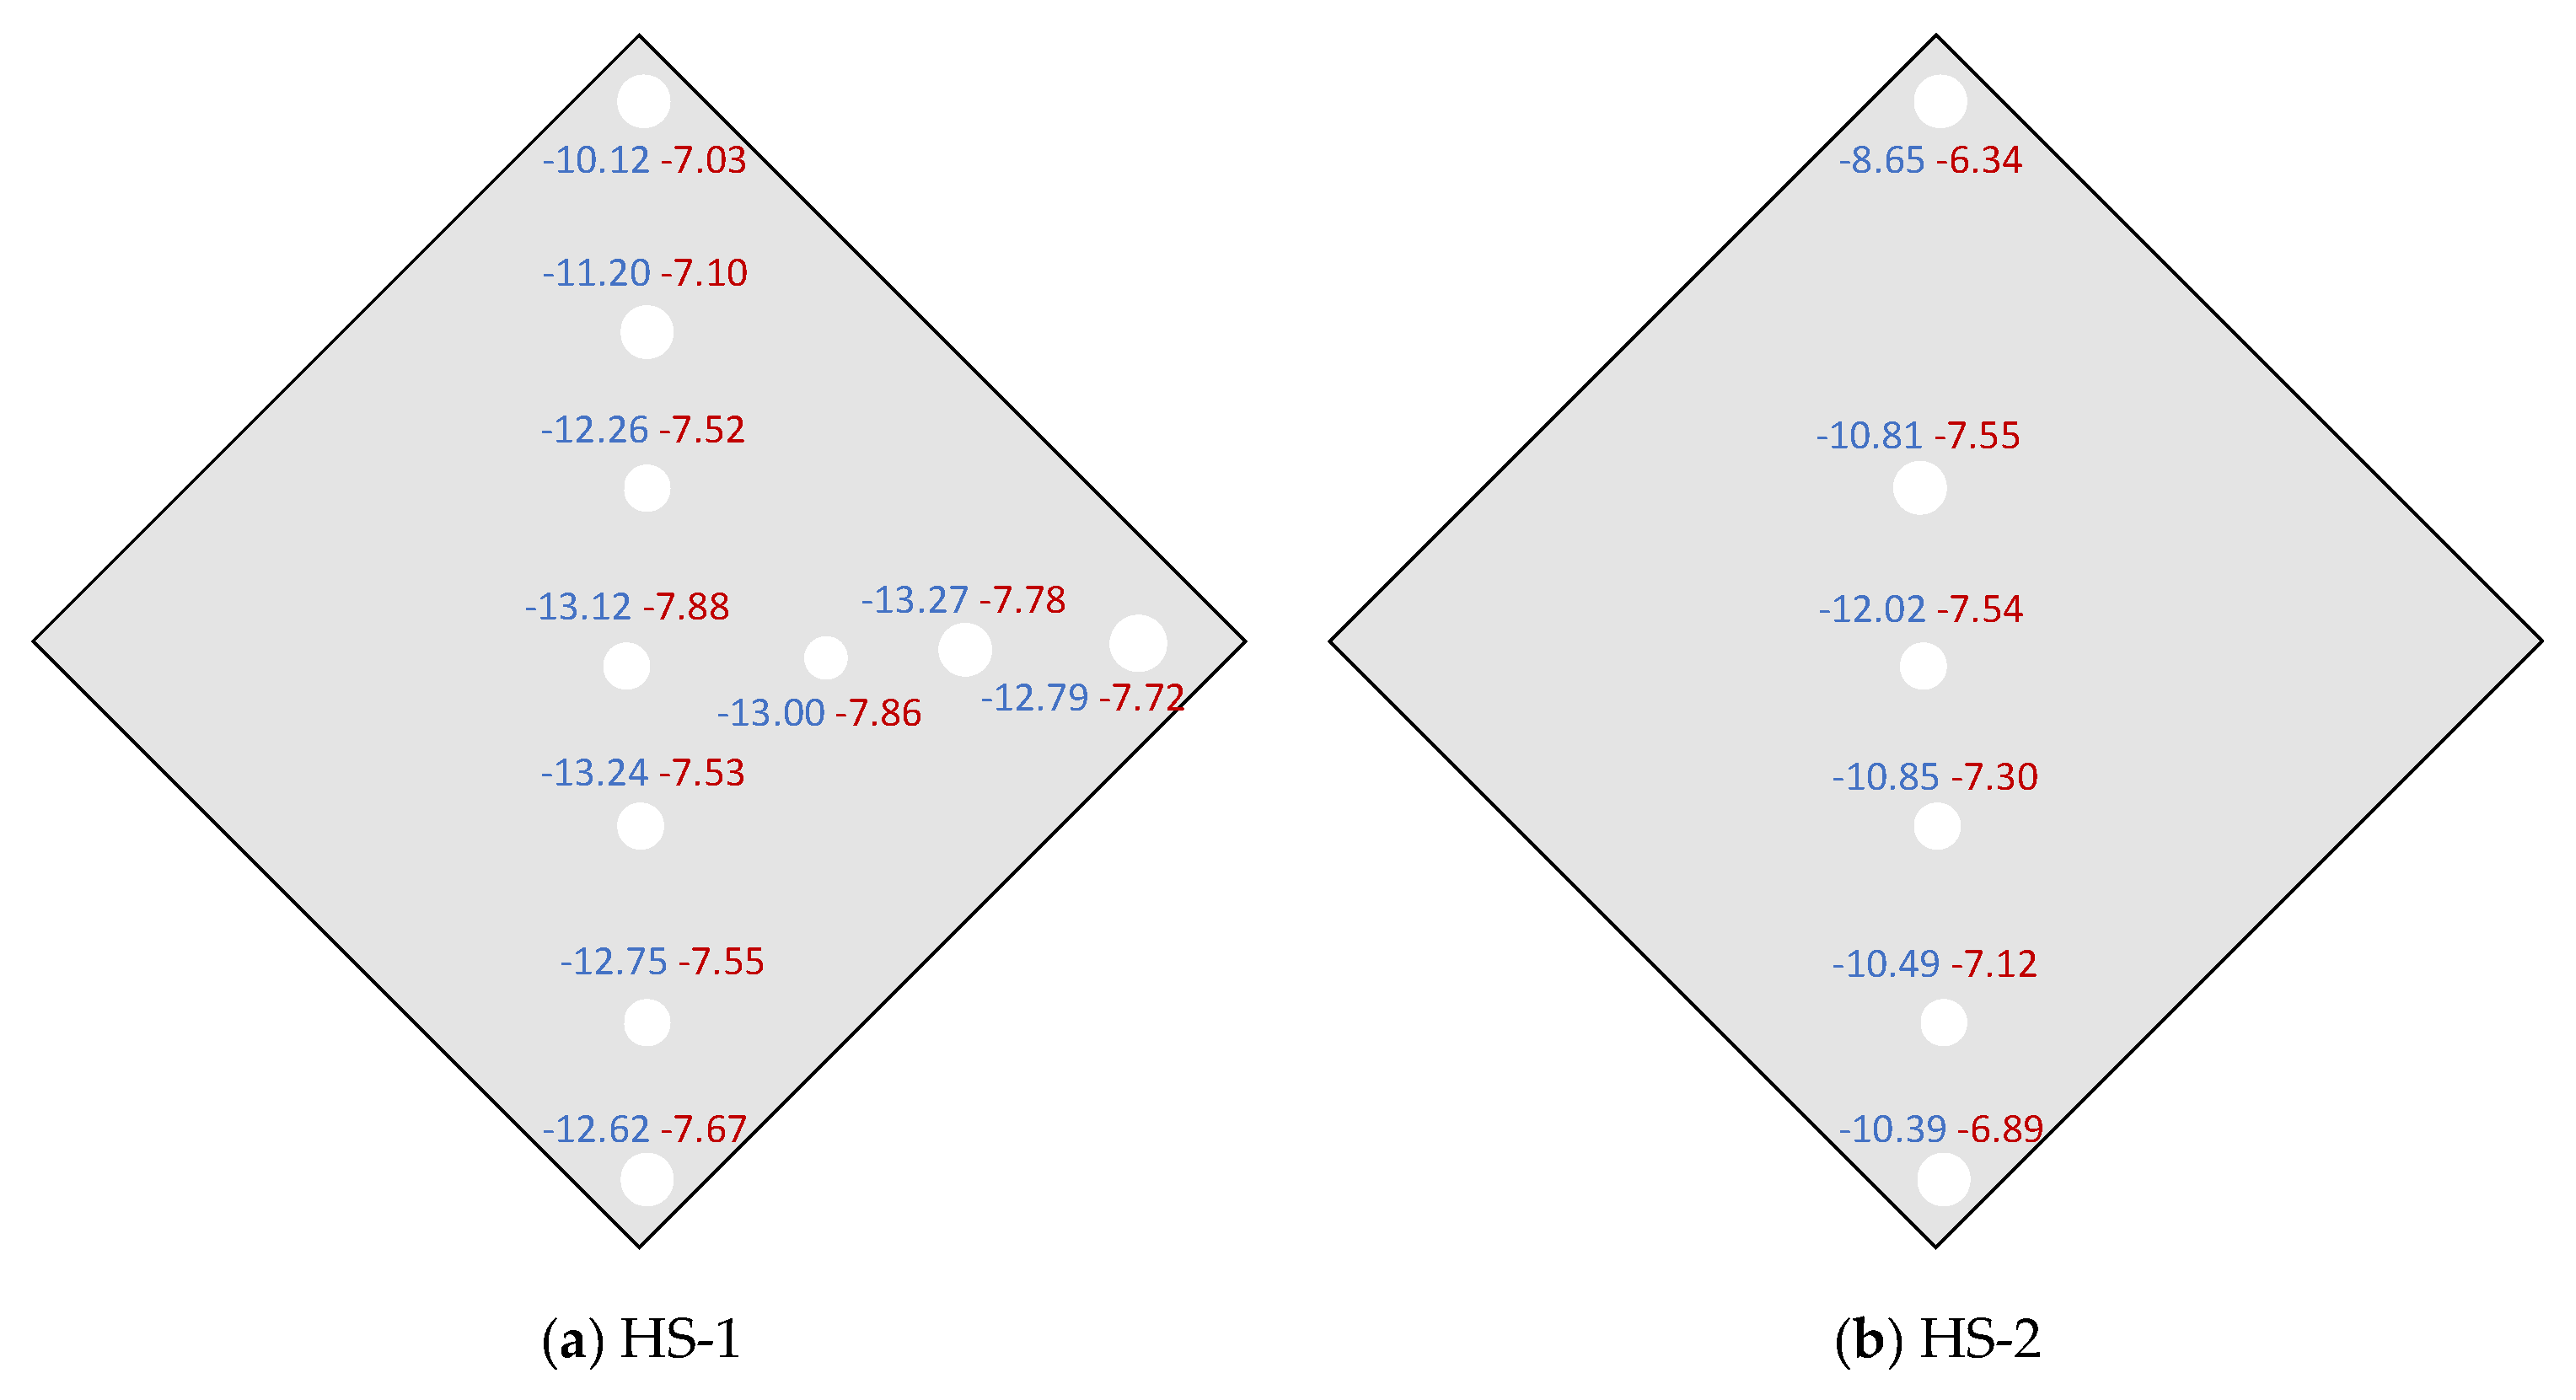
For glass plate HS-1 (Figure 6a), δ13C values ranged from −13.27‰ to −10.12‰, with an average of −12.44‰; δ18O values ranged from −7.88‰ to −7.03‰, with an average of −7.56‰. For glass plate HS-2 (Figure 6b), δ13C values ranged from −12.02‰ to −8.65‰, with an average of −10.53‰; δ18O values ranged from −7.55‰ to −6.34‰, with an average of −7.12‰. Both δ13C and δ18O values exhibited the lowest levels in the center, with an enriched trend toward the edge of the glass plates. There were strong correlations between δ18O and δ13C for glass plates HS-1 (R2 = 0.82, N = 10) and HS-2 (R2 = 0.84, N = 6).

3.3. Baojinggong Cave

BJG Cave (24°07′ N, 113°21′ E, 610 m a.s.l.) is about 70 km north of the city of Guangzhou, Guangdong Province, south China [23]. We chose two drip sites close to the cave entrance for BJG Cave, but there is a gate for the entrance and the gate is closed when there are no tourists (Figure 7). Both glass plates were placed on 3 March 2012, and then collected on 2 June 2012. During the growth period, mean cave air temperature was 16.2 °C; mean CO2 concentration was 982 ppm; mean RH was 88.4%; and drip rates were 6.25 drip/min (BJG-1) and 52.20 drip/min (BJG-2). The corresponding δ18OW values during the growth period were −6.08 (BJG-1) and −6.02 (BJG-2).
For glass plate BJG-1 (Figure 8a), δ13C values ranged from −14.25‰ to −11.43‰, with an average of −13.31‰; δ18O values ranged from −5.51‰ to −4.62‰, with an average of −5.22‰. For glass plate BJG-2 (Figure 8b), δ13C values ranged from −15.09‰ to −12.12‰, with an average of −13.93‰; δ18O values ranged from −5.67‰ to −5.03‰, with an average of −5.41‰. Both δ13C and δ18O values exhibited the lowest levels in the center, with an enriched trend toward the edge of the glass plates. There were strong correlations between δ18O and δ13C for glass plates BJG-1 (R2 = 0.93, N = 7) and BJG-2 (R2 = 0.97, N = 5).

4. Discussion

4.1. Equilibrium vs. Kinetic Isotope Fractionation

We used the average temperature during the growth period of plate calcite to calculate the oxygen fractionation factor. Calcite–water oxygen isotope fractionation can be calculated using the following equations [25]:
1000 ln αcalcite-water = 18.03 (103/T) − 32.42
αcalcite-water = (δcalcite + 1000)/(δwater + 1000)
ln αcalcite-water ≈ δcalcite − δwater
Note: T in Equation (1) is in Kelvin.
The summary of the basic characteristics of the monitoring drip sites for the three monitoring caves is provided in Table 2. We did not measure δ13C value of DIC in drip water; thus, we only assessed equilibrium vs. kinetic isotope fractionation for the δ18O value of farmed calcite. The spatial variability in modern calcite δ18O values exhibits consistent trends: δ18O values are lowest near the center of the glass plates, with isotopic values increasing away from the center (Figure 4, Figure 6, and Figure 8). The δ18OC values at centers of glass plates are close to the calculated δ18OC values based on δ18OW and T under equilibrium fractionation, while the δ18OC values at edges are higher than the predicted values under equilibrium. It is possible for isotopic equilibrium to occur at the centers of glass plates, but kinetic isotope fractionation occurs at the edges simultaneously.

4.2. δ13C and δ18O Covariation

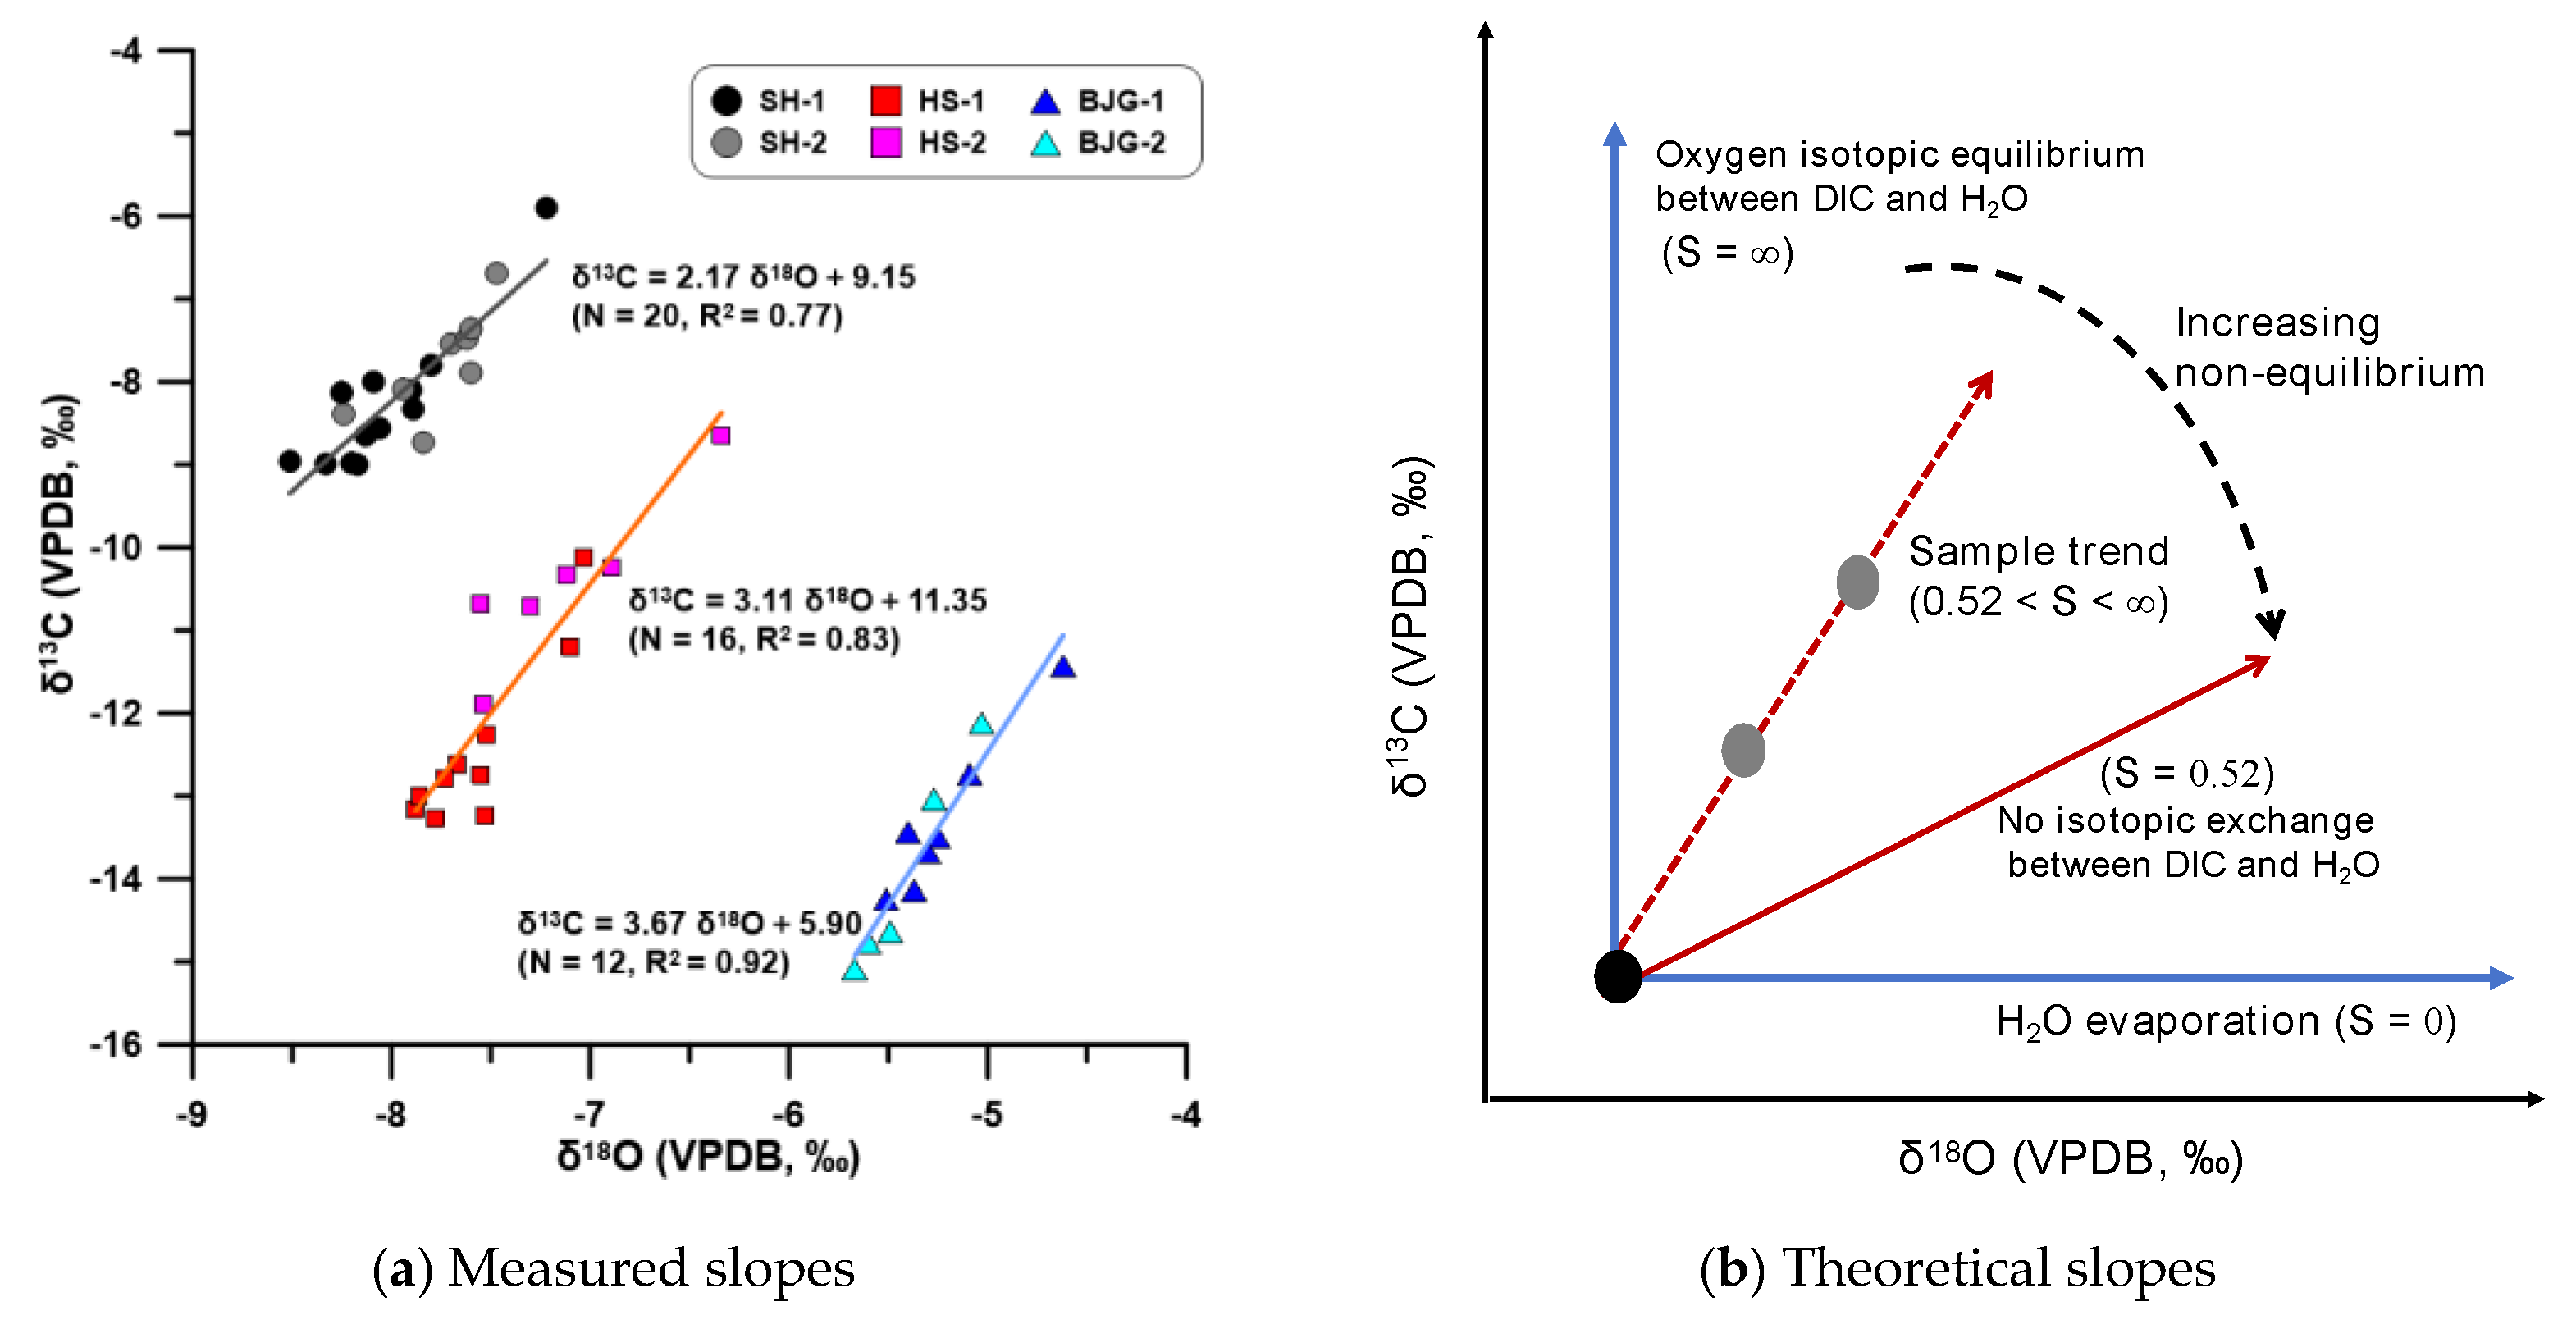
The δ13C and δ18O values of the spatially sampled modern calcite on the glass plates exhibit strong positive correlations (Figure 9a). We noted the regression lines for the three monitored caves have different slopes: 2.17 for SH, 3.11 for HS, and 3.67 for BJG. The slopes for different possible isotopic effects during calcite precipitation are displayed in Figure 9b.
If oxygen isotopic equilibrium is achieved between HCO3 and H2O (complete oxygen isotope buffering), the calcite δ18O values will remain unchanged during progressive CO2 degassing and CaCO3 precipitation. The degassing process caused 13C enrichment, thus manifesting a trend with a vertical slope (S = ∞). In the absence of oxygen isotopic exchange between HCO3 and H2O (without buffering), the slope of 0.52 denotes the δ13C/δ18O enrichment ratio as modeled by Rayleigh distillation [26]. If the “evaporation effect” of drip water dominates, the δ18O of drip water (δ18Ow) and corresponding calcite (δ18OC) would be elevated, while calcite δ13C values would not change (S = 0). The δ13C and δ18O covariations of our modern calcite samples displayed an intermediate slope (0.52 < S < ∞), indicating that incomplete oxygen isotopic buffering occurs between HCO3 and H2O. For the three monitoring caves, SH Cave, with its lower slope, might have stronger kinetic fractionation effects than the two others.
Many previous studies implied cave ventilation is the control factor of δ13C and δ18O covariation: the entry of low pCO2 outside air drives rapid CO2 degassing from drip water, which enriches the remaining DIC reservoir while preferentially removing the light isotopes [30,31]. Drip sites in HS and BJG Caves have lower CO2 concentrations, due to their close proximity to cave entrances and strong cave ventilation. However, the δ13C–δ18O slopes of HS and BJG Caves are higher than that of SH Cave, which indicates more oxygen isotope buffering for HS and BJG drip sites. There is a significant correlation between the drip rates and δ13C–δ18O slopes: the slower drip sites have smaller slopes. Thus, the disequilibrium fractionation in oxygen isotopes is more pronounced at slower drip-rate sites than at low pCO2 sites. For the slower drip-rate sites, the drip water spends more time on the stalagmite surface, allowing more time for both CO2 degassing and H2O evaporation. Long CO2 degassing depletes the DIC reservoir, making it unable to maintain oxygen isotopic equilibrium with H2O, particularly at the edge of the glass plates. Both DIC depletion (non-complete buffering) and H2O evaporation tend to cause shifts to higher δ18OC values with flatter δ13C–δ18O slopes [26,30].
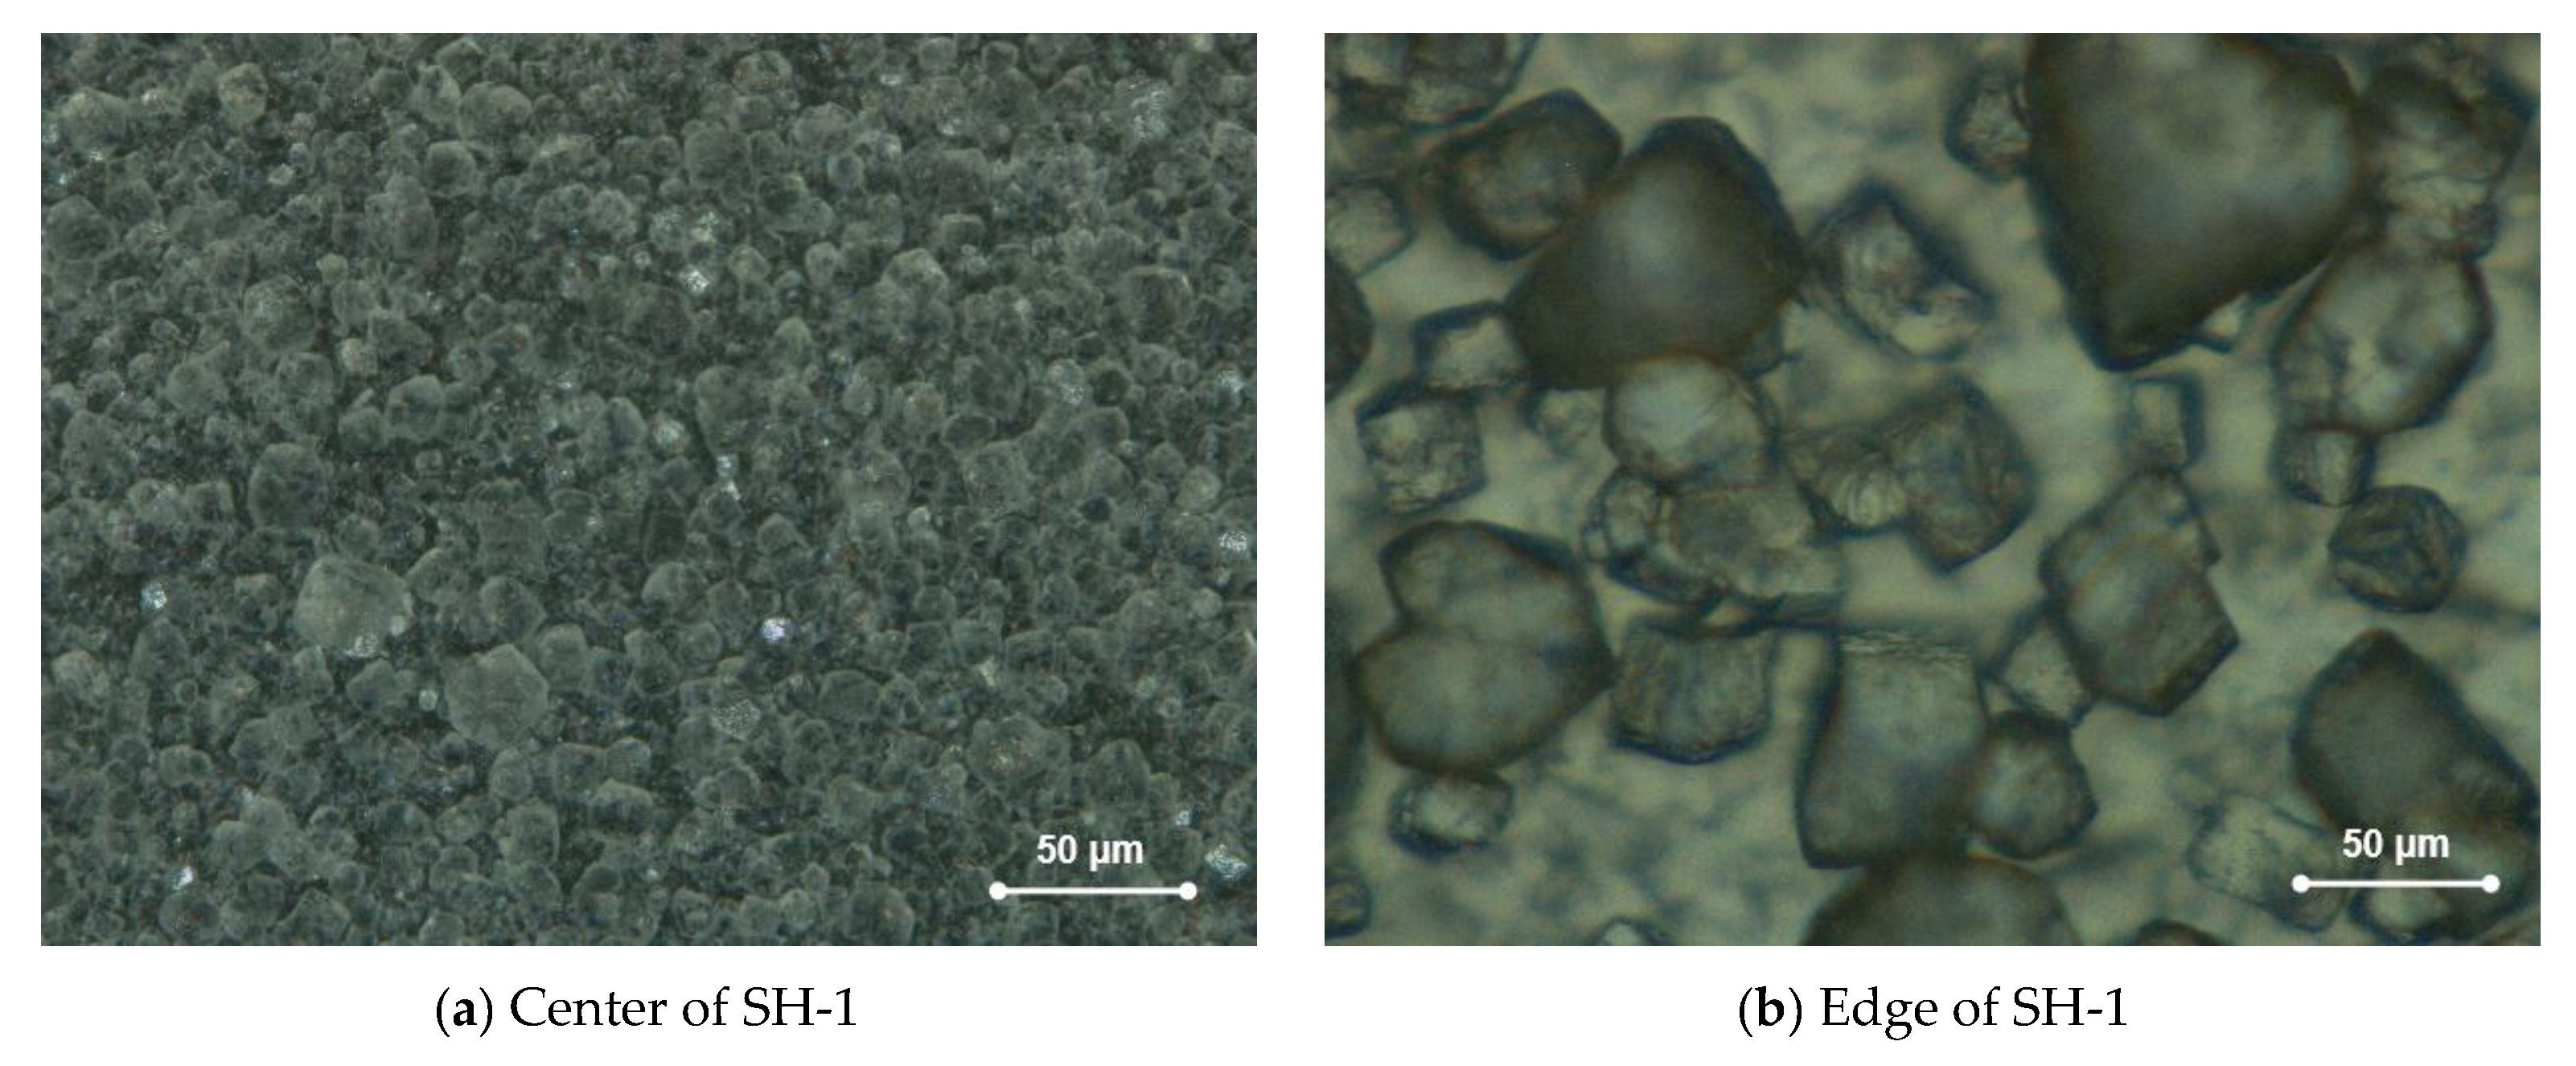
We also observed that the crystal size of farmed calcite can indeed vary between the edges and the center of glass plates (Figure 10). On glass plate SH-1, there are dense and small crystals (5–20 μm) at the center, while sparse and large crystals (20–100 μm) are at the edge. The speed and intensity of water flow can affect the growth and morphology of calcium carbonate crystals. The stronger impact of water droplets at the center may lead to the breakage or deformation of crystals, while weaker water flows at the edge are conducive to the formation of larger and more complete crystals [32]. At the center, new drip water mixes more frequently with the existing solution on the surface of stalagmite. This mixture could maintain the DIC reservoir as non-depleted and facilitate complete oxygen isotope buffering between HCO3 and H2O [19,26]. At the edge, there is an extended period for dissolved CO2 to escape from the water but without enough new drip water supply. This prolonged CO2 degassing at the edge can lead to δ18OC values deviating from those expected under equilibrium with the original drip solution [19,26].

4.3. Implications for Speleothem-Based Paleoclimate Studies

The Hendy Test for equilibrium conditions may be flawed due to the possibility of isotopic equilibrium and kinetic fractionation occurring simultaneously in different parts of a stalagmite. Our cave monitoring results indicate that isotopic equilibrium fractionation may take place in the stalagmite growth axis simultaneously with kinetic fractionation occurring at the flanks. Furthermore, the varying thickness of growth layers and the typical stalagmite geometry make uniform sampling difficult, often leading to the inclusion of cross-laminae calcite in samples. Many studies have adapted to along-growth-axis positive correlations between δ13C and δ18O values instead of along the same growth layer. However, the correlation along the growth axis might also indicate the control of climatic change on both stalagmite δ13C and δ18O signals rather than the kinetic isotope effect [33].
An actively growing stalagmite XMG-1 from SH Cave [20] does not exhibit any apparent δ13C–δ18O covariation throughout the entire dataset (Figure 11a). However, there are shorter intervals within the dataset that do show significant positive covariations. We found the 20 consecutive samples (every interval of 0.05 mm for the depth of 0–1 mm) from the top of stalagmite XMG-1 displayed strong positive δ13C–δ18O covariations (Figure 11b). The corresponding age of 2010–2015 CE is determined by annual layer counting for 0–1 mm depth in stalagmite XMG-1. The outside climate and cave microclimate were relatively stable during this short growth period. The δ13C–δ18O slope of 1.73 for the recent growth layers of XMG-1 is close to the δ13C–δ18O slope of 2.17 we found in the glass plate calcite. This observed positive δ13C–δ18O covariation in stalagmite XMG-1 may be attributed to non-equilibrium isotope effects (DIC depletion and non-complete buffering with H2O), which we proposed to explain the isotopic variations on the SH glass plates. The XMG-1 record and the stalagmite S312 record [34] from the same cave displayed similar δ18O changes within overlapping growth periods, and the so-called “Replication Test” confirmed that kinetic fractionation is negligible over a longer time scale.
The recent investigation of two coeval stalagmites (TS9701 and TS9501) from the SH Cave [35] has revealed a similar phenomenon: on interannual to decadal scales, positive δ13C–δ18O covariations are attributed to kinetic isotope effects; on multidecadal to millennial time scales, climate and vegetation changes are control factors of stalagmite isotopic signals. In this study, we have identified that kinetic fractionation leads to δ13C–δ18O covariations on seasonal to interannual scales. However, this does not negate the effect of climate change on speleothem isotopic signals over longer time scales, particularly for speleothem records that passed Replication Test [35]. Therefore, the speleothem isotopic proxies could still be used to reconstruct paleoclimate conditions even if the Hendy Test was not passed, and the Replication Test provides a more reliable indication of the integrity of isotopic proxies in paleoclimate research.

5. Conclusions

We examined the spatial variations in δ18O and δ13C values of farmed calcite on glass plates, which are analogous to a single growth layer in Hendy Test. The main conclusions drawn are as follows:
(1)
The δ18O and δ13C correlations of farmed calcite from different cave sites are consistently strong, suggesting that kinetic fractionation effects are widely present in the MRC.
(2)
For the slower drip-rate site, the δ13C and δ18O covariations displayed a lower slope due to longer CO2 degassing. DIC depletion and H2O evaporation tend to cause shifts to higher δ18OC values.
(3)
Spatial distribution of farmed calcite isotopic values on glass plates indicates that isotopic equilibrium fractionation may take place in the stalagmite growth axis simultaneously with kinetic fractionation occurring at the flanks.
(4)
Covariations of speleothem δ13C and δ18O on short time scales may result from kinetic isotope effects, but this isotopic disequilibrium does not alter isotopic variations in response to climate change over longer time scales.
(5)
Hendy Test criteria have limitations as prerequisites to isotopic equilibrium. Instead, the Replication Test provides a more reliable indication of the integrity of isotopic proxies in paleoclimate research.
However, our findings are based on a smaller sample size than would be ideal, and different caves and drip sites might exhibit varying isotopic fractionation conditions. In future studies, we plan to deploy larger glass plates or extend the growth duration to ensure sufficient calcite deposition, thereby enabling a more comprehensive analysis of a greater number of drip sites within each cave.

Author Contributions

Conceptualization, L.T. and M.T.; methodology, L.T. and M.T.; software, L.T. and T.T.; validation, W.D., J.R. and Y.L.; formal analysis, L.T., T.T. and X.L.; investigation, L.T., T.T., J.R. and W.D.; resources, C.H., X.L. and M.T.; data curation, L.T., T.T., W.D. and M.T.; writing—original draft preparation, L.T. and T.T.; writing—review and editing, L.T. and M.T.; visualization, L.T., T.T. and W.D.; supervision, C.H., H.C. and M.T.; project administration, C.H., H.C. and M.T.; funding acquisition, L.T. and Y.L. All authors have read and agreed to the published version of the manuscript.

Funding

This research was funded by the National Natural Science Foundation of China (grant nos. 42106228 and 42371164).

Data Availability Statement

Data are contained within the article. Specific data on carbon and oxygen isotopes are also available by contacting corresponding author [email protected] (L.T.).

Conflicts of Interest

The authors declare no conflicts of interest.

References

  1. Henderson, G.M. Caving in to new chronologies. Science 2006, 313, 620–622. [Google Scholar] [CrossRef] [PubMed]
  2. Cheng, H.; Lawrence Edwards, R.; Shen, C.-C.; Polyak, V.J.; Asmerom, Y.; Woodhead, J.; Hellstrom, J.; Wang, Y.; Kong, X.; Spötl, C.; et al. Improvements in 230Th dating, 230Th and 234U half-life values, and U-Th isotopic measurements by multi-collector inductively coupled plasma mass spectrometry. Earth Planet. Sci. Lett. 2013, 371–372, 82–91. [Google Scholar] [CrossRef]
  3. Wang, Y.J.; Cheng, H.; Edwards, R.L.; An, Z.S.; Wu, J.Y.; Shen, C.-C.; Dorale, J.A. A high-resolution absolute-dated late Pleistocene monsoon record from Hulu Cave, China. Science 2001, 294, 2345–2348. [Google Scholar] [CrossRef] [PubMed]
  4. Wang, Y.; Cheng, H.; Edwards, R.L.; He, Y.; Kong, X.; An, Z.; Wu, J.; Kelly, M.J.; Dykoski, C.A.; Li, X. The Holocene Asian monsoon: Links to solar changes and North Atlantic climate. Science 2005, 308, 854–857. [Google Scholar] [CrossRef] [PubMed]
  5. Wang, Y.; Cheng, H.; Edwards, R.L.; Kong, X.; Shao, X.; Chen, S.; Wu, J.; Jiang, X.; Wang, X.; An, Z. Millennial- and orbital-scale changes in the East Asian monsoon over the past 224,000 years. Nature 2008, 451, 1090–1093. [Google Scholar] [CrossRef]
  6. Yuan, D.; Cheng, H.; Edwards, R.L.; Dykoski, C.A.; Kelly, M.J.; Zhang, M.; Qing, J.; Lin, Y.; Wang, Y.; Wu, J.; et al. Timing, duration, and transitions of the last interglacial Asian monsoon. Science 2004, 304, 575–578. [Google Scholar] [CrossRef] [PubMed]
  7. Zhang, P.; Cheng, H.; Edwards, R.L.; Chen, F.; Wang, Y.; Yang, X.; Liu, J.; Tan, M.; Wang, X.; Liu, J.; et al. A test of climate, sun, and culture relationships from an 1810-Year Chinese cave record. Science 2008, 322, 940–942. [Google Scholar] [CrossRef] [PubMed]
  8. Zhang, H.; Griffiths, M.L.; Chiang, J.C.H.; Kong, W.; Wu, S.; Atwood, A.; Huang, J.; Cheng, H.; Ning, Y.; Xie, S. East Asian hydroclimate modulated by the position of the Westerlies during Termination I. Science 2018, 362, 580–583. [Google Scholar] [CrossRef] [PubMed]
  9. Li, T.Y.; Shen, C.C.; Li, H.C.; Li, J.Y.; Chiang, H.W.; Song, S.R.; Yuan, D.X.; Lin, C.D.J.; Gao, P.; Zhou, L.; et al. Oxygen and carbon isotopic systematics of aragonite speleothems and water in Furong Cave, Chongqing, China. Geochim. Cosmochim. Acta 2011, 75, 4140–4156. [Google Scholar] [CrossRef]
  10. Luo, W.; Wang, S. Transmission of oxygen isotope signals of precipitation-soil water-drip water and its implications in Liangfeng Cave of Guizhou, China. Sci. Bull. 2008, 53, 3364–3370. [Google Scholar] [CrossRef]
  11. Duan, W.; Ruan, J.; Luo, W.; Li, T.; Tian, L.; Zeng, G.; Zhang, D.; Bai, Y.; Li, J.; Tao, T.; et al. The transfer of seasonal isotopic variability between precipitation and drip water at eight caves in the monsoon regions of China. Geochim. Cosmochim. Acta 2016, 183, 250–266. [Google Scholar] [CrossRef]
  12. Pu, J.; Wang, A.; Shen, L.; Yin, J.; Yuan, D.; Zhao, H. Factors Controlling the growth rate, carbon and oxygen isotope variation in modern calcite precipitation in a subtropical cave, Southwest China. J. Asian Earth Sci. 2016, 119, 167–178. [Google Scholar] [CrossRef]
  13. Sun, Z.; Yang, Y.; Zhao, J.; Tian, N.; Feng, X. Potential ENSO effects on the oxygen isotope composition of modern speleothems: Observations from Jiguan Cave, Central China. J. Hydrol. 2018, 566, 164–174. [Google Scholar] [CrossRef]
  14. Wang, Q.; Wang, Y.; Zhao, K.; Chen, S.; Liu, D.; Zhang, Z.; Huang, W.; Yang, S.; Liang, Y. The transfer of oxygen isotopic signals from precipitation to drip water and modern calcite on the seasonal time scale in Yongxing Cave, Central China. Environ. Earth Sci. 2018, 77, 474. [Google Scholar] [CrossRef]
  15. Hendy, C.H. The Isotopic Geochemistry of speleothems—I. The calculation of the effects of different modes of formation on the isotopic composition of speleothems and their applicability as palaeoclimatic indicators. Geochim. Cosmochim. Acta 1971, 35, 801–824. [Google Scholar] [CrossRef]
  16. Dorale, J.A.; Liu, Z. Limitations of Hendy Test criteria in judging the paleoclimatic suitability of speleothems and the need for replication. J. Cave Karst Stud. 2009, 71, 73–80. [Google Scholar]
  17. Spötl, C.; Mangini, A. Stalagmite from the Austrian Alps Reveals Dansgaard-Oeschger events during Isotope Stage 3: Implications for the absolute chronology of Greenland ice cores. Earth Planet. Sci. Lett. 2002, 203, 507–518. [Google Scholar] [CrossRef]
  18. Zhou, H.; Zhao, J.; Qing, W.; Feng, Y.; Tang, J. Speleothem-derived Asian summer monsoon variations in Central China, 54–46 Ka. J. Quat. Sci. 2011, 26, 781–790. [Google Scholar] [CrossRef]
  19. Day, C.C.; Henderson, G.M. Oxygen isotopes in calcite grown under cave-analogue conditions. Geochim. Cosmochim. Acta 2011, 75, 3956–3972. [Google Scholar] [CrossRef]
  20. Li, X.; Cheng, H.; Tan, L.; Ban, F.; Sinha, A.; Duan, W.; Li, H.; Zhang, H.; Ning, Y.; Kathayat, G.; et al. The East Asian summer monsoon variability over the last 145 years inferred from the Shihua Cave record, North China. Sci. Rep. 2017, 7, 7078. [Google Scholar] [CrossRef]
  21. Cai, B.; Zhu, J.; Ban, F.; Tan, M. Intra-annual variation of the calcite deposition rate of drip water in Shihua Cave, Beijing, China and its implications for palaeoclimatic reconstructions. Boreas 2011, 40, 525–535. [Google Scholar] [CrossRef]
  22. Ruan, J.; Hu, C. Seasonal variations and environmental controls on stalagmite calcite crystal growth in Heshang Cave, Central China. Chin. Sci. Bull. 2010, 55, 3929–3935. [Google Scholar] [CrossRef]
  23. Tian, L.; Zhou, H.; Duan, W. The evaporation effect on transmission of oxygen isotope signal of drip water in Baojinggong, Guangdong: Revealed by Cave Monitoring. Quat. Sci. 2013, 618, 618–620. (In Chinese) [Google Scholar]
  24. Chen, F.H.; Chen, J.H.; Holmes, J.; Boomer, I.; Austin, P.; Gates, J.B.; Wang, N.L.; Brooks, S.J.; Zhang, J.-W. Moisture changes over the last millennium in arid Central Asia: A review, synthesis and comparison with monsoon region. Quat. Sci. Rev. 2010, 29, 1055–1068. [Google Scholar] [CrossRef]
  25. Kim, S.T.; O’Neil, J.R. Equilibrium and nonequilibrium oxygen isotope effects in synthetic carbonates. Geochim. Cosmochim. Acta 1997, 61, 3461–3475. [Google Scholar] [CrossRef]
  26. Mickler, P.J.; Stern, L.A.; Banner, J.L. Large kinetic isotope effects in modern speleothems. Geol. Soc. Am. Bull. 2006, 118, 65–81. [Google Scholar] [CrossRef]
  27. Ban, F.; Pan, G.; Zhu, J.; Cai, B.; Tan, M. Temporal and spatial variations in the discharge and dissolved organic carbon of drip waters in Beijing Shihua Cave, China. Hydrol. Process. 2008, 22, 3749–3758. [Google Scholar] [CrossRef]
  28. Hu, C.; Henderson, G.; Huang, J.; Chen, Z.; Johnson, K. Report of a three-year monitoring programme at Heshang Cave, Central China. Int. J. Speleol. 2008, 37, 143–151. [Google Scholar] [CrossRef]
  29. Tong, X.; Zhou, H.; Huang, Y.; He, H.; Zhu, L. Spatio-temporal variation of air CO2 concentration in Baojinggong Cave, Guangdong, China. Trop. Geogr. 2013, 33, 439–443. (In Chinese) [Google Scholar]
  30. Mickler, P.J.; Banner, J.L.; Stern, L.; Asmerom, Y.; Edwards, R.L.; Ito, E. Stable isotope variations in modern tropical speleothems: Evaluating equilibrium vs. kinetic isotope effects. Geochim. Cosmochim. Acta 2004, 68, 4381–4393. [Google Scholar] [CrossRef]
  31. Tremaine, D.M.; Froelich, P.N.; Wang, Y. Speleothem calcite farmed in situ: Modern calibration of δ18O and δ13C paleoclimate proxies in a continuously-monitored natural cave system. Geochim. Cosmochim. Acta 2011, 75, 4929–4950. [Google Scholar] [CrossRef]
  32. Riechelmann, S.; Schröder-Ritzrau, A.; Wassenburg, J.A.; Schreuer, J.; Richter, D.K.; Riechelmann, D.F.C.; Terente, M.; Constantin, S.; Mangini, A.; Immenhauser, A. Physicochemical characteristics of drip waters: Influence on mineralogy and crystal morphology of recent cave carbonate precipitates. Geochim. Cosmochim. Acta 2014, 145, 13–29. [Google Scholar] [CrossRef]
  33. Genty, D.; Blamart, D.; Ghaleb, B.; Plagnes, V.; Causse, C.; Bakalowicz, M.; Zouari, K.; Chkir, N.; Hellstrom, J.; Wainer, K. Timing and dynamics of the last deglaciation from European and North African δ13C stalagmite profiles—Comparison with Chinese and South Hemisphere stalagmites. Quat. Sci. Rev. 2006, 25, 2118–2142. [Google Scholar] [CrossRef]
  34. Li, H.; Gu, D.; Ku, T.; Stott, L.D.; Chen, W. Applications of interannual-resolution stable isotope records of speleothem: Climatic changes in Beijing and Tianjin, China during the past 500 years—The δ18O record. Sci. China Ser. D Earth Sci. 1998, 41, 362–368. [Google Scholar] [CrossRef]
  35. Duan, W.; Cai, B.; Tao, T.; Yang, X.; Tan, M. Multi-timescale variations of δ18O–δ13C in stalagmites: Insights into isotopic disequilibrium and human activities. J. Geophys. Res. Atmos. 2023, 128, e2023JD039607. [Google Scholar] [CrossRef]
Figure 1. Locations of three monitoring caves in the monsoon region of China. Circles represent cave monitoring sites; arrows indicate the dominant wind directions of the westerlies, summer monsoon, and winter monsoon; the dotted lines indicate the northern edge of modern Asian summer monsoon [24].
Minerals 14 00747 g001
Figure 2. The sketch map illustrates drip water striking the glass plate atop a stalagmite’s summit. As the water flows along its surface, it progressively deposits a glistening layer of calcite crystals.
Minerals 14 00747 g002
Figure 3. Plan view of Shihua Cave, as adapted from [27]. The hollow star denotes the sampled drip site, and cave levels are numbered.
Minerals 14 00747 g003
Figure 4. Spatial distribution of δ13C and δ18O values of farmed calcite on glass plates SH-1 (a) and SH-2 (b) in Shihua Cave. Sampling points are marked with white circles, with larger circles indicating areas of thinner calcite deposition. The blue numbers denote δ13C values and the red numbers denote δ18O values for each sampling point.
Minerals 14 00747 g004
Figure 5. Plan view of Heshang Cave, as adapted from [28]. The hollow stars denote the sampled drip sites, which are closer to the cave entrance.
Minerals 14 00747 g005
Figure 6. Spatial distribution of δ13C and δ18O values of farmed calcite on glass plates HS-1 (a) and HS-2 (b) in Heshang Cave. Sampling points are marked with white circles, with larger circles indicating areas of thinner calcite deposition. The blue numbers denote δ13C values and the red numbers denote δ18O values for each sampling point.
Minerals 14 00747 g006
Figure 7. Plan view of Baojinggong Cave, as adapted from [29]. The hollow stars denote the sampled drip sites, and the gate is closed when there are no tourists.
Minerals 14 00747 g007
Figure 8. Spatial distribution of δ13C and δ18O values of farmed calcite on glass plates BJG-1 (a) and BJG-2 (b) in Baojinggong Cave. Sampling points are marked with white circles, with larger circles indicating areas of thinner calcite deposition. The blue numbers denote δ13C values and the red numbers denote δ18O values for each sampling point.
Minerals 14 00747 g008
Figure 9. (a) δ13C vs. δ18O values of the spatially sampled modern calcite for our three monitored caves; (b) effects of CO2 degassing, isotopic buffering of HCO3, and H2O evaporation during calcite precipitation on the δ13C and δ18O values of speleothem calcite. The theoretical slopes were adapted from [26].
Minerals 14 00747 g009
Figure 10. The grain size of carbonate crystals on glass plate SH-1. There are dense and small crystals at the center (a), while sparse and large crystals are at the edge (b).
Minerals 14 00747 g010
Figure 11. (a) δ13C vs. δ18O plot for an actively growing stalagmite XMG-1 from SH Cave; (b) δ13C vs. δ18O plot for 20 consecutive samples (every interval of 0.05 mm for the depth of 0–1 mm) from the top of stalagmite XMG-1.
Minerals 14 00747 g011
Table 1. Summary of basic characteristics of the three monitored caves [11]. The annual precipitation and mean surface air temperature were obtained from National Meteorological Information Center, China Meteorological Administration (http://data.cma.cn).
CaveLocationAltitude (m asl)Annual Precipitation (mm)Mean Surface Air T (°C)Thickness of Bedrock (m)Thickness of Soil (cm)ClimateVegetation
SH39.78° N, 115.93° E25153912.230–130100Temperate monsoon climateShrub and grass
HS30.45° N, 110.42° E294134316.530040Subtropical monsoon climateWoody perennial plant and shrub-grass
BJG24.12° N, 113.35° E610183621.2>17050Subtropical monsoon climateEvergreen broad-leaf forest
Table 2. Summary of basic characteristics of monitoring drip sites for the three monitoring caves, and comparative analysis of predicted oxygen isotope values in calcite under equilibrium fractionation conditions with measured values from glass plates. Field measurements for the three monitoring caves were previously reported in [11].
Glass PlateDate Placed Date CollectedDrip Rate (drip/min)RH (%)CO2 Conc. (ppm)Cave Air T (°C)Measured δ18OC Range (VPDB, ‰)Measured δ18OW (VSMOW, ‰)Predicted δ18OC (VPDB, ‰)
SH-18 February 20138 March 20130.3410086415.1(−8.51, −7.22)−8.71−8.30
SH-228 March 201214 June 20120.3888.2114216.4(−8.73, −6.69)−8.62−8.49
HS-130 May 201129 June 20114<8049519(−7.88, −7.03)−7.65−8.10
HS-230 November 201130 December 20113<8050517(−7.55, −6.34)−7.76−7.78
BJG-13 March 20122 June 20126.2588.498216.2(−5.51, −4.62)−6.08−5.98
BJG-23 March 20122 June 201252.2088.498216.2(−5.67, −5.03)−6.12−6.02
Disclaimer/Publisher’s Note: The statements, opinions and data contained in all publications are solely those of the individual author(s) and contributor(s) and not of MDPI and/or the editor(s). MDPI and/or the editor(s) disclaim responsibility for any injury to people or property resulting from any ideas, methods, instructions or products referred to in the content.