Article

Unearthing Egypt’s Golden Legacy: Geophysical Insights and New Opportunities in the Central Eastern Desert

by
Adel Kotb
1,*,
Gaber M. Gaber
1,
Hassan Alzahrani
2,
Abdurraouf Okok
3,
Mohammed H. Abd Elkhaliq
1 and
Alhussein Adham Basheer
1
1
Geology Department, Faculty of Science, Helwan University, Cairo 11795, Egypt
2
Department of Geology and Geophysics, College of Science, King Saud University, Riyadh 11451, Saudi Arabia
3
Earth Sciences and Engineering Department, Missouri University of Science and Technology, McNutt Hall, 1400 N. Bishop Ave, Rolla, MO 65401, USA
*
Author to whom correspondence should be addressed.
Minerals 2024, 14(8), 787; https://doi.org/10.3390/min14080787
Submission received: 17 June 2024 / Revised: 26 July 2024 / Accepted: 29 July 2024 / Published: 31 July 2024

Abstract

:
Gold mining in Egypt’s Central Eastern Desert (ECED) has a rich history dating back to the Old Kingdom period. In recent years, there has been renewed interest from international mining companies, and several potential areas for gold mining have been identified. Extensive studies have been conducted on the deposition and occurrence of gold in the region, identifying over 100 areas of deposition. Aeromagnetic and radioactive surveys have played a crucial role in locating gold occurrences in ECED by utilizing data from these techniques to identify potential gold deposits. This study utilized geophysical data, including total aeromagnetic intensity (TM) and radiometric data, to identify hydrothermal zones and locate potential areas of gold occurrence. The radiometric ternary map was used to refine the search for gold deposits. Magnetic data were analyzed using edge detection tools to determine the structural framework of the area, facilitating the identification of regions with a high potential for gold occurrence. By integrating these geophysical datasets, this study provided a comprehensive understanding of the geological features and potential for gold mineralization in the study area. The area is divided into four sections by three shear zones, with high magnetic anomalies observed in the southeastern part. The radiometric data revealed that gold occurrence is associated with hydrothermal alteration zones, identified using the K/Th ratio and radiometric ternary map. However, not all these zones contain gold, and the area’s structure and magnetic suitability must be considered when selecting suitable locations for gold extraction. The study area presents a promising opportunity for gold exploration, with the integration of edge detection and radiometric analysis being crucial in identifying suitable locations for exploration.

1. Introduction

The functioning of modern society and economic growth depend heavily on minerals. The growing global population and the increasing range of uses for which minerals are utilized, especially in connection with the introduction of new technologies, are driving up demand for minerals. Though they have been voiced, worries about future mineral shortages are typically baseless and stem from overly simplified reasoning [1,2,3]. The attributes of gold, concerning its market structure, supply chain dynamics, and durability as a store of value, carry noteworthy consequences for investors who evaluate the carbon footprint and possibilities for decarbonization of their holdings. To put it plainly, there is ample evidence to support the idea that including gold in a diversified investment portfolio may increase its resistance to potential climate change-related effects [2].
The rare metal mineralization in Egypt’s Central Eastern Desert (ECED) is probably attributed to the basic components of both parental peraluminous solubility and magma fluids emitted that caused metasomatism and/or structural control by structures with different trends, which played as channels of hydrothermal fluids that in turn led to hydrothermal change [4,5].
This work concerned the area situated between longitudes 25°00.00 E and 26°00.00 E and latitudes 33°00.00 N and 34°30.00 N (Figure 1), which was chosen because it is a region of significant geological interest for gold exploration. This area is characterized by its complex tectonic history and diverse geological formations, making it a prime candidate for mineral exploration.
The Eastern Desert of Egypt is a geologically rich and diverse region with a complex history recorded in its rocks. From the ancient Precambrian basement to the more recent sedimentary deposits, the stratigraphy of this area offers valuable insights into the geological processes that have shaped the Earth over millions of years [6]. The tectonic framework of the Eastern Desert of Egypt is a complex interplay of accretionary, collisional, and extensional processes that have shaped the region over billions of years [7]. From the Precambrian accretion of terranes to the Pan-African orogeny and the ongoing Red Sea rifting, each tectonic phase has left a distinct imprint on the geological landscape [8]. Understanding these processes is crucial for unravelling the geological history of the Eastern Desert, the broader Arabian–Nubian Shield, and the northeastern margin of the African Plate.
Gold mining in Egypt’s ECED boasts a history as rich as the precious metal itself, dating back to the Old Kingdom period (2686–2181 BCE). In the 1930s, French Egyptologist Georges Castel’s groundbreaking research uncovered the ancient mining techniques and archaeological remains that highlighted the region’s historical significance. This legacy was further explored in the 1990s when the Egyptian Geological Survey and Mining Authority (EGSMA) [9] launched an extensive study, pinpointing several promising areas for gold mining, including the Zaghra area. In the Egyptian Eastern Desert, gold deposits are commonly found at shallow depths, often within a few hundred meters from the surface. This shallow burial is largely due to the region’s tectonic and geological history, which includes significant uplift and erosion processes. As a result, mineralized zones are frequently exposed or lie close to the surface, making them accessible for mining. Since 2007, the Canadian mining company Centamin has been operating the Sukari mine, now one of Egypt’s largest gold mines, demonstrating the region’s ongoing potential.
Figure 2 illustrates the historical mining areas, showcasing gold extraction and exploration from pre-dynastic times through the Arab era, according to [10]. ECED is dotted with over 100 gold deposition sites within the Precambrian basement of the Nubian Shield. Recent studies have leveraged advanced geophysical techniques, such as aeromagnetic and radioactive surveys, to explore these deposits. Research by [11] confirmed gold occurrences using these methods, correlating findings with the area’s structural and geological characteristics.
Further investigations, such as [12] in the Abu Zawal area, identified gold mineralization linked to quartz veins and sulfide minerals through petrographic analysis [13,14] utilizing Landsat-8 imagery and spectral analysis, revealing that high iron oxide concentrations often indicate potential gold zones. The diverse array of techniques employed in gold exploration in the Eastern Desert including geochemical and mineralogical analyses, geophysical surveys, and satellite imagery underscores the region’s enduring allure and substantial promise for future mining endeavors.
Modern technological advancements have revolutionized gold and thermal exploration in Egypt [15,16,17,18]. Cutting-edge tools like aeromagnetic surveys and Landsat-8 imagery not only improve the accuracy of locating gold deposits and thermal reservoirs but also minimize environmental impact. This high-tech approach attracts global mining giants and investors, fostering economic growth, and creating job opportunities within the region.
With its rich historical context and the application of modern exploration techniques, ECED stands as a beacon of potential for future gold discoveries [19,20,21]. The integration of global expertise and local knowledge positions Egypt as a significant player in the global gold mining industry. The Eastern Desert of Egypt, a region extending from the Nile River to the Red Sea, is a geologically significant area characterized by complex tectonic activities and a diverse lithological composition. The study area is strategically situated within Egypt’s Central Eastern Desert (ECED), a region renowned for its complex geology and rich mineral resources. This location is characterized by a diverse array of geological formations, including Precambrian basement rocks, which host significant mineral deposits, particularly gold. The ECED is bordered by the Nile River to the west and the Red Sea to the east, forming a critical part of the Arabian–Nubian Shield. This geological setting is crucial for understanding the area’s mineralization processes, as it provides a unique window into the tectonic and magmatic activities that have shaped the region over millions of years. The study area’s proximity to these key geological features enhances the relevance and applicability of the research findings, offering valuable insights into the mineralization patterns and exploration potential of the ECED.
Recent technological advancements have significantly improved the exploration of this geologically rich region. Techniques such as aeromagnetic and radiometric surveys have provided detailed insights into the subsurface structures, aiding in the identification of potential gold deposits. These modern methods enhance exploration accuracy and reduce environmental impact, making the process more sustainable.
The ECED holds great promise for future gold discoveries. Its complex geology, combined with advanced exploration technologies, positions this region as a key area for investment and development in the global mining industry. As international interest grows, the economic benefits for local communities and the broader region are expected to expand, creating new opportunities and fostering economic development.
The region’s vast, untapped resources promise a lucrative future, drawing the attention of international stakeholders eager to invest in and benefit from this golden opportunity.

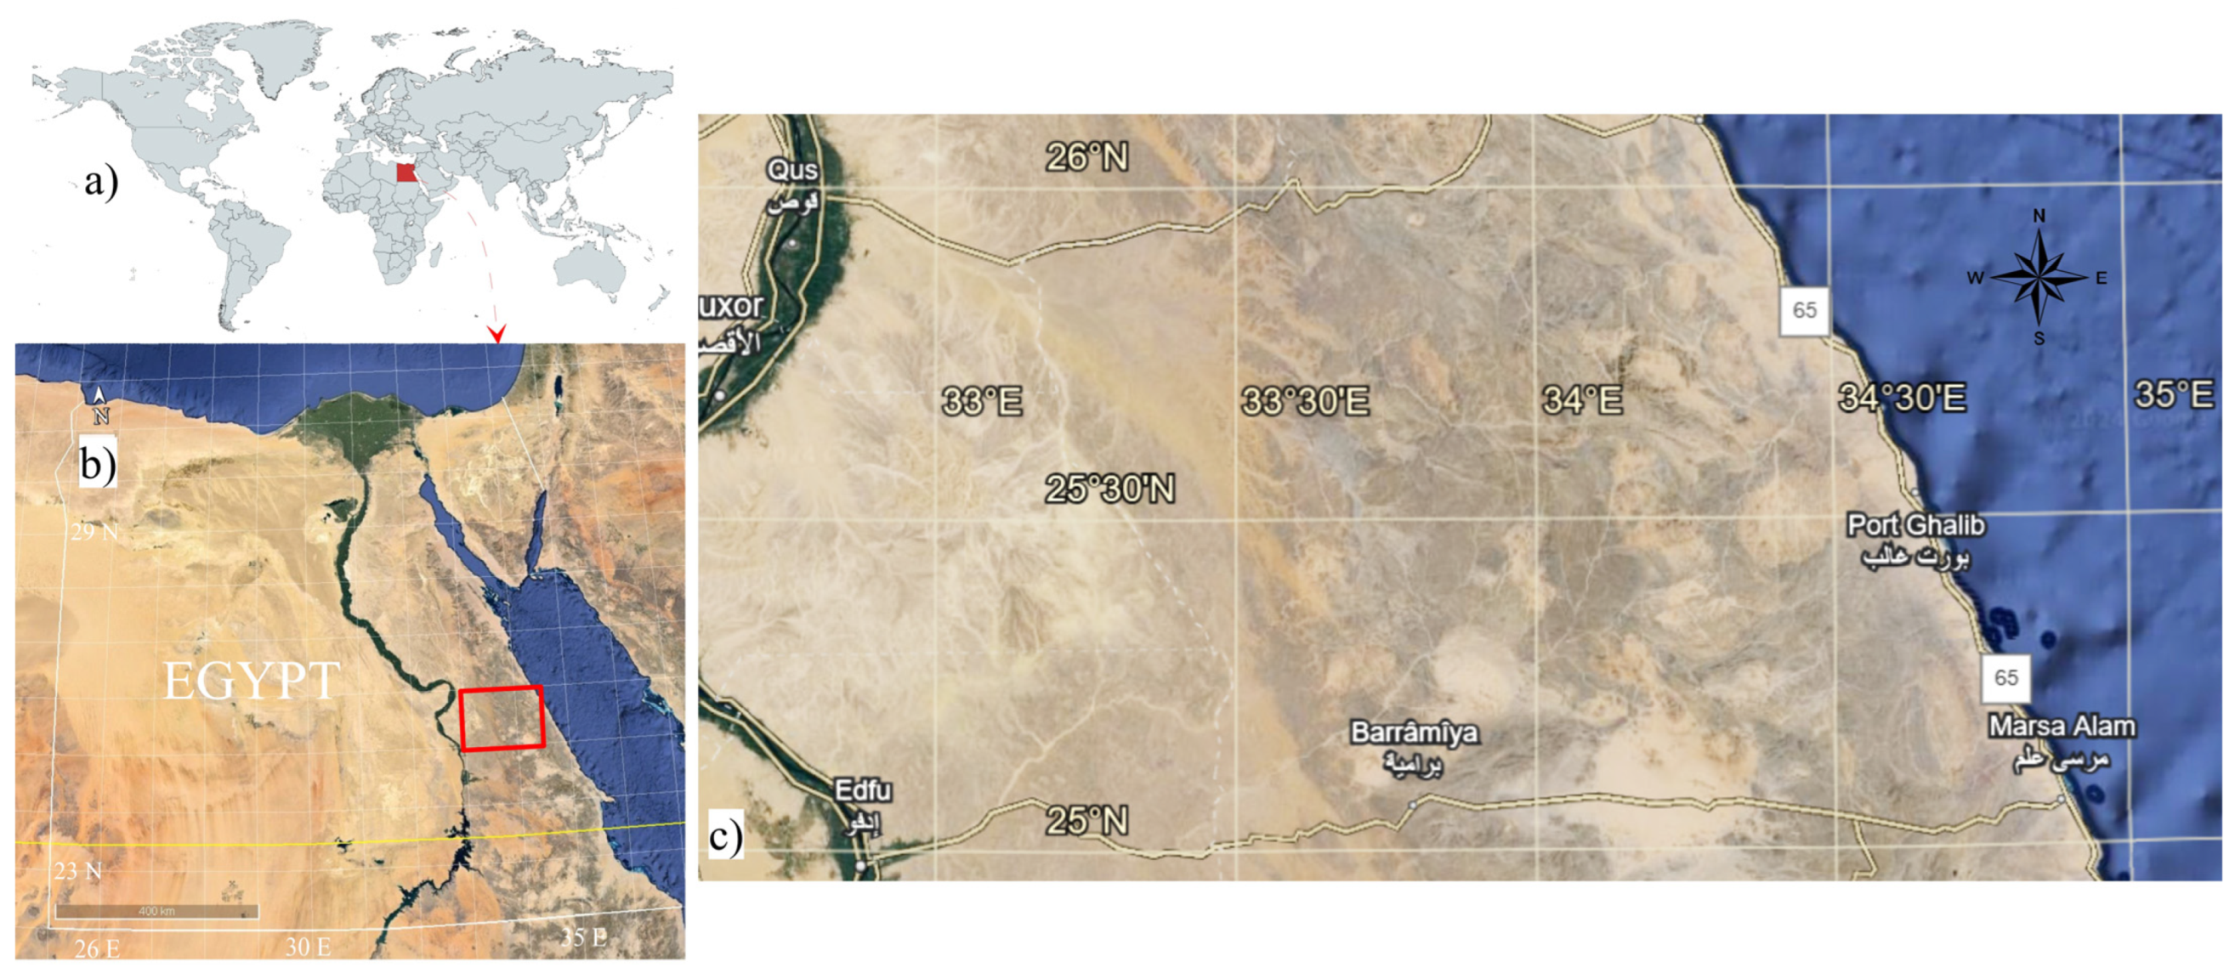
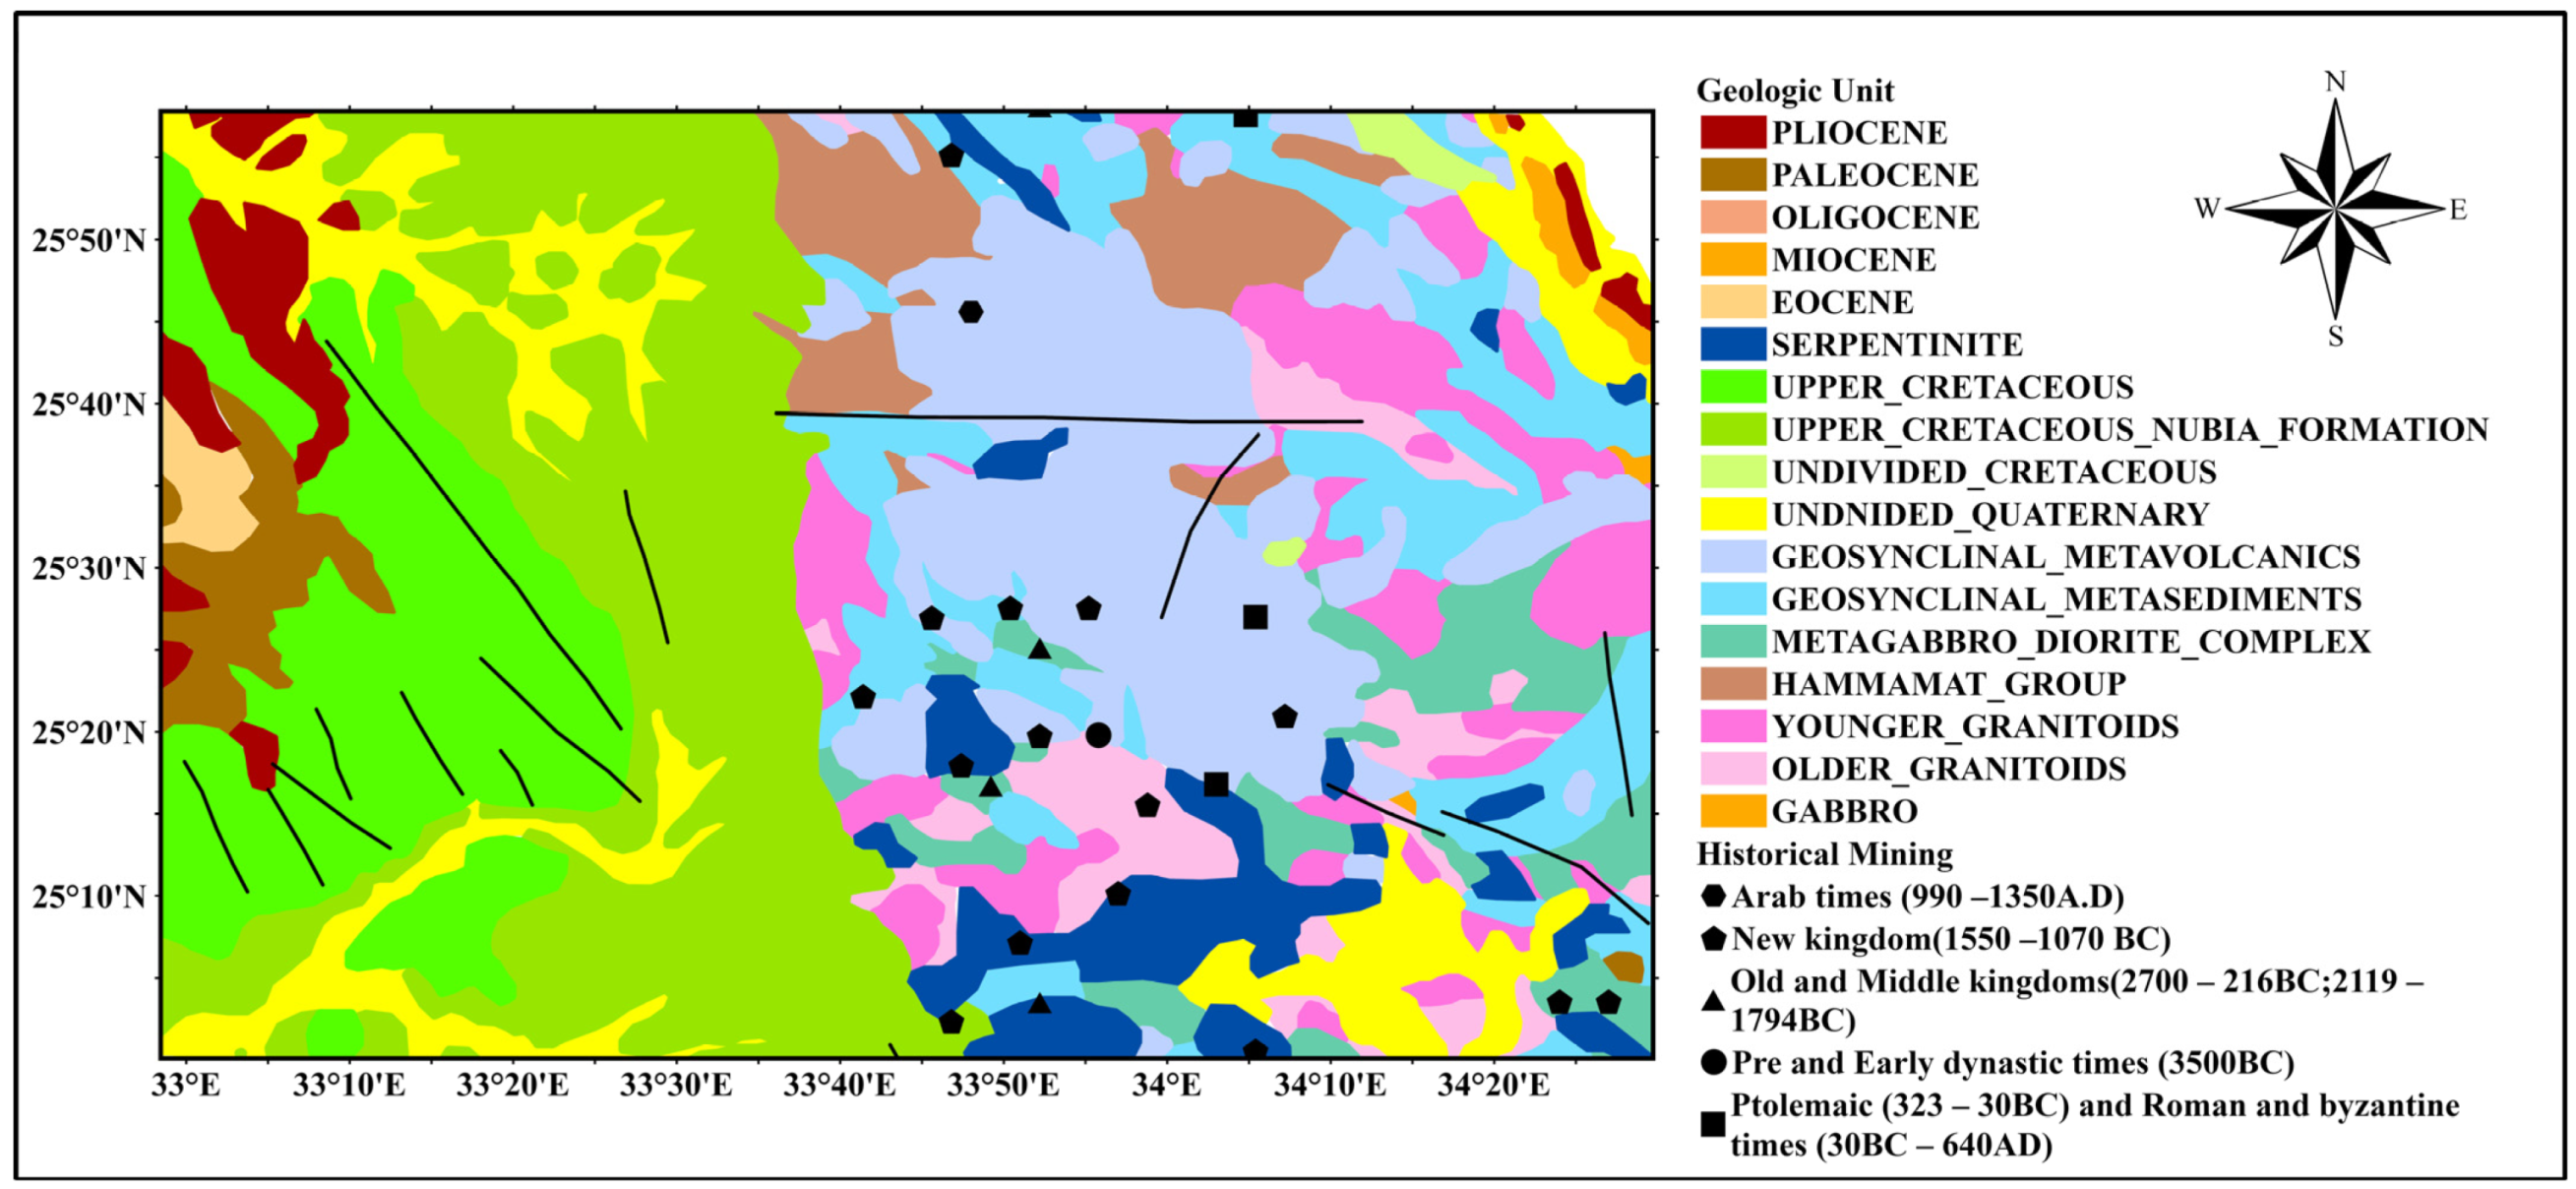
2. Geologic and Tectonic Settings

The formation of gold deposits in this region is closely linked to hydrothermal processes. Hydrothermal fluids, rich in dissolved minerals, circulate through fractures and faults in the Earth’s crust. These fluids deposit minerals, including gold, as they cool and react with surrounding rocks. In the Egyptian Eastern Desert, hydrothermal systems are often associated with granitic intrusions and volcanic activities, which provide the heat necessary to drive these systems. Gold in the region is typically found in quartz veins or as disseminated deposits within altered rocks. The presence of quartz veins is a common indicator of hydrothermal activity, as quartz is often a major component of hydrothermal mineral assemblages. The association with other minerals, such as sulfides (e.g., pyrite, chalcopyrite), further supports the hydrothermal origin of these deposits. The study area encompasses a diverse geological landscape with igneous, metamorphic, and sedimentary rocks ranging from the Precambrian to Quaternary ages [9,22,23,24] (Figure 2).
The region’s basement is a complex mosaic of geological formations, representing a variety of ages and rock types [25]. The Precambrian rocks include metasediments, metavolcanics, metagabbro, and serpentinites, forming part of the ‘ophiolitic mélange’ described by [25,26,27,28]. These ancient rocks are interspersed with calc-alkaline foliated quartz diorite, older granites, and younger granites, composed primarily of quartz and alkali-feldspar. In the Upper Cretaceous period, the area featured the Tariff and Qusier formations, characterized by sandstone and variegated shale [8,29].
Gold in ECED is predominantly associated with igneous rocks and is often found alongside copper and lead, although typically in small quantities relative to these other minerals. The primary source of gold is quartz veins, which traverse the various rock types in the region. The structural framework of the study area is marked by numerous folds, faults, and shear zones [30]. Notably, thrust faults trending in a northwest-southeast direction are prevalent, similar to those observed in the Gulf of Suez and the Gulf of Aqaba [31,32]. These structural features play a crucial role in the localization and concentration of gold deposits, influencing both the geology and the potential for future mining operations. The Egyptian Eastern Desert is part of the Arabian–Nubian Shield, a region characterized by ancient crystalline rocks that have been subjected to multiple tectonic and magmatic events. This shield is a significant geological province that extends across parts of northeastern Africa and the Arabian Peninsula. The geological history of the shield includes episodes of continental collision, rifting, and magmatism, which have all contributed to the region’s complex geology and rich mineralization.
Several gold-bearing districts in the Eastern Desert, such as the Sukari, Fawakhir, and Umm Rus gold deposits, are prime examples of hydrothermal mineralization. These deposits often exhibit a close spatial relationship with granitic and felsic volcanic rocks, indicating a genetic link to magmatic-hydrothermal processes.
Many studies highlight the complex interplay between tectonic activity, magmatism, and hydrothermal processes in the formation of gold deposits in the Egyptian Eastern Desert [33,34,35], emphasizing the shallow nature and hydrothermal origins of these valuable resources.
The geology of the Eastern Desert is complex and varied, featuring a range of rock types that span multiple geological eras. Key geological features include the following:
  • Precambrian Basement Complex: The Eastern Desert is primarily composed of Precambrian rocks, which are among the oldest on Earth, dating back over 600 million years. These rocks include gneisses, schists, and migmatites, which form the backbone of the region’s geological structure.
  • Ophiolites: These are fragments of ancient oceanic crust and upper mantle that have been thrust onto the continental crust. The Eastern Desert hosts some of the world’s best-preserved ophiolite sequences, which provide insights into the processes of plate tectonics and the formation of oceanic crust.
  • Granitoids: Large bodies of intrusive igneous rocks, such as granites and granodiorites, are prevalent. These granitoids intruded during various tectonic events and are crucial for understanding the tectono-thermal evolution of the region.
  • Sedimentary Cover: Overlying the Precambrian basement are sedimentary rocks ranging from the Paleozoic to the Cenozoic eras. These include sandstones, limestones, and shales, which provide evidence of ancient environments and the geological history of the area.
The geography of the Eastern Desert is characterized by the following:
  • Mountain Ranges: The Red Sea Hills dominate the landscape, with peaks often exceeding 2000 m. These mountains are dissected by numerous wadis (dry riverbeds) that channel occasional rainfall towards the Nile or the Red Sea.
  • Desert Plains: Interspersed between the mountain ranges are expansive desert plains and plateaus. These areas are typically barren, covered with gravel and occasional dunes.
  • Red Sea Coastline: The eastern boundary of the desert is marked by the Red Sea coastline, which features coral reefs, lagoons, and small islands. The coastal region is geologically active, with ongoing rifting and volcanic activity.
  • Wadis: These dry river valleys are essential geographical features, acting as natural routes through the mountains and providing the only sources of surface water during rare rain events.
The stratigraphy of the Eastern Desert is a detailed record of its geological history, captured in the layers of rocks that have formed over hundreds of millions of years. Key stratigraphic units include the following:
  • Precambrian Units: These are the oldest rocks, forming the basement complex. They include high-grade metamorphic rocks such as gneisses and schists, and igneous rocks like granites and diorites.
  • Paleozoic to Mesozoic Sedimentary Rocks: these overlie the Precambrian basement and include formations like the Cambrian sandstone, which is important for understanding the region’s sedimentary history and paleoenvironment.
  • Cenozoic Deposits: The youngest rocks in the Eastern Desert are the Cenozoic sedimentary deposits, including Tertiary limestones and Quaternary alluvial deposits. These provide insights into more recent geological processes and climatic conditions.
Figure 2 provides a visual representation of the region’s complex geology, highlighting the extensive Precambrian basement, the ophiolite sequences, granitoid intrusions, and the sedimentary cover. This map provides a comprehensive overview of the geological and historical mining features of the Eastern Desert, making it a valuable resource for understanding the region’s geological history and mineral wealth. The map uses different colors to represent various geologic units while the faults are represented with black lines. The map also indicates locations of historical mining activity, marked with different symbols corresponding to various historical periods such as Arab times (990–1350 A.D.), New Kingdom (1550–1070 B.C.), Old and Middle Kingdoms (2700–2160 B.C.; 2119–1794 B.C.), Pre and Early Dynastic times (3500 B.C.), Ptolemaic (323–30 B.C.), and Roman and Byzantine times (30 B.C.–640 A.D.) [6,7,8].
The study area, as illustrated in Figure 2, encompasses a diverse geological landscape that includes igneous, metamorphic, and sedimentary rocks spanning from the Precambrian to Quaternary ages. The Precambrian basement rocks, part of the Nubian Shield, are predominant and host significant gold deposits, particularly within the historical mining areas. These basement rocks are typically characterized by complex structural features resulting from prolonged tectonic activities. The igneous rocks, including granites and volcanic formations, reveal a history of magmatic intrusions and volcanic activity that played a crucial role in the mineralization processes. Metamorphic rocks, such as schists and gneisses, provide evidence of intense pressure and temperature conditions that have altered the original rock formations, further contributing to the area’s rich mineralogical diversity. Additionally, sedimentary rocks present in the area, although less abundant, offer insights into the depositional environments and the geological history of the region. Overall, the geological units depicted in Figure 2 highlight the intricate and varied geological framework of the study area, underscoring its significance for mineral exploration and geological research.
The Eastern Desert of Egypt is a part of the Arabian–Nubian Shield and plays a crucial role in understanding the tectonic evolution of the northeastern margin of the African Plate. The tectonic framework of the Eastern Desert is shaped by a series of geological events, including Precambrian accretion, Pan-African orogeny, and Red Sea rifting.
The Eastern Desert is characterized by several prominent tectonic structures, including the following: (a) Shear Zones: Major shear zones, such as the Najd Fault System, are widespread in the region. These zones are a product of the Pan-African orogeny and exhibit significant lateral displacement and deformation. (b) Ophiolite Complexes: Remnants of ancient oceanic crust, known as ophiolites, are present in the Eastern Desert. These complexes provide evidence for the tectonic processes associated with the accretion of terranes during the Proterozoic. (c) Granitoid Plutons: Large granitoid bodies which intruded during the Pan-African orogeny are common. These plutons are indicative of the magmatic activity associated with orogenic processes. (d) Normal Faults and Rift Basins: The ongoing Red Sea rifting has resulted in the formation of numerous normal faults and rift-related basins in the region. These structures are indicative of the extensional tectonics currently affecting the Eastern Desert.

3. Methodology

3.1. Reduction to the Pole (RTP)

Reduction to the Pole (RTP) is a crucial process in aeromagnetic data analysis used to simplify the interpretation of magnetic anomalies. The Earth’s magnetic field is typically not vertical except at the magnetic poles, which means that magnetic anomalies often appear shifted and distorted. RTP mathematically transforms the magnetic data as if the survey were conducted at the magnetic pole, where the magnetic field lines are vertical. This transformation centers the anomalies over their causative sources, making it easier to interpret their locations and geometries [36,37]. The RTP process requires accurate knowledge of the Earth’s magnetic field inclination and declination at the survey location. By aligning the anomalies directly above their sources, RTP enhances the clarity of magnetic maps and improves the accuracy of structural and lithological interpretations.

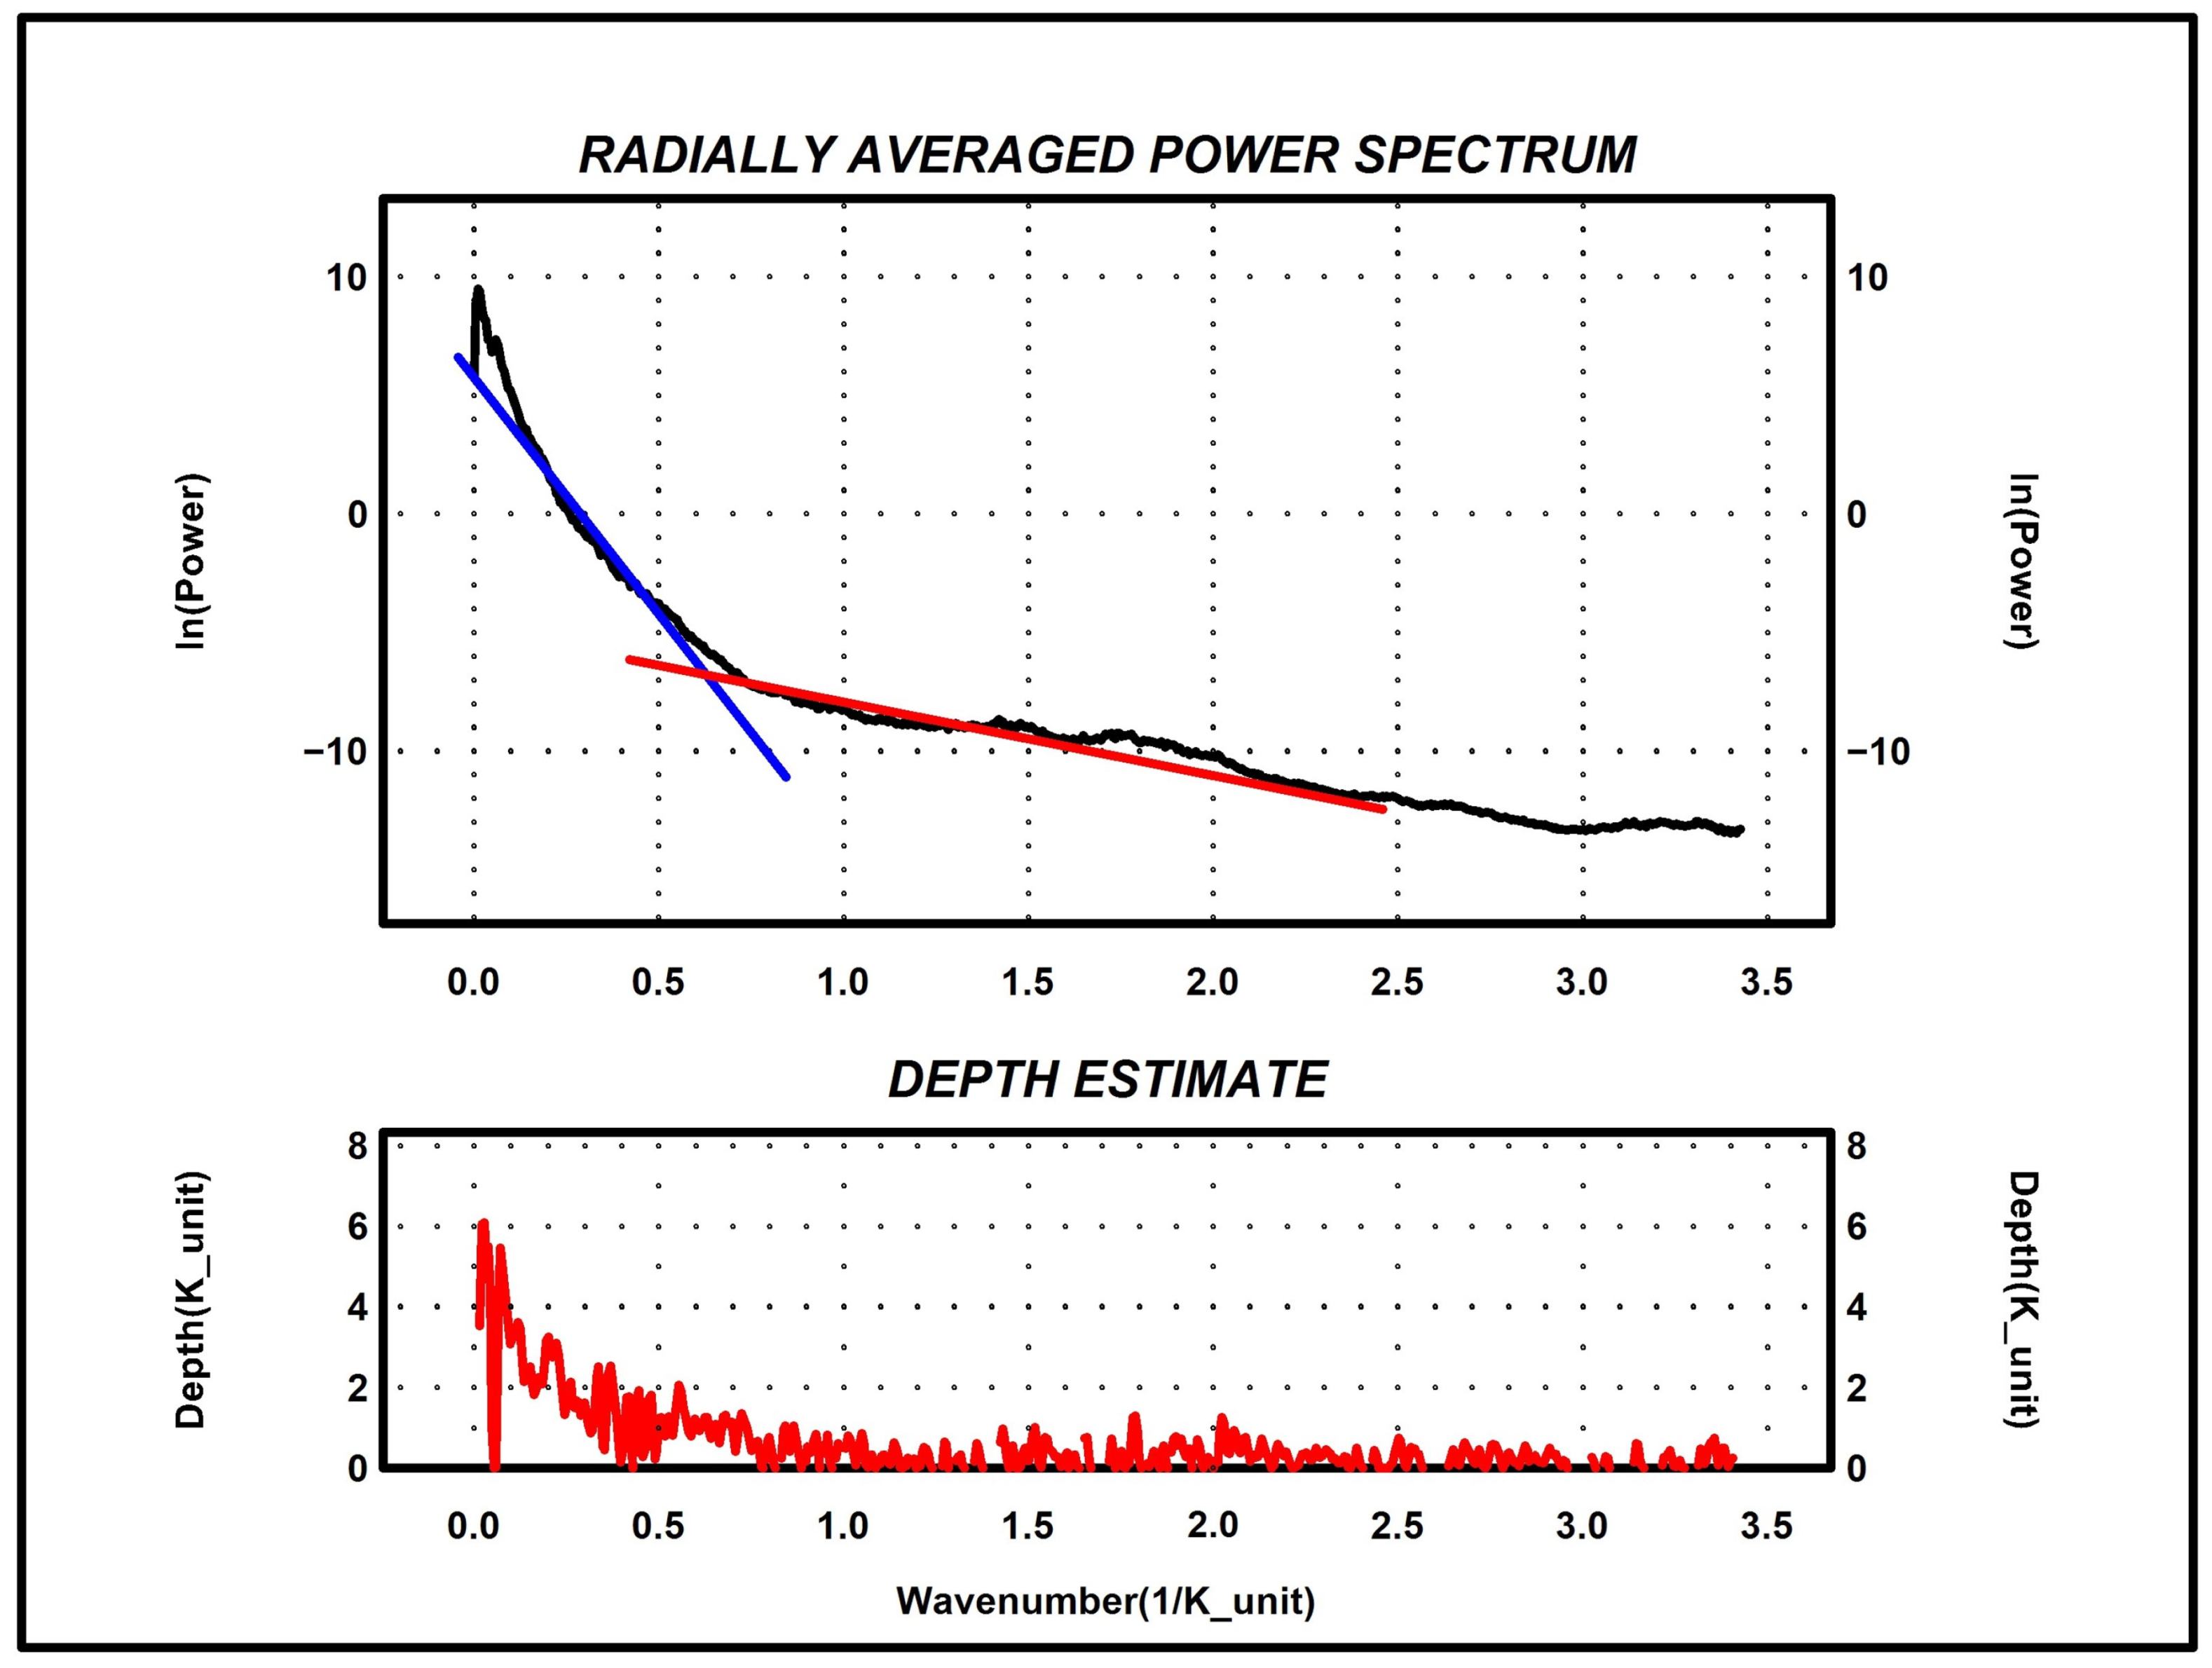
3.2. Radially Averaged Power Spectrum of RTP Data

The radially averaged power spectrum analysis of RTP data is a frequency-domain technique used to estimate the depth of magnetic sources. After applying the RTP transformation, the data are converted into the frequency-domain using Fourier Transform techniques [38]. The power spectrum, which represents the distribution of energy or variance across different spatial frequencies, is then radially averaged. This averaging process reduces noise and reveals dominant wavelength features corresponding to different depths. The slope of the power spectrum plot in a log-log scale can provide estimates of the depth to magnetic sources, as deeper sources tend to contribute to the low-frequency components, while shallower sources contribute to high-frequency components. This method is particularly useful in identifying the depth of the Curie isotherm and other significant geological boundaries.

3.3. Vertical Derivative

The Vertical Derivative method is another important tool in aeromagnetic data analysis used to enhance high-frequency anomalies and delineate shallow geological features [39,40]. By calculating the rate of change of the magnetic field in the vertical direction, this technique emphasizes shorter wavelength anomalies associated with near-surface sources. The first vertical derivative (1VD) can highlight subtle features that might be obscured in the total field data, while higher-order derivatives (e.g., 2VD) can further enhance shallow anomalies. This method is valuable in geological mapping, as it helps in identifying faults, dykes, and other linear features. However, it also amplifies noise, so the quality of the input data must be high for accurate interpretation.

3.4. Regional and Residual Maps

In aeromagnetic data analysis, separating regional and residual magnetic anomalies is crucial for focusing on the features of interest. The regional component represents the broad, long-wavelength anomalies associated with deep-seated geological structures or the regional magnetic field, while the residual component corresponds to short-wavelength anomalies caused by near-surface features such as mineral deposits or small-scale geological structures. This separation is typically achieved through filtering techniques, such as polynomial fitting or band-pass filtering. The regional map provides an overview of large-scale geological structures, while the residual map highlights detailed, localized anomalies. By analyzing both regional and residual maps, geophysicists can better understand the subsurface geology and target specific areas for exploration [41,42]. This two-tiered approach enhances the resolution and interpretation of aeromagnetic data, making it a vital step in the exploration of mineral resources and geological mapping.

3.5. Edge Detection Methods

The first step was to acquire and preprocess aeromagnetic data, ensuring it was free of noise and accurately georeferenced [43]. The second step was to apply the chosen edge detection methods. The third step was to analyze the resulting gradient maps to identify linear features, and correlate identified features with geological maps and other geophysical data to validate interpretations [44]. The fourth step was to combine results from multiple edge detection methods for a comprehensive structural interpretation. The fifth step was to integrate the results with topographic and other geophysical data for a detailed structural map [45]. Edge detection in aeromagnetic data is crucial for identifying the boundaries of geological structures, such as faults, dykes, and contacts between different rock types. The common edge detection methods are commonly used for edge detection in aeromagnetic data:
  • The Total Horizontal Gradient (THG) method calculates the horizontal gradient of the magnetic field. This is achieved by taking the gradient in both the x and y directions and combining them. This method is effective for highlighting linear features, such as faults and dykes, as high gradients indicate abrupt changes in magnetization. The following formula is used to calculate it:
T H G = M x 2 + M y 2
  • Tilt Derivative (TDR) is the arctangent of the ratio of the vertical derivative to the horizontal gradient of the magnetic field. This method normalizes the magnetic anomalies, making it easier to identify edges, especially in areas with variable magnetic intensity. The following formula is used to calculate it:
T D R = tan 1 M / z T H G
  • Analytical Signal (AS) is derived from the combination of the horizontal and vertical derivatives of the magnetic field. This method provides a clear representation of the location of the source edges and is independent of the magnetization direction, making it robust for edge detection. The following formula is used to calculate it:
A S = M x 2 + M y 2 + M z 2
  • The Vertical Derivative (VD) method amplifies short-wavelength features by calculating the rate of change of the magnetic field in the vertical direction. This is useful for enhancing the visibility of shallow structures and distinguishing between closely spaced features [46].
  • Gradient Amplitude (GA) is similar to the total horizontal gradient but includes the vertical component. This method is particularly effective in areas with complex geology, where both vertical and horizontal changes are significant [47,48,49,50].

3.6. K, Th, and eU Maps

In aero-radiometric surveys, gamma-ray spectrometry is used to map the concentration of naturally occurring radioactive elements, specifically potassium (K), thorium (Th), and equivalent uranium (eU). These elements emit gamma rays, which can be detected from the air to create detailed maps of their distribution on the Earth’s surface [51,52]. Potassium (K) concentration is often measured in percentage, while thorium (Th) and equivalent uranium (eU) are measured in parts per million (ppm). These maps are valuable for geological mapping and mineral exploration, as different rock types and alteration zones often have distinct radioactive signatures. For instance, felsic rocks typically show higher concentrations of K and Th, while mafic rocks exhibit lower values. Analyzing the spatial distribution of K, Th, and eU helps in identifying different lithological units, structural features, and alteration zones associated with mineralization processes.

3.7. Hydrothermal Alteration Zones Map from K/Th

The K/Th ratio map is a powerful tool for identifying hydrothermal alteration zones in geological formations. Hydrothermal processes can alter the mineralogical composition of rocks, often resulting in the redistribution of potassium and thorium. Since potassium is more mobile during these processes, an increased K/Th ratio can indicate areas of potassium enrichment, which are often associated with potassic alteration [53]. Conversely, a decrease in the K/Th ratio might suggest the leaching of potassium or enrichment of thorium. By mapping these variations, geologists can delineate zones of hydrothermal alteration, which are crucial in exploring certain types of mineral deposits, such as porphyry copper or epithermal gold systems. The K/Th ratio map thus serves as a guide for further exploration, directing attention to areas that may warrant more detailed ground investigation or drilling [54].

3.8. Radiometric Ternary Map

A radiometric ternary map is a composite image that simultaneously displays the concentrations of K, Th, and eU in a single visual representation, using different colors to indicate the relative abundance of each element. Typically, red is used for potassium (K), green for thorium (Th), and blue for equivalent uranium (eU). The intensity of each color corresponds to the concentration of the respective element, and the resulting combination provides a comprehensive overview of the radiometric properties of the surveyed area. This type of map is highly effective in distinguishing between different rock types and geological units based on their unique radioactive signatures [55,56,57]. It also helps in identifying subtle variations in radioelement concentrations that might not be as apparent in individual K, Th, or eU maps. The radiometric ternary map is particularly useful in complex geological settings, providing a clear and easily interpretable means of visualizing the spatial distribution of radioactive elements and aiding in the identification of potential mineralized zones and geological boundaries [58,59,60,61].

4. Geophysical Data Analysis

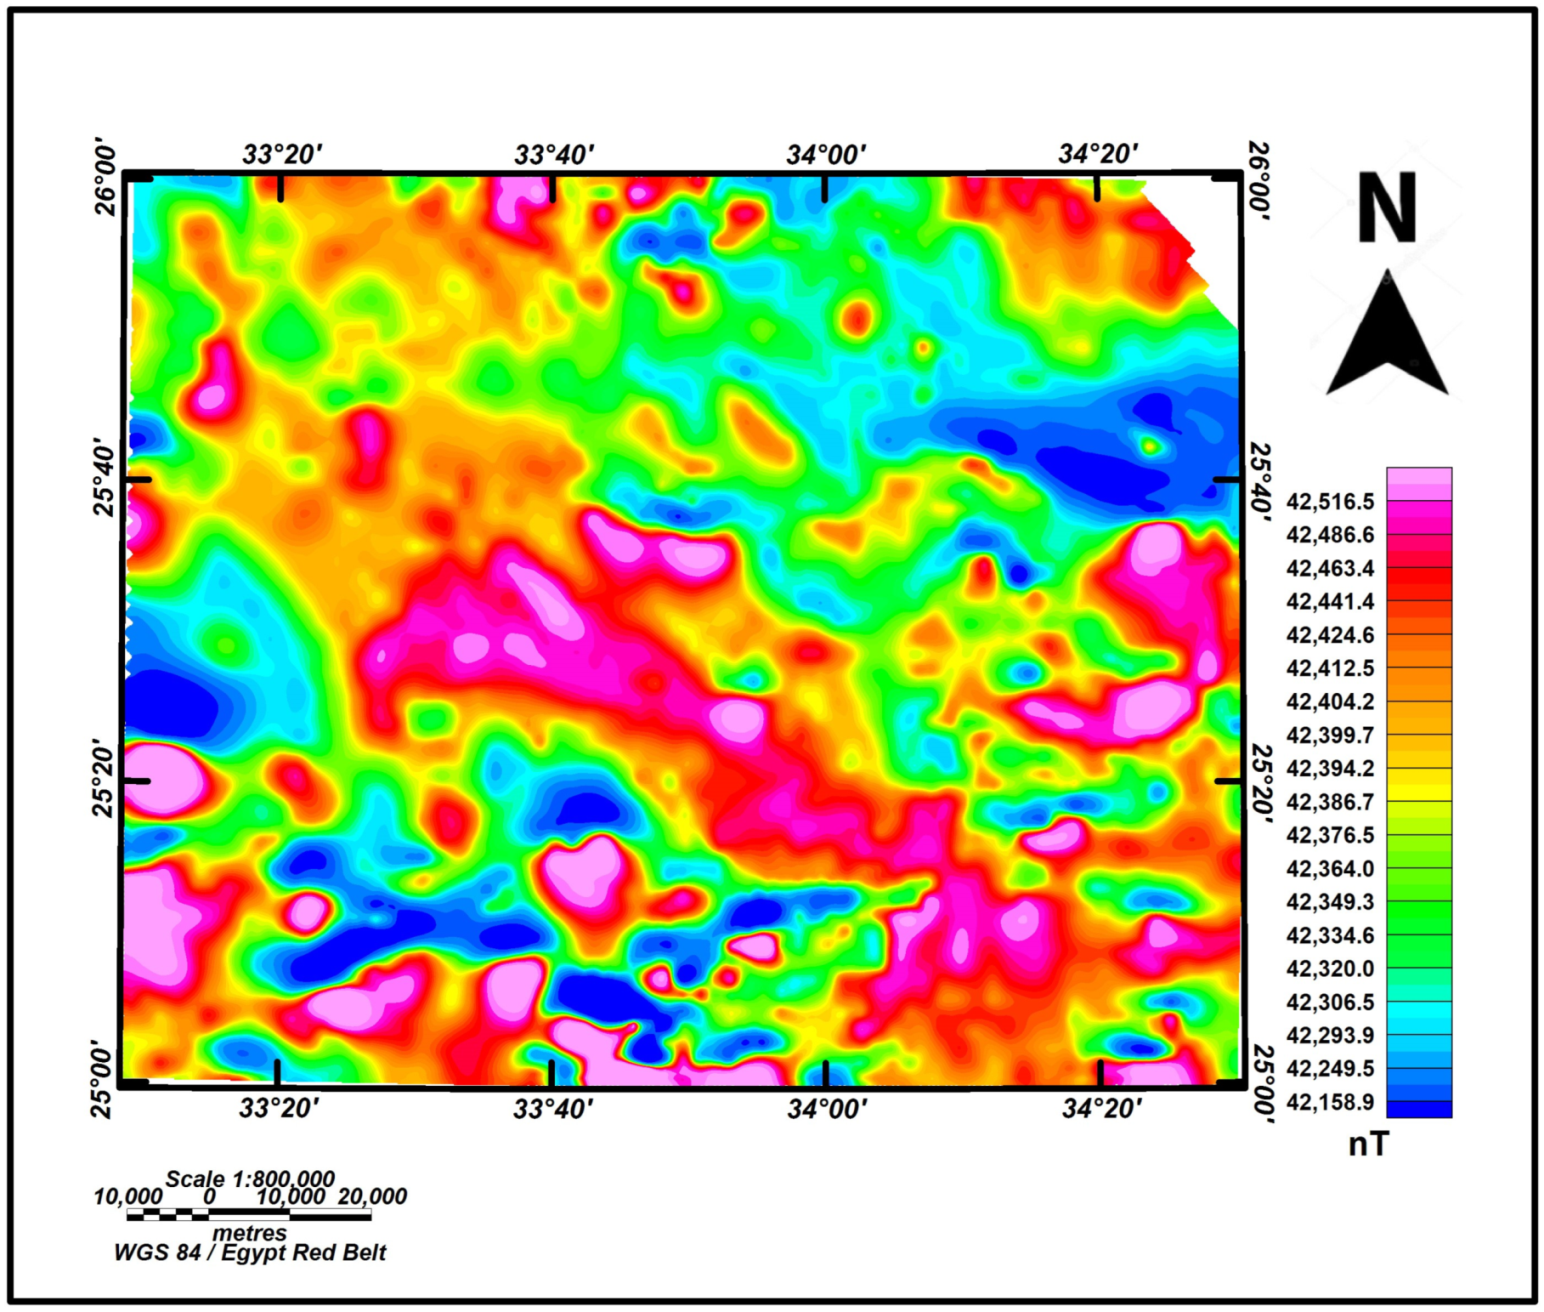
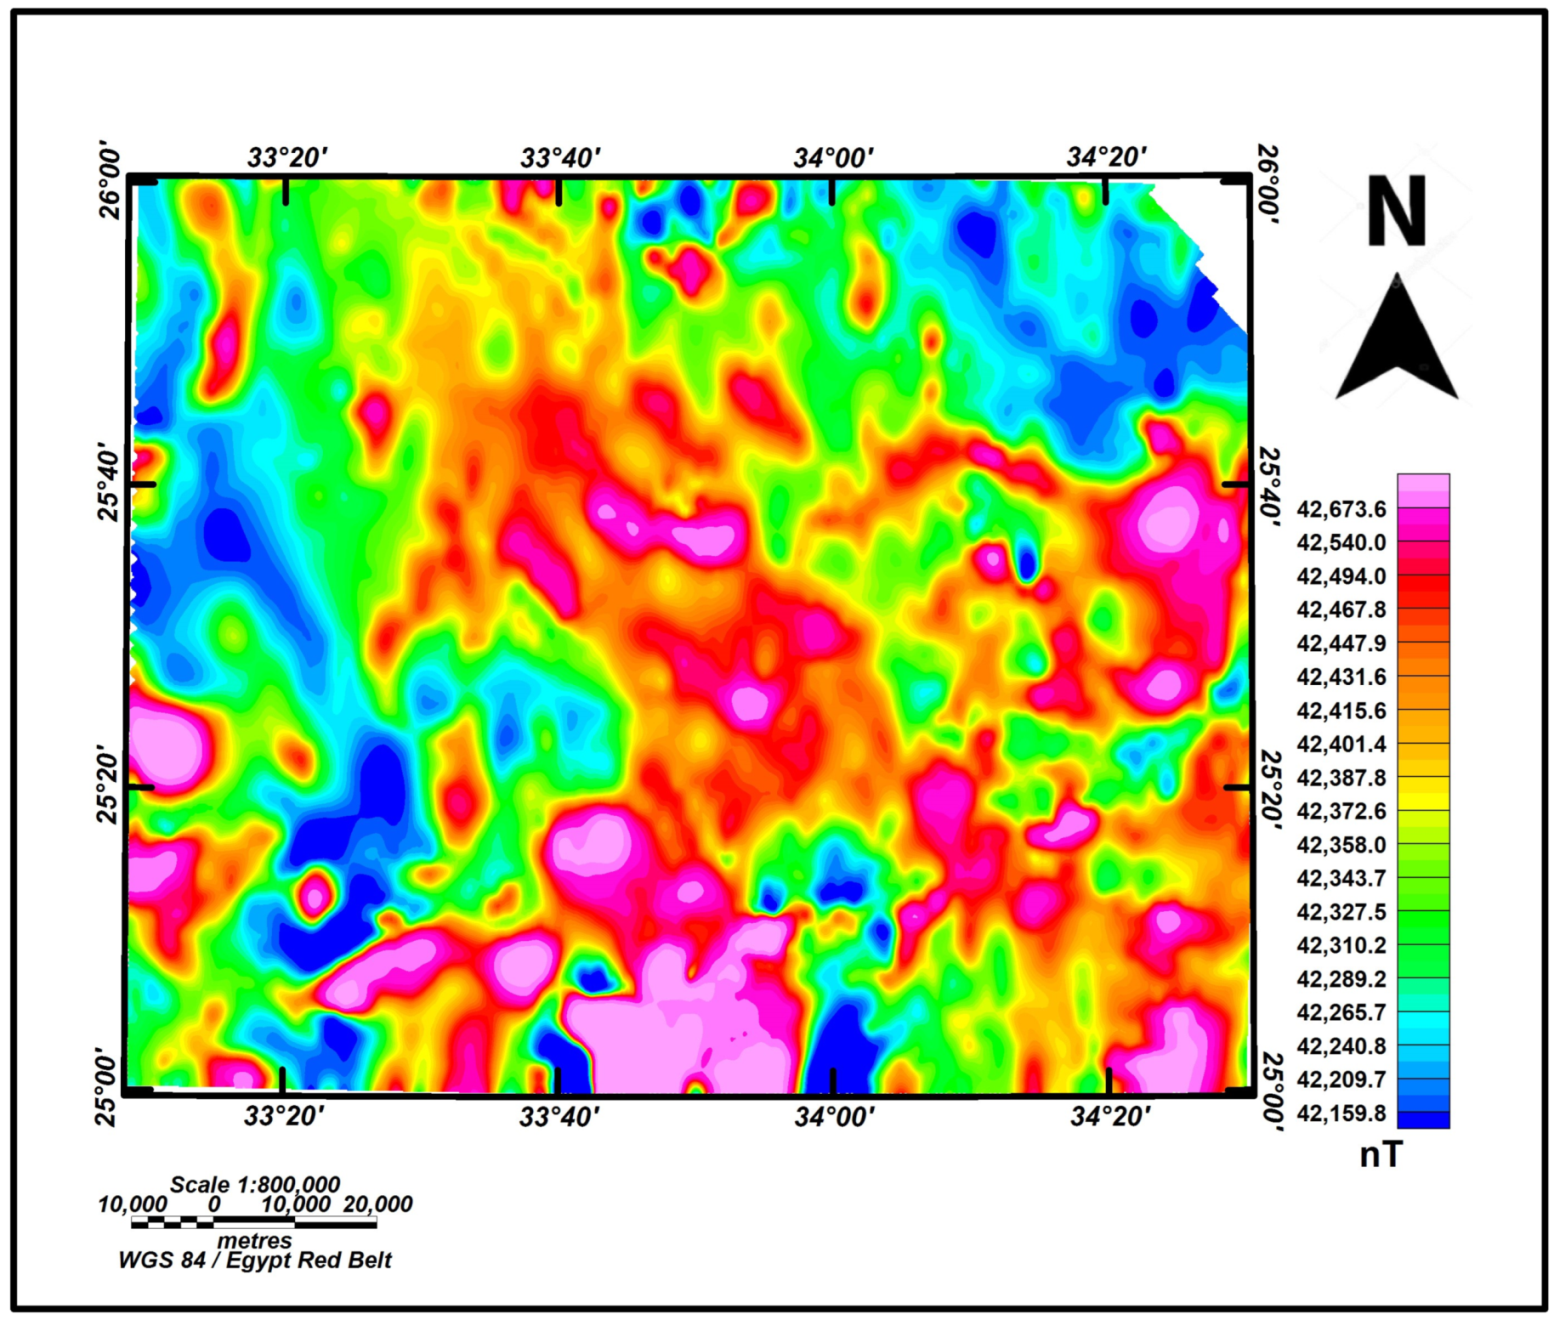
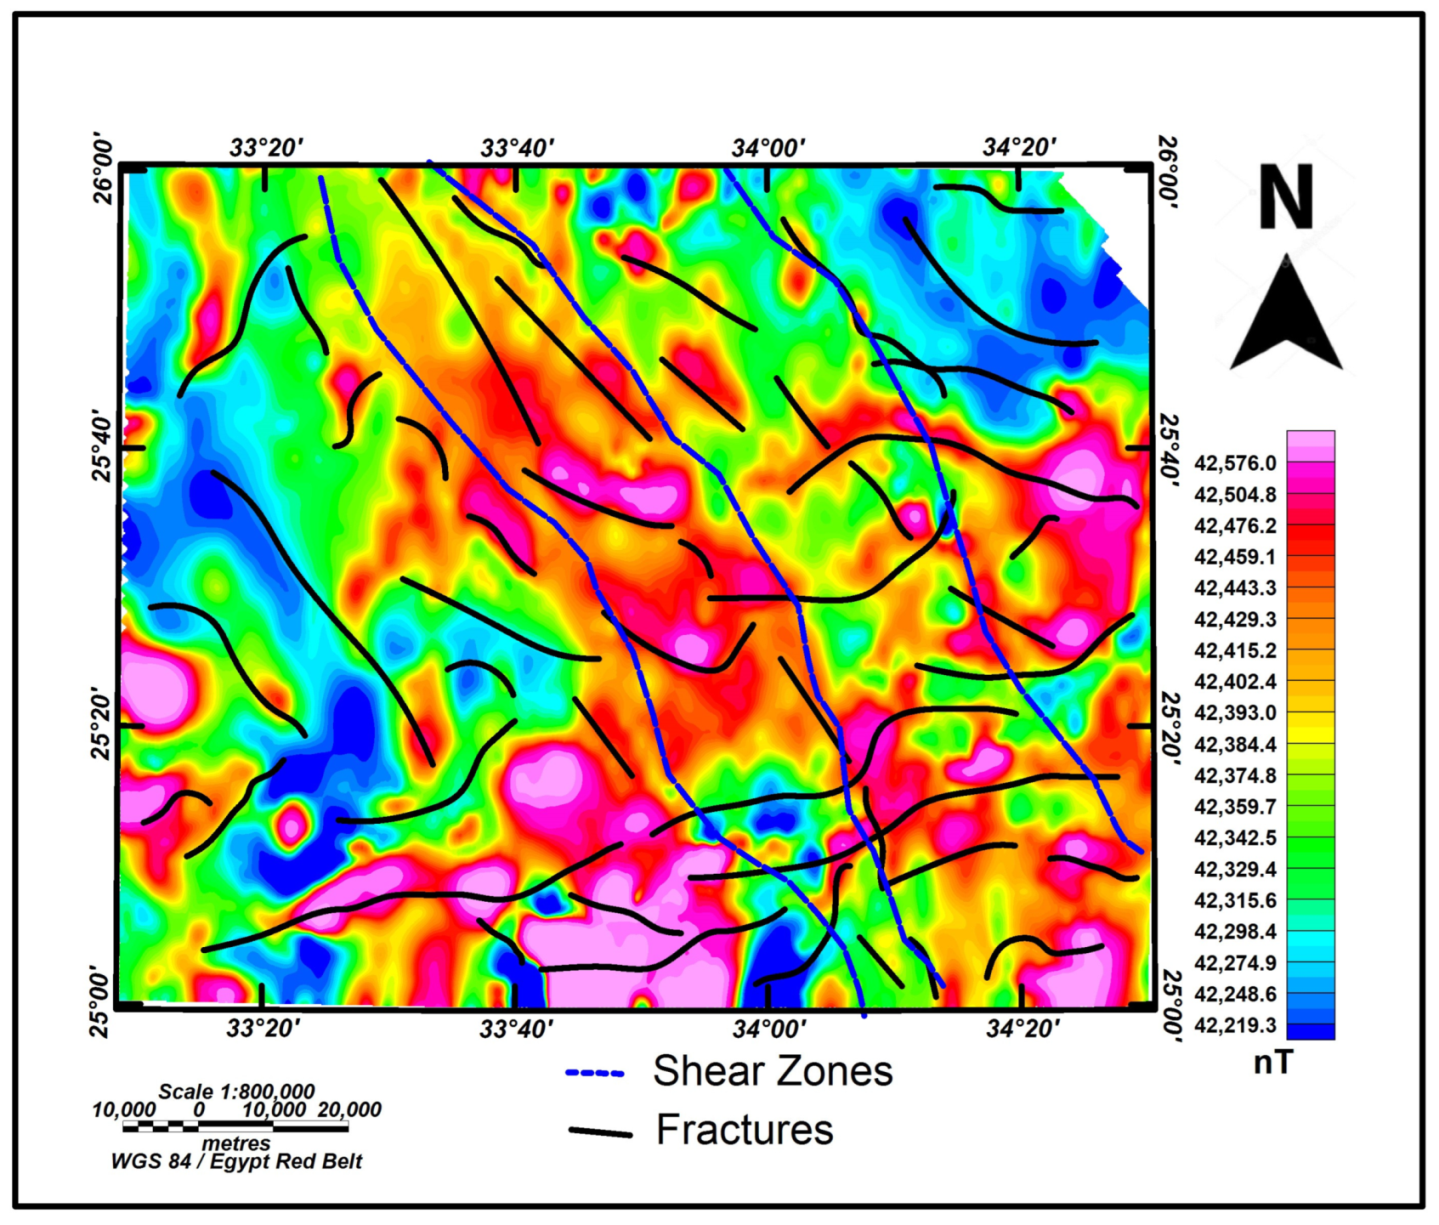
4.1. Aeromagnetic Data Analysis

The map in Figure 3 displays the total magnetic intensity across the study area, showing variations in the Earth’s magnetic field caused by subsurface geological structures. The anomalies in this map indicate the presence of different rock types and geological structures. High magnetic intensity areas could signify ferromagnetic minerals, while low-intensity areas might suggest sedimentary rocks or non-magnetic materials. Figure 3 identifies areas with high magnetic intensity, suggesting the presence of ferromagnetic minerals, which could be associated with gold-bearing rocks.
In Figure 4, a reduced-to-pole (RTP) aeromagnetic map of the examination area is illustrated; this map corrects magnetic data to appear as if measured at the magnetic pole. RTP processing simplifies the interpretation of magnetic data by centering anomalies over their causative bodies, making it easier to identify and analyze geological structures and mineral deposits. The map depicts magnetic values ranging from 42,159.8 nT to 42,673.6 nT. It shows the highest anomalies in the southern and southeastern parts, with smaller high anomalies in the eastern and central regions.
The radially averaged power spectrum of the RTP data is presented in Figure 5. The radially averaged power spectrum (RAPS) plays a pivotal role in the interpretation of geophysical data in our study area. By analyzing the RAPS of aeromagnetic survey data, we can identify and characterize the dominant wavelength components corresponding to various geological features. This method allows us to distinguish between shallow and deep-seated magnetic sources, providing insights into the depth and distribution of subsurface structures. In our study, the application of RAPS revealed significant anomalies that correlate with known gold-bearing formations, indicating potential areas for further exploration. The ability of RAPS to enhance the resolution of magnetic data makes it an invaluable tool in our geophysical analysis, facilitating a more accurate and detailed understanding of the geological framework of the ECED.
Figure 6 illustrates the structure map obtained from the vertical derivative map, offering a comprehensive depiction of the geological structures present in the study area, including faults and folds. Notably, lineaments play a crucial role in determining the location of mineral deposits. By facilitating the recognition of these significant structural features, the map assists in directing exploration activities towards areas with a greater likelihood of possessing valuable mineral resources. The use of the radially averaged power spectrum (RAPS) in conjunction with the reduced-to-pole (RTP) map has proven instrumental in identifying shear zones and structural lineaments within the study area. While these features are indeed depicted in the geological map (Figure 6), the identification and delineation were further refined and corroborated using the RTP map. This process highlights a clear distinction between the geological map data and the geophysical data inferred from the RTP map. Initially, the locations of shear zones and structural lineaments were collected from existing geological maps. These features were then validated and, in some cases, newly identified through the interpretation of the RTP map, which provided additional geophysical evidence supporting their presence and extent. This integrated approach ensures a more accurate and comprehensive understanding of the structural framework, enhancing the reliability of the geological interpretations.
The regional aeromagnetic map shows broad, deep-seated magnetic anomalies (Figure 7a). This helps in understanding the large-scale geological framework. The regional anomalies range from 42,219.3 nT to 42,576.0 nT, showing high anomalies in the south, east, west, and southeast. The residual aeromagnetic map highlights smaller, near-surface anomalies by removing the regional magnetic field (Figure 7b). The values of residual anomalies range from −150 nT to 144.8 nT, with high anomalies in almost all parts except the northeast. This map focuses on smaller, localized features, which are crucial for detailed mineral exploration. Both features are essential for identifying gold-bearing zones.
To create a structure map, linear features such as faults and dykes were identified in the interpreted maps of regional and residual aeromagnetic data. Concurrently, digital elevation models (DEMs) or topographic maps were utilized to aid in interpreting the surface expression of these features. The features’ locations of both linear anomalies and other structural features in the aeromagnetic data, along with the surface indications from the topographic data, were correlated to validate and refine the interpretations. These features were then integrated into a single structure map. Figure 8 illustrates the map overlays of shear zones and structural lineaments onto the RTP aeromagnetic map. The structure maps were derived through a systematic process involving the separation of regional and residual magnetic anomalies. This process began with the application of a filtering technique to the total magnetic intensity data, which decomposed the data into regional (long-wavelength) and residual (short-wavelength) components. The regional map highlights broad, deep-seated geological structures, while the residual map emphasizes shallower, more localized features. The regional map was generated by applying a low-pass filter to the total magnetic intensity data. This filter suppresses short-wavelength anomalies, thereby enhancing the visibility of larger, deeper geological structures, such as major fault zones and large shear zones. The residual map was obtained by applying a high-pass filter to the total magnetic intensity data. This filter removes the long-wavelength anomalies associated with deeper sources, thus isolating the short-wavelength anomalies that correspond to near-surface structures like smaller faults and lineaments.
By analyzing these filtered maps, the identification and delineation of various structural features were enabled. The regional map provided a broad overview of the major structural trends, while the residual map offered detailed insights into the finer, near-surface structures. The integration of these maps allowed for a comprehensive interpretation of the geological framework, ensuring that both deep-seated and shallow structures were accurately represented. The shear zones and lineaments are critical structural features that often control the emplacement of mineral deposits. Initial locations of shear zones and structural lineaments were collected from existing geological maps. These features were corroborated and, in some cases, newly identified through the interpretation of the RTP, regional, and residual maps, which provided additional geophysical evidence. The radially averaged power spectrum (RAPS) was used alongside the RTP map to enhance the resolution of magnetic data, facilitating precise identification. All these data were used to create a map (Figure 8) to aid in identifying such structures, and guide exploration efforts towards areas with higher mineral potential. It can be used to identify shear zones and structural lineaments, which are critical for localizing gold deposits. These structures often control the flow of mineralizing fluids. Figure 8 combines structural features with the RTP map, showing faults and folds that could control gold mineralization. The map illustrates the identification of shear zones (blue dashed line) and shallow structures (black lines), showing a predominant NW-SE trend and secondary NE-SW and E-W trends. Figure 6, which illustrates key geological features and structures, is critical for understanding the mineralization processes and the context of the anomalies presented in Figure 8. By directly referencing Figure 6 in the discussion of Figure 8, we can elucidate how these geological features influence the spatial distribution of the anomalies. For instance, the faults and fractures shown in Figure 6 are pivotal in controlling hydrothermal fluid flow, which directly impacts the localization of gold deposits, as indicated by the anomalies in Figure 8.

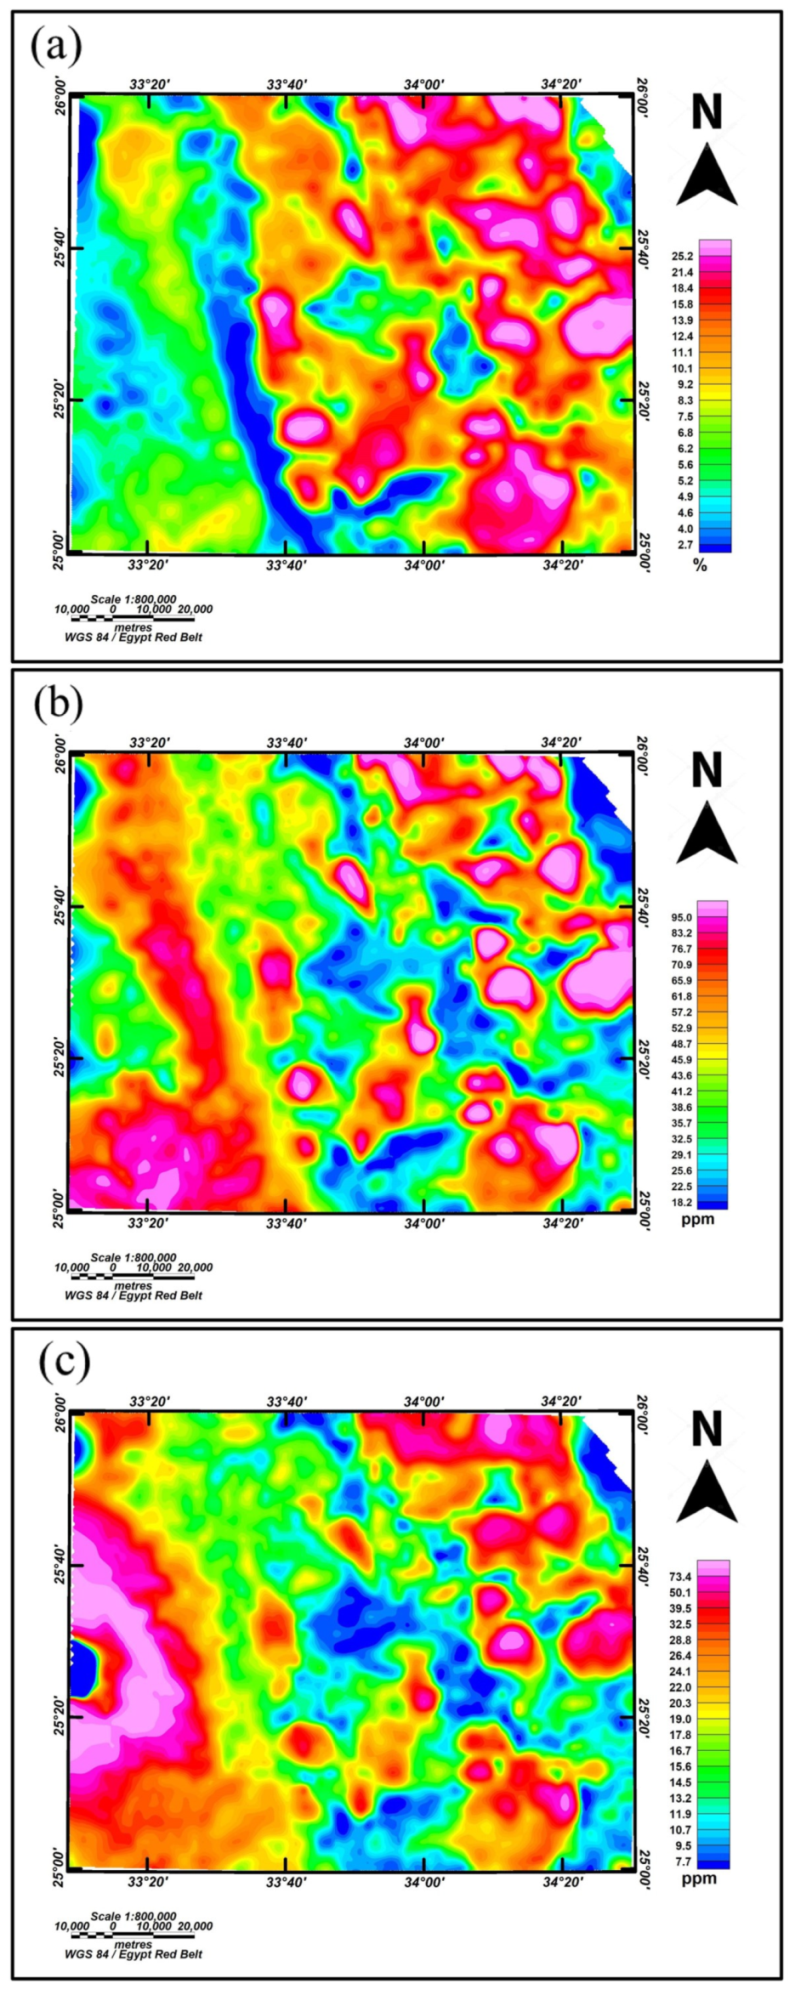
4.2. Radiometric (K, eTh and eU) Data Analysis

Figure 9 shows distributions of various altered radiometric minerals at different levels in the area under investigation. These maps illustrate the concentration of radiometric elements, which can help in identifying lithological variations and potential mineralization zones. High concentrations of potassium K, thorium Th, or equivalent uranium eU (Figure 9a, b, and c, respectively) can indicate the presence of specific mineral deposits or alteration zones associated with hydrothermal processes.
The K-feldspar percentage in rocks, indicating gold occurrence, is divided into three levels: highest (18%–27%) in metamorphic rocks and younger granite, medium (3%–18%) in metasediments, and lowest (1%–3%) in metavolcanic, metagabbro, ophiolitic serpentine, and talc carbonate rocks (31). Figure 9a shows the K occurrence, with anomalies ranging from 25.2% to 2.7%, high in the NE and some SE parts. The eTh percentage is also divided into three levels: highest (up to 95.1 ppm) in younger granite, medium in metasediments, and lowest in metavolcanic, meta gabbro, and ophiolitic serpentine. Figure 9b shows the Th distribution, with anomalies from 95.1 ppm to 18.2 ppm, high in the NE, SE, and SW parts. The eU percentage is similarly categorized: lowest in metavolcanic, meta gabbro, and ophiolitic serpentine, medium in metasediments, and highest in younger granite. Figure 9c shows the eU distribution, with anomalies from 73.5 ppm to 7.7 ppm, high in the NE and very high in the W part.
The three radioactive anomalies (K, eTh, eU) align in a NE-SE trend, focusing on the NE and SE parts. The study area reveals high potassium, thorium, and uranium concentrations, which can be related to alteration zones often associated with gold deposits.

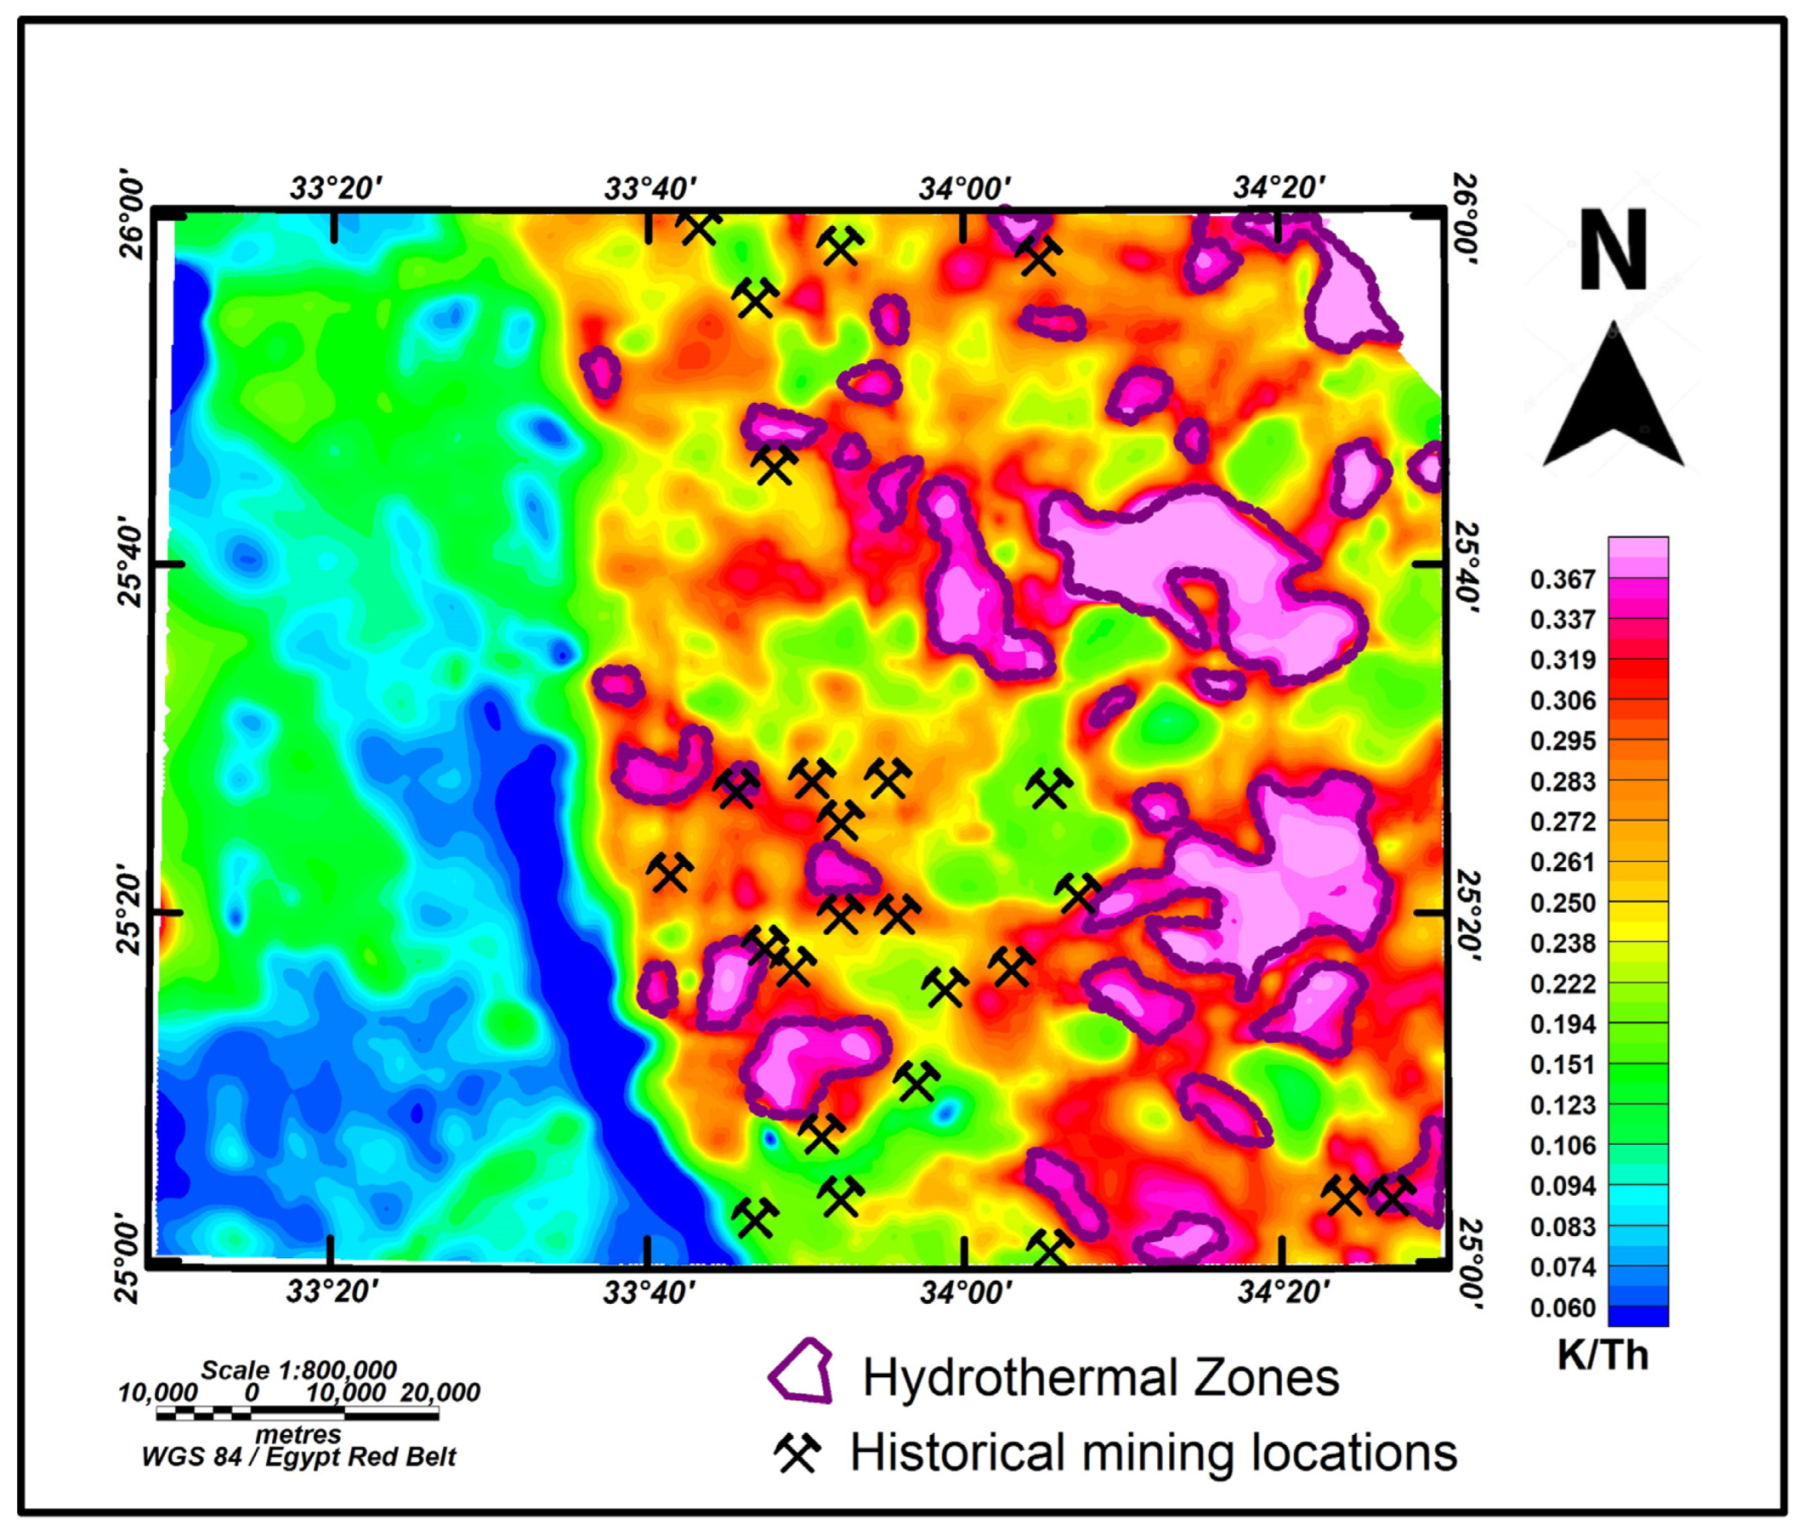
4.2.1. Hydrothermal Alteration Inferred from the K/eTh Ratio

A hydrothermal alteration zones map was created based on potassium-to-thorium ratios (K/Th) with historical mining locations (Figure 10). The map reveals the highest anomaly at 0.367 and the lowest at 0.060. High K/eTh ratio zones indicate high hydrothermal alteration zones, marked with pink color and surrounded by dark purple lines, suggesting rocks like younger granite and metavolcanic. The purple lines on the map delineate areas of significant hydrothermal activity. These zones are characterized by the presence of hot, mineral-rich fluids with elevated potassium concentrations. Such areas often correspond to geologically dynamic regions, particularly shear zones, where tectonic forces create pathways for fluid circulation and mineral deposition. The purple lines on the map delineate areas of significant hydrothermal activity. These zones are characterized by the presence of hot, mineral-rich fluids with elevated potassium concentrations. Such areas often correspond to geologically dynamic regions, particularly shear zones, where tectonic forces create pathways for fluid circulation and mineral deposition. Hydrothermal alteration zones are often associated with mineral deposits. This map help identify new exploration targets in areas with similar geological conditions by correlating these zones with historical mining sites. The hydrothermal alteration zones are key indicators of potential gold mineralization, while the overlay of historical mining locations provides validation and directs attention to similar unexplored areas [7,8,31].

4.2.2. The Radiometric Ternary Map

The radiometric ternary map (Figure 11) combines the three radiometric elements (K, Th, eU) with red, green, and blue representing uranium, thorium, and potassium, to provide a holistic view of the radiometric data, allowing for better discrimination of different rock types and alteration zones, essential for mineral exploration. The map uses colors to represent uranium, thorium, and potassium, distinguishing dark spots (low U, Th, K) from bright spots (high U, Th, K) and moderate spots leaning towards red (high K-feldspar content). Bright red spots correlate with younger granite, older granite, and metavolcanic rocks, which are primary gold sources, a correlation and comparison supported by the geological map (Figure 1).

5. Results and Discussion

The integration of various geophysical indicators and historical data in our study provides a robust framework for identifying potential gold locations in the study area. By analyzing these indicators, we can infer the presence of gold-associated minerals and alteration zones that are conducive to gold mineralization.
High magnetic intensity areas, as highlighted in Figure 3 and Figure 4, are particularly significant. These areas suggest the presence of magnetically anomalous minerals often associated with gold, such as magnetite and pyrrhotite. The correlation between magnetic anomalies and known mineral deposits supports the hypothesis that these high-intensity zones may contain gold-bearing minerals. The application of radially averaged power spectrum (RAPS) analysis further refines the interpretation of these magnetic data, allowing for the identification of both deep-seated and near-surface mineralization.
Hydrothermal alteration zones, depicted in Figure 10 with high potassium/thorium (K/Th) ratios, are also crucial indicators of potential gold deposits. These zones result from the chemical alteration of rocks by hydrothermal fluids, which can transport and deposit gold. The high K/Th ratios are indicative of potassic alteration, often associated with gold mineralization. This type of alteration alters the original mineralogy of the rocks, introducing minerals like sericite, which can be detected through radiometric surveys. The detailed analysis of these alteration patterns helps in delineating areas where hydrothermal processes have been active, thereby identifying zones with a higher potential for gold deposits.
Shear zones and structural lines, identified in Figure 6 and Figure 8, play a pivotal role in the formation of gold deposits. These structural features act as conduits for mineralizing fluids, concentrating gold along faults and fractures. The integration of structural data with magnetic and radiometric analyses provides a comprehensive view of the subsurface geology, revealing potential traps and pathways for gold-bearing fluids. The alignment of structural features with magnetic and radiometric anomalies strengthens the case for targeting these areas for further exploration.
This study also emphasizes the importance of radiometric concentrations, as seen in Figure 9 and the radiometric ternary map in Figure 10. High radiometric anomalies often correspond to areas of intense alteration, where the breakdown and reformation of minerals can lead to the concentration of gold. These anomalies are particularly useful in identifying zones of albitization and sericitization, which are key alteration processes associated with gold deposits. The detailed mapping of these anomalies allows for the precise targeting of exploration efforts.
Historical mining sites, depicted in Figure 9, provide a valuable context for this study. The presence of these sites indicates areas where gold has previously been extracted, suggesting that similar geological conditions may exist in unexplored areas nearby. The historical data validate the geophysical indicators, as many of the identified anomalies align with known mining locations. This alignment enhances the credibility of the geophysical data and justifies further exploration in these areas.
The Final Decision Map (Figure 12) synthesizes all these data layers—magnetic, radiometric, and structural—into a comprehensive exploration tool. This map highlights areas with the highest potential for gold discovery, guiding exploration efforts towards the most promising targets. The map’s integration of multiple geophysical datasets and historical data ensures that exploration activities are focused on areas with the greatest likelihood of success. It serves as a decision-making tool for mining companies, helping to prioritize areas for detailed exploration and potential drilling.
In conclusion, this study’s comprehensive approach—integrating magnetic, radiometric, structural, and historical data—provides a robust framework for identifying and prioritizing areas for gold exploration. This multi-faceted analysis increases the accuracy and reliability of identifying potential gold deposits, thereby enhancing the efficiency of exploration efforts and reducing the risk associated with exploration investments.

6. Conclusions

This study has revealed the rich potential of the area for gold exploration by utilizing advanced edge detection and radiometric techniques. Gold exploration in the Eastern Desert benefits from its complex geology. Gold is primarily found in quartz veins associated with igneous rocks, alongside copper and lead. The region’s structural features, including folds, faults, and shear zones, are crucial for localizing gold deposits. Recent advancements in exploration technologies, like aeromagnetic and radiometric surveys, have enhanced the identification of potential gold deposits, making exploration more accurate and sustainable.
The region is dissected into four distinct sections by three prominent shear zones, with significant magnetic anomalies in the southeastern part. Radiometric data highlight a strong correlation between gold occurrences and high values in hydrothermal alteration zones, identified through the K/Th ratio and radiometric ternary map. However, not all high-value zones contain gold, emphasizing the importance of considering the area’s structural features, such as shear zones and magnetic suitability of rocks, for precise gold extraction site identification. While some historically mined areas remain viable, limitations in current technology prompt the need to explore new sites, particularly in the central and eastern regions. Overall, the integration of edge detection and radiometric analysis has been pivotal, uncovering promising opportunities for future gold exploration and offering a compelling narrative for the advancement of mineral exploration globally.

Author Contributions

A.K.; Conceptualization, Methodology, Formal analysis, and investigation, Data Validation, Writing—review and editing. G.M.G.; Conceptualization, Methodology, Data curation, Writing the first draft. H.A.; Conceptualization and financial support. A.O.; English review and editing M.H.A.E.; Conceptualization, Methodology, Data curation, Writing first draft. A.A.B.; Conceptualization, Formal analysis and investigation, Data acquisition, Validation, Writing—original draft, Writing—review and editing. All authors have read and agreed to the published version of the manuscript.

Funding

This research was supported by the Researchers Supporting Project number (RSP2024R425), King Saud University, Riyadh, Saudi Arabia.

Data Availability Statement

The data supporting the findings of this research is accessible from the corresponding author upon reasonable request.

Acknowledgments

Special thanks to Nihal Adel ([email protected]), Associate Professor of English, Department of English Language, Faculty of Al-Alsun, Minya University, Egypt, for reviewing the linguistic, grammar, and scientific moral context of the current research.

Conflicts of Interest

The authors have no conflicts of interest to declare that are relevant to the content of this article. The authors have no relevant financial or non-financial interests to disclose.

References

  1. Jenkin, G.R.T.; Lusty, P.A.J.; McDonald, I.; Smith, M.P.; Boyce, A.J.; Wilkinson, J.J. Ore Deposits in an Evolving Earth. Geol. Soc. Lond. Spec. Publ. 2015, 393, 265–276. [Google Scholar] [CrossRef]
  2. Available online: https://www.gold.org/goldhub/esg/gold-and-climate-change-research (accessed on 26 July 2024).
  3. Idoine, N.E.; Raycraft, E.R.; Price, F.; Hobbs, S.F.; Deady, E.A.; Everett, P.; Shaw, R.A.; Evans, E.J.; Mills, A.J. World Mineral Production 2017–21; British Geological Survey: Nottingham, UK, 2023; 98p. [Google Scholar]
  4. Khedr, M.Z.; Abo Khashaba, S.M.; Takazawa, E.; Hassan, S.M.; Azer, M.K.; El-Shibiny, N.H.; Abdelrahman, K.; Ichiyama, Y. Genesis of Rare Metal Granites in the Nubian Shield: Tectonic Control and Magmatic and Metasomatic Processes. Minerals 2024, 14, 522. [Google Scholar] [CrossRef]
  5. El-Raouf, A.A.; Doğru, F.; Abdelrahman, K.; Fnais, M.S.; El Manharawy, A.; Amer, O. Using Airborne Geophysical and Geochemical Methods to Map Structures and Their Related Gold Mineralization. Minerals 2023, 13, 237. [Google Scholar] [CrossRef]
  6. Mansour, S.; Gharib, M.A.; Hasebe, N.; Abdelrahman, K.; Fnais, M.S.; Tamura, A. Tectonic evolution of the Gabal Loman area, North Eastern Desert, Egypt: Implications from low-temperature multithermochronometry on the Arabian-Nubian shield. Front. Earth Sci. 2023, 11, 1193692. [Google Scholar] [CrossRef]
  7. Mansour, S.; Hasebe, N.; Khedr, M.Z.; Tamura, A.; Shehata, A.A. Tectonic-Thermal Evolution of the Wadi El-Dahal Area, North Eastern Desert, Egypt: Constraints on the Suez Rift Development. Minerals 2023, 13, 1021. [Google Scholar] [CrossRef]
  8. El-Wardany, R.M.; Jiao, J.; Zoheir, B.; Kumral, M.; Kaya, M.; Abdelnasser, A. Post-Subduction Granite Magmatism and Gold-Sulfide Mineralization in the Abu Zawal (Fatira) Area, Eastern Desert, Egypt. Minerals 2023, 13, 489. [Google Scholar] [CrossRef]
  9. Geological Map of Sinai, A.R.E. Sheet No. 5, Scale 1:250,000; Egyptian Geological Survey and Mining Authority (EGSMA): Cairo, Egypt, 1994. [Google Scholar]
  10. Klemm, D.; Klemm, R.; Murr, A. Gold of the Pharaohs—6000 years of gold mining in Egypt and Nubia. J. Afr. Earth Sci. 2001, 33, 643–659. [Google Scholar] [CrossRef]
  11. Elkhateeb, S.; Abdellatif, M. Delineation potential gold mineralization zones in a part of Central Eastern Desert, Egypt using Airborne Magnetic and Radiometric data. NRIAG J. Astron. Geophys. 2018, 7, 361–376. [Google Scholar] [CrossRef]
  12. Redwan, M. Geochemical and mineralogical characteristics of some gold mine tailings in the Eastern Desert of Egypt. Front. Earth Sci. 2022, 16, 906–915. [Google Scholar] [CrossRef]
  13. Safwat, S.G.; Hassan, D.; Tharwat, A.A.; Mohamed, F.S.; Khalil, I.K.; Mohamed, A.S. Aeromagnetic and Landsat-8 data interpretation for structural and hydrothermal alteration mapping along the Central and Southern Eastern Desert boundary, Egypt. Egypt. J. Remote Sens. Space Sci. 2022, 25, 11–20. [Google Scholar] [CrossRef]
  14. El-Feky, M.G.; El-Tokhi, M.A.; El-Hadidy, M.A. Gold exploration in the Eastern Desert of Egypt using Landsat-8 data and spectral analysis techniques. Arab. J. Geosci. 2019, 12, 426. [Google Scholar]
  15. Abd El-Wahed, M.; Zoheir, B.; Pour, A.B.; Kamh, S. Shear-Related Gold Ores in the Wadi Hodein Shear Belt, Southeastern Desert of Egypt: Analysis of Remote Sensing, Field and Structural Data. Minerals 2021, 11, 474. [Google Scholar] [CrossRef]
  16. Gaber, G.M.; Saleh, S.; Kotb, A. Integrating radiometric and aeromagnetic data for assessment of geothermal potential: A case study in Central Eastern Desert, Egypt. Acta Geophys. 2024. [Google Scholar] [CrossRef]
  17. Gaber, G.M.; Saleh, S.; Kotb, A. 3D Gravity and magnetic inversion modelling for geothermal assessment and temperature modelling in the central eastern desert and Red Sea, Egypt. Sci. Rep. 2024, 14, 15266. [Google Scholar] [CrossRef] [PubMed]
  18. Gaber, G.M.; Saleh, S.; Kotb, A. Investigating geothermal resources in the Central Eastern Desert of Red Sea, Egypt, using aeromagnetic data. J. Earth Syst. Sci. 2024, 133, 137. [Google Scholar] [CrossRef]
  19. Shebl, A.; Abdellatif, M.; Elkhateeb, S.O.; Csámer, Á. Multisource Data Analysis for Gold Potentiality Mapping of Atalla Area and Its Environs, Central Eastern Desert, Egypt. Minerals 2021, 11, 641. [Google Scholar] [CrossRef]
  20. Basem, A.Z.; Peter, R.J.; Richard, J.G.; Dietrich, D.K. Orogenic gold in the Egyptian Eastern Desert: Widespread gold mineralization in the late stages of Neoproterozoic orogeny. Gondwana Res. 2019, 75, 184–217. [Google Scholar] [CrossRef]
  21. Abdelrady, M.; Elhadek, H.; Abdelmoneim, M.; Saleh, A. Orogenic lode-gold deposits and listvenization processes in the El-Barramiya area, Eastern Desert, Egypt. Environ. Earth Sci. 2023, 82, 420. [Google Scholar] [CrossRef]
  22. Abdel-Monem, A.A.; Abdel-Kader, Z.M.; Mansour, S.L.; Hassanein, S.M.M.; Mohamed, N.A.A. Petrography and geochemistry of the tectonic mélange rocks, El-Bakriya District, Central Eastern Desert, Egypt. In Proceedings of the 5th International Conference on Geochemistry Alexandria University, Alexandria, Egypt, 12–13 September 2001; pp. 251–277. [Google Scholar]
  23. Ahmed, N.A. Petrologic, Mineralogic and Geochemical Studies of the Basement Rocks and Associated Mineralizations of El-Bakriya Area, Central Eastern Desert, Egypt. Ph.D. Thesis, Cairo University, Giza, Egypt, 1999; p. 341. [Google Scholar]
  24. Shackleton, R.M.; Ries, A.C.; Graham, R.H.; Fitches, W.R. Late Precambrian ophiolitic mélange in the Eastern Desert of Egypt. Nature 1980, 285, 472–474. [Google Scholar] [CrossRef]
  25. El-Bialy, M.Z. Precambrian Basement Complex of Egypt. In The Geology of Egypt. Regional Geology Reviews; Hamimi, Z., El-Barkooky, A., Martínez Frías, J., Fritz, H., Abd El-Rahman, Y., Eds.; Springer: Cham, Switzerland, 2020. [Google Scholar] [CrossRef]
  26. Stern, R.J. The Najd Fault System, Saudi Arabia and Egypt: A Late Precambrian rift-related transform system. Tectonics 1985, 4, 497–511. [Google Scholar] [CrossRef]
  27. El-Gaby, S. Integrated evolution and rock classification of the Pan African belt in Egypt. In Proceedings of the First Symposium on the Classification of the Basement Complex of Egypt, Assiut, Egypt, 16–17 February 2005. [Google Scholar]
  28. El Gaby, S.; List, F.K.; Tehrani, R. Geology evolution and metallogenesis of the Pan-African belt in Egypt. In The Pan-African Belt of Northeast Africa and Adjacent Areas. Earth Evolution Sciences; El-Gaby, S., Greiling, R.O., Eds.; View-egerlag: Berlin, German, 1988; pp. 17–68. [Google Scholar]
  29. El-Amin, H. Radiometric and Geological Investigations of El-Bakriya Area, Eastern Desert, Egypt. Ph.D. Thesis, Faculty of Science, Cairo University, Cairo, Egypt, 1975. [Google Scholar]
  30. Said, A. Petrology and Structure of the Barramiya Area with Special Emphasis on the Gold Mineralization, Eastern Desert, Egypt. Master’s Thesis, Cairo University, Cairo, Egypt, 2006. [Google Scholar]
  31. Fowler, A.R.; Hamimi, Z. Structural and Tectonic Framework of Neoproterozoic Basement of Egypt: From Gneiss Domes to Transpression Belts. In The Geology of Egypt. Regional Geology Reviews; Hamimi, Z., El-Barkooky, A., Martínez Frías, J., Fritz, H., Abd El-Rahman, Y., Eds.; Springer: Cham, Switzerland, 2020. [Google Scholar] [CrossRef]
  32. Habib, M.E. Arc-ophiolites in the Pan-African basement between Meatiq and Abu Furad, Eastern Desert, Egypt. Bull. Fac. Sci. Assiut. Univ. 1987, 16, 241–283. [Google Scholar]
  33. Groves, D.I.; Bierlein, F.P. Geodynamic settings of mineral deposit systems. J. Geol. Soc. 2007, 164, 19–30. [Google Scholar] [CrossRef]
  34. Botros, N.S. Metallogeny of gold in relation to the evolution of the Nubian Shield in Egypt. Ore Geol. Rev. 2002, 19, 137–164. [Google Scholar] [CrossRef]
  35. Hussein, H.A.; El Sharkawy, M.A.; Khalil, K.I. Geology, geochemistry, and metallogenesis of the gold-bearing quartz veins and their host rocks at the Um Rus area, Central Eastern Desert, Egypt. J. Afr. Earth Sci. 1994, 19, 111–124. [Google Scholar]
  36. Baranov, V. A new method for interpretation of aeromagnetic maps: Pseudo-gravity anomalies. Geophysics 1957, 22, 359–383. [Google Scholar] [CrossRef]
  37. Blakely, R.J. Potential Theory in Gravity and Magnetic Applications; Cambridge University Press: Cambridge, UK, 1995. [Google Scholar]
  38. Spector, A.; Grant, F.S. Statistical models for interpreting aeromagnetic data. Geophysics 1970, 35, 293–302. [Google Scholar] [CrossRef]
  39. Hood, P.J. Gradient measurements in aeromagnetic surveying. Geophysics 1965, 30, 936–944. [Google Scholar] [CrossRef]
  40. Nabighian, M.N. The analytic signal of two-dimensional magnetic bodies with polygonal cross-section: Its properties and use for automated anomaly interpretation. Geophysics 1972, 37, 507–517. [Google Scholar] [CrossRef]
  41. O’Brien, D.P.; Crouch, S.E. Application of polynomial trend surface analysis to regional gravity and aeromagnetic data. Explor. Geophys. 1992, 23, 283–288. [Google Scholar]
  42. Gunn, P.J. Quantitative methods for interpreting aeromagnetic data: A subjective approach. Aust. Geol. Surv. Organ. Bull. 1997, 38, 39–43. [Google Scholar]
  43. Callaghan, P.T.; Stepišnik, J. Generalized analysis of motion using magnetic field gradients. In Advances in Magnetic and Optical Resonance; Academic Press: Cambridge, MA, USA, 1996; Volume 19, pp. 325–388. [Google Scholar]
  44. Ferreira, F.J.; de Souza, J.; de B. e S. Bongiolo, A.; de Castro, L.G. Enhancement of the total horizontal gradient of magnetic anomalies using the tilt angle. Geophysics 2013, 78, J33–J41. [Google Scholar] [CrossRef]
  45. Keating, P.; Pilkington, M. Euler deconvolution of the analytic signal and its application to magnetic interpretation. Geophys. Prospect. 2004, 52, 165–182. [Google Scholar] [CrossRef]
  46. Miller, H.G.; Singh, V. Potential field tilt—A new concept for location of potential field sources. J. Appl. Geophys. 1994, 32, 213–217. [Google Scholar] [CrossRef]
  47. Prasad, K.N.D.; Pham, L.T.; Singh, A.P.; Eldosouky, A.M.; Abdelrahman, K.; Fnais, M.S.; Gómez-Ortiz, D. A novel enhanced total gradient (ETG) for interpretation of magnetic data. Minerals 2022, 12, 1468. [Google Scholar] [CrossRef]
  48. Reid, A.B.; Allsop, J.M.; Granser, H.; Millett, A.T.; Somerton, I.W. Magnetic interpretation in three dimensions using Euler deconvolution. Geophysics 1990, 55, 80–91. [Google Scholar] [CrossRef]
  49. Roest, W.R.; Verhoef, J.; Pilkington, M. Magnetic interpretation using the 3-D analytic signal. Geophysics 1992, 57, 116–125. [Google Scholar] [CrossRef]
  50. Thurston, J.B.; Smith, R.S. Automatic conversion of magnetic data to depth, dip, and susceptibility contrast using the SPI™ method. Geophysics 1997, 62, 807–813. [Google Scholar] [CrossRef]
  51. Cinelli, G.; Tondeur, F.; Dehandschutter, B. Mapping potassium and thorium concentrations in Belgian soils. J. Environ. Radioact. 2018, 184, 127–139. [Google Scholar] [CrossRef]
  52. Cinelli, G.; Tondeur, F.; Dehandschutter, B.; Bossew, P.; Tollefsen, T.; De Cort, M. Mapping uranium concentration in soil: Belgian experience towards a European map. J. Environ. Radioact. 2017, 166, 220–234. [Google Scholar] [CrossRef]
  53. Bwamba, J.A.; Mallam, A.; Osagie, A.U. Characterization of hydrothermal alteration zones in parts of north-central basement complex of Nigeria for Solid Mineral Deposits. Earth Sci. Pak. 2024, 8, 72–79. [Google Scholar]
  54. Tawey, M.D.; Adetona, A.A.; Alhassan, U.D.; Rafiu, A.A.; Salako, K.A.; Udensi, E.E. Aeroradiometric data assessment of hydrothermal alteration zones in parts of North Central Nigeria. Asian J. Geol. Res. 2021, 4, 1–16. [Google Scholar]
  55. Aisabokhae, J.; Osazuwa, I. Radiometric mapping and spectral based classification of rocks using remote sensing data analysis: The Precambrian basement complex, NW Nigeria. Remote Sens. Appl. Soc. Environ. 2021, 21, 100447. [Google Scholar] [CrossRef]
  56. Minty, B.; Wilford, J. Enhancing the Radiometric Map of Australia. ASEG Ext. Abstr. 2010, 2010, 1–4. [Google Scholar] [CrossRef]
  57. Minty, B.; Richardson, M.; Wilford, J. New radiometric map of Australia. Aus-Geo News 2008, 92, 1–3. [Google Scholar]
  58. Taylor, D.; Walker, P. Geological mapping using integrated ternary radioelement mapping. Geophys. Res. Lett. 1985, 12, 371–374. [Google Scholar]
  59. Wilford, J. A simple method for the creation of ternary radioelement maps. Explor. Geophys. 1995, 26, 377–385. [Google Scholar]
  60. Portnov, A.M. Specialization of rocks toward potassium and thorium in relation to mineralization. Int. Geol. Rev. 1987, 29, 326–344. [Google Scholar] [CrossRef]
  61. Heran, W.D.; Hill, P.L. The Geophysical Expression of Selected Mineral Deposit Models; U.S. Geological Survey: Reston, VA, USA, 1992. [Google Scholar] [CrossRef]
Figure 1. Location map. (a) Spatial location of Egypt (red) relative to the world (gray), (b) Spatial location of the concerned area (red rectangle) relative to Egypt, (c) Spatial location of the study area.
Minerals 14 00787 g001
Figure 2. Simplified geologic and structural map of the study area with the locations of historical gold mining [9].
Minerals 14 00787 g002
Figure 3. Total intensity aeromagnetic map of the study area.
Minerals 14 00787 g003
Figure 4. RTP aeromagnetic map of the study area.
Minerals 14 00787 g004
Figure 5. Radially averaged power spectrum of RTP data.
Minerals 14 00787 g005
Figure 6. Vertical Derivative map from RTP with structure lineaments.
Minerals 14 00787 g006
Figure 7. (a) Regional aeromagnetic map. (b) Residual aeromagnetic map of the study area.
Minerals 14 00787 g007
Figure 8. Structure lineament extracted from Regional and Vertical Derivative maps plotted with RTP map. The shear zones confirmed [15].
Minerals 14 00787 g008
Figure 9. (a) K, (b) Th, and (c) eU maps of the study area.
Minerals 14 00787 g009
Figure 10. Hydrothermal alternative zones map of the study area from K/Th with the historical mining locations.
Minerals 14 00787 g010
Figure 11. Radiometric ternary map.
Minerals 14 00787 g011
Figure 12. Final Decision Map for gold mining in the study area.
Minerals 14 00787 g012
Disclaimer/Publisher’s Note: The statements, opinions and data contained in all publications are solely those of the individual author(s) and contributor(s) and not of MDPI and/or the editor(s). MDPI and/or the editor(s) disclaim responsibility for any injury to people or property resulting from any ideas, methods, instructions or products referred to in the content.

