Article

Application of Geophysical Methods in the Identification of Mineralized Structures and Ranking of Areas for Drilling as Exemplified by Alto Guaporé Orogenic Gold Province

1
Institute of Geosciences, University of Brasília, Brasília 70910-900, DF, Brazil
2
Faculty of Planaltina, University of Brasília, Brasília 73345-010, DF, Brazil
3
Instituto de Geociências e Ciências Exatas, Universidade Estadual Paulista, Rio Claro 13506-900, SP, Brazil
*
Author to whom correspondence should be addressed.
Minerals 2024, 14(8), 788; https://doi.org/10.3390/min14080788
Submission received: 24 May 2024 / Revised: 4 July 2024 / Accepted: 12 July 2024 / Published: 31 July 2024

Abstract

:
Mineral exploration works conducted in the Alto Guaporé Gold Province (AGGP), situated in the southwest region of the Amazon Craton in Brazil, faces the challenges of many gold provinces around the world, i.e., declines in the discoveries of new economic deposits and increases in exploration costs. Ground geophysical methods, combined with structural analyses and geological mapping, are valuable tools that have potential to improve accuracy in selecting exploration targets and in determining drilling locations. AGGP deposits are primarily associated with regional N20°–W50° inverse faulting and sheared geologic contacts between Meso-Neoproterozoic siliciclastic metasedimentary rocks and Mesoproterozoic basement (granite and volcano–sedimentary sequences). Mining currently occurring in the central portion of the province drives exploration works towards the many existing targets at the area. Among them, the ABP target is one of the most promising for being located few kilometers north of the Pau-a-Pique mine. At the ABP target, gold is associated with hydrothermal alteration located in the sheared contacts and in the hinge zone of folded metasedimentary sequence. Hydrothermal phases include Fe-oxides, sulfide (py), muscovite and quartz veins. In this study, we use magnetic and geoelectric (induced polarization) surveys coupled with structural and geological mapping to identify potential footprints within the ABP target. The results from induced polarization (IP) profiles successfully mapped the shape and orientation of the main structures down to approximately 350 m at the ABP target, indicating potential locations for hydrothermal alteration hosting gold. Additionally, 3D magnetic data inversions illustrated the distribution of magnetic susceptibilities and magnetization vectors associated with shear zone structures and isolated magnetic bodies. Magnetic data highlighted fault zones along the contacts between metamorphic rocks and granites, while IP data identified areas with high chargeability, correlating with sulfidation zones mineralized with gold. These findings suggest a metallogenic model where gold deposits are transported through deep structures connected to regional faults, implying significant tectonic and structural control over gold deposition. The results underscore the potential of multiparameter geophysics in identifying and characterizing deposits in both deep and strike, thereby advancing our understanding of mineral occurrences in the region and enhancing the search for new mineralized zones.

1. Introduction

Although the discovery of new metallic mineral deposits, including gold, has declined on a global scale, costs have risen significantly in recent years, placing pressure on mineral exploration teams to enhance their precision through more meticulous target selection [1] and a reduction in geological drilling expenses.
When entering an immature province, greenfield exploration teams typically deal with limited information. Therefore, area selection must be based on the use of conceptual models that are based on the mineral system concept and applied at the province scale. In addition to this, the models must consider parameters of fertility, architecture, geodynamics and preservation (e.g., [2]). An important parameter in this analysis is the matter of scale. Gold deposits of different types (e.g., orogenic gold, Carlin type, iron oxide copper gold ore deposits (IOCG), intrusion-related gold deposits (IRGD)) exhibit distinct characteristics when analyzed individually. However, at the lithospheric scale, they may have been formed in the same geodynamic context. Consequently, the individual analysis and ranking of targets should be accompanied by an analysis of the tectonic context where these targets are embedded. (e.g., [1]).
In more mature provinces, the challenge for brownfield exploration teams is to correlate and interpret large volumes of data and generate new targets from existing data in order to optimize work and reduce exploration costs. Roshanravan et al. [3] put forth a methodology comprising the following steps: (a) correlation of available data; (b) identification of key expressions and ingredients of mappable ore-forming processes, using spatial data modeling (particularly inversion and modeling together with advanced geophysical data filtering); (c) development of a conceptual model based on the mineral system concept; (d) translation of the conceptual model into an effective tool in target generation.
In the western portion of the Brazilian state of Mato Grosso, situated in close proximity to the international border with Bolivia, a series of Au + base metal deposits have been identified. These include (1) gold deposits of the Alto Guaporé Gold Province in Mato Grosso (e.g., [4,5,6,7,8,9,10]); (2) gold deposits of the San Ramon Gold Province in Bolivia; (3) the Cu-Au-Ag polymetallic Don Mario deposit, Bolivia [11]; and (4) the Cu-Au polymetallic Cabaçal deposit [12,13] considered a VMS by some authors (Figure 1). Although the deposits in question are relatively small to medium in size, their occurrence in a geotectonic context (i.e., near the Neoproterozoic margin of the Amazon Craton) serves to highlight the region as an important exploratory frontier in South America. This is because the region has large areas that remain unexplored alongside more developed provinces. The Alto Guaporé Gold Province (AGGP) is the most extensively studied of the aforementioned deposits. The province encompasses a series of gold deposits situated along a fold belt spanning over 500 km, designated the Aguapeí Belt [14,15,16,17]. The total resources are estimated at >1.8 Moz, based on production, resources and reserves from exploration and mining activities over the past 40 years [9]. However, these deposits have been exploited since the colonial period (e.g., [18]).
These deposits, which were formed in the early Neoproterozoic (~920 Ma), are interpreted as orogenic gold deposits generated by low-salinity aquo-carbonic fluids (e.g., [4,5,6,7,9,18]). The mineralizing fluids originated from metamorphic processes involving siliciclastic sedimentary sequences (Aguapeí Group) deposited in a rift basin during the late Mesoproterozoic (e.g., [17,19,20,21,22,23]). AGGP deposits are hosted in second- or third-order structures near the suture zone between the Paraguá Block and the Amazon Craton (e.g., [24]). Mineralization styles include quartz veins with sulfides (e.g., pyrite, chalcopyrite, pyrrhotite) found in regional folds and shear zones at the contact between Aguapeí metasediments and basement rocks ([9]).
The ABP target, situated 6 km to the north of the Pau-a-Pique mine, represents a strategic exploratory site. Within the target, gold occurrences have been found within the contact zone between the granites of the Pindaituba Intrusive Suite and the metasediments of the Aguapeí Group, as well as within hydrothermally altered folded Aguapei metasediments. The contact between the igneous basement and metasediments is marked by faulting and shearing associated with the corridor shear zone ([25,26]). The ore zone consists of quartz veins with hydrothermal muscovite, which host high-grade mineralization. The hydrothermally altered folded Aguapeí metasediments are situated within the context of the Caldeirão syncline hinge zone (e.g., [7,8,9,18,27]).
Despite being considered a mature province in terms of exploration, the Alto Guaporé Gold Province (AGGP) lacks significant geophysical research at the district or deposit scale compared to major orogenic gold provinces worldwide. Regionally, the existing literature consists of the following: (1) seismology that investigates the deep crust in the region (e.g., [28]); (2) regional studies in the neighboring Cabaçal deposit that employ potential methods that utilize the contrast between magnetic and radiometric properties to identify dioritic/porphyritic intrusions hosting gold, copper and zinc mineralization [29]; (3) studies that apply inversion of regional aeromagnetic data to guide exploration activities [30]. None of aforementioned studies are focused on identifying structurally controlled gold deposits at the deposit or district scale. The effectiveness of using geophysical–geological tools to search for orogenic gold mineralization has been reported in the literature. At the regional scale, integrating aeromagnetic and geoelectric data with geological and structural information facilitates the identification of prospective areas, which can then be validated by using robust geological and structural interpretation (i.e., shear zones) and their correlation with known deposits (e.g., [31]). At both the district and deposit scales, detailed terrestrial potential and electromagnetic surveys conducted throughout various stages of exploratory research, integrated with geological (geochemical and structural) data, enable the development of a prospective (favorability) model for mineralization, which is validated using robust mathematical tools to establish associations between known deposits, occurrences and geophysical signatures (e.g., [32]). In deeper portions of the crust, integrating potential, seismic and electrical data with good quality geological information can enhance our understanding of the genesis of orogenic gold mineralization, as validated by drilling data (e.g., [33,34]).
Previous works have utilized induced polarization to investigate electrical conductivity and chargeability (disseminated) metallic minerals associated with orogenic gold deposits (e.g., [35,36,37,38]). Examples demonstrating the effective application of this method in gold exploration are provided, all of which rely on accurate geological knowledge of the area and optimized survey scales (i.e., mineralization thickness; alterations; host/host rocks and type of sulfidation) [35,36,37,38].
The ABP target was chosen as a case study for ground geophysical surveys (magnetometry and IP) due to its strategic location near the Pau-a-Pique mine and its geological and structural context. The objective of this study was to assess the applicability of these methods at a district/deposit scale in brownfield exploration of orogenic gold deposits. The geological environment where the target is situated is characterized by low magnetic gradients [39] and potential for polarization (e.g., presence of disseminated sulfides). The findings of this study illustrate the potential of ground geophysics as a tool for guiding the exploration of orogenic gold deposits in mature provinces.

2. Geological Context

2.1. Geological Settings
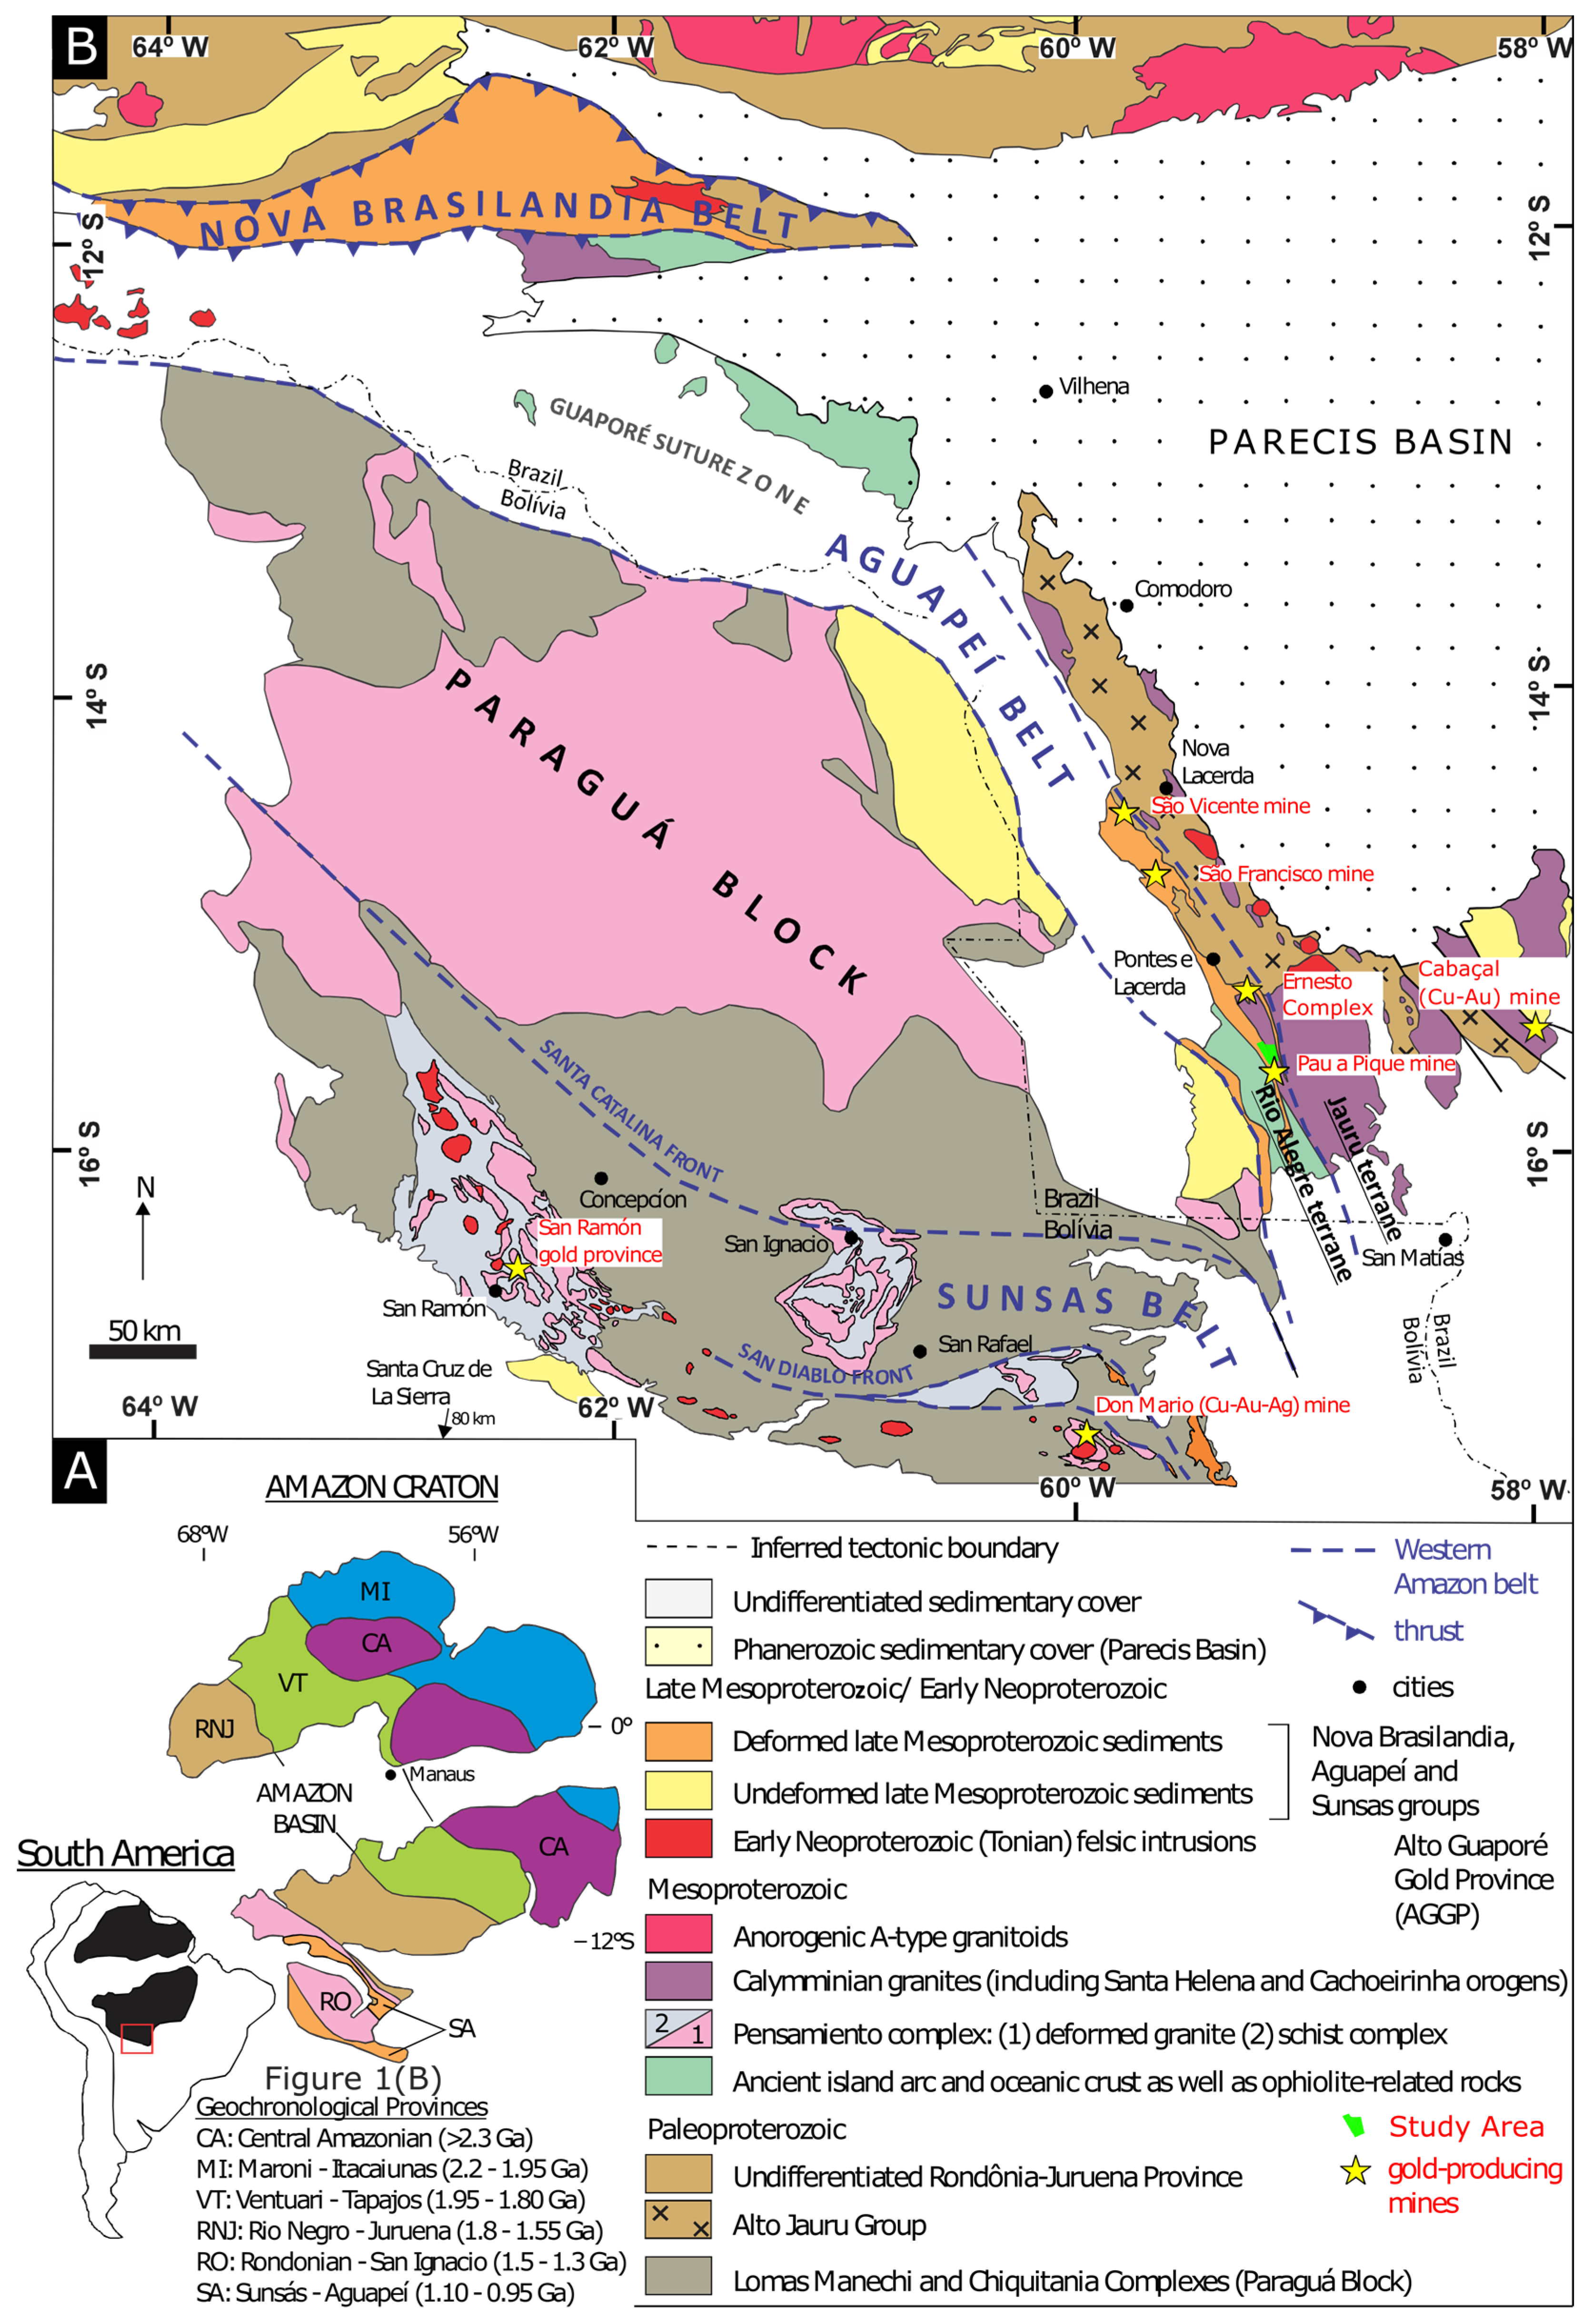
The study area is situated in the southwestern portion of the Amazon Craton (Figure 1) within the geo-tectonic context of the Sunsás–Aguapeí orogeny (1.25–1.00 Ga) (e.g., [26,40,41]). The AGGP deposits are hosted along the Aguapeí Belt, a narrow (~30 km wide) belt of low-grade Neoproterozoic metamorphic folds (~0.92 Ga) [18]. The Western Amazon Belt developed during the final stages of reactivation, transpression and closure of rift-type basins, resulting from the convergence between the Paraguá Block and the Amazon Craton [42].
Figure 1. Regional geologic settings (extracted and modified from [9]). (A) Major geochronological provinces of the Amazon Craton according to [40] and its location in South America. (B) Major geologic and tectonic domains of the southwest Amazon Craton (modified from [24,27], after [42,43,44,45]). The dashed blue line represents the limits of early Neoproterozoic belts that constitute the Western Amazon Belt [42].The Aguapeí Belt, the youngest fold–thrust belt formed during the Sunsás–Aguapeí orogeny ([14,15,17]), began with the deposition of siliciclastic sediments of the Aguapeí Group in rift-type basins (1265–1150 Ma) [19,20,41], later deformed and metamorphosed at a low grade during the final stages of compression and transpression along the Mesoproterozoic margin of the Amazon Craton (e.g., [9,42]).
Minerals 14 00788 g001
The Aguapeí Group encompasses a thick sequence of siliciclastic metasedimentary rocks deposited in an aulacogen-type basin ([21,23,46]) between 1265 and 1149 ± 7 Ma ([19,47]). The group is divided into three formations: the Fortuna Formation (conglomerates and quartz arenites), the Vale da Promissão Formation (metapsammites and metapelites) and the Morro Cristalina Formation (fluvial sandstones and siltstones) [21,22,23]. The aforementioned rocks exhibit green schist facies low-grade metamorphism ([18,23,27,48]).
The Aguapeí Group’s basement comprises rocks originating from the Rio Alegre and Jauru terrains. The Rio Alegre Terrain is composed of meta-volcano–sedimentary rocks (Minouro, Santa Izabel and São Fabiano Formations) [49], which have been interpreted as a suture zone between the Paraguá Block and the Amazon Craton (e.g., [24]). The Jauru Terrain (1780 Ma–1420 Ma) encompasses Paleoproterozoic and Mesoproterozoic igneous and metamorphic rocks, including the Alto Jauru Group, Alto Guaporé Metamorphic Complex and Figueira Branca Intrusive Suite [26].
In the study area, the basement of the Aguapeí Group is represented by granites and granitoids of the Pindaituba Intrusive Suite (Maraboa, Guaporé, Santa Elina granites and Lavrinha Tonalite) [25,26]. These rocks are interpreted as continental magmatic arc granitoids, with crystallization ages estimated between 1465 ± 4 Ma [50] and 1461.6 ± 4 Ma [9].

2.2. ABP Target

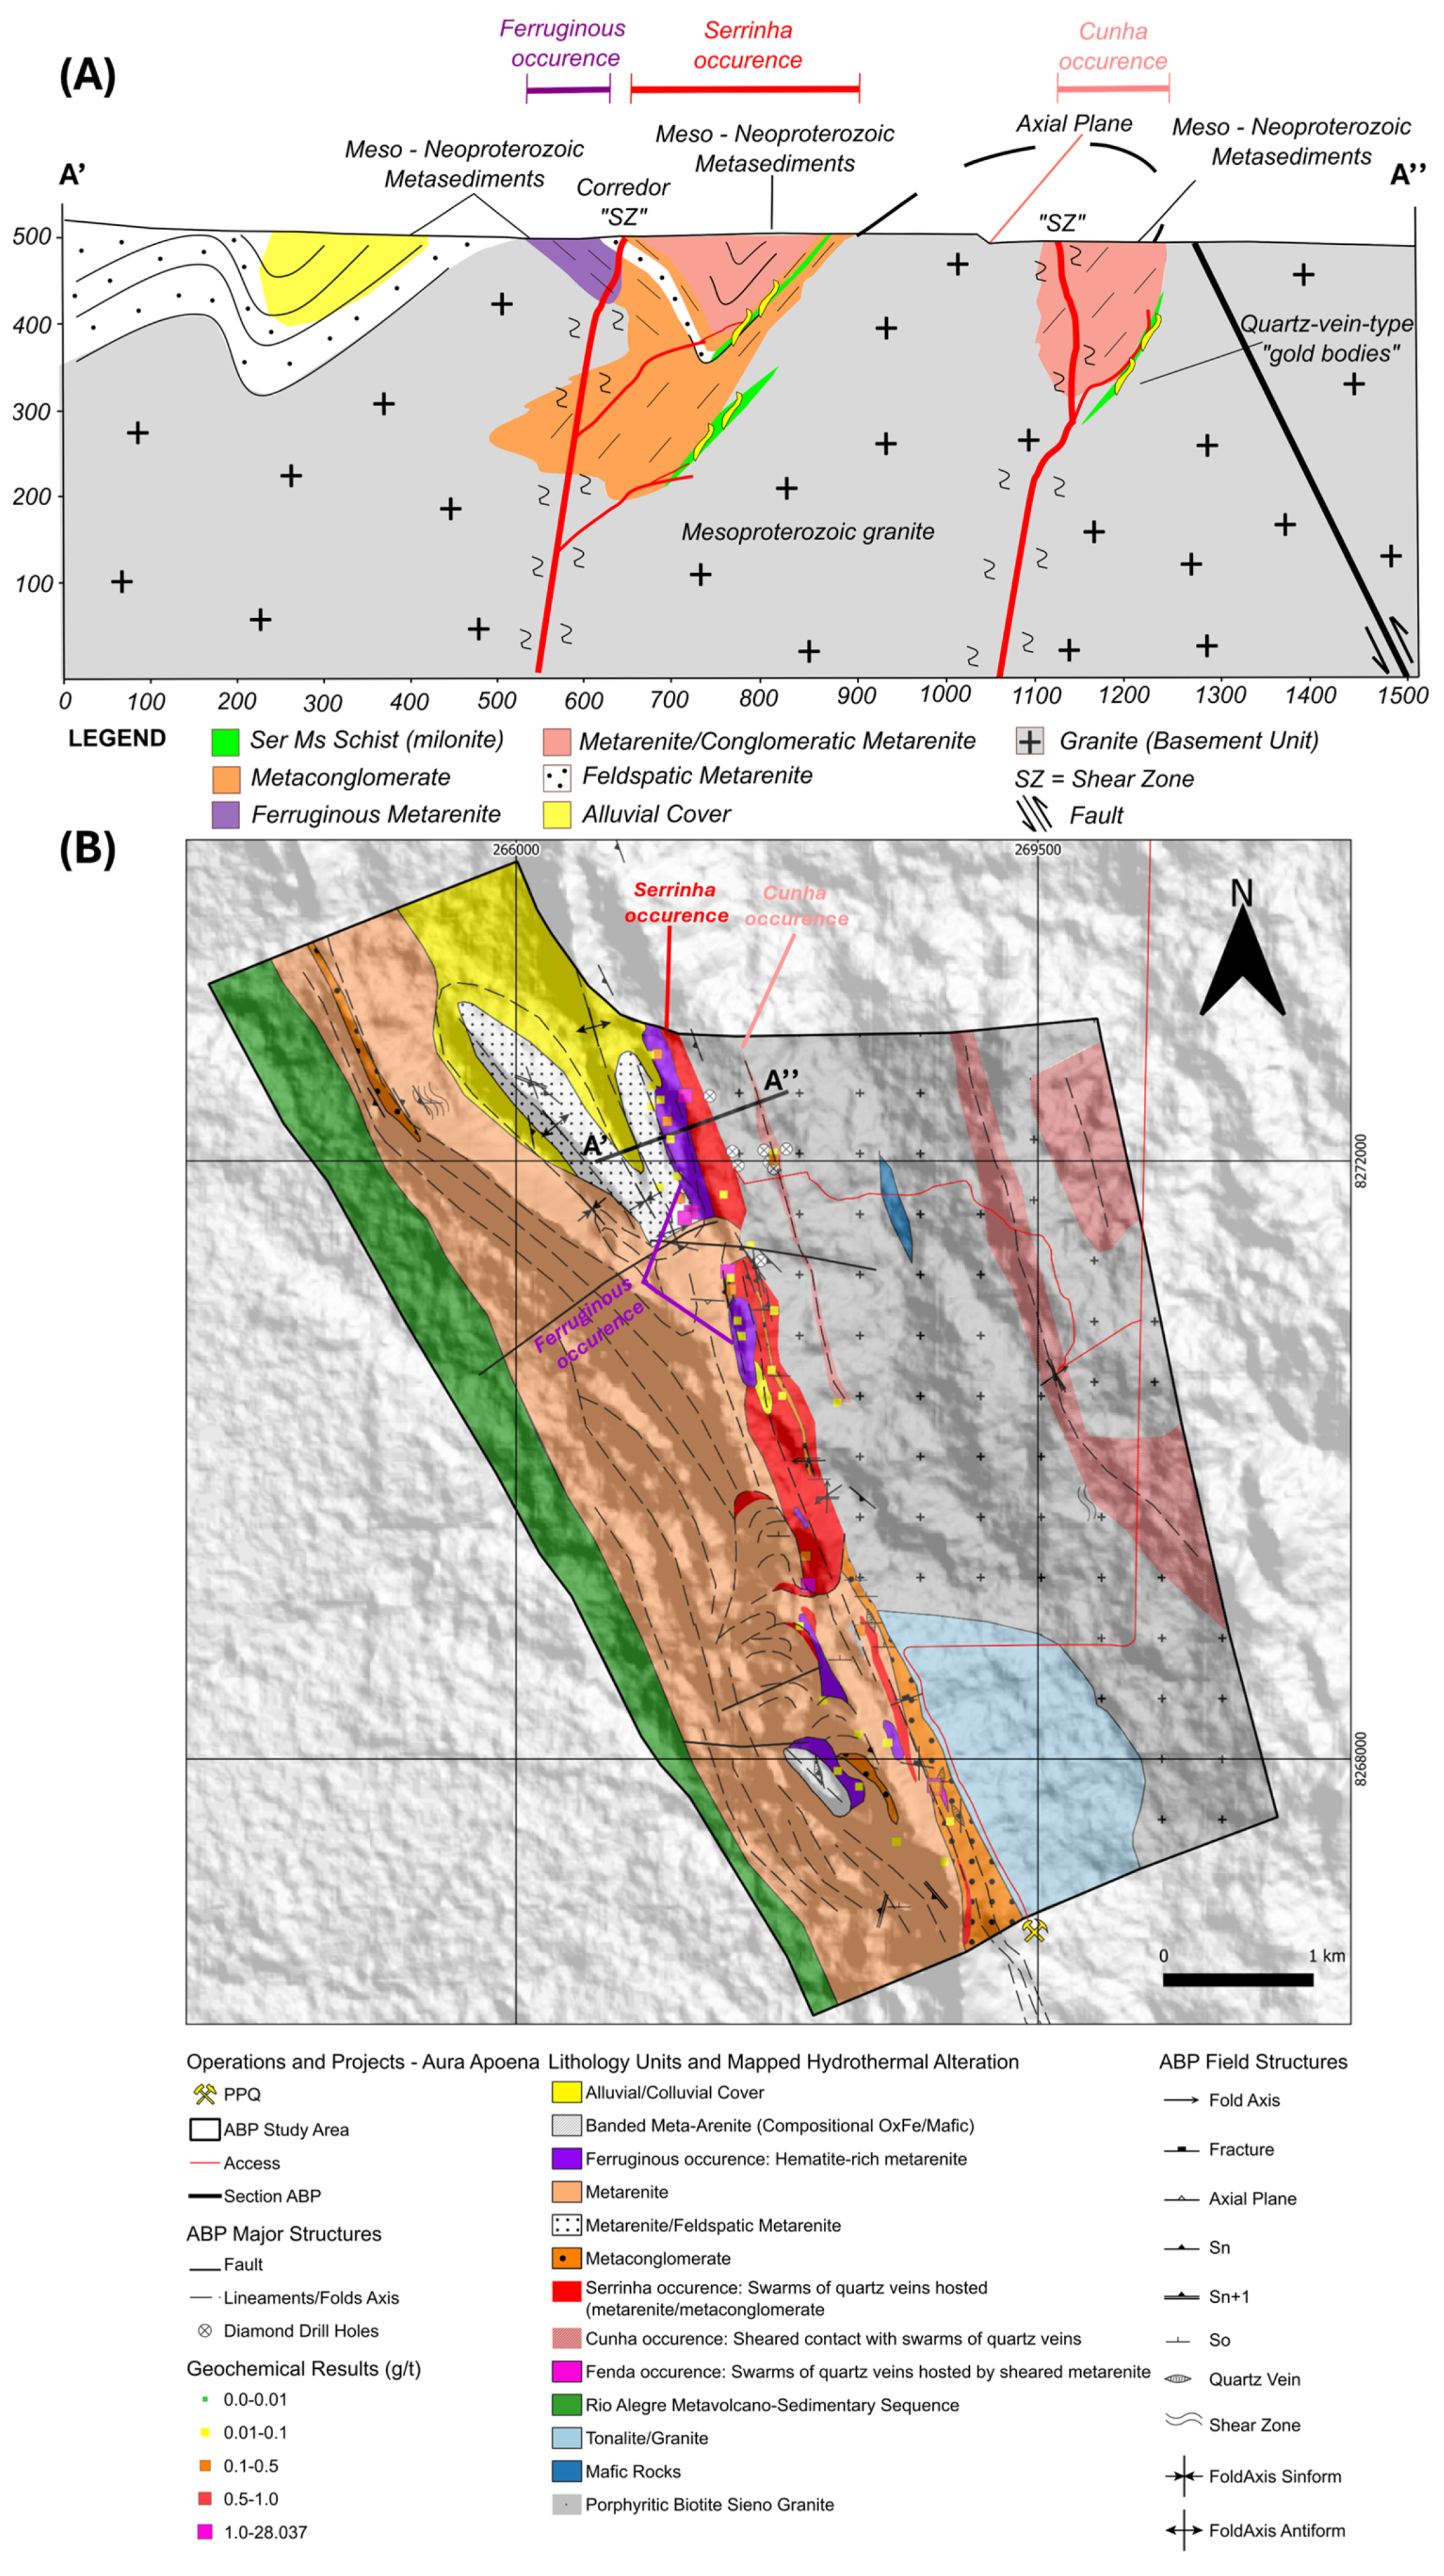
The ABP target is located in the central part of the Alto Guaporé Gold Province (AGGP), between the municipalities of Pontes e Lacerda and Porto Esperidião, approximately 6 km north of the Pau-a-Pique Mine (Figure 2). In this area, Mesoproterozoic granites are exposed in the relatively flat foothills of the NW-oriented Pau-a-Pique ridge, while metasedimentary rocks of the Aguapeí Group form outcrops on the mid-slope and hilltop of the ridge. The shaded relief in the background of the geological map (Figure 3B) illustrates the topography and elevation differences, which range from 325 m to 575 m, in the target area.
The ABP target comprises three gold occurrences known as Cunha, Serrinha and Ferruginous (Figure 3B). The Cunha occurrence, situated in the eastern part of the target, lies at the eastern contact of a wedge-shaped layer of metaconglomerate, tectonically emplaced within the surrounding basement granite. This metasedimentary wedge is approximately 100 m thick and extends over 400 m in length (Figure 3B). In cross-section, it exhibits a triangular shape (Figure 3A) and is interpreted as tectonically intercalated metasediments within the granite basement. Above-background gold grades mark a gold anomaly at the surface, which is associated with a zone rich in iron oxide minerals (e.g., hematite, specularite and minor magnetite). The hydrothermal fluids circulating throughout the shear zone altered the mylonite into layers of hydrothermal muscovite and biotite and precipitated quartz veins (e.g., [9]). The shear zone is estimated to be approximately 200 m thick and over 3.5 km in length (Figure 3B).
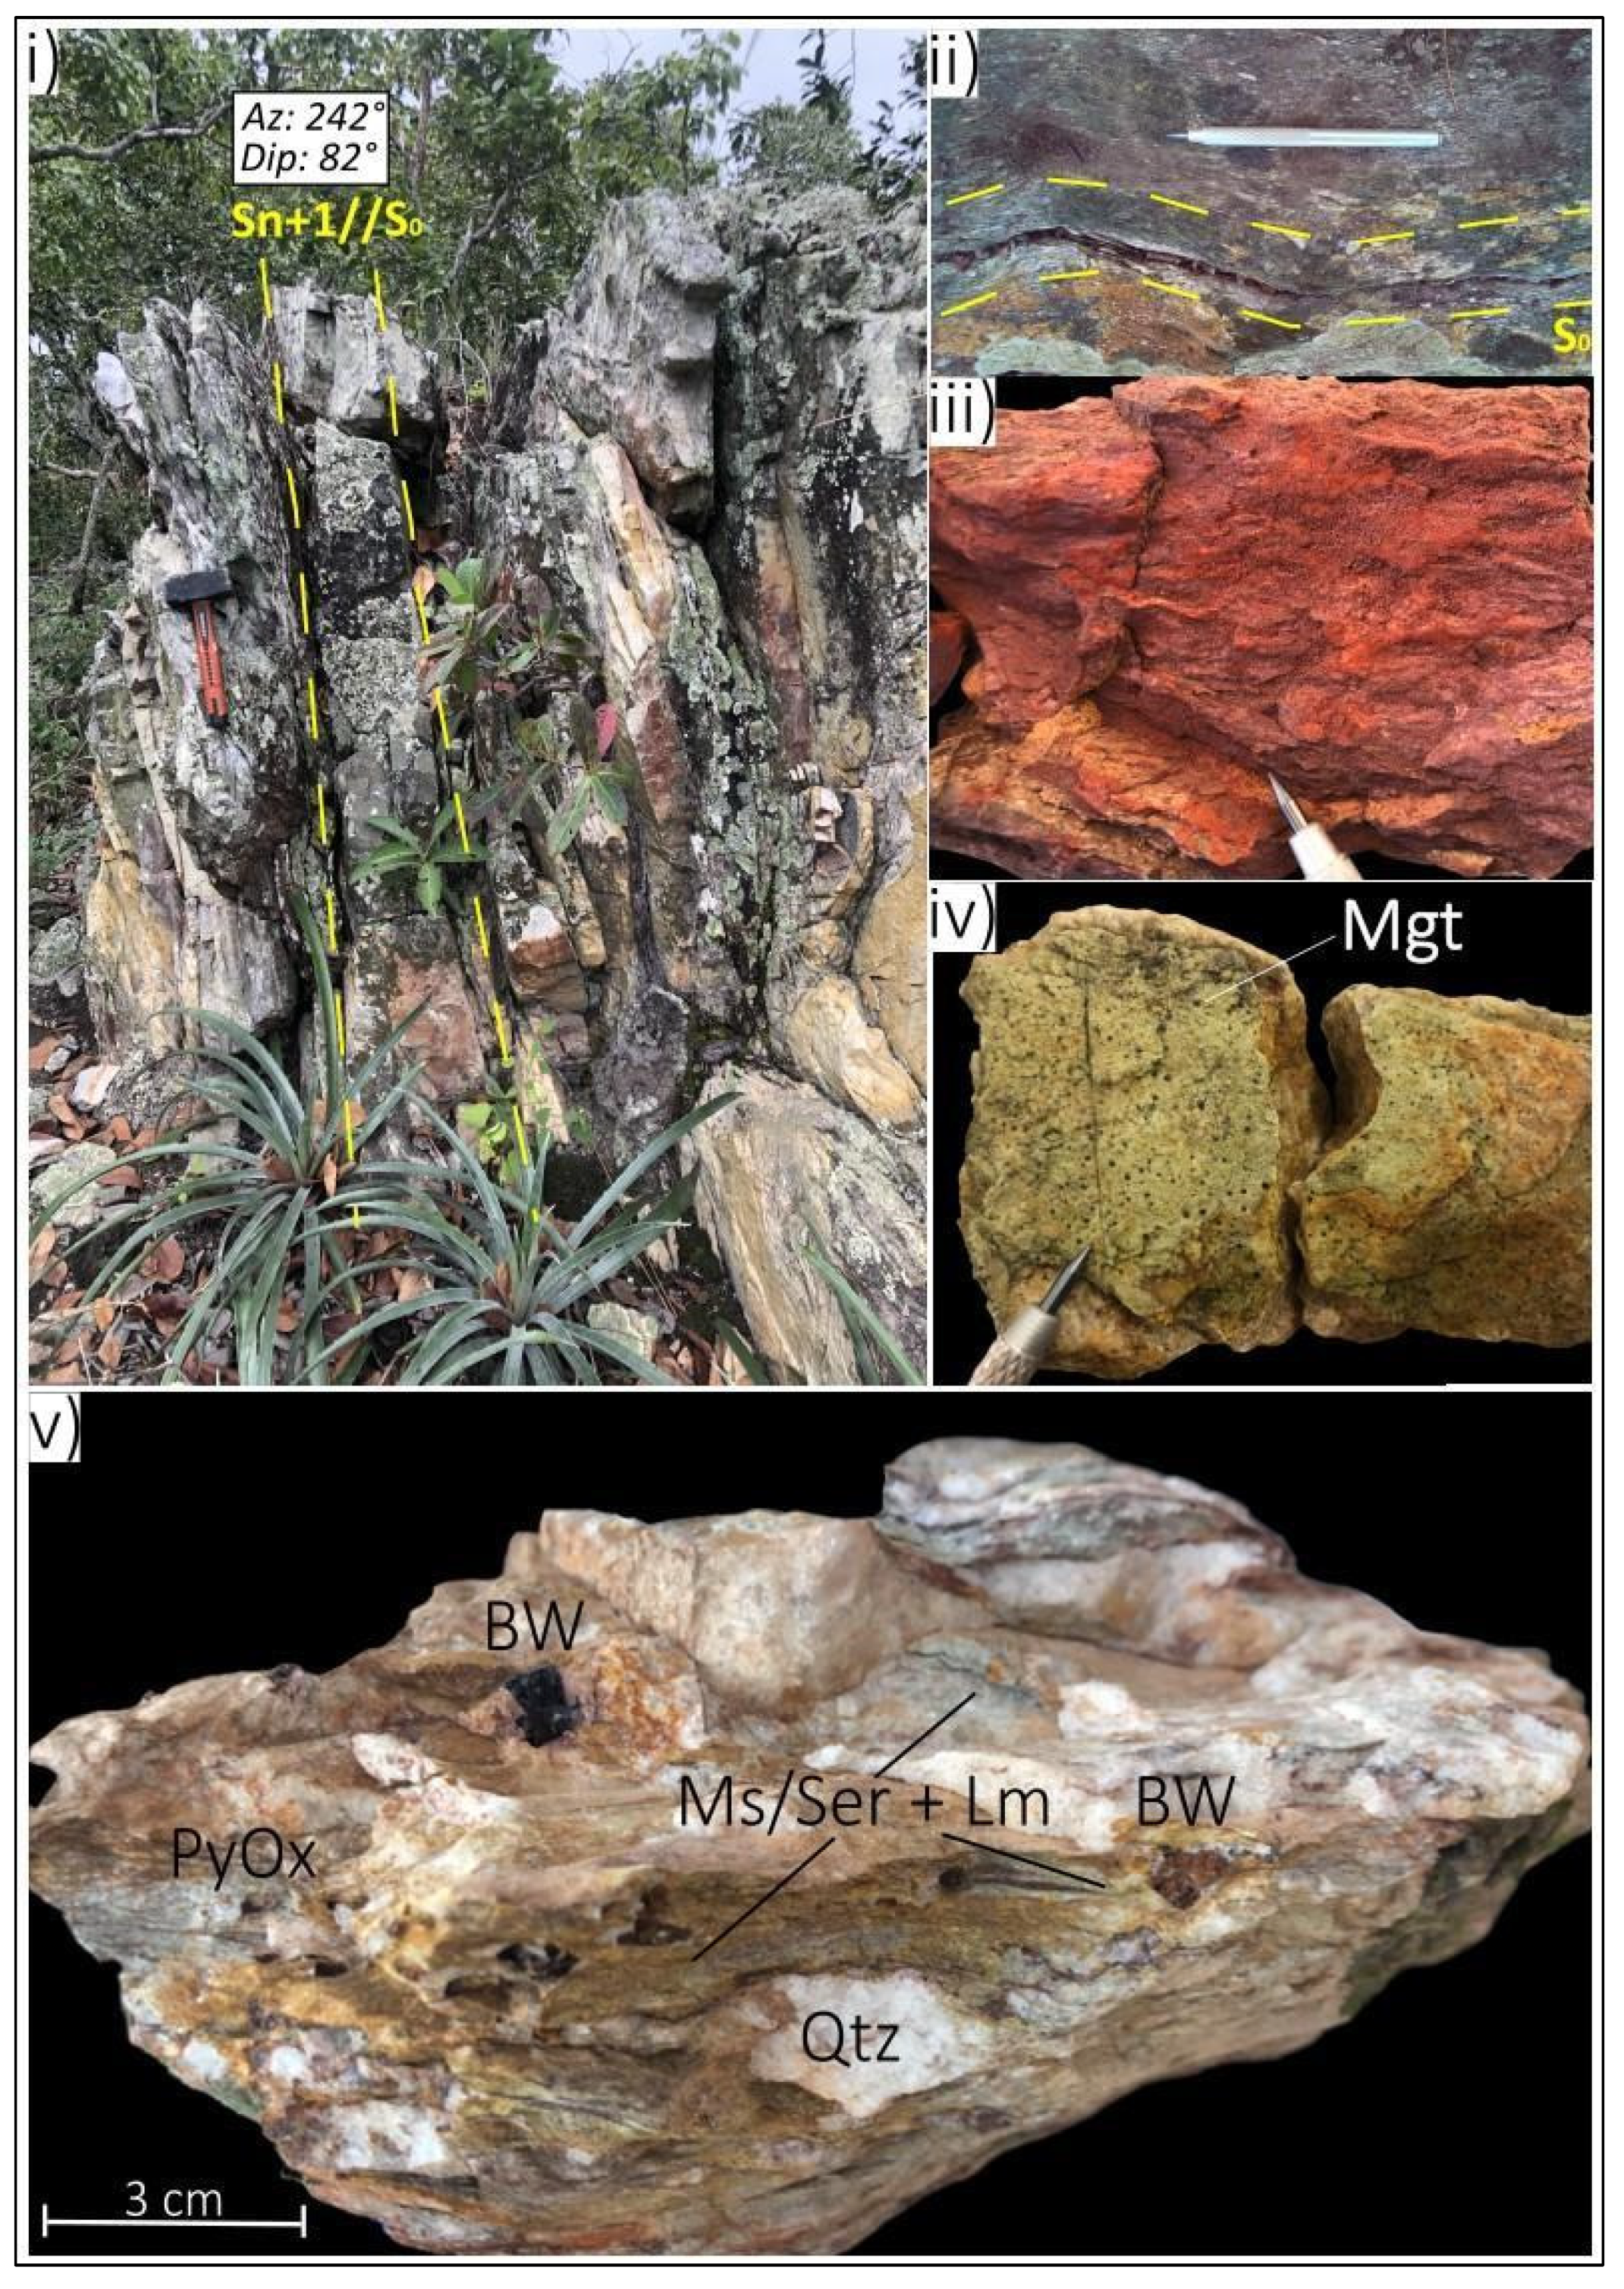
The Serrinha occurrence resembles the Cunha occurrence as it is also located along the sheared contact between the granite and metasediments (i.e., metarenites and lithic metarenites and conglomerates). The hydrothermal alteration observed at Serrinha mimics that of the Cunha occurrence, characterized by swarms of centimeter-scale quartz veins associated with hydrothermal muscovite-biotite “schists”, iron oxide (magnetite) (Figure 4iv,v), disseminated sulfides (pyrite)and pervasive silicification. The Ferruginous occurrence features a zone with strong presence of Fe-oxides (hematite + magnetite) (Figure 4iii) and sulfides (cubic to octahedral pyrite), disseminated throughout the folded metasedimentary rocks (metarenite and metaconglomerate) of the Aguapeí Group. This zone, characterized by Fe-oxides and sulfides, is associated with higher-than-background gold grades and has a lenticular shape, approximately 50 m thick and over 3 km in length, arranged as lenses along the strike.
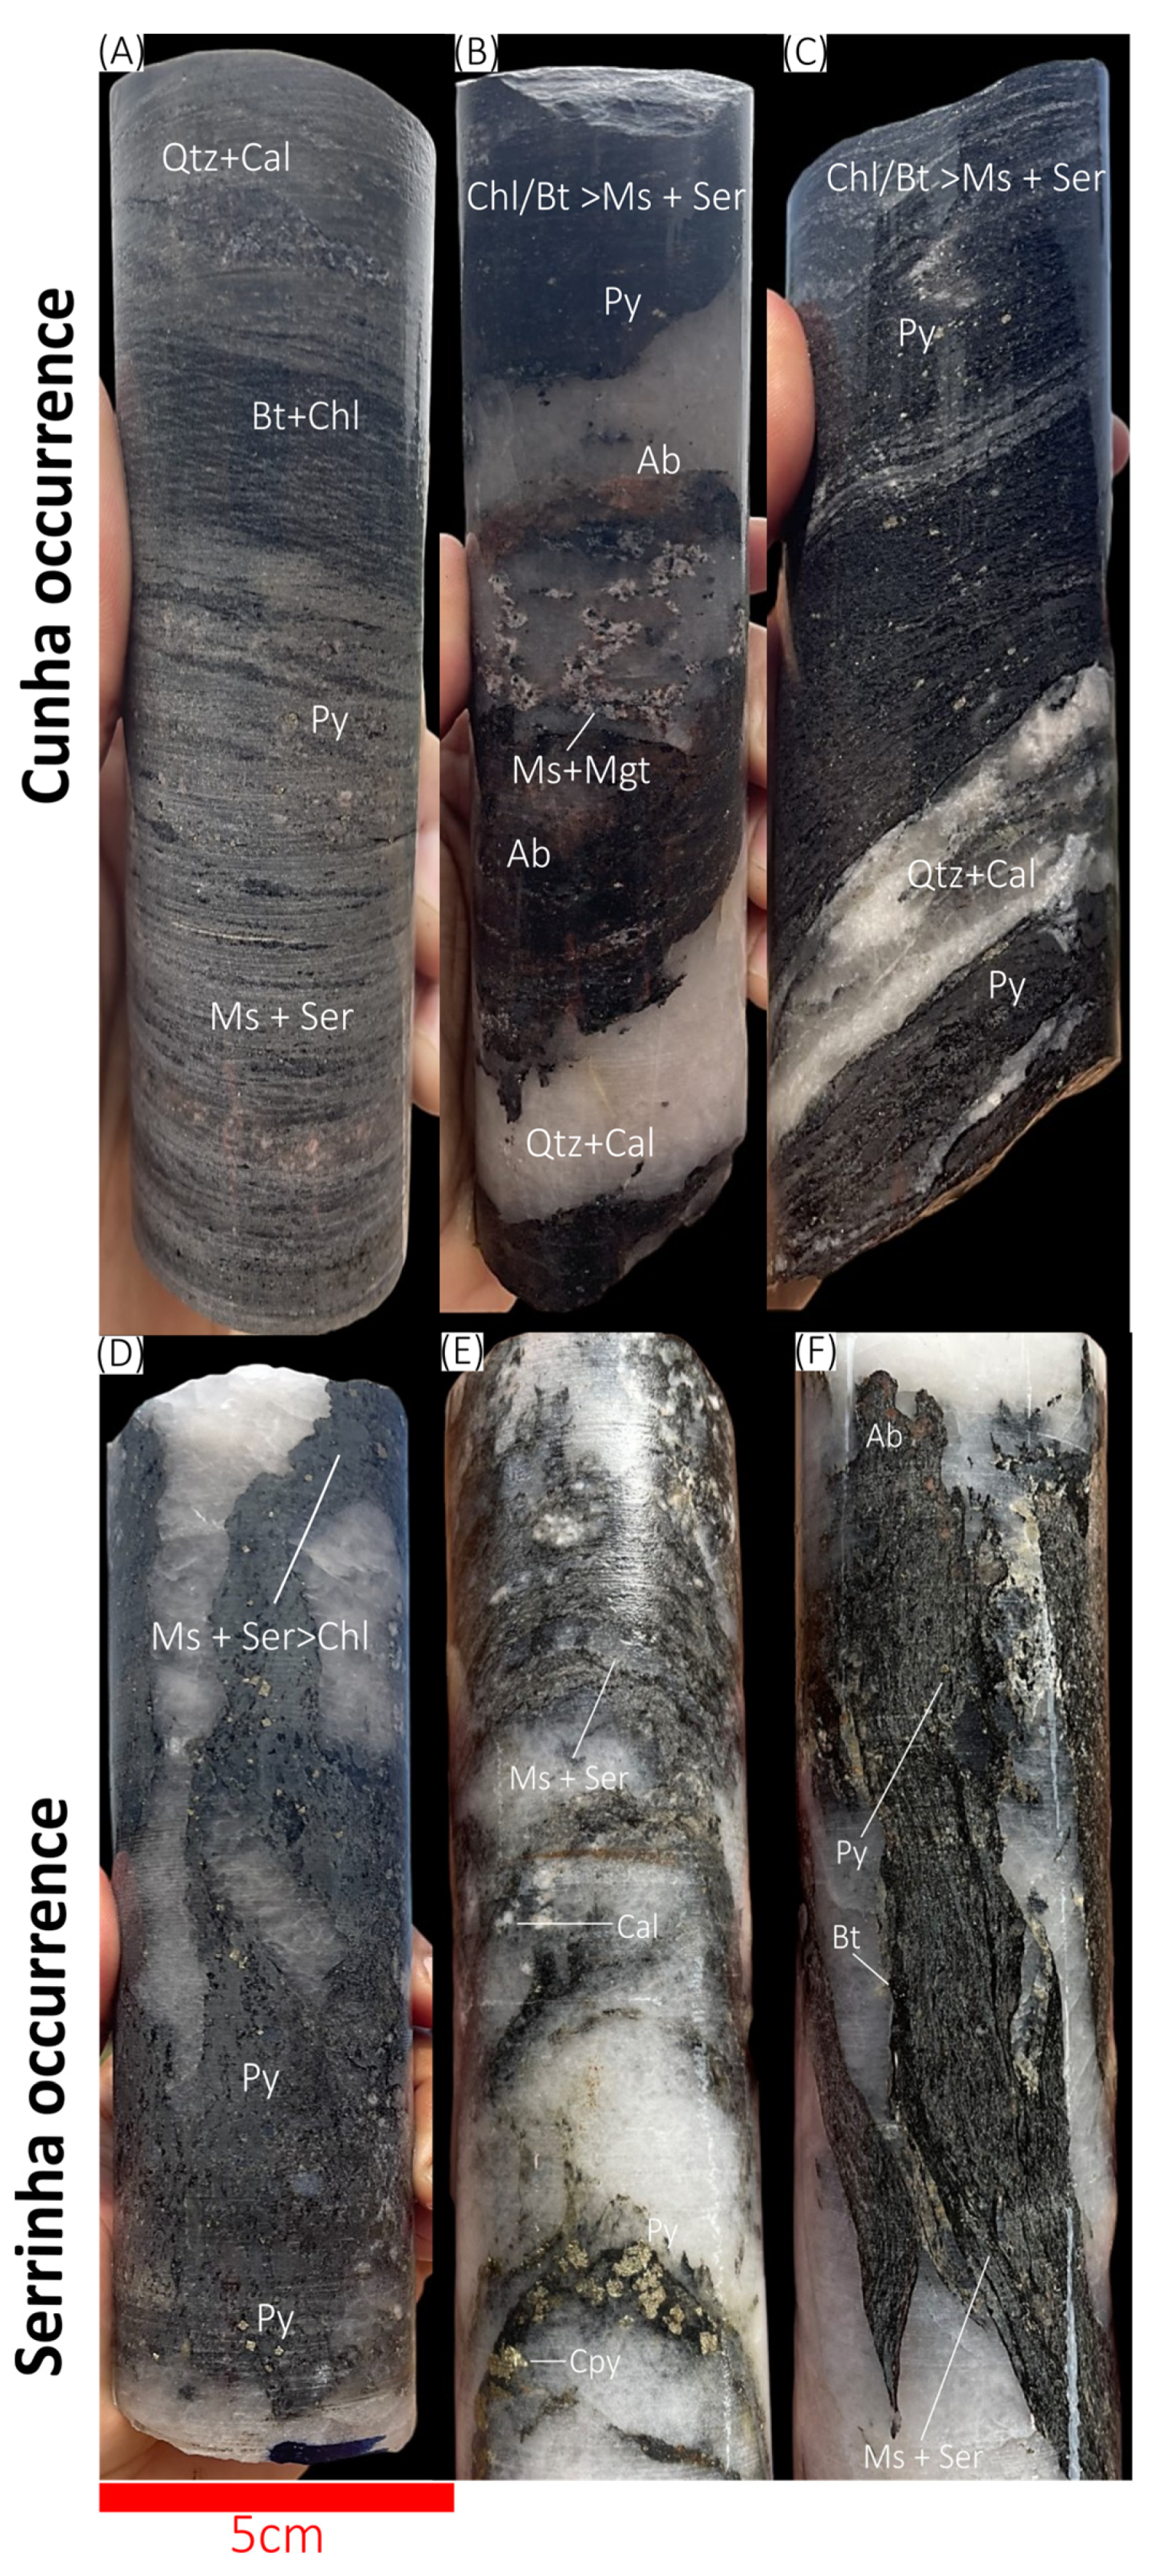
In both Serrinha and Cunha, the quartz veins are white and translucent, occur-ring at centimeter-scale, sometimes with calcite (Figure 5A) and albite (Figure 5B) and surrounded by hydrothermal muscovite and biotite (Figure 5). Other hydrothermal phases present, include magnetite (Figure 5B), calcite (Figure 5C) and sulfides (pyrite and lesser amounts of chalcopyrite) (Figure 5A,D–F).
Similarly to the Pau-a-Pique deposit, the mineralized zones of the Serrinha and Cunha are hosted within a hydrothermal muscovite layer associated with quartz veins and sulfide (Figure 4), developed at the contact between the granite in the footwall and the metasediments in the hangwall. These mineralized zones, formed along subvertical, NNW-oriented shear zones, dipping approximately 75°, with an average thickness of 7 m. The hydrothermal muscovite layer exhibits well-developed schistosity and contains abundant laminated quartz veins that show sigmoidal shapes and are parallel to the foliation. The footwall of the mineralized zones consists of medium- to coarse-grained leucocratic biotite granites with frequent porphyritic texture. These granites are associated with the Pindaituba Intrusive Suite. Occasionally, these rocks exhibit penetrative foliation, sometimes accompanied by mylonitic deformation. The hangwall is composed of intercalations (i.e., fining-upward or coarsening upward sequences) between oligomictic metaconglomerates with quartz and feldspar pebbles up to 5 cm in size. Additionally, it includes metarenites and lithic metarenites as well as conglomerates of the Fortuna Formation, which has quartz and feldspar clasts elongated in the direction of the foliation. These layers show stratification (S0) parallel to the main foliation (Sn + 1).
The structural framework of the area where the Target is located is characterized by a complex association of regional-scale structures, resulting from the confluence between the corridor shear zone and the hinge zone of the Caldeirão Syncline (e.g., [5,6,8,9,48,49]) (Figure 3). This is the reason why the target was selected as a case study for this research project. In the region of the ABP target, structures associated with two phases of compressional deformation (D1 and D2) and one phase of transpression (D3) have been identified ([7,8,49,51,52,53]). According to [9], the shear zone was formed during the D2 compression event, which led to the development of mylonitic foliations. However, it is believed that the gold deposition occurred during the D3 phase, during the transition from compressional to transpressional regimes with reactivation of pre-existing structures. The most prominent plane of deformation (Sn + 1) is consistently parallel to the bedding (S0).

3. Methods

In this study, magnetic and induced polarization (IP) surveys were conducted along lines intersecting the three gold occurrences of the ABP target.

3.1. Ground Magnetic Survey

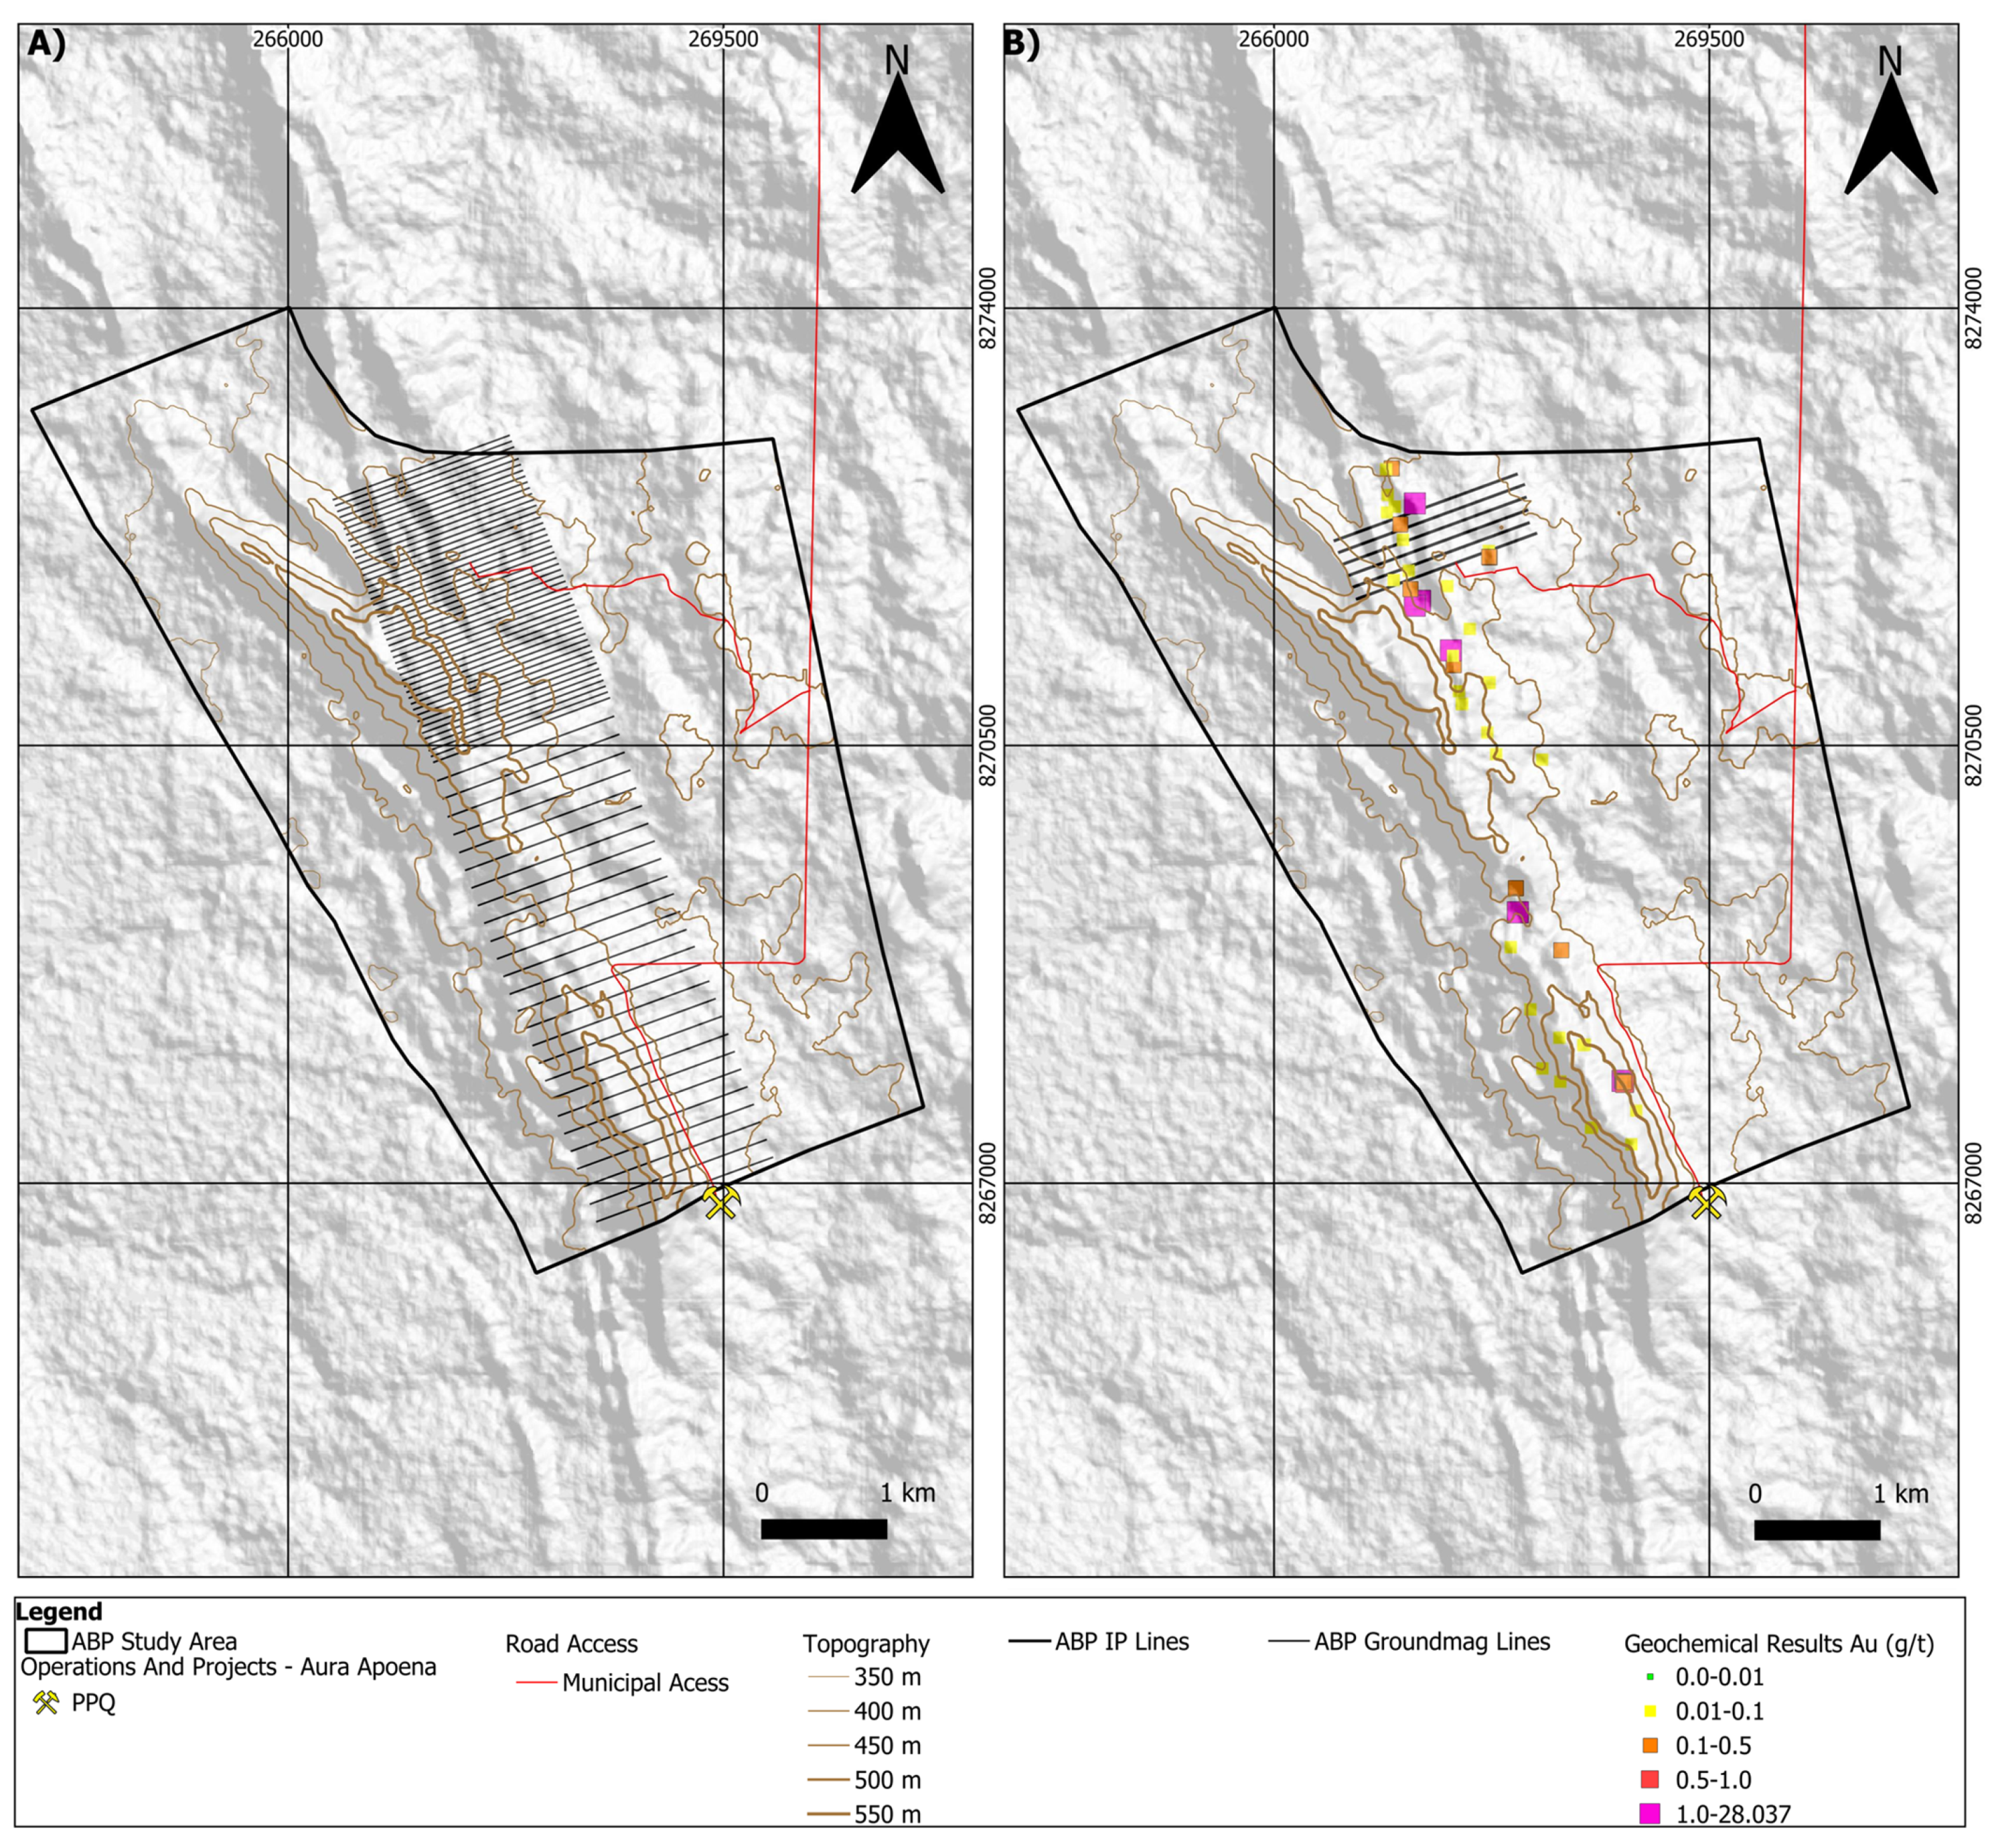
The ground magnetic data were acquired by the author with the support of the Aura Minerals Inc. (Road Town, UK) team. The acquisition occurred along lines of approximately 1.5 km in length, oriented NE–SW. A total of 71 lines were surveyed, covering a distance of 107.37 km in total (Figure 6A).
The ground magnetic survey was conducted using two different line spacings (Figure 6A). In the northern portion of the area, where the main gold occurrences of the ABP target are located, the survey grid had a line spacing of 50 m, with readings taken every 25 m along acquisition lines. Conversely, in the southern part, the survey was conducted with a line spacing of 150 m between lines, with readings taken every 25 m along the lines.
The survey configuration was defined based on previously mapped structures in the field, using 1:2500 geological mapping. This approach was important for locating the main structure (corridor shear zone), in the areas of low magnetic anomalies, particularly in the northern portion where a higher level of detail (50 × 25 m) was applied.
The equipment used included of two magnetometers, GSM-19TW and GSM-19W models, manufactured by GEM Systems. To monitor the diurnal variation of the magnetic field, recordings were taken at 30-s intervals at a base station located in a magnetic interference-free area. During the data preprocessing stage, diurnal correction and the removal of the International Geomagnetic Reference Field (IGRF) were performed. The data were processed using Oasis Montaj software (Educational Version 2022.1) [54]. Furthermore, data modelling was conducted to determine the distribution of magnetic susceptibility values and the direction of the magnetization vector (MVI), which were extracted using VOXI software 2.1. The cell size used was 30 m × 30 m × 10 m and the default inversion parameters of Oasis Montaj were applied for the inversion process.

3.2. Induced Polarization Survey

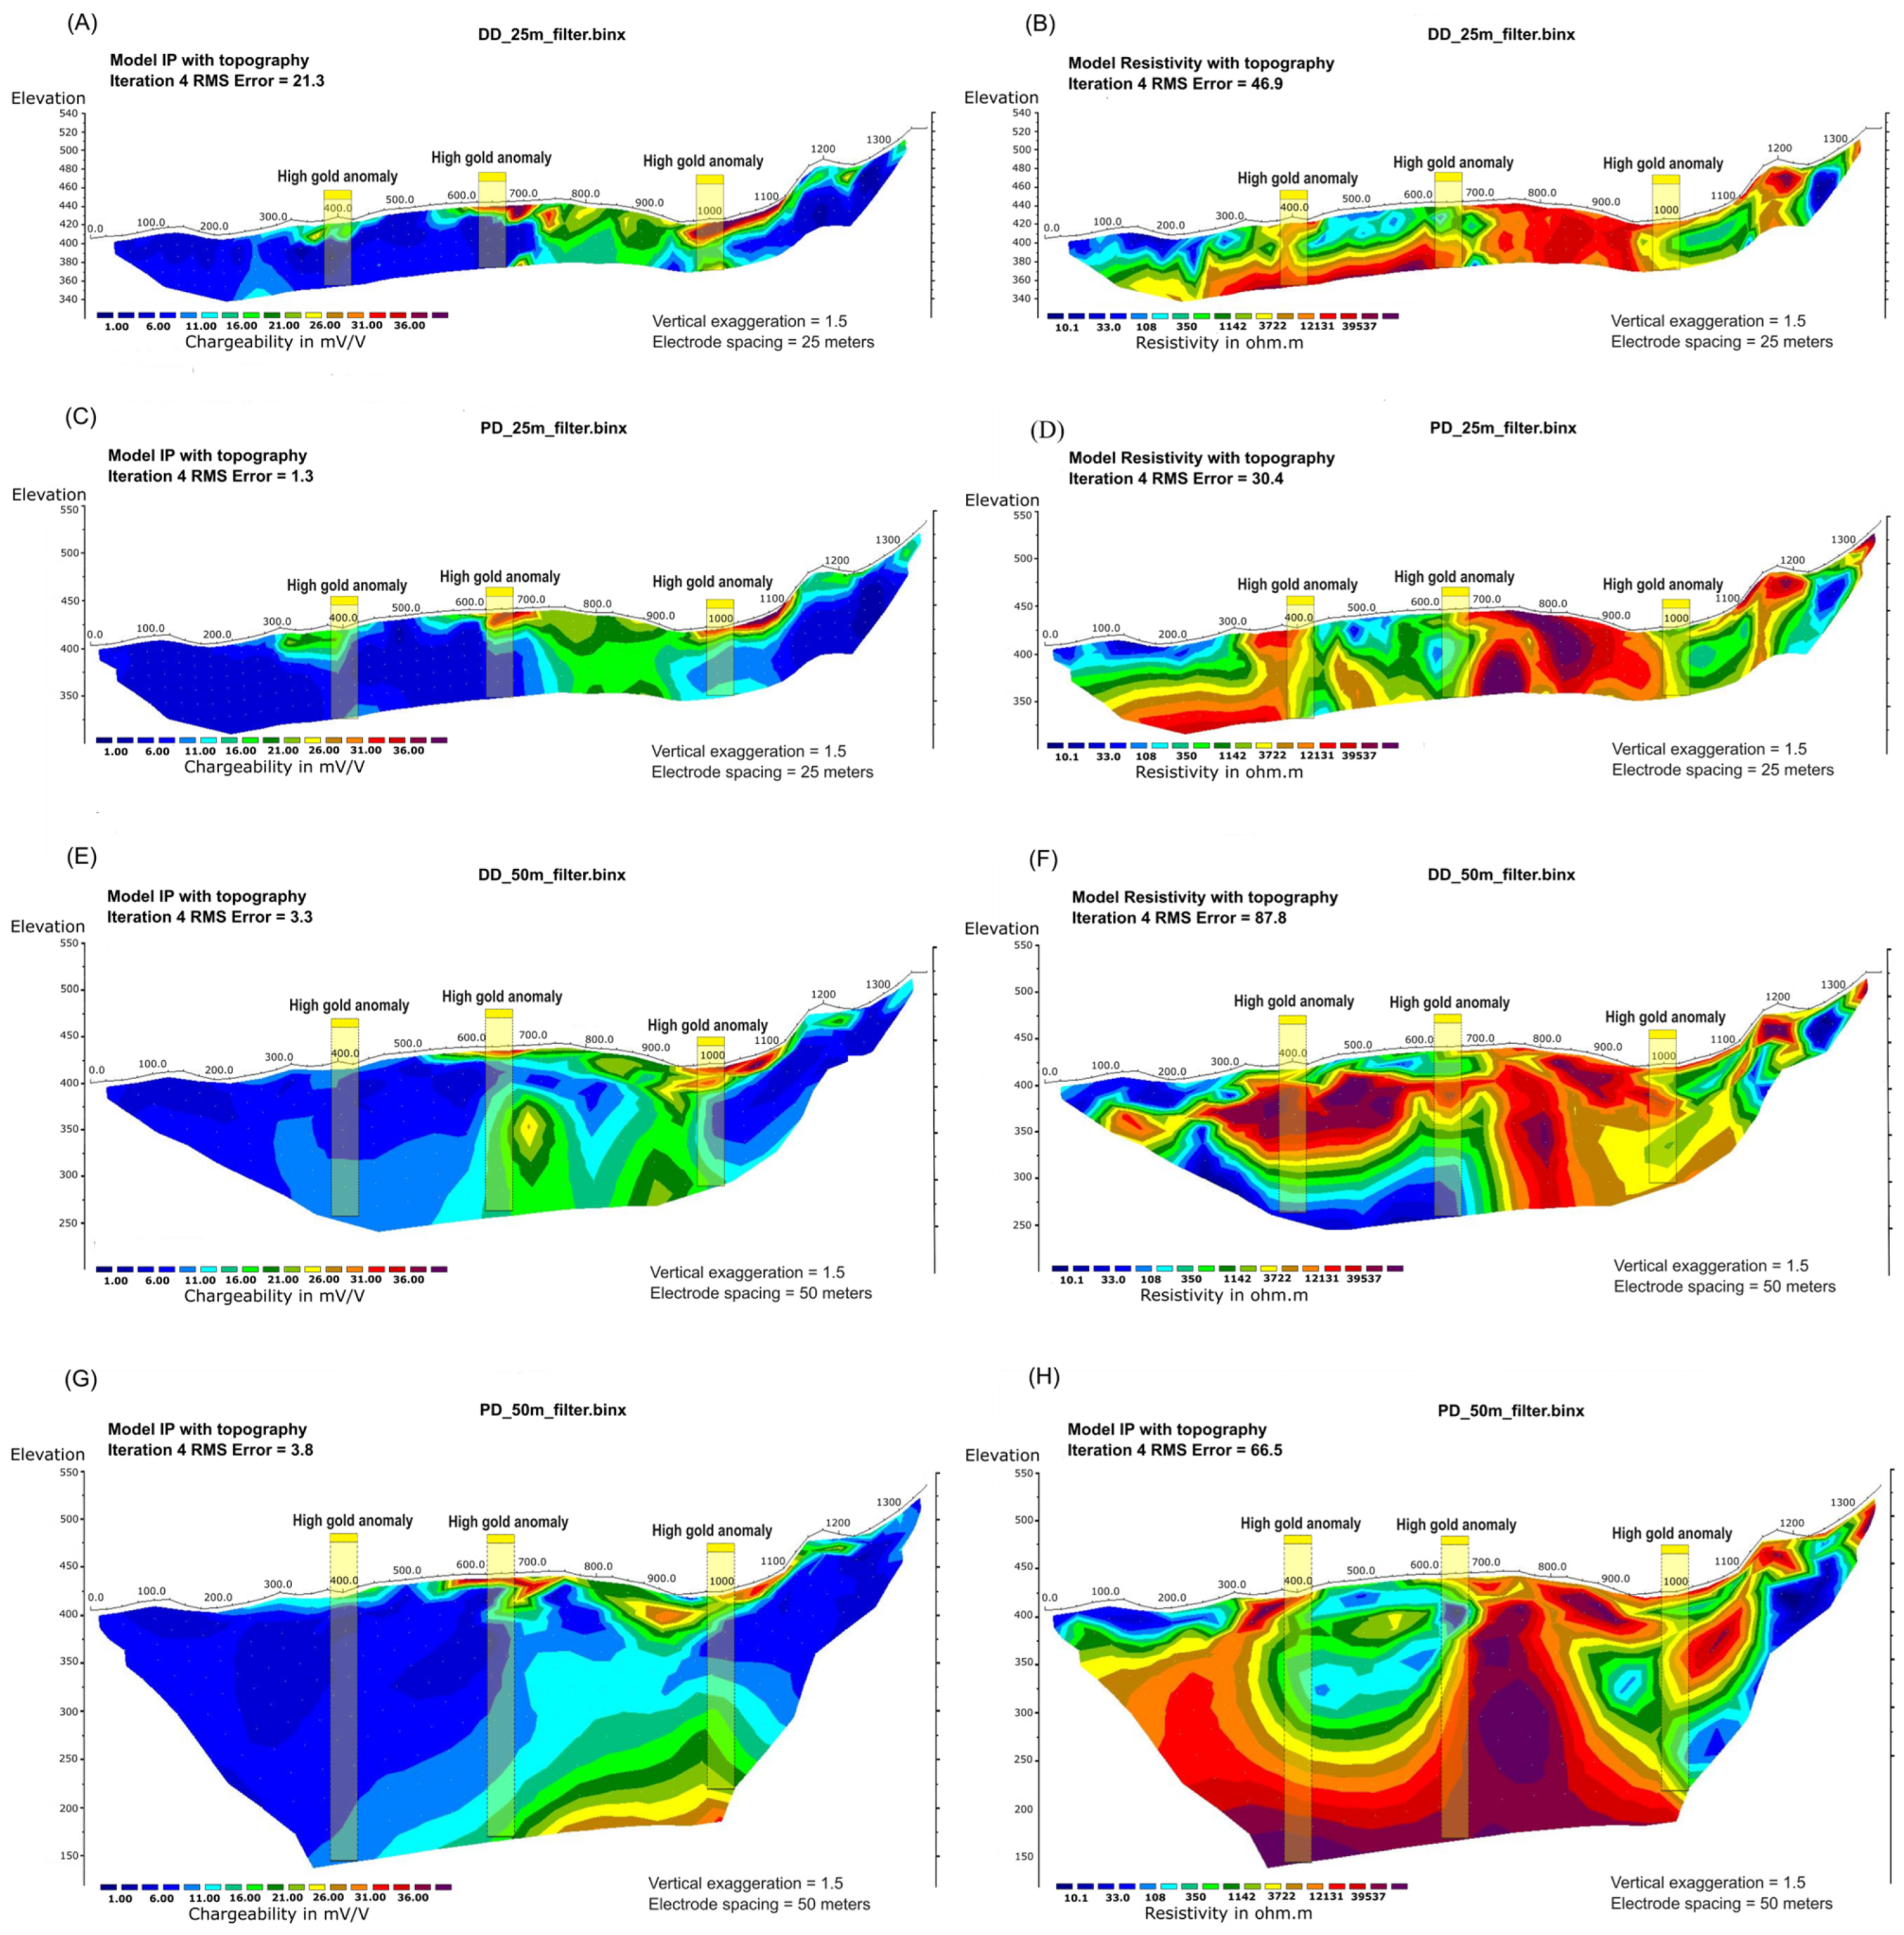
The induced polarization data were acquired along six lines in the northern portion of the ABP target. These IP survey lines were approximately 1.5 km long (Figure 6B) and oriented NE–SW, perpendicular to the strike of the gold occurrences. The survey grid had a line spacing of 100 m (Figure 6B). Electrodes and dipole lengths (MN and AB) were installed with a spacing of 50 m, except for line 6 (L6), where data acquisition involved two spacings of 25 m and 50 m, respectively. Line 6 was chosen for deploying dipole-dipole (DD) and pole-dipole (PD) arrays with 10 levels of investigation depth, aiming to select the most suitable for the study area. Line 6 was selected to test different acquisition spacings and arrays, because it covers all the mapped occurrences in the ABP target and exhibits the highest gold grades in both rock geochemical samples and the best intervals in drill holes (Figure 7).
In order to facilitate the acquisition of IP data, the following equipment was used: (i) a 10-channel ELREC-PRO receiver and (ii) a VIP 4000 transmitter, both manufactured by Iris Instruments.
The data collection parameters included a current injection and recording cycle of 4000 ms (e.g., 2 s on and 2 s off) and time windows (sampling) of the Cole–Cole potential curve [40]. The electrical current injected by the transmitter ranged from 1 to 3 A, depending on the electrical contact resistance between the current electrode and the ground (e.g., lower currents in areas of outcropping silicified metasediments).
The topography along the IP lines was obtained using a Geodetic GPS model GNSS Topcon HiPer VR manufactured by Topcon Positioning Systems, Inc. (Livermore, CA, USA).
The data filtering was conducted using the Prosys III software, version V2.11 (Iris Instruments Inc., Orléans, France), based on the following principles: extraction of resistivity records and chargeability outside the log-normal distribution and the identification of chargeability with decay curves that deviate from decreasing exponential functions.
The IP data modeling was performed using the Res2dinv software, version 2024.1.1 (Seequent). In the inverse modeling, the smoothness constrained routine [55] of this program was employed to achieve smoother transitions (e.g., geological materials) and a vertical filter to enhance vertical structures (e.g., shear zones). Subsequently, points with higher RMS errors (spikes) were removed.
The results obtained from the dipole–dipole (DD) array were limited in the study area, at both spacings (25 and 50 m), due to the limited depth of investigation and its low signal-to-noise ratio compared to the pole–dipole (PD) array. Conversely, the PD array offers the benefit of reaching greater depth of investigation. Consequently, the pole–dipole array with 50 m spacing was deemed optimal for continuing the study on the remaining lines, despite the aforementioned limitations. Additionally, when compared to the 25 m spacing, the gains in depth of investigation were significantly greater, considering the larger dimensions of the anomalies observed with the 50 m spacing.

4. Results

4.1. Ground Magnetic Data

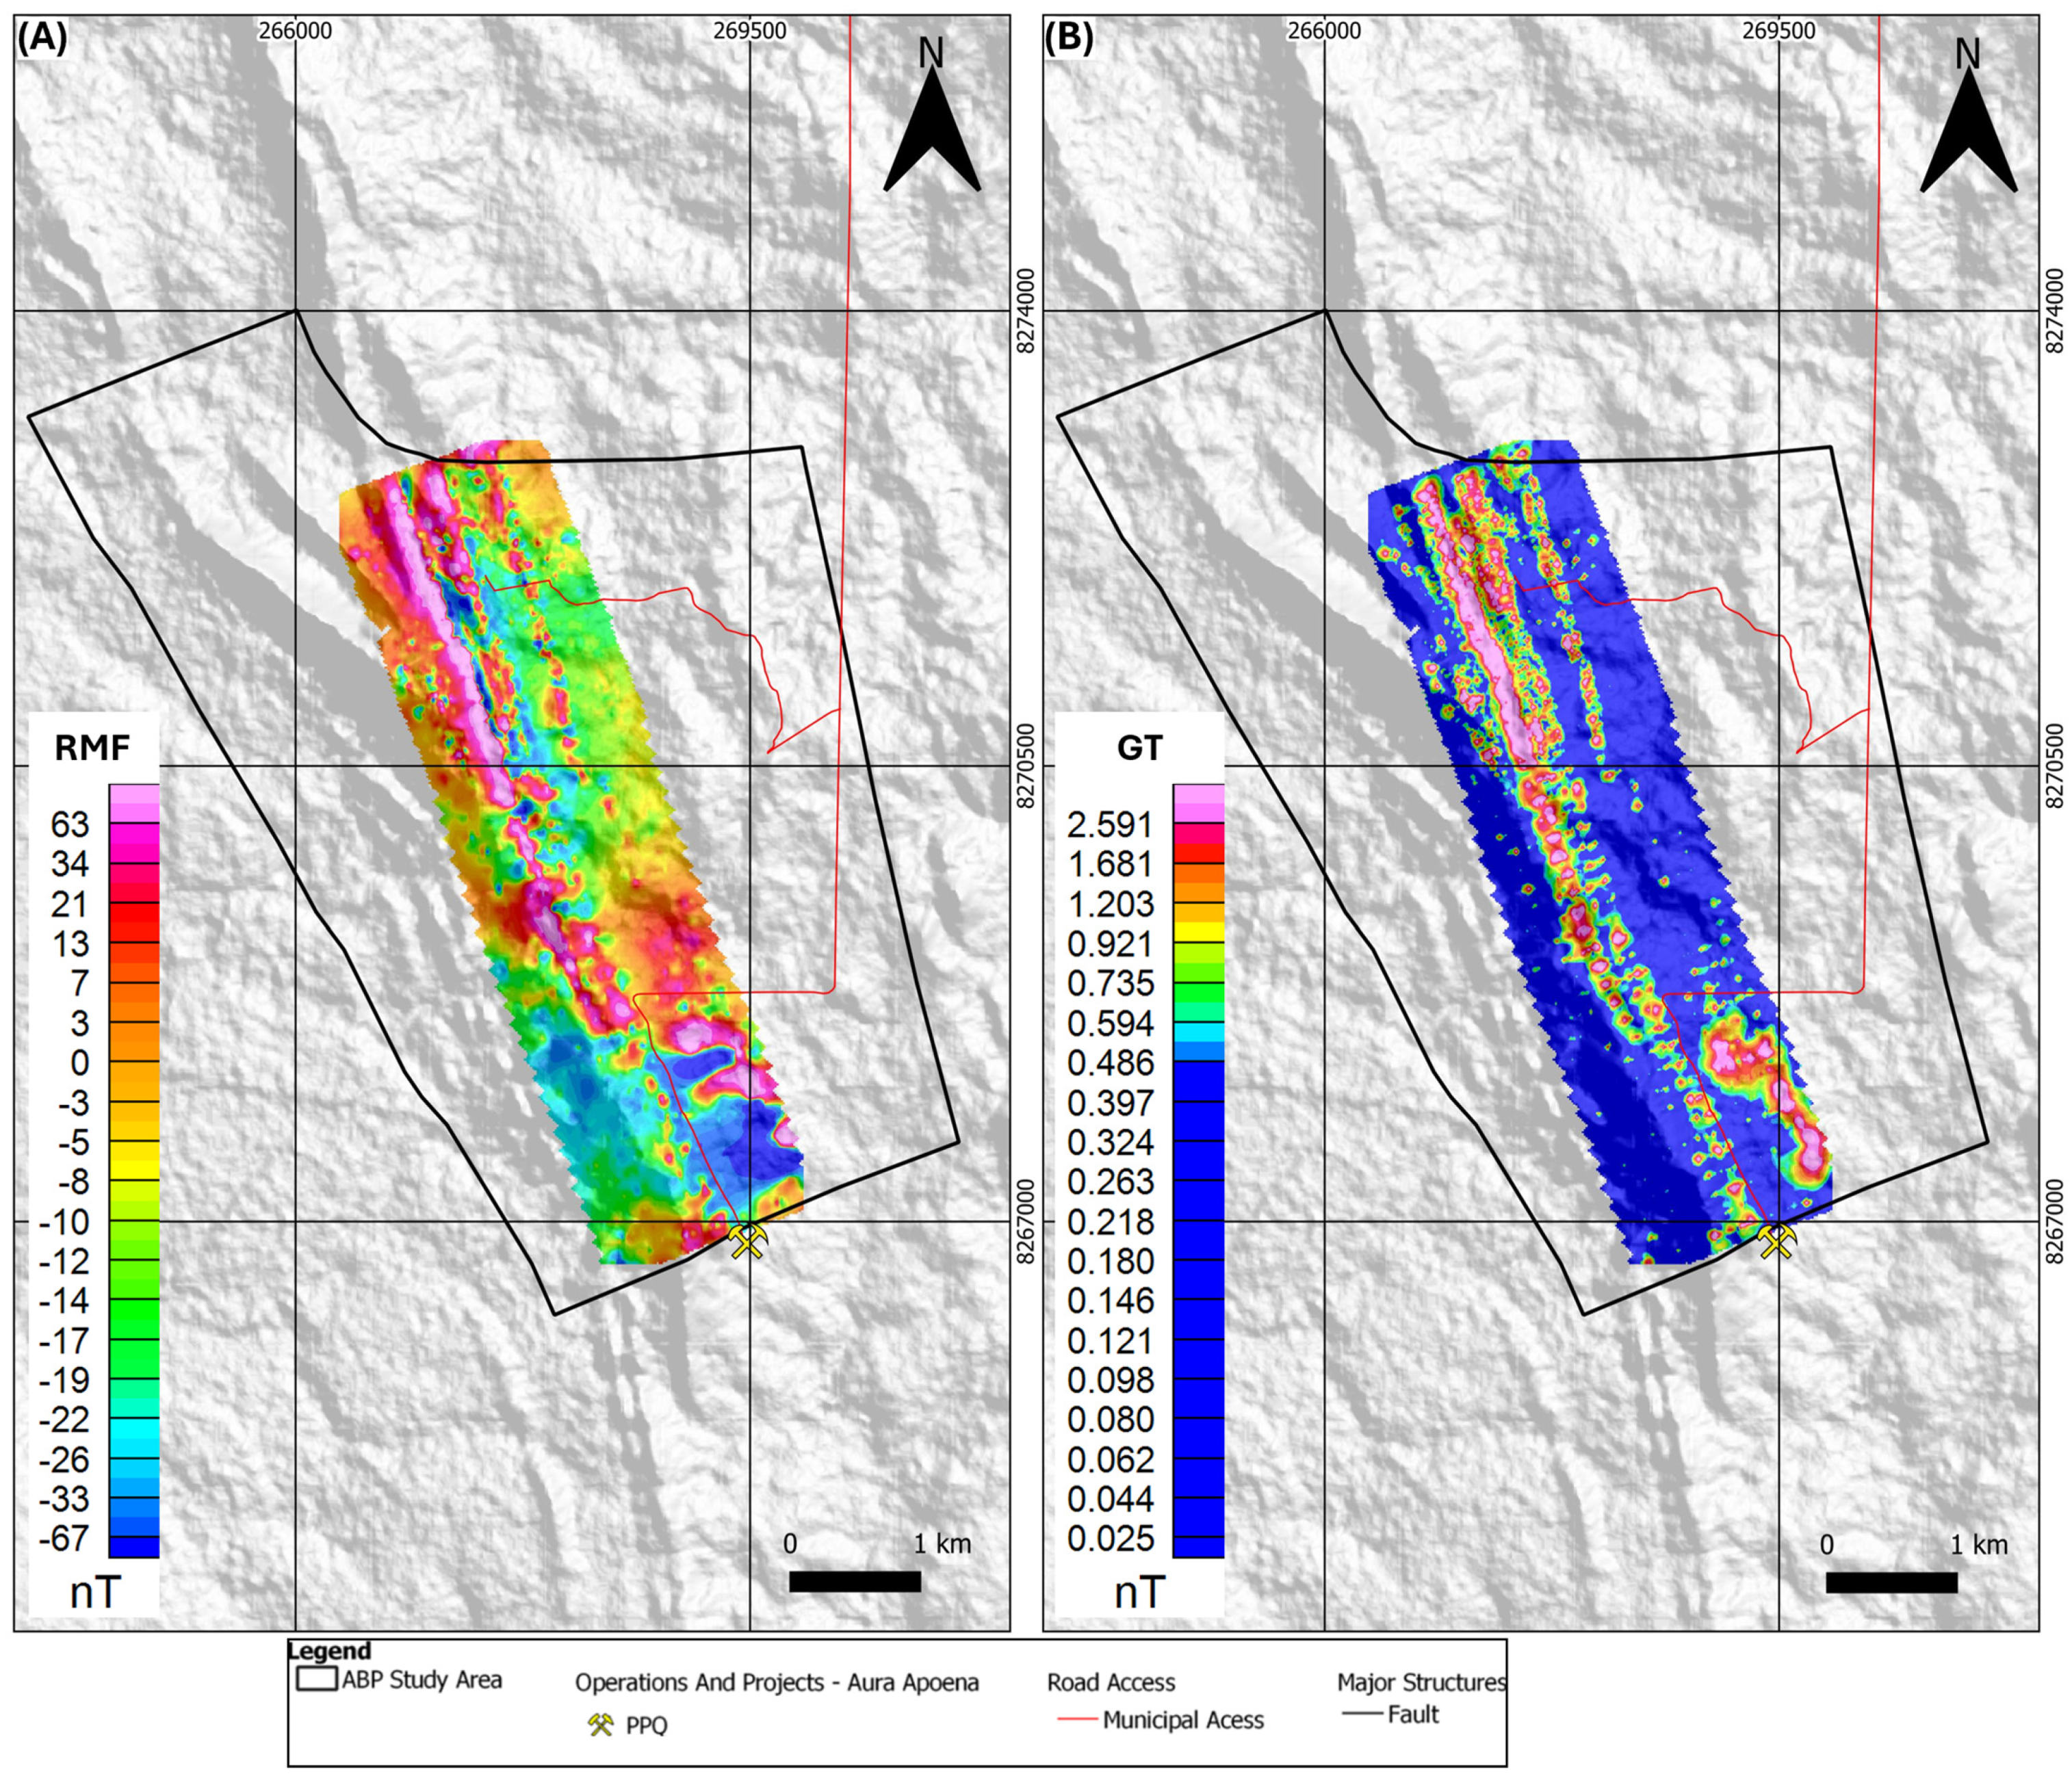
The results of the processing of ground magnetic data are presented in maps of residual magnetic field (RMF) and total gradient (GT), Figure 8A,B, respectively, as well as in 3D inversion models of the magnetic data with the recovery of amplitude value of the magnetic vector inversion, which was realized in VOXI (Oasis Montaj).
The analysis of magnetic anomalies on the map, particularly in the total gradient (GT) map (Figure 8B), reveals a linear pattern intertwined with high-frequency magnetic anomalies (0.594–2.591 nT) oriented along a NNW trend. The highest values, both in the total gradient (GT) (Figure 8B) and in the residual magnetic field (RMF) (Figure 8A), are generally associated with exposures of metasedimentary rocks from the Aguapeí Group (metarenites and metaconglomerates) containing iron oxides (magnetite, hematite and ilmenite), while the porphyritic granite of the Pindaituba Intrusive Suite exhibits low magnetic intensity, which contrasts with the metasedimentary rocks amidst a scenario of field variations.
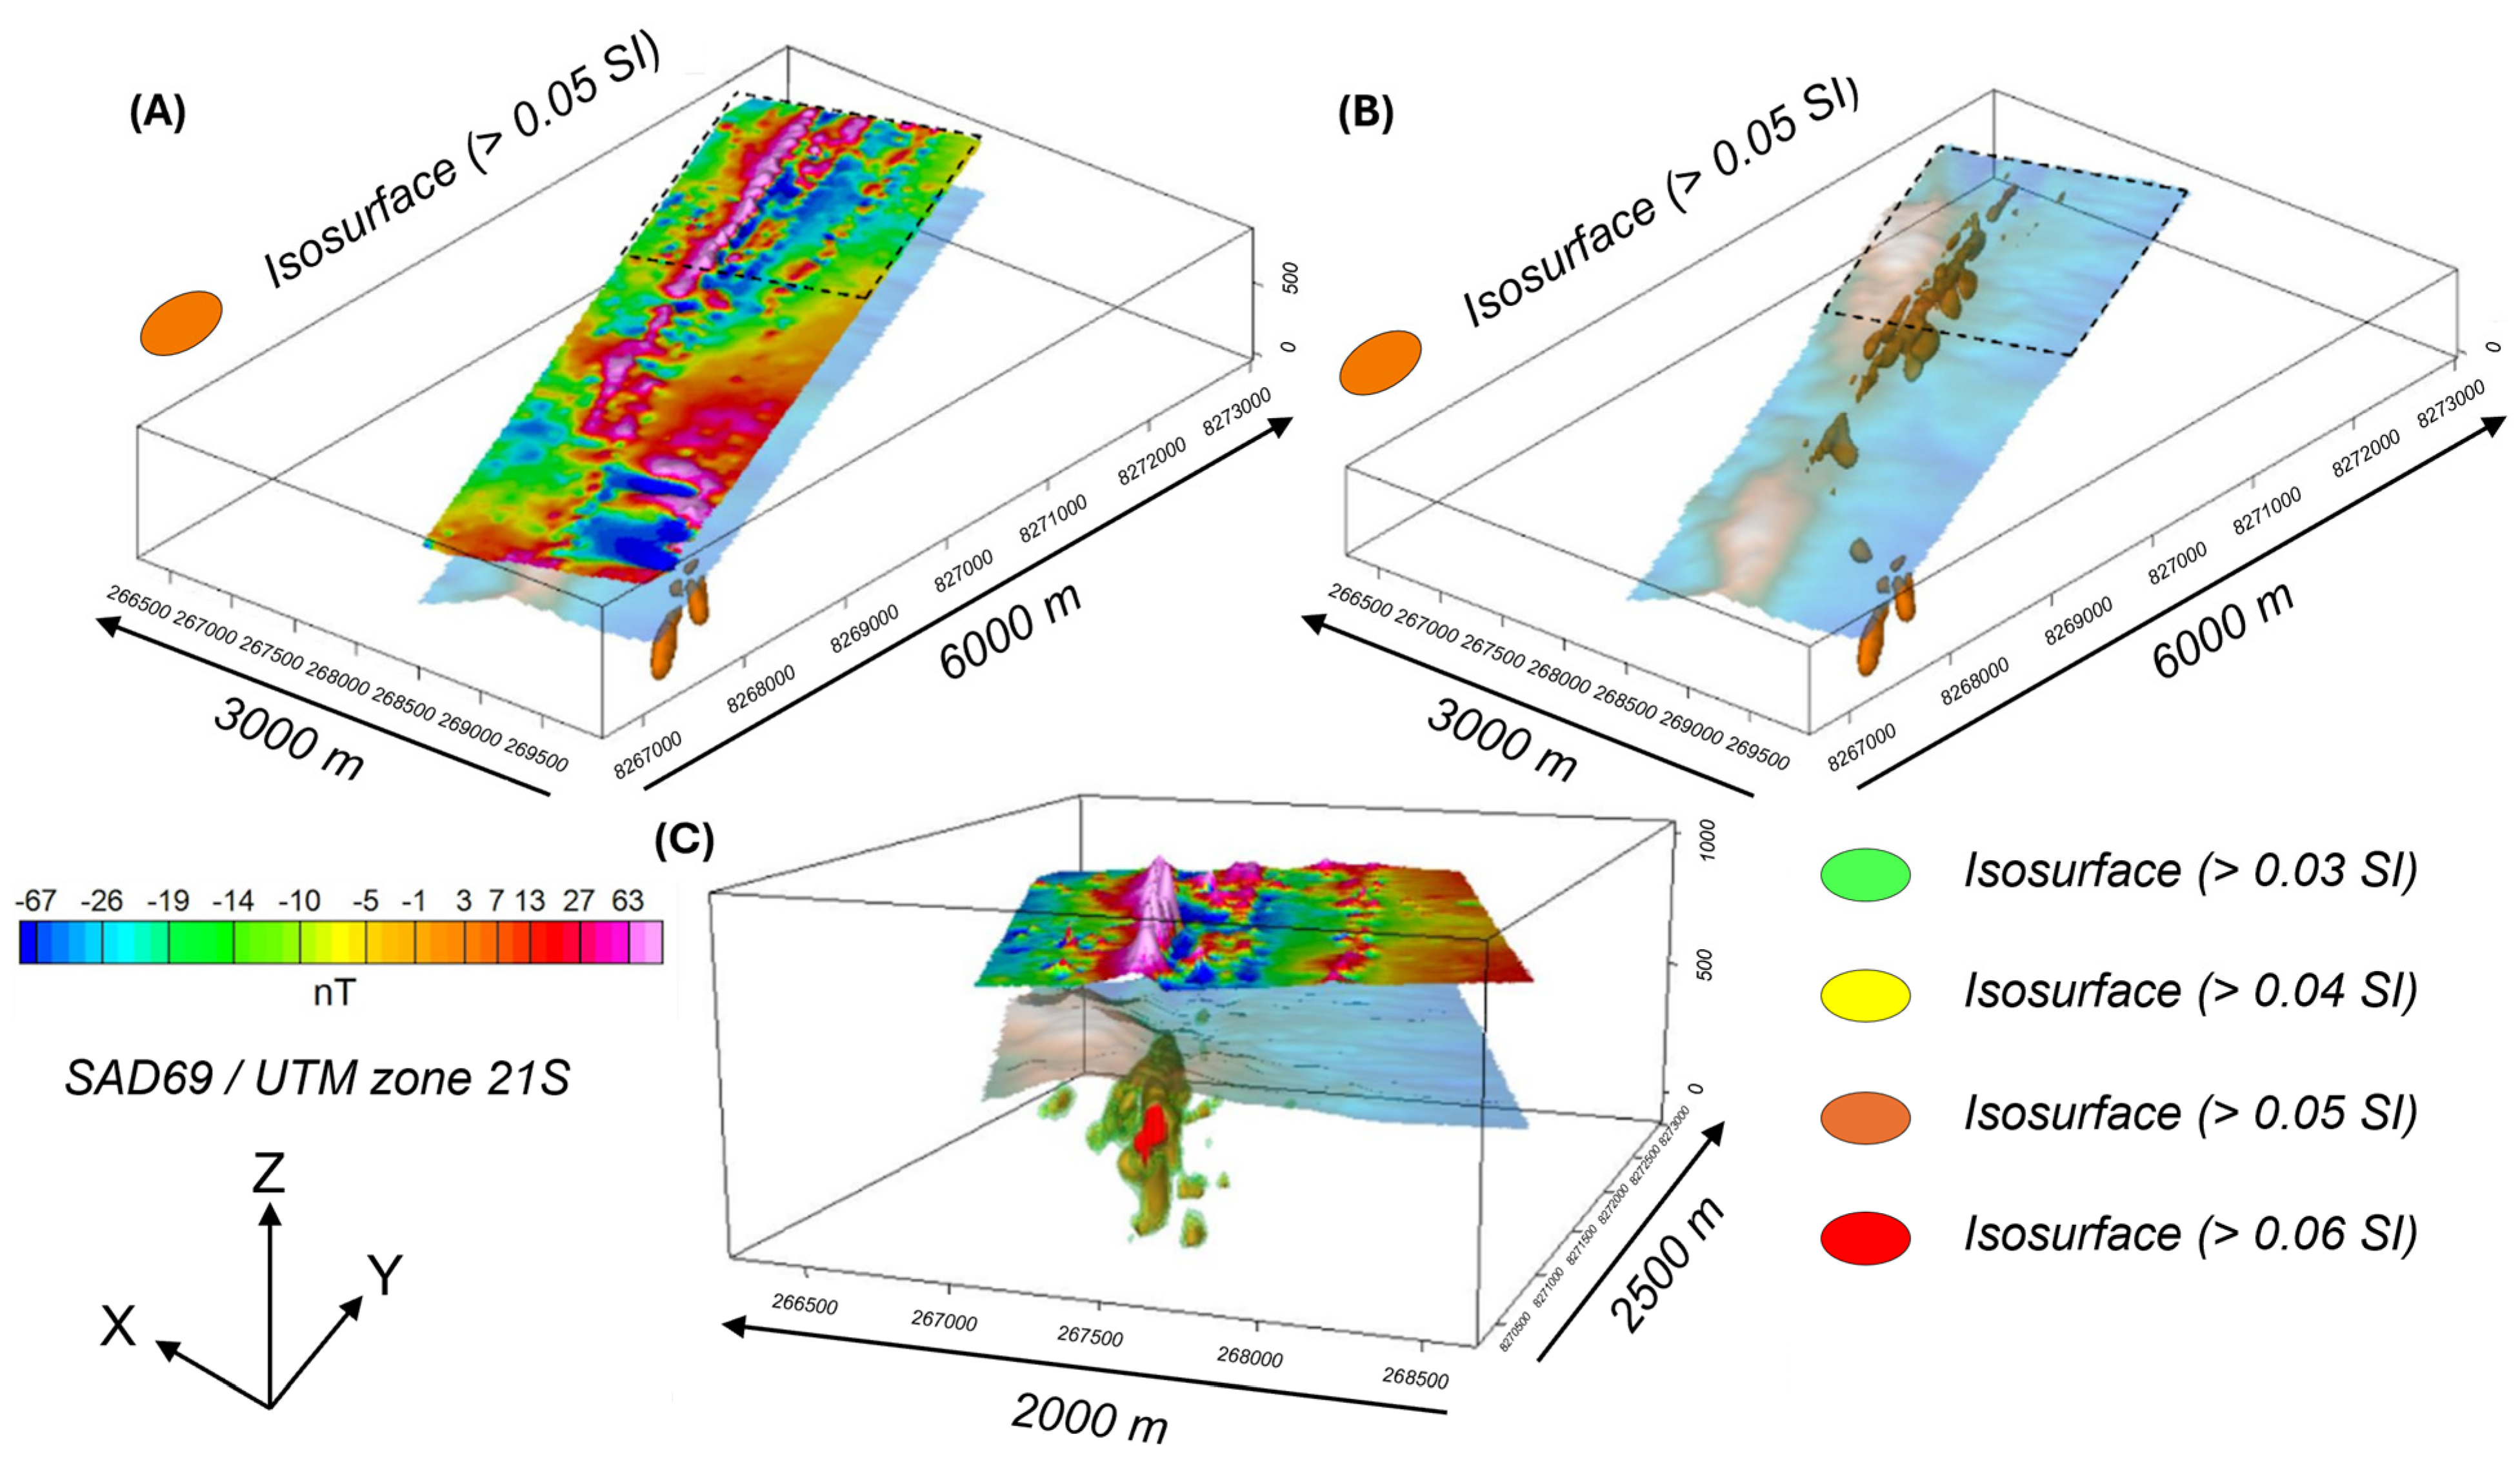
The three-dimensional inversion models (50 × 50 m mesh) of the recovered magnetic bodies (Figure 9) demonstrate that the higher-intensity magnetic anomalies manifest as linear bodies with a NNW trend, which are sub-vertical with a high-angle dip towards the WSW (Figure 9B,C). This pattern is most prominently observed in two regions of the study area: one in the NNW portion, where the most pronounced anomalies are situated, and another in the southeast portion, where a smaller anomaly in terms of area and volume is identified (Figure 9A,B).
In the NNW portion of the study area, a series of open antiforms and synforms with hinge zones oriented in a NNW–SSE direction, folding metasedimentary rocks of the Aguapeí Group are mapped (Figure 5). Regional aeromagnetic surveys ([56,57]) are consistently associated with this orientation pattern and the intensity of total gradient anomalies with the presence of folded Aguapeí Group metasedimentary rocks, especially at the sheared contact between metasediments and basement rocks, typically characterized by subvertical shear zones. In the central–southern part of the belt, these subvertical shear zones host some of the known gold deposits, such as the Pau-a-Pique mine, where mineralized zones are oriented along NNW trends with a dip to the SW.
It is also probable that high RMF and GT values are also observed in some of the gold deposits along the belt due to the presence of some ferromagnetic minerals (magnetite, hematite, ilmenite and minor pyrrhotite), particularly those situated in the contact between the metasediments and the granite or between the metasediments and the metavolcanosedimentary basement, which typically exhibits GT values < 0.594 nT.
The magnetic anomaly in the southeast corner of the map occurs in an area where intrusive rocks from Pindaituba Suite are mapped (Figure 8). These rocks are typically characterized by low GT and RMF values. The anomaly is interpreted as a lithological unit oriented approximately NW–SE, which is not identified in surface exposures and has a magnetic signature distinct from that of the porphyritic granites forming the basement of the area.
Another linear anomaly with a NNW direction, clearly highlighted on the map (GT and RMF) (Figure 8A,B), is observed in the northeastern part of the study area. This anomaly coincides with the presence of oxidized metasediment lenses, tectonically wedged into the porphyritic granite and whose contact is marked by the presence of hydrothermal alteration hosting mineralized zones with grades of up to 8.7 g/t Au (Serrinha occurrence). In this case, both the geological context and the pattern of magnetic anomalies (GT and RMF) are very similar to those observed at the Pau-a-Pique mine with the presence of magnetite, ilmenite, hematite and pyrrhotite locally.
Some shorter-wavelength dipole anomalies are visible in the southwestern portion of the RMF map (Figure 8A) and correspond to exposures of meta volcano–sedimentary sequences from the Rio Alegre Terrane. The absence of reversed polarities in the area indicates that residual effects or demagnetization have had a lesser influence.
The 3D magnetic amplitude data inversion with recovery of magnetic susceptibility bodies demonstrates zones of contrast between positive and negative anomalies, characterized by protrusions and depressions in RMF (Figure 9A), which mark the contact between metasediments and granitic basement. These zones are linked to low magnetic shear zones.
It can also be observed that the recovered values of magnetic susceptibility from positive anomalies often occur at the edges of shear zones related to magnetic hydrothermal alteration in the context and the correspondence of structural attitudes with a southwest dip, as well as the presence of folds associated with the SW–NE thrust.

4.2. Geoelectrical Survey

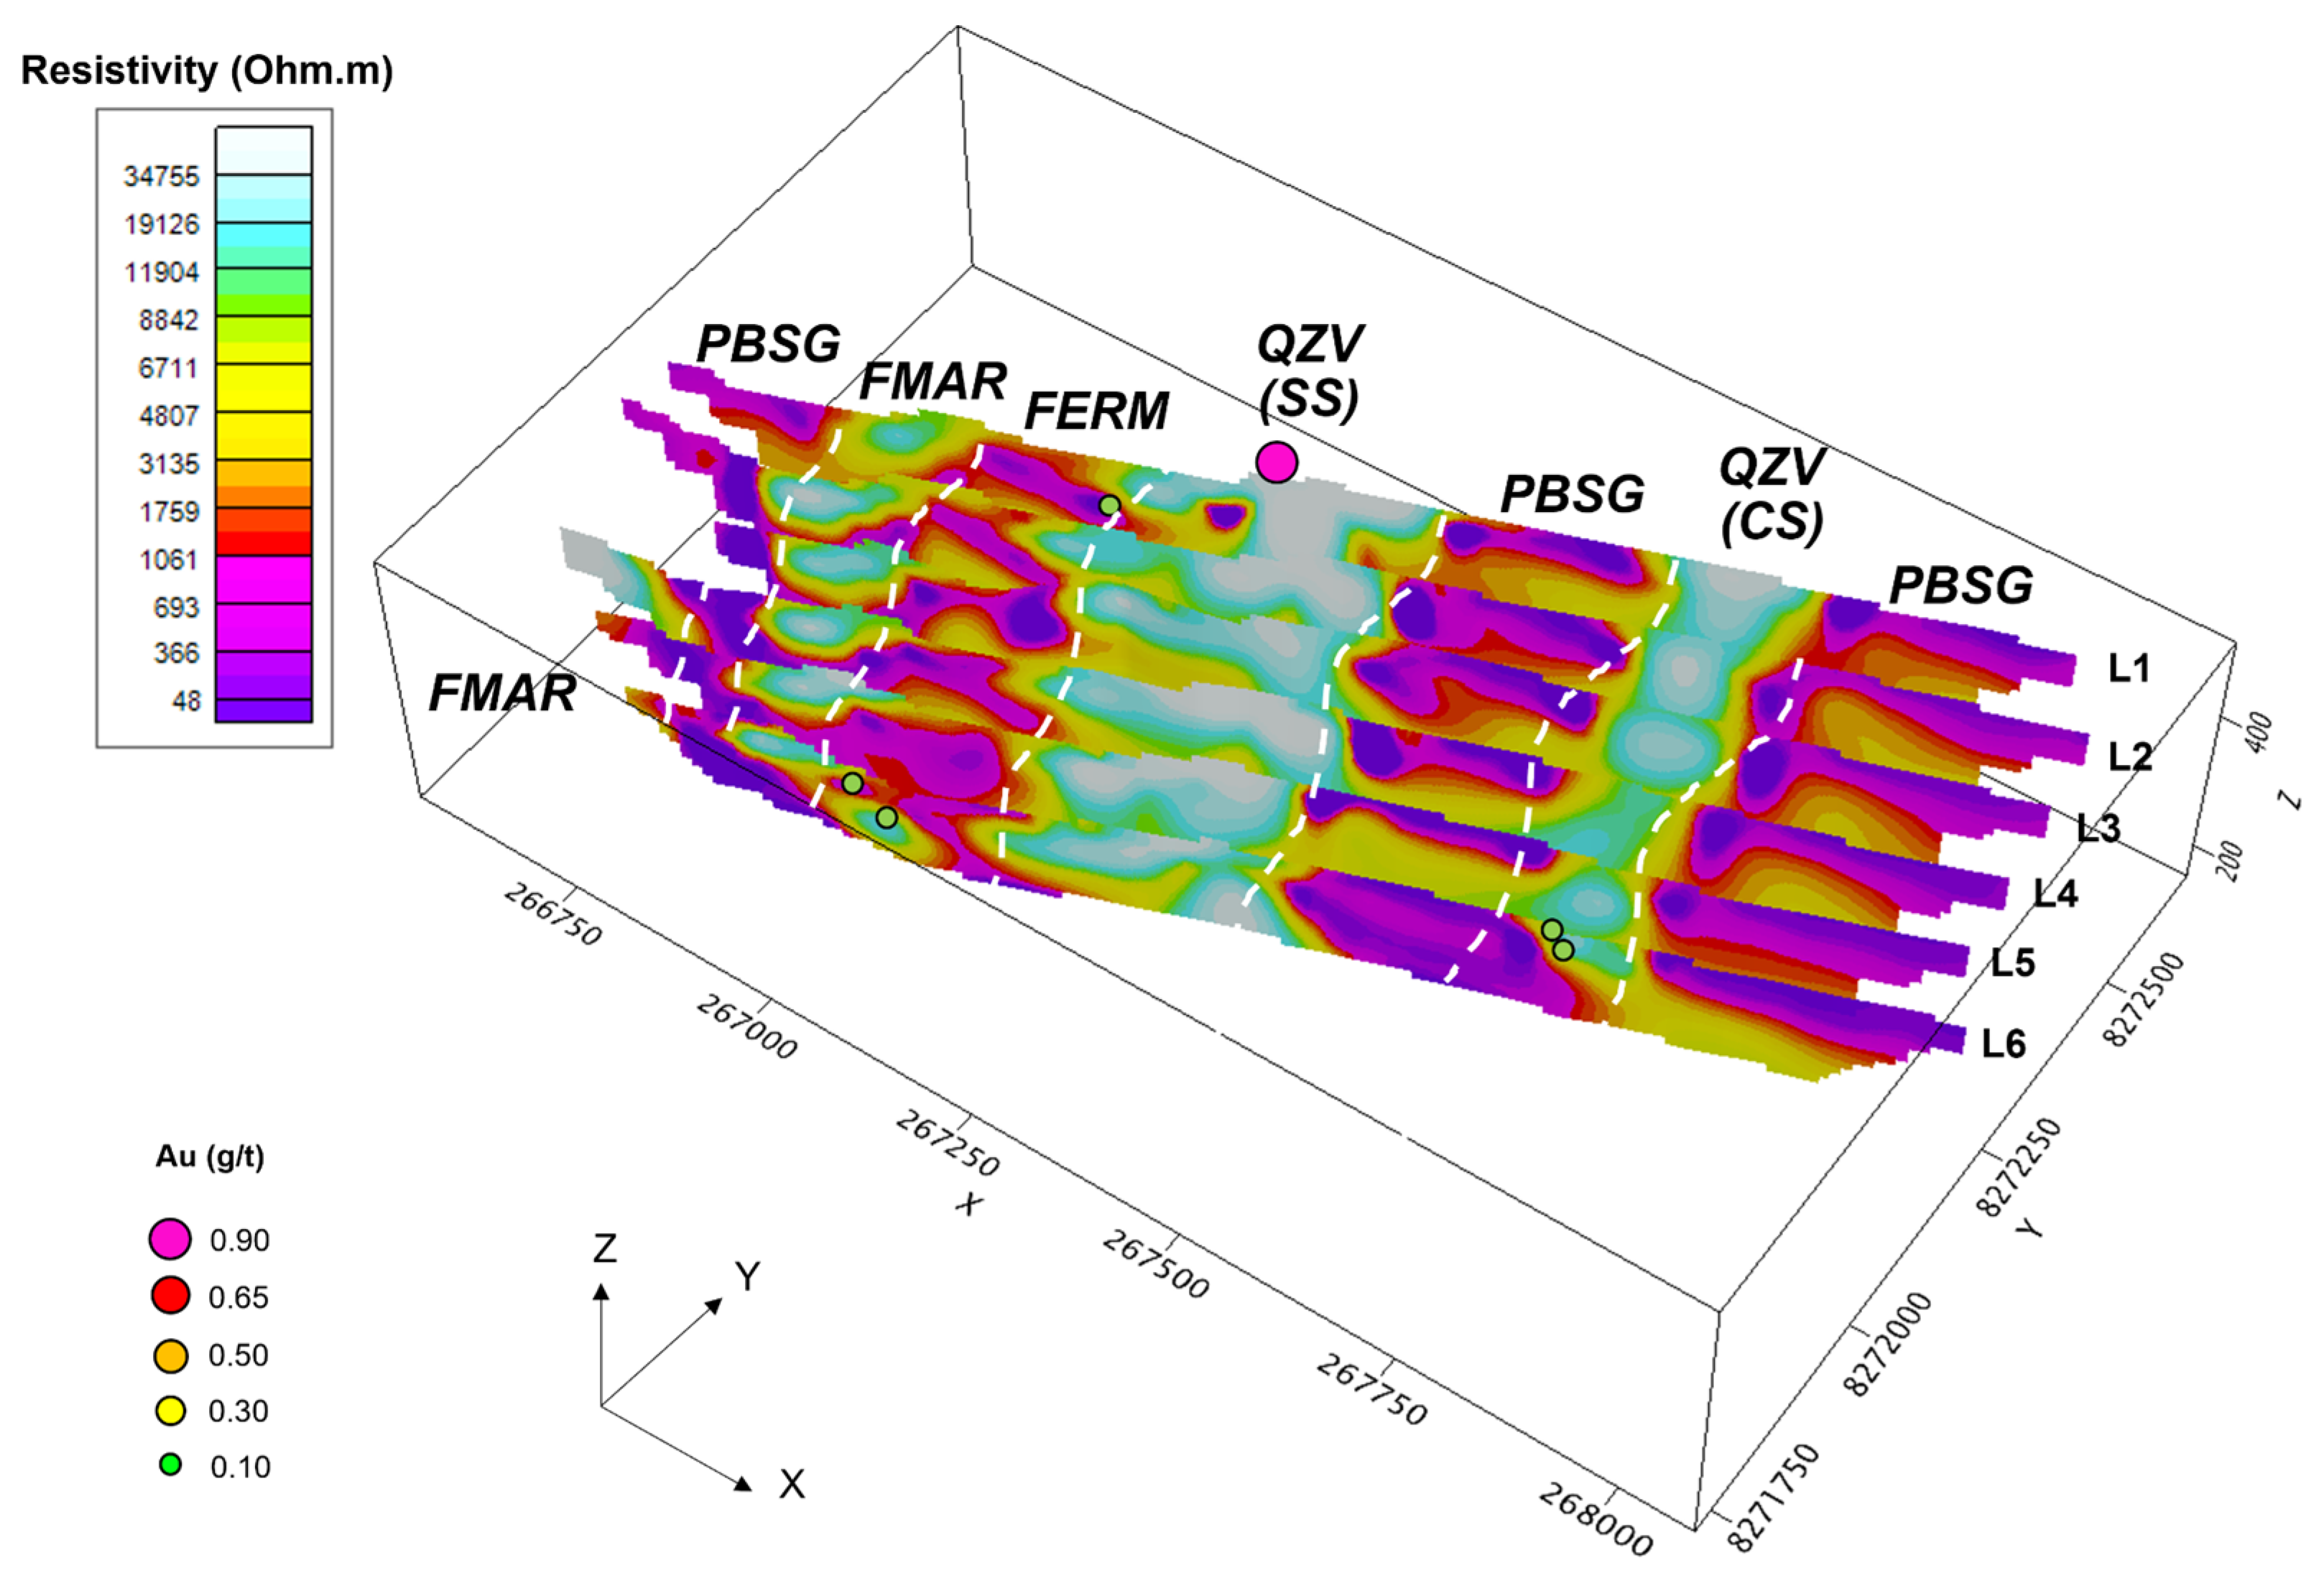
The cross-sectional resistivity (Figure 10) and chargeability (Figure 11) profiles were generated from the induced polarization (IP) surveys performed in the northern part of the area, reaching depths of ~350 m.

4.2.1. Resistivity

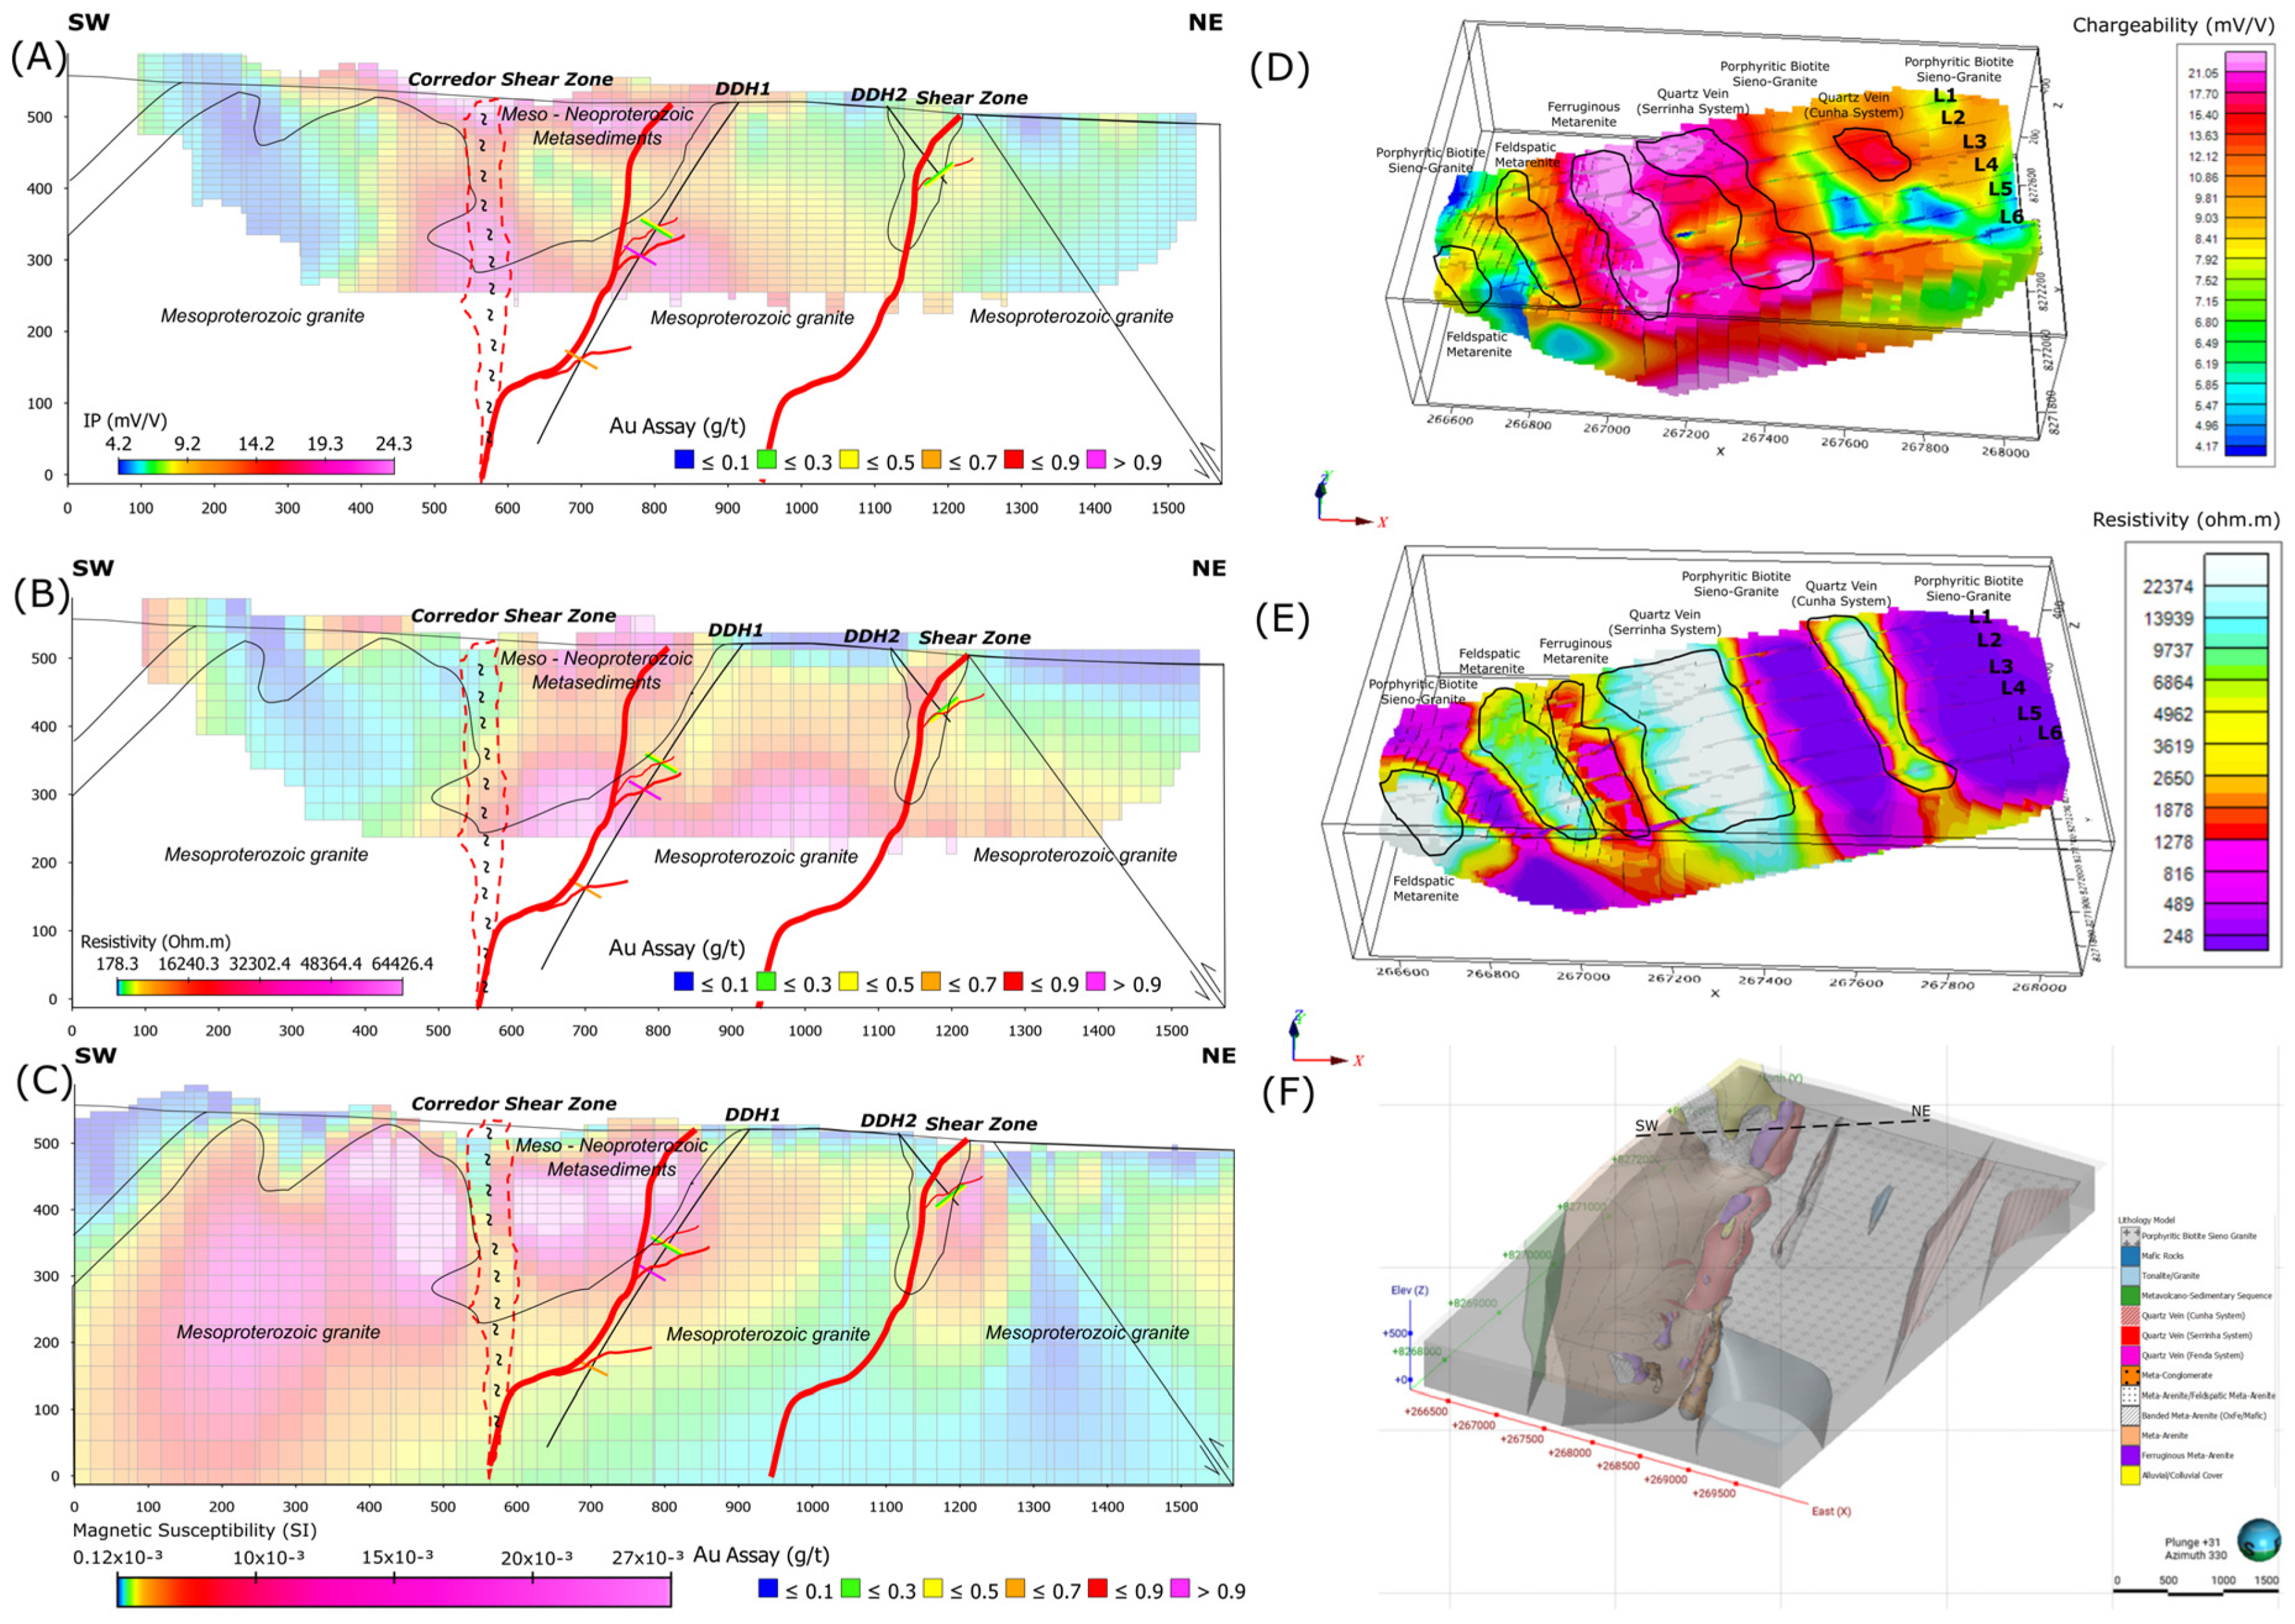
As illustrated in Figure 10, the resistivity exhibits a range of values between 178 and 64,426 ohm.m, encompassing both high and low electrical resistivity regions. The boundaries between these regions are abrupt and sub-vertical, with a NNW–SSE orientation. Correlating the resistivity sections with the geological map (Figure 3) reveals that the regions with lower apparent resistivity background (<16,240 ohm.m) are mainly associated with the occurrence of the porphyritic granite basement or hydrothermally altered metasediments, specifically where hydrothermal alteration is marked primarily by the frequent presence of iron oxides (ferruginous metarenite with magnetite and hematite). Zones of higher electrical resistivity (>16,240 ohm.m) are associated with exposures of metasediments from the Aguapeí Group represented by quartz–feldspar metarenites. These zones also exhibit strong hydrothermal alteration, characterized by the presence of swarms of quartz veins. These regions exhibit the highest gold concentrations within the area.
In the sections of Figure 10 and Figure 12B, a zone of high resistivity with a thickness of approximately 100 m is observed in the eastern portion of the area, with resistivity values ranging from 16,240 to 24,271 ohm.m (Figure 12B). This zone of high resistivity is associated with the presence of metarenites and mylonites (contact zone with basement) with quartz veins + oxidized sulfides + specularite and dissemination of magnetite in the sericitization matrix of the Cunha occurrence. The region between 800 and 1100 m, with an average elevation of 350 m, exhibits elevated resistivity values up to 64,426 ohm.m. These values may represent potential continuations and/or down-dip influences for the metasediment layer of the Cunha System, as well as a portion of the granitic basement with hydrothermal alteration (i.e., silicification).
In the region between 550 and 800 m and average elevations of up to 400 m, the values vary within the range of 16,240–64,426 ohm.m, associated with the Serrinha System, which is defined by metasediments (metarenites/metaconglomerates), with sulfide disseminated in quartz veins and oxidized, sometimes as boxworks associated with specularite + magnetite.
It can be observed that fault structures and shear zones are present between 500 to 600 m and 1250 m (Figure 12), respectively. These are not apparent at the surface, but can be correlated with zones of low resistivity in proximity to intermediate resistivity (i.e., porphyritic granites) and high resistivity (metasediments).

4.2.2. Chargeability

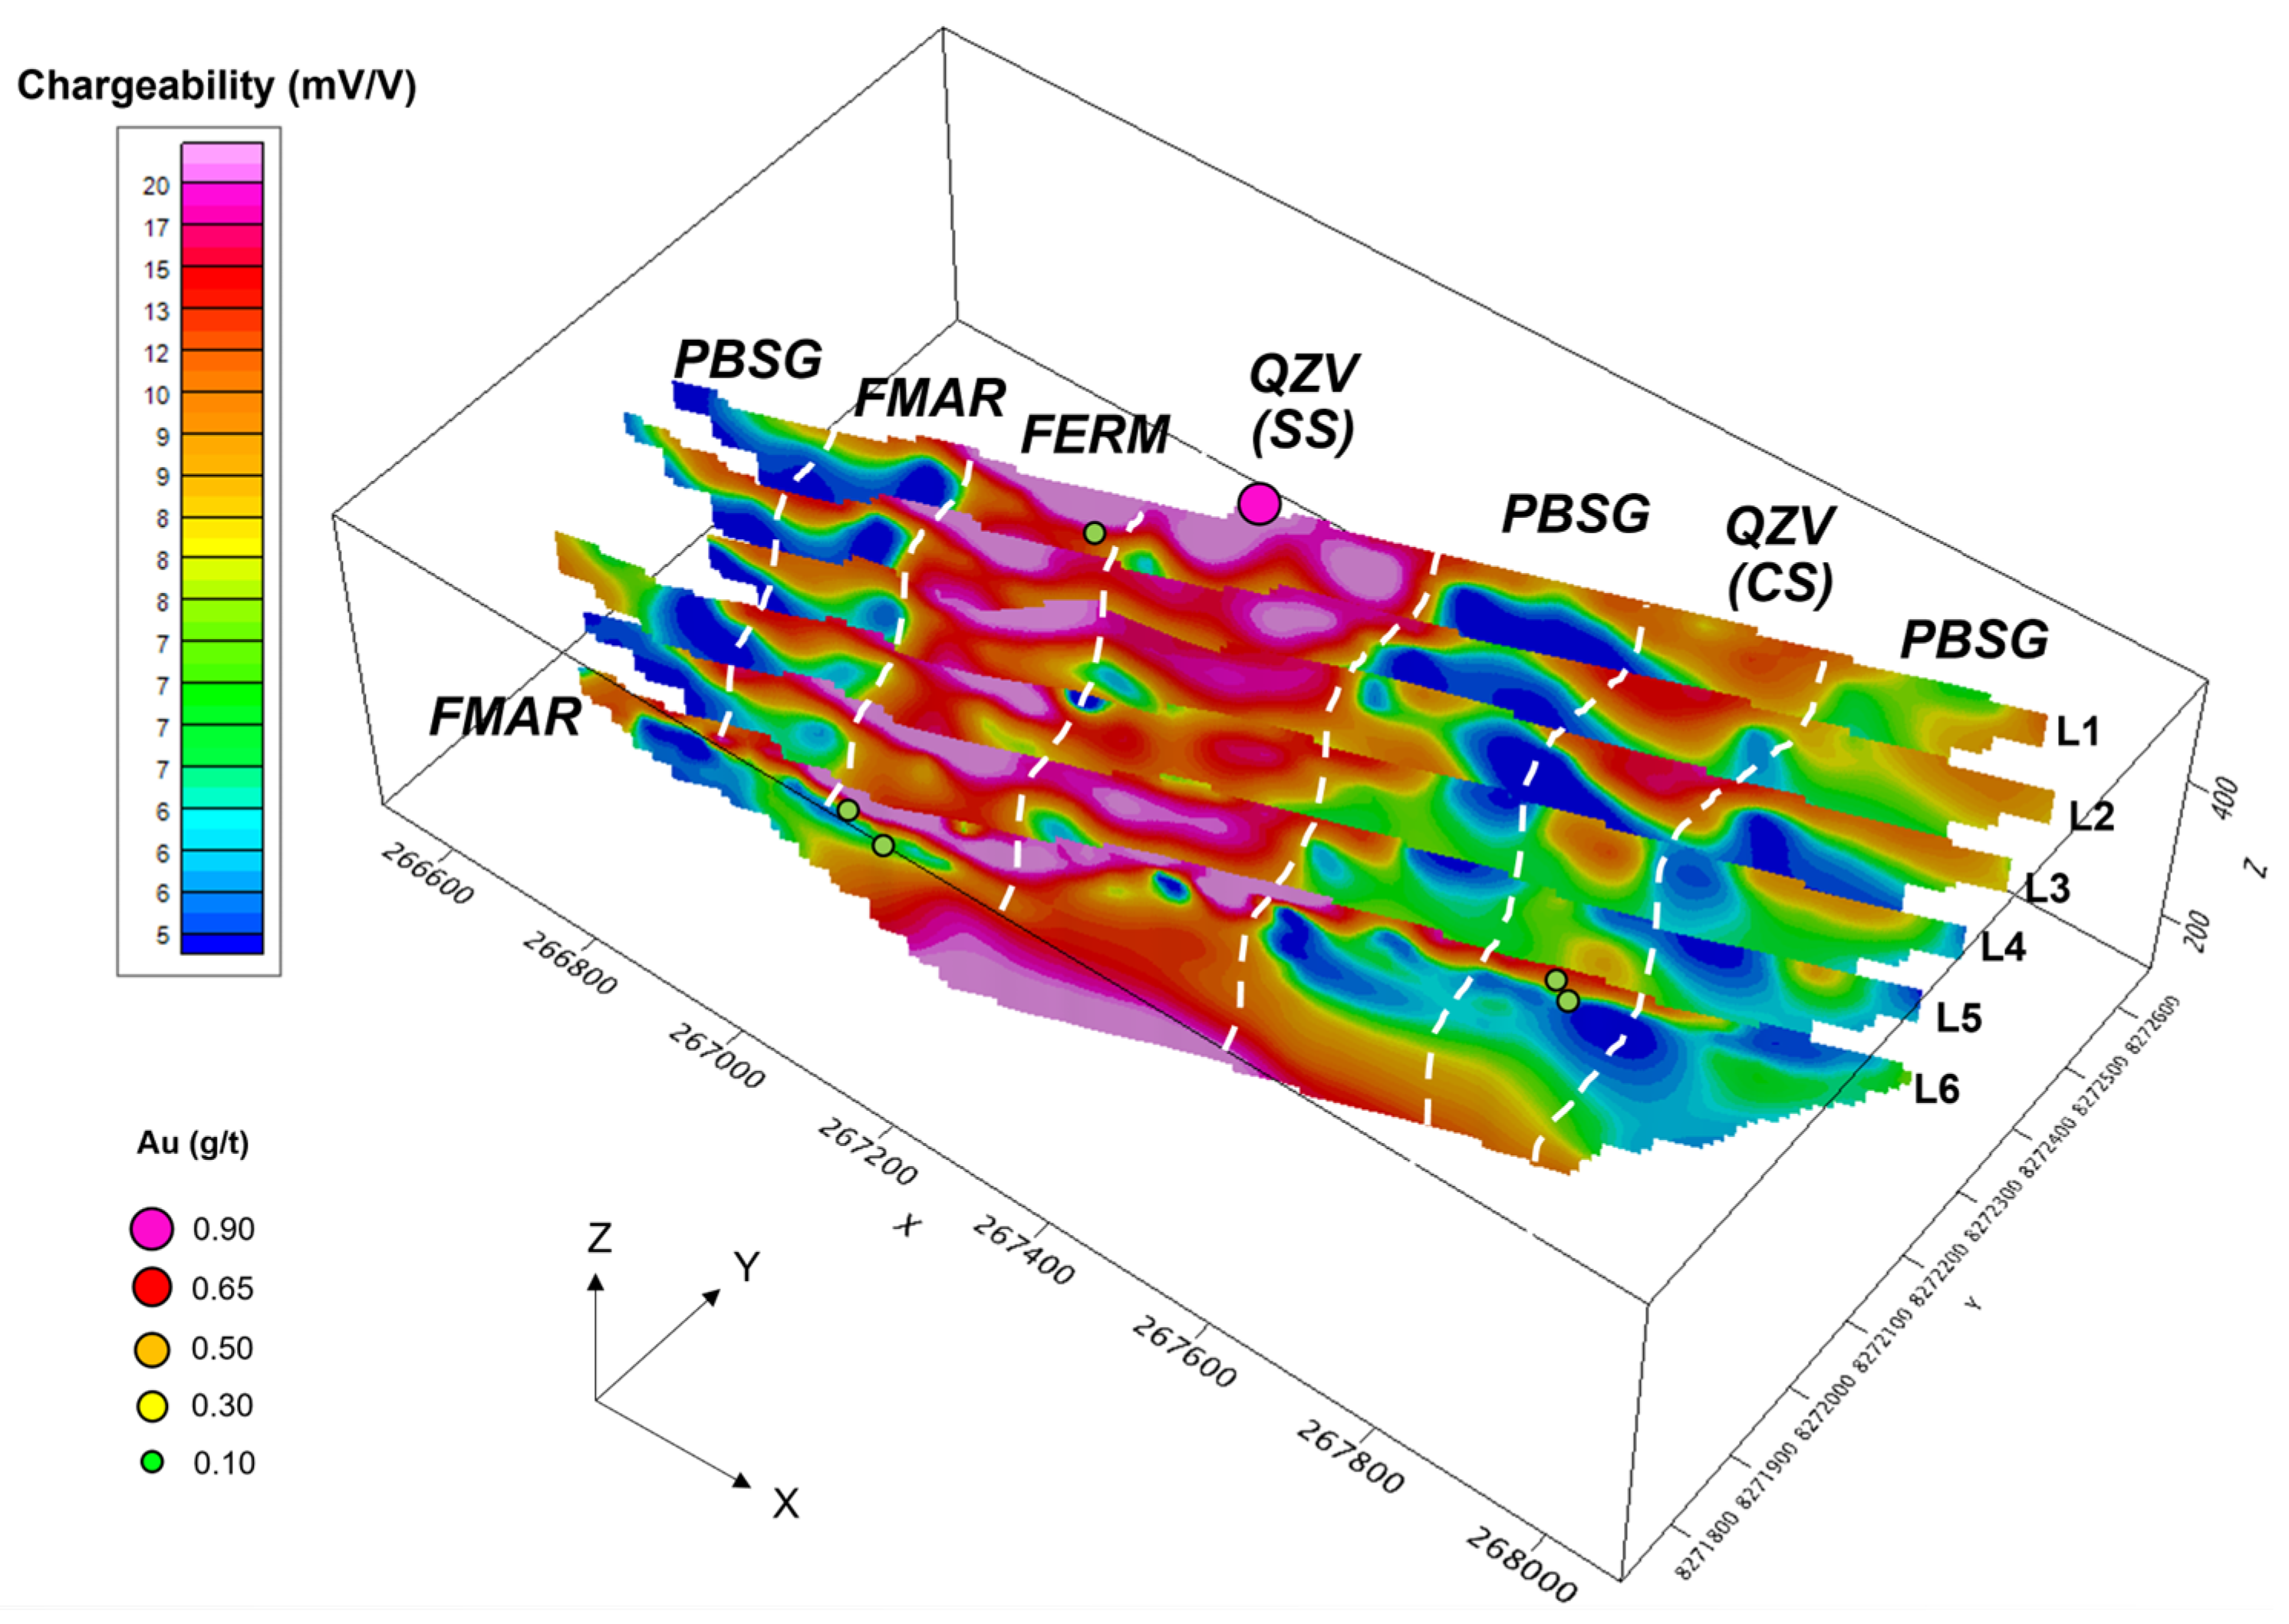
The high chargeability values (>18 mV/V) obtained with the induced polarization method were found to be restricted and only localized in certain sectors (Figure 11 and Figure 12A). This is supported by geochemical rock anomalies with Au grades at the surface (i.e., along the lines) and drill holes.
The maximum values did not exceed 24 mV/V, with the majority located in two areas along the sections: near the Serrinha occurrence (metasediment adjacent to the contact with the basement) and along the “conduit” of the possible extension of the corridor shear zone. The response is situated between 350 to 900 m, initiating its anomaly from the surface to 480 m (Figure 12A). Additionally, between 400 and 250 m (Z-axis) in a tapered aspect, the anomaly appears to follow the morphology of subvertical structures. On the X-axis, at approximately 1200 m, a chargeability of approximately 10 mV/V was observed, with an estimated depth of 100 m. This observation corroborates with the mapped area, where polarizable responses of metasediments with associated pyrite, arranged in the Cunha occurrence, are observed.
Furthermore, in the eastern region adjacent to the Cunha occurrence, approximately 1250 m (X-axis), a structural feature of a fault mapped within the context of the granitic basement is observed. All lines executed, as well as L5 in question, were acquired orthogonally to the target systems in question (Figure 10 and Figure 11) and the polarizable anomalies were restricted to systems of quartz veins with disseminated sulfides. Moreover, anomalies have been identified in the potential extension of the shear zone context. Although the host rock also holds trace Au mineralization (<0.2 g/t) and indications of hydrothermal alterations, including sulfidation, no anomalous signs were detected in these sectors.

5. Discussion

The metallogenic characteristics associated with the deposits of the ABP target and part of the Alto Guaporé Gold Province indicate that these deposits predominantly occur within fault zones that develop along the contacts between metamorphic rocks and granites (as depicted in Figure 8, Figure 9 and Figure 12C). The regions most conductive to gold deposits encompass the extension of the corridor shear zone, specifically during the D3 phase (transpressional) on NE fault planes and intersections of faults with different orientations.
From the inversion of the 3D magnetic data with recovery of the magnetization vector, contrasting zones between positive and negative anomalies can be observed, characterized by protrusions and depressions that mark the contact between metasediments and granitic basement, associated with low magnetic zones. These zones are highly favorable for the identification of deep shear structures that possibly favored the percolation of mineralizing fluids in the area (see Figure 12C). The granite of the Pindaituba Intrusive Suite exhibits low magnetic intensity. In contrast, the metamorphic rocks (metasediments) show high magnetic anomalies (presence of iron oxides such as magnetite and hematite) amidst a field of varying intensity. In addition, it is noteworthy that the values of magnetic susceptibility recovered from positive anomalies often occur at the edges of shear zones related to the magnetic hydrothermal alteration of the context (hematitization and sericitization), corresponding to structural attitudes dipping southwestward, as well as the presence of folds associated with SW–NE thrusting.

5.1. Prospective Geological-Geophysical Model for Gold Deposits in the Alto Guaporé Gold Province

The proposed model for the orogenic gold deposits within the AGGP context refers to the tectono-structural configurations proposed by [2], where mineralization is hosted in large-scale crustal structural corridors and/or faults/shear zones cut by accommodation faults; thrust-related anticlines; irregular contacts on faulted granite margins; and architectures of triple-quadruple points in granitic intrusions. In terms of geophysics, the lithological-structural and ore characteristics were utilized as a priori information to enhance correlation with the structural features of the context. Furthermore, the interaction between magnetic and geoelectric methods served as a mechanism to predict the positions and/or mineralized regions.
Subsequently, an interpretative gold prospecting model was constructed based on the geophysical and geochemical signatures of the area with the objective of identifying the ore bodies. In consideration of the geological and geophysical attributes of exploration line “5” of target ABP, which serves as a representative case within the context under discussion, the prospective geological-geophysical parameters are summarized in (Figure 12 and Figure 13).
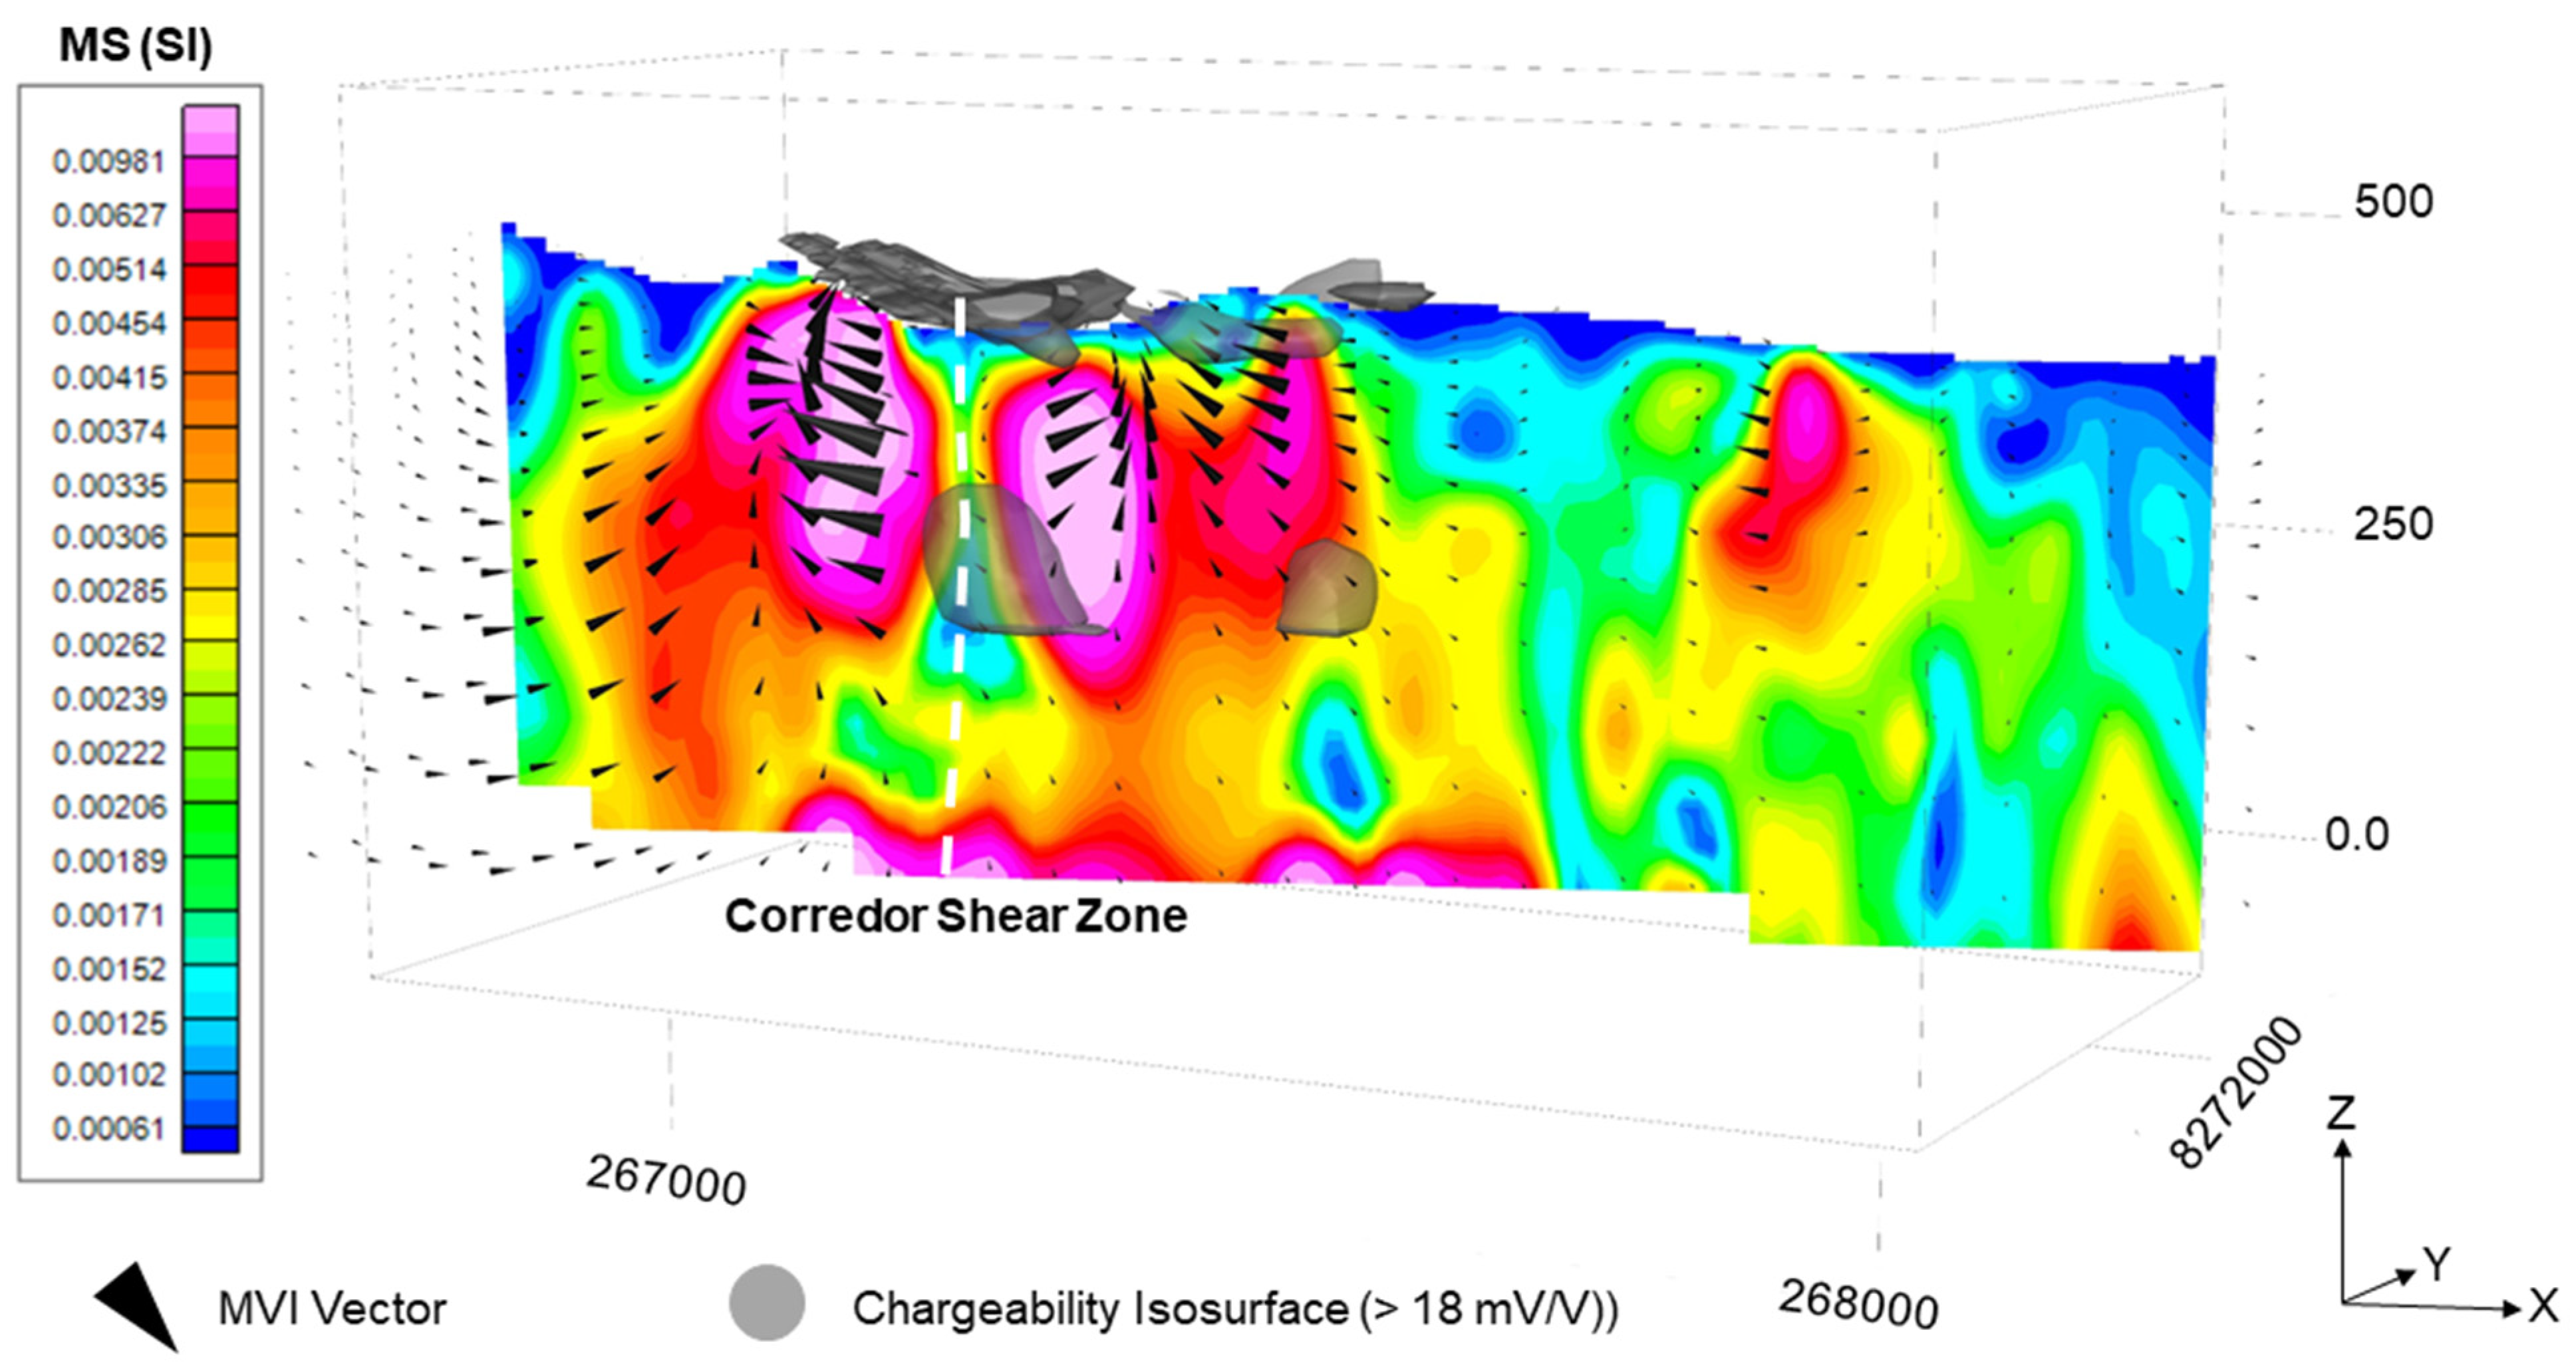
The results of the MVI in the region (Figure 12C and Figure 13) indicate a high degree of relevance. Through correlation with the electrical (resistivity and chargeability) and geological data, it was determined to be an important prospective indicator in AGGP. Firstly, it can be observed that the low magnetic signature of the silicification hydrothermal zone (i.e., between 500 to 600 m in the 2D section) corresponds to the corridor shear zone and behaves similarly to vectors in a magnetic bar, with magnetic induction vectors in opposite directions emanating from the low magnetic zone, as detected by [58]. Secondly, the electrical resistivity values delineate the bodies of metasediment enclosed in the granite with remarkable precision, thereby facilitating the identification of potential milonitic contact zones. Furthermore, the chargeability isosurface generated (Figure 10) indicates that the mineralizing system is continuous, extending both along the shear zone and at the edges of magnetic bodies associated with the contact of metasediments (i.e., oxidized) with the granite basement. This is corroborated by the Au grades evidenced in Figure 12A–C.
In summary, the results of magnetometric and geoelectric inversion suggest a good correlation between polarizable, resistive and low magnetic values with the potential for mineralization of rocks in the AGGP.

5.2. 3D Geological Features

As illustrated in (Figure 12F), the three mineralizing systems previously described in Section 2.1 are evident in the 3D visualization. Additionally, the arrangement of fault systems between the contacts of the metasediment with the granitic basement is observed, where the faults that control the ore exhibit characteristics of sub-vertical surfaces along their NNW–SSE strike. In the northwest portion, a system of folds in the metasediments is displayed, resembling a “chicken’s foot” pattern, which is associated with the closure of the Caldeirão syncline converging with the corridor shear zone (i.e., the main feeder of mineralization throughout the context). The model was generated using surface structural data as well as geological-hydrothermal mapping data (Aura Minerals Inc., internal report 2022) within the Leapfrog Geo software, version 2023.1.1, from Seequent (Bentley Systems).

6. Conclusions

The advancements observed in this study at the district scale in the AGGP were the result of a convergence between technical and scientific developments and previous studies. In this context, potential prospects can be selected based on long-term practical experience and at more regional scales, thereby supporting the application of exploratory tools in the context. Given the structural architecture of the known deposits and mines in the province, a target for detailed geophysical application was selected for the purpose of investigating possible continuities (e.g., strike and depth) of mineralization in shear zones hosted near contacts between the granitic basement of the Pindaituba Intrusive Suite and metasediments of the Aguapeí Group. The establishment and application of a prospective geological–geophysical model can contribute as a guide for future research regarding exploration in the Alto Guaporé Gold Province. The following conclusions were drawn from this study:
The methods and prospective ideals developed are part of traditional superficial and relatively deep prospecting methods. In contrast to gold prospecting in the Alto Guaporé Gold Province, which primarily employs techniques for identifying magnetic anomalies and mapping mineralized structures, the district-scale scope of this study enabled us to delineate the footprints of polarizable and resistive anomalies, as well as their distinctions in magnetic properties. These differences are determined by low magnetic anomalies (e.g., silicified zones), in comparison to mineralized gold zones with the presence of hydrothermal magnetite, as is the case with other targets and/or deposits in the AGGP region. Furthermore, this approach enabled the mapping of potential continuities in ore-controlling fault zone systems in both deep and near-surface areas.
The gold deposits in the Alto Guaporé Gold Province (AGGP) are controlled by large-scale regional faults and shear zones that are associated with the contact between metasedimentary rocks and a granitic basement. The ore shoots in the ABP target area are primarily attributed to deformed zones associated with mylonites and/or schists in structures secondary to the main feeder. The faults that host the ore developed along the contact interfaces between Mesoproterozoic metasedimentary rocks and Mesoproterozoic granites. These exhibit a subvertical metallogenic model that is parallel to the regional structure and has a preferential N20-50W direction. This model offers a promising technical premise, particularly for targets in the southern region of the province.
The indicative footprints in the integrated geological–geophysical prospecting model include a subvertical metallogenic model, low magnetic zones (main conduits), low resistivity and high chargeability in metasediments and contact zones.
The geophysical exploration of gold deposits in the target area demonstrated the feasibility of characterizing and identifying metallogenic footprints and mineralized zones at varying depths between 100 and 350 m, a finding that was subsequently validated through drilling.

Author Contributions

J.E., R.M. and M.L.-S. conceived and designed the research ideas; J.E., T.M., R.M. and M.L.-S. participated in field activities; J.E., T.M. and M.L.-S. conducted data analysis; J.E., R.M., T.M., M.L.-S. and W.B. reviewed and edited the drafts. All authors have read and agreed to the published version of the manuscript.

Funding

This research received no external funding.

Data Availability Statement

The geophysical and geochemical data are confidential.

Acknowledgments

The authors would like to express their gratitude to the “Graduate Program in Applied Geosciences and Geodynamics” for providing the necessary infrastructure (laboratories, study environment and equipment) to conduct this research. Additionally, they extend their appreciation to the Institute of Geosciences at the University of Brasília. Furthermore, the authors would like to express their gratitude to the company “Aura Minerals Inc. (Unit Aura Apoena)” for providing the private data that was acquired and collected by them and for granting the publication of this information as an article.

Conflicts of Interest

The authors declare no conflicts of interest.

References

  1. Groves, D.I.; Santosh, M. Province-scale commonalities of some world-class gold deposits: Implications for mineral exploration. Geosci. Front. 2015, 6, 389–399. [Google Scholar] [CrossRef]
  2. Groves, D.I.; Santosh, M.; Zhang, L. A scale-integrated exploration model for orogenic gold deposits based on a mineral system approach. Geosci. Front. 2020, 11, 719–738. [Google Scholar] [CrossRef]
  3. Roshanravan, B.; Kreuzer, O.P.; Buckingham, A.; Keykhay-Hosseinpoor, M.; Keys, E. Mineral potential modelling of orogenic gold systems in the granites-tanami Orogen, Northern Territory, Australia: A multi-technique approach. Ore Geol. Rev. 2023, 152, 105224. [Google Scholar] [CrossRef]
  4. Costa Neto, M.C. Estudo Da Interação Fluido-Rocha Nos Depósitos Da Lavrinha, Distrito Aurífero de Pontes E Lacerda-MT. Master’s Thesis, Universidade de Campinas (UNICAMP), Campinas, Brazil, 1998. [Google Scholar]
  5. Fernandes, C.J.; Kuyumjian, R.M.; Moura, M.A.; Barboza, E.d.S.; Pulz, M.G. Tipologia dos veios de quartzo e estudo de inclusões fluidas nos depósitos de ouro da Faixa Móvel Aguapeí–Cráton Amazonico–Mina de São Vicente, Região da Lavrinha e Pau-a-Pique. Rev. Bras. Geociências 2006, 36 (Suppl. S1), 59–70. [Google Scholar]
  6. Fernandes, C.J.; Kuyumjian, R.M.; Pulz, G.M.; Geraldes, M.C.; Pinho, F.E.C. Geologia Estrutural e Idade 40Ar/39Ar do depósito Pau a Pique, Faixa Móvel Aguapeí, Sudoeste do estado de Mato Grosso. Rev. Bras. Geociências 2006, 36 (Suppl. S1), 13. [Google Scholar]
  7. Fernandes, C.J.; Pulz, G.M.; Kuyumjian, R.M.; Pinho, F.E.C. Diferenças Entre os Depósitos Auríferos do Grupo Aguapeí (Estado de Mato Grosso) e os Clássicos Exemplos de Ouro em Conglomerados. Pesqui. Em Geociências-UFRGS 2005, 32, 10. [Google Scholar] [CrossRef]
  8. Fernandes, C.J.; Ruiz, A.S.; Kuyumjian, R.M.; Pinho, F.E. Geologia e Controle Estrutural dos Depósitos de Ouro do Grupo Aguapeí-Região da Lavrinha, Sudoeste do Craton Amazônico. Rev. Bras. Geociências 2005, 35, 13–22. [Google Scholar] [CrossRef]
  9. Melo, R.P.d.; Oliveira, M.A.F.d.; Goldfarb, R.J.; Johnson, C.A.; Marsh, E.E.; Xavier, R.P.; de Oliveira, L.R.; Morgan, L.E. Early Neoproterozoic Gold Deposits of the Alto Guaporé Province, Southwestern Amazon Craton, Western Brazil. Econ. Geol. 2022, 117, 127–163. [Google Scholar] [CrossRef]
  10. Scabora, J.A.; Duarte, C.L. A Jazida de Ouro de São Vicente–Município de Nova Lacerda–MT. A Terra Em Rev. 1998, 4, 32–42. [Google Scholar]
  11. Don Mario Reserves/Resources. 2020. Available online: https://www.orvana.com/English/operations/don-mario-district/reserves-resources/default.aspx (accessed on 7 June 2023).
  12. Pinho, F.E.C. The Origin of the Cabacal Cu-Au Deposit, Alto Jauru Greenstone Belt, Brazil. Ph.D. Thesis, The University of Western Ontario, London, ON, Canada, 1996. [Google Scholar]
  13. Pinho, F.E.C.; Fyfe, W.S. Isotopic Studies of the Carbonate Veins of the Cabaçal Mine, Mato Grosso, Brazil. Rev. Bras. De Geociências 1999, 29, 327–330. [Google Scholar] [CrossRef]
  14. Litherland, M.; Annells, R.N.; Darbyshire, D.P.F.; Fletcher, C.J.N.; Hawkins, M.P.; Klinck, B.A.; Mitchell, W.I.; Oconnor, E.A.; Pitfield, P.E.J.; Power, G.; et al. The proterozoic of eastern Bolivia and its relationship to the Andean mobile belt. Precambrian Res. 1989, 43, 157–174. [Google Scholar] [CrossRef]
  15. Litherland, M.; Bloomfield, K. The Proterozoic History of eastern Bolivia. Precambrian Res. 1981, 15, 157–179. [Google Scholar] [CrossRef]
  16. Ruiz, A.S.; Simões, L.S.A.; Araujo, L.M.B.d.; Matos, J.B.d.; Souza, M.Z.A. Cinturão Orogênico Aguapeí (1025-900Ma): Um exemplo de Faixa Móvel Intracontinental no SW do Cráton Amazônico. An. Do XI Simp. Nac. De Estud. Tectonicos 2007, 116–118. [Google Scholar]
  17. Teixeira, W.; Geraldes, M.C.; Matos, R.; Ruiz, A.S.; Saes, G.; Vargas-Mattos, G. A review of the tectonic evolution of the Sunsás belt, SW Amazonian Craton. J. S. Am. Earth Sci. 2010, 29, 47–60. [Google Scholar] [CrossRef]
  18. Melo, R.P.d. Caracterização do metamorfismo da Faixa Móvel Aguapeí e sua relação com a gênese dos depósitos de ouro da região de Pontes e Lacerda-MT. Ph.D. Thesis, Universidade Estadual Paulista, Rio Claro, Brazil, 2016. [Google Scholar]
  19. D’Agrella-Filho, M.S.; Tohver, E.; Santos, J.O.S.; Elming, S.A.; Trindade, R.I.F.; Pacca, I.I.G.; Geraldes, M.C. Direct dating of paleomagnetic results from Precambrian sediments in the Amazon craton: Evidence for Grenvillian emplacement of exotic crust in SE Appalachians of North America. Earth Planet. Sci. Lett. 2008, 267, 188–199. [Google Scholar] [CrossRef]
  20. Geraldes, M.C.; Nogueira, C.; Vargas-Mattos, G.; Matos, R.; Teixeira, W.; Valencia, V.; Ruiz, J. U–Pb detrital zircon ages from the Aguapeí Group (Brazil): Implications for the geological evolution of the SW border of the Amazonian Craton. Precambrian Res. 2014, 244, 306–316. [Google Scholar] [CrossRef]
  21. Leite, J.A.D.; Saes, G.S. Geology of the southern Amazon craton in southwestern Mato Grosso, Brazil: A review. Rev. Bras. De Geociências 2000, 30, 91–94. [Google Scholar] [CrossRef]
  22. Saes, G.S. Evolução Tectônica E Paleogeográfica Do Aulacógeno Aguapeí (1.2–1.0 GA) E Dos Terrenos Do Seu Embasamento NA Porção Sul Do Craton Amazônico. Ph.D. Thesis, Universidade de São Paulo, São Paulo, Brazil, 1999. [Google Scholar]
  23. Saes, G.S.; Leite, J.A.D. Evolução tectono-sedimentar do Grupo Aguapeí, Proterozoico médio na porção meridional do Cráton Amazônico: Mato Grosso e oriente boliviano. Rev. Bras. De Geociências 1993, 23, 31–37. [Google Scholar] [CrossRef]
  24. Rizzotto, G.J.; Santos, J.O.S.; Hartmann, L.A.; Tohver, E.; Pimentel, M.M.; McNaughton, N.J. The Mesoproterozoic Guaporé suture in the SW Amazonian Craton: Geotectonic implications based on field geology, zircon geochronology and Nd–Sr isotope geochemistry. J. S. Am. Earth Sci. 2013, 48, 271–295. [Google Scholar] [CrossRef]
  25. Ruiz, A.S. Evolução Geológica do Sudoeste do Cráton Amazônico Região Limítrofe Brasil Bolívia-Mato Grosso; Tese (Doutorado em Geociências)–Instituto de Geociências e Ciências Exatas, Universidade Estadual Paulista: Rio Claro, Brazil, 2005; 289p. [Google Scholar]
  26. Bettencourt, J.S.; Leite, W.B.; Ruiz, A.S.; Matos, R.; Payolla, B.L.; Tosdal, R.M. The Rondonian-San Ignacio Province in the SW Amazonian Craton: An overview. J. S. Am. Earth Sci. 2010, 29, 28–46. [Google Scholar] [CrossRef]
  27. Menezes, R.G.; Silva, L.C.; Takahashi, A.T.; Lopes, L., Jr.; Bezerra, J.R.L. Folha Pontes e Lacerda, SD.21-Y-C-II; CPRM: Brasília, Brazil, 1993. [Google Scholar]
  28. Mitchinson, D.E. Targeting Archean Orogenic Gold Mineralization Using Physical Properties and Integrated Geophysical Methods. Ph.D. Thesis, University of British Columbia, Vancouver, BC, Canada, 2009. [Google Scholar]
  29. Morais, D.S.F. Estudo da Crosta no Sudoeste do Cráton Amazônico Utilizando Técnicas Sismológicas; Tese (Doutorado em Geociências)–Instituto de Geociências e Ciências Exatas, Universidade Estadual Paulista: Rio Claro, Brazil, 2018; 119p. [Google Scholar]
  30. Aisengart, T.; Barbosa, D.; Pithawala, T.; Pereira, J.; Porto, C.; Ando, J.L.; Rechand, M.; Johnson, A. High resolution inversion of the magnetization vector in the Pontes e Lacerda area of southwestern Mato Grosso, Brazil. J. Geophys. 2017, 38, 159–164. [Google Scholar]
  31. MacKenzie, D.; Craw, D. Geophysical Signals and Exploration for Orogenic Gold on the Low-grade Margins of the Otago Schist. In Proceedings of the Gold’17 Conference, Rotorua, New Zealand, 17 August 2017. Extended Abstracts: 62–65. [Google Scholar]
  32. Niiranen, T.; Nykänen, V.; Lahti, I. Scalability of the Mineral Prospectivity Modelling–An orogenic gold case study from northern Finland. Ore Geol. Rev. 2019, 109, 11–25. [Google Scholar] [CrossRef]
  33. Song, M.; Xue, G.; Liu, H.; Li, Y.; He, C.; Wang, H.; Wang, B.; Song, Y.; Li, S. A Geological Geophysical Prospecting Model for Deep-Seated Gold Deposits in the Jiaodong Peninsula, China. Minerals 2021, 11, 1393. [Google Scholar] [CrossRef]
  34. Adetunji, A.Q.; Launay, G.; Ferguson, I.J.; Simmons, J.M.; Ma, C.; Ayer, J.; Lafrance, B. Crustal conductivity footprint of the orogenic gold district in the Red Lake greenstone belt, western Superior craton, Canada. Geology 2023, 51, 377–382. [Google Scholar] [CrossRef]
  35. Seigel, H.O.; Johnson, I.; Hennessey, J. Different methodology: Geophysical aids to gold exploration. Lead. Edge 1984, 3, 32–35. [Google Scholar] [CrossRef]
  36. Li, Y.; Oldenburg, D.W. 3D inversion of magnetic data. Geophysics 1996, 61, 32–35. [Google Scholar] [CrossRef]
  37. Doyle, H.A. Geophysical exploration for gold—A review. Geophysics 1990, 55, 134–146. [Google Scholar] [CrossRef]
  38. Halloff, P.G.; Yamashita, M. The use of the IP method to locate gold-bearing sulfide mineralization. In Induced Polarization: Applications and Case Histories, Society of Exploration Geophysicists; Fink, J.B., Sternberg, B.K., McAlistar, E.O., Weiduwilt, W.G., Ward, S.H., Eds.; SEG or Society of Exploration Geophysicists: Tulsa, OK, USA, 1990; pp. 227–279. [Google Scholar]
  39. Ribeiro, V.B.; Mantovani, M.S.M.; Louro, V.H.A. Geophysical study of the Sertãozinho, Rio Aguapeí and Nova anomalies (SW of Mato Grosso, Brasil). In Proceedings of the 13th International Congress of the Brazilian Geophysical Society (SBGf), Rio de Janeiro, Brazil, 26–29 August 2013. [Google Scholar]
  40. Cole, K.S.; Cole, R.H. Dispersion and absorption in dielectrics. I. alternating current characteristics. J. Chem. Phys. 1941, 9, 341–351. [Google Scholar] [CrossRef]
  41. Rizzotto, G.J.; Hartmann, L.; Santos, J.O.S.; McNaughton, N. Tectonic evolution of the southern margin of the Amazonian craton in the late Mesoproterozoic based on field relationships and zircon U-Pb geochronology. Ann. Braz. Acad. Sci. 2014, 86, 57–84. [Google Scholar] [CrossRef]
  42. Cordani, U.G.; Teixeira, W. Proterozoic accretionary belts in the Amazonian Craton. In 4-D Framework of Continental Crust: Geological Society of America Memoir 200; Hatcher, R.D., Jr., Carlson, M.P., McBride, J.H., Martínez Catalán, J.R., Eds.; 2007; pp. 297–320. Available online: https://www.researchgate.net/publication/236016478_Proterozoic_accretionary_belts_in_the_Amazonian_Craton (accessed on 21 January 2024).
  43. Schobbenhaus, C.; Bellizzia, G. Geologic map of South America. 2001. Available online: http://rigeo.cprm.gov.br/jspui/handle/doc/2542 (accessed on 12 November 2023).
  44. Tassinari, C.G.; Macambira, M.J.B. Geochronological provinces of the Amazonian Craton. Episodes 1999, 22, 174–182. [Google Scholar] [CrossRef]
  45. Litherland, M. Mapa Geológico del Área del Proyecto Precámbrico (1976–1983), 1:1,000,000 Map Sheet. Br. Geol. Surv. 1984. Available online: https://colecoes.igc.usp.br/colecao/mapoteca/bolivia-mapa-geologico-del-area-del-proyecto-precambrico-1976-83 (accessed on 12 November 2023).
  46. Rizzotto, G.J. Petrologia e Geotectônica do Grupo Nova Brasilândia, Rondônia. Master’s Thesis, Federal University of Rio Grande do Sul, Porto Alegre, Brasil, 1999. [Google Scholar]
  47. Souza, E.P.; Hildred, P.R. Contribuição ao estudo da geologia do Grupo Aguapeí, oeste de Mato Grosso Congresso Brasileiro de Geologia. Camboriú Soc. Bras. De Geol. 1980, 2, 813–825. [Google Scholar]
  48. Matos, J.B.D.; Schorscher, J.H.D.; Geraldes, M.C.; Souza, M.Z.A.D.; Ruiz, A.S. Petrografia, Geoquímica e Geocronologia das Rochas do Orógeno Rio Alegre, Mato Grosso: Um Registro de Crosta Oceânica Mesoproterozóica no SW do Cráton Amazônico. Rev. Inst. Geociências-USP 2004, 4, 75–90. [Google Scholar] [CrossRef]
  49. Pulz, G.M.; Barbosa, E.S.; Pinho, F.E.C.; Ronchi, L.H.; Jelinek, A.R.; Duarte, L.d.C. Inclusiones fluidas en venas auríferas del yacimiento Pau-a-Pique, suroeste del craton Amazónico, Brasil. Boletín De La Soc. Española De Mineral. 2003, 26, 79–92. [Google Scholar]
  50. Geraldes, M.C.; Van Schmus, W.R.; Condie, K.C.; Bell, S.; Teixeira, W.; Babinski, M. Proterozoic geologic evolution of the SW part of the Amazonian craton in Mato Grosso state, Brazil. Precambrian Res. 2001, 111, 91–128. [Google Scholar] [CrossRef]
  51. Cezar, P.A. Caracterização Deformacional e Metamórfica do Cinturão Móvel Aguapeí nas Serras do Caramujo e Salto do Aguapeí-SW de Mato Grosso; Undergraduate Report; Universidade Estadual Paulista: Rio Claro, Brazil, 2004; 117p. [Google Scholar]
  52. Fernandes, C.J.; Pulz, G.M.; Oliveira, A.S.; Cunha, M.C.L.; Barbosa, E.S.; Pinho, F.E.; Quadros, A.P. Diferenças químicas e texturais entre os veios de quartzo férteis e estéreis no depósito Pau-a-Pique. Pesqui. Em Geociências 1999, 26, 91–101. [Google Scholar] [CrossRef]
  53. Baia, F.H. Caracterização Litológica e Estrutural da Área “Cava Principal”, Alvo Aurífero Pau-a-Pique, na Faixa Aguapeí, Pontes e Lacerda-MT; Undergraduate Report; Universidade Estadual Paulista: Rio Claro, Brazil, 2007; 62p. [Google Scholar]
  54. Available online: https://my.seequent.com/products/oasis-montaj/oasis-montaj-2022-1 (accessed on 17 September 2022).
  55. Sasaki, Y. Resolution of Resistivity Tomography Inferred from Numerical Simulation. Geophys. Prospect. 1992, 40, 453–464. [Google Scholar] [CrossRef]
  56. Folha SD.21-Y-C-II-Sinal Analítico. 2008. Projeto Aerogeofísico Mato Grosso-Área 2. Programa Geologia do Brasil (PGB) Consórcio Lasa Engenharia e Prospecções S.A./Prospectors Aerolevantamentos e Sistemas Ltd.a. Serviço Geológico do Brasil. Available online: https://rigeo.sgb.gov.br/handle/doc/10497 (accessed on 12 November 2023).
  57. Folha SD.21-Y-C-V-Sinal Analítico. 2008. Projeto Aerogeofísico Mato Grosso-Área 2. Programa Geologia do Brasil (PGB) Consórcio Lasa Engenharia e Prospecções S.A./Prospectors Aerolevantamentos e Sistemas Ltd.a. Serviço Geológico do Brasil. Available online: https://rigeo.sgb.gov.br/handle/doc/10497 (accessed on 12 November 2023).
  58. Mendes, T.L.; Leão-Santos, M.H.; Tabosa, L.F.C.; Borges, W.R.; dos Santos Alves, C.; de Freitas Suita, M.T. Airborne geophysics, petrophysics, geochemistry and geology of Ni-Cu (Co-Au-PGE) footprints to define exploration targets in mafic-ultramafic rocks. J. S. Am. Earth Sci. 2024, 133, 104716. [Google Scholar] [CrossRef]
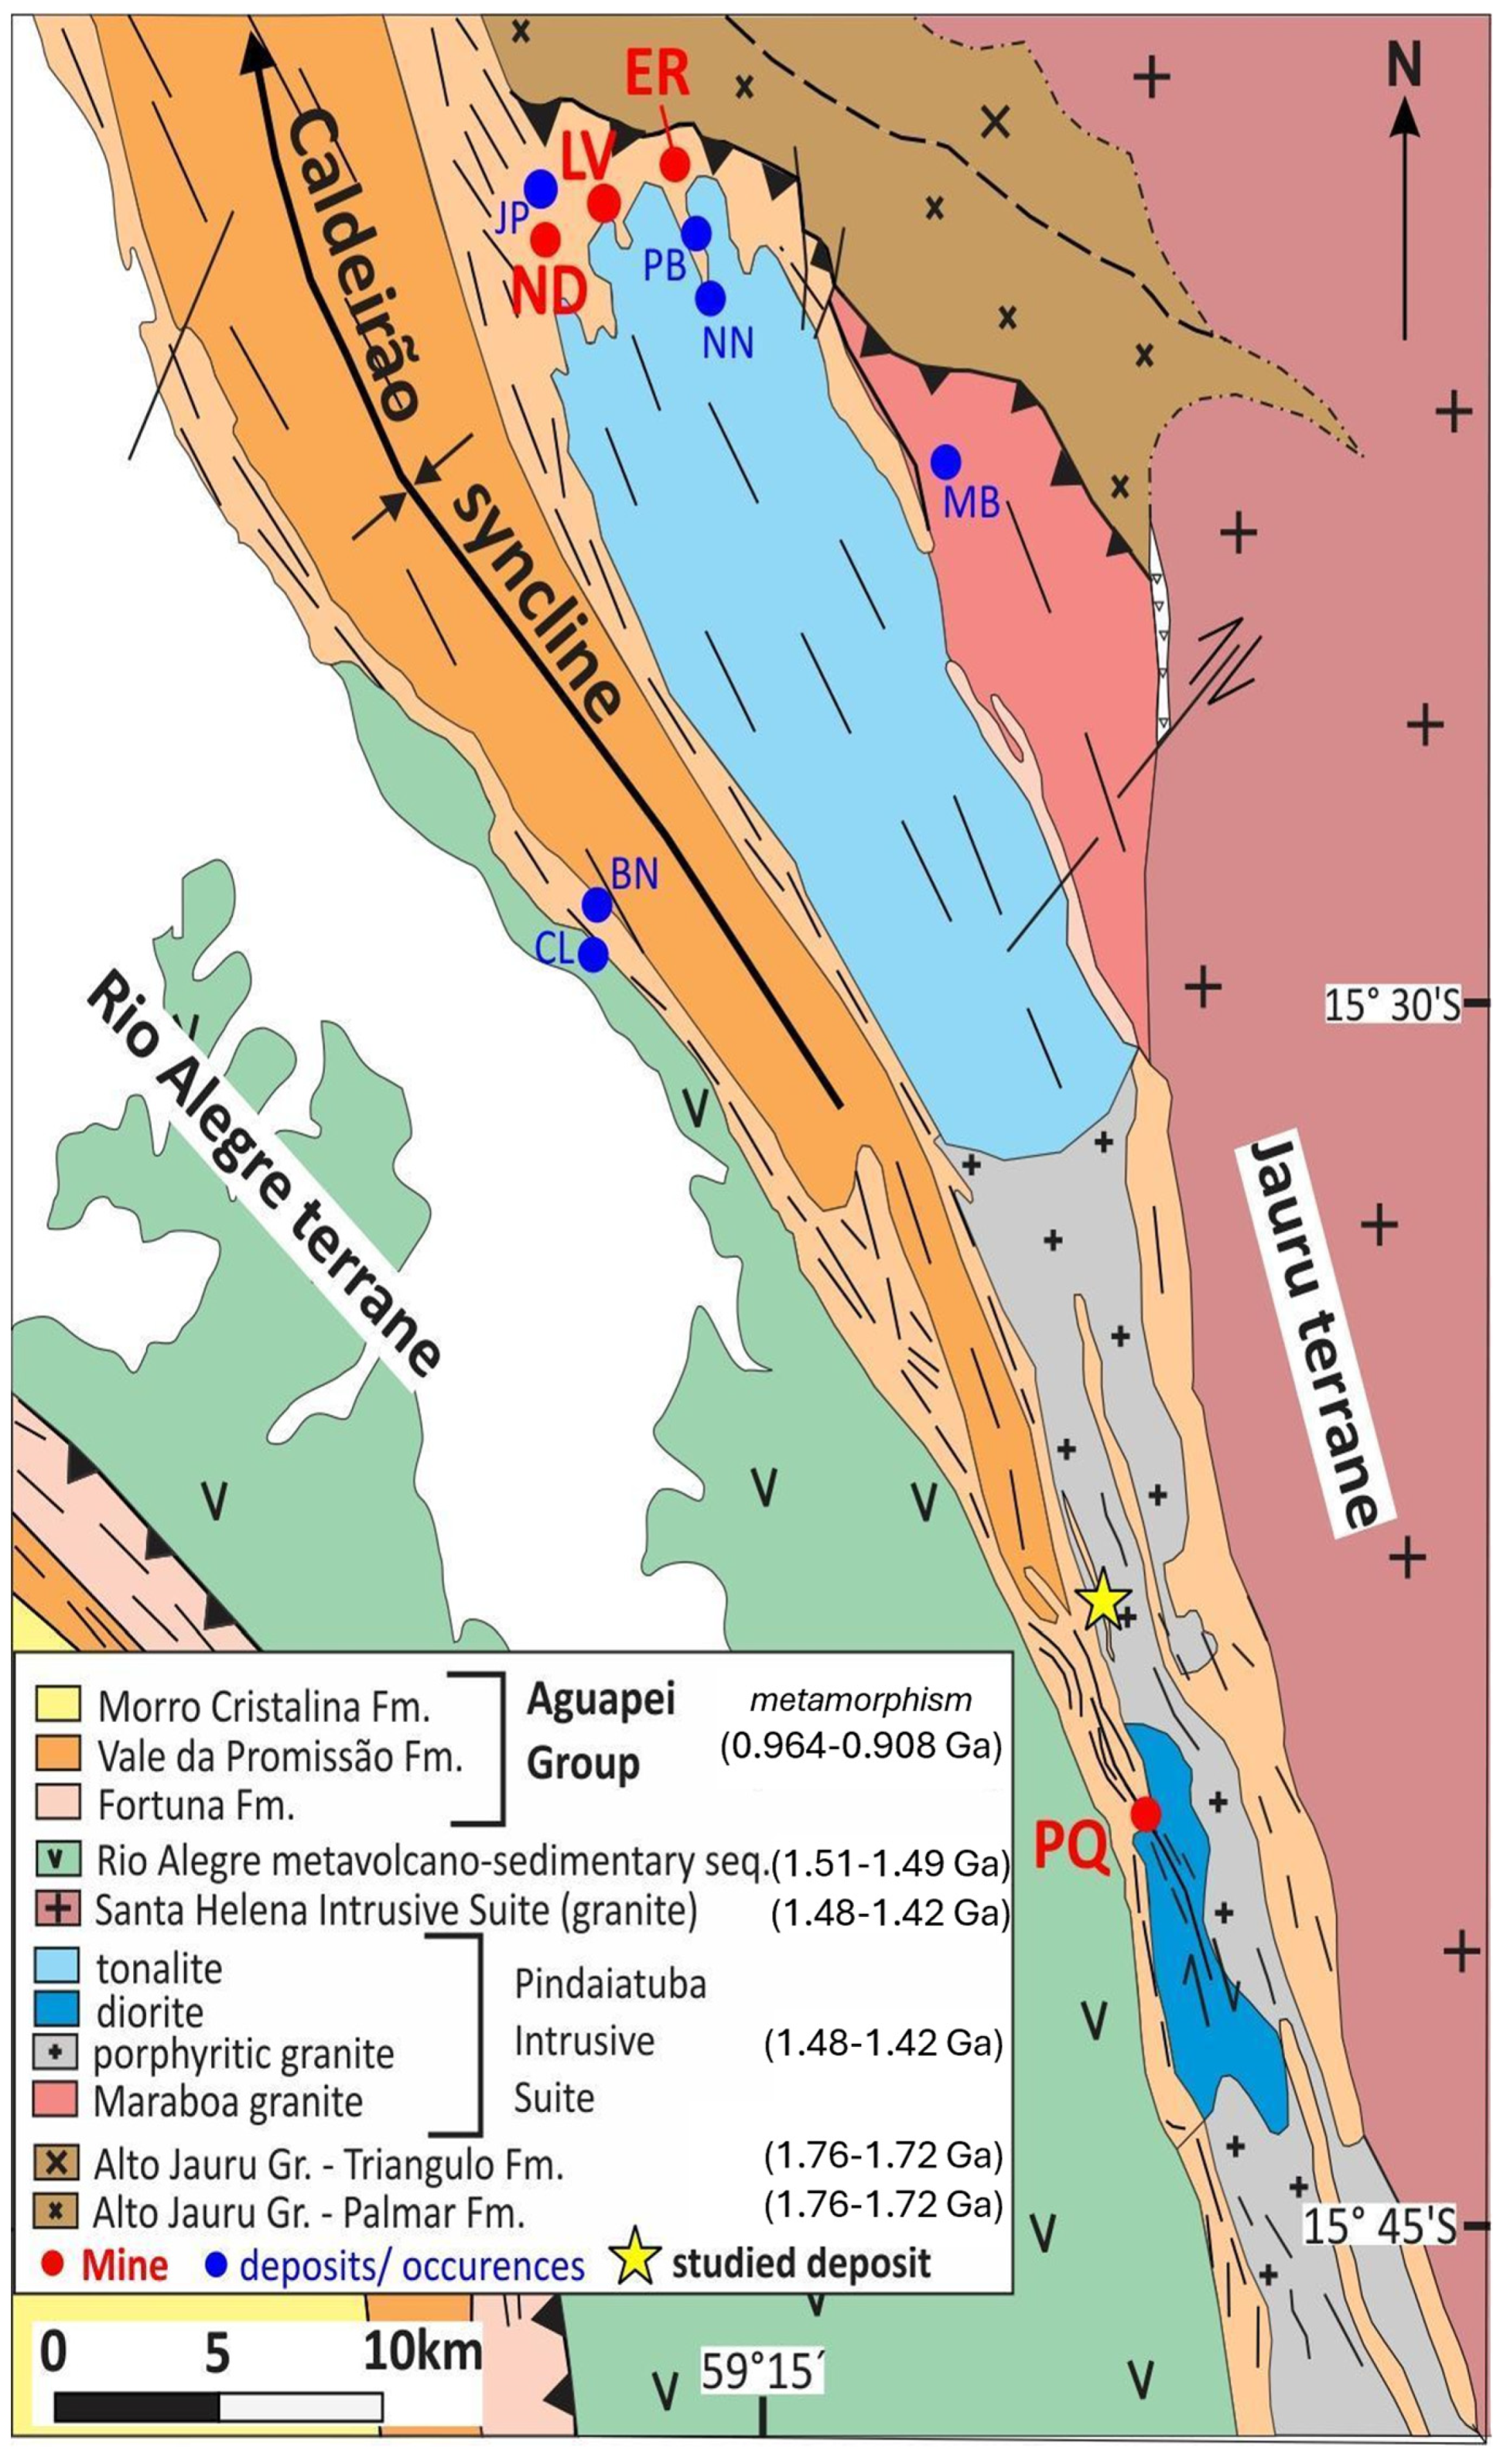
Figure 2. Geological map of the central portion of Aguapeí Gold Province (AGGP) indicating the approximate location of the studied deposit (ABP target) as well as commercial mines and known gold occurrences. BN = Bananal; CL = Caldeirão; ER = Ernesto; JP = Japonês; LV = Lavrinha; MB = Maraboa; ND = Nosde; NN = Nene; PB = Pombinhas; PQ = Pau-a-Pique. Modified from [9].
Minerals 14 00788 g002
Figure 3. Geological map and profile section of APB Target. (A) Interpreted geological section of the studied area. (B) Detailed geological map with mapped hydrothermal alteration of the three gold occurrences of ABP target. PPQ = Pau-a-Pique and ABP = BP Anomaly.
Minerals 14 00788 g003
Figure 4. Photos showing the aspects of weathered surface exposures of the ABP target’s hydrothermal alteration. (i) Intensely deformed metasedimentary rocks cropping on hangwall of Serrinha occurrence, shown by vertically displayed layers of metaconglomerate interbedded with medium- to coarse-grained metarenite. (ii) Detail of fine to medium grained metarenite present on hangwall Serrinha occurrence showing moderate deformation and stratification (S0) parallel to the main foliation (Sn + 1); (iii) ferruginous metarenite from ferruginous occurrence characterized by limonitized hydrothermal hematite/specularite and oxidized pyrite; (iv) sample of silicified metarenite with disseminated magnetite from Serrinha occurrence; and (v) weathered sample of hydrothermal alteration of Serrinha occurrence characterized by sigmoidal shape quartz veins associated with muscovite, oxidized pyrite, limonite and box work texture. Az = Azimute; Mgt = magnetite; BW = boxwork; PyOx = oxidized sulfide; Ms = muscovite; Ser = sericite; Lm = limonite and Qtz = quartz.
Minerals 14 00788 g004
Figure 5. Drill core photos showing the aspects of hydrothermal alteration of Cunha and Serrinha occurrence in ABP target. Photos shows that Cunha hydrothermal alteration is given by quartz±calcite veins (C) in association with hydrothermal muscovite—biotite “schist” formed at the sheared contact (A) between metasediments of the Aguapeí Group and the granitic basement. The other hydrothermal phases include magnetite (B); albite (B,F); calcite (C,E); pyrite (A,DF) and chalcopyrite (E). The characteristics of mineralization in the context of the Serrinha system, with gradation between the granite basement and venulated deformed zones (hydrothermal schist muscovite layers) have paragenesis defined by Qtz + Cal + Al + Py > Cpy + Ms-Ser and Mgt and Bt trace. Mgt = magnetite; Py = pyrite; Cpy = calcopirite; Ms = muscovite; Ser = sericite; Cal = calcite; Bt = biotite and Qtz = quartz.
Minerals 14 00788 g005
Figure 6. Location map of topographic conditions: (A) magnetic data acquisition lines, (B) induced polarization IP acquisition lines and geochemical anomalies of the area. Digital elevation model (DEM). Source: ALOS PALSAR—radiometric terrain correction. Municipal access points correspond to the red lines. PPQ = Pau-a-Pique and ABP = BP Anomaly.
Minerals 14 00788 g006
Figure 7. Inverted sections covering the two configurations tested in line 6, dipole–dipole (DD) and pole–dipole (PD) and spacings of 25 and 50~m between the electrodes. In (AD) sections for line 6 with a spacing of 25 m between the electrodes, with both dipole–dipole and pole–dipole arrangements. (EH) show sections of the two arrays at 50 m spacing.
Minerals 14 00788 g007
Figure 8. Ground magnetic data: (A) residual and (B) total gradient. Black dashed lines highlight the continuity of the corridor shear zone demarcated by a low magnetic anomaly with orientation NW–SE. Digital elevation model (DEM) Source: ALOS PALSAR—radiometric terrain correction. PPQ = Pau-a-Pique and ABP = BP Anomaly.
Minerals 14 00788 g008
Figure 9. Three-dimensional mosaic with the shape of the magnetic bodies in depth recovered by inversion of magnetic data anomalies, with dashed lines delimiting the area of greater detail (C) and DEM topographic layout of the area. (A) Residual magnetic field (RMF) relief (view to NW). (B) Recovered magnetic model overlaid by DEM topography (view to NW), same results with 50 × 50 and 150 × 150 m mesh. (C) Representation of the northernmost portion of the detail with a 50 × 50 m mesh, from a different viewing angle (from N to S).
Minerals 14 00788 g009
Figure 10. 3D view of geoelectric resistivity profiles, correlated with surface geochemical anomalies. White dashed lines highlight the contacts of units mapped in the field. FMAR = feldspatic metarenite; PBSG = porphyritic biotite sieno-granite; FERM = ferruginous metarenite; QZV (SS) = quartz vein (Serrinha system) and QZV (CS) = quartz vein (Cunha system).
Minerals 14 00788 g010
Figure 11. 3D view of geoelectric chargeability acquisition lines, associated with surface geochemical anomalies. White dashed lines highlight the contacts of units mapped in the field. FMAR = feldspatic metarenite; PBSG = porphyritic biotite sieno-granite; FERM = ferruginous metarenite; QZV (SS) = quartz vein (Serrinha system) and QZV (CS) = quartz vein (Cunha System).
Minerals 14 00788 g011
Figure 12. Geophysical–geological interpretative model (geoelectric–magnetic) for gold deposits in AGGP. (A) Chargeability and (B) resistivity inverted sections of line 5. (C) Vertical section in 3D model of the MVI (magnetic vector inversion) along line 5 (IP). (D,E) 3D voxel products of IP data (chargeability and resistivity respectively). (F) 3D geological model. In thinner dashed lines (AC), geological interpretation of the sections. DDH = diamond drill hole; L1 = line 1; L2 = line 2; L3 = line 3; L4 = line 4; L5 = line 5 and L6 = line 6.
Minerals 14 00788 g012
Figure 13. Correlation of magnetic and geoelectric results in line 5, with the magnetic vector inversion and amplitude inversion image section, superimposed by the chargeability isosurface (>18 mV/V). MS = magnetic susceptibility and MVI = magnetic vector inversion.
Minerals 14 00788 g013
Disclaimer/Publisher’s Note: The statements, opinions and data contained in all publications are solely those of the individual author(s) and contributor(s) and not of MDPI and/or the editor(s). MDPI and/or the editor(s) disclaim responsibility for any injury to people or property resulting from any ideas, methods, instructions or products referred to in the content.