Article

Key Technologies for Surface-Borehole Transient Electromagnetic Systems and Applications

by
Qingming Guo
1,2,
Yurong Mao
1,*,
Liangjun Yan
1,
Wenhui Chen
2,
Jupeng Yang
2,
Xingbing Xie
1,
Lei Zhou
1 and
Haojin Li
1
1
College of Geophysics and Petroleum Resources, Yangtze University, Wuhan 430100, China
2
Logging Technology Research Institute, China National Logging Corporation, Xi’an 710077, China
*
Author to whom correspondence should be addressed.
Minerals 2024, 14(8), 793; https://doi.org/10.3390/min14080793
Submission received: 14 June 2024 / Revised: 25 July 2024 / Accepted: 30 July 2024 / Published: 31 July 2024

Abstract

:
The nonferrous metal mines in China are rapidly depleting due to years of mining, and it has become difficult to identify new mineral resources in the periphery of the old mining area. In order to deal with this situation, advanced technologies and equipment must be deployed. The borehole transient electromagnetic method (TEM) has become a key technology due to its deep investigative capabilities within conductive geological structures. In the present study, in order to meet the exploration needs at depths of less than 3000 m, surface-borehole TEM exploration was used to analyze the characteristics of electromagnetic signals generated by a long wire source and a large loop source, providing essential data for the development of key technologies, such as sensor parameter design and signal gain optimization of the TEM system in the borehole. This study discussed in detail two key technical problems as follows: firstly, the efficient synchronization mechanism between the ground transmitter system and the borehole electromagnetic signal acquisition system ensured the accuracy and timeliness of data acquisition; and secondly, the realization of mass storage technology, which effectively solved the problem of mass storage and real-time transmission of data in a deep borehole environment. The effectiveness of the surface-borehole TEM systems with a long wire source and a large loop source was verified by tests in real mines. The surface-borehole electromagnetic signal acquisition system developed in this study effectively collected electromagnetic signals in the borehole, and the results accurately reflected the stratigraphic information of mineral resources in the study area. This study can pave a new technical path for the exploration of deep and peripheral areas of non-ferrous metal mines and provide valuable experience and insights for mineral resource exploration in similarly complex geological environments.

1. Introduction

The Transient Electromagnetic Method (TEM), as an advanced time-domain artificial source electromagnetic exploration technology, shows outstanding application potential in the field of mineral resource exploration [1,2]. This technology uses an ungrounded loop source or ground line source to emit a one-time pulsed magnetic field to the ground, and then precisely monitors the changes in the secondary electromagnetic field generated by the underground medium response, so as to analyze the electrical structure characteristics of the formation in depth [3]. Compared with traditional frequency domain methods, TEM enjoys many advantages in theory, including lower sensitivity to low resistivity layers, insignificant volume effect, significantly improved resolution, effective control of side effects, and efficient and fast data acquisition process, which greatly improves exploration efficiency and accuracy [4]. As a rising star in this field, surface-borehole TEM has developed rapidly in recent years and has achieved remarkable results in many fields such as geological prospecting, structural interpretation, oil and gas field exploration, coal field survey, groundwater exploration, geothermal resource assessment, tundra research, and marine geological exploration with its unique advantages. Especially in the field of metal ore exploration, this method is particularly effective for the detection of blind ore bodies near and at the bottom of boreholes, especially in complex geological conditions where the ore bodies are deeply buried and the electrical interference is complicated (such as conductive overburden, shallow sulfide enrichment, surface mineralization phenomenon, etc.) [5,6]. The surface-borehole TEM method has shown advantages that are difficult to compare with those of surface electromagnetic exploration. Globally, surface-borehole TEM has become a standard tool for geological exploration in developed mining countries, such as Canada and Australia, and has successfully helped a number of major deep prospecting discoveries. For example, in 1995, Lindsley’s Falconbridge copper–nickel mining area in Canada revealed a rich ore body with a depth of 1280 m, about 200 m from the drilling hole and a thickness of 28 m, through the surface-borehole TEM method, which not only verified the advanced nature of this technology but also provided valuable experience for subsequent deep mineral resource exploration [7,8]. In the process of field data acquisition, the technology sends high-intensity bipolar pulse signals to the underground above or near the borehole through a carefully arranged transmitting loop device. At the same time, the highly sensitive probe slowly lowered along the borehole is responsible for accurately capturing and recording the transient electromagnetic response generated by the subsurface geological body induction, providing detailed and reliable data as the basis for subsequent geological interpretation and resource assessment.
As the receiving probes measure the electromagnetic signals along the borehole surface and are generally placed close to subsurface conductive geological structures, they can detect strong anomalous response signals. In addition, the receiving probes experience less interference by conductive overburden and external electromagnetic sources, allowing them to acquire valuable geological information within hundreds of meters around the wellbores [9,10,11,12]. The primary advantage of TEM is its capability to observe deep subsurface regions and detect mineral deposits that cannot be located by traditional exploration methods. TEM is a novel detection method for deep resource exploration and offers unique advantages in finding blind mines beside and at the bottom of boreholes. In surface-borehole TEM exploration, an electromagnetic signal acquisition system is required to withstand high temperatures and high pressures in deep boreholes, and this signal acquisition system must also be able to collect high-precision electromagnetic response signals generated by subsurface media and process these signals through filtering, amplification, and denoising techniques.
The first commercial borehole Electromagnetic Method (EM) receiver was introduced by Duncan Crone (of Crone Geophysics) in 1978 [13]. His early work was summarized in the University of Toronto PhD thesis of A. V. Dyck in 1981 [14,15]. In 1988, Karlsson and Sternberg from Sweden proposed the borehole receiver technology. Subsequently, numerous corporations and research institutions in North America and Europe started research in this field. For example, the PROTEM transient electromagnetic system and its supporting BH43-3 borehole probe, developed by the Canadian company, Geonics, in the late 1980s, have a detection range of within 200–300 m from the borehole and a depth of 2000 m [16]. The SIROTEM transient electromagnetic system produced by the Australia’s national science organisation, CSIRO, can also be used for the research of subsurface transient electromagnetics. Jiang and Shi from China successfully developed a borehole axial probe in the late 1980s and conducted field tests [17]. The Institute of Geophysical and Geochemical Exploration of the Chinese Academy of Geological Sciences initiated research on surface-borehole TEM exploration. In 2006, a research team from the Institute of Geophysics at the Chinese Academy of Sciences designed a borehole electromagnetic signal receiver for surface-borehole TEM exploration. The China University of Geosciences (Wuhan) and the China Coal Geology Bureau developed a borehole transient electromagnetic receiver, and the Institute of Geophysical and Geochemical Exploration of the Chinese Academy of Geological Sciences developed borehole probes [18]. Currently, most surface-borehole transient electromagnetic instruments used in China are imported or designed based on imported products. Hence, no reports of domestically developed products tailored to specific local needs are available [9]. In the field of deep exploration (>2000 m), no reports on practical application outcomes have been published. In the context of deep resource exploration, the effective designs for small-diameter borehole electromagnetic signal acquisition systems that are suitable for transient electromagnetic exploration at depths of less than 3000 m and can withstand high temperatures and high pressures has not yet been proposed. Therefore, the present study mainly focused on the development of a borehole electromagnetic signal acquisition system based on surface-borehole TEM and its key technologies to successfully detect resources at depths of less than 3000 m.

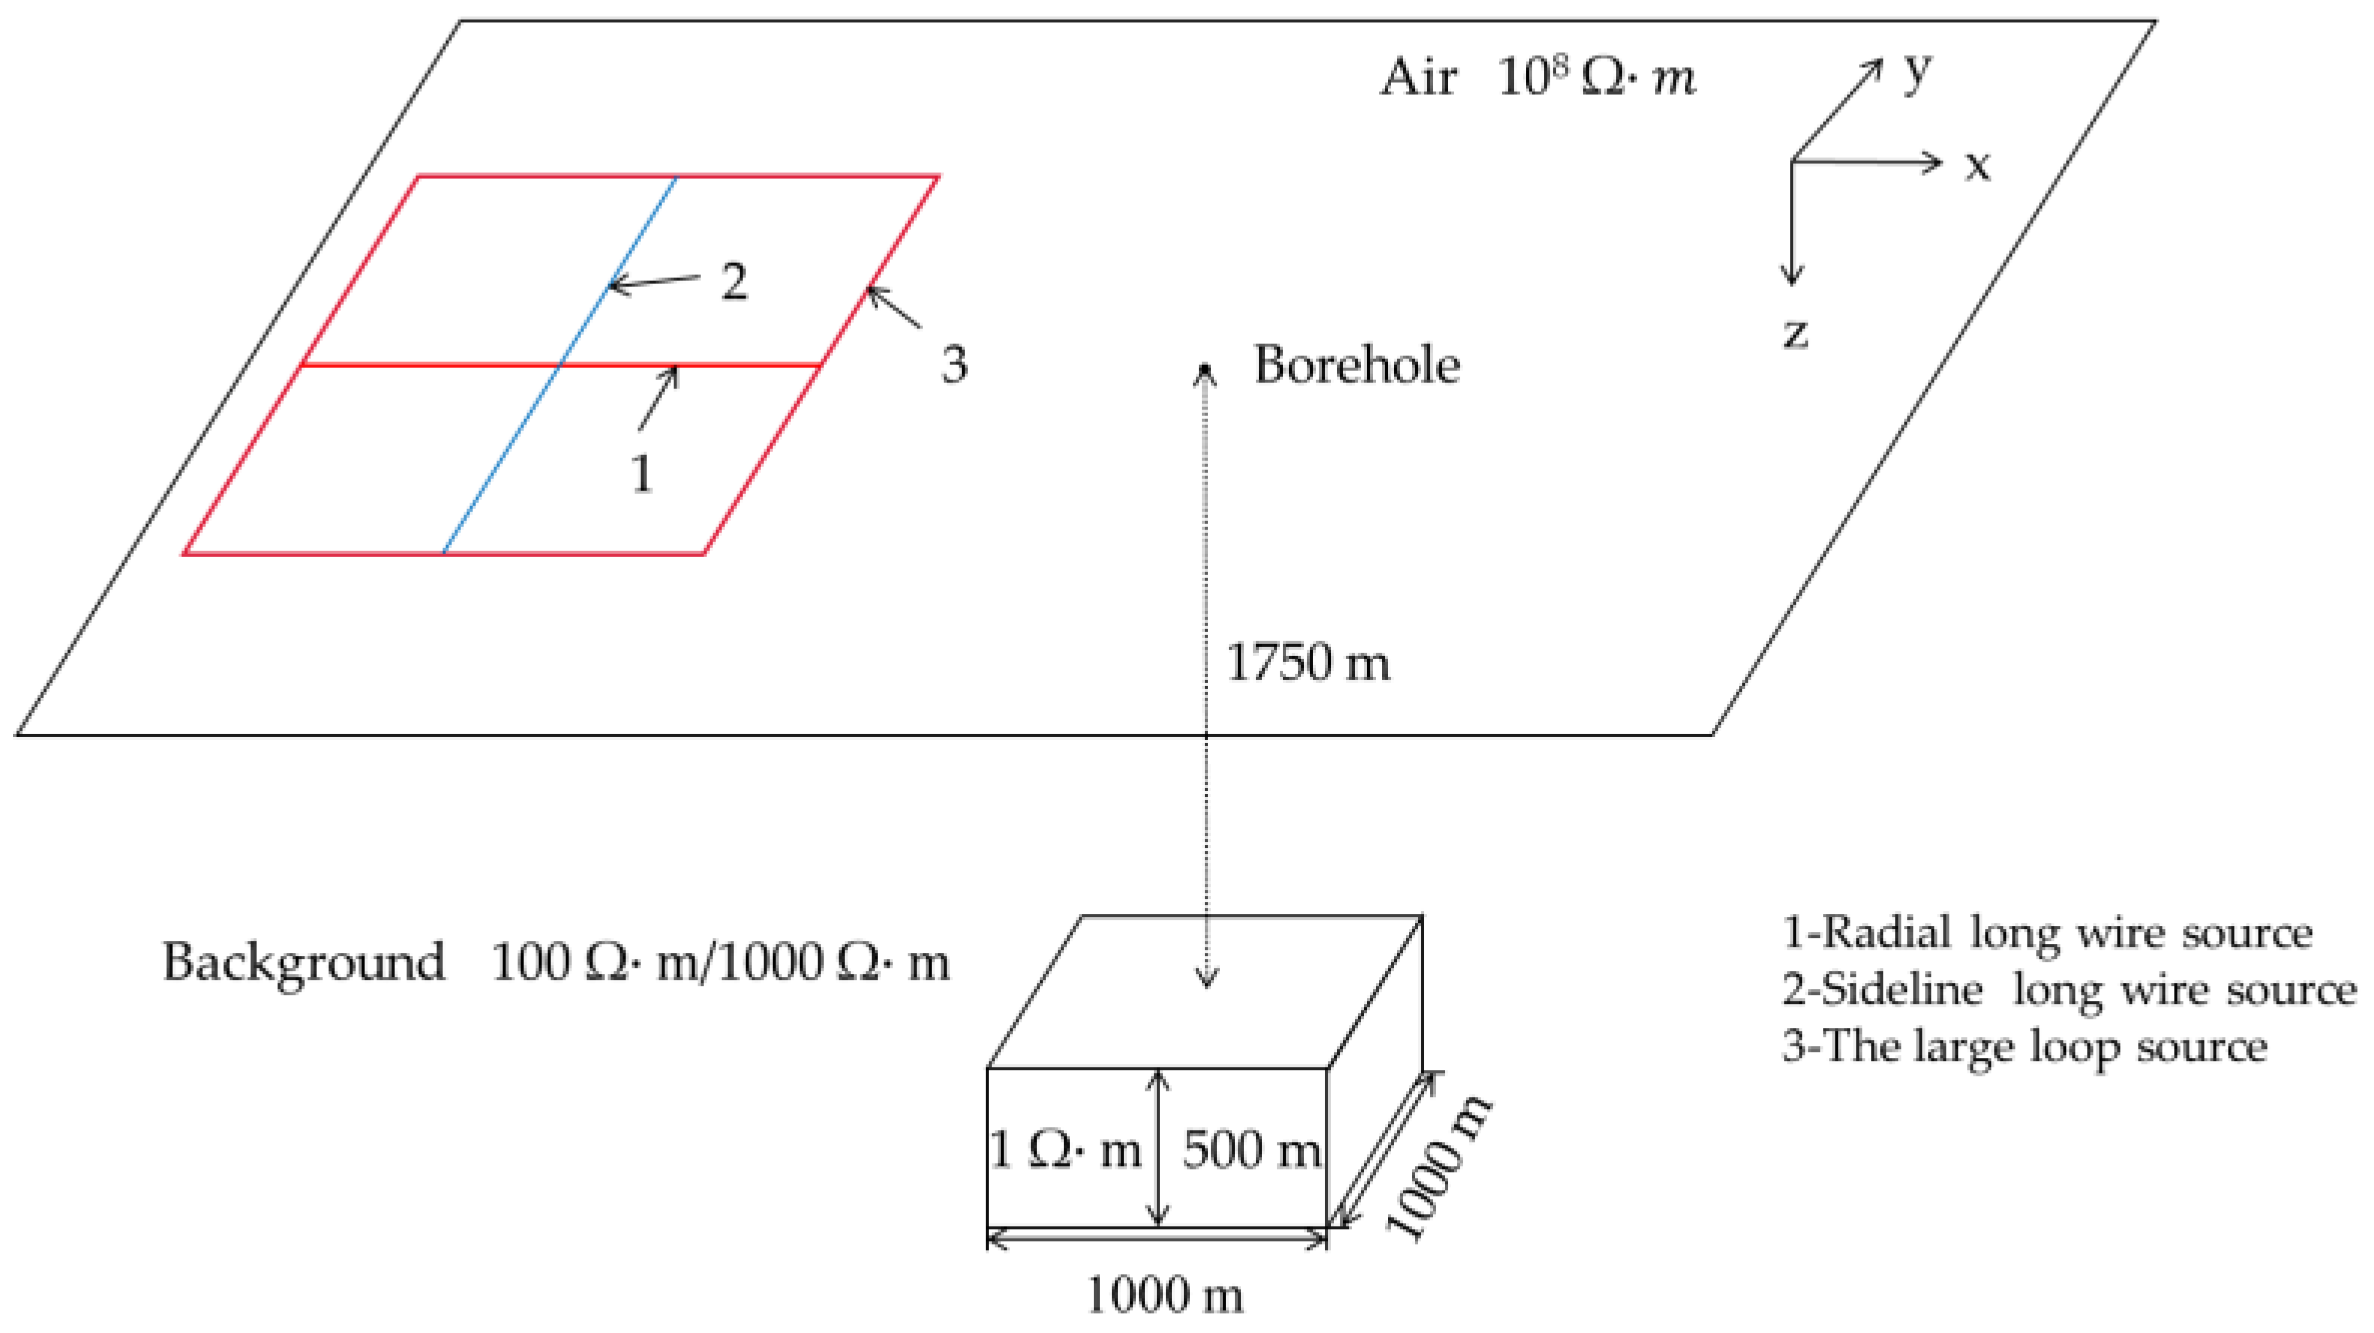
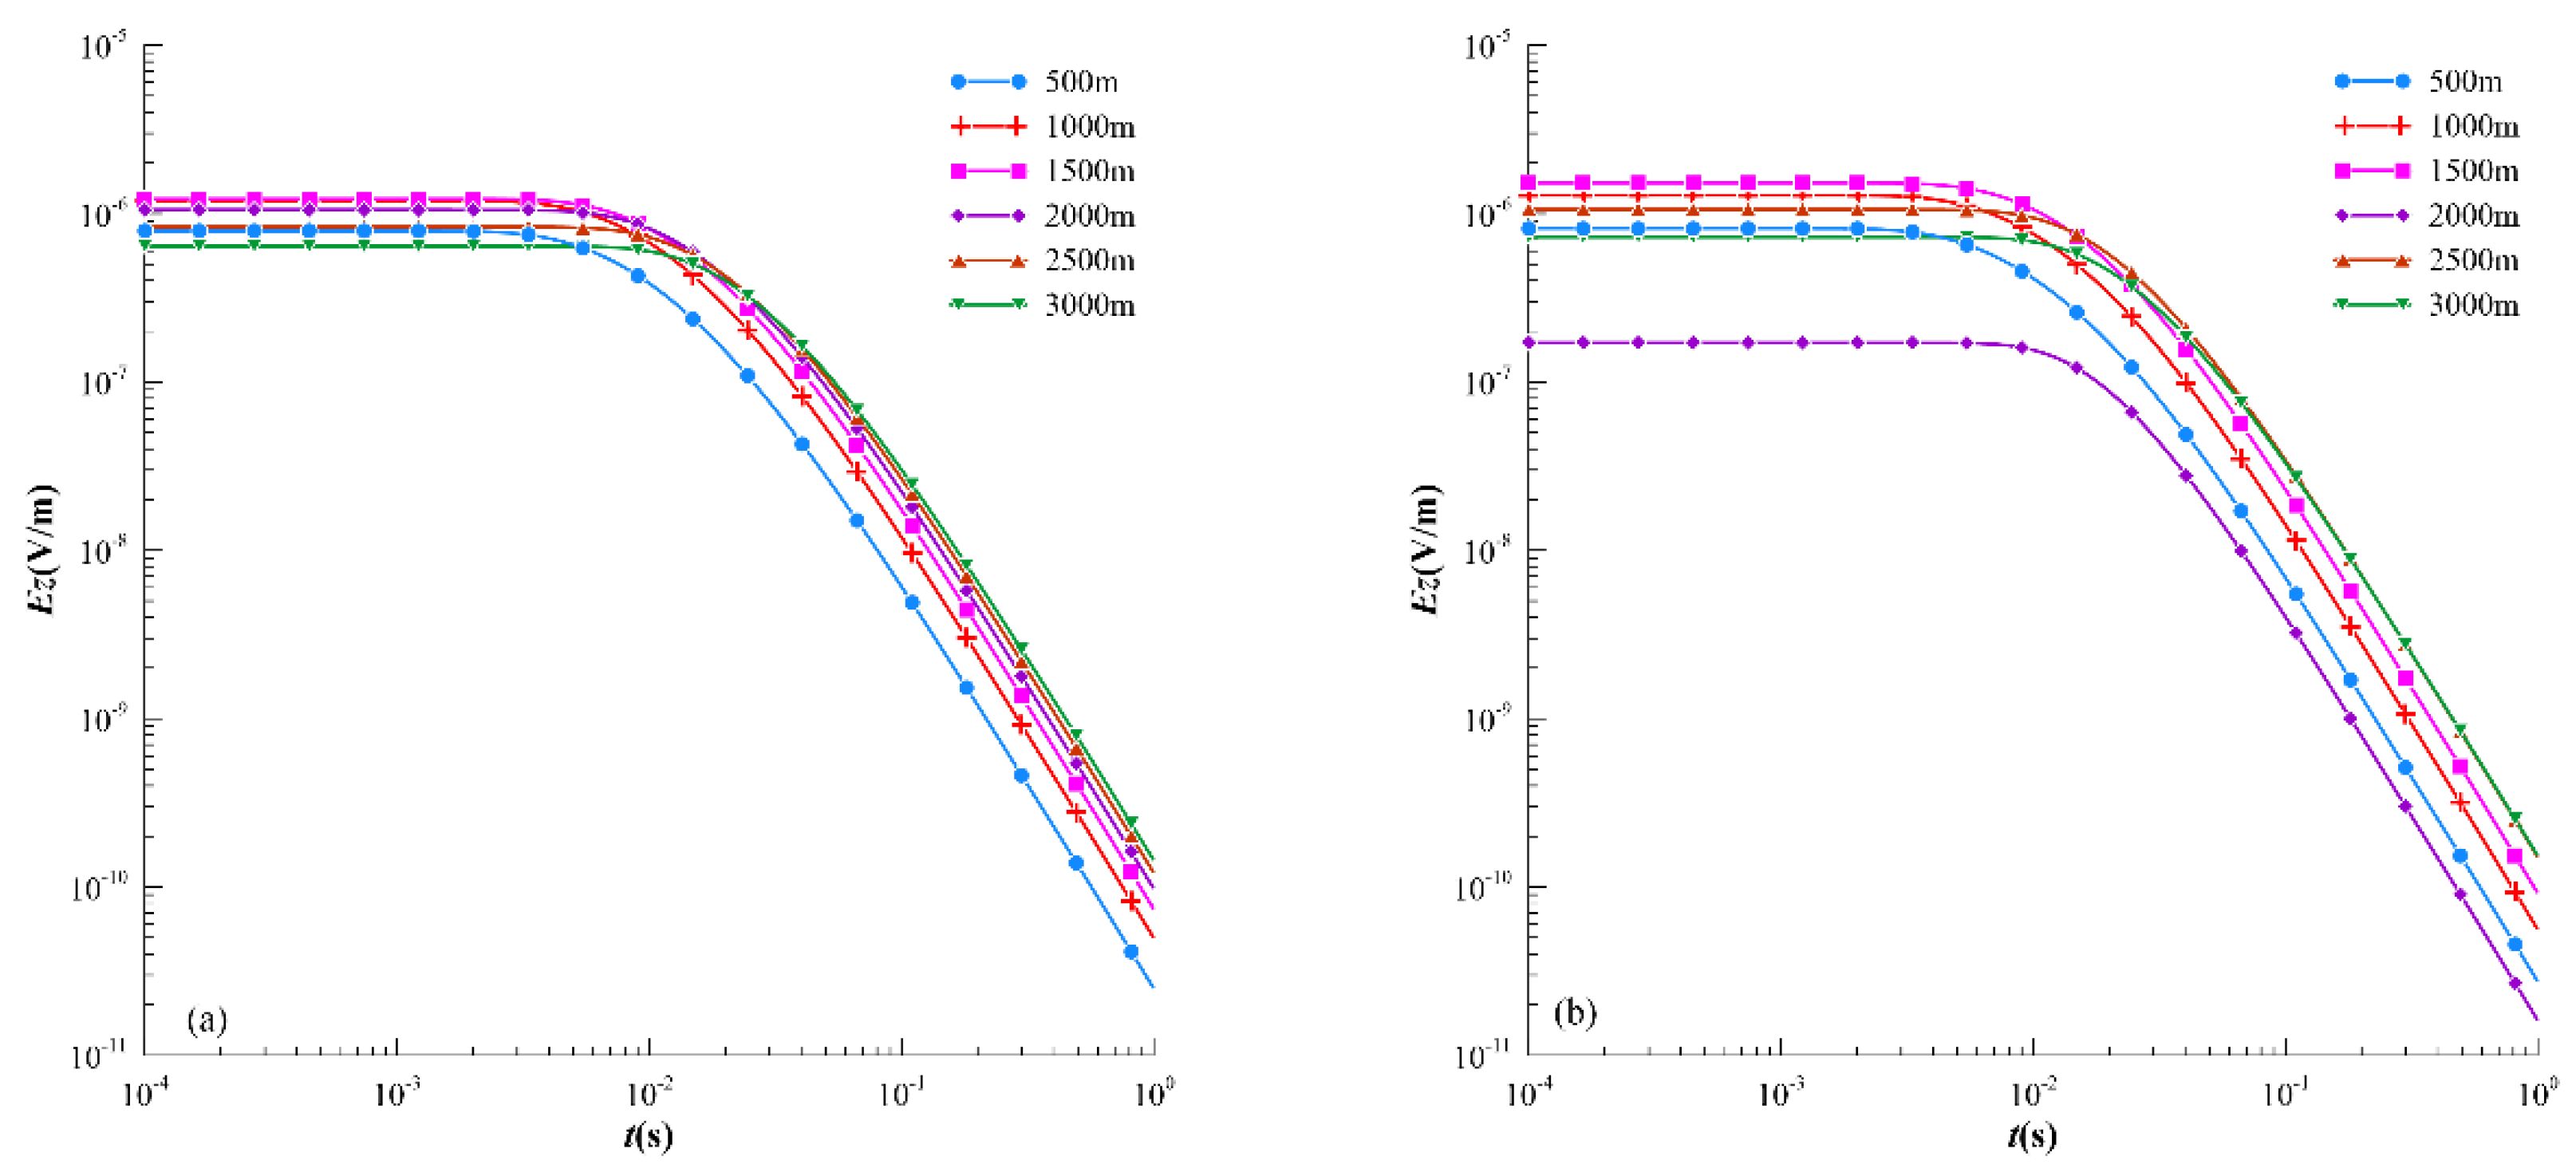
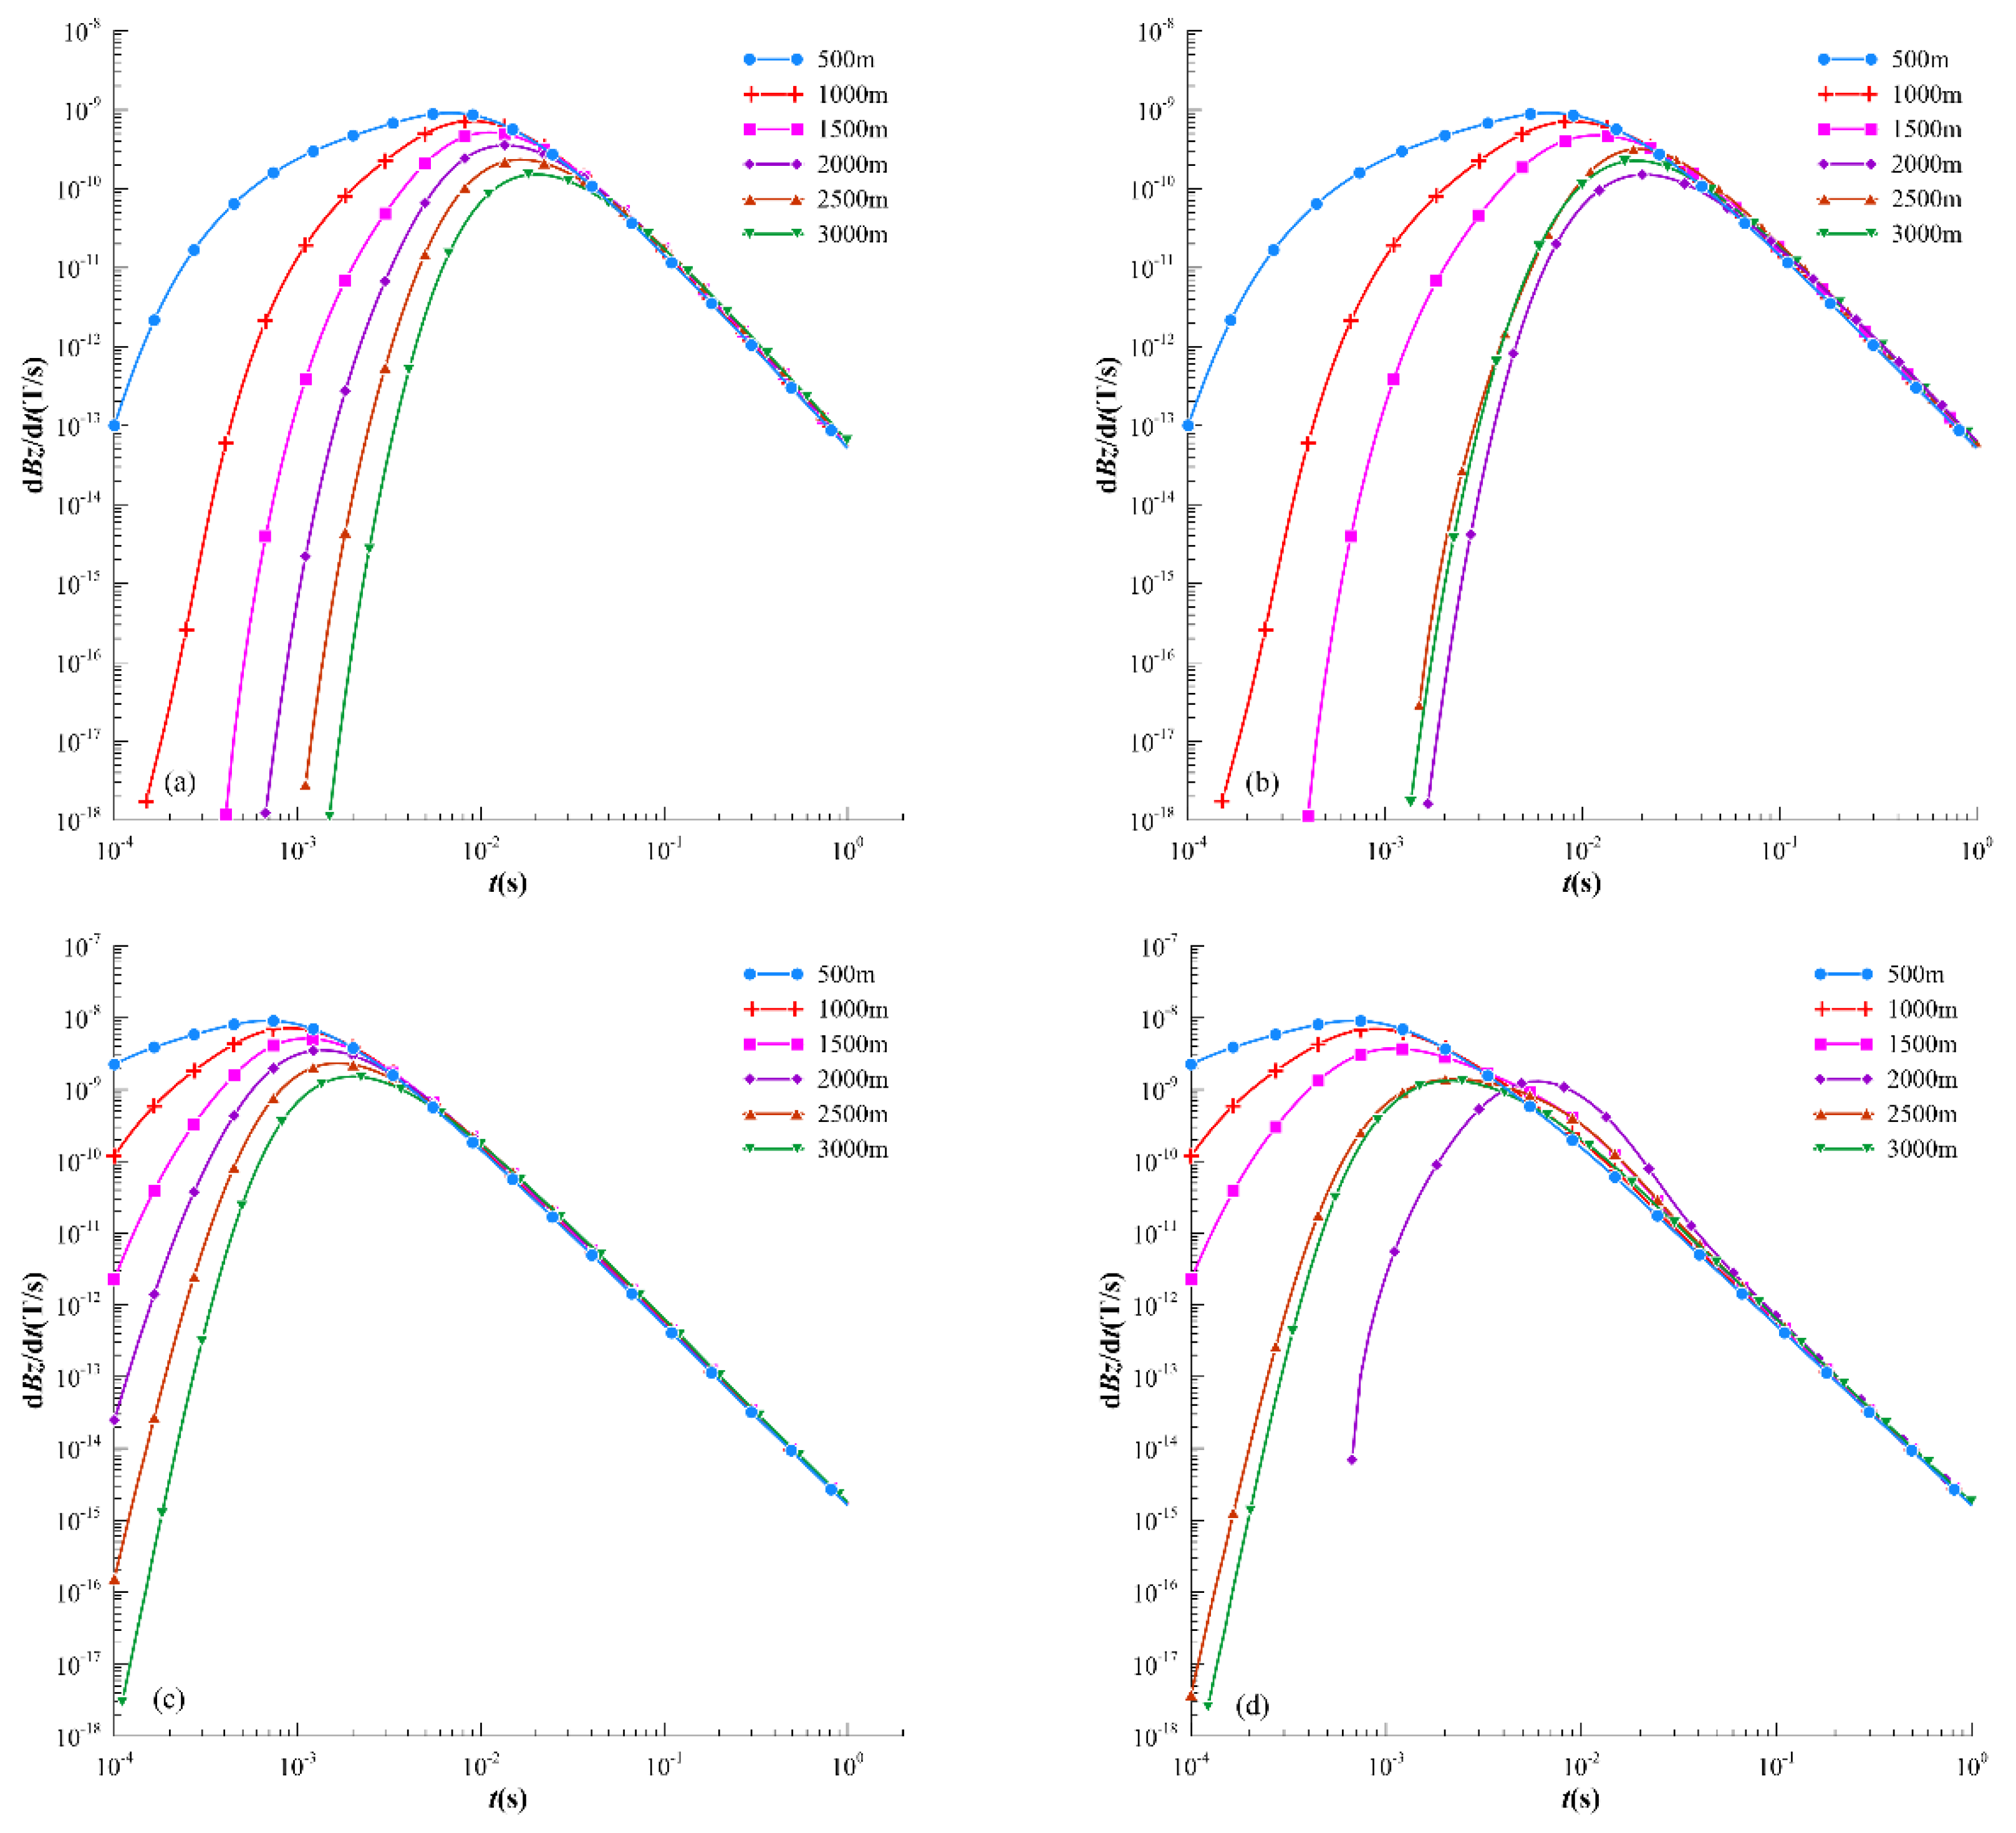
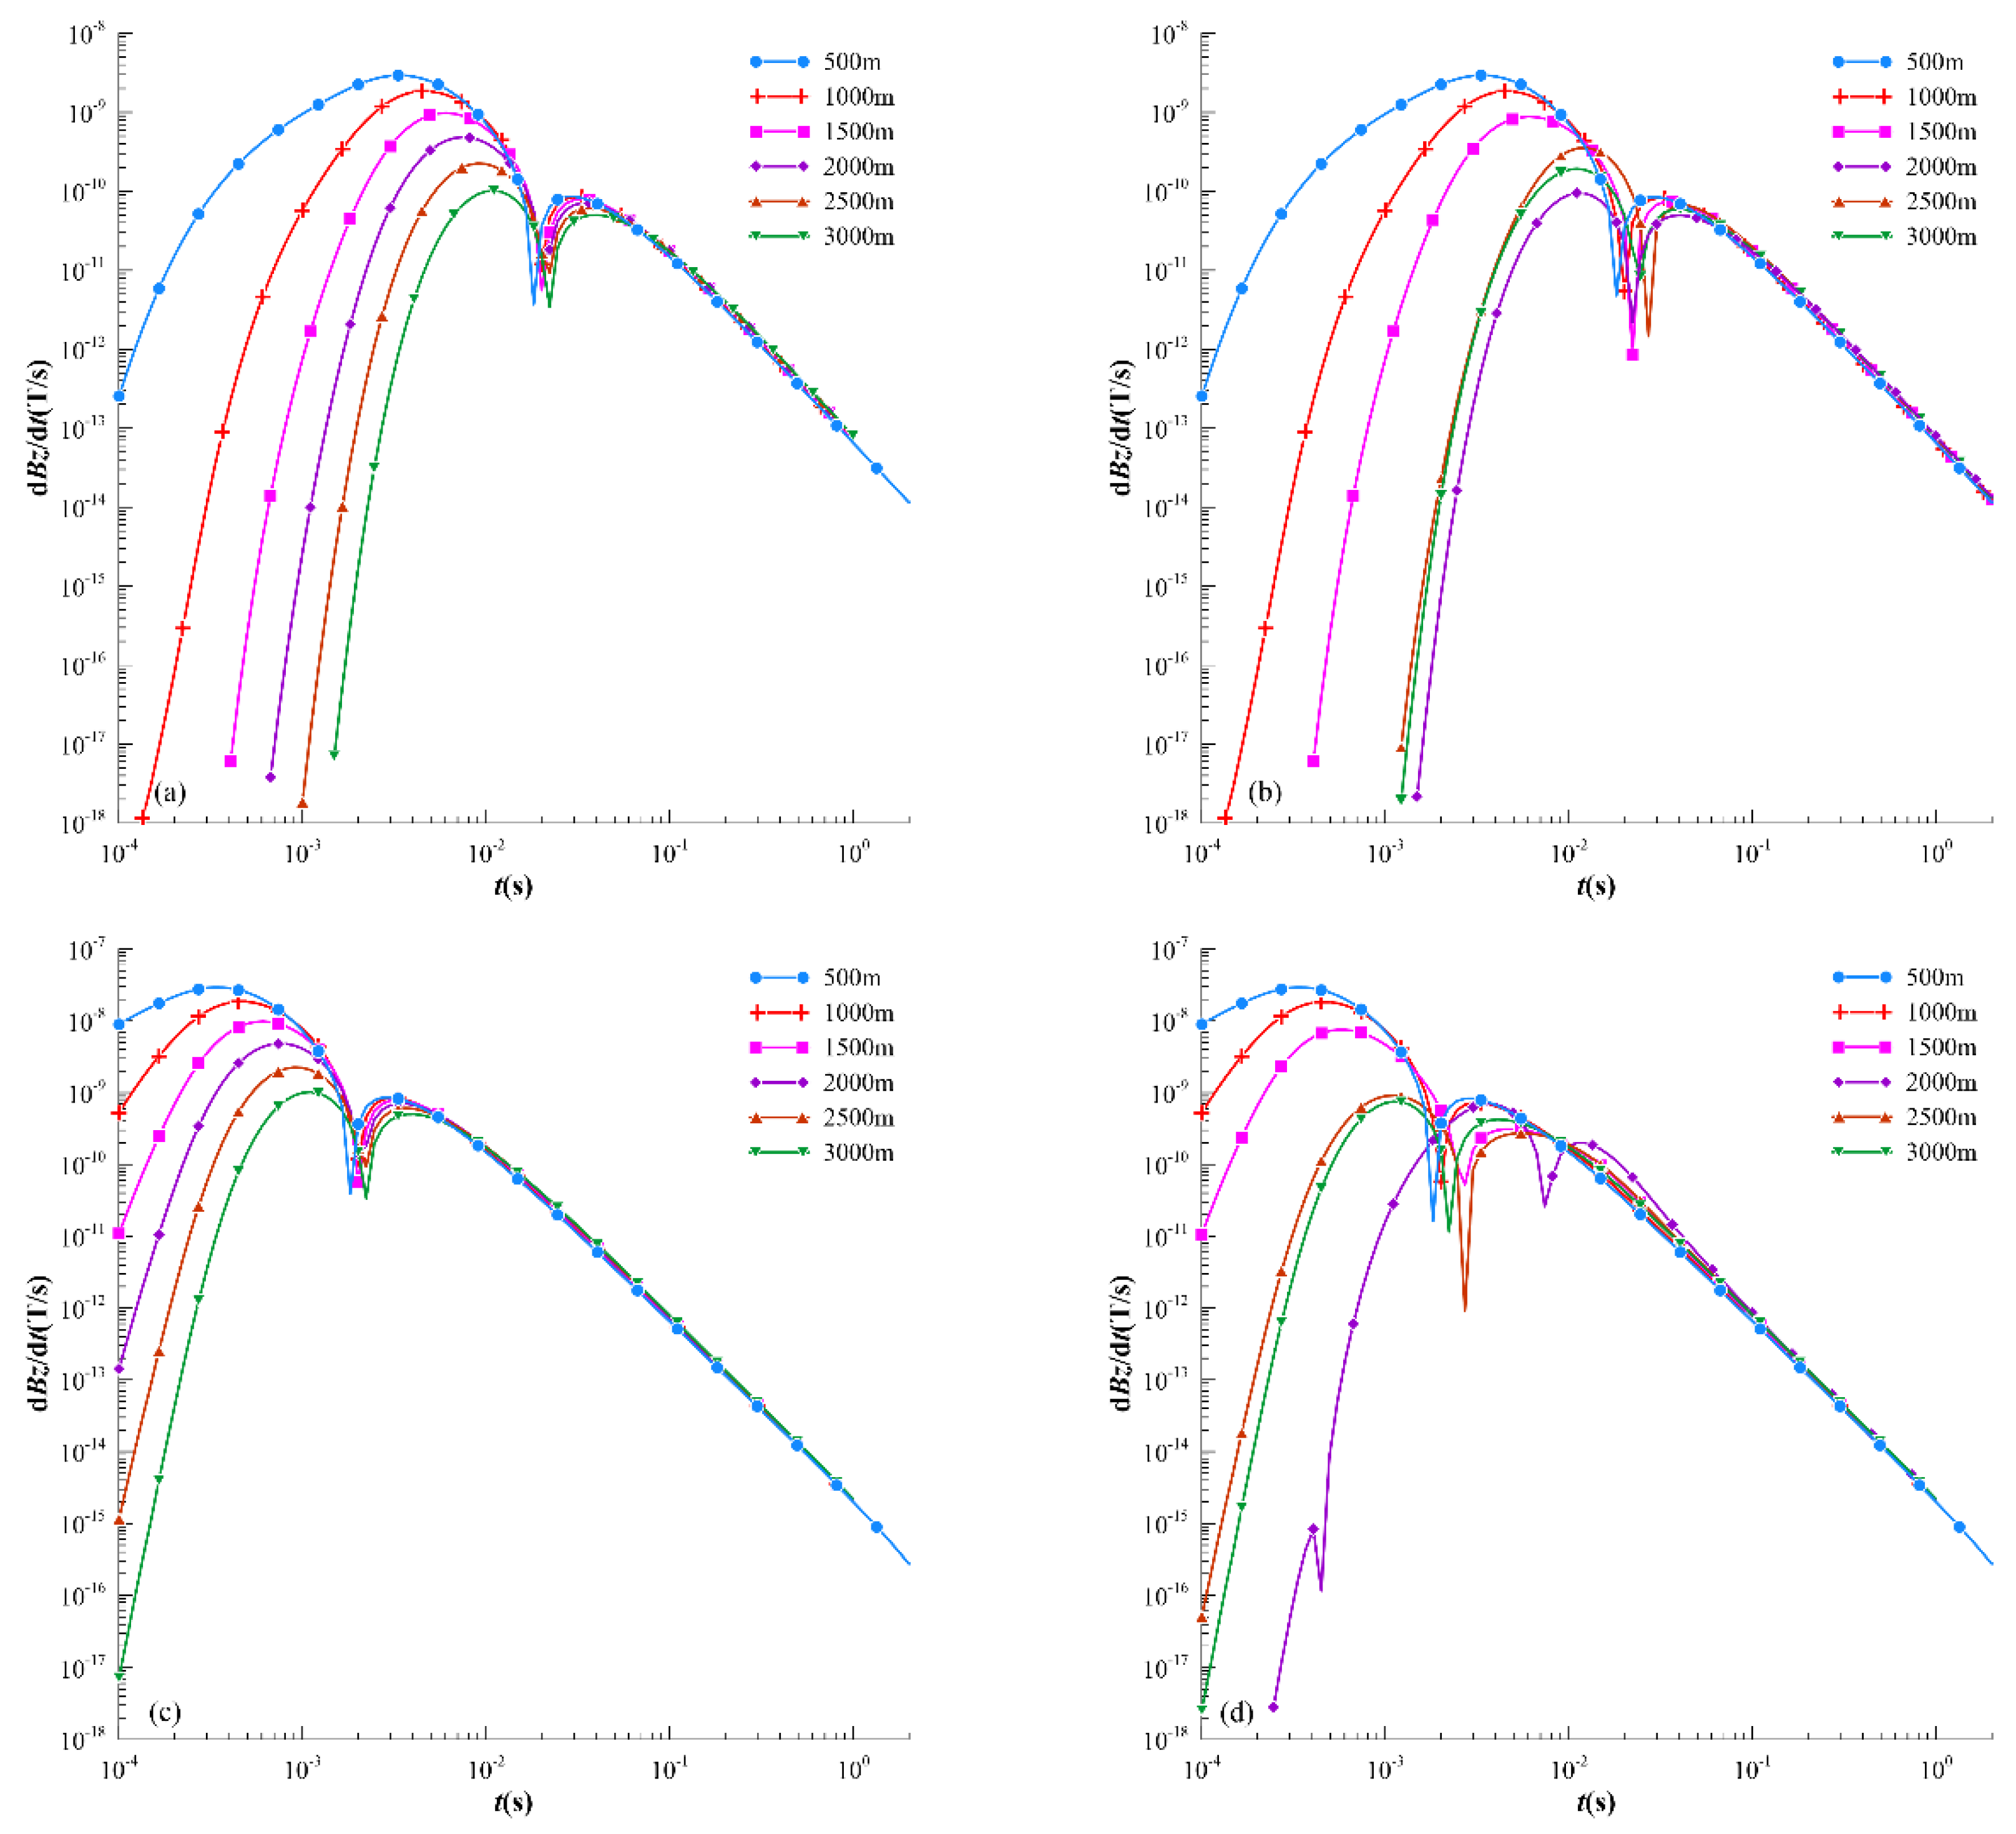
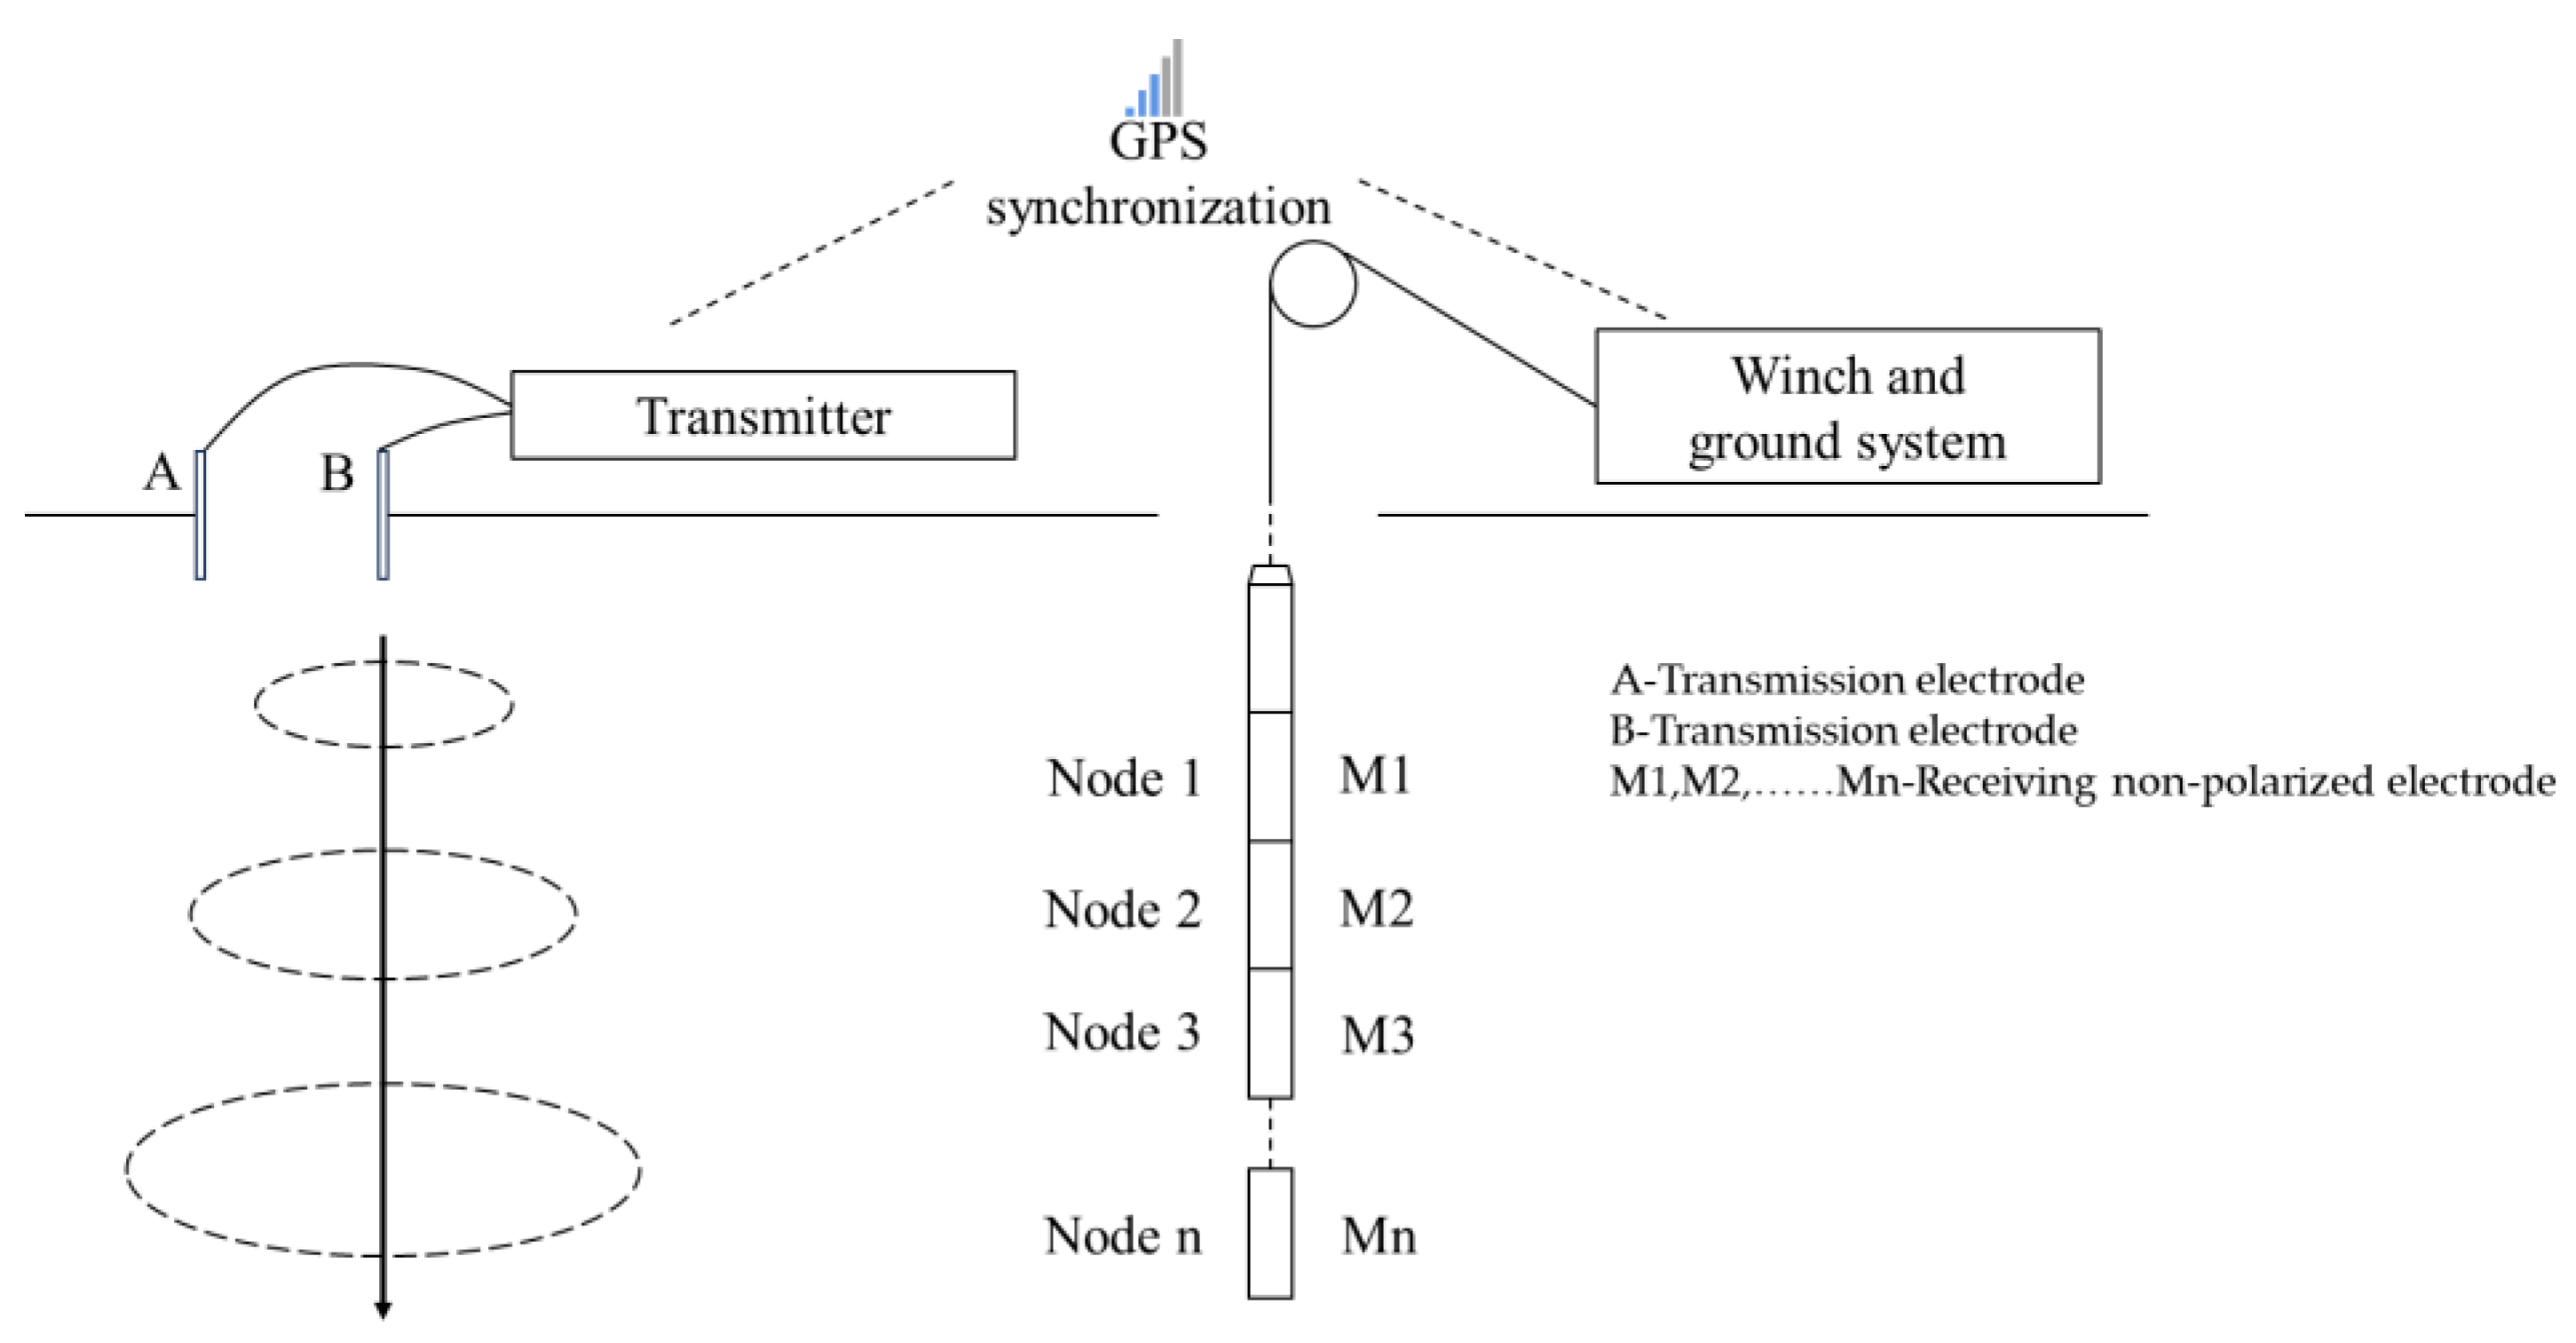
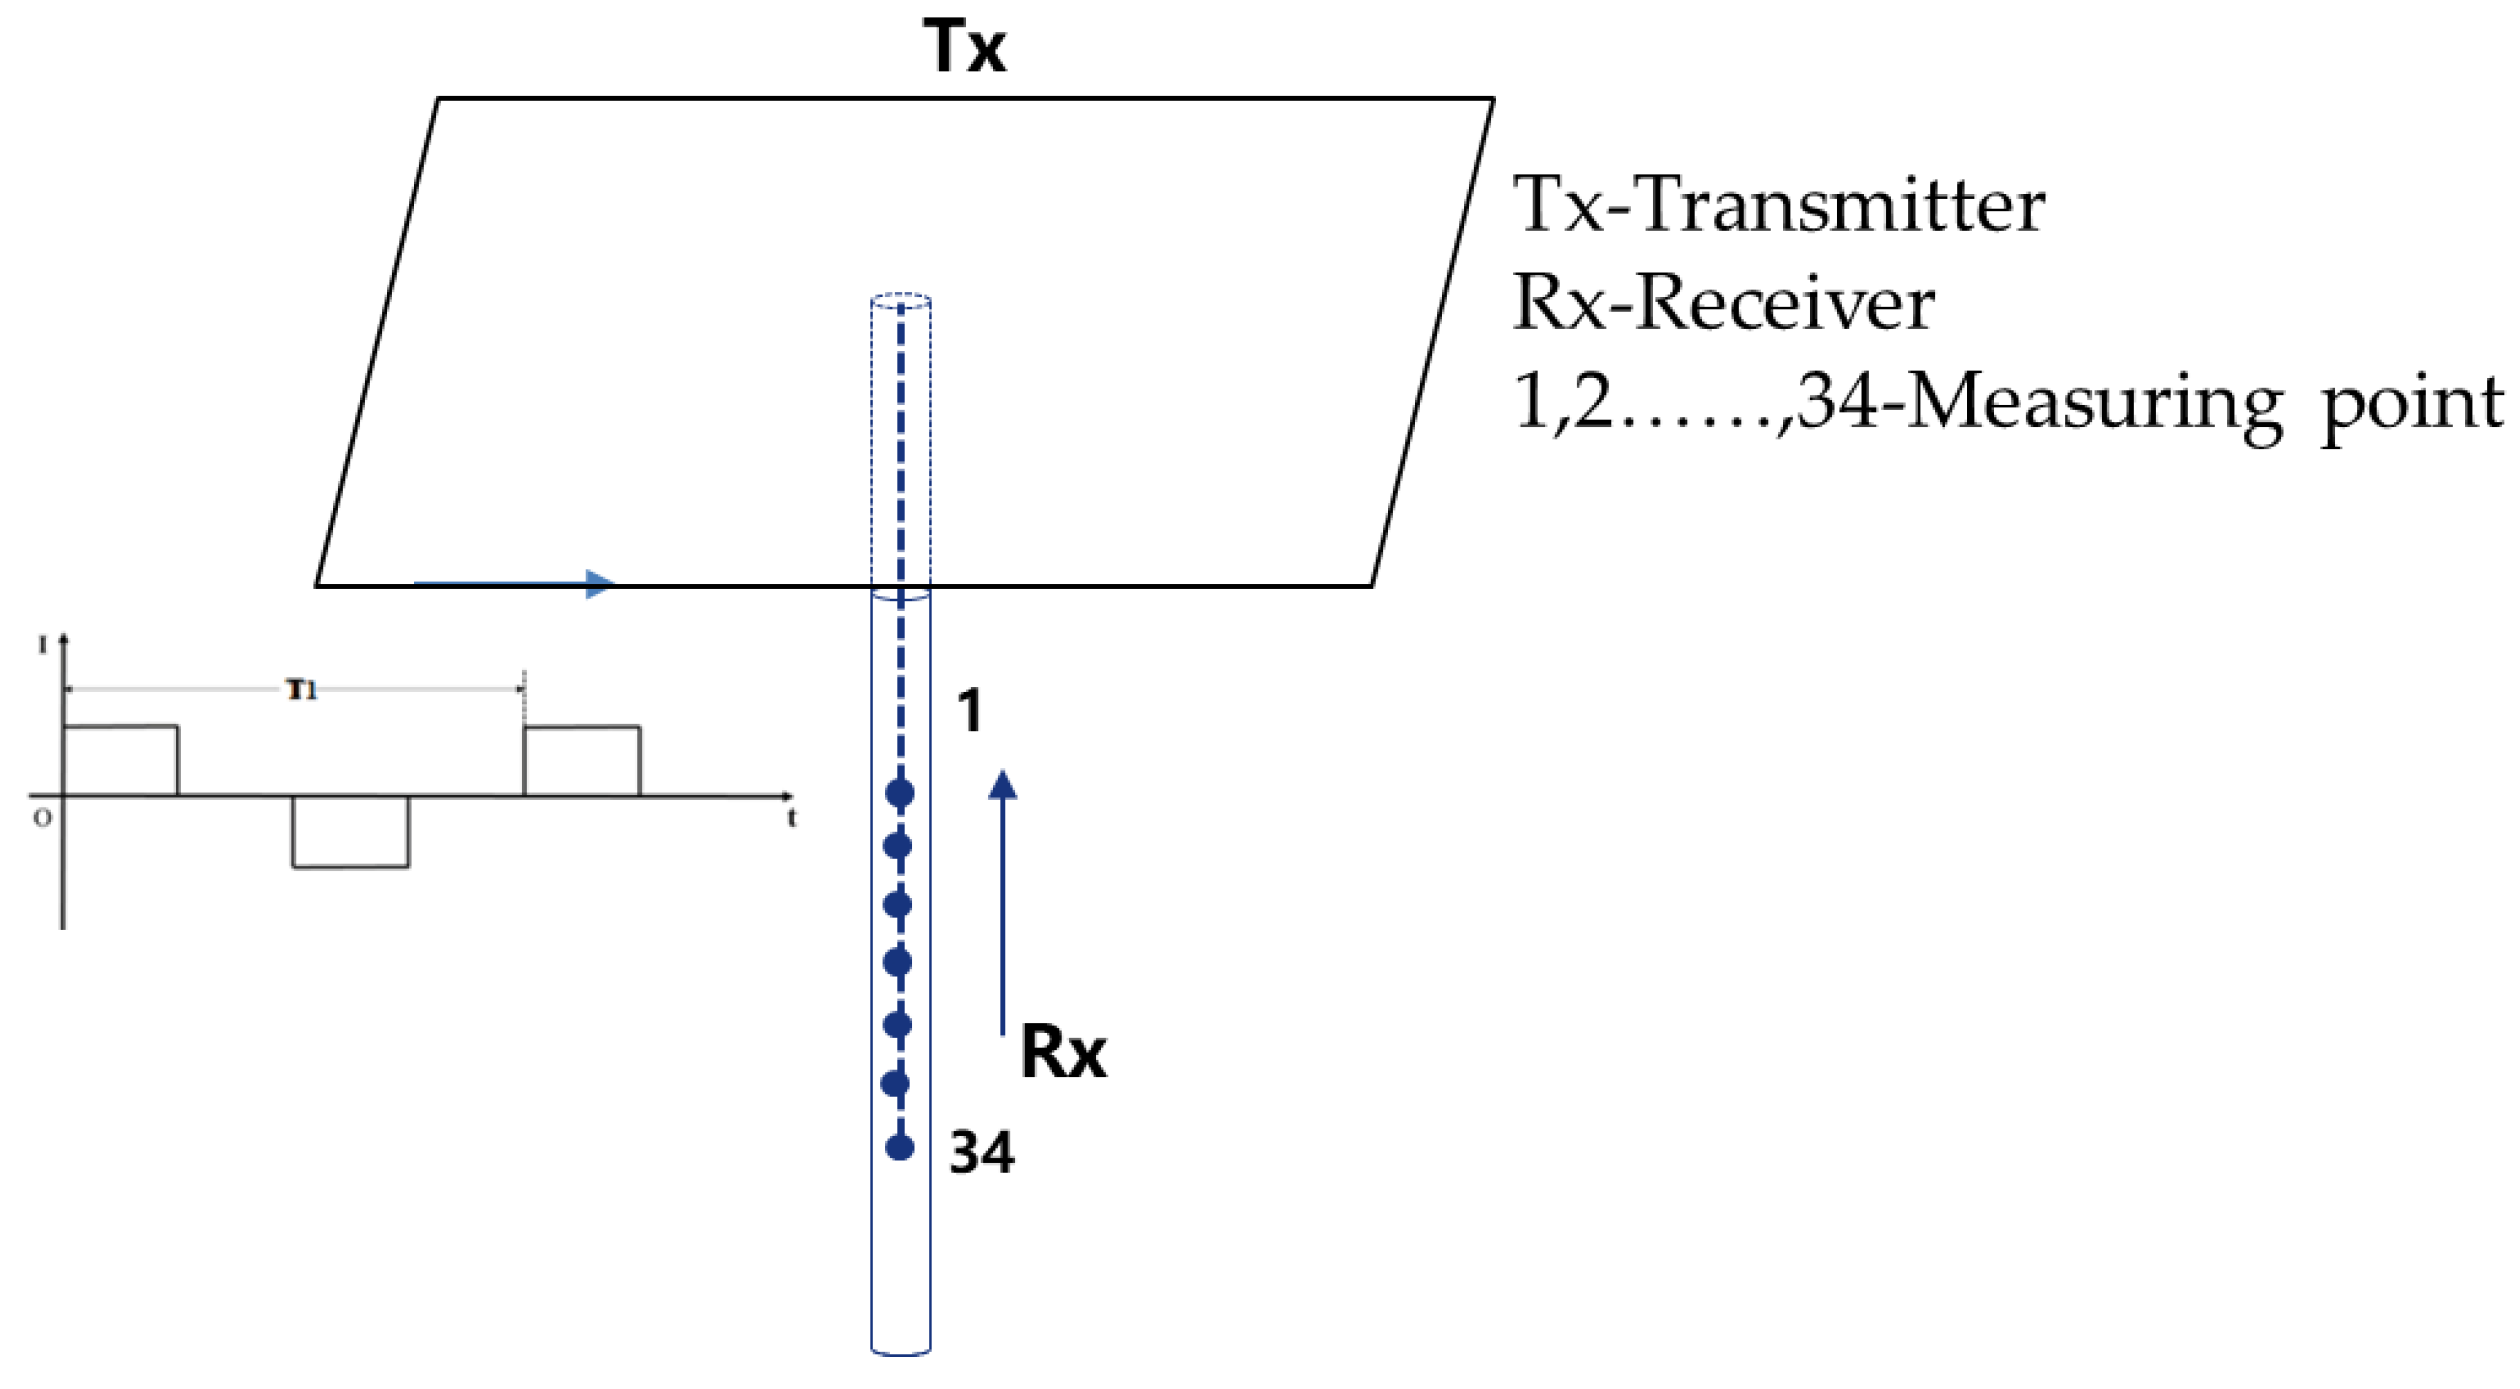
2. Characteristics of Surface-Borehole Transient Electromagnetic Responses

In surface-borehole TEM exploration, long wire sources of different orientations, distances, and currents or large loop sources (also called magnetic sources) of varying equivalent radii and currents are placed near wellheads on the ground, and these sources emit pulse currents to excite the electromagnetic field. When the emission is turned off, borehole electromagnetic signal acquisition systems collect the electromagnetic information of the secondary field induced by the primary field. Information about subsurface electrical conductors can be obtained by analyzing the characteristics of the electromagnetic field [19,20,21].
As borehole electromagnetic signal acquisition systems can collect data from both the primary and secondary electromagnetic fields, their signal dynamic range is large. Therefore, it is necessary to carry out simulations when designing borehole electromagnetic signal acquisition systems to provide references for the selection of devices and the circuit design. In this experiment, the electromagnetic receiver in the borehole was placed in a vertical position, and two types of transmission sources were used—a large loop source and a long wire source. The long wire source simulated two transmission modes based on the transmission azimuth, namely co-linear or radial transmission (the borehole was on the line connecting the two points of the transmitting electrodes (marked as 1 in Figure 1) and sideline transmission (the borehole was not on the line connecting the two points of the transmitting electrodes (marked as 2 in Figure 1). The characteristics of the response signals were analyzed based on the resistivity of different mineral layers in the borehole and the formation [22,23,24,25,26,27,28,29,30,31].
In Figure 1, 1 and 2 represent a radial electrical source and a sideline electrical source, respectively. The intersection of these two sources was taken as the origin of the coordinate system. The directions of the radial electrical source and the sideline electrical source were along the positive x- and y-axes, respectively. The formation resistivity was set to 100 Ω·m, and the resistivity of the metal ore anomaly was 10 Ω·m. The radial electrical source and the sideline electrical source were both 2000 m long in the positive x- and y-axes, respectively. The dimension of the magnetic source was 2000 m × 2000 m, the emission waveform had a square pattern with a width of 1 s, and the emission current was 1 A. The anomaly size was 1000 m × 1000 m × 500 m, the coordinates of the center of the anomaly were (3000 m, 0 m, 2000 m), and the coordinates of the wellhead were (3000 m, 0 m).
The responses of the radial electrical source attenuation field (Ez), the sideline electrical source (dBz/dt), and the large loop source (dBz/dt) are displayed in Figure 2, Figure 3, and Figure 4, respectively, where the x- and y-axes represent the response time (t) with a unit in s and the normalized value of the electrode ring pressure difference signal with respect to distance with a unit in V/m, respectively.
It is evident from Figure 2, Figure 3 and Figure 4 that both the electrical source and the magnetic source had significant anomalies. When the long wire source emitted a current of 1 A, the signal range at a depth of 3000 m was 10−9–10−6 V/m, and when the emission current was raised to 100 A and the electrode distance was set to 10 m, the signal range was 10−6–10−3 V (Figure 2), indicating that the voltage difference between the two non-polarized electrodes was between 1 µV and 1 mV.
It is evident from Figure 3 and Figure 4 that the magnetic signal at a depth of 3000 m was very weak. When the large loop source emitted a current of 1 A, the magnetic signal response at a depth of 3000 m ranged between 10−13–10−9 T/s, and when the emission current was raised to 100 A, the response signal range was 10−11–10−7 T/s.

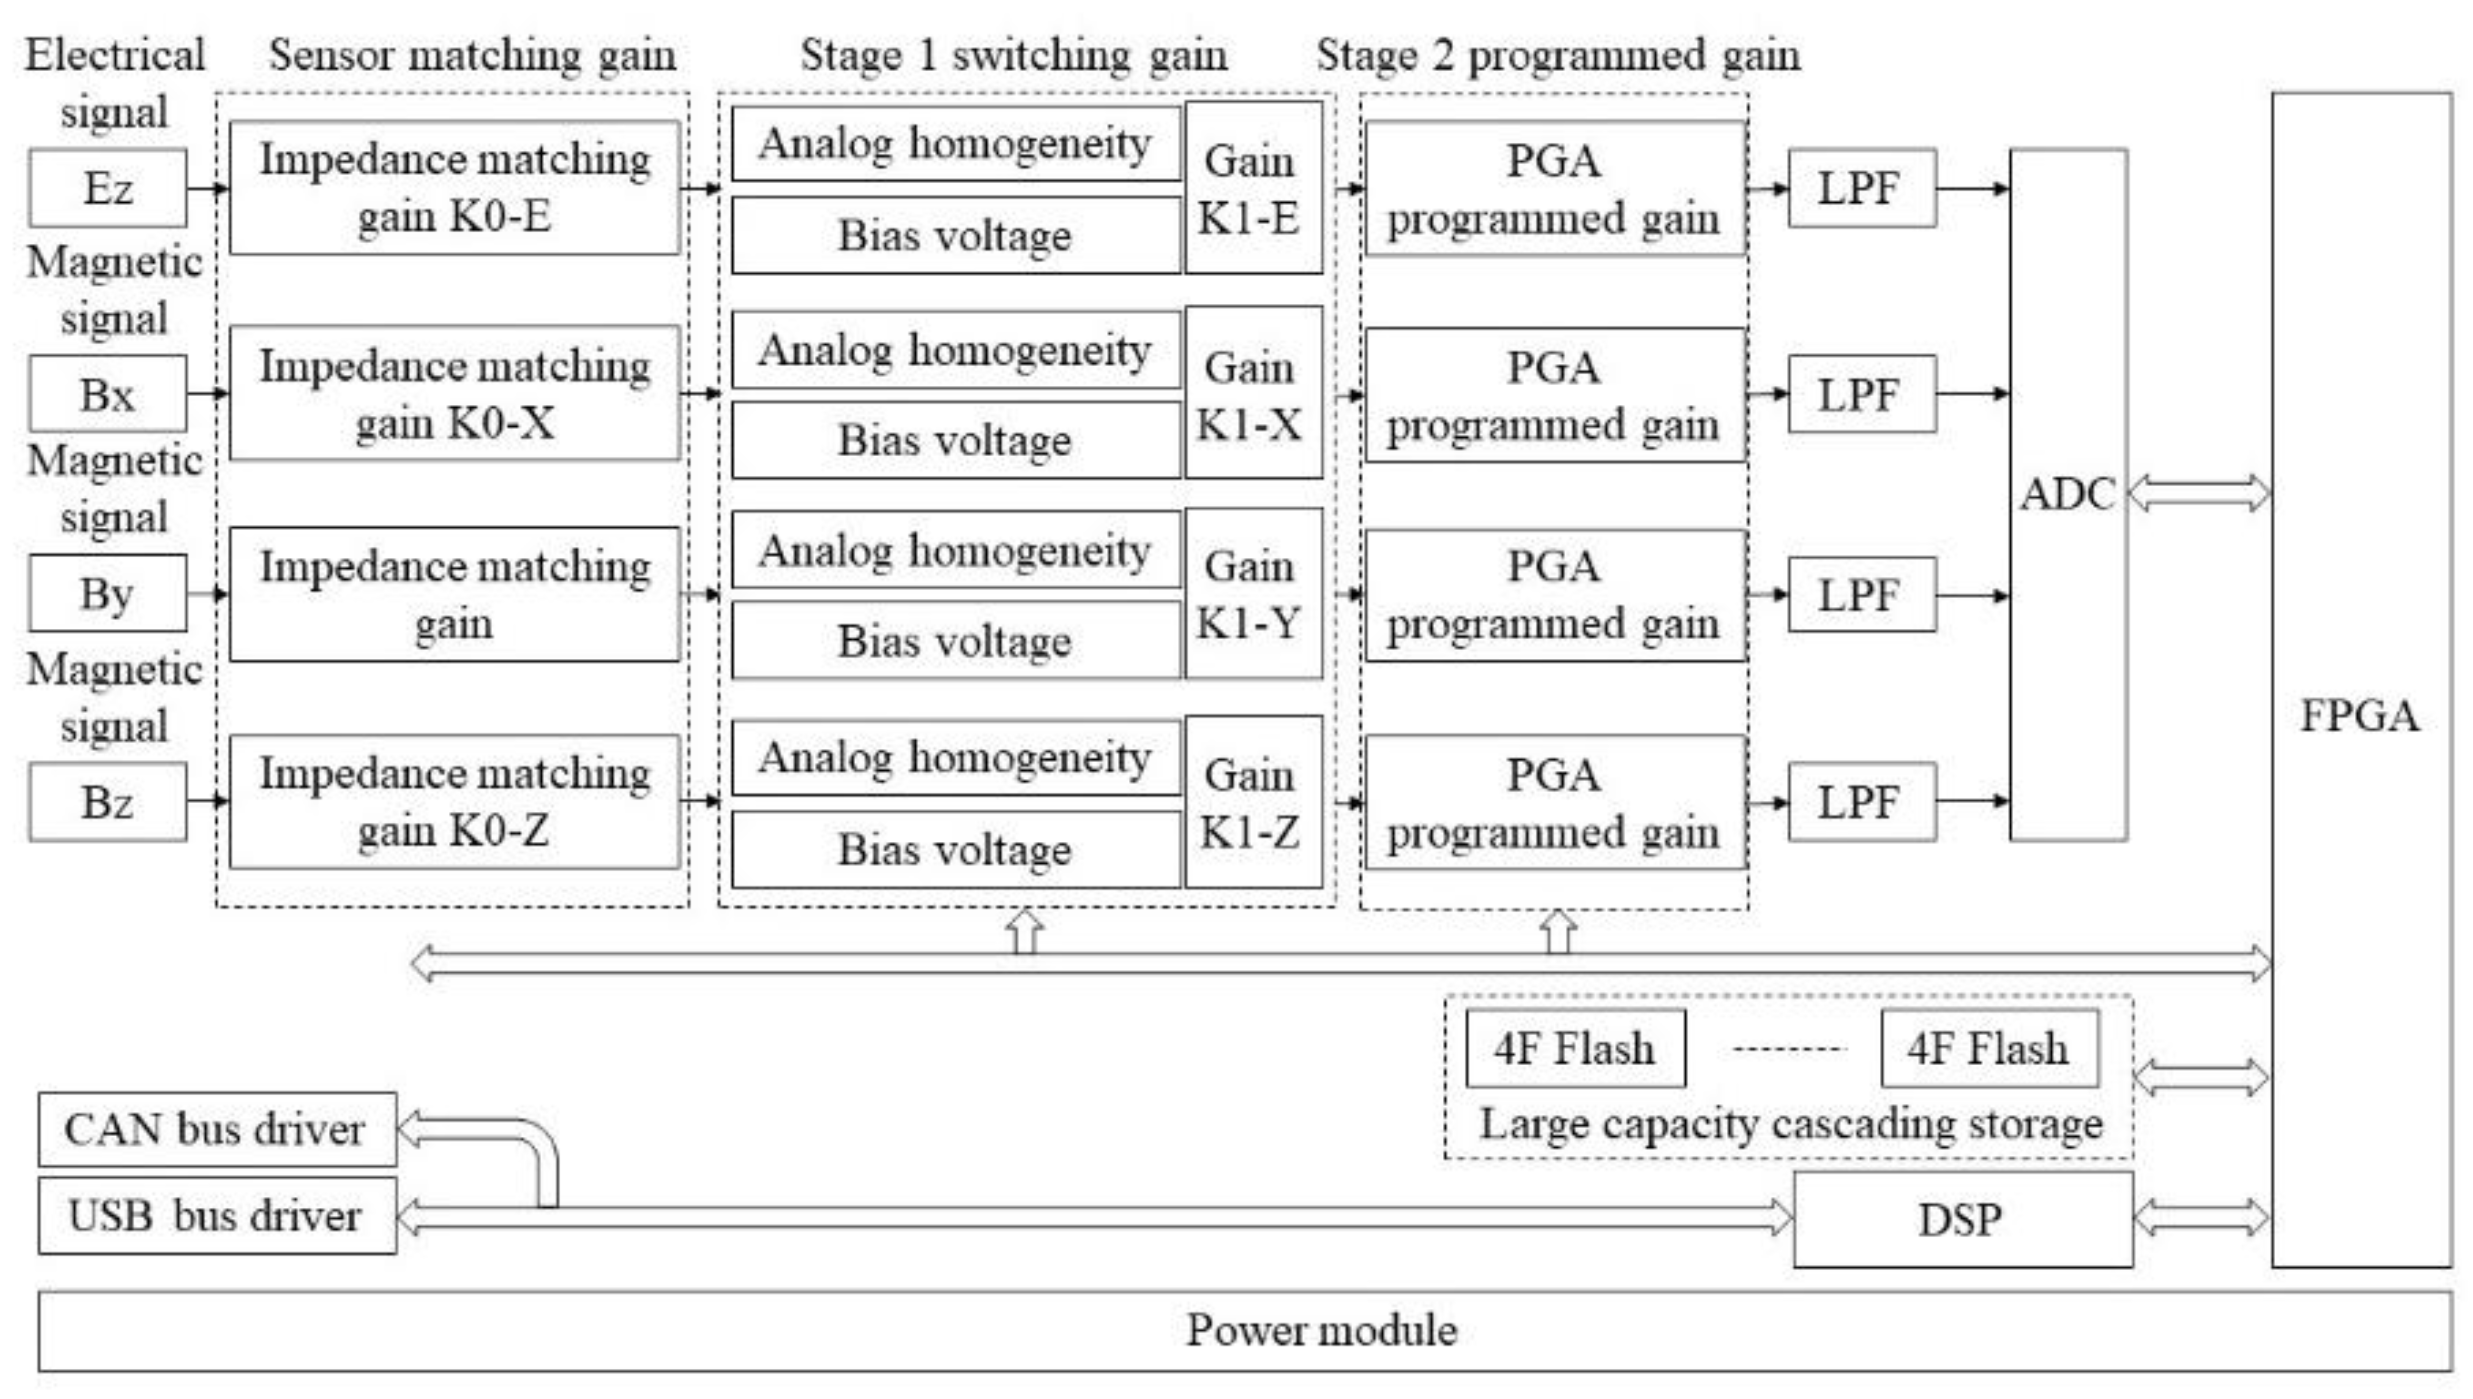
3. Borehole Electromagnetic Signal Acquisition System

The borehole electromagnetic signal acquisition system contained three receiving electrodes (M1, M2, and M3 electrode rings), two magnetic sensors (B1 and B2), and acquisition, insulating, and extension sections. The receiving electrodes and the magnetic field sensors were used to detect electrical and magnetic signals in the borehole, respectively. The acquisition section performed key functions of sending and receiving commands, data acquisition and storage, real-time message transmission, and data reading [31,32].
The borehole electromagnetic signal acquisition system achieved an array acquisition of borehole electromagnetic signals through multiple acquisition nodes (Figure 5). This design supported multi-node attachment and simultaneous logging to enhance efficiency. The insulating and extension sections were inserted between the electrode rings to increase the distance and voltage difference between the electrodes.

3.1. Non-Polarized Electrodes and Three-Component Magnetic Sensor

Non-polarized electrodes and three-component magnetic sensors play a crucial role in transient electromagnetic logging processes. Non-polarized electrodes used in borehole logging systems are generally metal-inert electrodes; however, non-polarized electrodes designed for electrochemical reactions have not yet been used in borehole logging devices. Lead electrodes, stainless steel electrodes, and silver chloride electrodes are mainly used in geophysical exploration. When these electrodes are statically tested without emitting current signals at high temperature (150 °C) and high pressure (100 MPa), lead electrodes experience a significant voltage drift from 0.8 mV to approximately 3 mV after continuous testing for 24 h, whereas the potential range of stainless-steel electrodes and silver chloride electrodes remains relatively stable. However, even in a stable state, the potential range of the stainless-steel electrodes is greater than that of the silver chloride electrodes. It is reported that silver chloride electrodes have the smallest potential range with a minimum stable potential of around 0.01 mV [33]. Therefore, a ring-shaped silver chloride electrode was used as the non-polarized electrode in the borehole.
The three-component magnetic field sensor could measure the magnetic field components in the X-, Y-, and Z-directions simultaneously [34,35,36]. Considering the size of the borehole, the magnetic sensor adopted a miniature design with an increased length in the z-axis.
In Faraday’s law of electromagnetic induction, the induced electromotive force (EMF) generated in a receiving coil is directly related to the rate of change in the magnetic flux that passes through the coil. The magnetic flux Φ is the product of the magnetic field strength B, the coil area S, and the cosine of the angle θ between the magnetic field direction and the normal direction of the coil plane, as follows:
Φ = B S c o s θ
However, in many cases, we assume that the magnetic field direction is perpendicular to the coil plane (θ = 0 or θ = π), simplifying the magnetic flux to the following:
Φ = B S
But in the context of induced EMF, we are more concerned with how the magnetic flux changes over time. Assuming that the magnetic field strength B is a function of time B(t), while the coil area S and the angle θ remain constant, the magnetic flux also varies with time, such as the following:
Φ ( t ) = B ( t ) S
Next, according to the differential form of Faraday’s law of electromagnetic induction, the induced EMF E is the derivative of the magnetic flux Φ with respect to time t, multiplied by the number of turns N in the coil, as demonstrated in the following equation:
U ( t ) = N d Φ d t
Substituting Equation (3) into Equation (4), the induced electromotive force generated in the receiving coil can be calculated as follows:
U = N π r R 2 d B z ( t ) d t
where t is the time, N is the number of turns in the receiving coil, r R is the radius of the receiving coil, and B z is the magnetic field strength in the z-axis.
It indicates that the magnitude of the induced EMF is directly proportional to the rate of change in the magnetic field strength over time, as well as to the number of turns and the area of the coil.
The sensitivity was calculated from the noise factor (NF), as follows:
N F = S N R i S N R o = P i n / P n S N R o
Hence, the following equation is formed:
P i n = N F · P n · S N R o
where P i n and P n represent the input signal power and the input source resistance noise power under unit bandwidth, respectively. Within a certain bandwidth range B, after integrating and taking the logarithm, Equation (3) becomes as follows:
S m i n = N F d B + P n + B d B + S N R o d B
where P n represents the thermal noise power spectrum when the ambient temperature (T) was 300 K, and the internal resistance of the input noise source matched the load ( P n = −173.8 dBm/Hz).

3.2. Key Technologies of the Borehole Electromagnetic Signal Acquisition System

The borehole electromagnetic signal acquisition system was composed of an analog circuit and a digital circuit (Figure 6). The analog circuit comprised the following seven components: electric field and magnetic field sensors, a sensor-matching gain circuit, a first-stage switching gain circuit, a second-stage programmable gain circuit, a low-pass filter, an ADC analog circuit, and a power module. The digital circuit consisted of the following six components: a field-programmable gate array (FPGA), a digital signal process (DSP), an analog-to-digital converter (ADC) digital circuit, a large-capacity cascade storage module, a controller area network (CAN) bus driver, and a universal serial bus (USB) driver.
At depths of less than 3000 m, the electromagnetic signal acquisition system should withstand high temperatures and high pressures and ensure high-precision signal acquisition and transmission. Optimal gain and sampling frequency could greatly enhance the sensitivity and resolution of the acquisition system [37].

3.2.1. Channel Gain

An ADS1278 borehole electromagnetic signal acquisition chip (Texas Instruments, Dallas, TX, USA) was used in this experiment, and it could operate at 210 °C and had a 24-bit resolution with an effective signal acquisition range from zero to U2. The impedance matching circuit gain for the magnetic sensor output (K0-B) was U1/U2, where U1 is the maximum signal output from the internal gain circuit of the three-component magnetic sensor. The electric signal sensor was a passive one, and its impedance matching circuit gain (K0-E) was equal to one. In the first stage of the electromagnetic signal amplification circuit, an analog switch chip paired with an instrumentation operational amplifier was employed to switch between gain multipliers of K1 and 1. The voltage reference end of this instrumentation operational amplifier circuit was connected to the output of a voltage reference chip to generate a bias potential of Uref = U2/2, which ensured that the positive and negative voltage signals at the output of the electromagnetic signal sensor were converted into a unipolar voltage signal ranging from 0 to U2. In the second stage of the electromagnetic signal amplification circuit, a programmable gain chip powered by unipolar U2 was used to generate programmable gain multipliers (K2) of 1, 2, 5, 10, 20, 50, 100, and 200. In the third stage of the electromagnetic signal amplification circuit, a low-pass filter circuit with a cutoff frequency of 20 kHz was used, and the output was sent to the input of ADC for acquisition.

3.2.2. Sampling Frequency

The sampling frequency of a borehole electromagnetic signal acquisition system is limited by the circuit size of the subsurface high-temperature storage chip. The maximum capacity of high-temperature (175 °C) NANDFLASH thick film package chips is 4G bytes. If these chips exceed this capacity, they need to be stored in a cascade manner. If the ADC sampling frequency is f, the ADC is a 24-bit chip, the subsurface high-temperature DSP is a 32-bit chip, and the data are stored in 32 bits, then the amount of data collected per second would be 32 × f × 4 bits. The transmission rate of most subsurface and surface transmission systems is 430 kbps; hence, f ≤ 3.4 kHz. The time-domain sampling rate generally ranges between 10 and 100 kHz, and this sampling frequency is enough for the time-domain electromagnetic signal acquisition. At the minimum sampling frequency of 10 kHz, the real-time transmission rate of surface and subsurface data is 10 kHz × 32 bit × 4 = 1.28 Mbps, which is much higher than the transmission rate for kilometer-level logging in the existing commercial systems in China. Therefore, in order to ensure data integrity, the borehole electromagnetic signal acquisition system used in this experiment adopted local storage.
If the maximum chip storage capacity is 4G bytes, the storage time of a single chip is 4096 M byte/1.28 M bps = 4096 × 8 M bit/1.28 M bps = 25,600 s = 7.1 h. If the sampling frequency is raised to 100 k, the storage time of a single storage chip becomes 0.71 h. As a single borehole generally takes 5–10 h for surface-borehole transient electromagnetic exploration, it would need ten chips to ensure normal operation, resulting in the difficulty of local storage in the borehole. Considering the transmission rate, signal validity, and local storage capacity in the borehole, the sampling frequency of the system used in this study was set to 8 kHz.

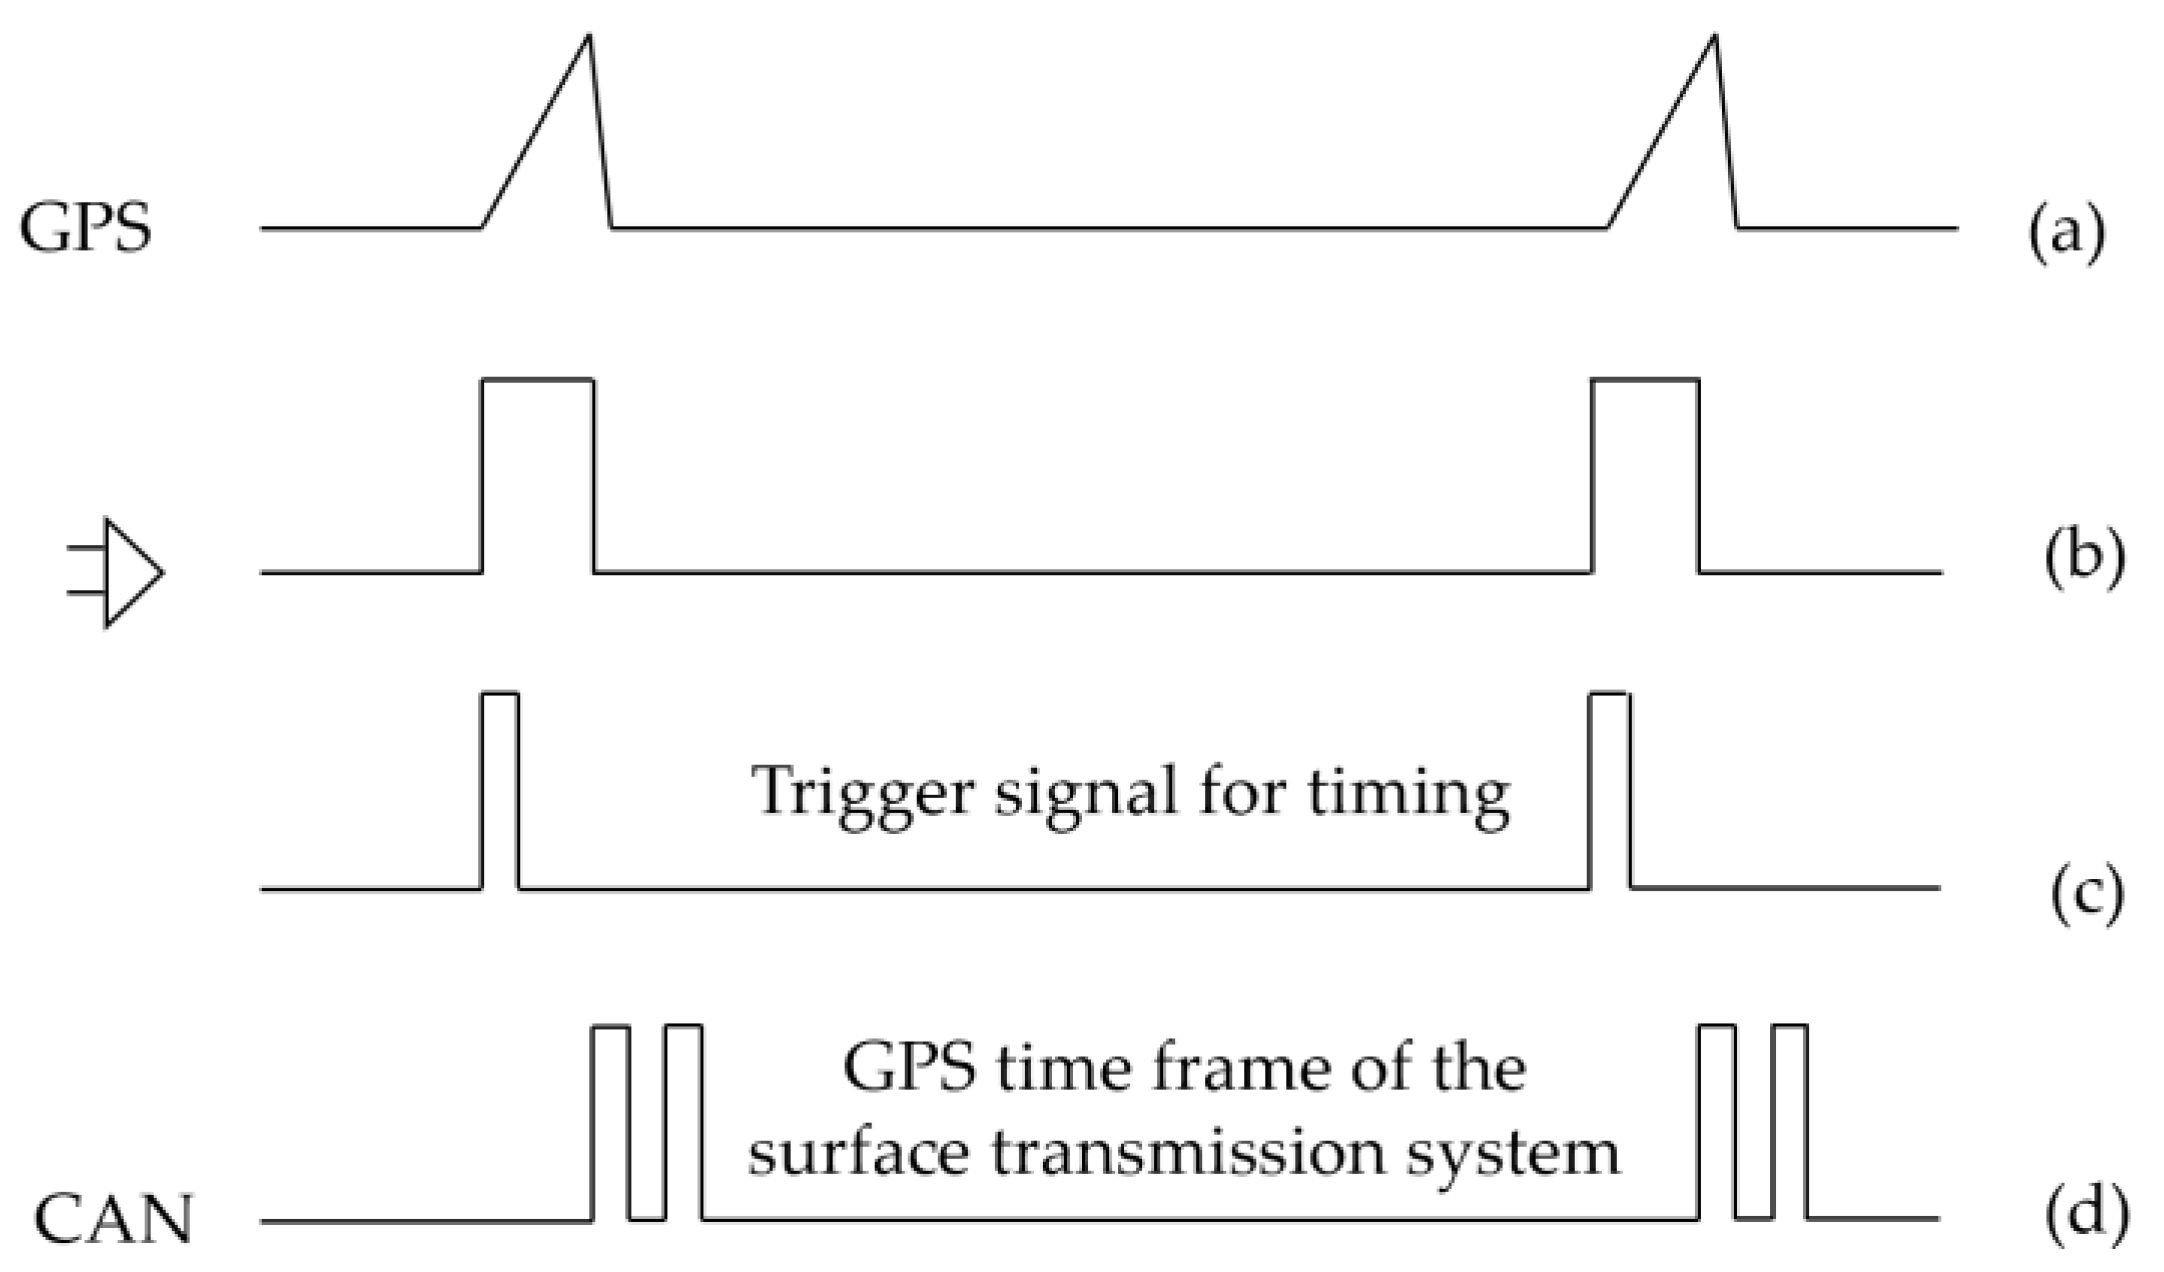
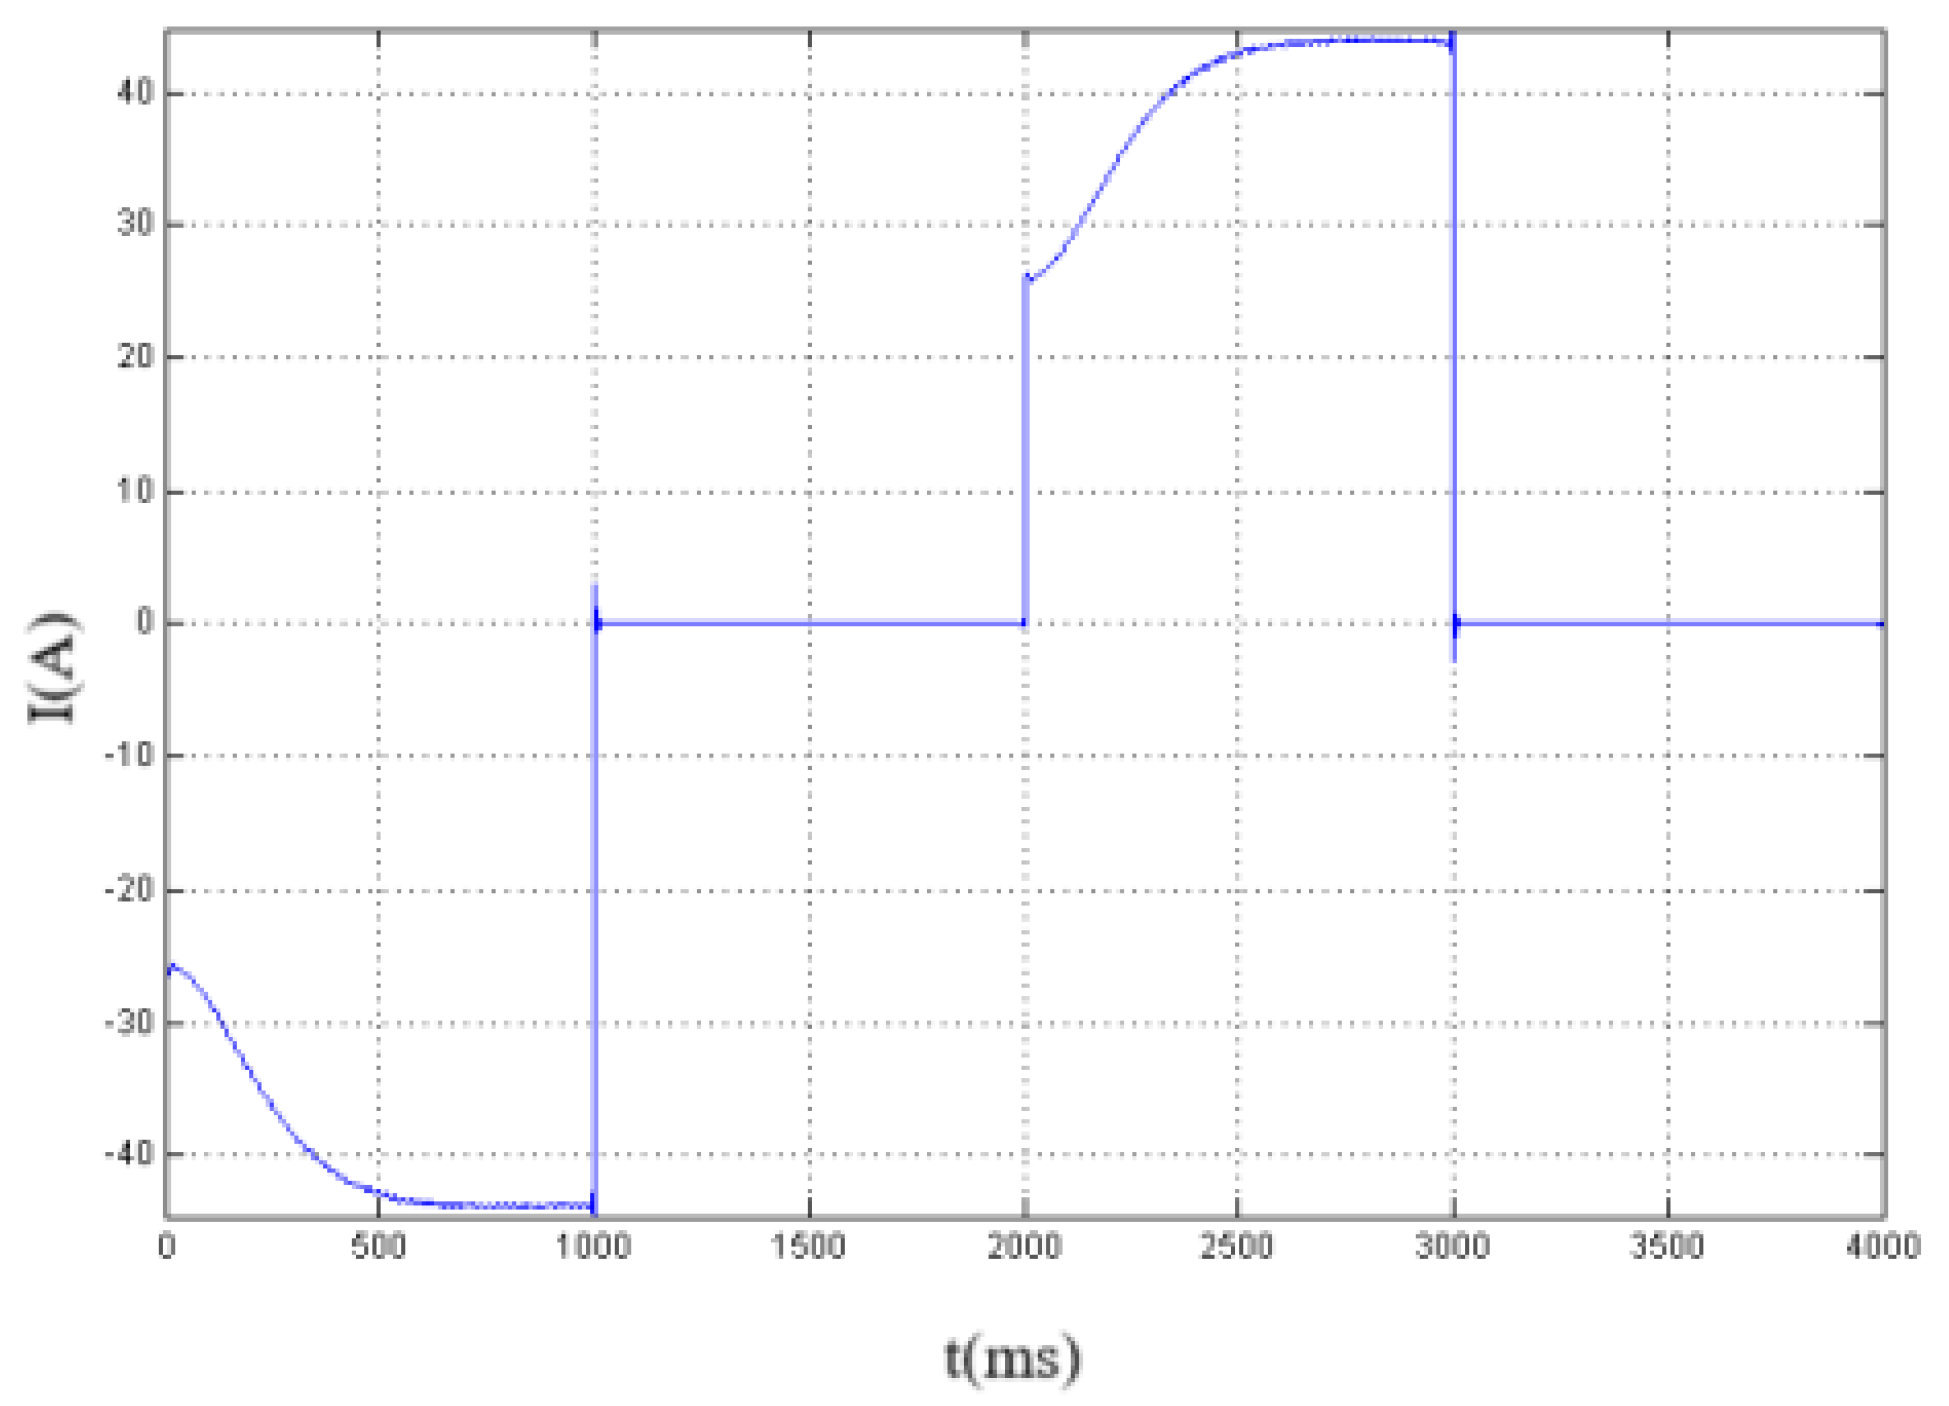
3.2.3. Synchronization of the Surface Transmission System and the Borehole Electromagnetic Signal Acquisition System

Conventional GPS (Global Position System)-based synchronous transmission and reception systems are not suitable for borehole TEM systems. The synchronization of the subsurface electromagnetic signal acquisition system and the surface transmission system was achieved through the following steps. The surface GPS module first accurately generated time pulse signals (Figure 7a), which were then transmitted to the subsurface electromagnetic signal acquisition system through logging cables (length of several thousand meters). In the subsurface electromagnetic signal acquisition system, the received time pulse signals were processed by a hardware comparator and shaped into trigger square waves (Figure 7b). The rising edge of the square waves further triggered the subsurface acquisition system to read the time frame of the subsurface timing module (Figure 7c). The time frame contained the precise time information of the subsurface timing module, and by associating it with the trigger square waves, the accuracy of the subsurface time information was ensured. The time frame of the surface transmission system was also transmitted to the subsurface electromagnetic signal acquisition system through the CAN bus of the logging telemetry system (Figure 7d), and it was aligned with the time frame of the subsurface timing module. The time synchronization of all subsurface nodes and the surface transmission system was achieved by accurately comparing and calibrating the time frames of the time series in the data processing software.
GPS pulses have a certain delay after being transmitted through several kilometers of logging cables. For example, coaxial cables have a delay of about 5 μs/km. The core of the synchronization between the surface and subsurface systems lies in the transmission of GPS pulses. Pulse synchronization can be started by GPS synchronization, and it will no longer respond to subsequent GPS pulses and only run according to the crystal oscillator clock inside the borehole electromagnetic signal acquisition system. Therefore, the borehole electromagnetic signal acquisition system used in this experiment included hardware for GPS signal control. The surface transmission system transmitted GPS time signals to the borehole acquisition system through the logging telemetry system and then sent the rising edges of GPS pulses (Figure 8). The borehole electromagnetic signal acquisition system used these rising edges as the time reference, then performed sampling at a fixed sampling rate, and stored the electromagnetic signal time series with time frames. In the data processing software, the time series of emitted signals and electromagnetic signals were synchronized through time frame alignment.

4. Tests in Real Mines

After carrying out the high-temperature and high-pressure tests on the borehole transient electromagnetic acquisition system, borehole logging was executed in the borehole named ZK409 of a mining area in Hubei. The copper–iron resources in this area contain typical skarn copper–iron ores. Table 1 presents the rock and ore conditions of each layer in the mine.
The thickness of the mineralized metallic ore layer was 15.2 m (depth = 762.76–777.96 m). A long wire source and a large loop source were used in the surface-borehole transient electromagnetic tests [38,39]. The specific test plan is presented in Figure 9 and Figure 10.
Figure 9 illustrates the surface-borehole transient electromagnetic test setup using a long wire source. A 3000 m long wire emitted time-domain bipolar zero-crossing square wave signals with a transmission current of 60 A. The borehole reception section was placed at a depth of between 600 and 880 m, with an electrode spacing of 10 m. During the hoisting process, measurements were taken at 29 designated points. Figure 10 displays the surface-borehole transient electromagnetic test setup using a large loop source. A 5000 m large loop source emitted time-domain bipolar zero-crossing square wave signals with a transmission current of 40 A. The borehole reception section was placed at depths of between 600 and 880 m, with an electrode spacing of 10 m. During the hoisting process, measurements were taken at 34 designated points.

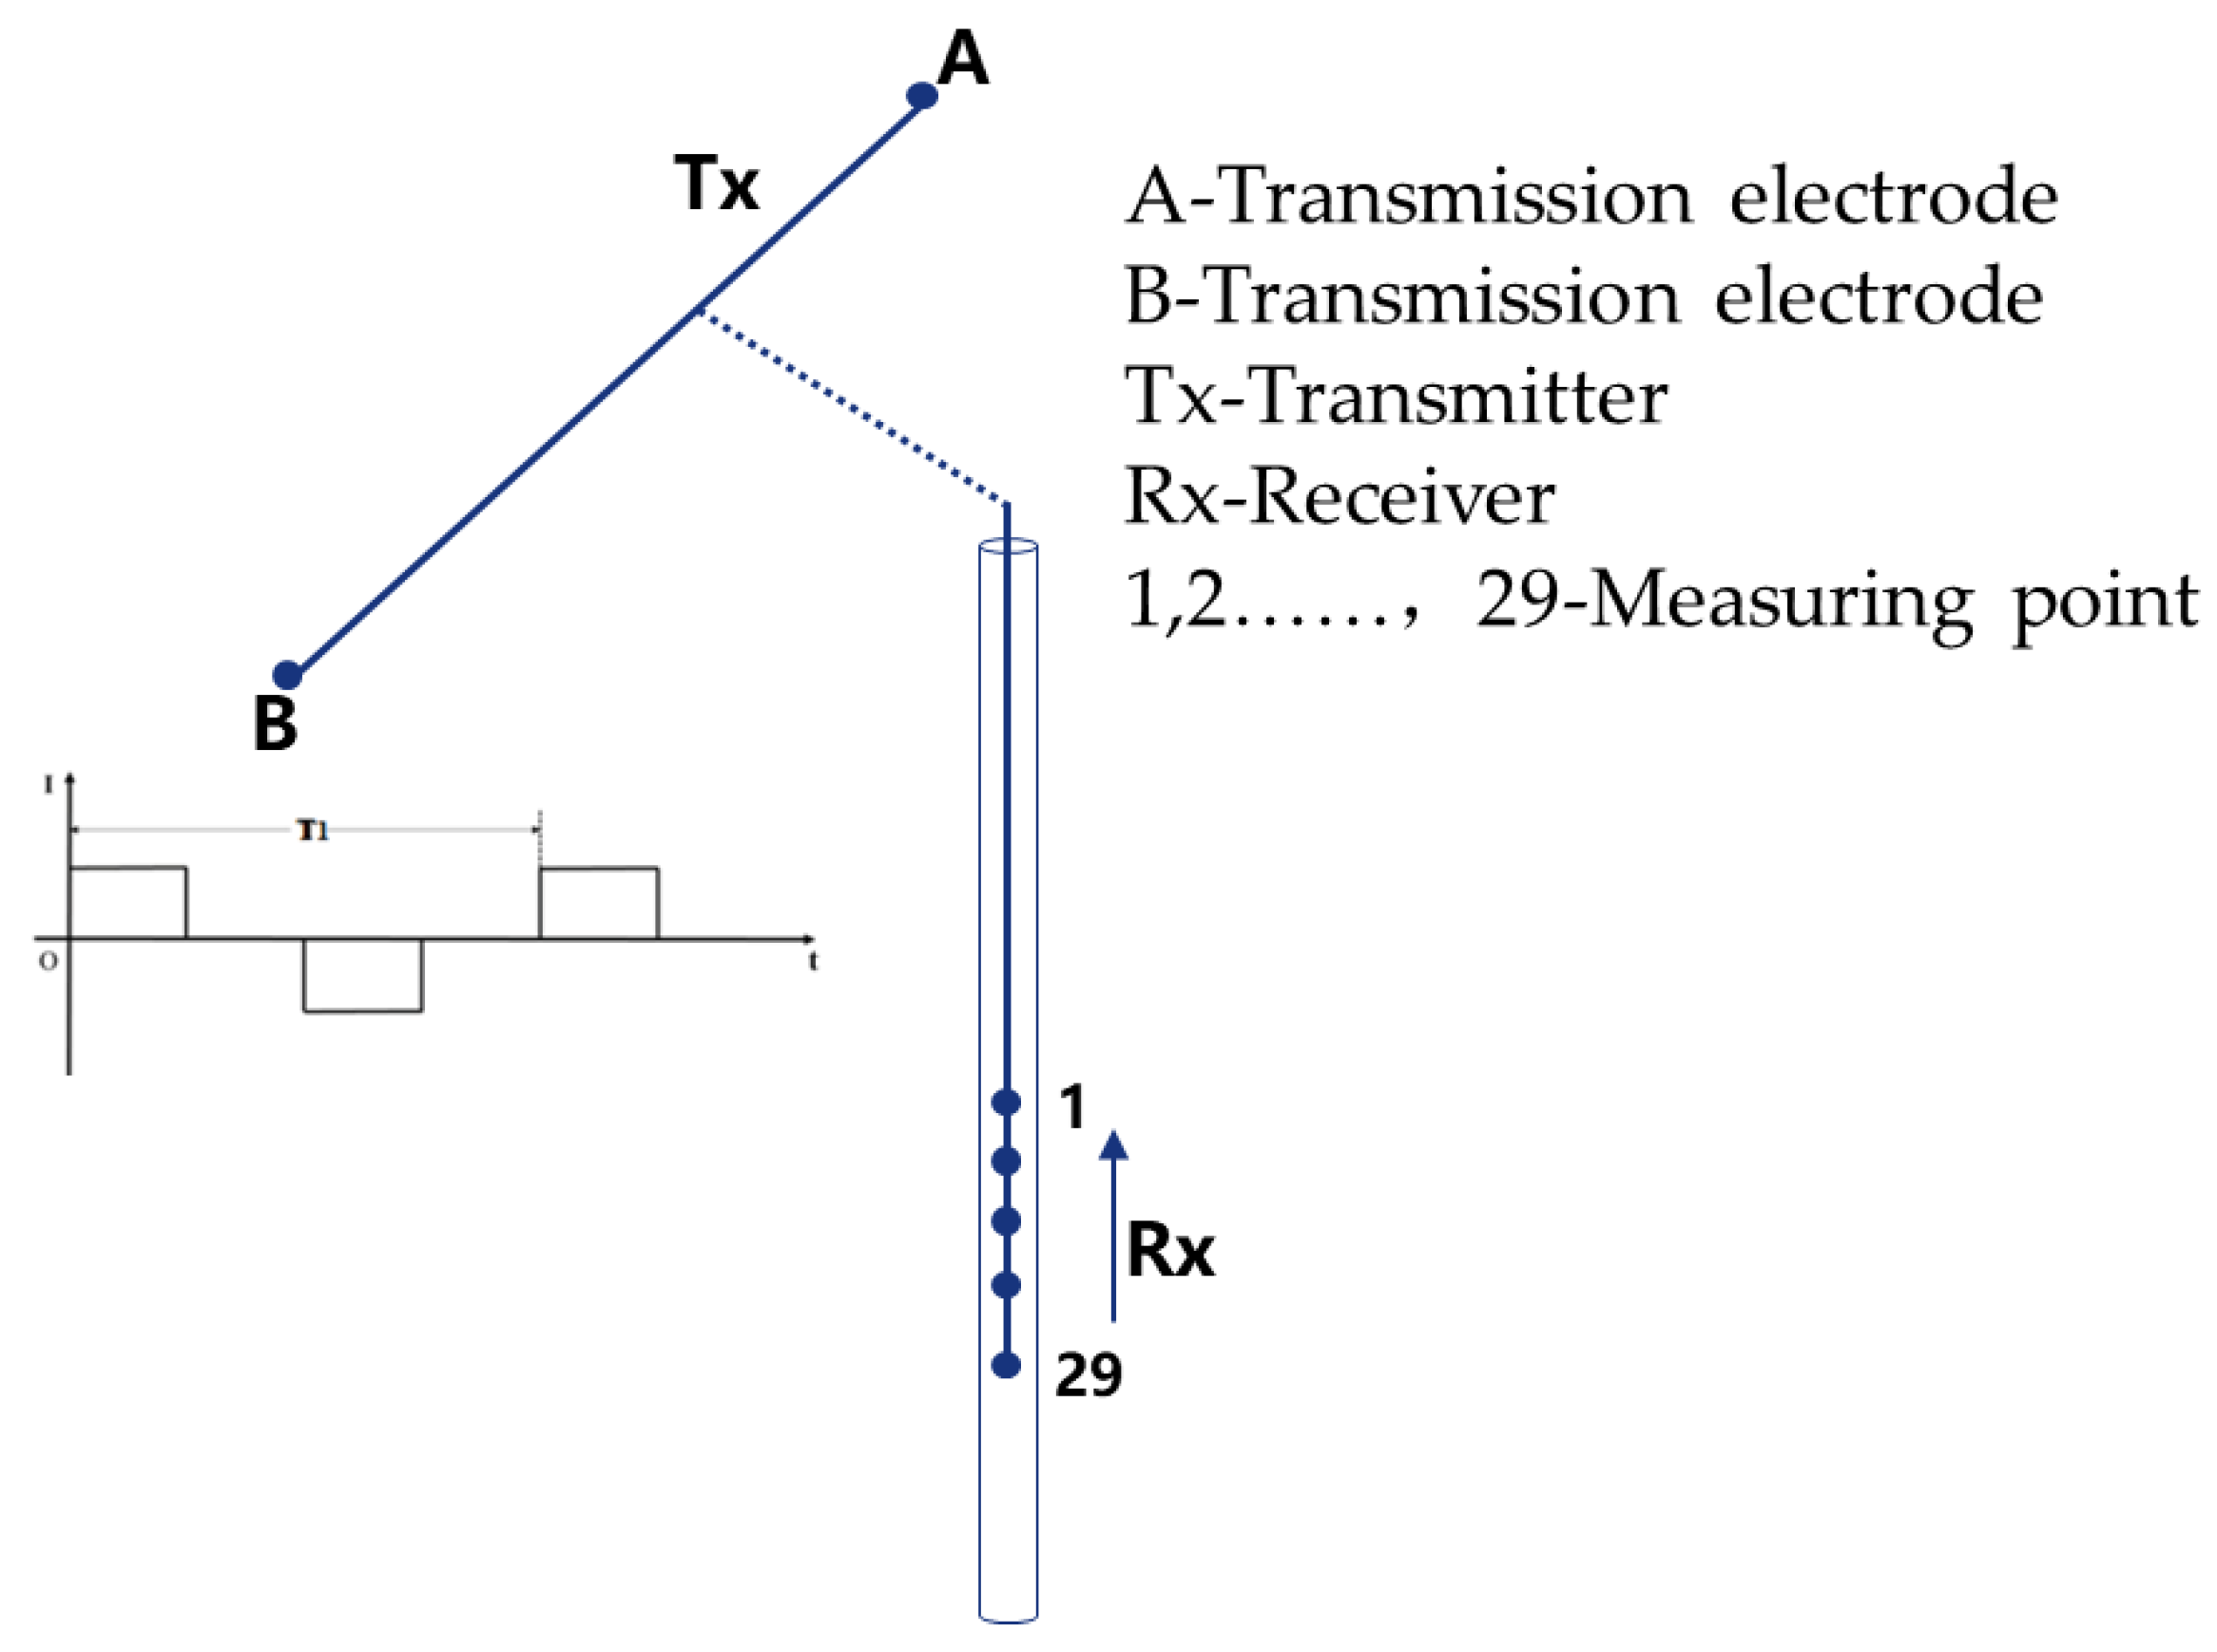
4.1. Transient Electromagnetic Test with a Long Wire Source

Figure 11 shows the waveform of a 60 A current emitted by the long wire source, and Figure 12 presents the signals received by the borehole receiver at depths of 760 m and 880 m. Figure 12a displays the signal at a depth of 760 m, where the ore layer was located, and Figure 12b presents the signal at a depth of 880 m. It is evident that the signals collected by the borehole electromagnetic signal acquisition system are valid. The collected signals were normalized for emission current and potential difference, and iso-time curves for the measurement points at different depths were obtained (Figure 13, where the y- and x-axes represent the depth (Unit: m) and the iso-time curves of the normalized potential signals (Ez; Unit: V/A/m).
The borehole electromagnetic signal acquisition system recorded the transient electromagnetic signal of a single measurement point and performed pre-processing. The electrical signals measured at 760 m and 880 m are focused on in Figure 12.
Figure 13 shows that when the long wire source emitted a current, the electric field (Ez) manifested a significant response in the 760–780 m layer. All decay time curves had lower amplitudes in this layer, indicating that the ore layer had good conductivity, and the time-domain curves also converged well in this layer. Due to the low resistivity, the Ez component signal was quite weak near the copper–iron ore layer, causing near-zero values at depths of 760–770 m, which was consistent with the data from the geological profile. Figure 14 reveals that upon entering the ore layer, a significant negative anomaly occurred in dBz/dt signals. In other words, one side was a positive anomaly, and the other was a negative anomaly, because the ore body was mostly inclined, resulting in positive and negative anomaly asymmetry. The magnetic field (dBz/dt) anomaly characteristics reflected the position of the ore body borehole and were consistent with the target horizon, corresponding to the vertical electric field Ez anomaly characteristics.

4.2. Transient Electromagnetic Test with a Large Loop Source

Figure 15 displays the waveform of a 40 A current emitted by the large loop source, and Figure 16 and Figure 17 present the Ez and dBz/dt signals collected by the electromagnetic signal acquisition system at the depths of 760 and 880 m, respectively. It is evident that the time variation and amplitude of the electrical signals at different depths varied greatly, especially upon entering the ore layer, great anomalies were noticed in signal responses. Figure 18 and Figure 19 display the signals after normalization.
Figure 18 shows that when the large loop source emitted a current, the Ez amplitude in the ore layer was significantly smaller than that of the other layers, aligning with the geological profile of borehole ZK409. Figure 19 indicates that the magnetic field (dBz/dt) had a significant response in the 760–780 m layer. The attenuation time curves had low amplitudes in this layer, and the time-domain curves also converged well. This congruence with the target horizon, which corresponds to the distinctive anomaly characteristics of the vertical electric field (Ez). This consistency indicates the reliability of the data collected by the electromagnetic receiver in the borehole and its consistency with geological expectations.

5. Conclusions

  • The borehole electromagnetic signal acquisition system designed in this study achieved the synchronous acquisition and storage of time-domain signals of three-component magnetic field signals and electrical signals in the borehole;
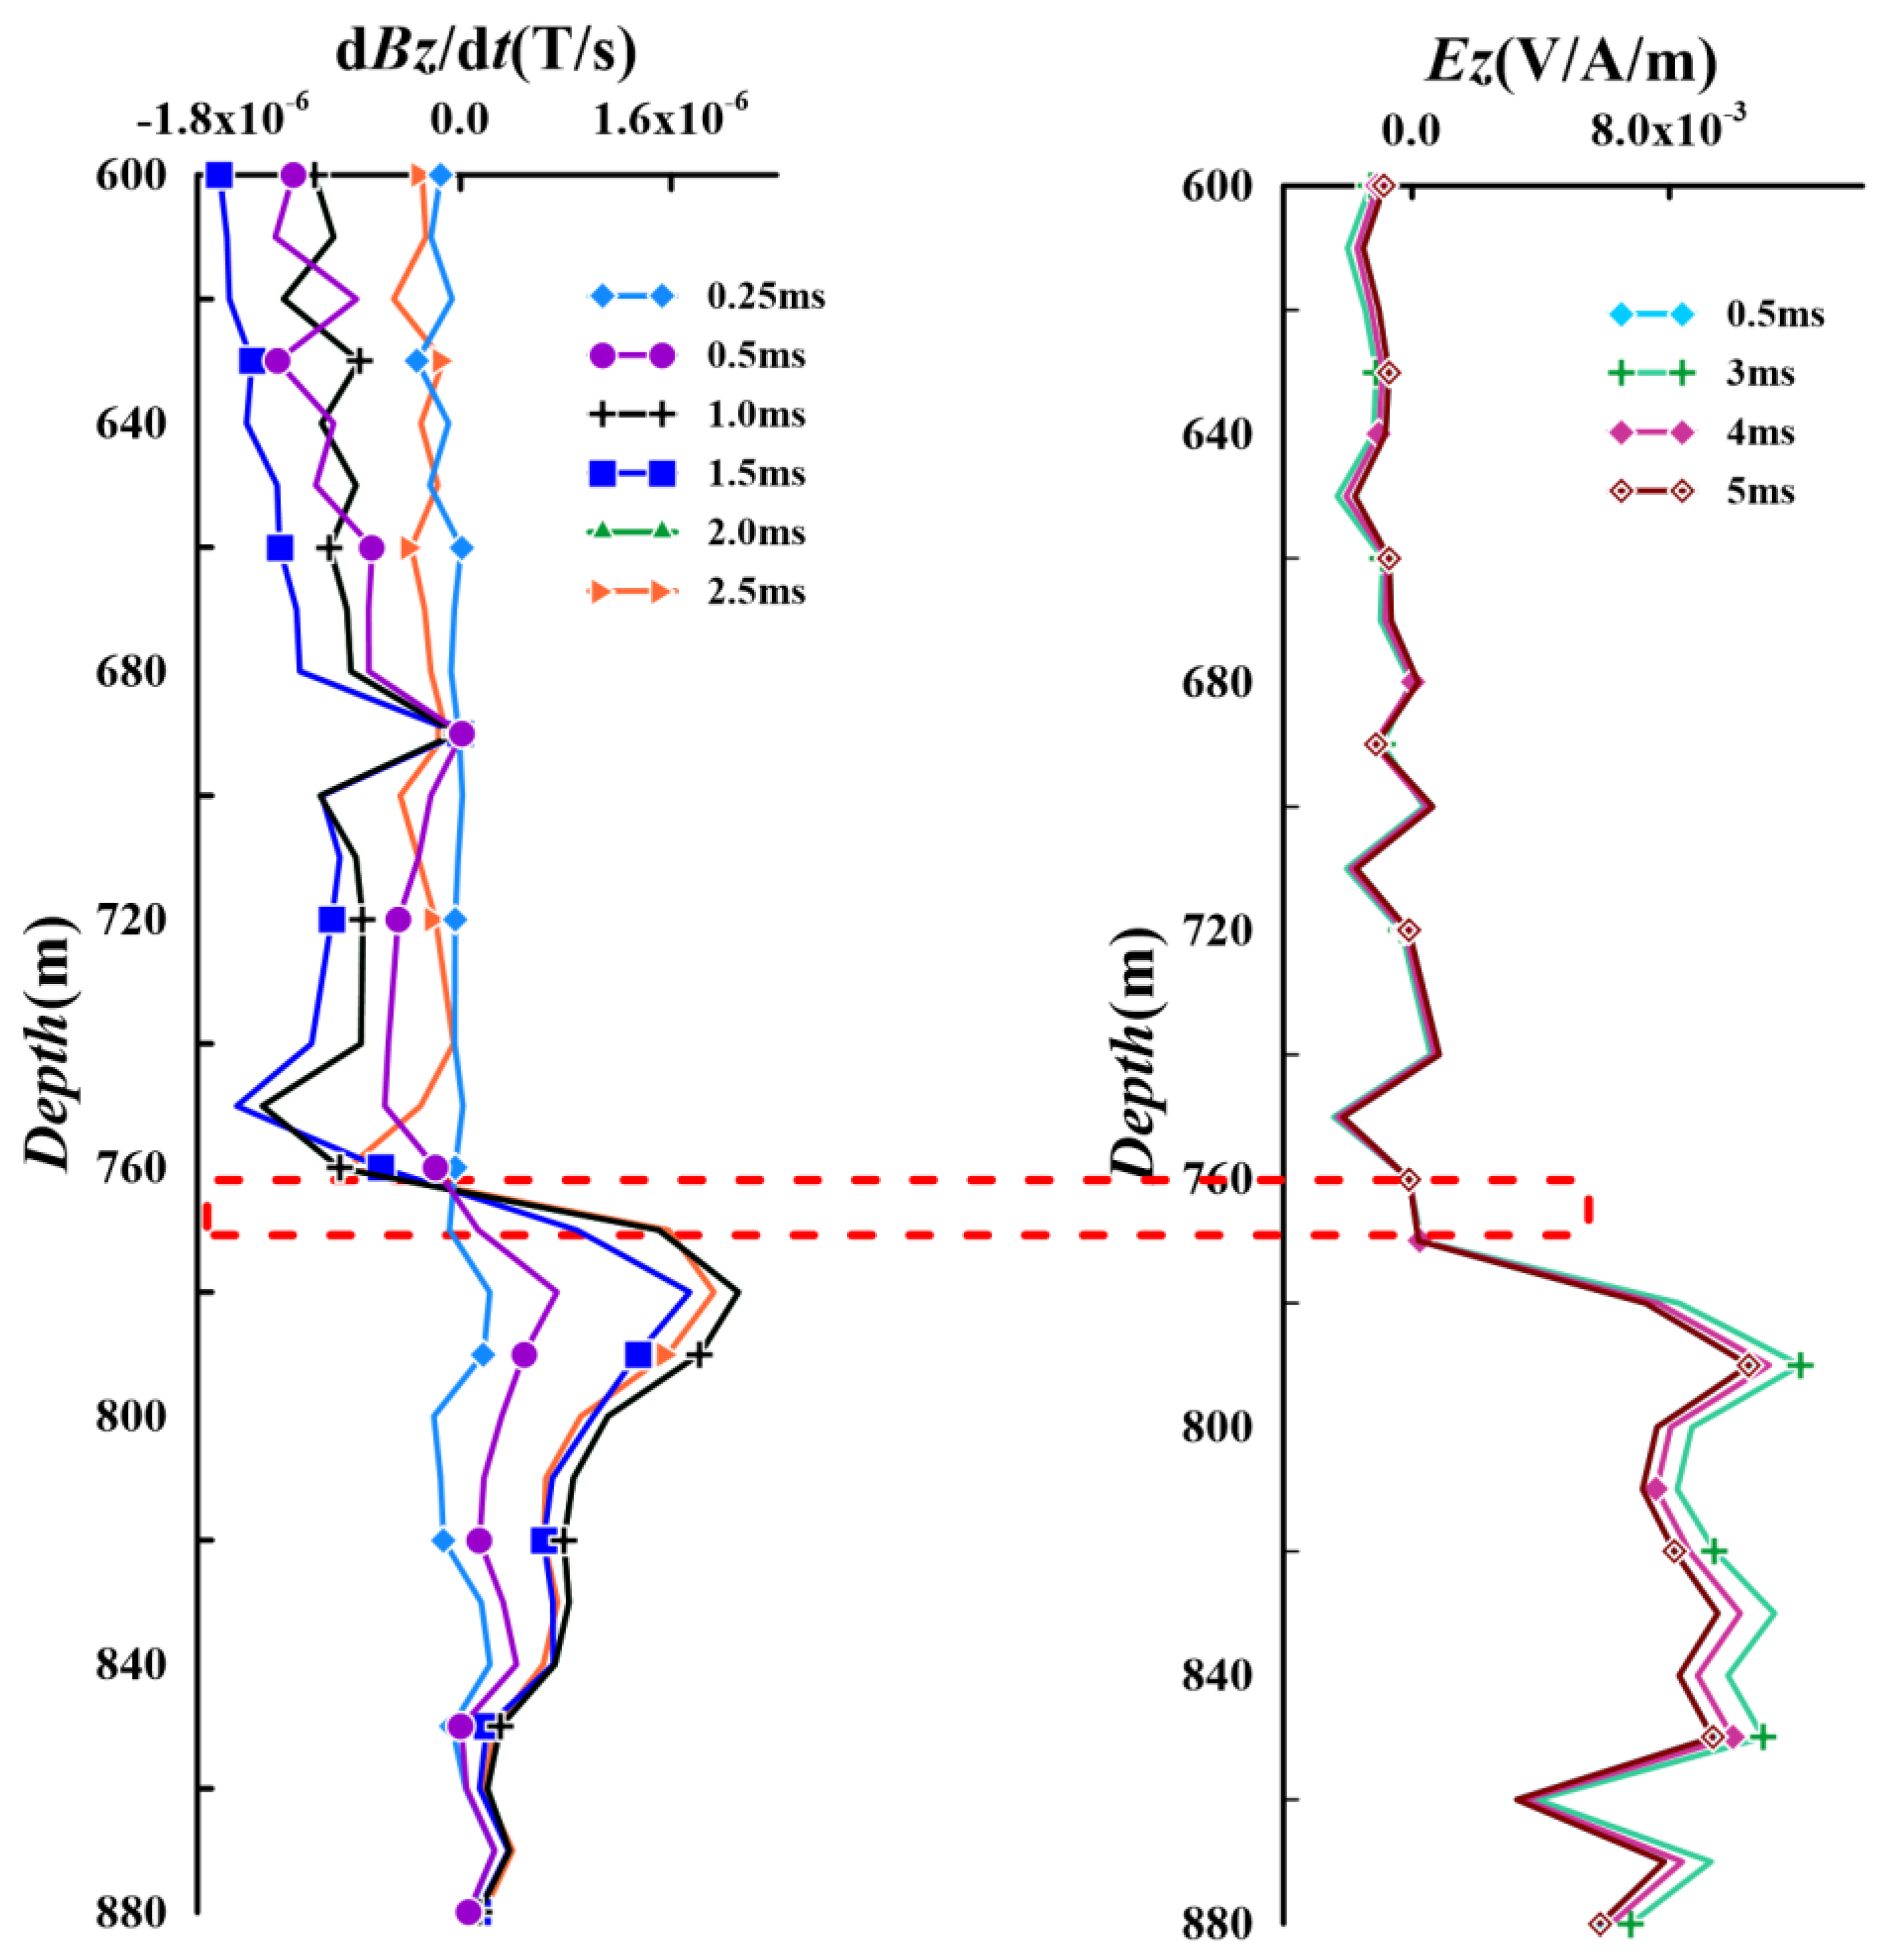
  • The logging results had strong regularity and were correlated to the position of the mineralized metallic ore. The attenuation time curves had low amplitudes in the mineralized metallic ore layer, and the time-domain curves also converged well;
  • The borehole electromagnetic signal acquisition system rotated during the logging process, resulting in scattered magnetic signals. To solve this problem, a push-back device and azimuth-measuring section were installed to prevent the electromagnetic acquisition system from rotating during the measurement, and the real-time instrument rotation angle and status were measured for angle compensation. In addition, the stability and sensitivity of the three-component magnetic field sensor will be improved in future research.
  • Due to difficulties in finding a deep metal mine, the temperature and pressure of the metal mine selected in this study were far below the maximum performance of the system at 3000 m. However, the response characteristics indicated the efficacy of the borehole receiver; hence, it could be commercialized.

Author Contributions

Conceptualization, Y.M. and Q.G.; methodology, L.Y. and Y.M.; software, H.L.; validation, L.Z., X.X. and H.L.; formal analysis, H.L.; investigation, J.Y. and W.C.; resources, Q.G.; data curation, H.L.; writing—original draft preparation, Q.G. and Y.M.; writing—review and editing, Y.M. and H.L.; visualization, H.L.; supervision, L.Z.; project administration, Y.M.; funding acquisition, Y.M. and L.Z. All authors have read and agreed to the published version of the manuscript.

Funding

This research was funded by the National Natural Science Foundation of China (42374091, 42274103) and Project of China National Logging Corporation: Key Technology Research and Platform Construction of High Temperature Long Life Power Supply (CNLC2022-1E01).

Data Availability Statement

The data used to support the findings of this study are available from the corresponding author upon request.

Conflicts of Interest

Author Qingming Guo was employed by Logging Technology Research Institute, China National Logging Corporation. The remaining authors declare that the research was conducted in the absence of any commercial or financial relationships that could be construed as a potential conflict of interest.

References

  1. Becker, A.R.; DeCarle, R.; Lazenby, P.G. Simplified prediction of transient electromagnetic response. Geophysics 1984, 49, 913–917. [Google Scholar] [CrossRef]
  2. Nguyen Dinh, C.; Klityński, W.; Pham Nguyen, P.; Oryński, S. Application of electromagnetic transient method for Zn–Pb exploration at the Cho Dien–Cho Don District, Bac Can Province, North Vietnam. Acta Geophys. 2019, 67, 1921–1931. [Google Scholar] [CrossRef]
  3. Azizuddin, A.A.; Kurt, S.; Tilman, H. Surface-to-borehole TEM for reservoir monitoring. In Proceedings of the 2011 SEG Annual Meeting, San Antonio, TX, USA, 18–23 September 2011; pp. 1882–1886. [Google Scholar]
  4. Barajas-Olalde, C.; Adams, D.C.; Curcio, A.; Davydycheva, S.; Klapperich, R.J.; Martinez, Y.; Paembonan, A.Y.; Peck, W.D.; Strack, K.; Soupios, P. Application of Electromagnetic Methods for Reservoir Monitoring with Emphasis on Carbon Capture, Utilization, and Storage. Minerals 2023, 13, 1308. [Google Scholar] [CrossRef]
  5. Li, H.; Mao, Y.; Wang, X.; Yan, L.; Zhou, L. Characterization of Surface–Borehole Transient Electromagnetic Response in Electrical Anisotropic Media. Minerals 2023, 13, 674. [Google Scholar] [CrossRef]
  6. Wu, J.; Zhi, Q.; Deng, X.; Wang, X.; Chen, X.; Zhao, Y.; Huang, Y. Deep Gold Exploration with SQUID TEM in the Qingchengzi Orefield, Eastern Liaoning, Northeast China. Minerals 2022, 12, 102. [Google Scholar] [CrossRef]
  7. Bailey, J.; Lafrance, B.; McDonald, M.A.; Fedorowich, J. Mazatzal Labradorian-age ductile deformation of the South Range Sudbury impact structure at the Thayer Lindsley mine, Ontario. Can. J. Earth Sci. 2004, 41, 1491–1505. [Google Scholar] [CrossRef]
  8. Molnar, F.; Watkinson, D.H.; Jones, P.C. Fluid inclusion evidence for hydrothermal enrichment of magmatic ore at the contact zone of the Ni-Cu-platinum-group element 4b Deposit, Lindsley Mine, Sudbury. Can. Econ. Geol. 1997, 92, 674–685. [Google Scholar] [CrossRef]
  9. Sun, H.R.; Zhang, Y.Y.; Zhao, Y.C.; Liu, Y.; Zhao, H. Present study situation review of borehole transient electromagnetic method. Coal Geol. Explor. 2022, 50, 85–97. [Google Scholar]
  10. Nepeina, K.; Bataleva, E.; Alexandrov, P. Electromagnetic Monitoring of Modern Geodynamic Processes: An Approach for Micro-Inhomogeneous Rock through Effective Parameters. Appl. Sci 2023, 13, 8063. [Google Scholar] [CrossRef]
  11. Lévesque, Y.; Walter, J.; Chesnaux, R. Transient Electromagnetic (TEM) Surveys as a First Approach for Characterizing a Regional Aquifer: The Case of the Saint-Narcisse Moraine, Quebec, Canada. Geosciences 2021, 11, 415. [Google Scholar] [CrossRef]
  12. Kalisperi, D.; Kouli, M.; Vallianatos, F.; Soupios, P.; Kershaw, S.; Lydakis-Simantiris, N. A Transient ElectroMagnetic (TEM) Method Survey in North-Central Coast of Crete, Greece: Evidence of Seawater Intrusion. Geosciences 2018, 8, 107. [Google Scholar] [CrossRef]
  13. Ravenhurst, B.; Roth, J. Memorials. Lead. Edge 2011, 30, 594. [Google Scholar]
  14. Daniels, J.J.; Dyck, A. Borehole Resistivity and Electromagnetic Methods Applied to Mineral Exploration. IEEE Trans. Geosci. Remote Sens. 1984, 22, 80–87. [Google Scholar] [CrossRef]
  15. Dyck, A.V. Drill-Hole Electromagnetic Methods. In Electromagnetic Methods in Applied Geophysics: Volume 2, Application, Parts A and B; Society of Exploration Geophysicists: Houston, TX, USA, 1991. [Google Scholar]
  16. Zhang, Y.X.; Han, Z.H.; Zhou, J.X.; Kang, H.W.; Zhou, T. The application effect of mining hydrogeological exploration using PROTEM67D system. Chin. J. Eng. Geophys. 2005, 2, 123–128. [Google Scholar]
  17. Jiang, B.Y.; Feng, M.L.; Ye, Z.X.; Lu, Q.X.; Chen, D.X. Comprehensive Technologies for Geophysical and Geochemical Exploration for Deep Concealed Mineral Deposits; Institute of Geophysical and Geochemical Exploration, Chinese Academy of Geological Sciences: Langfang, China, 1990. [Google Scholar]
  18. Ping, H.; Shi, Z.Y. Research Report on Ground-Borehole Transient Electromagnetic Methods and Interpretation Technologies; Institute of Geophysical and Geochemical Exploration, Chinese Academy of Geological Sciences: Langfang, China, 1995. [Google Scholar]
  19. Ping, H. Technical Manual of Ground-Borehole Transient Electromagnetic Method; Institute of Geophysical and Geochemical Exploration, Chinese Academy of Geological Sciences: Langfang, China, 1995. [Google Scholar]
  20. Deng, X.H.; Zhang, J.; Wu, J.J.; Wang, X.C.; Yang, Y. Technical Specifications for Surface-Borehole Transient Electromagnetic Method, 1st ed.; China Geological Survey Technical Standards for Geological Survey; China Geological Survey: Hebei, China, 2019.
  21. Xue, G.Q.; Li, X.D.; Qing, Y. The progress of TEM in theory and application. Prog. Geophys. 2007, 22, 1195–1200. [Google Scholar]
  22. Yan, S.; Shi, X.X.; Chen, M.S. The probing depth of transient electromagnetic field method. Chin. J. Geophys. 2009, 52, 1583–1591. [Google Scholar]
  23. Xiu, L. Theory and Application of Transient Electromagnetic Sounding, 1st ed.; Shaanxi Science and Technology Press: Xi’an, China, 2002. [Google Scholar]
  24. Chen, W.Y.; Han, S.X.; Xue, G.Q. Analysis on the full-component response and detectability of electric source surface-to-borehole TEM method. Chin. J. Geophys. 2019, 62, 1969–1980. [Google Scholar]
  25. Zhang, X.N.; Yan, L.J.; Huang, X.; Zhou, L.; Wang, X.; Cao, X. Three-Dimensional Forward Modeling of Transient Electromagnetic Method Considering Induced Polarization Effect Based on Spectral Element Method. Minerals 2024, 14, 24. [Google Scholar] [CrossRef]
  26. Cheng, M.; Yang, D.K.; Luo, Q. Interpreting Surface Large-Loop Time-Domain Electromagnetic Data for Deep Mineral Exploration Using 3D Forward Modeling and Inversion. Minerals 2023, 13, 34. [Google Scholar] [CrossRef]
  27. Meng, Q.X.; Pan, H.P. Numerical simulation analysis of surface-hole TEM responses. Chin. J. Geophys. 2012, 55, 1046–1053. [Google Scholar]
  28. Wu, J.J.; Li, X.; Zhi, Q.Q.; Deng, X.; Guo, J. Full field apparent resistivity definition of Borehole TEM with electric source. Chin. J. Geophys. 2017, 60, 1595–1605. [Google Scholar]
  29. Wang, X.C.; Zhi, Q.Q.; Wu, J.J.; Deng, X.; Huang, Y.; Yang, Q.A.; Wang, J. Multicomponent Transient Electromagnetic Exploration Technology and Its Application. Minerals 2022, 13, 681. [Google Scholar] [CrossRef]
  30. Wu, J.J.; Li, X.; Zhi, Q.Q.; Qi, Z.P.; Guo, J.L.; Deng, X.H. Analysis of three component TEM response characteristic of electric source dill hole TEM. Prog. Geophys. 2017, 32, 1273–1278. [Google Scholar]
  31. Yan, C.; Chen, R.J.; Shen, R.J.; Wu, X.; Wan, X.; Chen, X.; Liu, H. Distributed multi-channel data acquisition system for electrical and electromagnetic methods. Prog. Geophys. 2021, 36, 1743–1750. [Google Scholar]
  32. Huang, J.Y. Development of High-Precision Low-Power Distributed Seismic Acquistion Staion. Master’s Thesis, China University of Geosciences (Beijing), Beijing, China, 2014. [Google Scholar]
  33. Mao, Y.; Yan, L.; Zhou, L.; Xu, J.; Chen, H. A Set of In-Well Receiver Array for Borehole Induced Polarization Detecting Technology in Deep Mine Exploration. Minerals 2022, 12, 1247. [Google Scholar] [CrossRef]
  34. Lin, J.; Wang, L.; Wang, X.G.; Cai, M.; Fu, L.; Shang, X.L. Research and development on the air-core coil sensor for mines transient electromagnetic exploration. Chin. J. Geophys. 2016, 59, 721–730. [Google Scholar]
  35. Liang, Q.H. Transient Electromagnetic Exploration in the Whole Mine Space Using Small Coils and Its Application. Master’s Thesis, Central South University, Changsha, China, 2012. [Google Scholar]
  36. Dang, B.; Yang, L.; Liu, C.; Zheng, Y.; Li, H.; Dang, R.; Sun, B. A Uniform Linear Multi-Coil Array-Based Borehole Transient Electromagnetic System for Non-Destructive Evaluations of Downhole Casings. Sensors 2018, 18, 2707. [Google Scholar] [CrossRef] [PubMed]
  37. He, Z.R. Noise Analysis and Design of Operational Amplifier Circuits. Microelectronics 2006, 36, 148–153. [Google Scholar]
  38. Wu, X.; Xue, G.Q.; Chen, W.Y.; Wu, K.; Qi, L.; Liu, F.B.; Fang, G.Y. Contrast test of the transient electromagnetic system (CASTEM)at the Dawangzhuang iron mine in Anhui province. Chin. J. Geophys. 2016, 59, 4448–4456. [Google Scholar]
  39. Chen, W.; Han, S.; Khan, Y.M.; Chen, W.; He, Y.; Zhang, L.; Hou, D.; Xue, G. A Surface-to-Borehole TEM System Based on Grounded-wire Sources: Synthetic Modeling and Data Inversion. Pure Appl. Geophys. 2020, 177, 4207–4216. [Google Scholar] [CrossRef]
Figure 1. Schematic diagram of the model.
Minerals 14 00793 g001
Figure 2. Ez responses of the radial long wire source at different depths: (a) 100 m background field response; (b) 100 Ω·m background field low-resistance response; (c) 1000 Ω·m background field response; (d) 1000 Ω·m background field low-resistance response.
Minerals 14 00793 g002aMinerals 14 00793 g002b
Figure 3. dBz/dt responses of the sideline long wire source: (a) 100 Ω·m background field response; (b) 100 Ω·m background field low-resistance response; (c) 1000 Ω·m background field response; (d) 1000 Ω·m background field low-resistance response.
Minerals 14 00793 g003
Figure 4. dBz/dt responses of the large loop source: (a) 100 Ω·m background field response; (b) 100 Ω·m background field low-resistance response; (c) 1000 Ω·m background field response; (d) 1000 Ω·m background field low-resistance response.
Minerals 14 00793 g004
Figure 5. Schematic diagram of the surface-borehole transient electromagnetic exploration system.
Minerals 14 00793 g005
Figure 6. Hardware block diagram of the borehole electromagnetic signal acquisition system.
Minerals 14 00793 g006
Figure 7. Principle of time synchronization between the surface and subsurface systems. (a) GPS pulse signals; (b) Trigger square waves; (c) Trigger signal for timing; (d) The time frame of the surface transmission system.
Minerals 14 00793 g007
Figure 8. Block diagram of the GPS signal interface.
Minerals 14 00793 g008
Figure 9. Schematic diagram of surface-borehole transient electromagnetic exploration using the long wire source.
Minerals 14 00793 g009
Figure 10. Schematic diagram of surface-borehole transient electromagnetic exploration using the large loop source.
Minerals 14 00793 g010
Figure 11. Current waveform of the long wire source.
Minerals 14 00793 g011
Figure 12. Waveforms of the signals received by the electromagnetic receiver in the borehole after being emitted by the long wire source at depths of: (a) 760 m; (b) 880 m.
Minerals 14 00793 g012
Figure 13. Ez response curves of the long wire source at different times compared to the geological profile of borehole ZK409.
Minerals 14 00793 g013
Figure 14. Comparison of dBz/dt and Ez response curves of the long wire source at different times.
Minerals 14 00793 g014
Figure 15. Current waveform of the large loop source.
Minerals 14 00793 g015
Figure 16. Ez response curves of the large loop source at depths of: (a) 760 m; (b) 880 m.
Minerals 14 00793 g016
Figure 17. dBz/dt response curves of the large loop source at depths of: (a) 760 m; (b) 880 m.
Minerals 14 00793 g017
Figure 18. Ez response curves of the large loop source at different times compared to the geological profile of borehole ZK409.
Minerals 14 00793 g018
Figure 19. Comparison of dBz/dt and Ez response curves of the large loop source at different times.
Minerals 14 00793 g019
Table 1. Rock and ore distribution in the borehole ZK409.
Borehole Depth (m)Mineral
0–671.92Quartz monzodiorite porphyry
671.92–686.32Chalcopyrite quartz monzodiorite porphyry
686.32–727.16Quartz monzodiorite porphyry
727.16–762.76Chalcolithic dolomitic marble
762.76–777.96Copper–iron ore body
777.96–1031.80Marble
1031.80–1040.40Quartz monzodiorite porphyry
1040.40–1049.00Copper–iron ore body
1049.00–1107.20Quartz monzodiorite porphyry
Disclaimer/Publisher’s Note: The statements, opinions and data contained in all publications are solely those of the individual author(s) and contributor(s) and not of MDPI and/or the editor(s). MDPI and/or the editor(s) disclaim responsibility for any injury to people or property resulting from any ideas, methods, instructions or products referred to in the content.

