Article

Effect of Solid Ratio and Particle Size on Dissolution of Heat-Activated Lizardite at Elevated Pressures and Moderate Temperatures

1
Discipline of Chemical Engineering, University of Newcastle, Callaghan, NSW 2308, Australia
2
Mineral Carbonation International (MCi Carbon), Newcastle, NSW 2308, Australia
*
Author to whom correspondence should be addressed.
Minerals 2024, 14(8), 831; https://doi.org/10.3390/min14080831
Submission received: 22 May 2024 / Revised: 3 August 2024 / Accepted: 5 August 2024 / Published: 16 August 2024
(This article belongs to the Special Issue Mineralogy, Chemistry, Weathering and Application of Serpentinite)

Abstract

:
This study investigates the effect of the particle size and solid-to-liquid ratio on the dissolution rate of magnesium (Mg) and silicon (Si) in heat-activated lizardite. The investigation was conducted under specific conditions: without the presence of sodium bicarbonate (NaHCO3), at a moderate temperature (40 °C), and under elevated CO2 pressure (100 bar). The aim was to isolate the dissolution reactions and enhance comprehension of the factors constraining the overall yields in the Albany Research Center (ARC) mineral carbonation process. Our study disclosed two distinct dissolution regimes: an initial stage with a rapid initial rate of Mg extraction, resulting in the fraction of Mg extracted ranging from 30 to 65% during the first 20 min of the experiment, following which the dissolution rate decreases dramatically. The initial rapid dissolution stage is primarily driven by the low pH of the supernatant solution, resulting from CO2 dissolution, leading to a higher concentration of protons that extract Mg2+ cations. However, as the heat-activated lizardite dissolution progresses, the pH increases due to the high level of leached Mg2+, and a diffusion barrier forms due to the precipitation of amorphous silica. This phenomenon ultimately slows down the mineral’s dissolution rate during the latter stages of particle dissolution.

1. Introduction

The dissolution of gaseous CO2 into aqueous solutions leads to carbonic acid formation, and the carbonic acid in turn dissociates, producing bicarbonate (HCO3) ions and protons (H+). A decrease in pH, due to the production of protons, enhances and promotes the extraction of magnesium (Mg) from ultramafic minerals and their derivatives such as heat-activated lizardite [1]. The direct aqueous carbonation process comprises two main steps; the dissolution of the mineral to extract magnesium ions (Mg2+), which is favoured under acidic conditions (low pH), and the precipitation of Mg-carbonate, which is favoured under alkaline conditions (high pH). The direct aqueous carbonation process occurs at near-neutral pH conditions where both the dissolution and precipitation processes can occur concurrently, despite neutral pH conditions not being optimal for either step. An investigation of both steps is important for understanding the kinetics and mechanisms of the aqueous carbonation process.
The following reactions for the dissolution of CO2 and dissolution of lizardite under acidic conditions are shown in Equations (1)–(5):
CO2(g) ⇌ CO2(aq)
CO2(aq) + H2O(l) ⇌ H2CO3(aq) ⇌ HCO3(aq) + H+(aq)
HCO3(aq) ⇌ CO32−(aq) + H+(aq)
H2O(l) ⇌ H+(aq) + OH(aq)
Mg3Si2O5(OH)4(s) + 6H+(aq) ⇌ 3Mg2+(aq) + 2SiO2(s) + 5H2O(l)
It can be seen from Equation (5) that Mg2+ can be leached into solution with Mg2+ and leached silicon (Si) being generated at a molar ratio of 3:2. It has been postulated in previous studies [2,3] that a Si-enriched layer can form around the outside magnesium silicate particles due to the precipitation of amorphous silica from the solution after the supernatant solution reaches supersaturation with respect to amorphous silica and/or via non-stoichiometric dissolution, leading to Mg depletion in the outer layer of the particles. It was postulated that the formation of amorphous silica solid product contributes to the formation of a Si-passivating layer that can significantly reduce the overall rate of the dissolution of the mineral carbonation reaction [4].
Several research groups have investigated the factors limiting the rate and extent of mineral dissolution and many assert that the rate of dissolution of the mineral is the overall rate-limiting step affecting the carbonate yield compared to the corresponding precipitation step [1,4,5,6,7,8,9,10,11,12,13,14,15,16,17]. This has also been confirmed in our studies on single-step carbonation, which demonstrate that after an initial spike in Mg concentration, the solution rapidly approaches equilibrium with respect to magnesite (MgCO3) solubility, indicating that MgCO3 precipitation is occurring rapidly compared to the dissolution step. A number of previous dissolution studies have identified an initially rapid rate of extraction of Mg, which is followed by a significantly slower dissolution rate of the residual Mg [7,18,19]. The initial rapid extraction of Mg has been found to result in a rapid rise in pH in two-stage carbonation (separate dissolution and precipitation steps) [20]; however, in single-stage carbonation, the buffering effect of NaHCO3 acts to stabilise the pH.
The dissolution kinetics of Mg-silicate minerals (such as serpentine and forsterite) have been examined and it was concluded that proton diffusion controls the rate of the dissolution process [21]. Researchers have applied the concurrent grinding (attrition-leaching) method to exfoliate the silica layer continuously to reduce the diffusion resistance and enhance the dissolution step in the carbonation process [21,22].
A number of groups have investigated and examined different factors influencing Mg extraction during the mineral dissolution of Mg-silicates, such as particle size, temperature, solids concentration, reaction time, and pH [1,4,7,9,15,16,23]. It was found that as the acid concentration increased (for a range of acids), the Mg2+ concentration in solution increased dramatically. To evaluate how well they perform in the context of two-stage mineral carbonation, a comparative study was carried out to examine the acid dissolution of various mining waste materials [24]. Vieira et al. [24] focused on two types of Brazilian serpentinite: waste rock from serpentinite mining and serpentinite tailings. Serpentinite rocks from different regions of Brazil were studied. The serpentinite tailings were provided by an industry in the Central-West Region. The mining tailings were derived from the processing of chrysotile asbestos ore and were provided by a mining company in Minas Gerais, a state in southeastern Brazil [24]. This study delved into the mineral carbonation of serpentinite rocks in Brazil, employing hydrochloric acid (HCl) to extract Mg and iron (Fe). The temperature had the greatest effect on Mg leaching, whereas an excess of acid had a negligible influence [24]. A recent research project was undertaken to explore the variables that affect pH-swing mineral carbonation and its influence on the efficiency of capturing CO2. To fine-tune the conditions for dissolving serpentinite using acid, a central composite rotatable design (CCRD) was employed. The findings revealed that temperature plays a substantial role in Mg dissolution. When exposed to 100 °C and treated with 2.5 M HCl, the study achieved 96% Mg extraction within 120 min and 91% extraction within 30 min [25]. In general, the study enhanced the understanding of process variables in extracting Mg from serpentinite and underscored the possibility of using serpentinite tailings to generate stable carbonates [25]. Recent studies have uncovered that the use of mechanochemical pre-conditioning holds promise for improving the efficiency and capacity of mineral carbonation kinetics, potentially leading to a twofold increase in CO2 capture capability [26,27,28]. Dufourny and colleagues [25] arrived at the conclusion that the introduction of defects within crystal structures induced through ball milling serves to promote the carbonation process of materials. In contrast to alternative approaches, the utilisation of grinding for the enhancement of mineral carbonation represents a relatively recent advancement, prompting the need for additional exploration to pinpoint and analyse the governing mechanisms and ideal parameters involved [29]. We wish to study single-stage carbonation under conditions where the rate of precipitation of MgCO3 (and possibly SiO2) is suppressed, so that the mineral dissolution process can be studied in isolation.
In this study, lizardite was obtained from the Great Serpentinite Belt in NSW. This belt starts from the township of Barraba and extends to Bingara. A bulk sample of serpentinite (lizardite (labelled 1A)) was obtained from an abandoned dunite (rock composed primarily of olivine and lizardite) quarry (Doonba Station, NE of Barraba). Field collection of the bulk samples involved the selection of suitable rocks which were then broken with a sledge hammer into fist-sized blocks (approximately 10 cm × 10 cm × 10 cm) or smaller.
In the present work, the dissolution of heat-activated lizardite has been studied at a moderate temperature (40 °C) and at an elevated pressure of CO2 (100 bar) in the absence of NaHCO3, conditions which are known to enhance the solubility of CO2. The extent of Mg extraction from Mg-silicate minerals is then assessed under these conditions. The aim of this research is to elucidate the mechanism of dissolution of heat-activated lizardite by measuring the elemental concentration (Mg, Si) in the supernatant solution, where a greater extraction rate leads to a greater carbonate yield. We also explore the effect of the solid-to-liquid ratio and particle size on the dissolution rate, extent of Mg extraction, and formation of a Si-enriched layer to gain further insight into the factors influencing Mg extraction.

2. Materials and Methods

The ground lizardite (obtained from the Great Serpentinite Belt in New South Wales (NSW) was wet-sieved into 45–75, 20–45 and sub-20 µm size fractions (bins). Each sieved fraction was oven-dried overnight at 100 °C. It was necessary to clean each size fraction to remove fines (undersize mineral particles not within size fraction) prior to conducting the dissolution experiments. The cleaning process involved processing 25 g of the ground material as one batch using wet sieving (20 μm sieve). On completion of sieving, the sieve was placed in an ultrasonic water bath for 5 min and the resulting solution was analysed by a particle size analyser. If fine particles were shown to be present in the sieve solution, then the above procedure was repeated until such time that sub-20 μm particles were not represented in the targeted sieve fraction.
A particle size analyser (2000, Malvern Mastersizer, Malvern Instruments, Worcestershire, UK) was used to measure the particle size distribution of each fraction by dispersing the particles in water.
X-ray diffraction (XRD) was used to qualitatively and quantitatively determine the crystalline phases of the raw and thermally activated lizardite. XRD analysis of the feed, heat-activated lizardite, and reaction product were accomplished on a Philips X’Pert Pro diffractometer (X’pert Pro MPD, Philips Analytical, Eindhoven, The Netherlands) with Cu Kα radiation operated at a current of 40 mA and a voltage of 40 kV. Samples were continuously scanned from 5° to 90° 2θ with a step size of 0.002° or 0.008° by a goniometer (Multi-Purpose Goniometer (MPG), Philips Analytical, Almelo, The Netherlands)
Inductively coupled plasma optical emission spectrometry (ICP-OES) utilizing argon plasma was used to measure the total concentrations of Mg and Si in the liquid samples obtained after the dissolution experiments. This analytical technique employs high-temperature plasma to ionise and excite aqueous species, causing them to emit photons at specific wavelengths. These emissions allow for the identification and quantification of the elements.
In this investigation, a thermodynamic analysis using PHREEQC 2.18 [30] was employed to evaluate the system parameters, specifically focusing on the pH of the H2O-CO2-Mg(OH)2 system within the studied experimental conditions. Additionally, the impact of Si on the system’s pH was assessed by introducing elemental Si into the modelled aqueous system.
The ‘wateq4f’ thermodynamic database was utilised to forecast the aqueous speciation. In our simulations, we employed brucite (Mg(OH)2 as a surrogate for the reactive Mg compound. The thermodynamic analysis enabled the prediction of the system’s pH under dissolution conditions of serpentine.

3. Results and Discussion

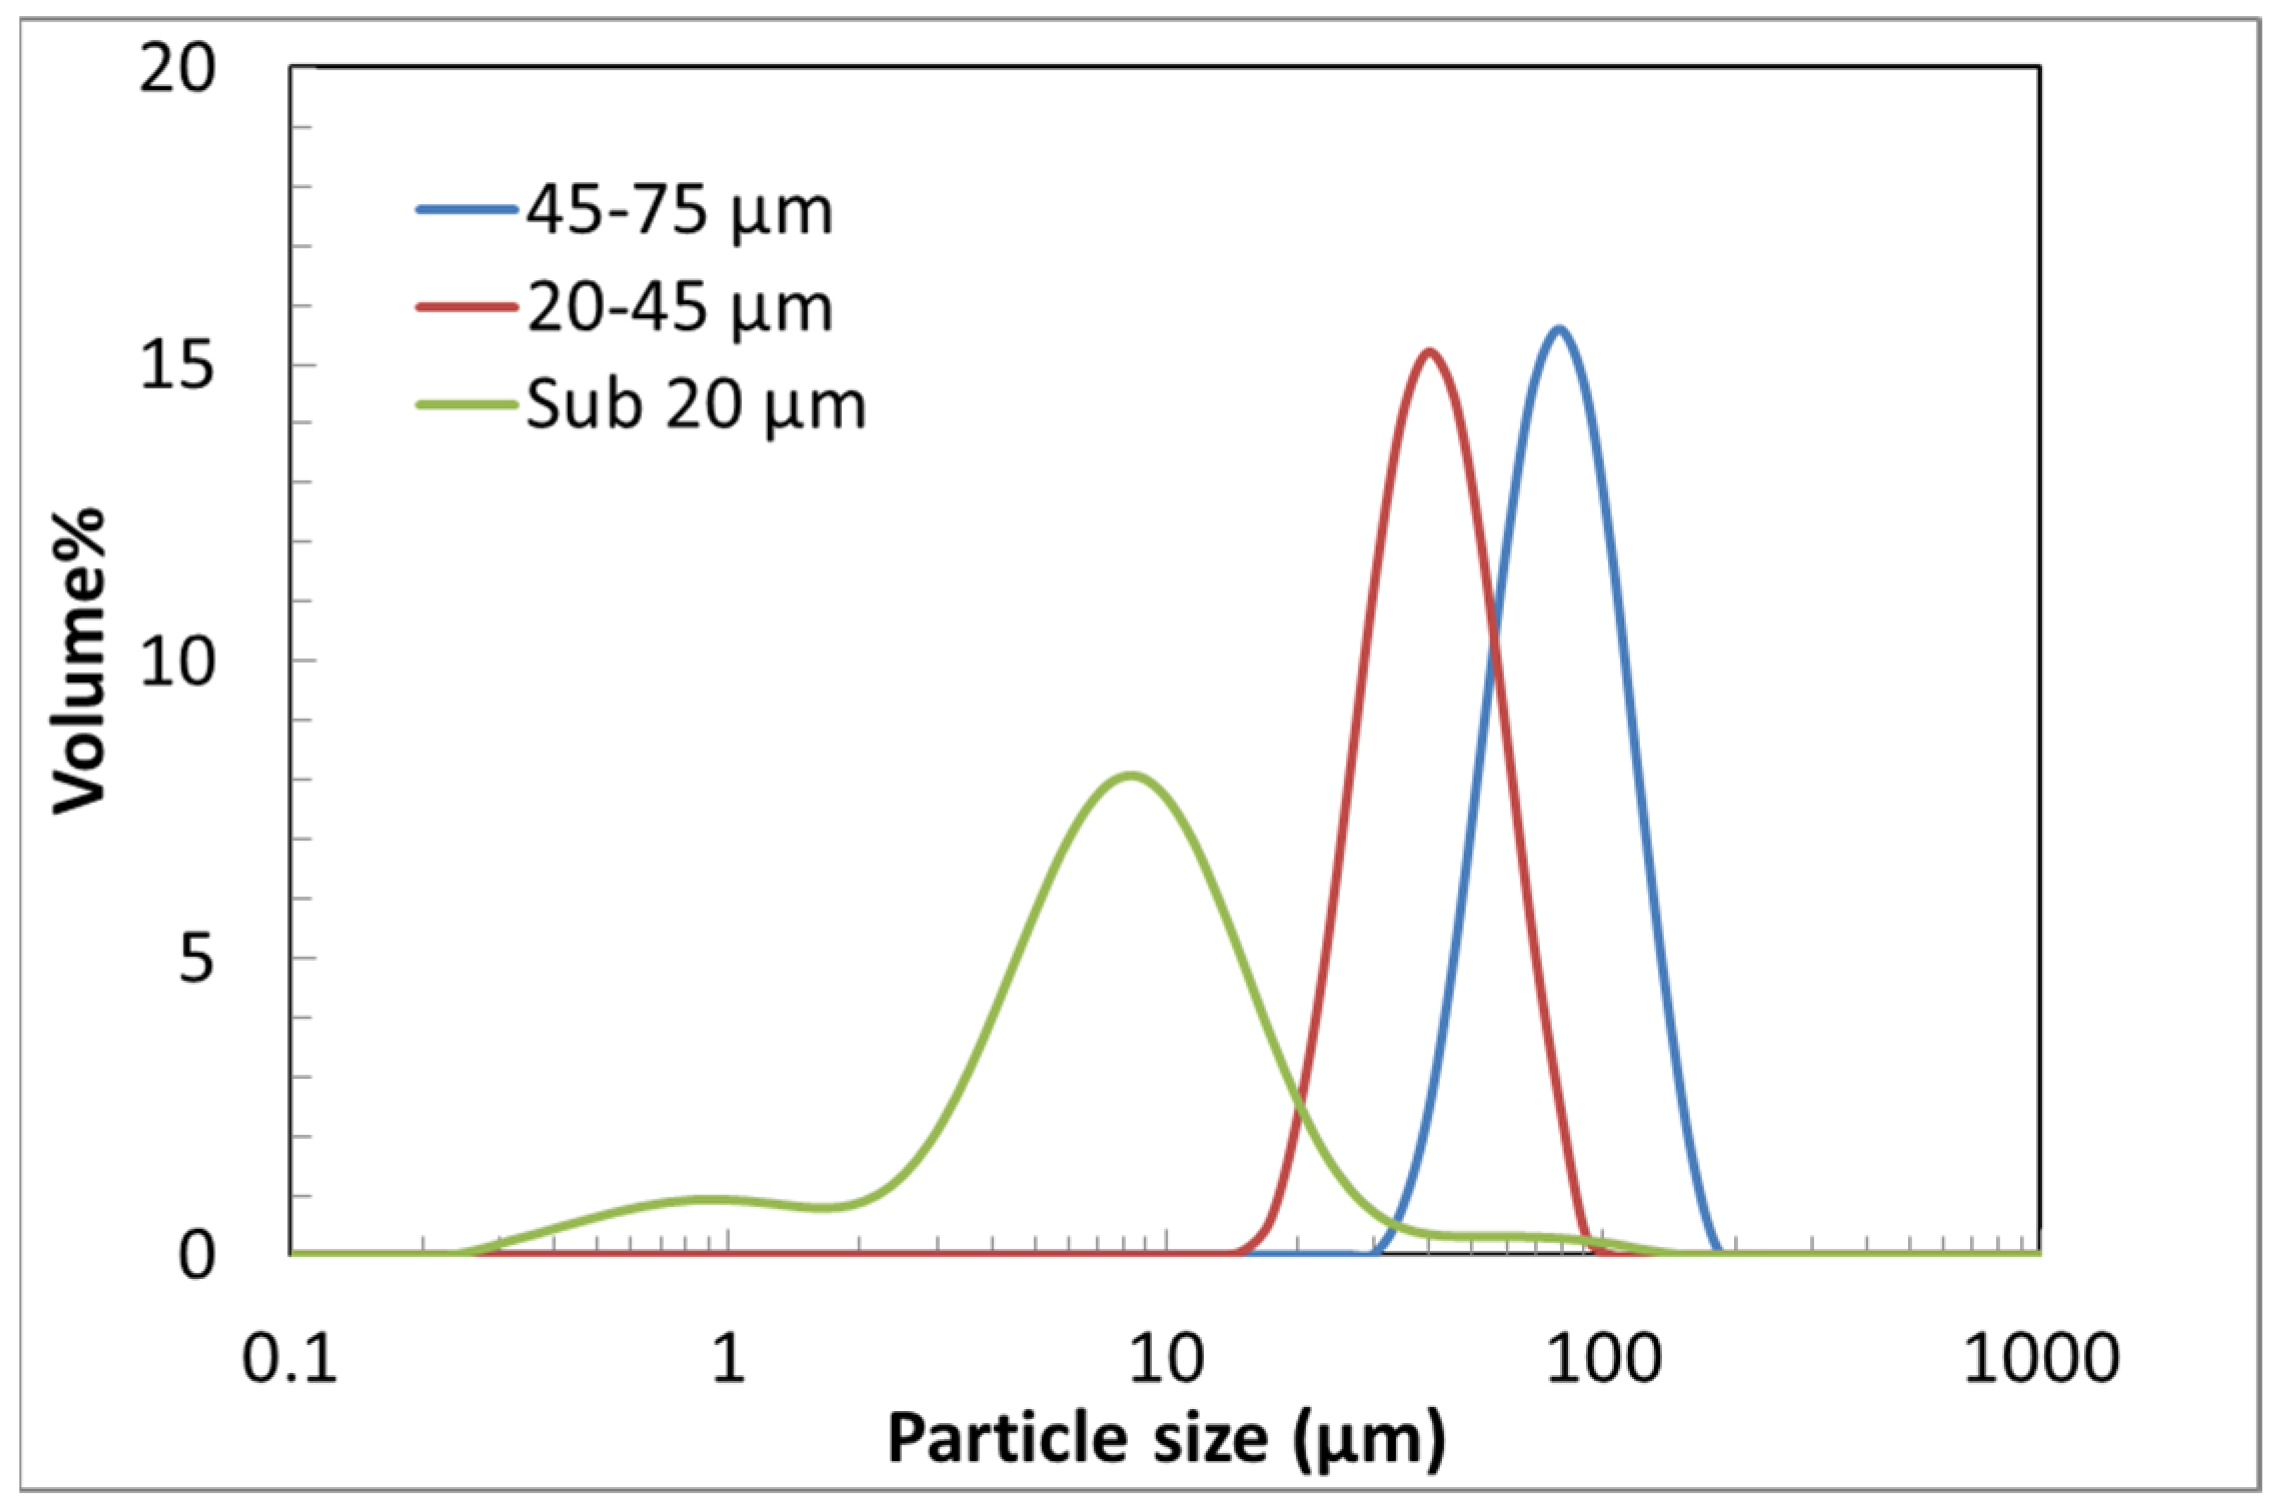
3.1. Particle Size Analysis
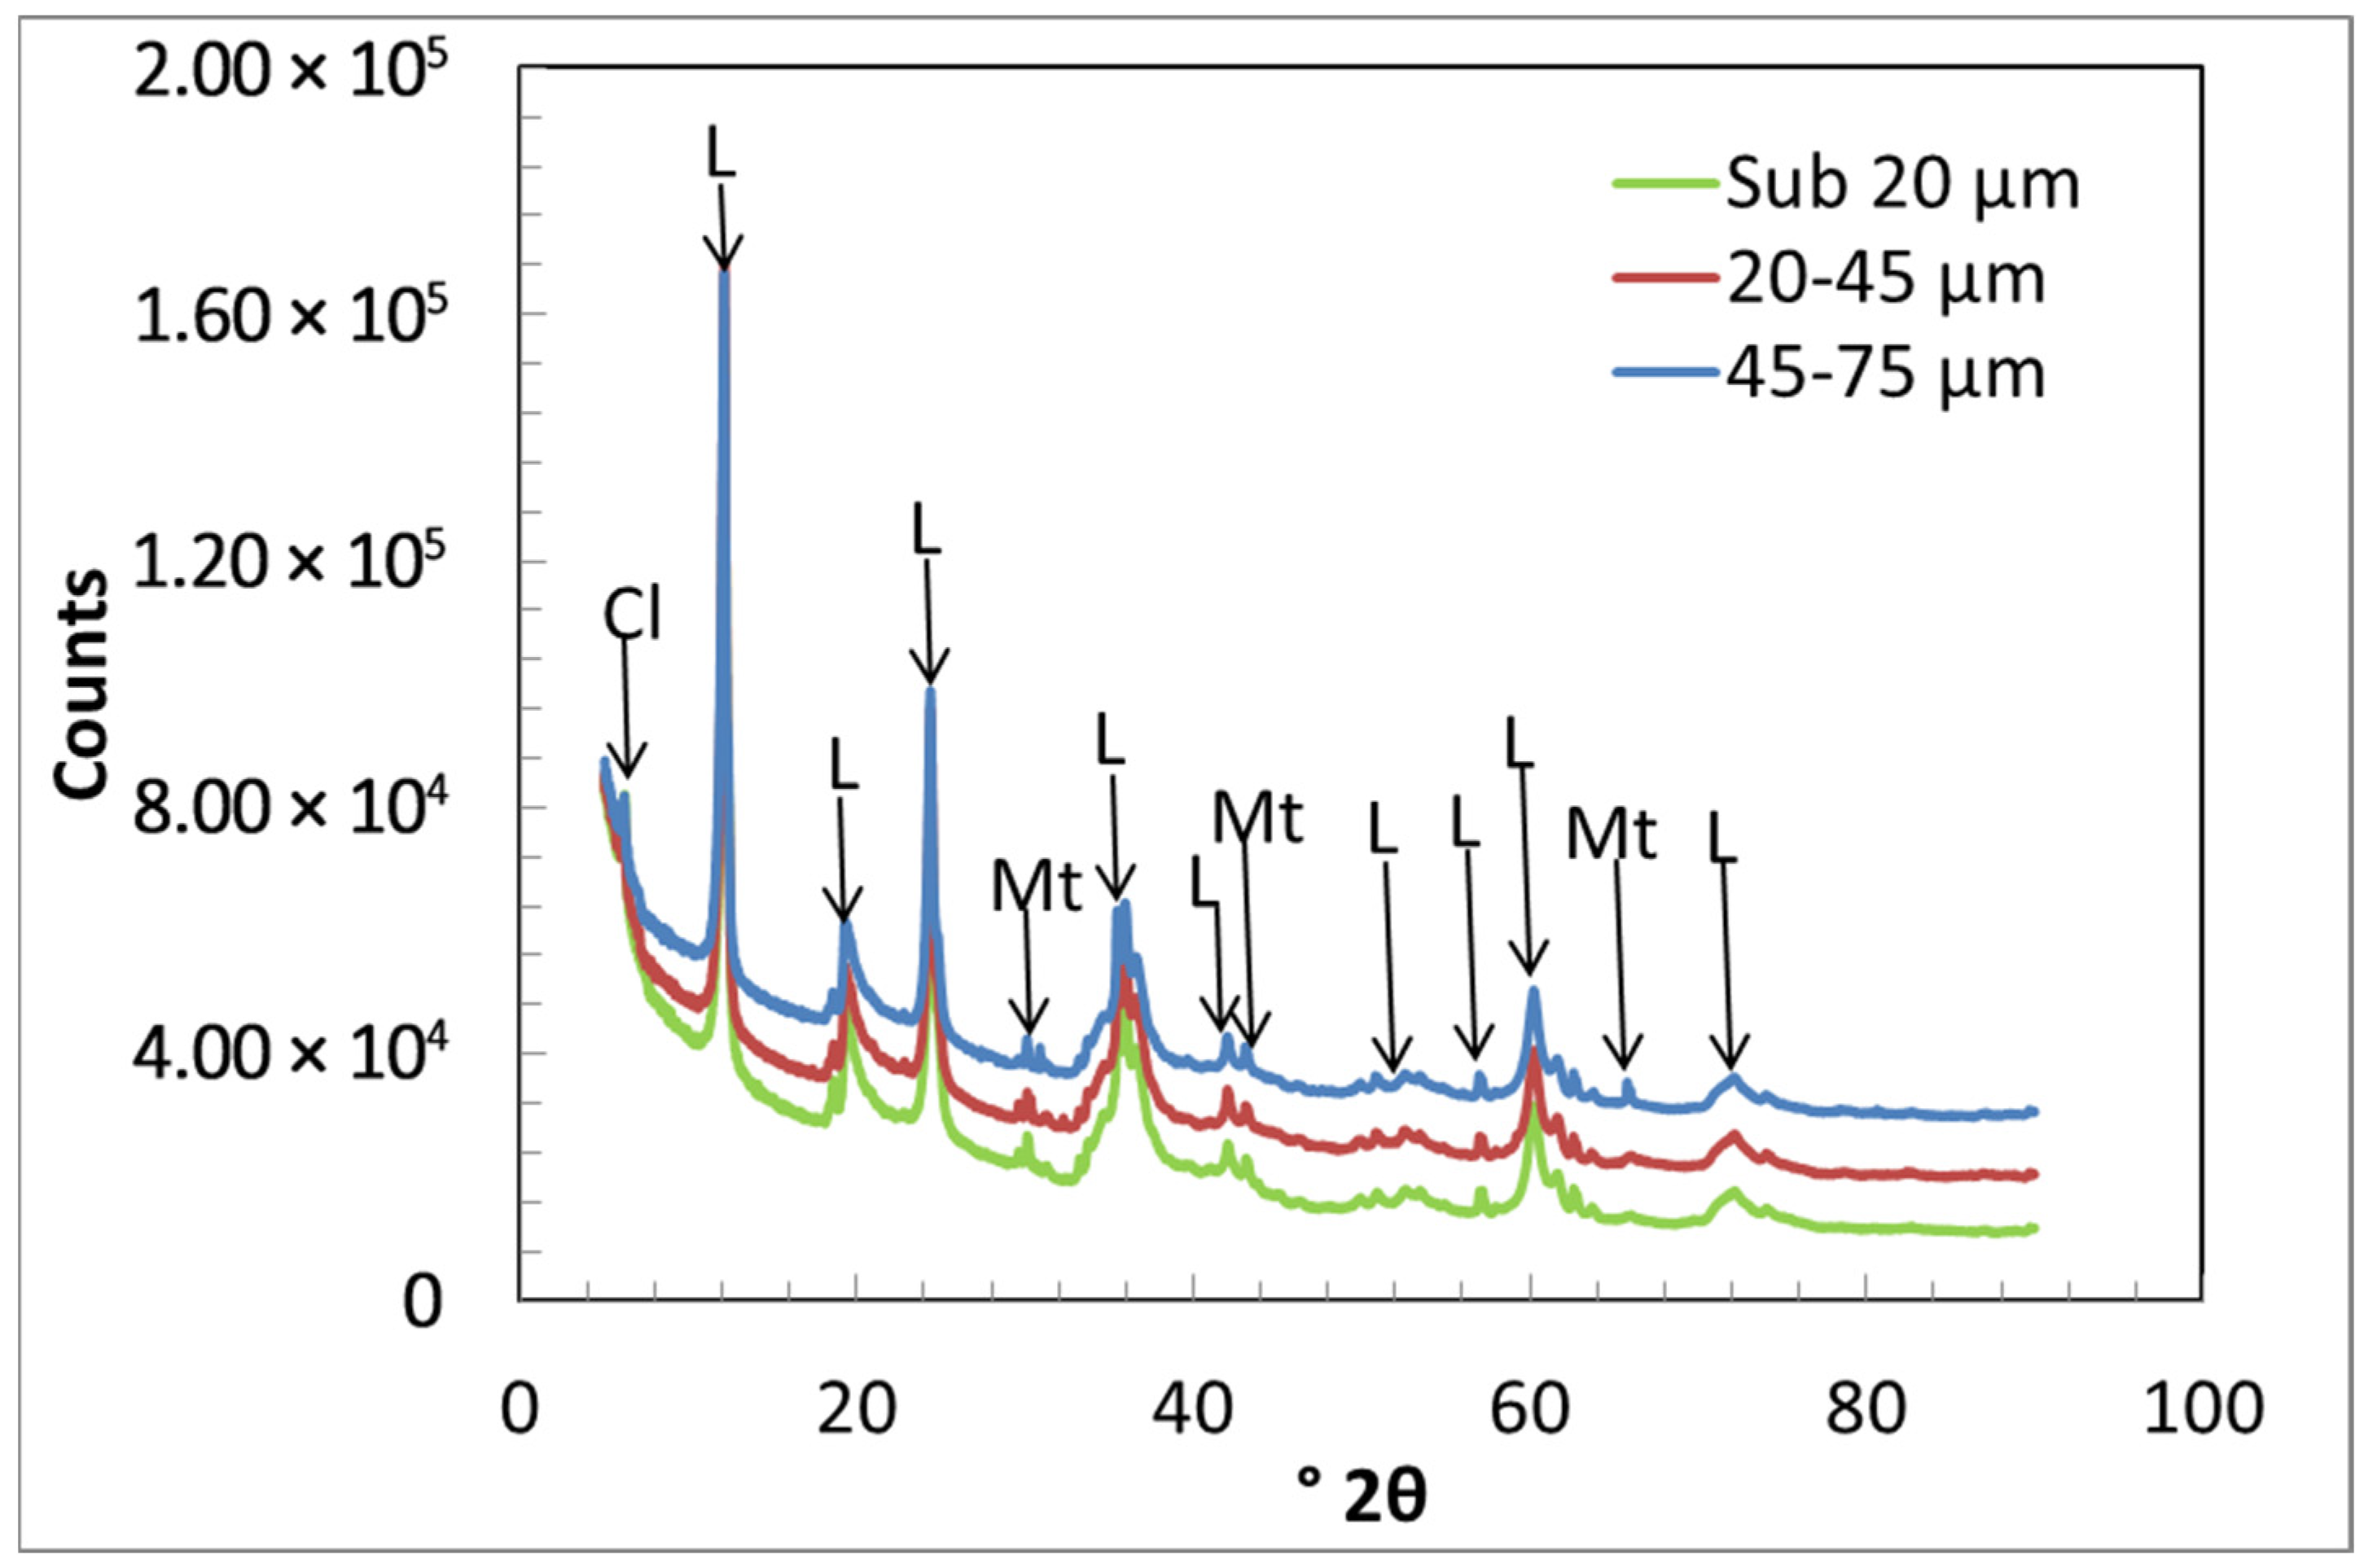
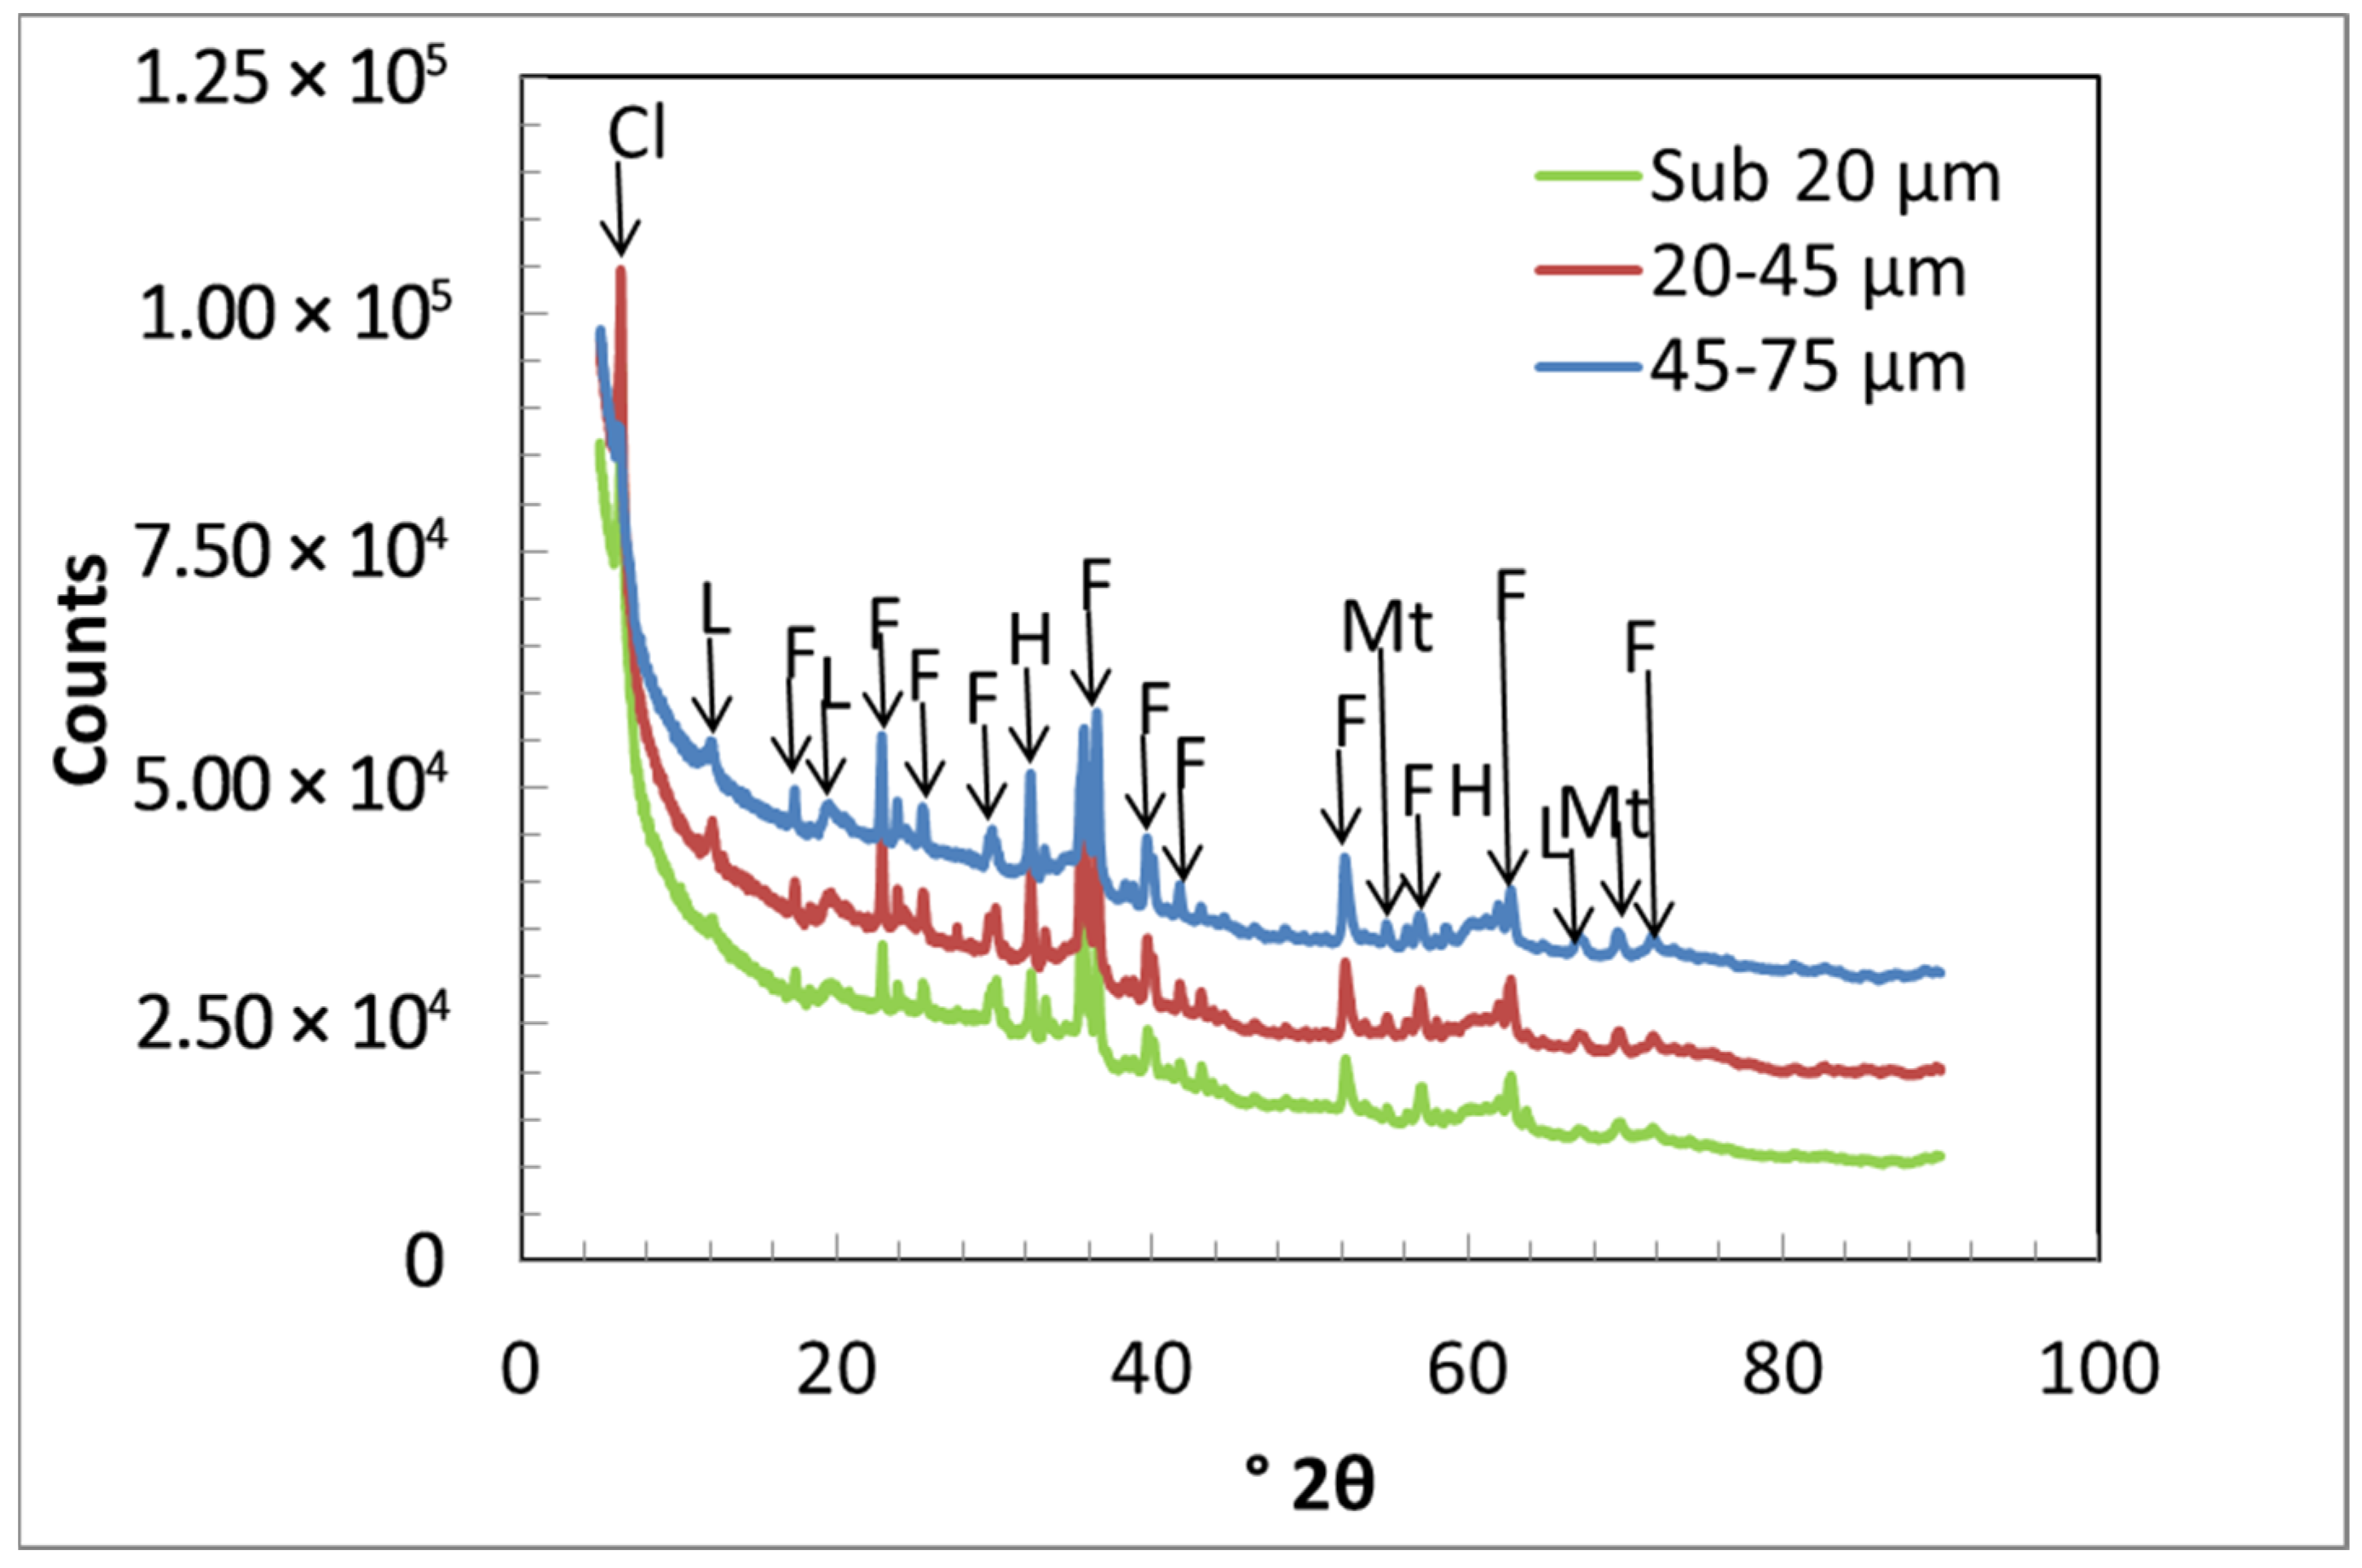
The particle size analysis of the samples provided three size measurements for each sample, namely d10, d50, and d90, corresponding to 10, 50, and 90% of the particles (by volume) present in the sample having diameters of less than d10, d50, and d90, respectively. These results are shown in Figure 1 and Table 1. The upper size of the particles appears to be larger than the bin size, which can be attributed to the shape of the particles (non-spherical, rod-like particles). Elongated particles can have a maximum dimension larger than the screen aperture yet can still pass the screen if the dimensions of the other axes are smaller. The results confirm the removal of fines for the larger size fractions (45–75 and 20–45 µm), as shown in Figure 1.

3.2. X-ray Analysis

XRD analysis was used to identify the main crystalline phases present in each raw mineral sample. The results of the XRD analysis are presented in Figure 2. The main crystalline phases identified in the raw lizardite, for each of the size fractions, were lizardite, clinochlore, and magnetite.
All the fractions of raw lizardite were heat-activated in a rotary kiln at 630 °C for 4 h under partial vacuum (<20 kPa). An XRD analysis was also performed on the heat-activated samples to identify the residual crystalline phases [31,32,33,34]. Figure 3 shows the results of the XRD analysis for the heat-activated fractions and the primary crystalline phases remaining or formed during heat activation. It can be seen from the quantitative XRD analysis in Table 2 that the forsterite composition is lower in the sub-20 µm material compared to that with a larger particle size. This is consistent with previous reports that suggest that the amount of forsterite formed is lower in smaller compared to larger particles [35].
The compositions for the two large size particle fractions (45–75 and 20–45 µm) are similar. Meanwhile, for the sub-20 µm fraction, the amorphous content of the sub-20 µm material is about 10% higher than the that of the larger bins and contains less lizardite. For the two large size particle fractions, it can be concluded that any differences in the reactivity between the coarsest fractions can be attributed to particle size alone. The sub-20 µm fraction is expected to exhibit a slightly improved reactivity owing to its chemical composition, even before accounting for the effects of particle size.

3.3. Elemental Analysis of Supernatant Solutions with ICP-OES

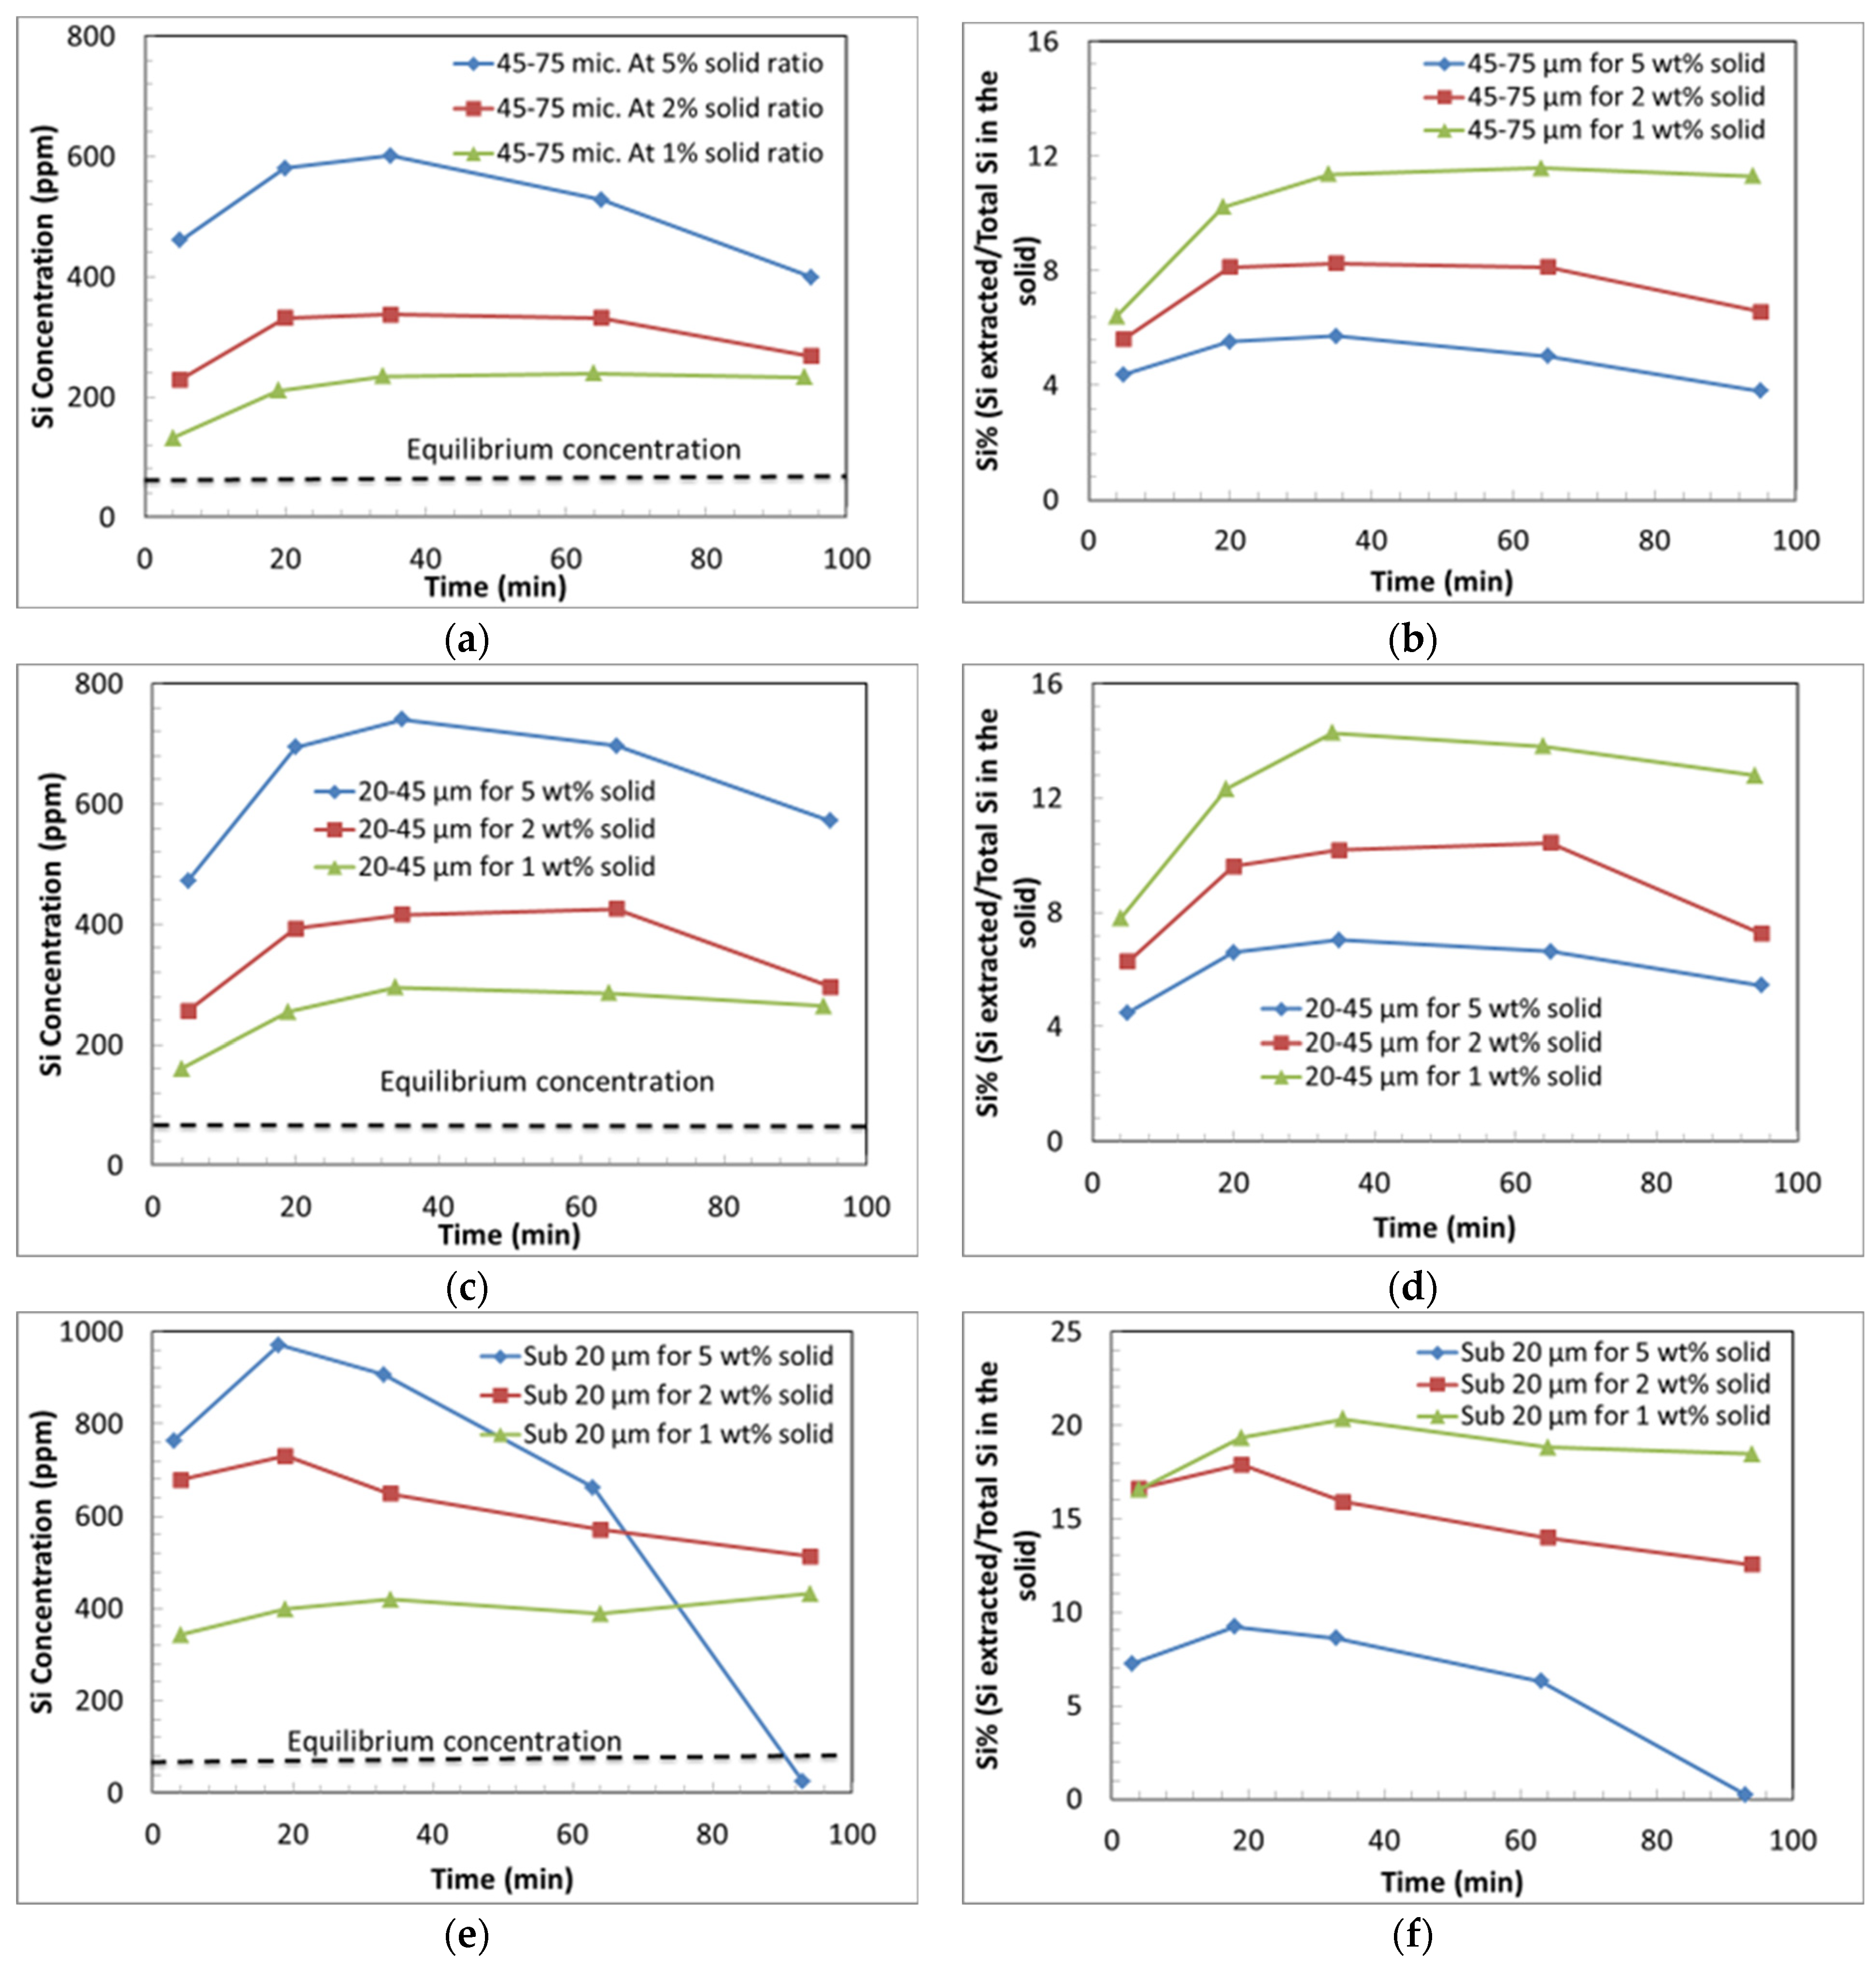
3.3.1. Effect of Liquid-to-Solid Ratio

One of the most important parameters that has a significant effect on the extent of dissolution of Mg and the rate of dissolution is the solid-to-liquid ratio [36]. It has been reported that decreasing the solid-to-liquid ratio facilitates the interaction of serpentine particles with generated protons and hence increases Mg extraction [9,37]. Furthermore, the extent of carbonation for two-stage carbonation was promoted when the solid-to-liquid ratio decreased [36,38].
As shown from the results of the ICP analysis displayed in Figure 4a–f (specifically for Mg), the dissolution process appears to comprise two main stages; an initial rapid extraction of Mg (in the first 20 min), followed by a period in which the dissolution rate decreases dramatically—the second dissolution stage. In all the experiments, the Mg concentration increases monotonically with time. This can be contrasted with the experiments conducted at an elevated temperature, in which the Mg concentration reaches an initial maximum before declining to an equilibrium value [34]. This indicates that Mg carbonate precipitation is greatly hindered in the present experiments.
The ICP results indicate that the solids concentration had a significant effect on the extent of dissolution of Mg and the rate of dissolution. It appears, for all the particle size fractions, that the extent of Mg extraction (per g basis) for the experiments conducted at the lower solids loading (1 wt%) is higher compared with the higher solids loading (2 and 5 wt%) experiments. This is most likely due to the pH effect, as the increased solids loading results in a greater rise in pH over the course of the batch experiments. Another possible contributing factor is the higher rate of deposition of Si, as discussed later in this paper. It can be observed clearly from Figure 5c,d that the Mg extraction for the fine particle (sub-20 µm) experiments was almost the same for the different solids loads (1, 2, and 5 wt%). These results could be attributed to the substantial surface area, resulting in the extensive extraction of Mg from the fine particles. This extraction occurs irrespective of the solids load, leading to a more significant increase in pH during the various solids loading experiments.
The maximum extent of Mg extraction of approximately 65% was achieved using fine particles (sub-20 µm). For comparison, the carbonate yield for the same particle size in the direct aqueous carbonation with ARC conditions was approximately of 50% [34]. This indicates that it is possible to extract a significant fraction of Mg using CO2 and that the intrinsic reactivity/dissolution kinetics of the mineral is not the limiting factor to dissolution under the current dissolution conditions but not so under single-stage mineral carbonation. Other issues, such as diffusion resistance (Si passivating layer) and the precipitation of Mg silicate and carbonate phases may play a role in hindering the carbonation progress, leading to the low conversions in the ARC process. For the 45–75 µm size fraction, as shown in Figure 4b, the maximum extent of Mg extraction (of the total Mg in the ore) for the 5 wt% solids experiments was approximately 31%, while for the same particle size with a lower solids loading (1 wt% solids) the maximum extent of Mg extraction was approximately 44% of the total Mg.
The impact of the solids loading on the extraction extent could be caused by the increase in pH that occurs with increasing solids load. To investigate the effect of the solids loading on pH, thermodynamic calculations were conducted using brucite as a surrogate material to represent the amorphous fraction, with the quantity of brucite selected to match the measured Mg concentration in solution. Under a partial pressure of CO2 of 100 bar at 40 °C, without any dissolved mineral in the system, the PHREEQC simulation predicted a pH of the H2O-CO2 system of 3.0. This modelled pH increased to a value of 5.4 for the 5 wt% solids experiment, and a pH of 5.0 for the 1 wt% experiment. Other researchers [39,40] have determined that the rate of mineral dissolution is proportional to the 0.5 power of proton concentration (i.e., rate ~ [H+]0.5). From this, the expected change in the rate of reaction should be approximately 1.5 times faster for pH 5 compared to the rate of reaction for pH 5.4. However, as can be observed in Figure 4b, the rate is significantly slower (by, approximately, a factor of 10) for the experiment with a 5 wt% slurry concentration compared to the experiment with 1 wt% solids. In addition, it appears that further into the experiment, the reaction completely stops, with the 5 wt% experiment reaching a terminal level of extraction significantly lower than that in the 1 wt%. As such, whilst the effect of pH is expected to account for some of the observed decrease in rate and extraction with increasing solids concentration, there must be other factors that contribute to the significant decline in performance.
The ICP results also disclose a similar effect for Si dissolution, with the low solids loading experiments producing a greater extent of Si extraction compared to the experiments with a higher solids load. The dissolution trends for Si also show two distinct steps; an initially rapid rate of extraction of Si, leading to a peak concentration, as can be seen in Figure 5a–f, which is followed by a declining concentration of Si, indicative of the precipitation (polymerisation) of Si from the solution. These trends for Mg and Si represent the net rates of extraction, which comprise a combination of extraction and precipitation processes.
Increasing the solids concentration from 1 to 5 wt% had a significant effect on the Si extraction and the concentration of Si in solution at any given time during the experiment. As can be seen in Figure 5a, for the 45–75 µm particle size fraction, the concentration of Si for the 1 wt% solids experiment was initially close to 200 ppm (10% of the total Si) (after 20 min) and by increasing the solid concentration to 5 wt%, the Si concentration increased to 580 ppm (5.0% of the total Si) for the same sampling time (after 20 min). These results can be interpreted as being the result of Si precipitation for the higher solids concentration experiment. In other words, the Si precipitation rate for the higher solids concentration was more rapid than that for the experiment at a lower solids concentration due to the higher level of supersaturation with respect to amorphous silica in solution and the greater surface area of mineral exposed to solution (greater number of nucleation sites) for the 5 wt% solids loading experiment compared to the 1 wt% solids loading experiment.
For the experiments with 5 wt% solids, the Si concentration in solution reaches a maximum before declining. The saturation limit, predicted by PHREEQC 2.18, for amorphous silica in water at 40 °C and 100 bar is 120 ppm of SiO2 (56 ppm of Si). As can be seen in Figure 5, for all samples for all experiments conducted at different solids loadings, the concentration of Si exceeded the solubility limit for amorphous silica (based on thermodynamic calculation using PHREEQC), after less than 4 min of reaction time. Also, silica gel (a precursor to amorphous silica) was observed in all the collected samples at the time of collection. It is hypothesised that amorphous silica precipitates and that it is precipitates at a greater rate for the higher solids loading (5 wt% solids) experiments. It is also hypothesised that the precipitating amorphous silica contributes to the formation of a Si passivating layer around the particle, hindering Mg extraction. The Si concentration declines faster for the greater solids loading (5 wt%) as there is more Si in solution, corresponding to a higher degree of supersaturation. In addition, the higher solids content provides more nucleation sites and a greater surface area for precipitation. The increased rate of Si precipitation with increasing solids content may explain why the decrease in the Mg extraction rate with the solids content is greater than that predicted based on pH effects alone. The effect of the solids loading on the extent and rate of Mg extraction for fine particles (sub-20 µm), is presented in Figure 5d. It appears that the extent of Mg extraction per unit weight of mineral was enhanced by decreasing the solids loading (most likely due to lowering the pH and the reduction in the extent of Si re-precipitation (Figure 5e)), which facilitates the additional leaching of Mg compared with the higher solids loading experiments. It can be seen from Figure 4a–d that for the 45–75 and 20–45 µm size fractions, the ratios between the final Mg concentrations for the 5 and 1 wt% solids experiments are approximately 3.6 and 3.7, respectively, which are lower than the theoretical ratio between the two different loadings, based on the weight measurement alone, of 5. On the other hand, for the fine particles in Figure 5e,f (sub-20 µm), the ratio is 4.6, which is close to the theoretical ratio between the two different loadings based on the weight measurement alone of 5 for the 5 and 1 wt% solids experiments. It is possible that the precipitation of silica has a lower impact on the ultrafine particles, as the precipitated silica is spread over a larger area, leading to the smaller thickness of the precipitated layer and less diffusion resistance. In addition, the observed Mg extraction for the sub-20 µm particles is so fast that the concentration stabilises prior to the decrease in the Si concentration, and as such, the Mg is extracted before the diffusion limiting barrier can form.
The relative amount of Mg and Si initially differs compared to the latter stages of the dissolution. For example, for the 45–75 µm size fraction with a 5 wt% solids loading, the Mg/Si ratio changed from an initial value (after 20 min) of 4.8 to a value of 9.2 at the later stage of the experiment, as can be seen in Figure 6.
As is evident in Figure 7, the Si concentration for the sub-20 µm fraction at 5 wt% slurry under the ARC conditions (130 bar and 150 °C with 0.64 M NaHCO3) is always under the saturation limit for amorphous silica [34].
This may be due to the formation of other Mg silicate phases, as predicted by PHREEQC [31]. On the other hand, the Si concentration for the dissolution experiment with the sub-20 µm fraction at 5 wt% slurry is higher than the saturation limit for amorphous silica for the majority of the experiment, falling below the equilibrium solubility limit at the end of the experiment. The persistently high Si concentration indicates that SiO2 precipitation is relatively slow under these conditions. This is significantly different to the experiment conducted under ARC conditions [34]. The Si profiles in the ARC experiments suggest the precipitation of Mg silicate phases, which may further hinder Mg dissolution and reduce the selectivity towards MgCO3. This may explain the higher Mg extractions in the dissolution experiments at 40 °C and demonstrates the significant role of temperature on the precipitation rate (150 °C under ARC conditions) of secondary phases.

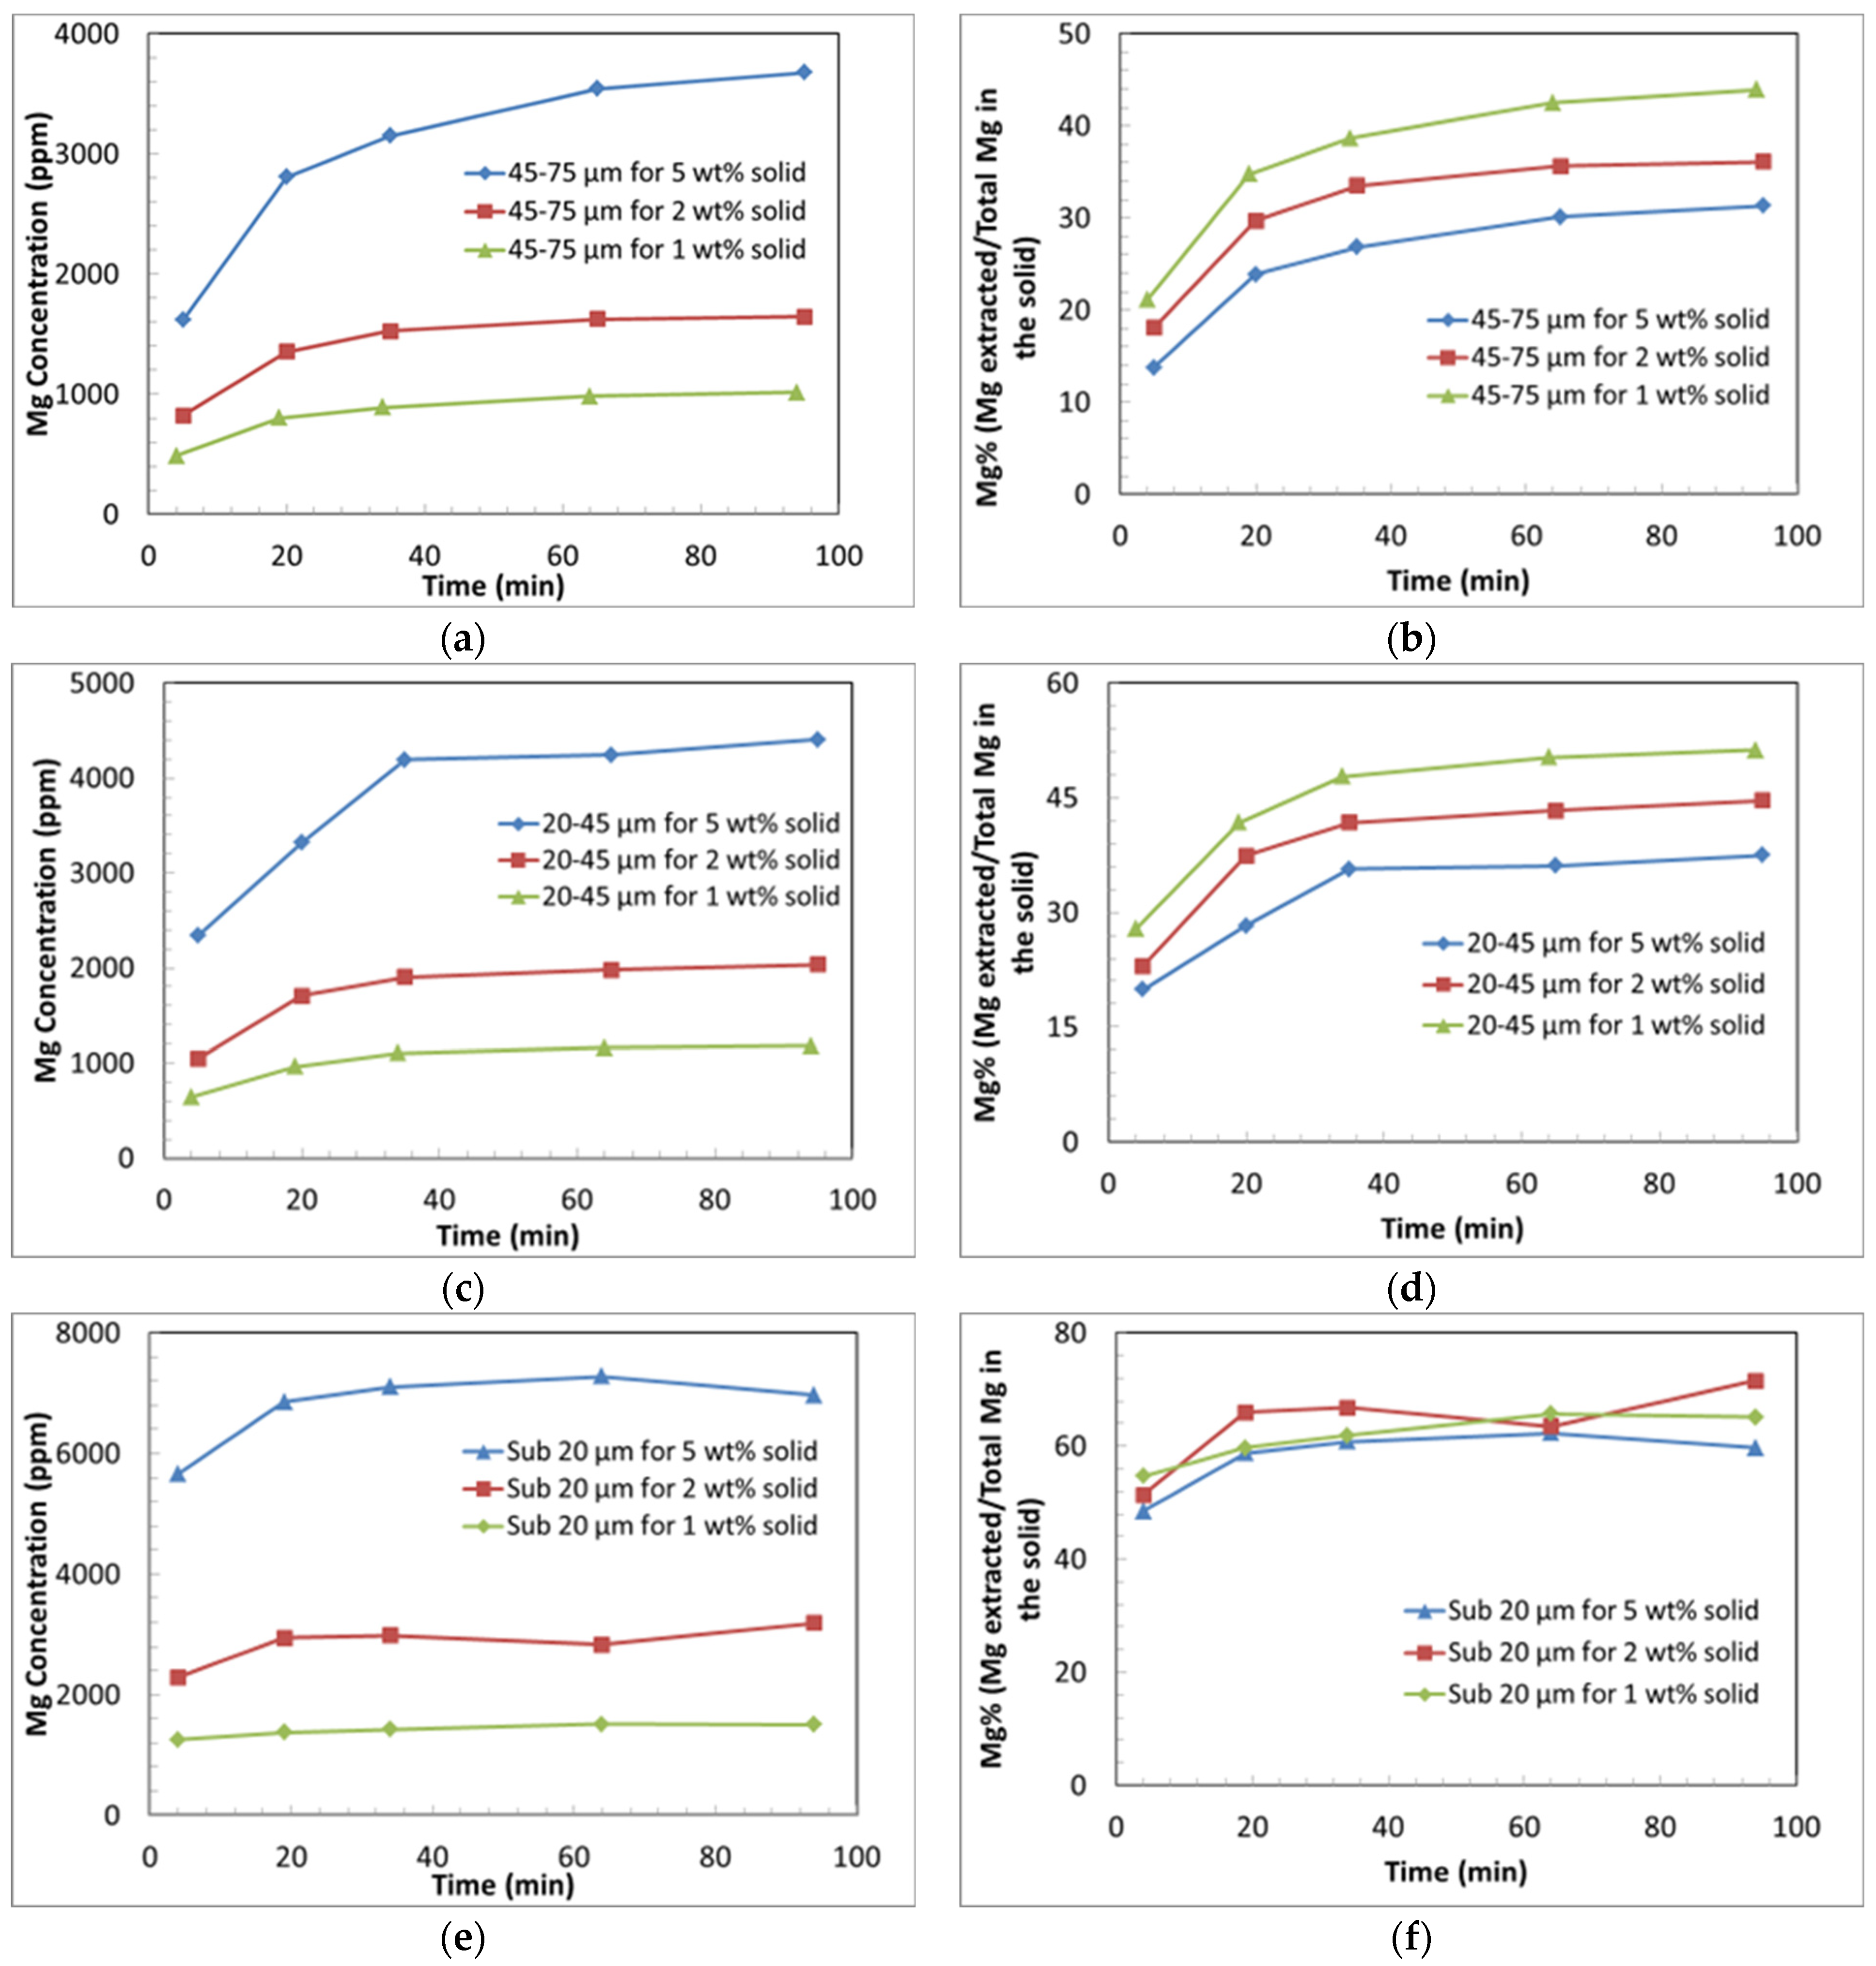
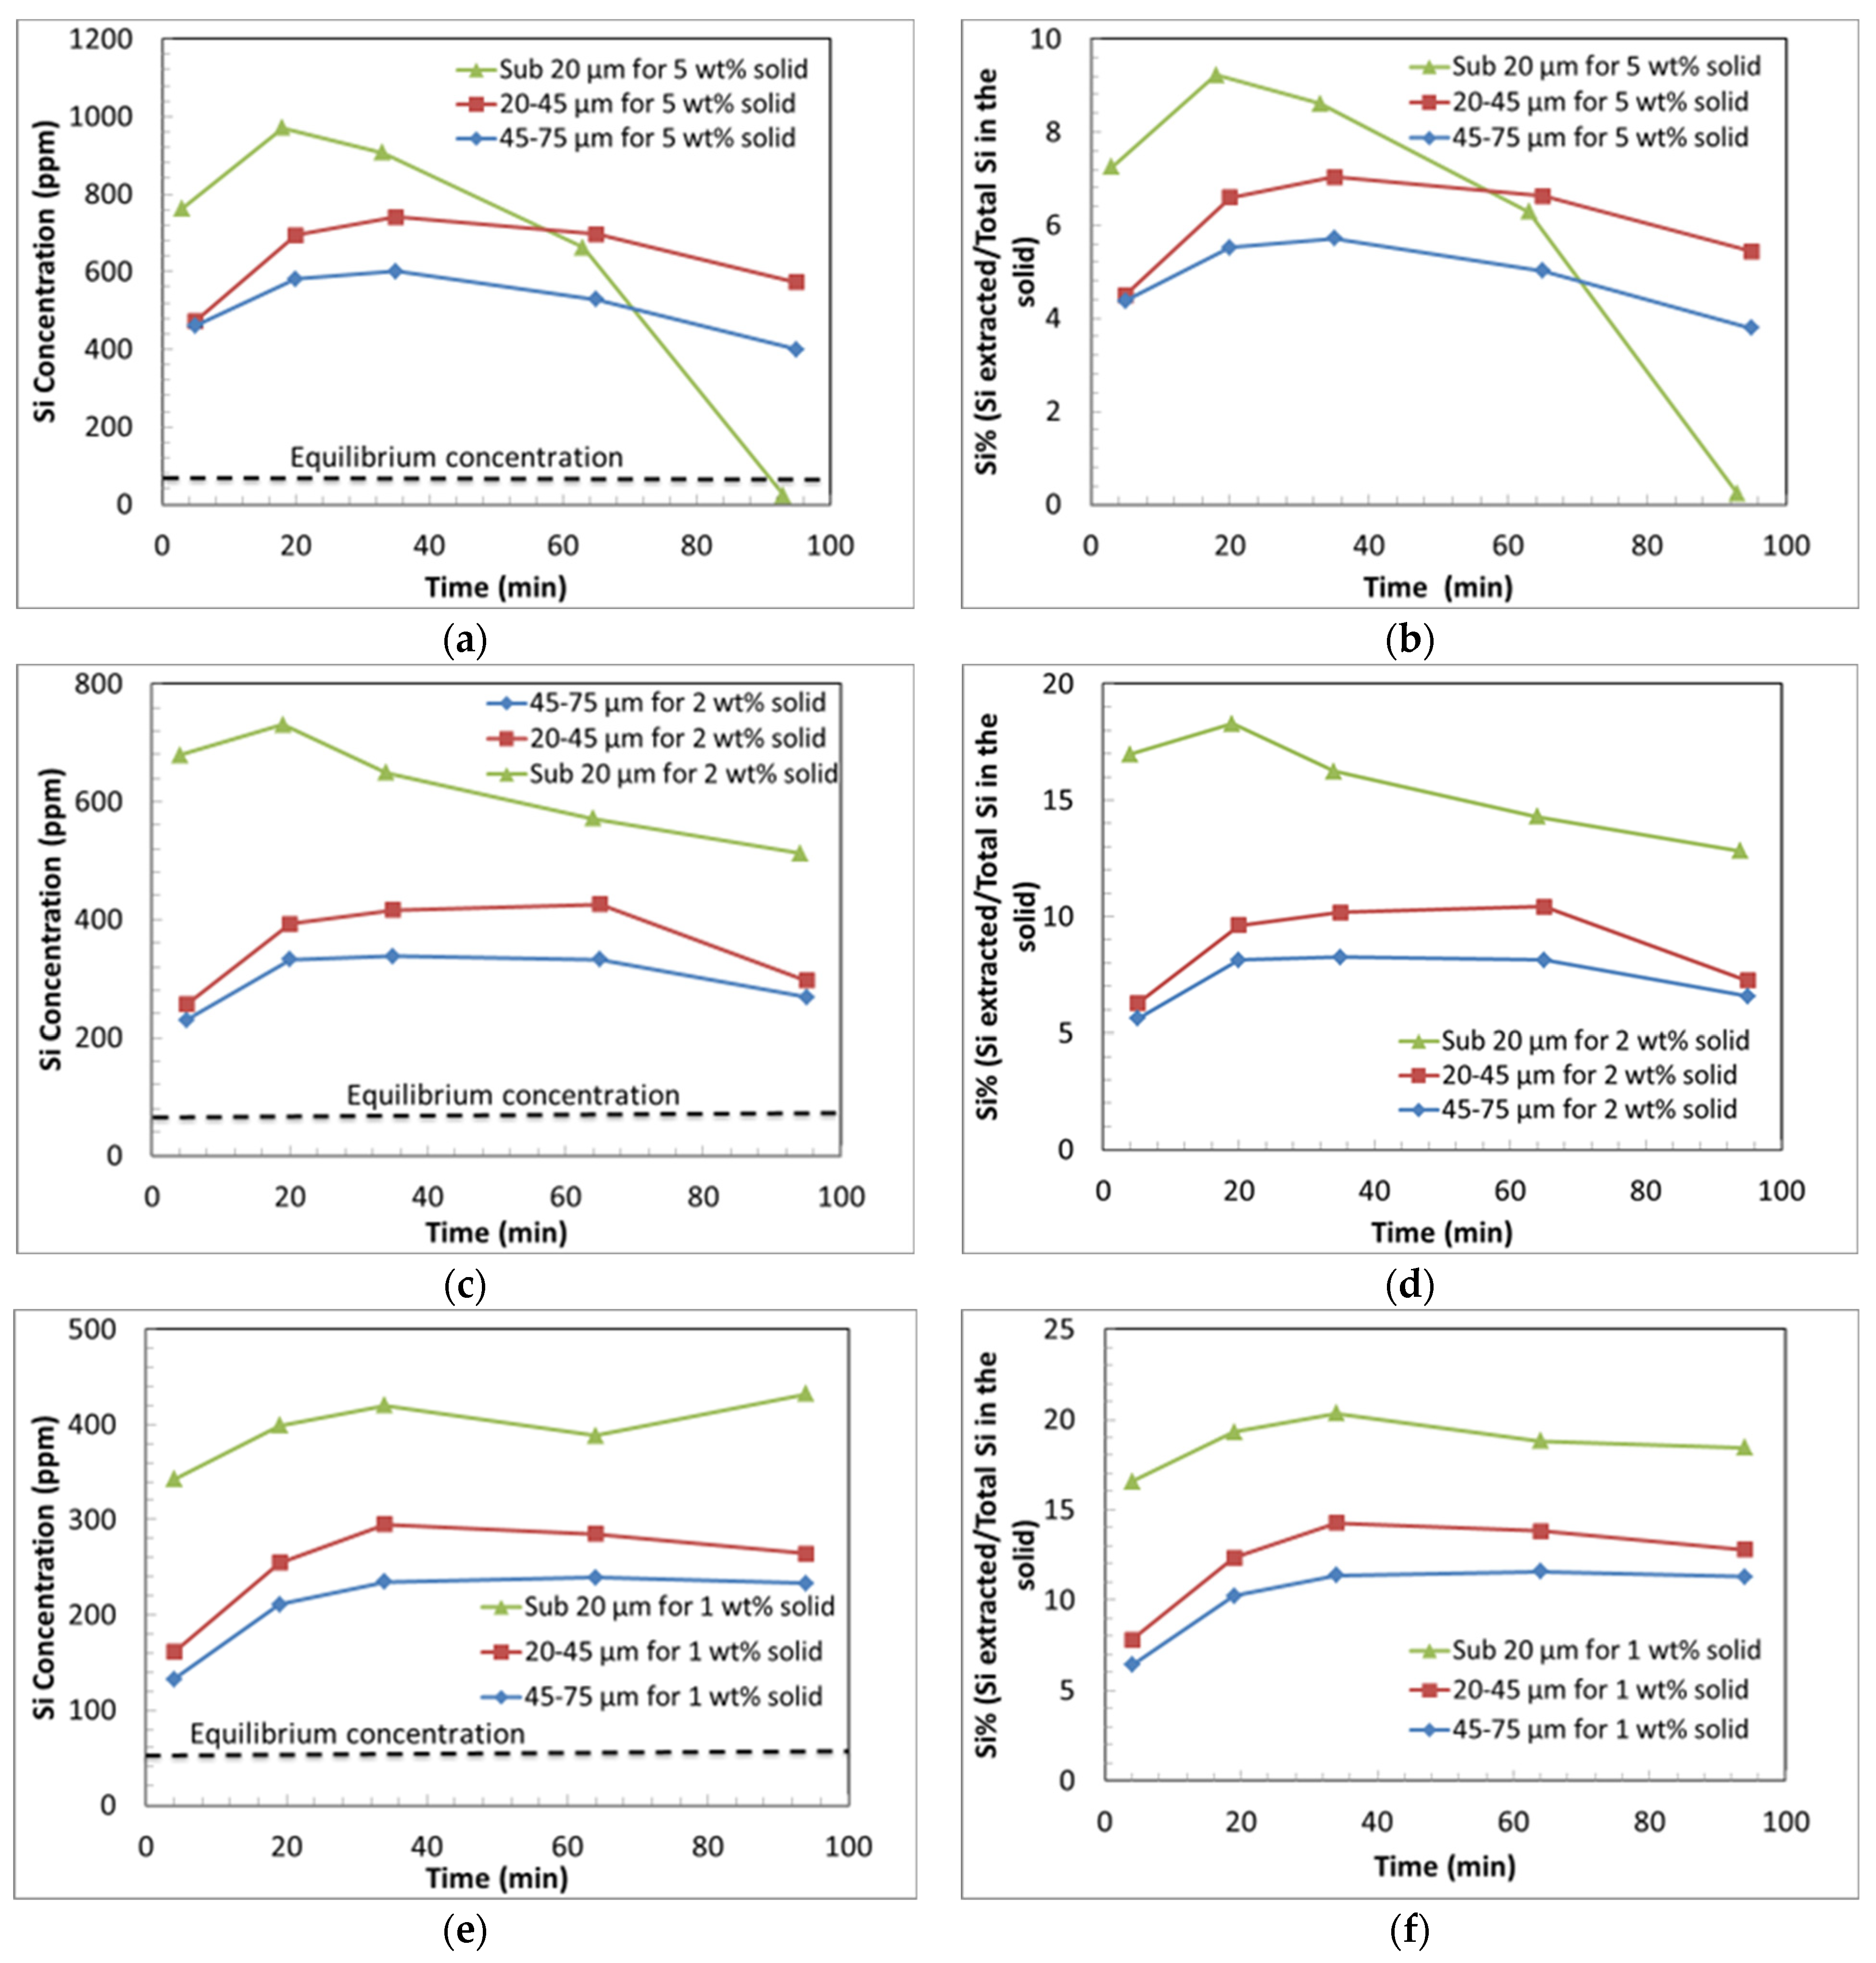
3.3.2. Effect of Particle Size on Si and Mg Extraction
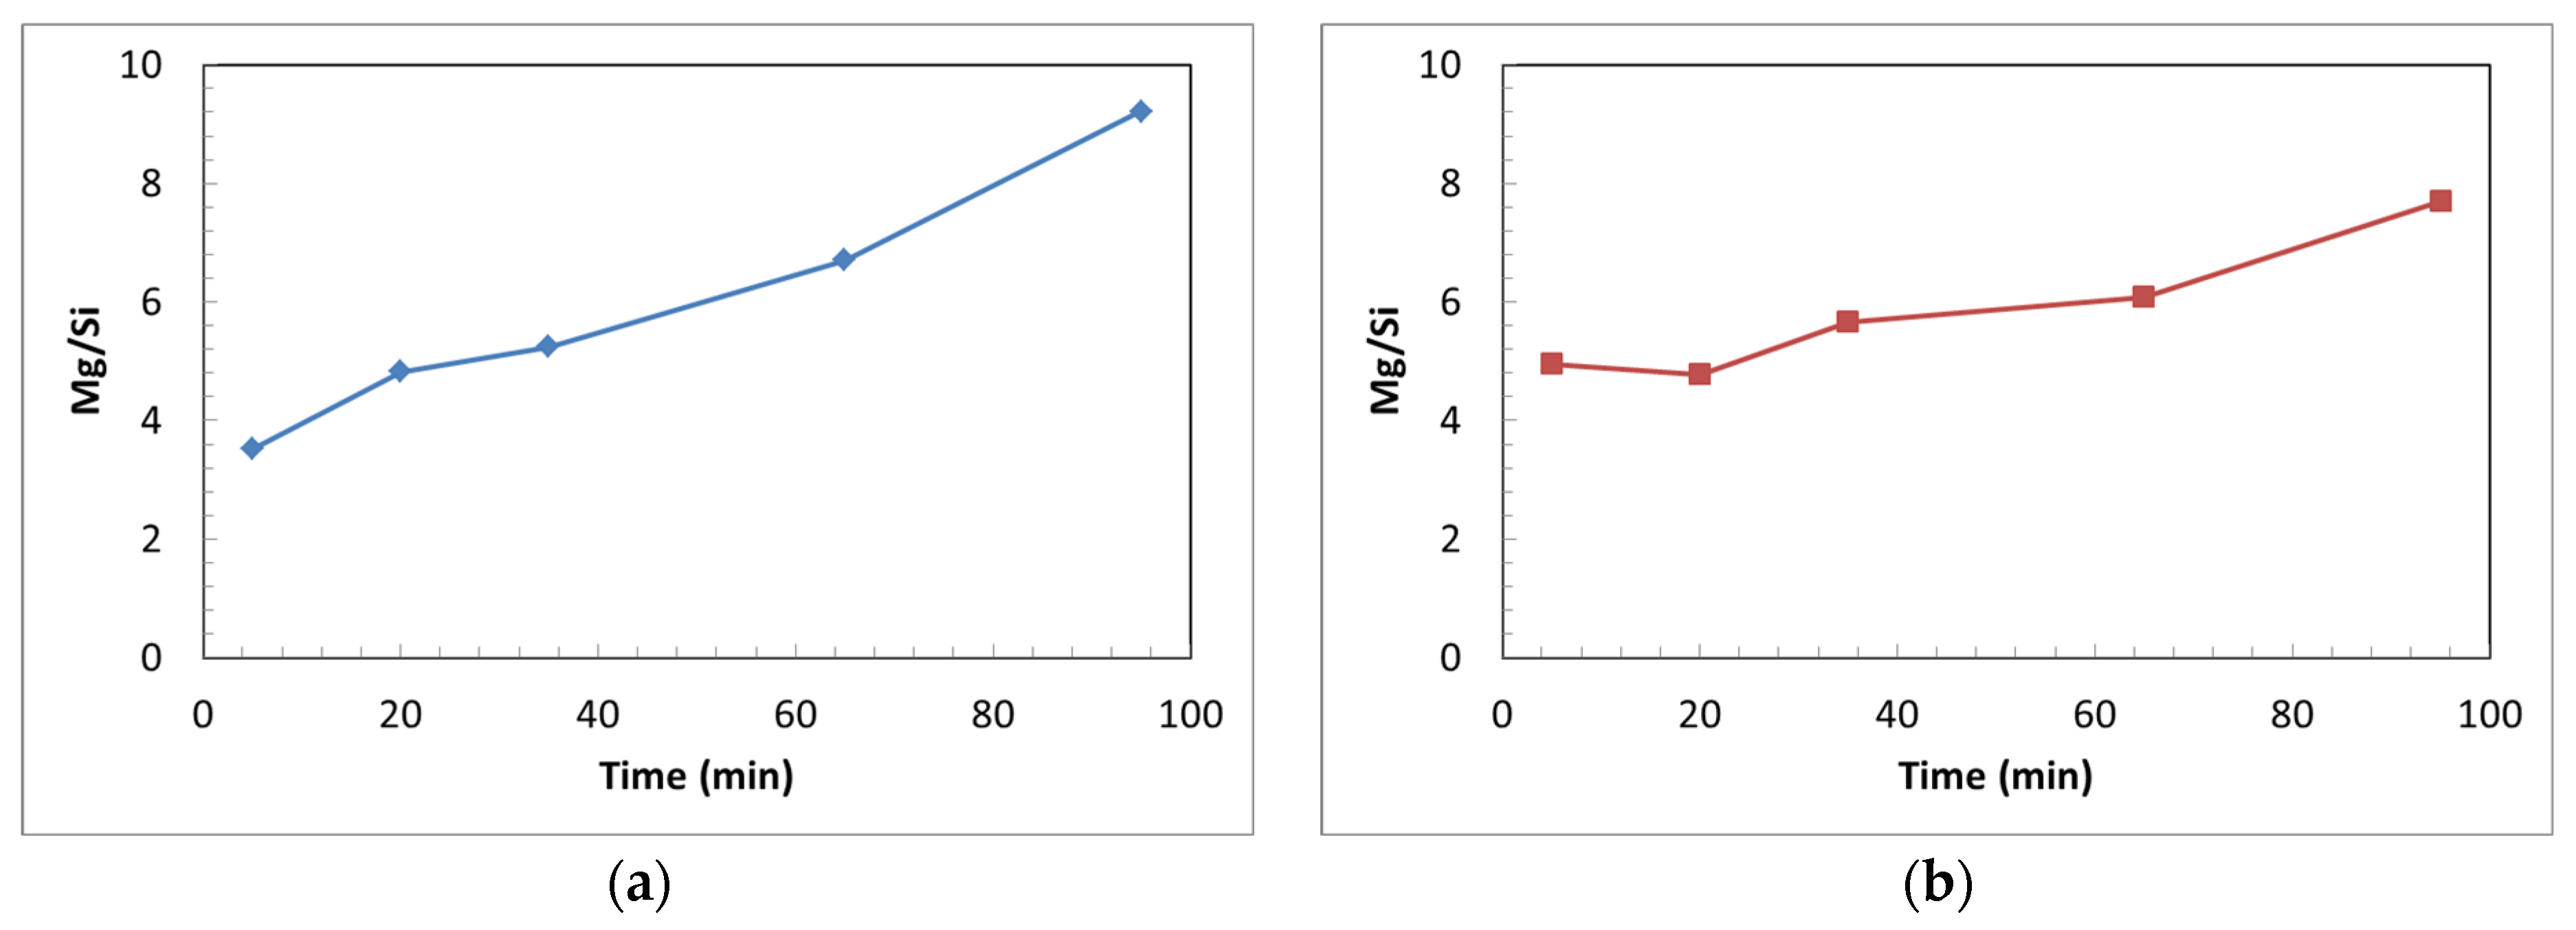
As shown in Figure 8 for the dissolution experiments using 5, 2, and 1 wt% solids, the maximum extent of Mg extraction as a percentage of the total Mg in the mineral was between 60 and 70% for the experiment using the sub-20 µm particle size fraction, with a greater extent of Mg extracted (in absolute terms) from fine particles (sub-20 µm) compared with the larger size fractions (20–45 and 45–75 µm), where reaction takes place under, otherwise, the same experimental conditions (40 °C, 100 bar). These results confirm the notable effect that the particle size has on the overall rate and the extent of dissolution, with fine particles and their associated relatively high surface area (typically 0.76 m2/g for sub-20 µm, based on laser diffraction particle sizing analysis) producing a greater rate of extraction. Based on the ICP analysis of the supernatant from the experiments, it can be concluded that the dissolution of all the particle size fractions is initially relatively rapid, while during the latter stages of heat-activated lizardite dissolution, an increase in the pH reduces the rate of dissolution of the mineral. The formation of a silica-rich layer around a core of the unleached particle, which presents a diffusion barrier and inhibits the rate of further dissolution, would also contribute to the reduced rate of Mg extraction with time.
Similar trends of Si extraction are observed for all three particle size fractions studied (as can be seen from Figure 9), with a greater extent of Si extracted (in absolute terms) from the fine particles (sub-20 µm) compared with the larger size fractions (20–45 and 45–75 µm). A decrease in the Si concentration for each size fraction is observed, which indicates the onset of precipitation of amorphous silica from the bulk solution, resulting in the formation of a silica layer. This is most pronounced for the sub-20 µm fraction at a 5 wt% slurry concentration, at which the final Si concentration falls below the equilibrium solubility limit for amorphous silica, as shown in Figure 9a. The low Si concentration may be due to the solution being saturated with respect to other phases (e.g., Mg silicates).
The key findings from the previous results for the effect of the solid-to-liquid ratio and particle size can be summarised as follows:
(a)
The dissolution behaviour of Mg comprises two main stages: an initial rapid extraction, followed by a dramatic decrease in the dissolution rate.
(b)
The Mg concentration increases monotonically with time. This indicates that magnesium carbonate precipitation is greatly hindered compared to ARC conditions.
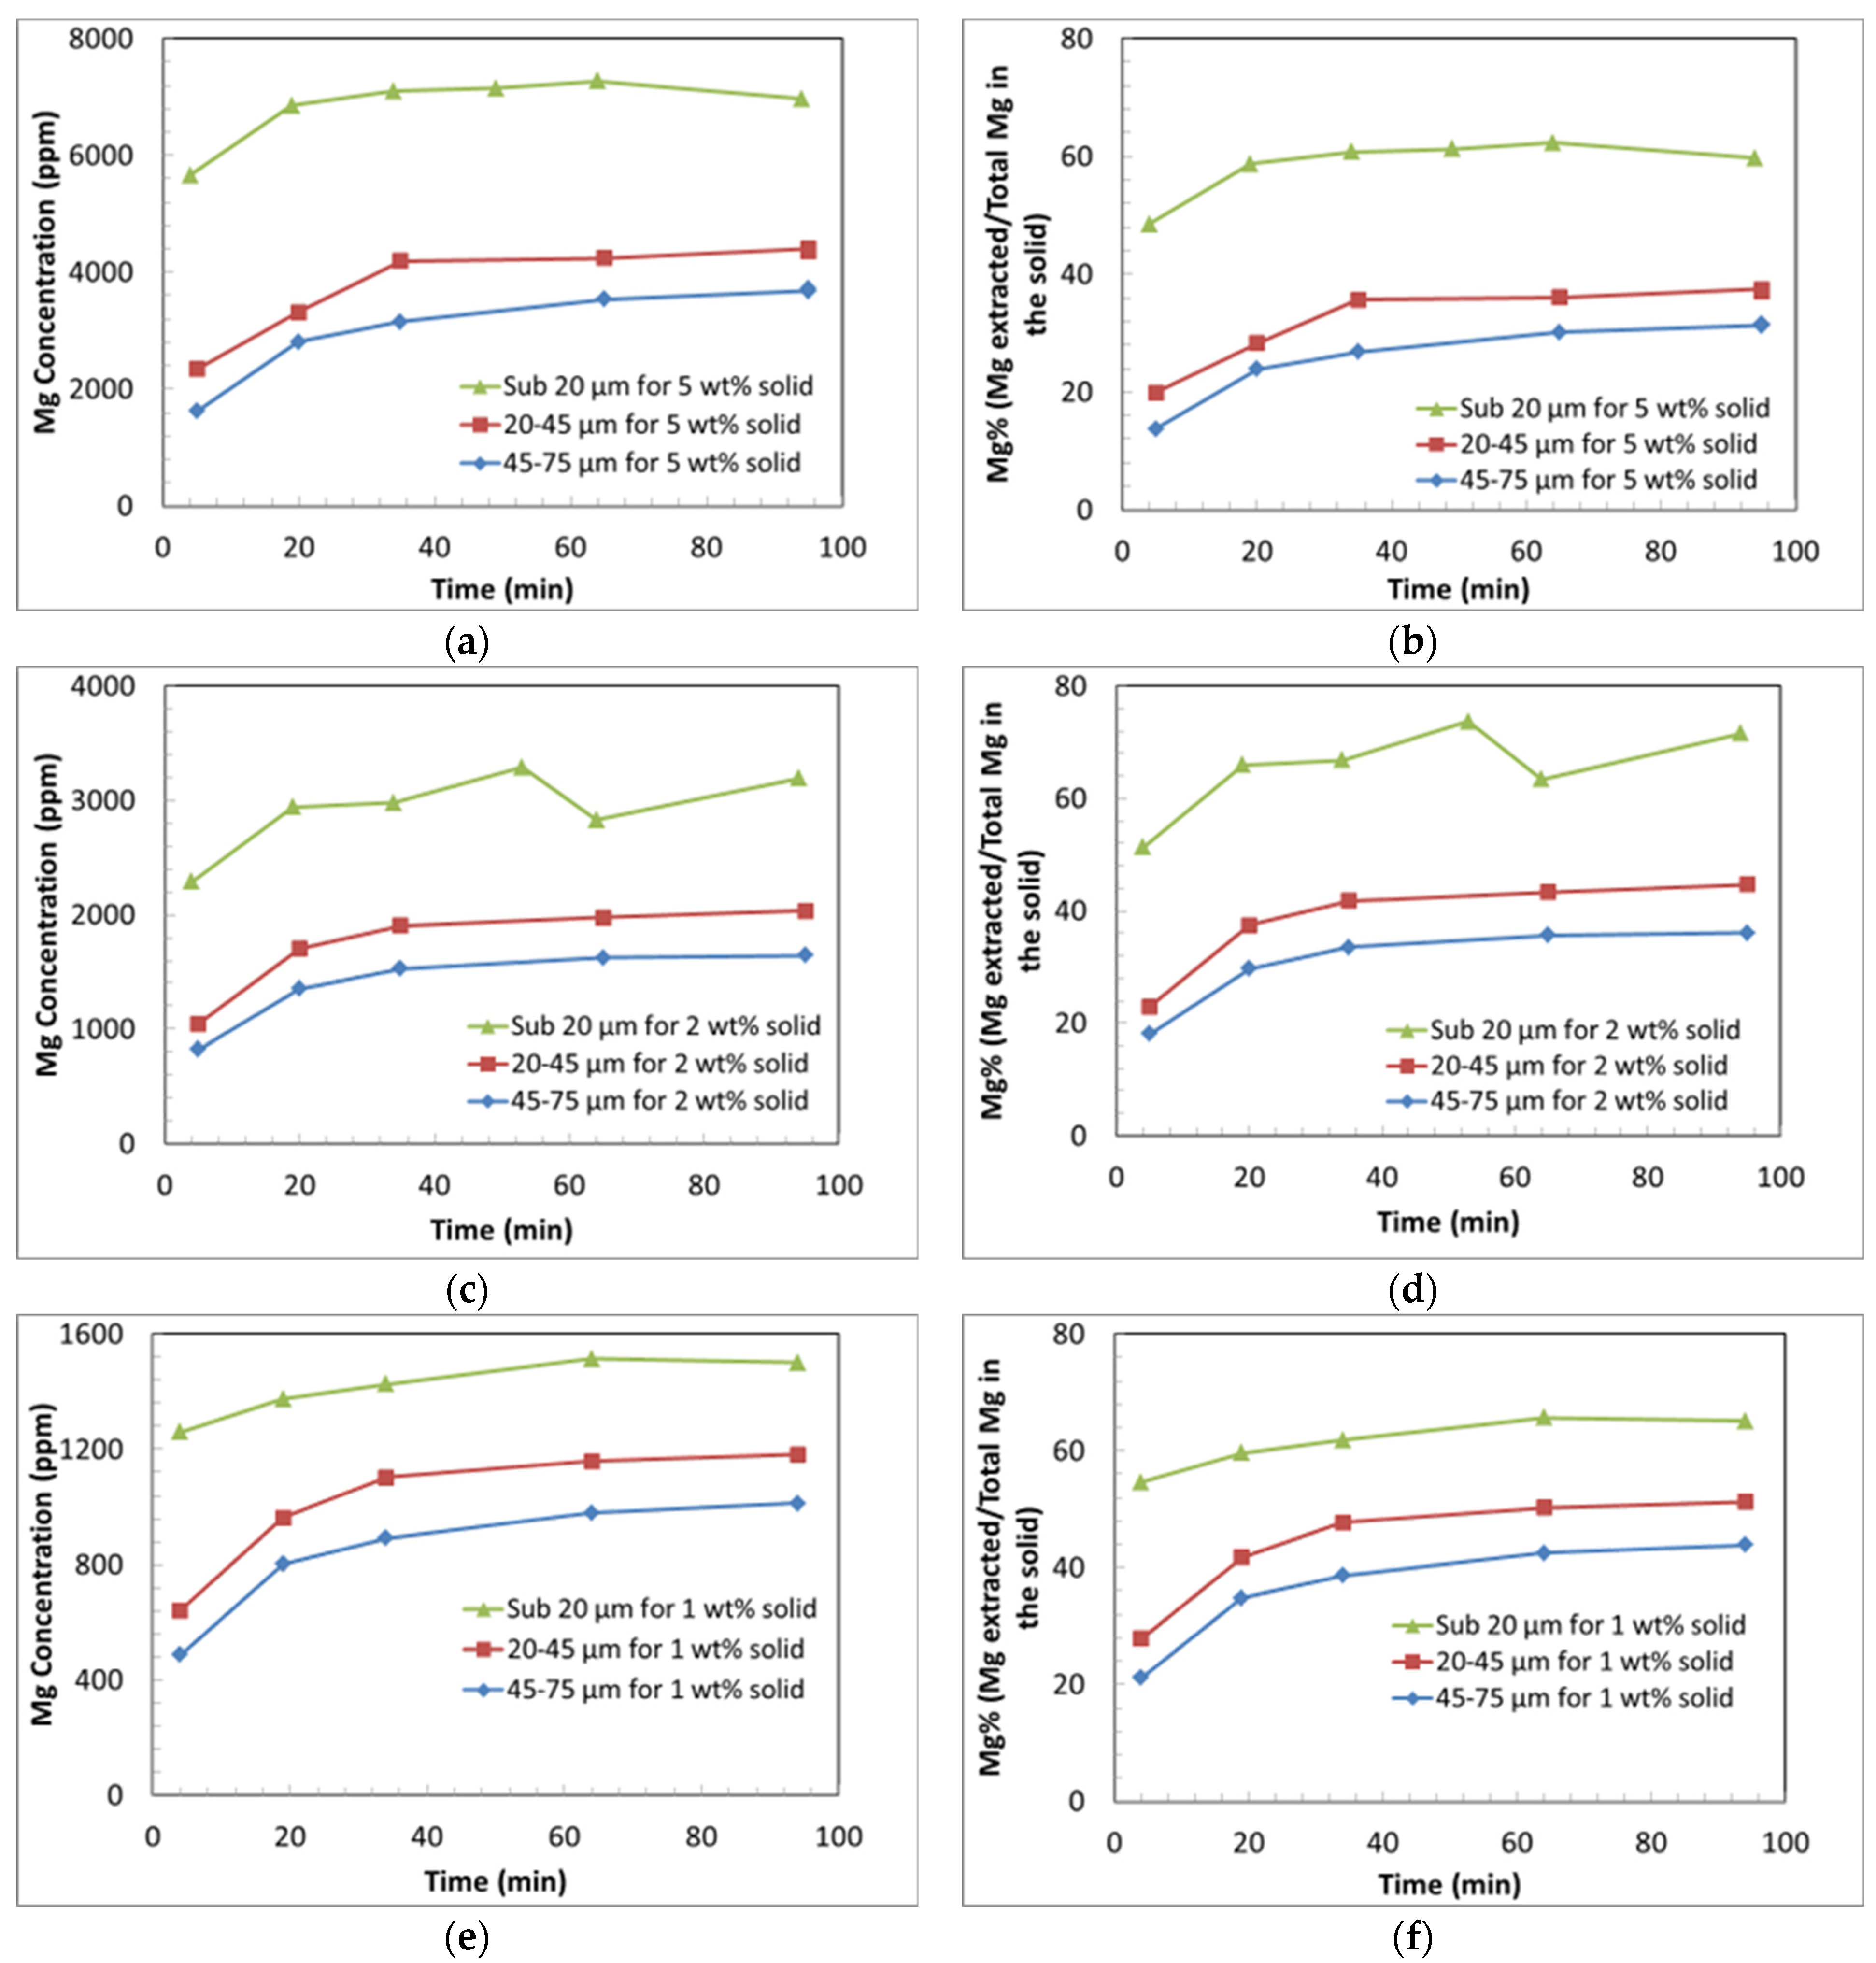
(c)
The extent of Mg extraction for coarse particles decreases with increasing solids loading. This is partly due to the effect of pH on extraction kinetics, as the increased solids loading results in a greater rise in pH over the course of the experiment.
(d)
The decrease in the extraction rate and extent with the increasing solids content is not fully explained by the effect of pH alone. Another possible contributing factor is the higher rate of deposition of Si, which may form a passivating layer, hindering further Mg extraction.
(e)
The high surface area of the fine particles (sub-20 µm) in the experiments leads to a high extent of Mg extraction regardless of the solids loading. A maximum extent of Mg extraction of approximately 65% was achieved using fine particles (sub-20 µm).
(f)
The low solids loading experiments produced a greater extent of Si extraction compared to the experiments with a higher solids loading.
(g)
The dissolution trends for Si also show two distinct steps; an initially rapid rate of extraction of Si, followed by a declining concentration of Si, indicative of the precipitation of Si from the solution.
(h)
It is hypothesised that amorphous silica precipitates at a greater rate in the higher solids loading experiments.
(i)
Silica gel was observed in all the collected samples at the time of collection and amorphous silica precipitation is predicted by the modelling. It is hypothesised that the silica gel transformed during the reaction into amorphous silica, which contributes to the formation of a Si passivating layer.
(j)
The extent of Mg extraction per unit weight of mineral was enhanced by decreasing the solids loading (due to lowered pH and the reduction in the extent of Si re-precipitation), which facilitates the additional leaching of Mg compared with higher solids loading experiments.
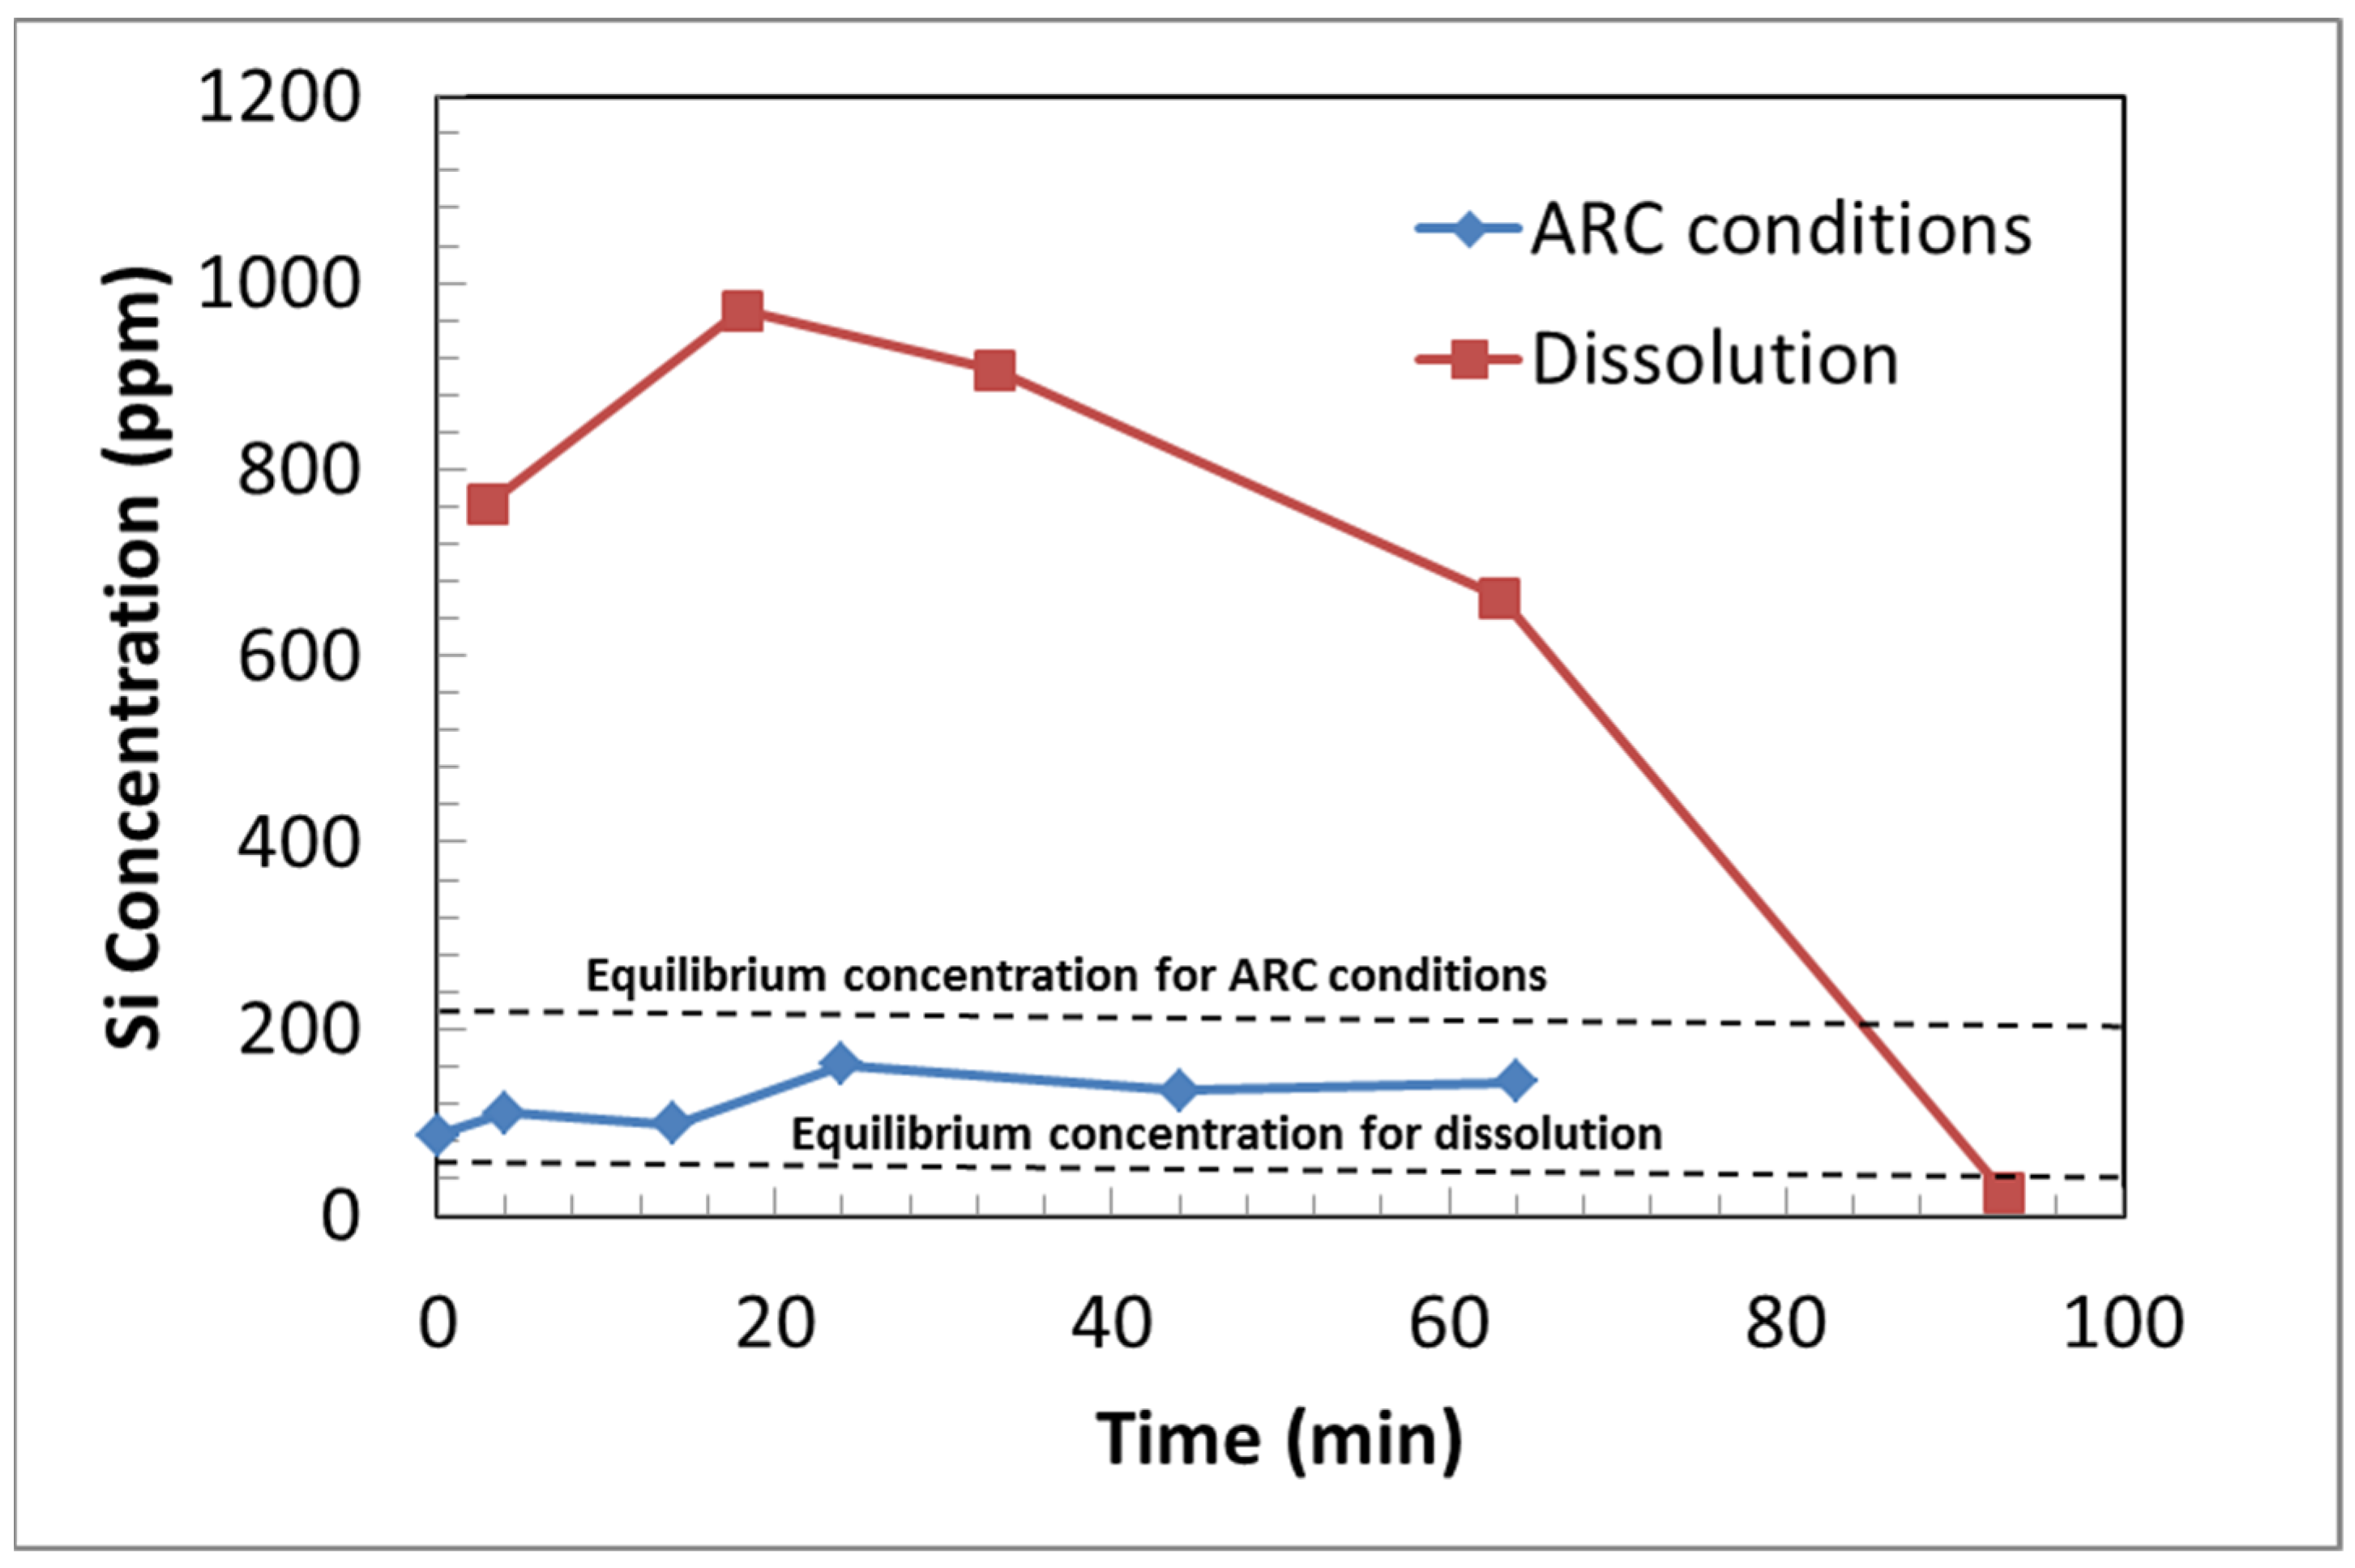
(k)
The Si concentrations are considerably higher in the low-temperature (40 °C) dissolution experiments compared to those under ARC conditions (150 °C, 130 bar). The results indicate the potential formation of Mg silicate phases under ARC conditions, which might explain the discrepancy in reaction extents in the two systems.

4. Conclusions

In this study, dissolution experiments on heat-activated lizardite were conducted at a high partial pressure of CO2 (100 bar) and moderate temperatures (40 °C) without NaHCO3 to isolate the dissolution reactions to better understand the factors limiting the overall yields in the ARC process. The effect of the particle size and liquid-to-solid ratio on the dissolution rate of Mg and Si was investigated. It was found that the dissolution process comprises two distinct dissolution stages, with a rapid initial rate of Mg extraction occurring during the first 20 min of the dissolution process, following which the dissolution rate decreases dramatically. As the particle size decreased, there was a noticeable rise in the percentage of extracted Mg, reaching a peak of 65% when using particle fractions smaller than 20 µm at conditions of 100 bar and 40 °C, all without the presence of NaHCO3.
It can be concluded that the dissolution of all the particle size fractions is initially relatively rapid, due to the low pH from CO2 dissolution and the production of an elevated concentration of protons, which react with the reactive mineral to extract the Mg2+ cations. In the later phases of heat-activated lizardite dissolution, the pH levels begin to rise, and the formation of an amorphous silica precipitate creates a diffusion barrier. This barrier leads to a deceleration in the mineral’s dissolution rate. It is hypothesised that the Si dissolved in the supernatant solution may exceed the solubility limit of amorphous silica, potentially resulting in its precipitation through processes such as polymerisation or gelation.
The Mg extraction in the fine particle (sub-20 µm) experiments was almost the same for the different solids loadings (1, 2, and 5 wt%) due to the high surface area of the fine particles, which leads to high Mg extraction regardless of the solids loading. This indicates that these experiments are not limited by diffusion. For coarse particles, reducing the liquid-to-solid ratio had a positive impact on magnesium (Mg) extraction. This was attributed, in part, to the lower operational pH observed in the experiments with lower liquid-to-solid ratios, aligning with the predictions from the thermodynamic modelling conducted with PHREEQC, which anticipated increased Mg extraction under these conditions. However, the pH effect alone does not fully explain the decrease in the rate and extent of the reaction with the solids concentration. This discrepancy is likely caused by the deposition of amorphous silica, which is supported by the measured Si concentration profiles in solution.
A similar effect of the liquid-to-solid ratio on the Mg dissolution was observed for Si extraction. The dissolution behaviour of Si involved two distinct steps; a rapid rate of extraction of Si from the heat-activated mineral was observed initially, followed by a drop in the concentration of Si, indicative of the precipitation of Si from the solution on the surface of the reacting particles.
It was observed that the Si concentration is higher than the equilibrium concentration and, at the end of the experiment, this declines below the equilibrium concentration. The high Si concentration in the dissolution experiment is indicative of slower Si precipitation compared with the carbonation experiment under ARC conditions, where the rate of Si precipitation is much more rapid. In practice, these ratios vary depending on the specific technology and operational conditions. The lowest liquid-to-solid ratio in an autoclave reactor is 2 kg/kg, but most aqueous carbonation experiments use a higher ratio to boost the conversion efficiency [41]. Theoretically, running an industrial process at a 1:1 liquid-to-solid ratio could improve the overall CO2 sequestration efficiency [37]. The findings observed in our study can inform the design of reactors for mineral carbonation processes. Specifically, controlling particle size and maintaining optimal solid–liquid ratios could enhance the efficiency of CO2 uptake and the formation of stable mineral carbonates.

Author Contributions

Conceptualization, E.M.K. and M.R.R.; methodology, E.M.K. and A.A.F.; software, T.K.O. and A.A.F.; validation, E.M.K., M.R.R., G.F.B., T.K.O. and M.S.; formal analysis, A.A.F.; investigation, E.M.K. and A.A.F.; resources, E.M.K. and M.S.; data curation, A.A.F.; writing—original draft preparation, A.A.F.; writing—review and editing, E.M.K., T.K.O. and A.A.F.; visualization, A.A.F.; supervision, E.M.K. and M.R.R.; project administration, E.M.K.; funding acquisition, E.M.K. All authors have read and agreed to the published version of the manuscript.

Funding

This research was funded by the Australian Government Research Training Program Scholarship. This work was supported through the University of Newcastle and Mineral Carbonation international (MCi).

Data Availability Statement

Data are contained within the article. The raw data supporting the conclusions of this article will be made available by the authors on request.

Conflicts of Interest

The authors declare no conflict of interest.

References

  1. Alexander, G.; Maroto-Valer, M.M.; Gafarova-Aksoy, P. Evaluation of reaction variables in the dissolution of serpentine for mineral carbonation. Fuel 2007, 86, 273–281. [Google Scholar] [CrossRef]
  2. Guyot, F.; Daval, D.; Dupraz, S.; Martinez, I.; Ménez, B.; Sissmann, O. CO2 geological storage: The environmental mineralogy perspective. Comptes Rendus Geosci. 2011, 343, 246–259. [Google Scholar] [CrossRef]
  3. Stockmann, G.J.; Wolff-Boenisch, D.; Gislason, S.R.; Oelkers, E.H. Do carbonate precipitates affect dissolution kinetics? 1: Basaltic glass. Chem. Geol. 2011, 284, 306–316. [Google Scholar] [CrossRef]
  4. Bales, R.C.; Morgan, J.J. Dissolution kinetics of chrysotile at pH 7 to 10. Geochim. Cosmochim. Acta 1985, 49, 2281–2288. [Google Scholar] [CrossRef]
  5. Oelkers, E.H.; Gislason, S.R.; Matter, J. Mineral Carbonation of CO2. GeoScienceWorld Elem. 2008, 4, 333–337. [Google Scholar] [CrossRef]
  6. Huijgen, W.J.J.; Comans, R.N.J. Carbon Dioxide Sequestration by Mineral Carbonation. Literature Review; Energy research Centre of The Netherlands ECN: Petten, The Netherlands, 2003; pp. 1–52. [Google Scholar]
  7. Luce, R.W.; Bartlett, R.W.; Parks, G.A. Dissolution kinetics of magnesium silicates. Geochim. Cosmochim. Acta 1972, 36, 35–50. [Google Scholar] [CrossRef]
  8. Teir, S.; Revitzer, H.; Eloneva, S.; Fogelholm, C.-J.; Zevenhoven, R. Dissolution of natural serpentinite in mineral and organic acids. Int. J. Miner. Process. 2007, 83, 36–46. [Google Scholar] [CrossRef]
  9. Gao, W.; Wen, J.; Li, Z. Dissolution Kinetics of Magnesium from Calcined Serpentine in NH4Cl Solution. Ind. Eng. Chem. Res. 2014, 53, 7947–7955. [Google Scholar] [CrossRef]
  10. Prigiobbea, V.; Hänchen, M.; Werner, M.; Baciocchi, R.; Mazzotti, M. Mineral carbonation process for CO2 sequestration. Energy Procedia 2009, 1, 4885–4890. [Google Scholar] [CrossRef]
  11. Hänchena, M.; Prigiobbe, V.; Storti, G.; Seward, T.M.; Mazzotti, M. Dissolution kinetics of fosteritic olivine at 90–150 °C including effects of the presence of CO2. Geochim. Cosmochim. Acta 2006, 70, 4403–4416. [Google Scholar] [CrossRef]
  12. Rosso, J.J.; Rimstidt, J.D. A high resolution study of forsterite dissolution rates. Geochim. Cosmochim. Acta 2000, 64, 797–811. [Google Scholar] [CrossRef]
  13. Oelkers, E.H. An experimental study of forsterite dissolution rates as a function of temperature and aqueous Mg and Si concentrations. Chem. Geol. 2001, 175, 485–494. [Google Scholar] [CrossRef]
  14. Awad, A.; Groos, A.F.K.V.; Guggenheim, S. Forsteritic olivine: Effect of crystallographic direction on dissolution kinetics. Geochim. Cosmochim. Acta 2000, 64, 1765–1772. [Google Scholar] [CrossRef]
  15. Daval, D.; Hellmann, R.; Martinez, I.; Gangloff, S.; Guyot, F. Lizardite serpentine dissolution kinetics as a function of pH and temperature, including effects of elevated pCO2. Chem. Geol. 2013, 351, 245–256. [Google Scholar] [CrossRef]
  16. Lin, F.-C.; Clemency, C.V. The dissolution kinetics of brucite, antigorite, talc, and phlogopite at room temperature and pressure. Am. Mineral. 1981, 66, 801–806. [Google Scholar]
  17. Giammar, D.E.; Bruant, R.G., Jr.; Peters, C.A. Forsterite dissolution and magnesite precipitation at conditions relevant for deep saline aquifer storage and sequestration of carbon dioxide. Chem. Geol. 2005, 217, 257–276. [Google Scholar] [CrossRef]
  18. Chen, Y.; Brantley, S.L. Dissolution of forsteritic olivine at 65 °C and 2 < pH < 5. Chem. Geol. 2000, 165, 267–281. [Google Scholar]
  19. Guthrie, G.D.; Carey, J.W.; Bergfeld, D.; Byler, D.; Chipera, S.; Ziock, H.-J.; Lackner, K. Geochemical aspects of the carbonation of magnesium silicates in an aqueous medium. In Proceedings of the Conference: Workshop on Carbon Sequestration Science, Morgantown, WV, USA, 22–24 May 2001; pp. 1–14. [Google Scholar]
  20. Pasquier, L.-C.; Mercier, G.; Blais, J.-F.; Cecchi, E.; Kentish, S. Reaction Mechanism for the Aqueous-Phase Mineral Carbonation of Heat-Activated Serpentine at Low Temperatures and Pressures in Flue Gas Conditions. Environ. Sci. Technol. 2014, 48, 5163–5170. [Google Scholar] [CrossRef] [PubMed]
  21. Werner, M.; Hariharana, S.; Mazzotti, M. Flue gas CO2 mineralization using thermally activated serpentine: From single- to double-step carbonation. Phys. Chem. Chem. Phys. 2014, 16, 24978–24993. [Google Scholar] [CrossRef]
  22. Julcour, C.; Bourgeois, F.; Bonfils, B.; Benhamed, I.; Guyot, F.; Bodénan, F.; Petiot, C.; Gaucher, É.C. Development of an attrition-leaching hybrid process for direct aqueous mineral carbonation. Chem. Eng. J. 2015, 262, 716–726. [Google Scholar] [CrossRef]
  23. Daval, D.; Sissmann, O.; Menguy, N.; Saldi, G.D.; Guyot, F.; Martinez, I.; Corvisier, J.; Garcia, B.; Machouk, I.; Knauss, K.; et al. Influence of amorphous silica layer formation on the dissolution rate of olivine at 90 °C and elevated pCO2. Chem. Geol. 2011, 284, 193–209. [Google Scholar] [CrossRef]
  24. Vieira, K.R.M.; Arce, G.L.; Luna, C.M.; Facio, V.O.; Carvalho, A.J.; Neto, T.G.S.; Ávila, I. Understanding the acid dissolution of Serpentinites (Tailings and waste rock) for use in indirect mineral carbonation. S. Afr. J. Chem. Eng. 2022, 40, 154–164. [Google Scholar] [CrossRef]
  25. Galina, N.R.; Arce, G.L.A.F.; Maroto-Valer, M.; Ávila, I. Experimental Study on Mineral Dissolution and Carbonation Efficiency Applied to pH-Swing Mineral Carbonation for Improved CO2 Sequestration. Energies 2023, 16, 2449. [Google Scholar] [CrossRef]
  26. Li, J.; Hitch, M. Mechanical activation of ultramafic mine waste rock in dry condition for enhanced mineral carbonation. Miner. Eng. 2016, 95, 1–4. [Google Scholar] [CrossRef]
  27. Li, J.; Hitch, M. Ultra-fine grinding and mechanical activation of mine waste rock using a planetary mill for mineral carbonation. Int. J. Miner. Process. 2017, 158, 18–26. [Google Scholar] [CrossRef]
  28. Ke, X.; Baki, V.A.; Skevi, L. Mechanochemical activation for improving the direct mineral carbonation efficiency and capacity of a timber biomass ash. J. CO2 Util. 2023, 68, 102367. [Google Scholar] [CrossRef]
  29. Dufourny, A.; Julcour, C.; Esvan, J.; Cassayre, L.; Laniesse, P.; Bourgeois, F. Observation of the depassivation effect of attrition on magnesium silicates’ direct aqueous carbonation products. Front. Clim. 2022, 4, 946735. [Google Scholar] [CrossRef]
  30. PHREEQC. Thermodynamic Software; Appelo, P.A., Ed.; United States Geological Survey (USGS): Washington, DC, USA, 1999. [Google Scholar]
  31. Abu Fara, A. Experimental and Modelling Studies on Direct Aqueous Carbonation of Thermally Activated Lizardite. Ph.D. Thesis, The University of Newcastle, Newcastle, Australia, 2019. [Google Scholar]
  32. Farhang, F.; Oliver, T.K.; Rayson, M.; Brent, G.; Stockenhuber, M.; Kennedy, E. Experimental study on the precipitation of magnesite from thermally activated serpentine for CO2 sequestration. Chem. Eng. J. 2016, 303, 439–449. [Google Scholar] [CrossRef]
  33. Farhang, F.; Rayson, M.; Brent, G.; Hodgins, T.; Stockenhuber, M.; Kennedy, E. Insights into the dissolution kinetics of thermally activated serpentine for CO2 sequestration. Chem. Eng. J. 2017, 330, 1174–1186. [Google Scholar] [CrossRef]
  34. Abu Fara, A.; Rayson, M.R.; Brent, G.F.; Oliver, T.K.; Stockenhuber, M.; Kennedy, E.M. Formation of magnesite and hydromagnesite from direct aqueous carbonation of thermally activated lizardite. Environ. Prog. Sustain. Energy 2019, 38, e13244. [Google Scholar] [CrossRef]
  35. Mann, J. Serpentine Activation for CO2 Sequestration. Ph.D. Thesis, The University of Sydney, Sydney, Australia, 2014. [Google Scholar]
  36. Dri, M.; Sanna, A.; Maroto-Valer, M.M. Mineral carbonation from metal wastes: Effect of solid to liquid ratio on the efficiency and characterization of carbonated products. Appl. Energy 2014, 113, 515–523. [Google Scholar] [CrossRef]
  37. Huijgen, W.J.J.; Comans, R.N.J.; Witkamp, G.-J. Cost evaluation of CO2 sequestration by aqueous mineral carbonation. Energy Convers. Manag. 2007, 48, 1923–1935. [Google Scholar] [CrossRef]
  38. Huijgen, W.J.J.; Witkamp, G.-J.; Comans, R.N.J. Mechanisms of aqueous wollastonite carbonation as a possible CO2 sequestration process. Chem. Eng. Sci. 2006, 61, 4242–4251. [Google Scholar] [CrossRef]
  39. Hariharan, S.; Werner, M.; Hänchen, M.; Mazzotti, M. Dissolution of dehydroxylated lizardite at flue gas conditions: II. Kinetic modeling. Chem. Eng. J. 2014, 241, 314–326. [Google Scholar] [CrossRef]
  40. Hariharan, S.; Repmann-Werner, M.; Mazzotti, M. Dissolution of dehydroxylated lizardite at flue gas conditions: III. Near-equilibrium kinetics. Chem. Eng. J. 2016, 298, 44–54. [Google Scholar] [CrossRef]
  41. Wang, X.; Maroto-Valer, M. Integration of CO2 capture and storage based on pH-swing mineral carbonation using recyclable ammonium salts. Energy Procedia 2011, 4, 4930–4936. [Google Scholar] [CrossRef]
Figure 1. Particle size distribution for raw lizardite for three different particle size bins after implementation of cleaning protocol.
Minerals 14 00831 g001
Figure 2. Typical diffractogram of a raw lizardite for three different size fractions (where Cl: chlinochlore, L: lizardite, and Mt: magnetite).
Minerals 14 00831 g002
Figure 3. Typical diffractogram of heat-activated lizardite for three different particle size fractions (where Cl: clinochlore, L: lizardite, F: forsterite, H: hematite, and Mt: magnetite).
Minerals 14 00831 g003
Figure 4. (a) The amount of Mg dissolved in supernatant. (b) Percentage of Mg (net Mg extracted/total Mg in the solid) dissolved in supernatant for different solids loadings with 45–75 µm particle size fraction. (c) The amount of Mg dissolved in supernatant. (d) The percentage of Mg (net Mg extracted/total Mg in the solid) dissolved in supernatant for different solids loadings with 20–45 µm particle size fraction. (e) The amount of Mg dissolved in supernatant. (f) Percentage of Mg (net Mg extracted/total Mg in the solid) dissolved in supernatant for different solids loadings with sub-20 µm particle size fraction.
Minerals 14 00831 g004
Figure 5. (a) The amount of Si dissolved in supernatant. (b) Percentage of Si dissolved (net Si extracted/total Si in the solid) in supernatant for different solids loadings with 45–75 µm particle size fraction. (c) The amount of Si dissolved in supernatant. (d) Percentage of Si (net Si extracted/total Si in the solid) dissolved in supernatant for different solids loadings with 20–45 µm particle size fraction. (e) The amount of Si dissolved in supernatant. (f) Percentage of Si (net Si extracted/total Si in the solid) dissolved in supernatant for different solids loadings with sub-20 µm particle size fraction (precipitation occurs after 20 min).
Minerals 14 00831 g005
Figure 6. Mg/Si ratio in supernatant for 5 wt% solids loading with (a) 45–75 µm and (b) 20–45 µm particle size fractions.
Minerals 14 00831 g006
Figure 7. The concentration of Si dissolved in supernatant for the experiments conducted under ARC conditions and dissolution experiments for the sub-20 µm fraction at 5 wt% slurry (amorphous silica is the equilibrium concentration).
Minerals 14 00831 g007
Figure 8. (a) The amount of Mg dissolved in supernatant. (b) Percentage of Mg (net Mg extracted/total Mg in the solid) dissolved in supernatant for 5 wt% solids loading with different particle size fractions. (c) The amount of Mg dissolved in supernatant. (d) Percentage of Mg (net Mg extracted/total Mg in the solid) dissolved in supernatant for 2 wt% solids with different particle size fractions. (e) The amount of Mg dissolved in supernatant. (f) Percentage of Mg (net Mg extracted/total Mg in the solid) dissolved in supernatant for 1 wt% solids loading with different particle size fractions.
Minerals 14 00831 g008
Figure 9. (a) The amount of Si dissolved in supernatant. (b) Percentage of Si (net Si extracted/total Si in the solid) dissolved in supernatant for 5 wt% solids loading with different particle size fractions (amorphous silica is the equilibrium concentration). (c) The amount of Si dissolved in supernatant. (d) Percentage of Si (net Si extracted/total Si in the solid) dissolved in supernatant for 2 wt% solids loading with different particle size fractions (amorphous silica is the equilibrium concentration). (e) The amount of Si dissolved in supernatant. (f) Percentage of Si (net Si extracted/total Si in the solid) dissolved in supernatant for 1 wt% solids loading with different particle size fractions (amorphous silica is the equilibrium concentration).
Minerals 14 00831 g009
Table 1. Measured particle diameters of each particle size distribution for raw lizardite for three different sieve bins.
Sieve Bin (of Raw Lizardite), µmd10 (µm)d50 (µm)d90 (µm)
45–7547.273.2112
20–4527.543.066.8
Sub-202.18.219.2
Table 2. Composition of crystalline and amorphous phases for heat-activated lizardite at different particle size fractions.
Crystalline Phases % Amorphous Phase %
Particle Size (µm)ClinochloreLizarditeForsteriteMagnetiteHematiteTotal
Crystalline %
45–753.687.1914.10.260.6025.874.2
20–458.135.8412.80.330.5927.772.3
<206.810.948.680.240.5817.382.8
Disclaimer/Publisher’s Note: The statements, opinions and data contained in all publications are solely those of the individual author(s) and contributor(s) and not of MDPI and/or the editor(s). MDPI and/or the editor(s) disclaim responsibility for any injury to people or property resulting from any ideas, methods, instructions or products referred to in the content.

