Article

Hydrothermal Retrogradation from Chlorite to Tosudite: Effect on the Optical Properties

1
Department of Soil Science, Gorgan University of Agricultural Sciences and Natural Resources (GAU), Shahid Beheshti St., Gorgan 49138 15739, Iran
2
Departamento de Mineralogía y Petrología and IACT, Universidad de Granada, Avda, Fuentenueva s/n, 18002 Granada, Spain
3
Fateh Mine and Mining Industries Development Company, Tehran No. 102, Aftab Avenue, Khoddami Street, Vanak Square, Tehran 15179 43413, Iran
4
Department of Mining Exploration and Processing, Amirkabir University of Technology (AUT), Hafez St., Valiasr Square, Tehran 15875 4413, Iran
5
Department of Geology, Faculty of Sciences, Golestan University, Shahid Beheshti Street, Gorgan 15759 49138, Iran
*
Authors to whom correspondence should be addressed.
Minerals 2025, 15(3), 326; https://doi.org/10.3390/min15030326
Submission received: 7 February 2025 / Revised: 14 March 2025 / Accepted: 17 March 2025 / Published: 20 March 2025

Abstract

:
In the argillic alteration zone of the SinAbad area of the Urumieh–Dokhtar magmatic belt (Iran), Mg-rich, Fe-poor chlorites, which crystallised at temperatures between 160 °C and 260 °C, were affected by extensive alteration to smectite mixed-layering at the micro- and nano-scales during the retrograde evolution of the hydrothermal system. Chlorites retain their usual optical aspect and properties, except for the index of refraction perpendicular to the (001) layers, which becomes lower than those parallel to the layers, producing an increase in birefringence and change in the optic and elongation signs, in comparison to the ordinary ones for Mg chlorites. Scanning electron microscopy (SEM) maps and compositions, and electron microprobe (EMP) analyses indicate minor but ubiquitous Ca (and K) content. X-ray diffraction (XRD) of chloritic concentrates allowed the identification of chlorite and tosudite. High-resolution transmission electron microscopy (HRTEM) images show major 14 Å (chlorite), with the frequent presence of 24 Å (contracted tosudite) individual layers and small packets up to five layers thick. Lateral change from 14 Å to 24 Å individual layers has been visualised. High-resolution chemical maps obtained in high-angle annular dark-field (HAADF) mode confirm the existence of areas preferentially dominated by chlorite or tosudite. The overall chemical compositions obtained by SEM, EMP, and transmission electron microscopy (TEM) align from the chlorite to the tosudite end-members, whose pure compositions could be determined from extreme analytical electron microscopy (AEM) analyses. The described intergrowths and interlayers, under the optical resolution, could provide a clue to explain changes in the normal optic properties of chlorite, which are mentioned, but not explained, in the literature.

1. Introduction

The first approach for petrographic studies is optical microscopy. Therefore, a correct knowledge of the optical properties is essential to recognise mineral components. Chlorite is a major secondary mineral commonly found in low-grade metamorphic or hydrothermally altered felsic to ultramafic rocks. This ubiquitous phyllosilicate, characterised by a 14 Å c cell parameter, occurs in a wide range of geological environments and forms under conditions ranging from diagenesis to blueschist- and amphibolite-facies metamorphism.
The optical properties of chlorites are well-established and have been known for many years. Albee [1] proposed a graphic relating the refractive indices, birefringence, optic sign, and elongation sign with the Fe/Fe + Mg ratio: chlorites change the optic and elongation signs near Fe/Fe + Mg = 0.5. The basic optical books [2,3] refer to this graphic, which is widely accepted. Even so, according to Nesse [2] (p. 258), “there are, however, numerous exceptions”, which implies different optical properties than those predicted in the Albee’s graph.
Chatterjee [4] justified the highly anomalous optical properties of chlorites by the oxidation of Fe2+ to Fe3+. Nevertheless, Masci et al. [5] showed oxychlorite (with Fe3+ up to ~2.8 atoms per formula unit) with normal optical properties, hence the oxidation state of Fe seems not to be critical. Mellini et al. [6] found similar changes in the optical properties of chlorites as Chatterjee [4], that is, chlorite resembling biotite, and showed by TEM that they were due to the interlayer and intermixing of other phyllosilicates at the nano-scale.
Chlorite/smectite (C/S) and/or chlorite/vermiculite mixed layers are frequently described in the literature. Shau et al. [7] investigated chloritic minerals in very-low-grade metamorphic mafic rocks using TEM, revealing “expandable chlorite” with abnormal optical properties and composition. The chloritic areas could be mainly described as an intergrowth of chlorite and corrensite, with corrensite having its own structural and compositional characteristics as a unique phase, rather than a mixed-layer. Altered chloritic areas are generally described in the TEM literature [7,8] as intergrowths of discrete chlorite and C/S crystals, interstratification of packets of layers, complex mixed layering, and terminations of single smectite layers by chlorite layers. Tosudite, a regularly interstratified chlorite–smectite mineral, represents an important transformation product under hydrothermal conditions. It has been found mainly in felsic to intermediate volcanic and pyroclastic rocks [9,10,11] and granites [12,13,14]; in clastic sedimentary rocks, it is less common [15,16,17]. Moreover, ocurrences of tosudite have been reported in serpentinites [18] and very low-grade metamorphic graywackes [19]. Tosudite was defined by a 1:1 stacking sequence of dioctahedral chlorite and smectite [20], with some occurrences including di-trioctahedral chlorite [16,17]; chemically it is enriched in Si, Al, and Mg, while Fe3+ remains low, indicating its formation in reducing environments [21]. Through microprobe analysis, Billon et al. [16] identified tosudite’s composition in arkosic sandstones in Niger as a combination of di-trioctahedral chlorite and low-charge montmorillonite. Due to their small grain size, these minerals are not optically recognisable, resulting in largely unknown optical properties.
Abd Elmola et al. [17] found that tosudite, with a rosette-like morphology, formed in Tim Mersoï Basin (Niger) via Mg-rich hydrothermal fluid, from the Arlit Fault, which altered aluminosilicate components in sandstone. Thermobarometric studies suggested a stability range between 100 and 260 °C. In this deposit, tosudite, which has a cation exchange capacity of ~50 meq/100 g, served as a major sorption medium, significantly affecting fluid chemistry and uranium mobility [21].
During the systematic study of the argillic alteration in the SinAbad area, located in the southern part of the Kerman magmatic copper belt (KMCB) within the Urumieh–Dokhtar belt, Iran (Ahmadi et al., in prep.), chlorites and C/S mixed-layers of exceptional size were found; they show the same optical properties as Mg-rich chlorites, but anomalous optic and elongation signs were determined.
This study aims to characterise and describe, up to the nano-scale, the texture, optical properties, mineralogy, chemistry, and origin of the chlorite/smectite mixed layer to infer how even minor mixed-layering at the lattice scale may drastically change the optical properties of chlorites, explaining previous cases cited, but not justified, in the literature [2].

2. Sampling and Geological Setting

C/S was found in all the samples studied by XRD (X-ray diffraction) in the SinAbad area (see after). The SinAbad area is located in the southern part of the KMCB, in the Urumieh–Dokhtar belt Rock (Figure 1). The exposures of the SinAbad area are volcanic and volcanoclastic rocks in origin. An andesitic eruption in the Lower Eocene started volcanic activity in the area. Then, a complex of volcanoclastic units with lithic and vitric tuff compositions was produced during this activity. The youngest magmatic activity belongs to the post-Eocene and probably the Oligo-Miocene. The intrusion of a granitic pluton, which is extended from northwest to southeast for 1.5 by 3 km2, accompanied this. The granites are mostly formed by K-feldspar, plagioclase, quartz, biotite, and hornblende, with a granular to porphyry texture. A vast argillic alteration affected the granitic pluton and surrounding hosts, and the expansion of silica ledges has been recognised in the altered area. This granitic pluton, because of argillic and silica alterations, was a target for porphyry copper exploration. After IP-Rs and magnetometry surveying, two drill holes were drilled, but no copper mineralisation was detected.
To investigate the argillic alteration in SinAbad and compare it with recognised porphyry copper deposits, the sampling was performed in two modes: deep (samples from drilling cores) and surface sampling. Surface samples were collected at approximately 300 m intervals along two profiles. In total, nine surface samples and four drilling samples were collected from the SinAbad area. Sample SIN02-01 was finally selected for a more in-depth mineralogical study because of the exceptional grain size of the C/S, which showed similar optical properties to chlorites.

3. Materials and Methods

3.1. Optics. Separation

Polished thin sections of the porphyry rocks were prepared and analysed in a Zeiss Jenapol U petrographic photo-microscope (Jena, Germany). Chloritic aggregates were manually separated from the rocks, magnetically enriched, and finally hand-picked under a binocular microscope for the determination of some optical properties and for obtaining an enriched fraction for X-ray diffraction (see below). Refractive indices were determined in white light using Cargille immersion liquids controlled with a Leitz-Jelley micro-refractometer (Wetzlar, Germany) after the measurements. The γ–α birefringence was measured using a Leitz Berek compensator (Wetzlar, Germany).

3.2. X-Ray Diffraction (XRD)

The porphyry rock was washed, and after coarse crushing, homogeneous chips of the rocks were analysed by X-ray diffraction (XRD). Whole fractions were prepared as disoriented powders after milling in an agate mortar. The <2 µm fraction was extracted by repeated centrifugation and extraction of the supernatant liquid, according to Stokes’s law. Oriented aggregates were prepared by sedimentation on round glass slides. A PANalytical X’Pert Pro diffractometer (MalvernPanalytical, Malvern, UK) was employed to study whole and clay fractions, together with chloritic separates, using Cu Kα radiation, 45 kV, and 40 mA. The diffractometer is equipped with an X’Celerator solid-state linear detector, which produced an overall counting time of 10 s/step, with step increments of 0.008° 2θ. To check the presence of C/S, the sample was solvated with ethylene glycol (EG) for 24 h at 60 °C and heated to 350 °C for one hour [28]. The low-angle region was explored on separates deposited onto a low-background Si holder, with 1/32 and 1/16 divergence- and anti-scatter slits, respectively, and a 200 s/step counting time.

3.3. Scanning Electron Microscopy (SEM)

Carbon-coated polished thin sections were examined by scanning electron microscopy (SEM) with energy-dispersive X-ray spectroscopy (EDS). Observations using backscattered electron (BSE) imaging were carried out with a Supra40VP SEM (Zeiss, Oberkochen, Germany) with an accelerating voltage of 20 kV, in the Centro de Instrumentación Científica (CIC) (Universidad de Granada, Spain). This technique obtained (1) textural data by BSE imaging in the atomic number contrast mode, and (2) quantitative chemical analysis and maps by EDS data (X-Max 50 mm detector). Both natural and synthetic standards were employed: albite (Na), periclase (Mg), wollastonite (Si and Ca), orthoclase (K), and synthetic Al2O3, Fe2O3, and pure Ti and Mn, and ZAF correction was applied.

3.4. Electron Microprobe (EPM)

Carbon-coated polished thin section of the sample was used to obtain the composition of the major elements and accurate spot analyses of the C/S and chlorite areas in the electron microprobe (EPM).
Data were obtained by wavelength-dispersive spectroscopy (WDX) on a Cameca SX100 (Paris, France) at the CIC. For obtaining the spot analyses, the instrument was set at an accelerating voltage of 15 keV, with a beam current of 15 nA and an electron beam diameter < 5 μm. Data were reduced and corrected using the PAP method [29], and the standards were albite, sanidine, periclase, diopside, rutile, and synthetic oxides (Al2O3, Fe2O3, and MnTiO3).

3.5. Transmission Electron Microscopy (TEM)

Samples were prepared as ion-milled specimens for their study by high-resolution transmission electron microscopy (HRTEM); copper rings were attached to selected areas of thin sections prepared with Canada balsam. After being detached through gentle heating, these areas were ion-thinned using a Fischione-1050 ion mill (Export, PA, USA) and carbon-coated. Low-magnification and high-resolution images and selected area electron diffraction (SAED) patterns were obtained at the CIC with a Thermo Fisher Talos electron microscope (Eindhoven, Nederland) at 200 kV, equipped with the Super-X system (Eindhoven, Nederland) (four energy dispersion X-ray EDX detectors). X-ray elemental maps were acquired by scanning transmission electron microscopy (STEM) using high-angle annular dark field (HAADF). For quantitative micro-analyses, the EDX data were corrected using the thin-film method [30]. The K-factors for the transformation of the intensity ratios to the concentration were determined using muscovite, albite, biotite, spessartine, olivine, and titanite standards.

4. Results

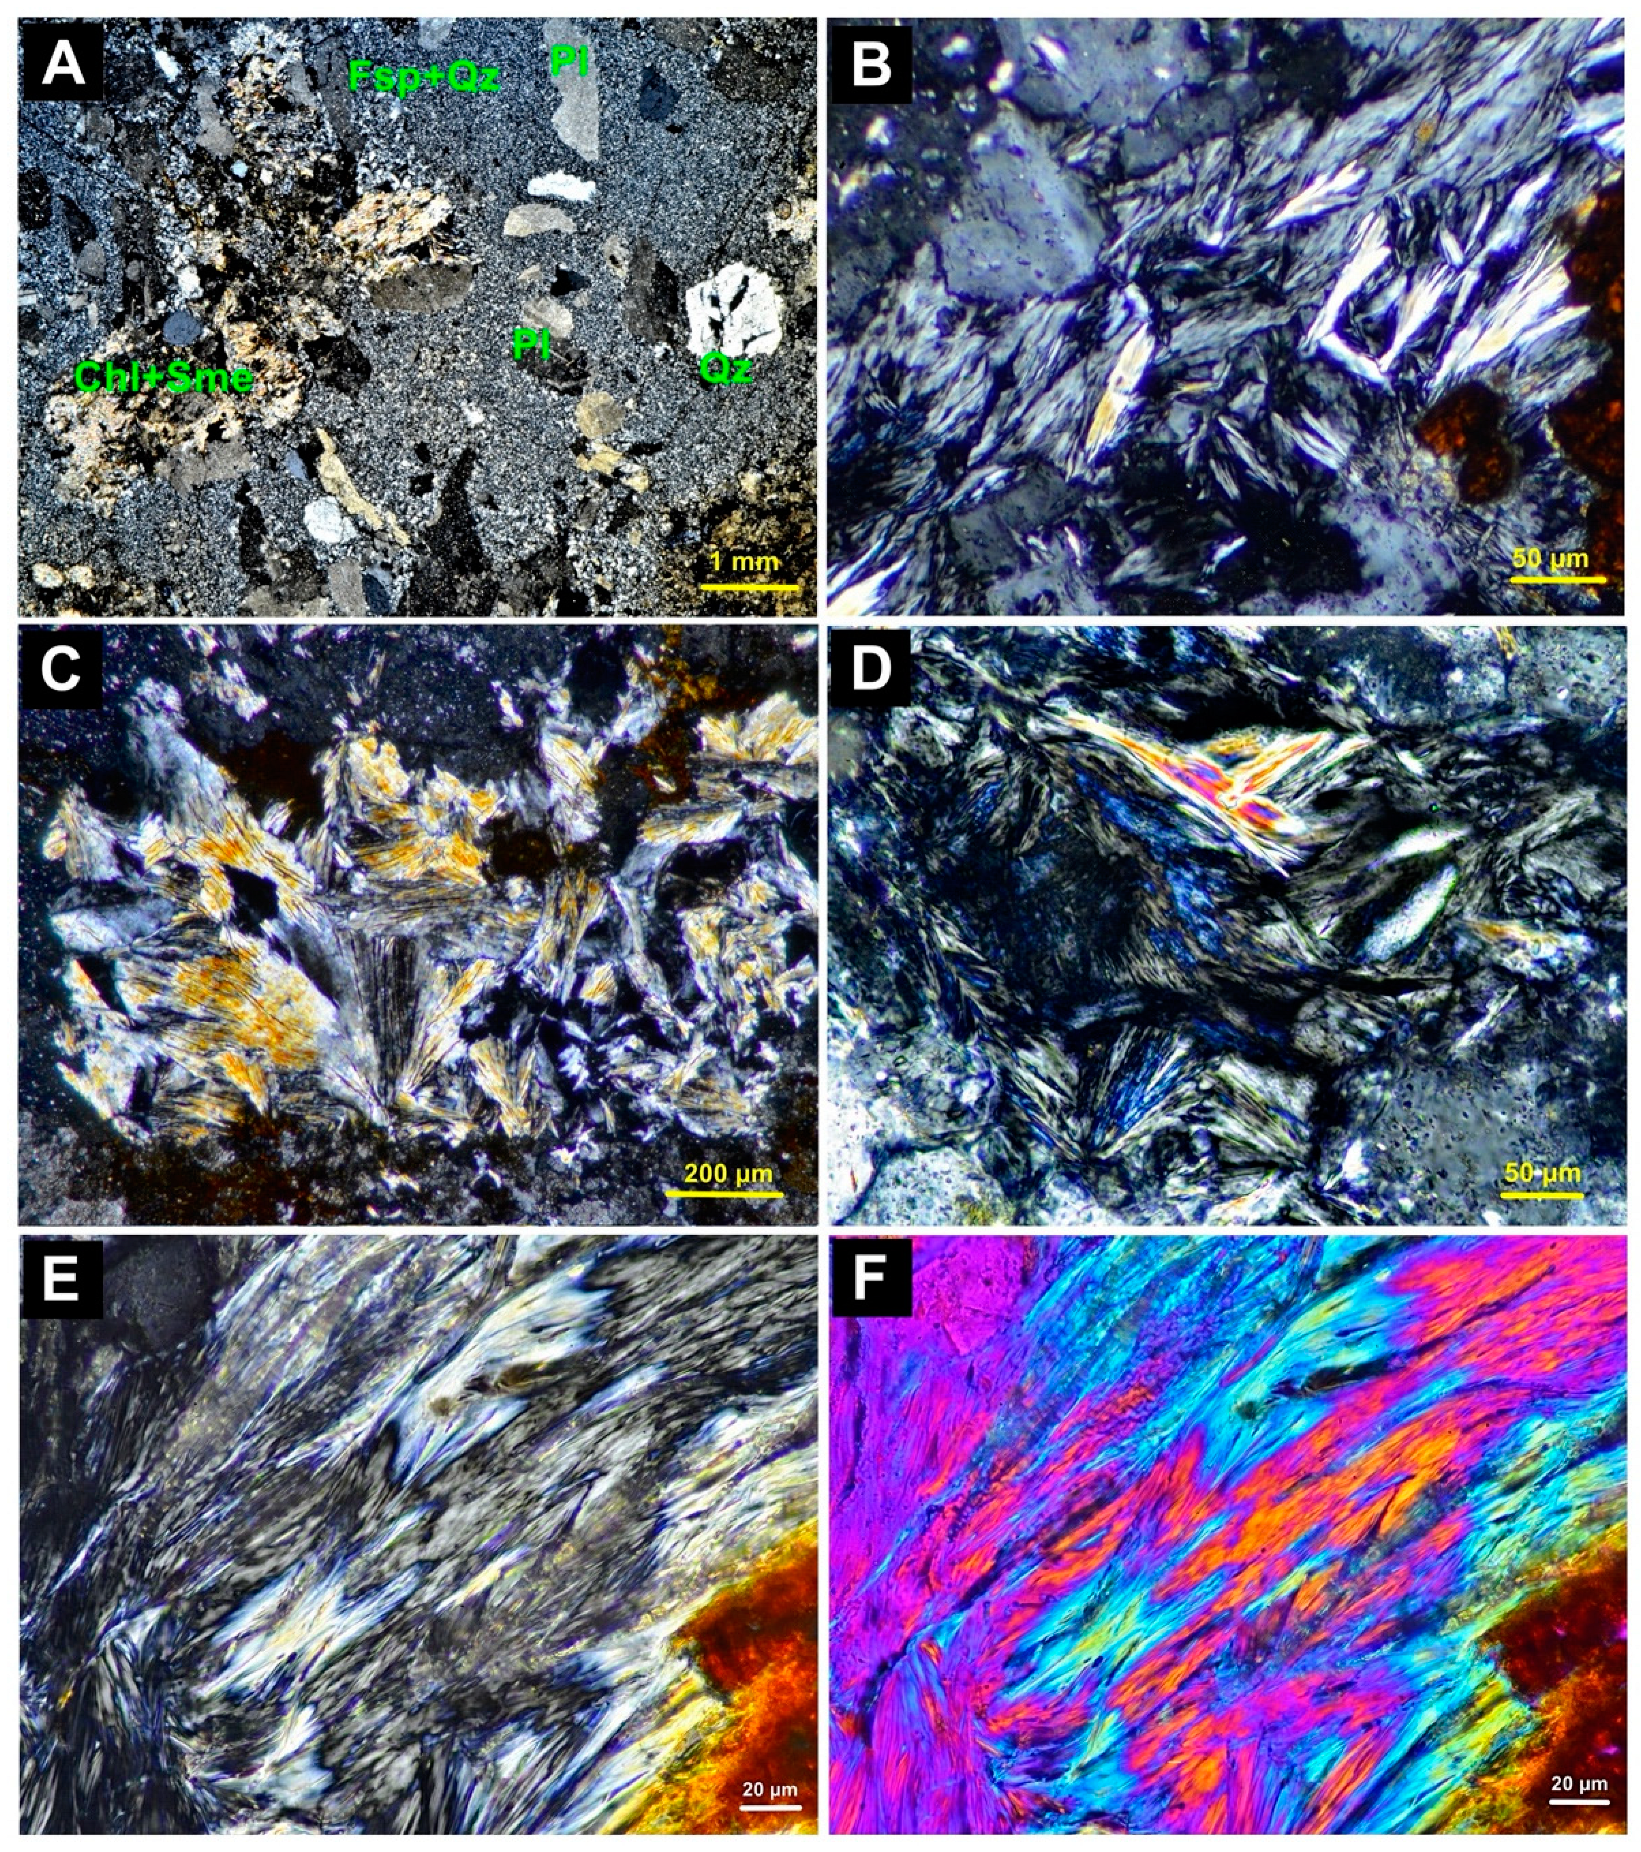
4.1. Optical Microscopy

The SinAbad rocks are andesitic–dacitic volcanic rocks in origin, but they are affected by pervasive argillic alteration. Hand samples selected for this study are whitish, variably stained with iron oxides, and show a greenish-greyish mottled appearance corresponding to irregular chloritic aggregates up to 5 mm in size. In thin sections, the dacitic rocks present a porphyric texture (Figure 2A) with phenocrystals of plagioclase (up to 3 mm) and quartz (up to 1 mm), and chloritic aggregates in a fine-grained felsic groundmass (10–40 µm) consisting of quartz and feldspars. Chlorite aggregates pseudomorphic of the precursor minerals, possibly biotite, can be recognised completely transformed to chlorite and C/S (Figure 2C). Small (<50 µm) sub-euhedral rutile crystals are commonly associated with these aggregates. Accessory minute crystals of zircón are dispersed in the rocks, whereas muscovite, calcite, and epidote appear as minor alteration components.
The petrographic images (Figure 2) reveal large chlorite and C/S mixed-layer grains, which display distinct optical characteristics compared to typical chlorite. The intergrowth of plagioclase (Pl), quartz (Qz), and epidote with chlorite–smectite, along with sericite, highlights the complex mineralogical relationships and significant alteration processes. Polysynthetic twinning in plagioclase and sericitised plagioclase were observed (Figure 2A). The distinct foliated texture and large grain size of the chlorite–smectite are evident (Figure 2B–F).
The chloritic areas predominantly show the characteristic optical properties (Table 1) of Mg-rich chlorites [1]. Nevertheless, in some areas, those properties progressively change (from Figure 2B–D) to higher interference colours (up to the beginning of the second order) and interestingly change their elongation sign from negative to positive (Figure 2E,F). This change systematically coincides with the reversal change in the optic sign (Table 1).
Figure 2. Optical microscopic images (crossed polars): (A) characteristic texture of the SinAbad rocks: dacite deeply transformed by the argillic alteration. (BD) Typical optical aspect of the chloritic areas, with a predominantly grey interference colour, but with some areas showing higher birefringence (up to the beginning of the second order interference colour). (E,F) Chloritic areas without (E) and with intercalation of the ∆550 nm plate (F) to show the change in elongation sign from negative to positive in the higher birefringence zones. Pl: plagioclase, Qz: quartz, Fsp: feldspars, Chl-Sme: chlorite + chlorite-smectite mixed-layers.
Minerals 15 00326 g002

4.2. X-Ray Diffraction (XRD)

The whole powder diagram (Figure 3A) of the SinAbad samples indicates the major presence of plagioclase and quartz, with minor peaks of mica and a 14.5 Å periodicity phase, which could be coherent with chlorite, but it is composed of irregular, wide peaks and present a (001) peak significantly higher than the (002) peak. The oriented aggregates of the minor than 2 µm fraction (Figure 3B) allow the measurement of a 14.28 Å peak, which slightly changes after EG treatment to 13.96 Å and contracts to 12.22 Å after heating to 350 °C. The 9.99 Å peak of the mica remains unchanged. The behaviour of the 14 Å–7 Å peaks is clearly better solved in the hand-picked fraction (Figure 3C), in which the initial 14.34 Å and 7.08 Å peaks are separated, after EG treatment, in two different phases, showing coherent (00l) orders, one corresponding to 15.11 Å, and the second one to 14.16 Å. The phase at 14.16 Å is compatible with Mg-rich chlorite and that at 15.11 Å, after EG treatment, indicates an interstratification containing smectitic layers. Low-angle measurements on low-background holders allowed the identification of the super-order peak of the mixed-layers at 30 Å (Figure 3C).

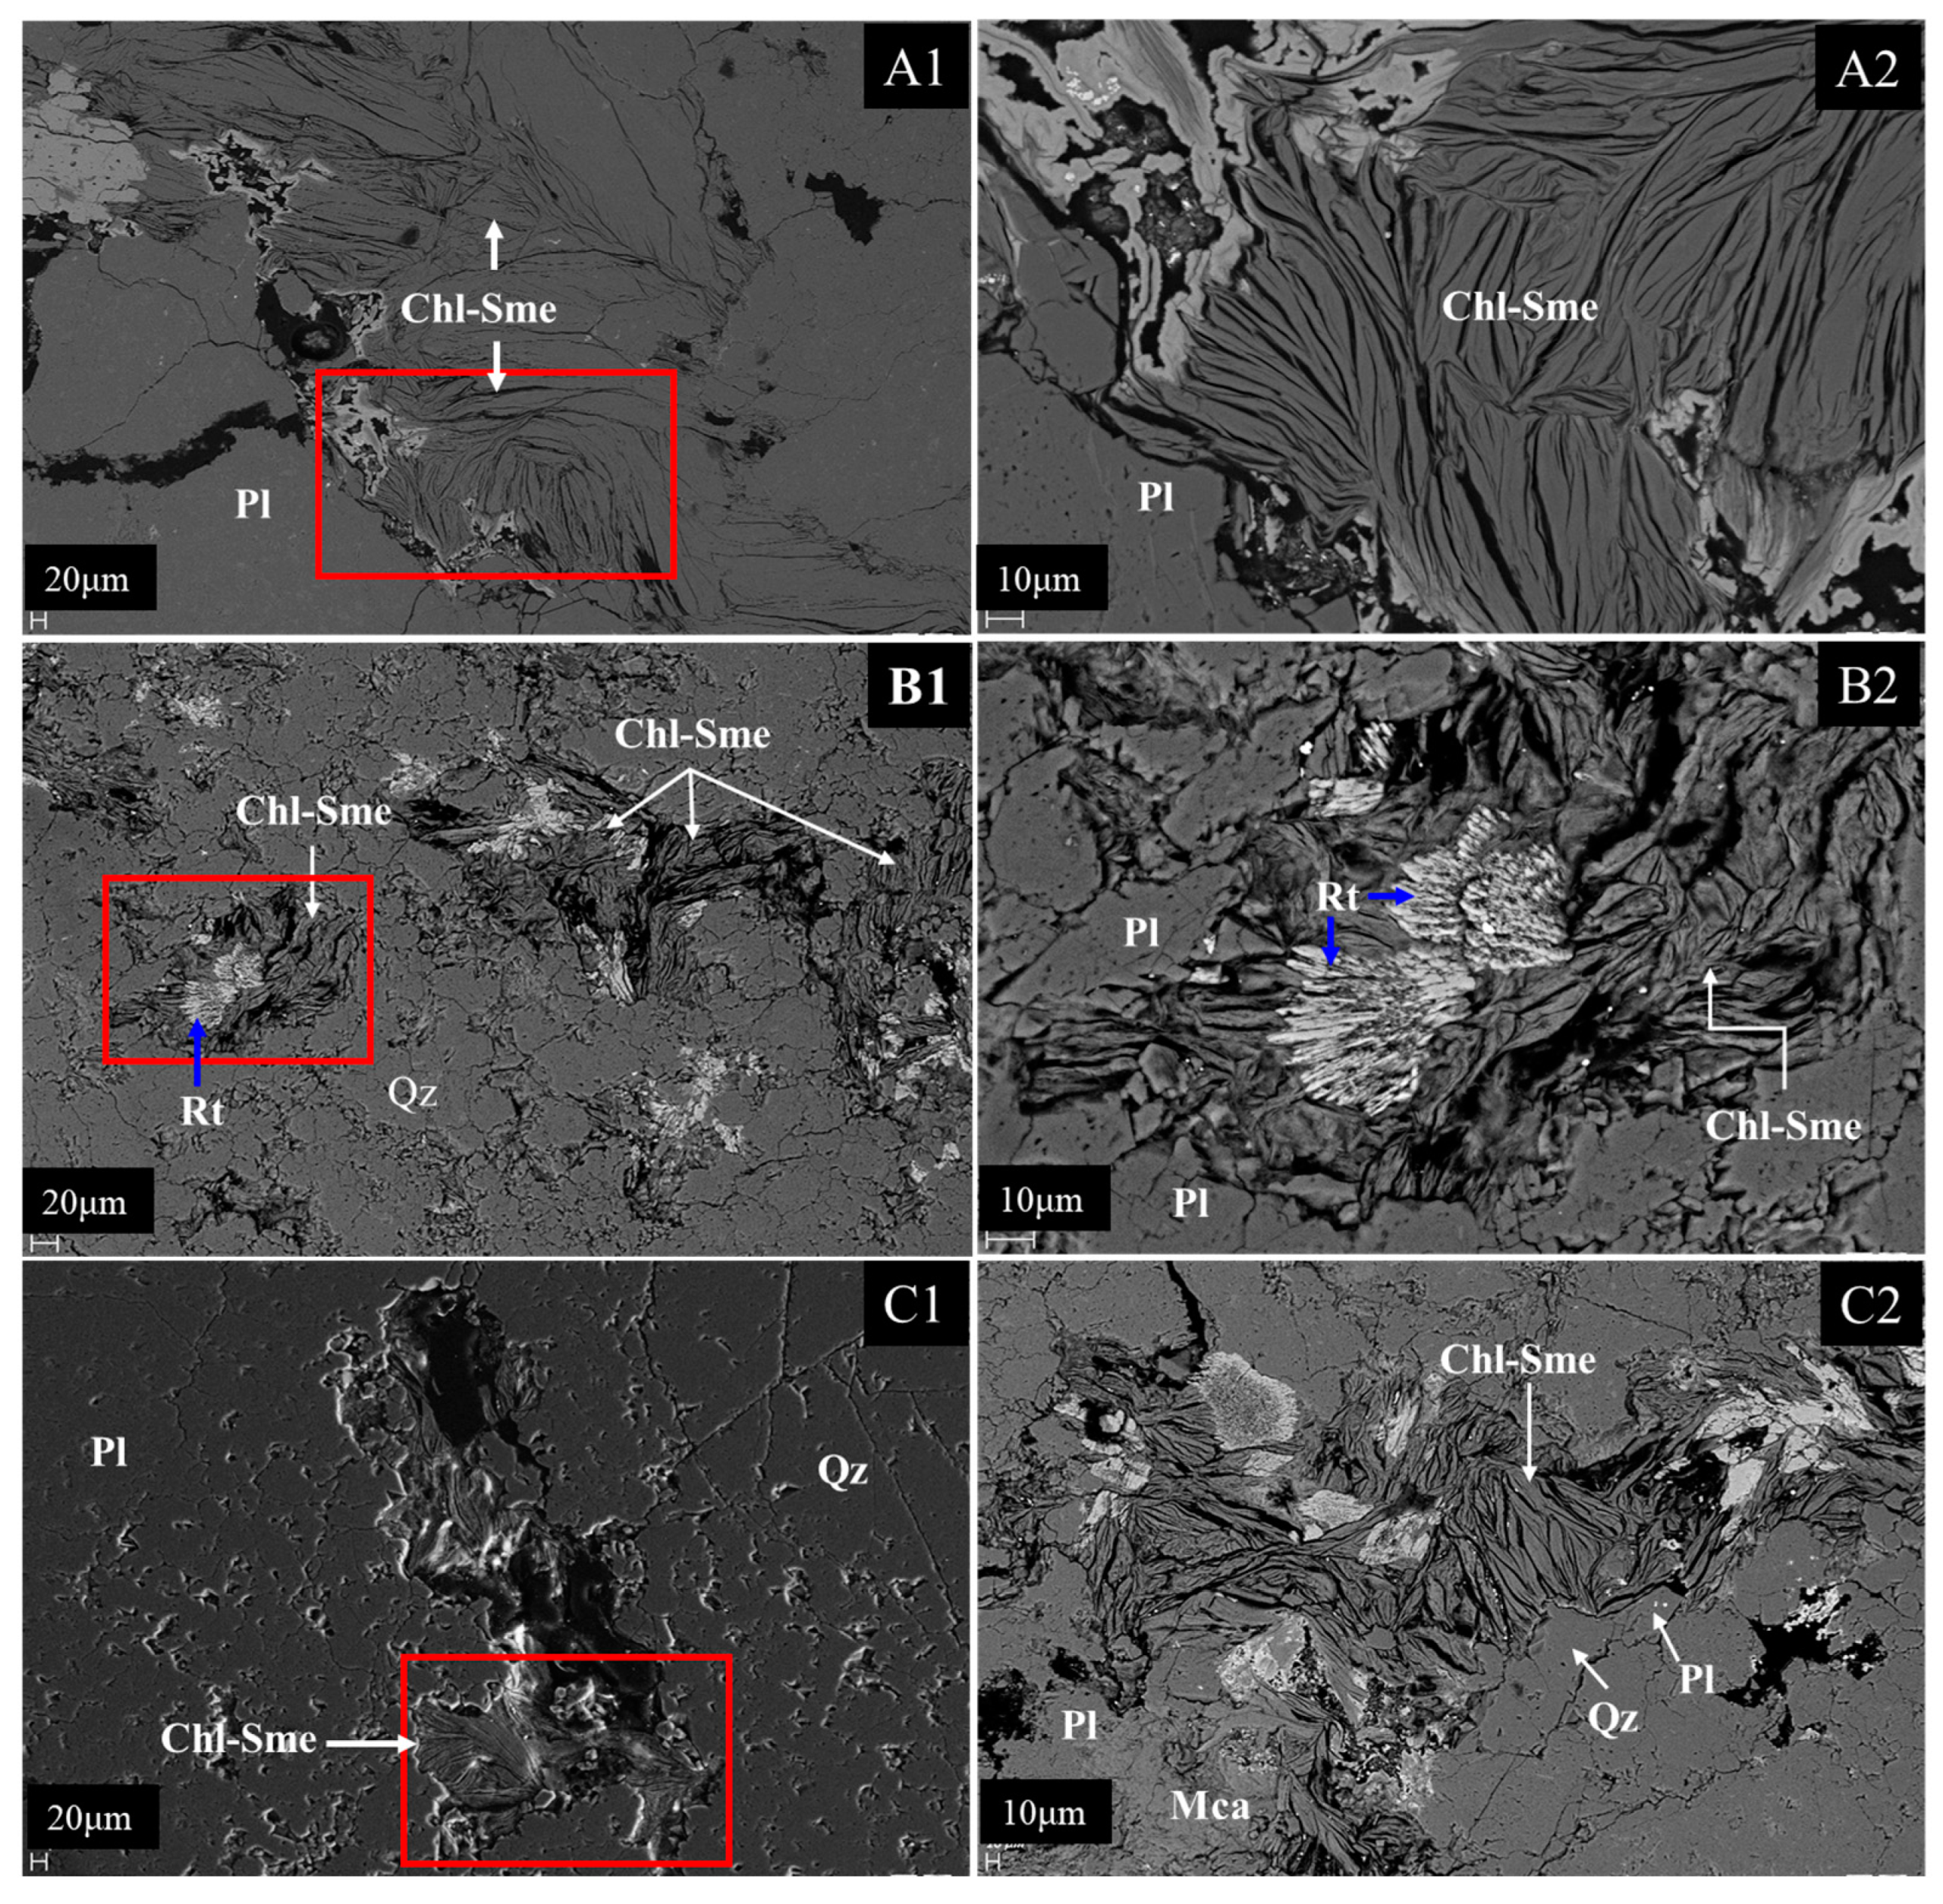
4.3. Scanning Electron Microscopy

The mineralogical chemical map (Figure 4) allows the recognition of the different minerals in the sample and their textural relationships. The plagioclase is albite; quartz is generally smaller and evenly distributed; mica areas include both muscovite and illite compositions, and chlorite, including C/S forms clusters of well-recognisable elongated packets. The EDX spectrum of these areas indicates basically chlorite composition, but with the systematic presence of Ca (and minor K), and it is always magnesium rich. Differences in the colour of chloritic areas in the maps are produced by slightly different compositions, as indicated by the differences in the corresponding spectra.
The BSE images (Figure 5) illustrate the relationships among chlorite–smectite (Chl-Sme), plagioclase (Pl), quartz (Qz), rutile (Rt), and mica (Mca). Chl-Sme consistently appears as foliated, elongated structures associated to the more massive and blockier albite and granular quartz, and small prismatic crystal of rutile, indicating their alteration origin. The chlorite in the Chl-Sme was identified as magnesium-rich. The mica presents a variable composition between muscovite and illite.

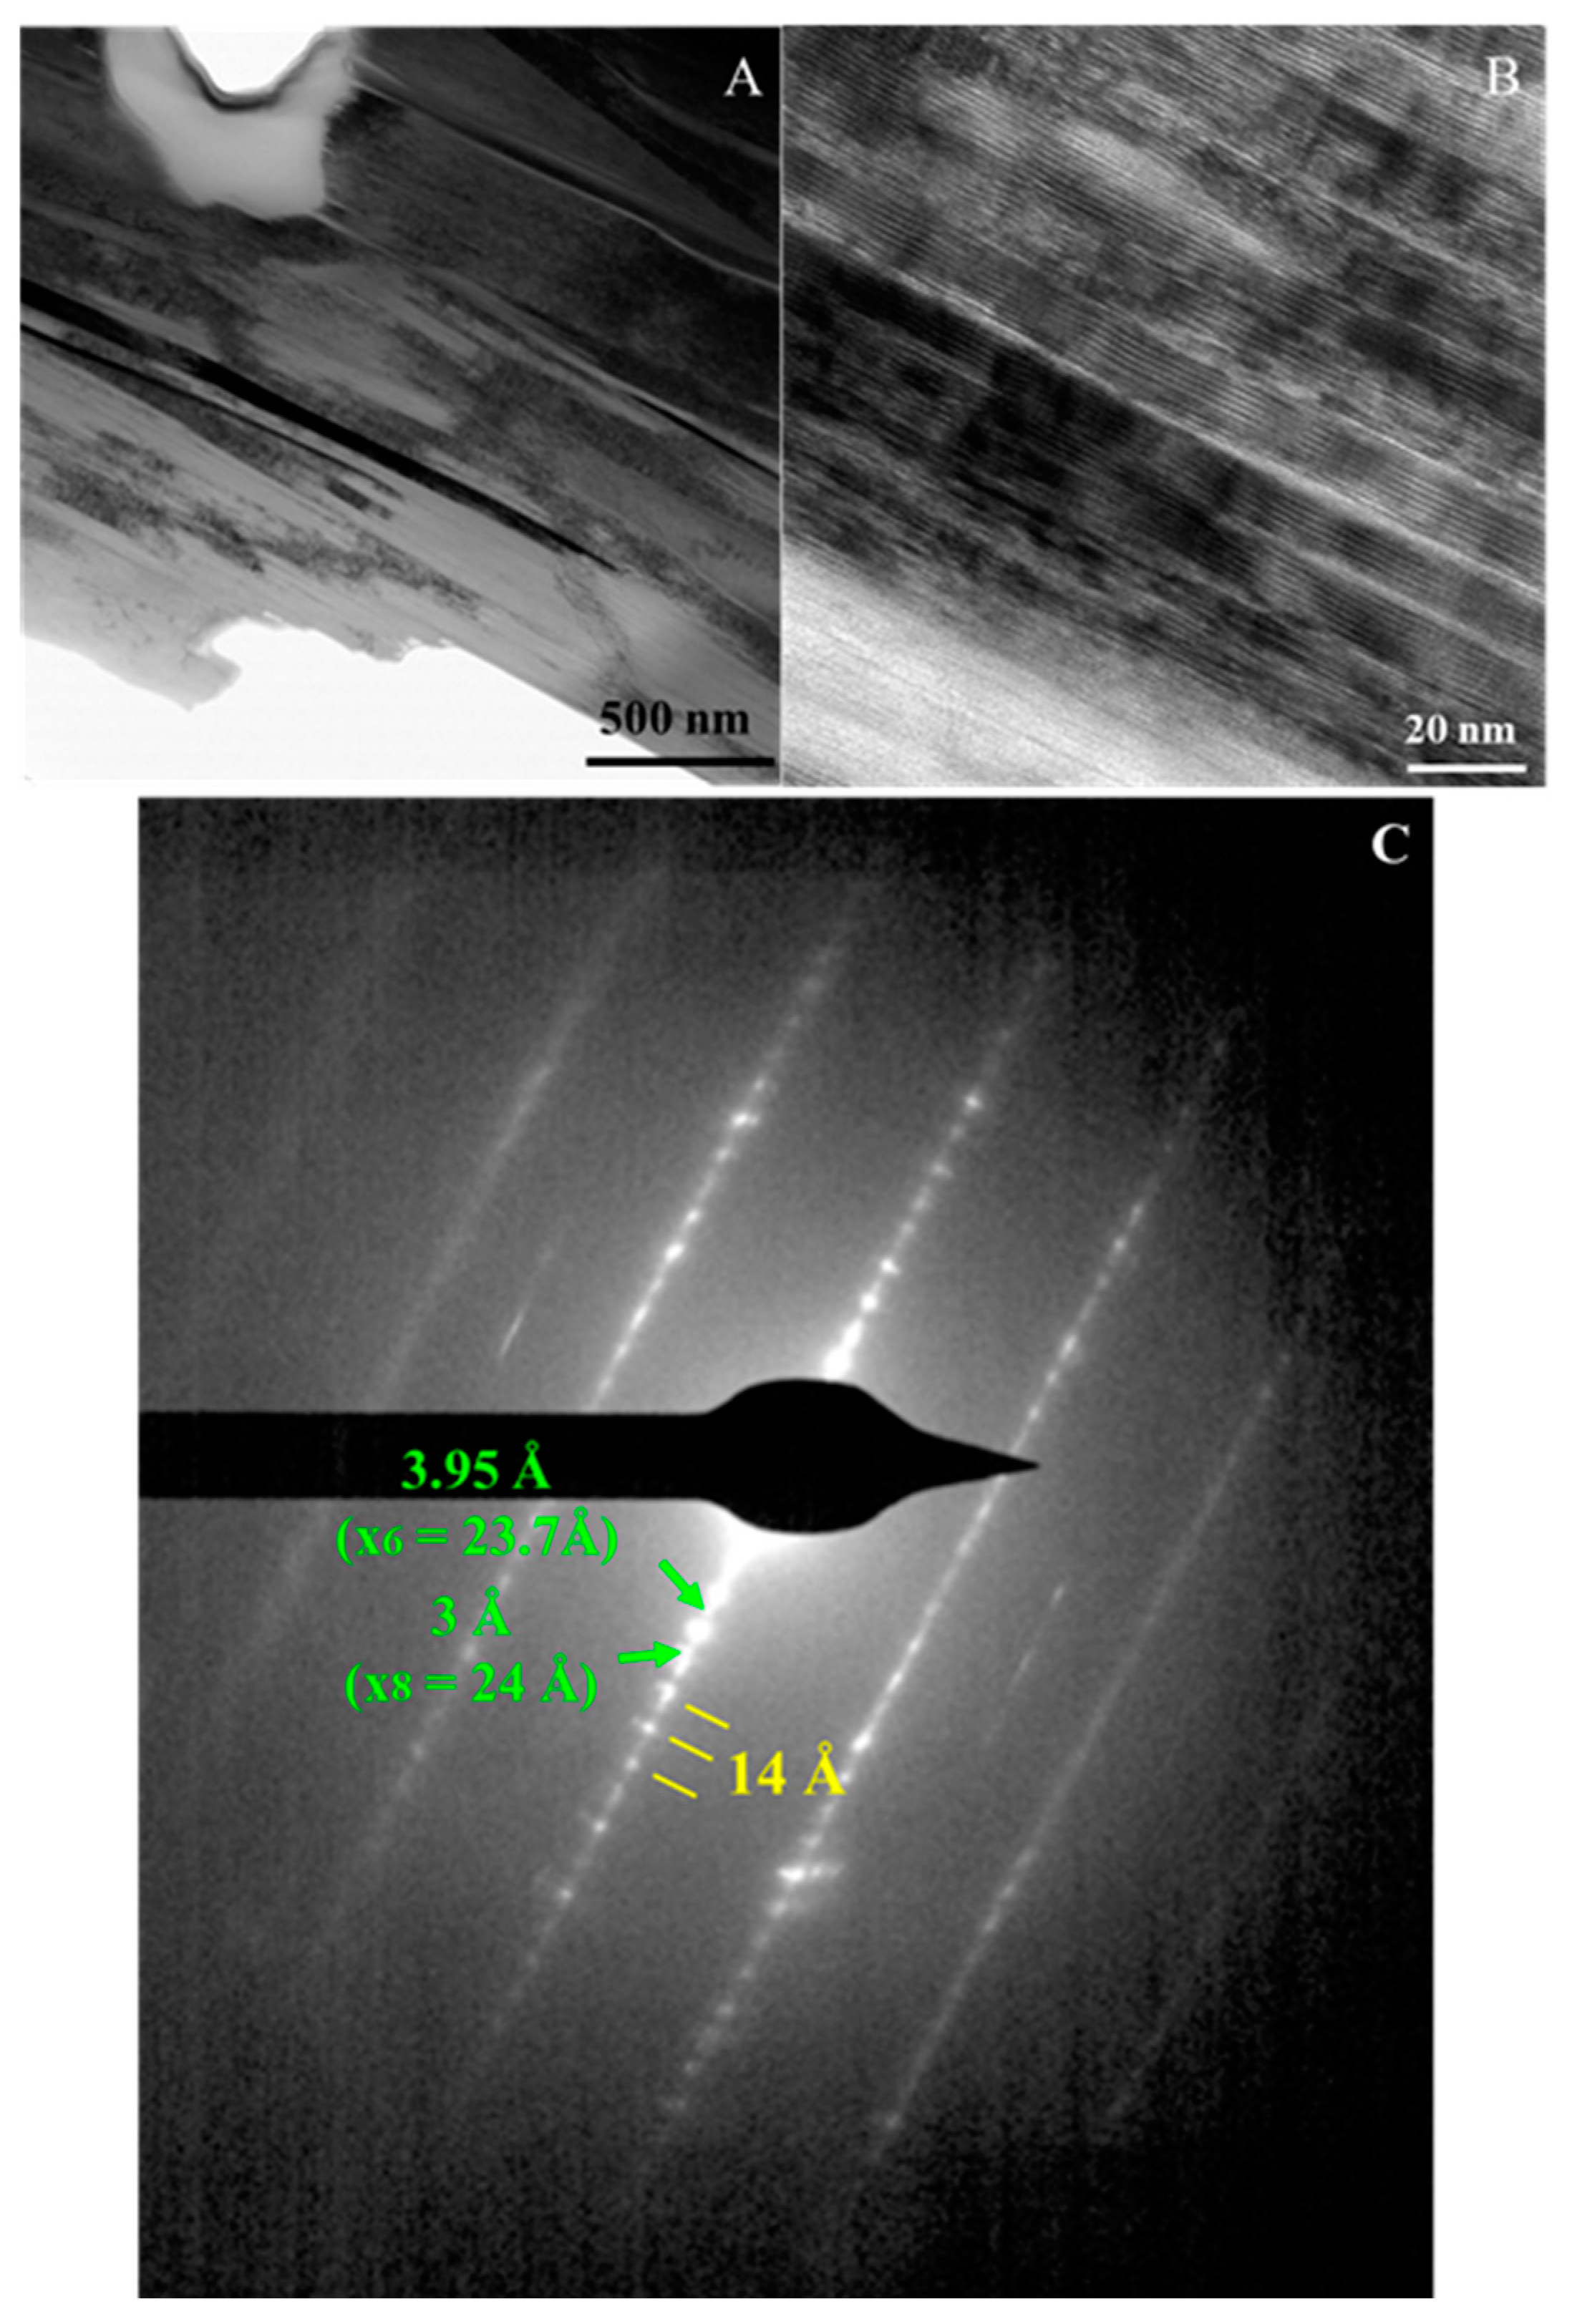
4.4. Transmission Electron Microscopy (TEM)

The TEM images (Figure 6A,B) show that the chloritic areas consist of stacked multiple-layer packets, each ranging from 100 to 500 Å in thickness. The term “packet”, as used here, refers to a sequence of coherent layers with identical crystallographic orientation. These packets are slightly disoriented but show sub-parallel orientation (Figure 6A). More in detail (Figure 6B), the packets include a variable number of layers, generally less than 10, showing differences in contrast and, sometimes, spacing.
Selected area electron diffraction patterns of these areas (Figure 6C) correspond to a c* spacing of 14 Å and a second spacing in the perpendicular direction of around 4.6 Å, coherent with the half b* parameter or the <110> crystallographic direction. In some cases, weak spots corresponding to 24 Å periodicity can be measured (green arrows in Figure 6C); for most of the cases, the spots corresponding to the 24 Å periodicity are too weak and/or superposed to the predominant 14 Å spots. The 14 Å/4.6 Å net is regular and can also be recognised for the (hkl) spots different from (00l), which allow recognising a one-layer polytype (Figure 6C).
Figure 3. XRD patterns (A) disoriented preparation of the whole powder. (B) <2 µm fraction: air-dried (AD); ethylene glycol-saturated (EG) and heated at 350 °C for 1 h. (C) Magnetically and hand-picking separates of chloritic grains in the air-dried (AD) and the ethylene glycol-saturated states (EG). Chl-Sme: chlorite + chlorite-smectite mixed-layers, Mca: mica, Qz: quartz, Pl: plagioclase. Numbers indicate the d spacing of each peak in Å.
Minerals 15 00326 g003
Figure 4. The mineralogical chemical map shows plagioclase (Pl), quartz (Qz), mica (Mca), calcite (Cal), and chlorite–smectite (Chl-Sme), with the EDS spectrum indicating that the chlorite–smectite areas are rich in Mg and systematically contain Ca.
Minerals 15 00326 g004
Figure 5. Back-scattered electron (BSE) and secondary-electron (C1) images of textural aspects of the minerals forming the porphyry rock: chlorite–smectite (Chl-Sme) (large size) and plagioclase (Pl) (A1,A2); Chl-Sme and quartz (Qz) (B1); Chl-Sme, rutile (Rt) and Pl (B2); Chl-Sme, Pl, Mca, and Qz (B1,C1,C2). The right images (A2,B2,C2) show the zoomed-in areas marked by red rectangles in the left images (A1,B1,C1).
Minerals 15 00326 g005
Figure 6. (A) Low-magnification image of chloritic areas, while (B) displays a medium-magnification image showing visible lattice fringes to illustrate the packet relationships. (C) is a SAED pattern showing 14 Å predominant chlorite lattice, but some interstratified 10 Å layers (collapsed smectite-like layers) create 24 Å mixed layers (indicated by green arrows).
Minerals 15 00326 g006
The 001 lattice fringe images of sample SIN02-01 (Figure 7) display a periodicity of ~14 Å with intercalated layers at ~10 Å spacing, resembling chlorite interspersed with smectite layers. Analysis combining TEM, XRD, and chemical data confirms that the 14 Å fringes correspond to chlorite layers, while the 10 Å fringes represent collapsed smectite-like layers. High-resolution TEM images frequently show adjacent layers with a composite periodicity of ~24 Å (14 + 10 Å), indicating a regular interstratification of chlorite and smectite layers (Figure 7). These 24 Å packets comprise regularly alternating 14 Å and 10 Å layers in a consistent arrangement (Figure 7A). In Figure 7B, two 14 Å layers (upper ones of the bottom-right packet, indicated by green lines) transform into a 24 Å layer (lower one of the packets to the left, indicated by yellow lines).
Chemical maps obtained in STEM-HAADF mode (Figure 8) allow recognising differences in composition in a parallel arrangement, which, according to the corresponding EDS spectra, indicate 1) nearly pure chlorite areas (area 2, red spectrum) vs. significant enrichment in interlayer cations (Ca and K) and a reduction in Mg and Fe (area 1, green spectrum).

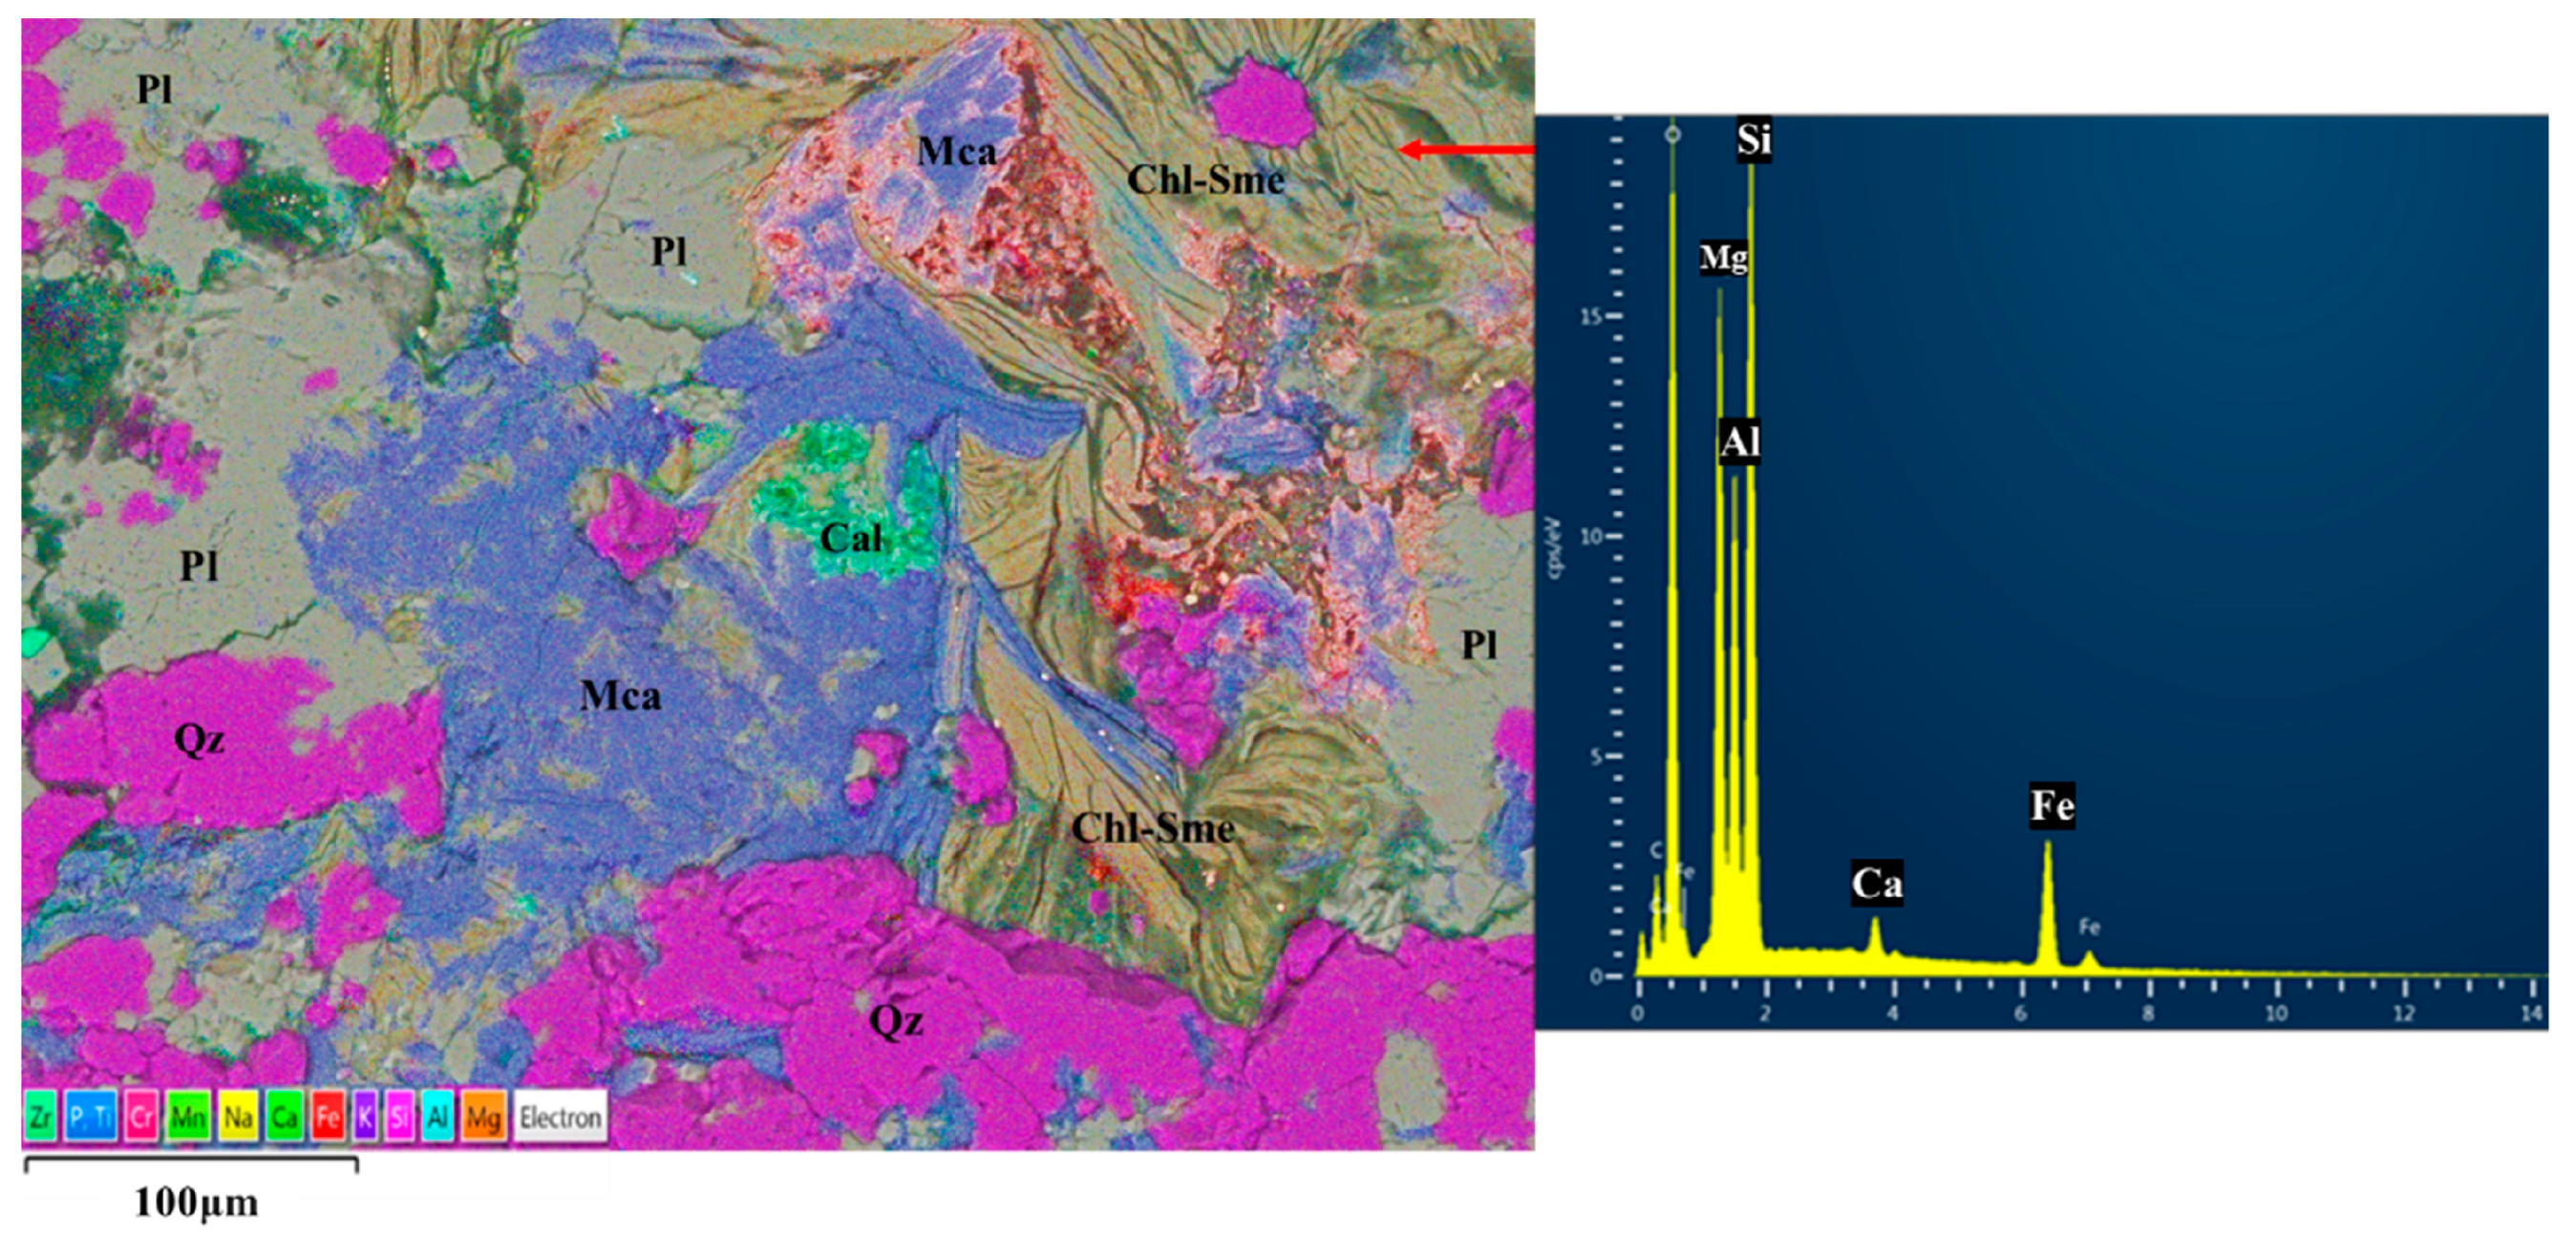
4.5. Chemical Composition of Chlorite and Chlorite/Smectite

Representative microprobe analyses and structural formulae of chloritic minerals are listed in Table 2. Normalisation was based on O10(OH)8 [31] and all the Fe considered as Fe2+ to facilitate comparison with the ordinary compositions of chlorite.
The chlorite and chloritic mixed-layer identified are rich in magnesium and contain small amounts of iron. The composition spans a large compositional range, between the end-members of tosudite and chlorite (Figure 9). The interlayer charge in the mixed-layer chlorite-smectite is up to 0.38 atoms per formula unit (apfu).
In those areas less affected by intermixing with C/S, it was possible to obtain clean analyses of chlorite, which fulfil the purity conditions for the application of the semi-empirical geothermometers [32,33]. After selecting only analyses with the sum of interlayer cations under 0.04 apfu and producing similar temperatures for both geothermometers [32,33], a range of temperatures between 160 °C and 260 °C for the chlorite formation in sample SIN02-01 was determined (Table S1).
Table 3 presents representative formulae of the chloritic areas, normalised to O10(OH)8, obtained in SEM-EDS by the integration of spectra from the apparently homogeneous areas of the chemical maps. The results from the SEM-EDS and EMP analyses show similar chemical compositions (Figure 9), confirming the reliability and consistency of both types of data.
Figure 9. Representative analyses of chlorite and chlorite–smectite mixtures, determined by SEM-EDS, EMPA, and TEM. (A) Chemical variations in the Na + K + Ca/Si versus Fe + Mg/Si diagram [34]. (B) Compositional plot of the chloritic phases in the ternary diagram Si-Al-R2+ [17,35]. Black symbols and stars denote standard clay phases (tosudites from [16,17]).
Minerals 15 00326 g009
In general, the SEM-EDS and EMP analyses deviate from the typical composition of chlorite in one or more of the following characteristics: high Si content, low octahedral sum, and significant interlayer charge. This is because they include mixtures, as these methods cannot resolve the fine-scale intergrowth between chlorite and the smectite-bearing mixed layer. Nevertheless, the TEM data can provide a more accurate representation of the end-member compositions, extending their range towards the theoretical values of chlorite and tosudite (Figure 9), while the SEM-EDS and EMP data often represent a weighted averaged composition of the mixed areas between the two phases.
Some of the compositions obtained by TEM (Table 3) are coherent with tosudite; therefore, they have been recalculated to 50 (28 + 22) charges (Table 4). The tosudite in this sample is characterised by large Al and Mg and low Fe content. The interstratification of low-charge dioctahedral smectite and di-trioctahedral chlorite may be inferred, in concordance with similar criteria as in [16,17], from (1) an octahedral occupancy close to 7 atoms (2 + 5) and (2) an interlayer charge ranging from 0.31 to 0.51 per 50 charges, with Ca and K as the main cations (green spectrum in Figure 8). This range of interlayer charges reaches higher values than for the Niger tosudites [16,17], being compensated by a higher negative tetrahedral charge, that is, Al by Si substitution (Figure 9A and Table 4).

5. Discussion

5.1. Nature of the Mixed-Layer

The SinAbad porphyry rock samples display a mixed layer of chlorite/smectite (C/S) minerals, as identified through XRD and HRTEM analyses (Figure 3, Figure 6C and Figure 7). The XRD diagrams indicate that (1) the normal chlorite peaks corresponding with successive orders coherent with 14 Å spacing are irregular, wide, and affected by slight changes in spacing in relation to the normal ones; (2) they expand after EG treatment (Figure 3C); (3) they collapse after heating (Figure 3B); (4) the 14 Å peak is more intense than the 7 Å one; (5) a peak around 30 Å may be recognised (Figure 3C). Collectively, all this behaviour indicates the existence of swilling layers interstratified within the chlorite ones. Those layers are also recognised in the HRTEM images, where they have been collapsed to 10 Å due to the vacuum of the microscope and the effect of electrons. The absence of significant quantities of vermiculitic layers can be inferred from the ethylene glycol (EG) treatment results, as vermiculite would not expand after the EG treatment and is in coherency with the chemical composition determined by EMPA, SEM-EDS, and AEM (Figure 9 and Table 2, Table 3 and Table 4). The presence of the so-named super-order reflection at ~30 Å indicates that the mixed-layer is, at least in part, ordered [28], which is consistent with the existence of discrete areas in the HRTEM images formed by 24 (14 + 10) Å. It can be concluded that an ordered mixed-layer chlorite/smectite is present in the sample.
This mixed-layer was observed to be intermixed within pure chlorite at the optical and electron microscopy scales. The change in the optical properties (Figure 2) and chemical composition (Figure 4) is diffuse, with a defined change between the chlorite and C/S areas only recognisable at the TEM scale (Figure 7 and Figure 8). The proportion of the chlorite/smectite mixed layers varied, with some cases showing pure chlorite, as indicated by the XRD and TEM data.
The nature of the chloritic and smectitic layers can be inferred from the chemical analyses performed by EMPA, SEM-EDS, and AEM. Most of the analyses correspond to mixing between chlorite and C/S, but they produce a defined trend between the two extremes (Figure 9), with those analyses at the C/S end-member, determined by AEM, showing a composition coherent with tosudite, as analysed by EMP in the Niger sandstones [16]. As those authors [16] interpreted, the composition of this study and Niger tosudites indicates the nature of the two kinds of mixed-layers: di-trioctahedral chlorite and dioctahedral smectite.

5.2. Chemical Composition

The chemical composition of the pure chlorites from the SinAbad area was determined using EMP, SEM-EDS, and AEM analyses. These chlorites were found to be magnesium-rich and iron-poor, which is consistent with their origin from a magmatic system, in which Mg and Al are clearly predominant over Fe. Minor but ubiquitous amounts of Ca and K, as indicated by SEM maps and EMP analyses, are produced by the tosudite intermixing. Clear peaks at 14 Å, characteristic of chlorite, were identified by XRD analysis, and the intensity ratio between the odd and even XRD peaks is characteristic of Mg-rich, Fe-poor chlorites. According to [36,37], Fe increases the even peaks in the chlorite XRD diagrams, producing the typical diagram of iron-rich or intermediate-composition chlorites with (002) and (004) more intense (more than double) than (001) and (003), which is not the case of the SinAbad chlorites (Figure 3)
It was found through chemical analyses that the interlayer cations in the chlorite/smectite mixed layers included sodium (Na), potassium (K), and calcium (Ca), with calcium being more prevalent, but K being also significant (Figure 8). When the obtained results for tosudite (Table 4) were compared with the tosudite in sandstones in Niger [16,17], several similarities and differences were observed. It was found that tosudite consists of a combination of di-trioctahedral chlorite and dioctahedral smectite. One of the key differences identified between the SinAbad samples and those from the Niger sandstones is a higher interlayer charge for the former (Figure 9A), compensated by a greater tetrahedral negative charge (AlIV by Si substitution). This would represent that the smectitic layers of SinAbad are of higher charge than those of Niger, even if this charge is still far from being of vermiculitic character. In any case, the higher negative charge cannot be unambiguously assigned to the tetrahedral smectitic layer because there is no way to distribute this charge between the chloritic and smectitic layers; the di-trioctahedral character of the chloritic layer precludes any assumption of similarity between the composition of the chlorite and that of the chloritic layers in the interstratified structure. Similarly to the corrensite case [7,8], tosudite has its own compositional field, independent of the coetaneous chlorite and/or smectite.

5.3. Origin of the Mixed-Layer

The SinAbad samples provide valuable insights into the alteration processes and the formation of the mixed-layer minerals, highlighting significant differences compared to other geological environments. The original rock in SinAbad is a volcaniclastic rock, primarily composed of plagioclase, quartz, and supposedly some mafic minerals such as amphibole and biotite. The absence of other Mg-rich phases suggests that any pre-existing Mg-bearing phase was either completely altered or dissolved during the paragenetic sequence leading to chlorite formation. This primary composition underwent argillic alteration, leading to the production of muscovite, illite, and chlorite. The argillic alteration spans a wide range of temperatures and fluid compositions, as evidenced by the coexistence of muscovite and illite, along with the temperature range of chlorite formation (260 °C to ~160 °C). At the later stages of this alteration, significant portions of chlorite were transformed into tosudite due to changes in the fluid chemistry and temperature. This transformation is supported by the textural relationships observed in the samples and the lateral transition from chlorite to tosudite layers (Figure 7B). SEM and TEM analyses reveal that tosudite is an alteration product of higher-temperature chlorite, which itself was formed at temperatures around 200 °C, as indicated by geothermometric calculations on nearly pure chlorite. The subsequent retrogradation by colder fluids facilitated the partial transformation of chlorite into tosudite, as described by Ahmadi et al. (in prep.). The limited presence of tosudite packets suggests that this transformation was constrained. The proportion of tosudite (or smectite-like) layers relative to chlorite in the SinAbad samples appears to have been primarily influenced by the temperature and composition of the fluid, as well as the bulk rock composition.
Comparison with the Niger tosudites [16,17] demonstrates that even if tosudite can form over a wide temperature range (approximately 100 °C to over 300 °C), most of the occurrences cited in the literature [38], including those of Niger, are related to temperatures well below 200 °C, near to 100 °C ([38] and references therein). However, the geological settings differ significantly. Those from Niger are related to a sedimentary, burial diagenesis environment, whereas the Sinabad samples formed in volcaniclastic rocks; however, in both cases, a final hydrothermal environment is invoked. In spite of this similar final origin, those differences in the geological context resulted in distinct chemical characteristics in the mixed-layer minerals of the two settings, probably related to the distinct compositions of the parent rocks, but also with that of the fluids responsible for alteration [39].

5.4. Effect on the Optical Properties of Chlorite

The optical properties of chlorite in the SinAbad samples are significantly influenced by the presence of smectitic interlayers. Mg-rich/Fe-poor chlorites typically show normal values of approximately 1.575 (α and β) for the refractive indices parallel to the layers and 1.585 (γ) for the perpendicular one [1]. However, in the SinAbad samples, these values were modified due to the presence of smectitic interlayers, which affected the refractive index and related optical properties (Table 1). Measurements indicate a birefringence of approximately 0.02, with the indices in the plane of the layer (γ and β) being higher than the perpendicular index (α). This alteration also causes changes in the optical and elongation signs, with the SinAbad chlorites frequently exhibiting a negative optic sign and positive elongation, consistent with observations reported for tosudite [40]. Such change is progressive, depending on the tosudite proportion of each area, with layers showing a nearly isotropic behaviour and anomalous interference colours (Figure 2D), indicating the proportion correspondent to the change in optic and elongation signs.
The reduction in the refractive index is attributed to the structural disruptions introduced by the smectitic layers. These layers, which include water molecules and are characterised by weak ionic bonds, would reduce the atomic polarisability. This lower polarisability decreases the refractive index [41] when the light rays pass perpendicularly through the smectitic layers. Conversely, light rays travelling parallel to the chlorite layers are little affected, as they pass continuously through the intact chlorite structure.
Overall, the presence of smectitic layers in the SinAbad chlorites reduced the refractive index perpendicular to the layers from values typical of chlorite to those observed in some areas of these samples (Table 1). These structural changes produce the optical behaviour documented in this study, including a change in elongation and optical sign and an increase in birefringence (Figure 2), which provide insight into the impact of smectitic interlayers on the optical properties of chlorite and may explain the frequent reference in the literature to unexpected anomalous properties.

6. Conclusions

This study describes the alteration of Mg-rich, Fe-poor chlorites in the SinAbad area within the Urumieh–Dokhtar magmatic belt. Chlorites are crystallised by hydrothermal alteration of dacitic rocks at 160–260 °C. During the hydrothermal system’s retrograde evolution, they underwent micro- to nano-scale alteration into chlorite/smectite mixed-layers. TEM and XRD analyses confirmed the presence of chlorite and tosudite, with observed lateral transitions between 14 Å (chlorite) and 24 Å (tosudite) layers. In coherence with previous studies of Niger tosudites, their composition indicates that they are formed by an ordered arrangement of di-trioctahedral chlorite and dioctahedral smectite layers; however, the SinAbad tosudites differ from those of Niger and other described cases in a higher interlayer charge. Such differences reflect both the different natures of the parent rock, i.e., dacitic in SinAbad, and the physicochemical characteristics of the altering fluids.
Altered chlorites retained their optical properties except for a reduction in the refractive index perpendicular to (001), leading to increased birefringence and changes in optic and elongation signs. The anomalous optical properties of chlorite, frequently cited in the literature, may indicate mixed layering of other phyllosilicates due to alteration processes.

Supplementary Materials

The following supporting information can be downloaded at: https://www.mdpi.com/article/10.3390/min15030326/s1, Table S1: Compositions of chlorites, nearly free of smectite layers, determined by EMPA, used for chlorite geothermometry.

Author Contributions

Conceptualisation, Z.A., F.N. and N.V.; formal analysis, Z.A., F.N. and N.V.; samples and geological investigation, Z.A. and M.E.; methodology, Z.A., F.N. and N.V.; writing—original draft, Z.A. and F.N.; writing—review and editing, Z.A., F.N., F.K., M.E., A.M., A.A. and N.V. Funding acquisition, F.N. All authors have read and agreed to the published version of the manuscript.

Funding

Funding for this research was provided by Projects TED2021-131697B-C22 and PID2023-147440OB-C22 from the Spanish MICIU/AEI/ 10.13039/501100011033; Project FEDER-UJA Andalucía 2021-2027. M.1.B.B TA_000655; Research Group RNM-179 of the Junta de Andalucía. Z.A. acknowledges the Ministry of Science, Research and Technology of Iran and the Vicerrectorado de Investigación and CICODE of the Granada University for the grants for funding her stay in the Granada University.

Data Availability Statement

The authors confirm that the data supporting the findings of this study are available within the manuscript and as Supplementary Materials (Table S1). Raw data are available upon reasonable request.

Acknowledgments

We thank Isabel Guerra, Fina Pedrajas, and María del Mar Abad, of the Scientific Instrumentation Centre (CIC) and Eva María Marín (Department of Mineralogy and Petrology) of the University of Granada for their help during the analytical work. We would also like to thank Shahryar Motevakel, Director of Exploration and Mineral Resource Development at the National Iranian Copper Industries Company (NICICO).

Conflicts of Interest

Morteza Einali are employee of Fateh Mine and Mining Industries Development Company. The paper reflects the views of the scientists and not the company.

References

  1. Albee, A.L. Relationships between the mineral association, chemical composition, and physical properties of the chlorite series. Am. Mineral. 1962, 47, 851–870. [Google Scholar]
  2. Nesse, W.D. Introduction to Optical Mineralogy; Oxford University Press: Oxford, UK, 1991; 335p. [Google Scholar]
  3. Deer, W.A.; Howie, R.A.; Zussman, J. Rock Forming Minerals Vol. III: Sheet Silicates; Longman: Harlow, UK, 2013; 270p. [Google Scholar]
  4. Chatterjee, N.D. On the widespread occurrence of oxidized chlorites in the Pennine Zone of the Western Italian Alps. Contrib. Mineral. Petrol. 1966, 12, 325–339. [Google Scholar] [CrossRef]
  5. Masci, L.; Dubacq, B.; Verlaguet, A.; Chopin, C.; De Andrade, V.; Herviou, C. A XANES and EPMA study of Fe3+ in chlorite: Importance of oxychlorite and implications for cation site distribution and thermobarometry. Am. Mineral. 2019, 104, 403–417. [Google Scholar] [CrossRef]
  6. Mellini, M.; Nieto, F.; Alvarez, F.; Gomez-Pugnaire, M.T. Mica-chlorite intermixing and altered chlorite from the Nevado-Filabride mica schists, southern Spain. Eur. J. Mineral. 1991, 3, 27–38. [Google Scholar] [CrossRef]
  7. Shau, J.H.; Peacor, D.R.; Essene, E.J. Corrensite and mixed-layer chlorite/corrensite in metabasalt from Northern Taiwan: TEM/AEM, EMPA, XRD and optical studies. Contrib. Mineral. Petrol. 1990, 105, 123–142. [Google Scholar] [CrossRef]
  8. Jiang, W.T.; Peacor, D.R. Formation of corrensite, chlorite and chlorite-mica stacks by replacement of detrital biotite in low-grade pelitic rocks. J. Metamorph. Geol. 1994, 12, 867–884. [Google Scholar] [CrossRef]
  9. Shimoda, S. New data for tosudite. Clays Clay Miner. 1969, 17, 179–184. [Google Scholar] [CrossRef]
  10. Nishiyama, T.; Shimoda, S.; Shimosaka, K.; Kanaoka, S. Lithium-bearing tosudite. Clays Clay Miner. 1975, 23, 337–342. [Google Scholar] [CrossRef]
  11. Ichikawa, A.; Shimoda, S. Tosudite from the Hokuno Mine, Hokuno, Gifu Prefecture, Japan. Clays Clay Miner. 1976, 24, 142–148. [Google Scholar] [CrossRef]
  12. Creach, M.; Meunier, A.; Beaufort, D. Tosudite crystallization in the kaolinized granitic cupola of Montebras, Creuse, France. Clay Miner. 1986, 21, 225–230. [Google Scholar] [CrossRef]
  13. Merceron, T.; Inoue, A.; Bouchet, A.; Meunier, A. Lithium-bearing donbassite and tosudite from Echassières, Massif Central, France. Clays Clay Miner. 1988, 36, 39–46. [Google Scholar] [CrossRef]
  14. Bartier, D.; Meunier, A.; Liewig, N.; Morvan, G.; Addad, A. Hydrothermal alteration of the Soultz-sous-Forets granite (hot fractured rock geothermal exchanger) into a tosudite and illite assemblage. Eur. J. Mineral. 2008, 20, 131–142. [Google Scholar] [CrossRef]
  15. Hillier, S.; Son, B.K.; Velde, B. Effect of hydrothermal activity on clay mineral diagenesis in Miocene shales and sandstones from the Ulleung (Tsushima) back-arc basin, East Sea (Sea of Japan), Korea. Clay Miner. 1996, 31, 113–126. [Google Scholar] [CrossRef]
  16. Billon, S.; Patrier, P.; Beaufort, D.; Sardini, P.; Wattinne-Morice, A. Occurrence of tosudite in the Guezouman, Tarat, and Tchirezrine 2 formations, hosts of uranium deposits in Niger (Tim Mersoï basin). Clay Miner. 2016, 51, 635–651. [Google Scholar] [CrossRef]
  17. Abd Elmola, A.; Asaad, A.; Patrier, P.; Ballini, M.; Descostes, M. Clay mineral signatures of fault-related fluid flows in a sandstone reservoir: A case study from the Teloua Formation, Tim Mersoï Basin, Niger. J. Afr. Earth Sci. 2020, 168, 103840. [Google Scholar] [CrossRef]
  18. Maksimovic, Z.; Brindley, G.W. Hydrothermal alteration of a serpentinite near Takovo, Yugoslavia, to chromium-bearing illite/smectite, kaolinite, tosudite, and halloysite. Clays Clay Miner. 1980, 28, 295–302. [Google Scholar] [CrossRef]
  19. Ruiz Cruz, M.D.; Andreo, B. Tosudite in very low-grade metamorphic graywackes from the Málaga area, Betic Cordilleras, Spain. Eur. J. Mineral. 1996, 8, 1391–1399. [Google Scholar] [CrossRef]
  20. Frank-Kamenetskii, V.A.; Logvinenko, N.V.; Drits, V.A. Tosudite—A new mineral, forming the mixed layer phase in alushtite. In Proceedings of the International Clay Conference, Stockholm, Sweden, 12–16 August 1965; Volume 2, pp. 181–186. [Google Scholar]
  21. De Windt, L.; Grizard, P.; Besançon, C.; Assalack, F.; Djibo Hama, I.; Reiller, P.E.; Seigneur, N.; Descostes, M. Modeling of hydrogeochemical processes influencing uranium migration in anthropized arid environments with application to the Teloua aquifer. J. Contam. Hydrol. 2025, 269, 104507. [Google Scholar] [CrossRef]
  22. Dimitrijevic, M.D. Geology of the Kerman Region; Report 52; Geology Survey of Iran: Tehran, Iran, 1973; pp. 245–334. [Google Scholar]
  23. Saric, V.; Mijalkovic, N. Metallogenic map of Kerman region, 1:500000 scale. In Exploration for Ore Deposits in Kerman Region; Report 53; Geology Survey of Iran: Tehran, Iran, 1973; pp. 244–247. [Google Scholar]
  24. Dercourt, J.; Zonenshain, L.; Ricou, L.E.; Kazmin, G.; Le Pichon, X.; Knipper, A.L.; Grandjacquet, C.; Sbortshikov, I.M.; Geyssant, J.; Lepvrier, C.; et al. Geological evolution of the Tethys belt from the Atlantic to Pamirs since the Lias. Tectonophysics 1986, 123, 241–315. [Google Scholar] [CrossRef]
  25. Emami, M.H.; Mir Mohammad Sadeghi, M.; Omrani, S.J. Magmatic Map of Iran: 1: 2,500,000 Scale; Geological Survey of Iran: Tehran, Iran, 1993. [Google Scholar]
  26. Samani, B. Distribution, setting and metallogenesis of copper deposits in Iran. In Porphyry and Hydrothermal Copper and Gold Deposits: A Global Perspective; Porter, T.M., Ed.; Conference Proceedings; Perth PGC Publishing: Adelaide, Australia, 1998; pp. 135–158. [Google Scholar]
  27. Shafiei, B.; Haschke, M.; Shahabpour, J. Recycling of orogenic arc crust triggers porphyry Cu mineralization in Kerman Cenozoic arc rocks, southeastern Iran. Miner. Depos. 2009, 44, 265–283. [Google Scholar] [CrossRef]
  28. Moore, D.M.; Reynolds, R.C., Jr. X-Ray Diffraction and the Identification and Analysis of Clay Minerals, 2nd ed.; Oxford University Press: Oxford, UK, 1997; 378p. [Google Scholar] [CrossRef]
  29. Pouchou, J.L.; Pichoir, F. ‘PAP’ (φρZ) procedure for improved quantitative microanalysis. In Microbeam Analysis; Armstrong, J.T., Ed.; San Francisco Press: San Francisco, CA, USA, 1985; pp. 104–106. [Google Scholar]
  30. Cliff, G.; Lorimer, G.W. The quantitative analysis of thin specimens. J. Microsc. 1975, 103, 203–207. [Google Scholar] [CrossRef]
  31. Laird, J. Chlorites: Metamorphic petrology. In Hydrous Phyllosilicates (Reviews in Mineralogy, vol 19); Bailey, S.W., Ed.; Mineralogical Society of America: Chantilly, VA, USA, 1988; pp. 405–453. [Google Scholar]
  32. Bourdelle, F.; Parra, T.; Chopin, C.; Beyssac, O. A new chlorite geothermometer for diagenetic to low-grade metamorphic conditions. Contrib. Mineral. Petrol. 2013, 165, 723–735. [Google Scholar]
  33. Inoue, A.; Inoué, S.; Utada, M. Application of chlorite thermometry to estimation of formation temperature and redox conditions. Clay Miner. 2018, 53, 143–158. [Google Scholar] [CrossRef]
  34. Do Campo, M.; Nieto, F.; Albanesi, G.L.; Ortega, G.; Monaldi, C.R. Outlining the thermal postdepositional evolution of the Ordovician successions of northwestern Argentina by clay mineral analysis, chlorite geothermometry, and Kübler index. Andean Geol. 2017, 44, 179–212. [Google Scholar] [CrossRef]
  35. Arostegui, J.; Arroyo, X.; Nieto, F.; Bauluz, B. Evolution of clays in the Cretaceous marly series (Alava Block, Basque Cantabrian Basin, Spain): Diagenesis and detrital input control. Minerals 2020, 9, 40. [Google Scholar] [CrossRef]
  36. Petruk, W. Determination of the heavy atom content in chlorite by means of X-ray diffractometer. Am. Mineral. 1964, 49, 61–67. [Google Scholar]
  37. Nieto, F. Chemical composition of metapelitic chlorites; X-ray diffraction and optical property approach. Eur. J. Mineral. 1997, 9, 829–841. [Google Scholar] [CrossRef]
  38. Beaufort, D.; Rigault, C.; Billon, S.; Billault, V.; Inoue, A.; Inoue, S.; Patrier, P. Chlorite and chloritization processes through mixed-layer mineral series in low-temperature geological systems—A review. Clay Miner. 2015, 50, 497–523. [Google Scholar] [CrossRef]
  39. Hullaster, D.P.; Soreghan, G.S.; Kukkadapu, R.K.; Dumont, B.S.; Dee, K.T.; Elwood Madden, A.S. Red-green-bleached redox interfaces in the proximal Permian Cutler red beds: Implications for regional fluid alteration. Front. Earth Sci. 2023, 11, 1219966. [Google Scholar] [CrossRef]
  40. Anthony, J.W.; Bideaux, R.A.; Bladh, K.W.; Nichols, M.C. (Eds.) Handbook of Mineralogy; Mineralogical Society of America: Chantilly, VA, USA, 1980; Available online: https://handbookofmineralogy.org/ (accessed on 1 March 2025).
  41. Bloss, F.D. Crystallography and Crystal Chemistry; Mineralogical Society of America: Chantilly, VA, USA, 1994; 545p. [Google Scholar]
Figure 1. Simplified lithostructural map of the Kerman Magmatic Complex (KMCB) [22,23,24,25,26,27] showing the location of the Sinabad area and sampling site. (a) illustrates the position of the Kerman magmatic belt within the Urumieh–Dokhtar magmatic belt in Iran. (b) enlarges the Kerman magmatic belt to provide a clearer view of the SinAbad study area. (c) is a detailed Google Earth image of the SinAbad area, with the location of the SinAbad samples. The location of sample SIN02-01 is highlighted.
Minerals 15 00326 g001
Figure 7. High-resolution bright-field lattice fringe images showing details of ordered mixed-layering between chlorite and smectite (24 Å), intergrowth with chlorite (14 Å) (A,B).
Minerals 15 00326 g007
Figure 8. EDX map, obtained using HAADF, indicates that in the chloritic areas, Mg and Ca are not uniformly distributed, with specific areas (1, 2) showing varying concentrations of these elements.
Minerals 15 00326 g008
Table 1. Optical properties of chlorites and mixed-layer chlorite/smectite.
Chlorite (Clinochlore)Mixed-Layer Chlorite/Smectite
Refractive indexγ ≈ 1.588, β ≈ α ≈ 1.58γ ≈ β = 1.578, αmin ≈ 1.557
Birefringence (max.)0.0070.021
Colourpale greencolourless or very pale green
Pleochroismweak, X = Y < Zvery weak, X< Y = Z
Optic orientationX~a, Y = b, Z~cX~c, Y = b, Z~a
Sign of the elongationlength-fast (−)length-slow (+)
Optic sign(+)(−)
Optic angle 2V<5°<5°
Table 2. Representative EMP analyses (oxide contents in wt%) and structural formulae of chlorite/smectite areas.
Data Set/Point1621293314223126231115
SiO230.7631.1329.4527.5629.3333.8234.4732.7332.7128.2422.22
Al2O321.4020.4118.7518.7316.5719.7618.4517.6416.8315.5012.95
MgO25.0724.9924.5824.4623.1822.8122.6821.3219.6517.9614.56
FeOt8.358.217.237.536.497.368.537.569.885.485.82
TiO20.030.020.010.030.020.020.020.020.010.010.01
MnO0.120.110.160.120.120.140.170.130.170.080.13
CaO0.160.420.470.220.630.540.980.761.120.861.04
Na2O0.030.050.030.030.090.060.050.070.120.100.12
K2O0.110.080.070.050.110.220.160.250.230.190.11
Sum86.0285.4180.7578.7276.5284.7385.5280.4880.7368.4256.96
Data Set/Point1621293314223126231115
Numbers of cations based on O10(OH)8
Si2.993.063.062.943.213.313.383.403.453.433.31
Aliv1.010.940.941.060.790.690.620.600.550.570.69
Alvi1.451.421.351.301.341.601.521.551.541.651.58
Mg3.643.663.803.893.783.333.323.303.093.253.23
Fe *0.680.670.630.670.590.600.700.660.870.560.72
Ti0.000.000.000.000.000.000.000.000.000.000.00
Mn0.010.010.010.010.010.010.010.010.020.010.02
∑ Oct5.785.765.805.885.725.545.555.525.515.465.55
Ca0.020.040.050.030.070.060.100.080.130.110.17
Na0.010.010.010.010.020.010.010.010.020.020.03
K0.010.010.010.010.010.030.020.030.030.030.02
Int ch.0.050.110.120.060.180.150.240.220.310.280.38
Int. ch., interlayer charge. * All Fe has been considered as Fe2+.
Table 3. Representative structural formulae determined by SEM-EDS and TEM of chloritic mixed-layers normalised as chlorite. All Fe has been considered as Fe2+ for the formula calculation.
PointSEM-EDS Formulae
Site4Sp13[Si3.45Al0.54]4O10[Al1.63Mg2.63Fe1.10Mn0.02Ti0.02]5.42[K0.02Ca0.15]0.17(OH)8
Site3Sp3[Si3.30Al0.69]4O10[Al1.61Mg3.08Fe0.81Mn0.03]5.54[K0.04Ca0.08]0.12(OH)8
Site1Sp2[Si3.17Al0.82]4O10[Al1.34Mg3.73Fe0.63Mn0.02]5.74[K0.01Ca0.06]0.07(OH)8
Site6Sp22[Si3.28Al0.71]4O10[Al1.44Mg3.57Fe0.61]5.63[K0.03Ca0.07]0.10(OH)8
Site2Sp3[Si2.92Al1.07]4O10[Al1.19Mg3.11Fe1.62]5.93[K0.02Ca0.06]0.08(OH)8
Site6Sp15[Si3.15Al0.84]4O10[Al1.50Mg3.65Fe0.51]5.67[K0.02Ca0.03]0.05(OH)8
Site4Sp7[Si3.15Al0.84]4O10[Al1.34Mg3.83Fe0.56]5.74[K0.02Ca0.04]0.06(OH)8
Site6Sp2[Si3.05Al0.94]4O10[Al1.44Mg3.77Fe0.53]5.75[K0.01Ca0.03]0.04(OH)8
Site1 Sp14[Si2.93Al1.06]4O10[Al1.30Mg4.03Fe0.53]5.87[Ca0.01]0.01(OH)8
Sites.sp710[Si3.29Al0.70]4O10[Al1.36Mg2.67Fe1.63]5.67[Ca0.15]0.15(OH)8
Site1Sp9[Si2.99Al1]4O10[Al1.35Mg3.82Fe0.64]5.82[Ca0.02]0.02(OH)8
Site5Sp4[Si3.68Al0.31]4O10[Al1.91Mg2.71Fe0.57]5.20(OH)8
PointTEM Formulae
map1.35sp2[Si3.01Al0.98]4O10[Al1.44Mg3.40Fe0.91Mn0.01]5.77[Na0.01K0.03Ca0.07]0.11(OH)8
1002bsp1b[Si3.18Al0.81]4O10[Al1.58Mg3.43Fe0.57Mn0.01]5.61[K0.04Ca0.03]0.07(OH)8
1002bsp2b[Si3.88Al0.11]4O10[Al2.98Mg1.04Fe0.52Mn0.01]4.56[K0.06Ca0.10]0.16(OH)8
1011bsp1b[Si3.73Al0.26]4O10[Al2.85Mg1.57Fe0.27]4.70[Na0.04K0.04Ca0.06]0.14(OH)8
1352sp2[Si3.20Al0.79]4O10[Al1.54Mg3.17Fe0.90]5.62[Na0.03K0.01Ca0.19]0.23(OH)8
aro3sp4[Si3.15Al0.84]4O10[Al1.48Mg3.21Fe0.97]5.67[Na0.05K0.02Ca0.13]0.20(OH)8
1110sp1[Si3.09Al0.90]4O10[Al1.43Mg4.11Fe0.16Ti0.01]5.72[K0.05Ca0.09]0.14(OH)8
1039sp3[Si2.66Al1.33]4O10[Al1.25Mg4.46Fe0.30Mn0.01]6.04[Ca0.04]0.04(OH)8
1234225f[Si2.87Al1.12]4O10[Al1.38Mg3.91Fe0.58]5.87[K0.02Ca0.12]0.14(OH)8
1039sp1[Si2.94Al1.05]4O10[Al1.32Mg4.32Fe0.19]5.86[K0.01Ca0.02]0.03(OH)8
1039sp2[Si3.12Al0.87]4O10[Al1.44Mg3.98Fe0.27]5.71[K0.01Ca0.07]0.08(OH)8
1359sp3[Si2.87Al1.12]4O10[Al1.50Mg4.07Fe0.22]5.80(OH)8
Table 4. Tosudite structural formulae normalised to 50 charges (28 from chlorite + 22 from smectite).
PointSiAlivAlviAlMgFe *MnTi∑octNaKCa∑c.int.
SP2b6.741.264.145.41.810.910.020.006.890.000.120.180.47
SP76.681.324.125.441.970.840.000.006.930.030.330.070.51
SP186.681.324.125.441.970.840.000.006.930.030.330.070.51
SP286.641.364.025.392.000.940.000.006.970.000.100.180.46
SP16.781.224.435.652.250.380.000.007.050.000.090.110.31
SP1b6.561.444.045.472.760.480.000.007.270.080.080.110.39
* All Fe has been considered as Fe3+. Oct, octahedral occupancy; Int., interlayer charge.
Disclaimer/Publisher’s Note: The statements, opinions and data contained in all publications are solely those of the individual author(s) and contributor(s) and not of MDPI and/or the editor(s). MDPI and/or the editor(s) disclaim responsibility for any injury to people or property resulting from any ideas, methods, instructions or products referred to in the content.

