

Geochemical Variations of Kerolite, Stevensite, and Saponite from the Pre-Salt Sag Interval of the Santos Basin: An Approach Using Electron Probe Microanalysis

 ,
,  ,
,  ,
,  ,
,  , , , and
Abstract
1. Introduction
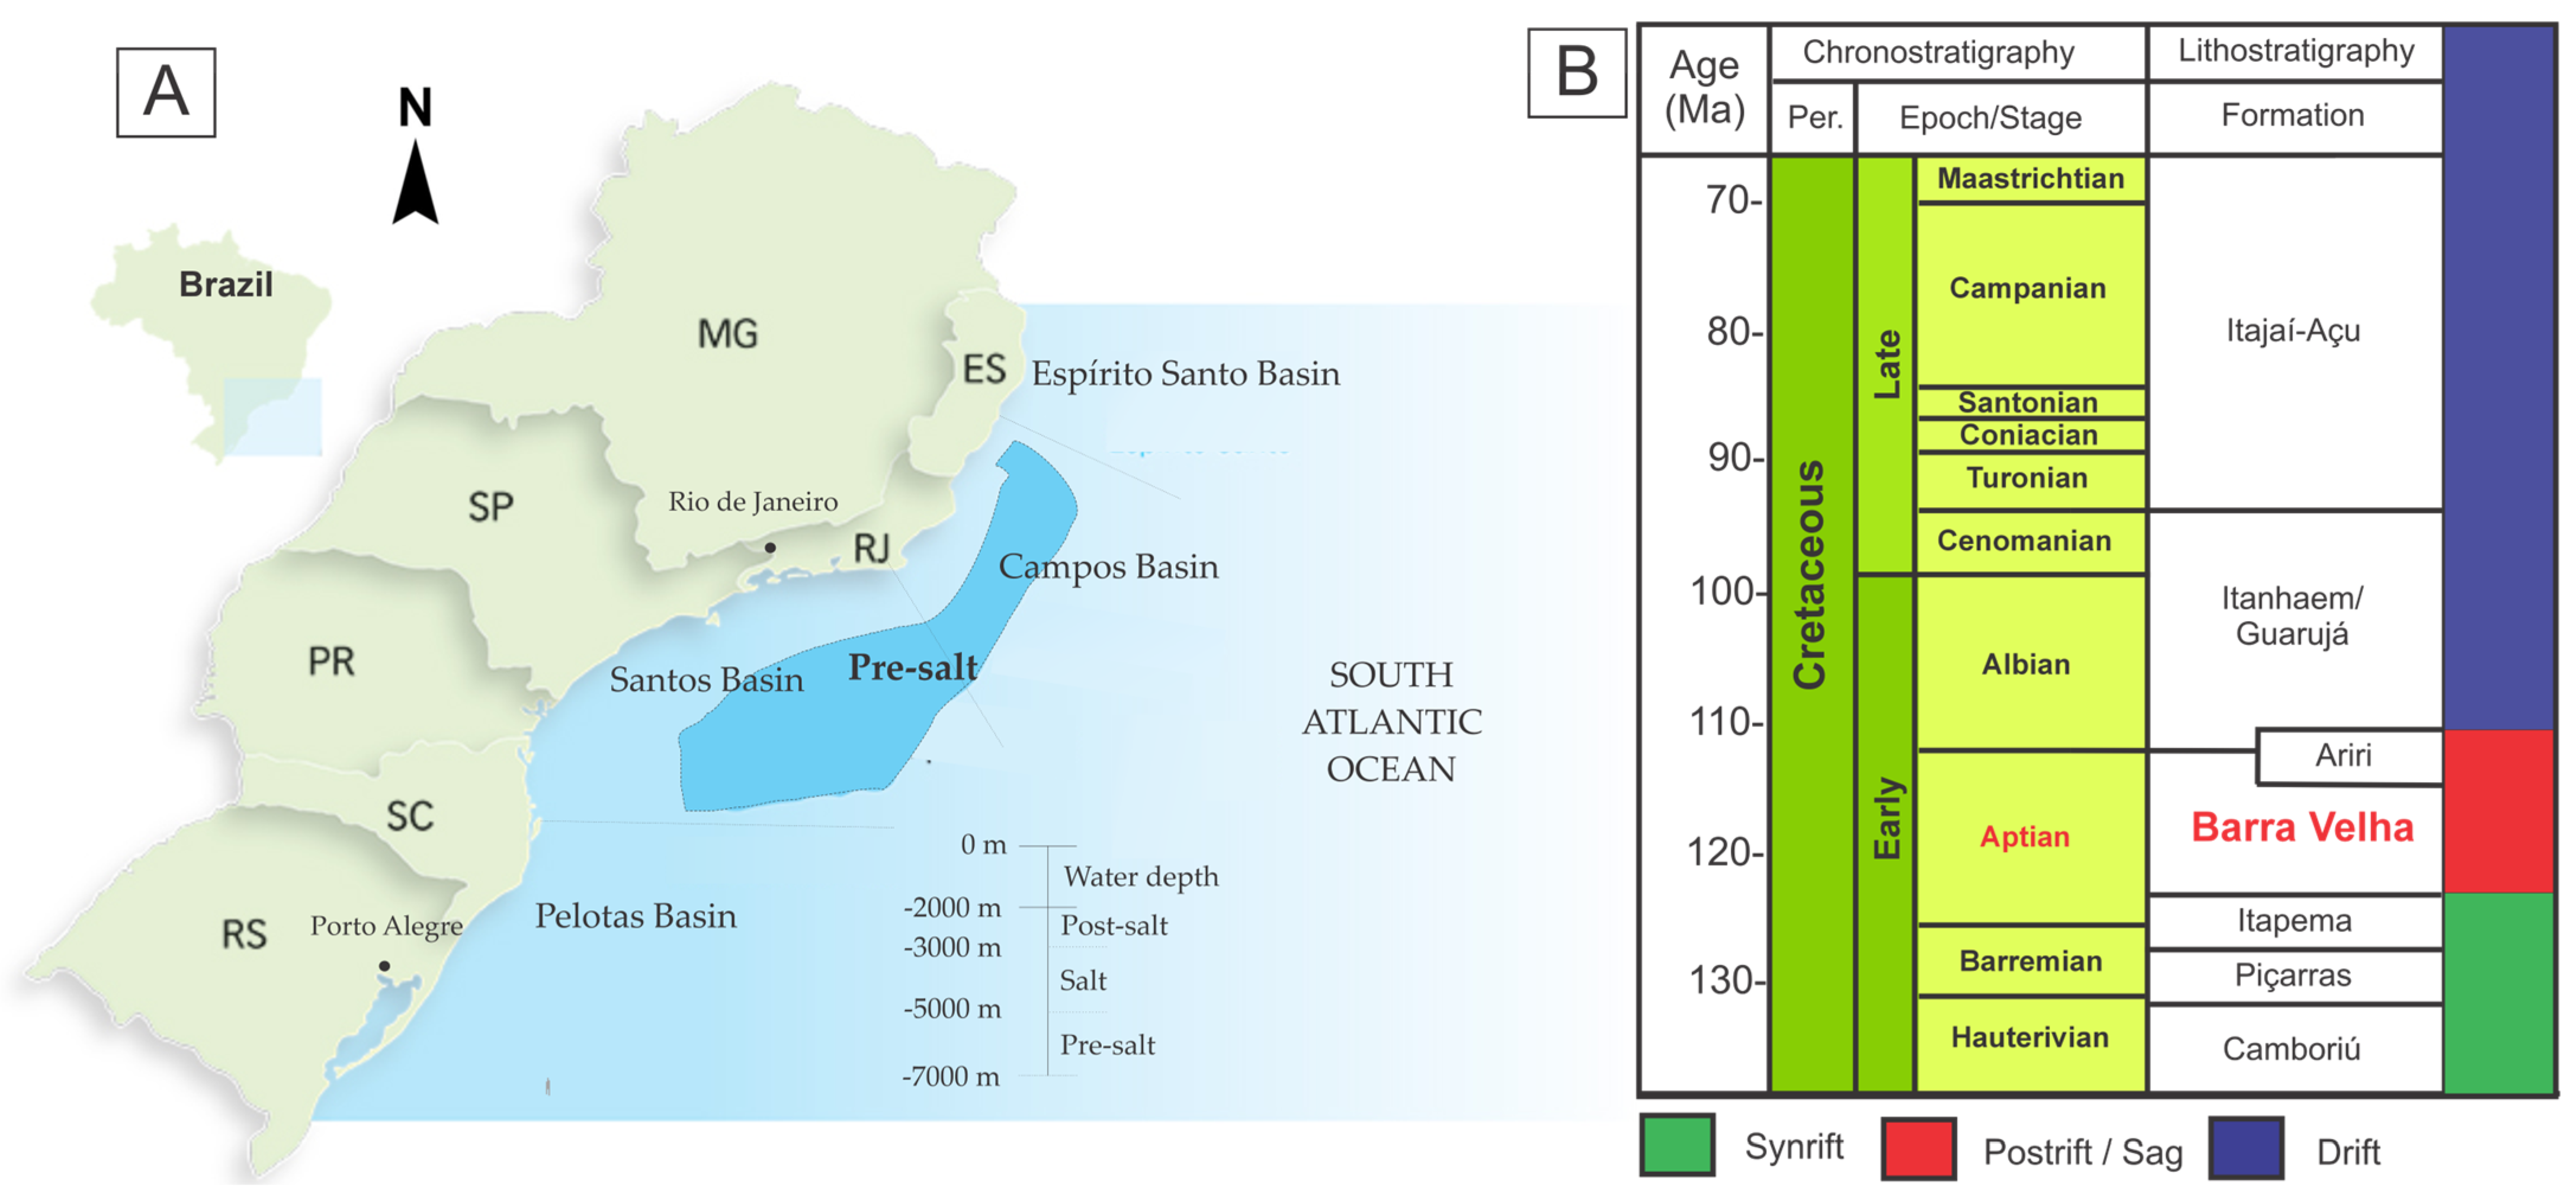
Geologial Setting
2. Materials and Methods
3. Results
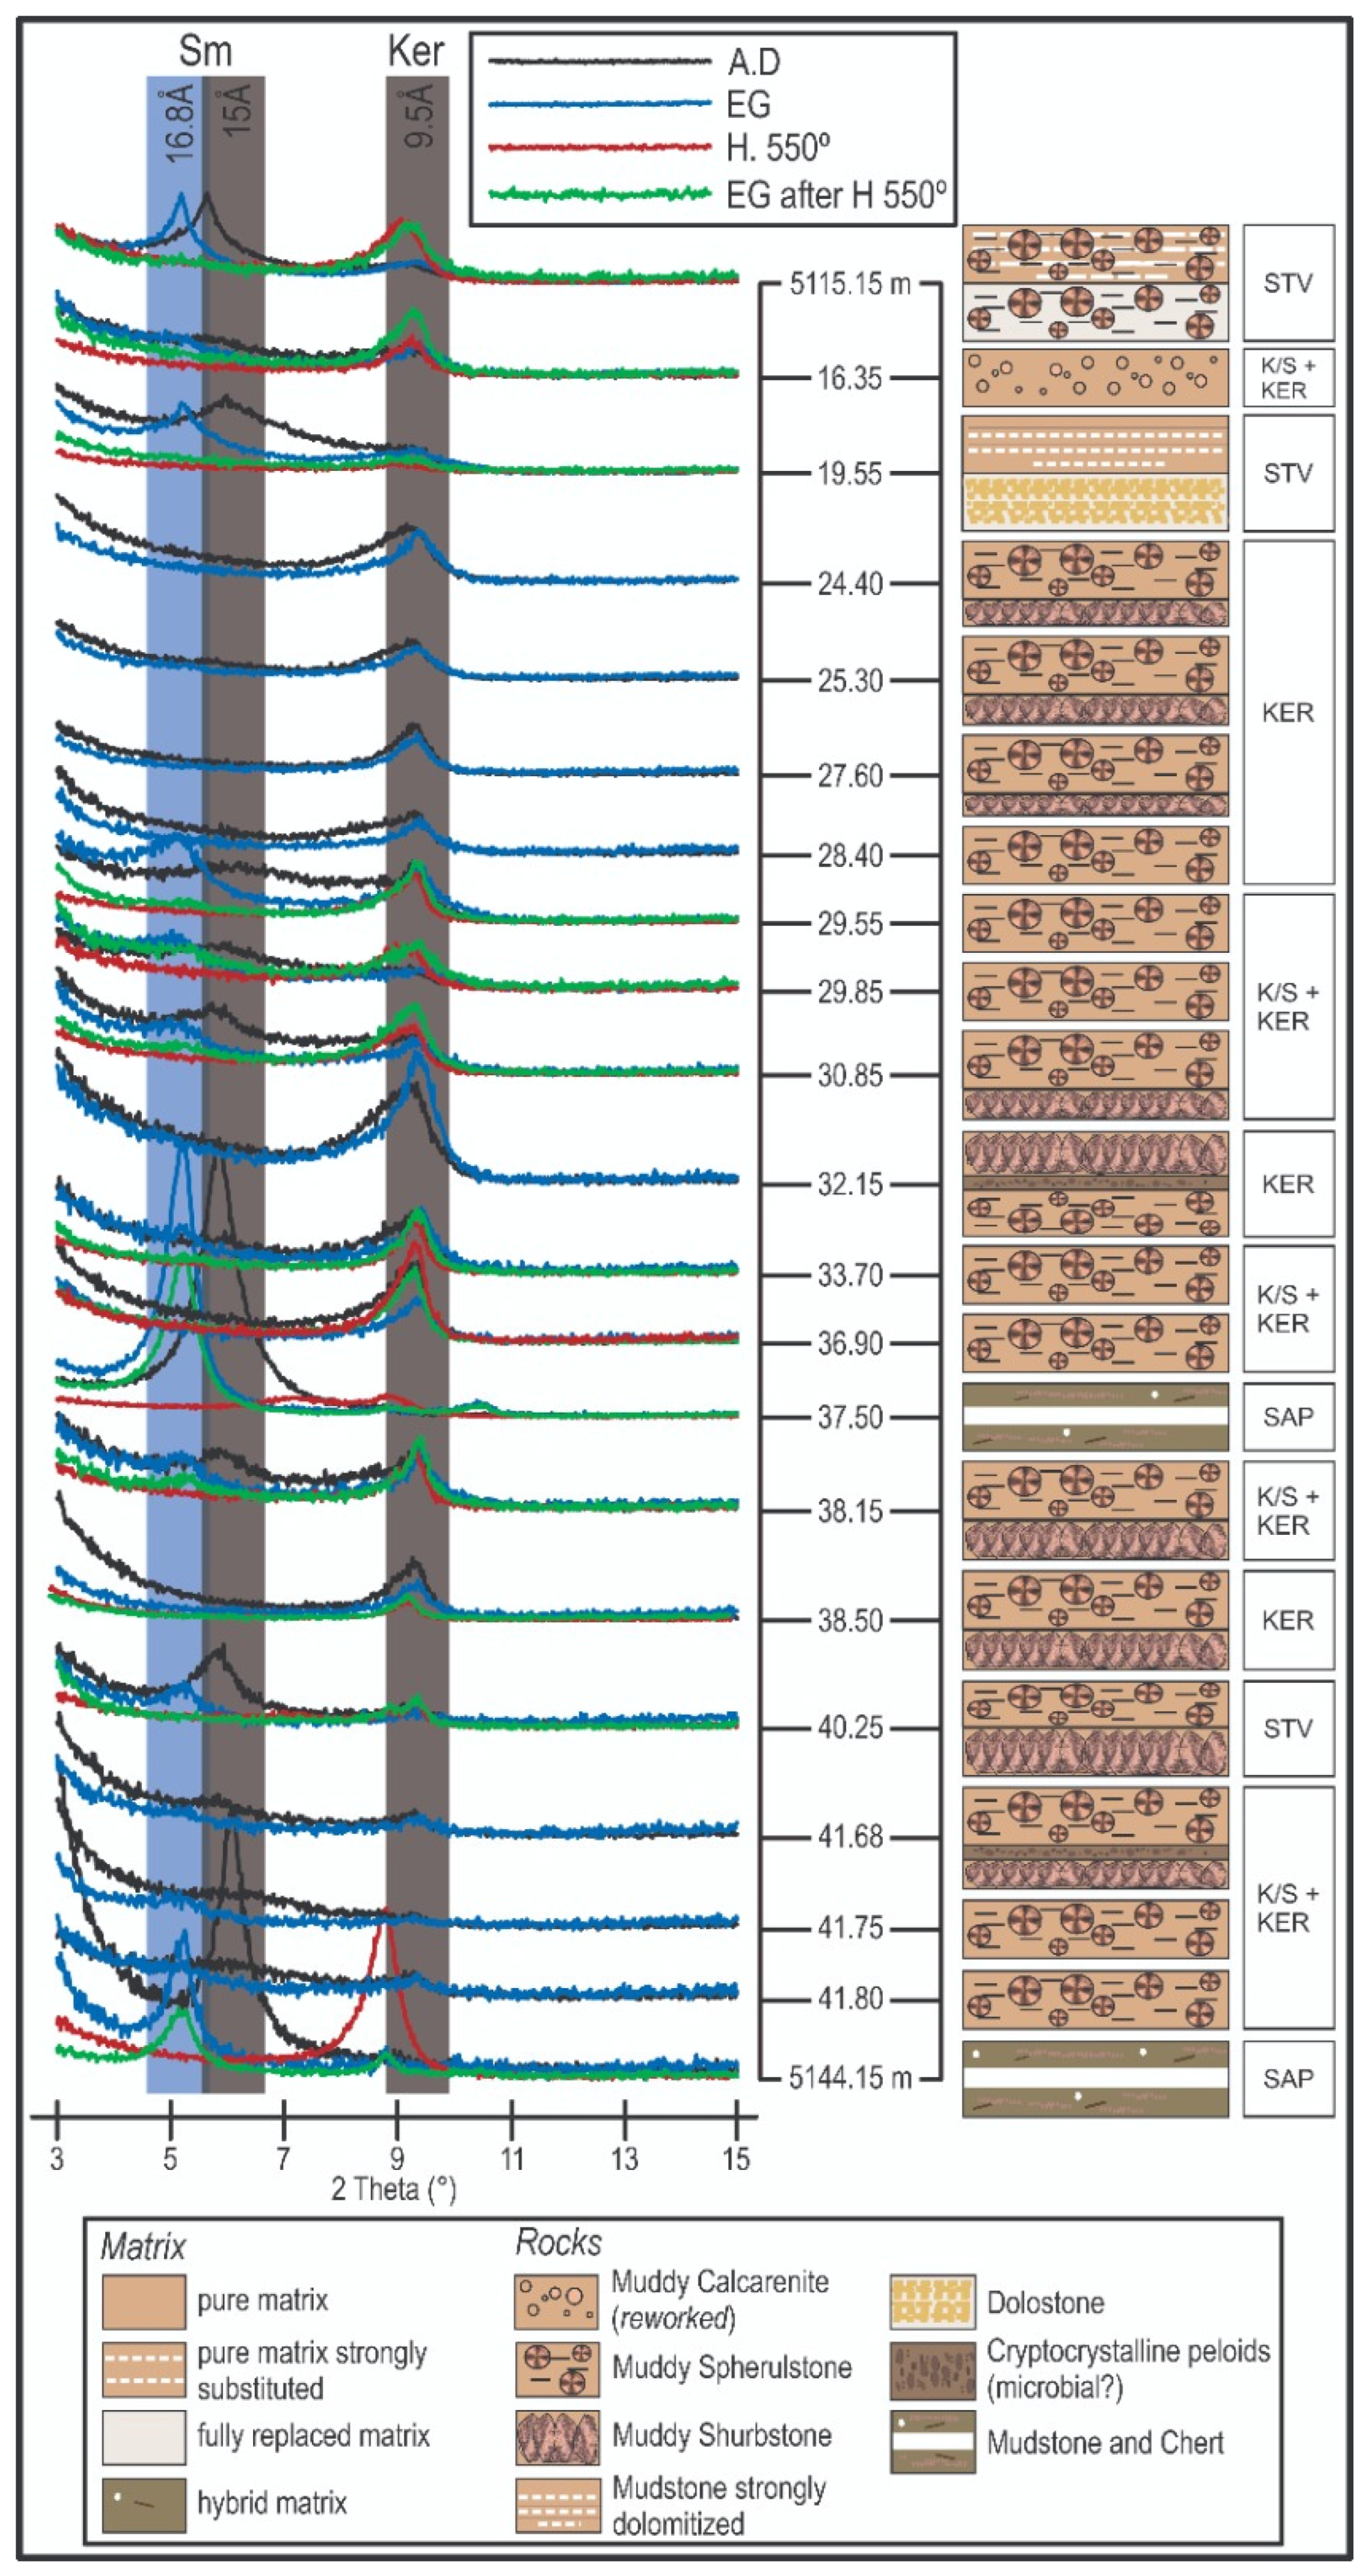
3.1. Mineralogy
3.2. Clay Minerals and Assemblages
3.3. In Situ Morphochemistry
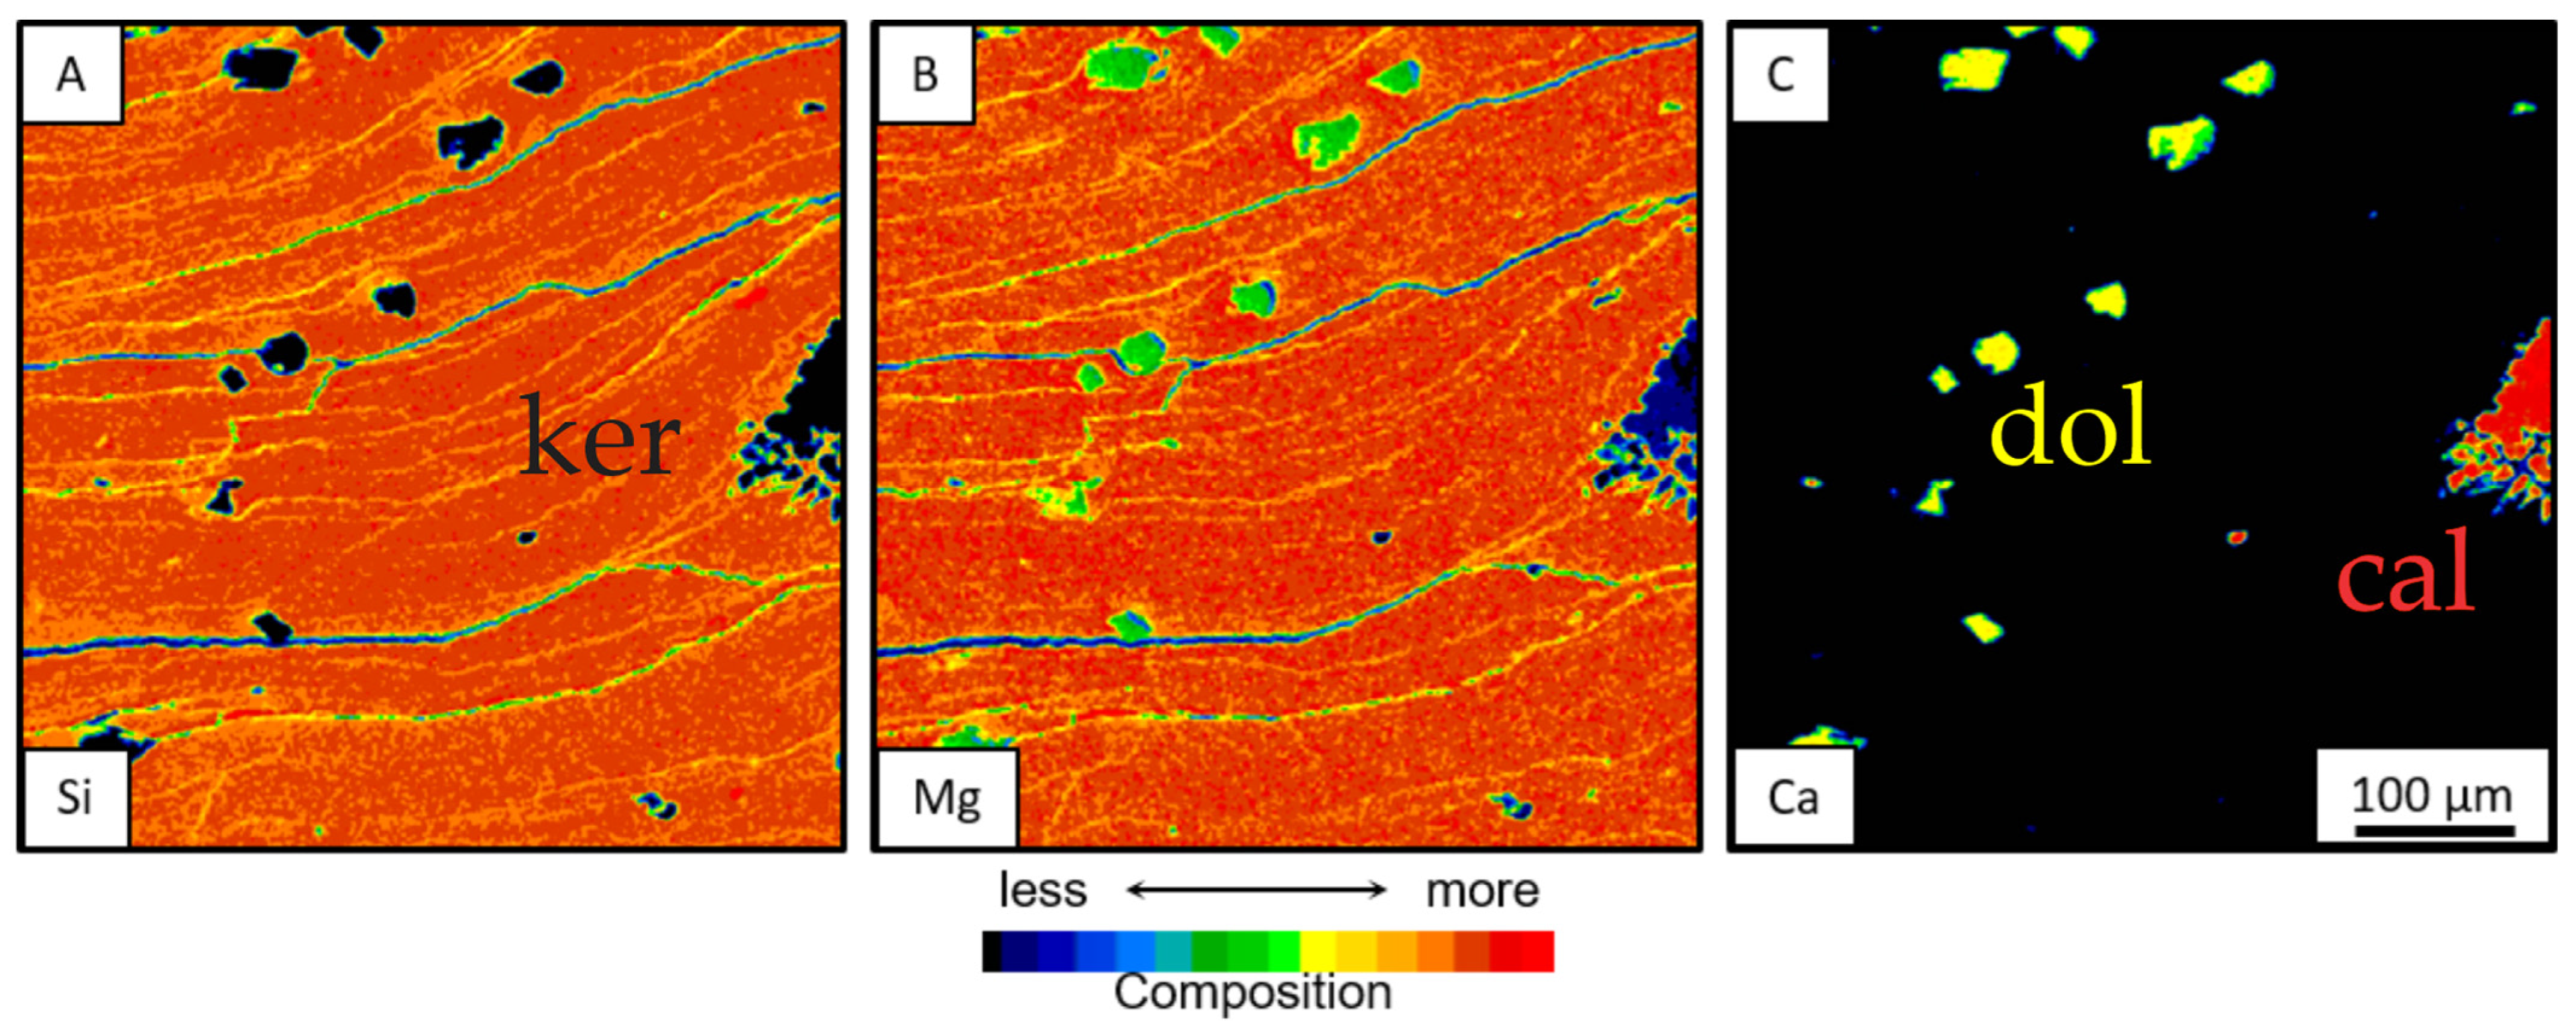
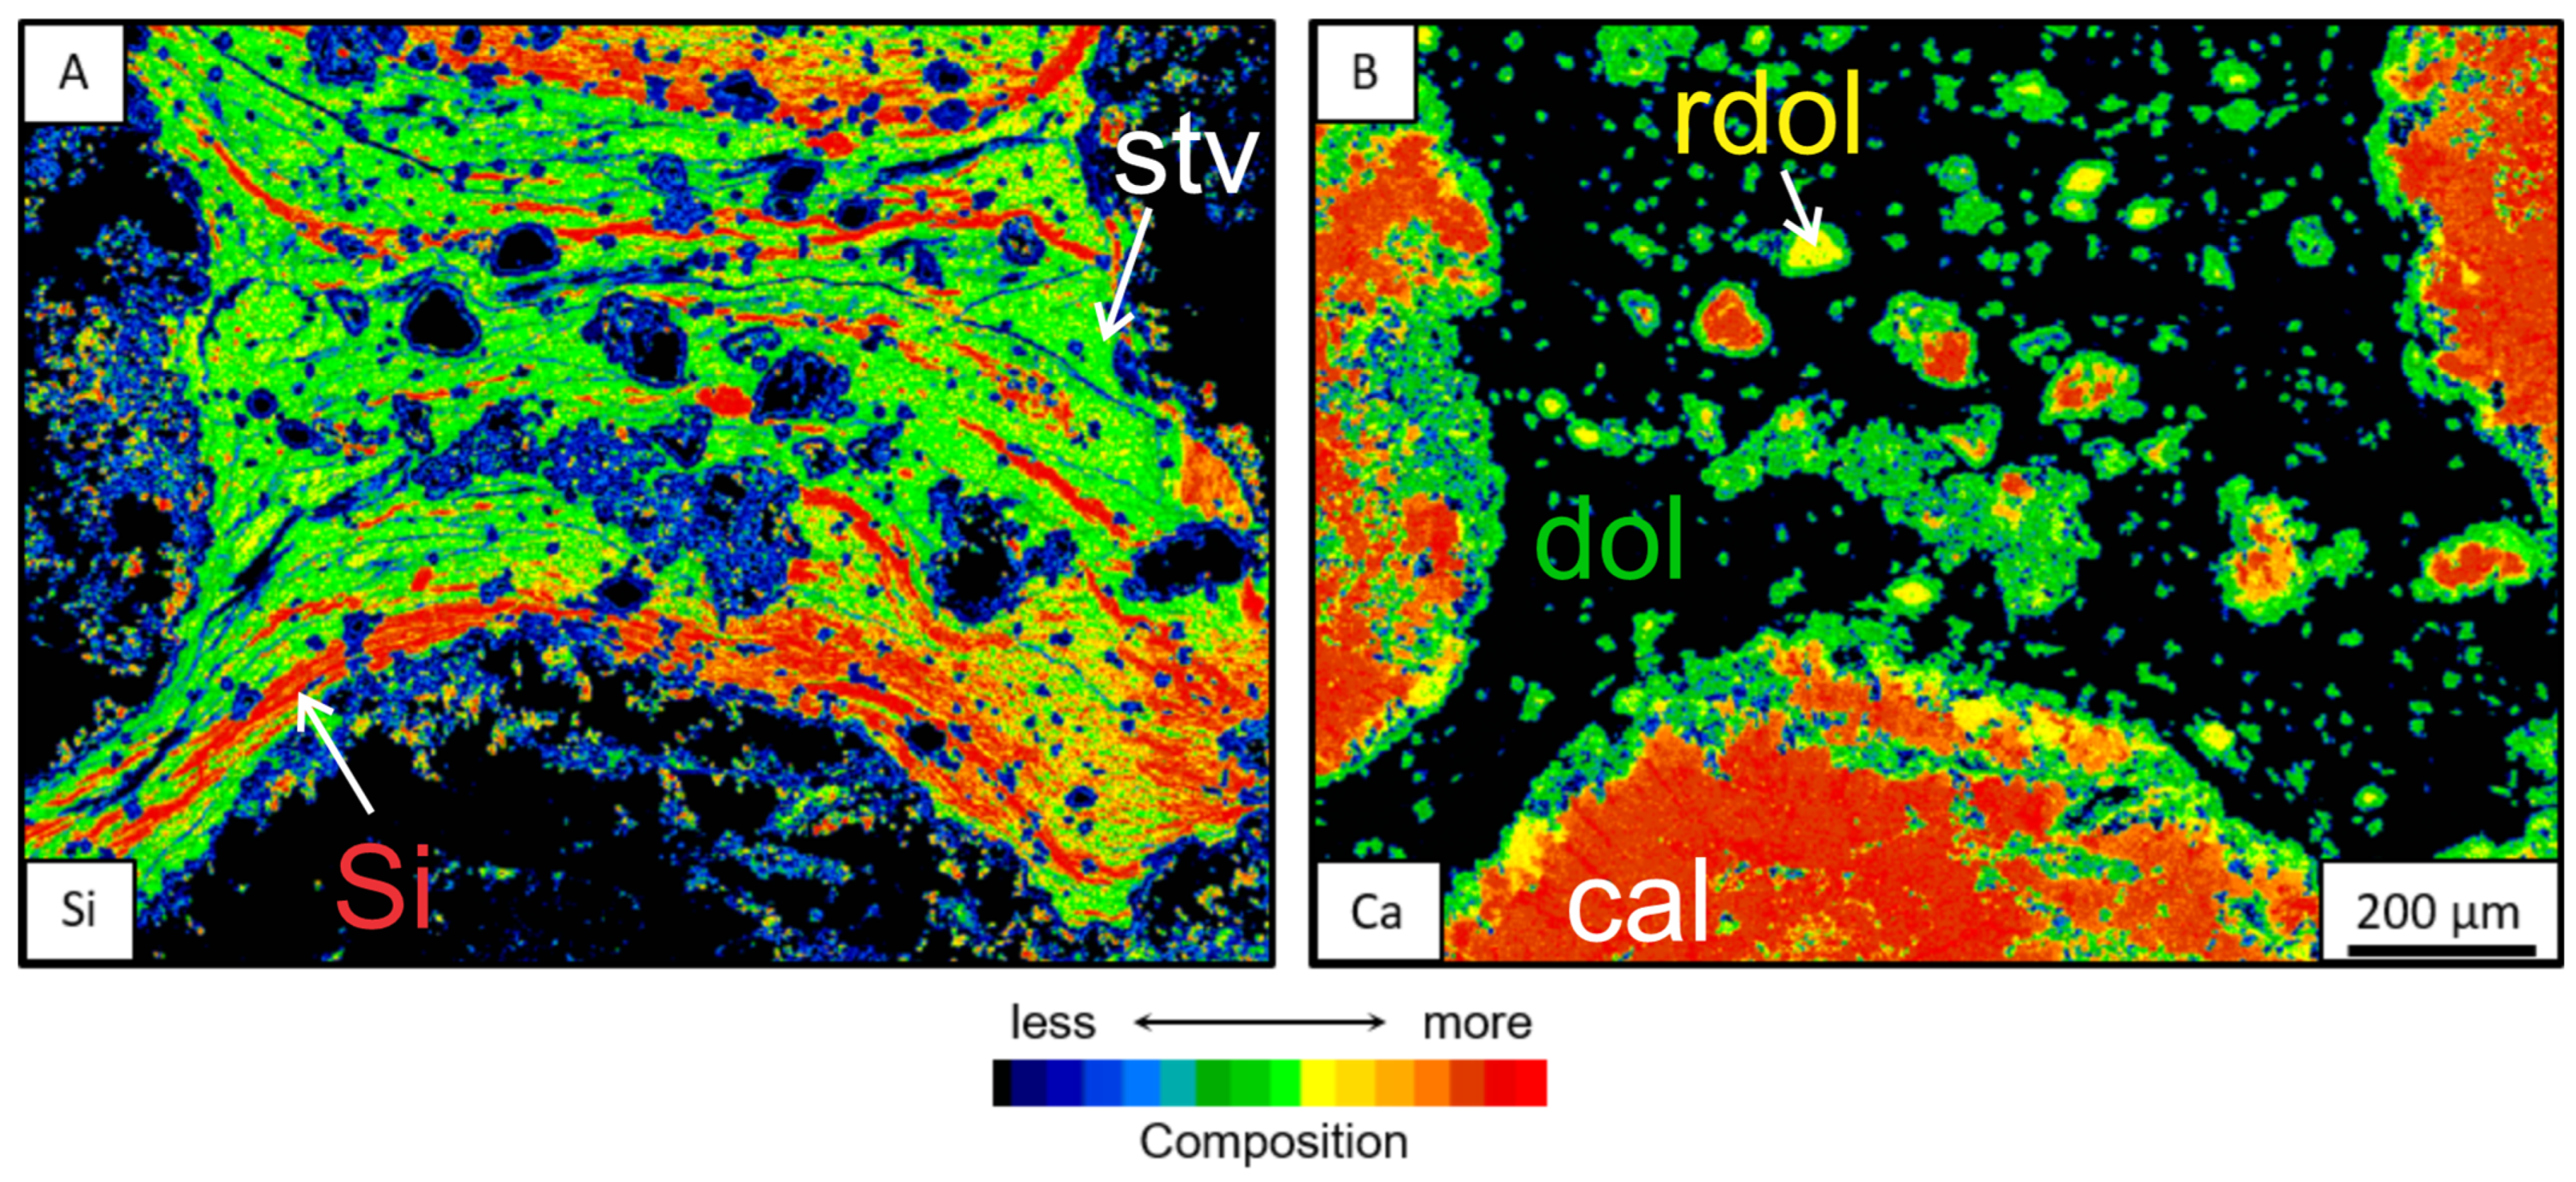
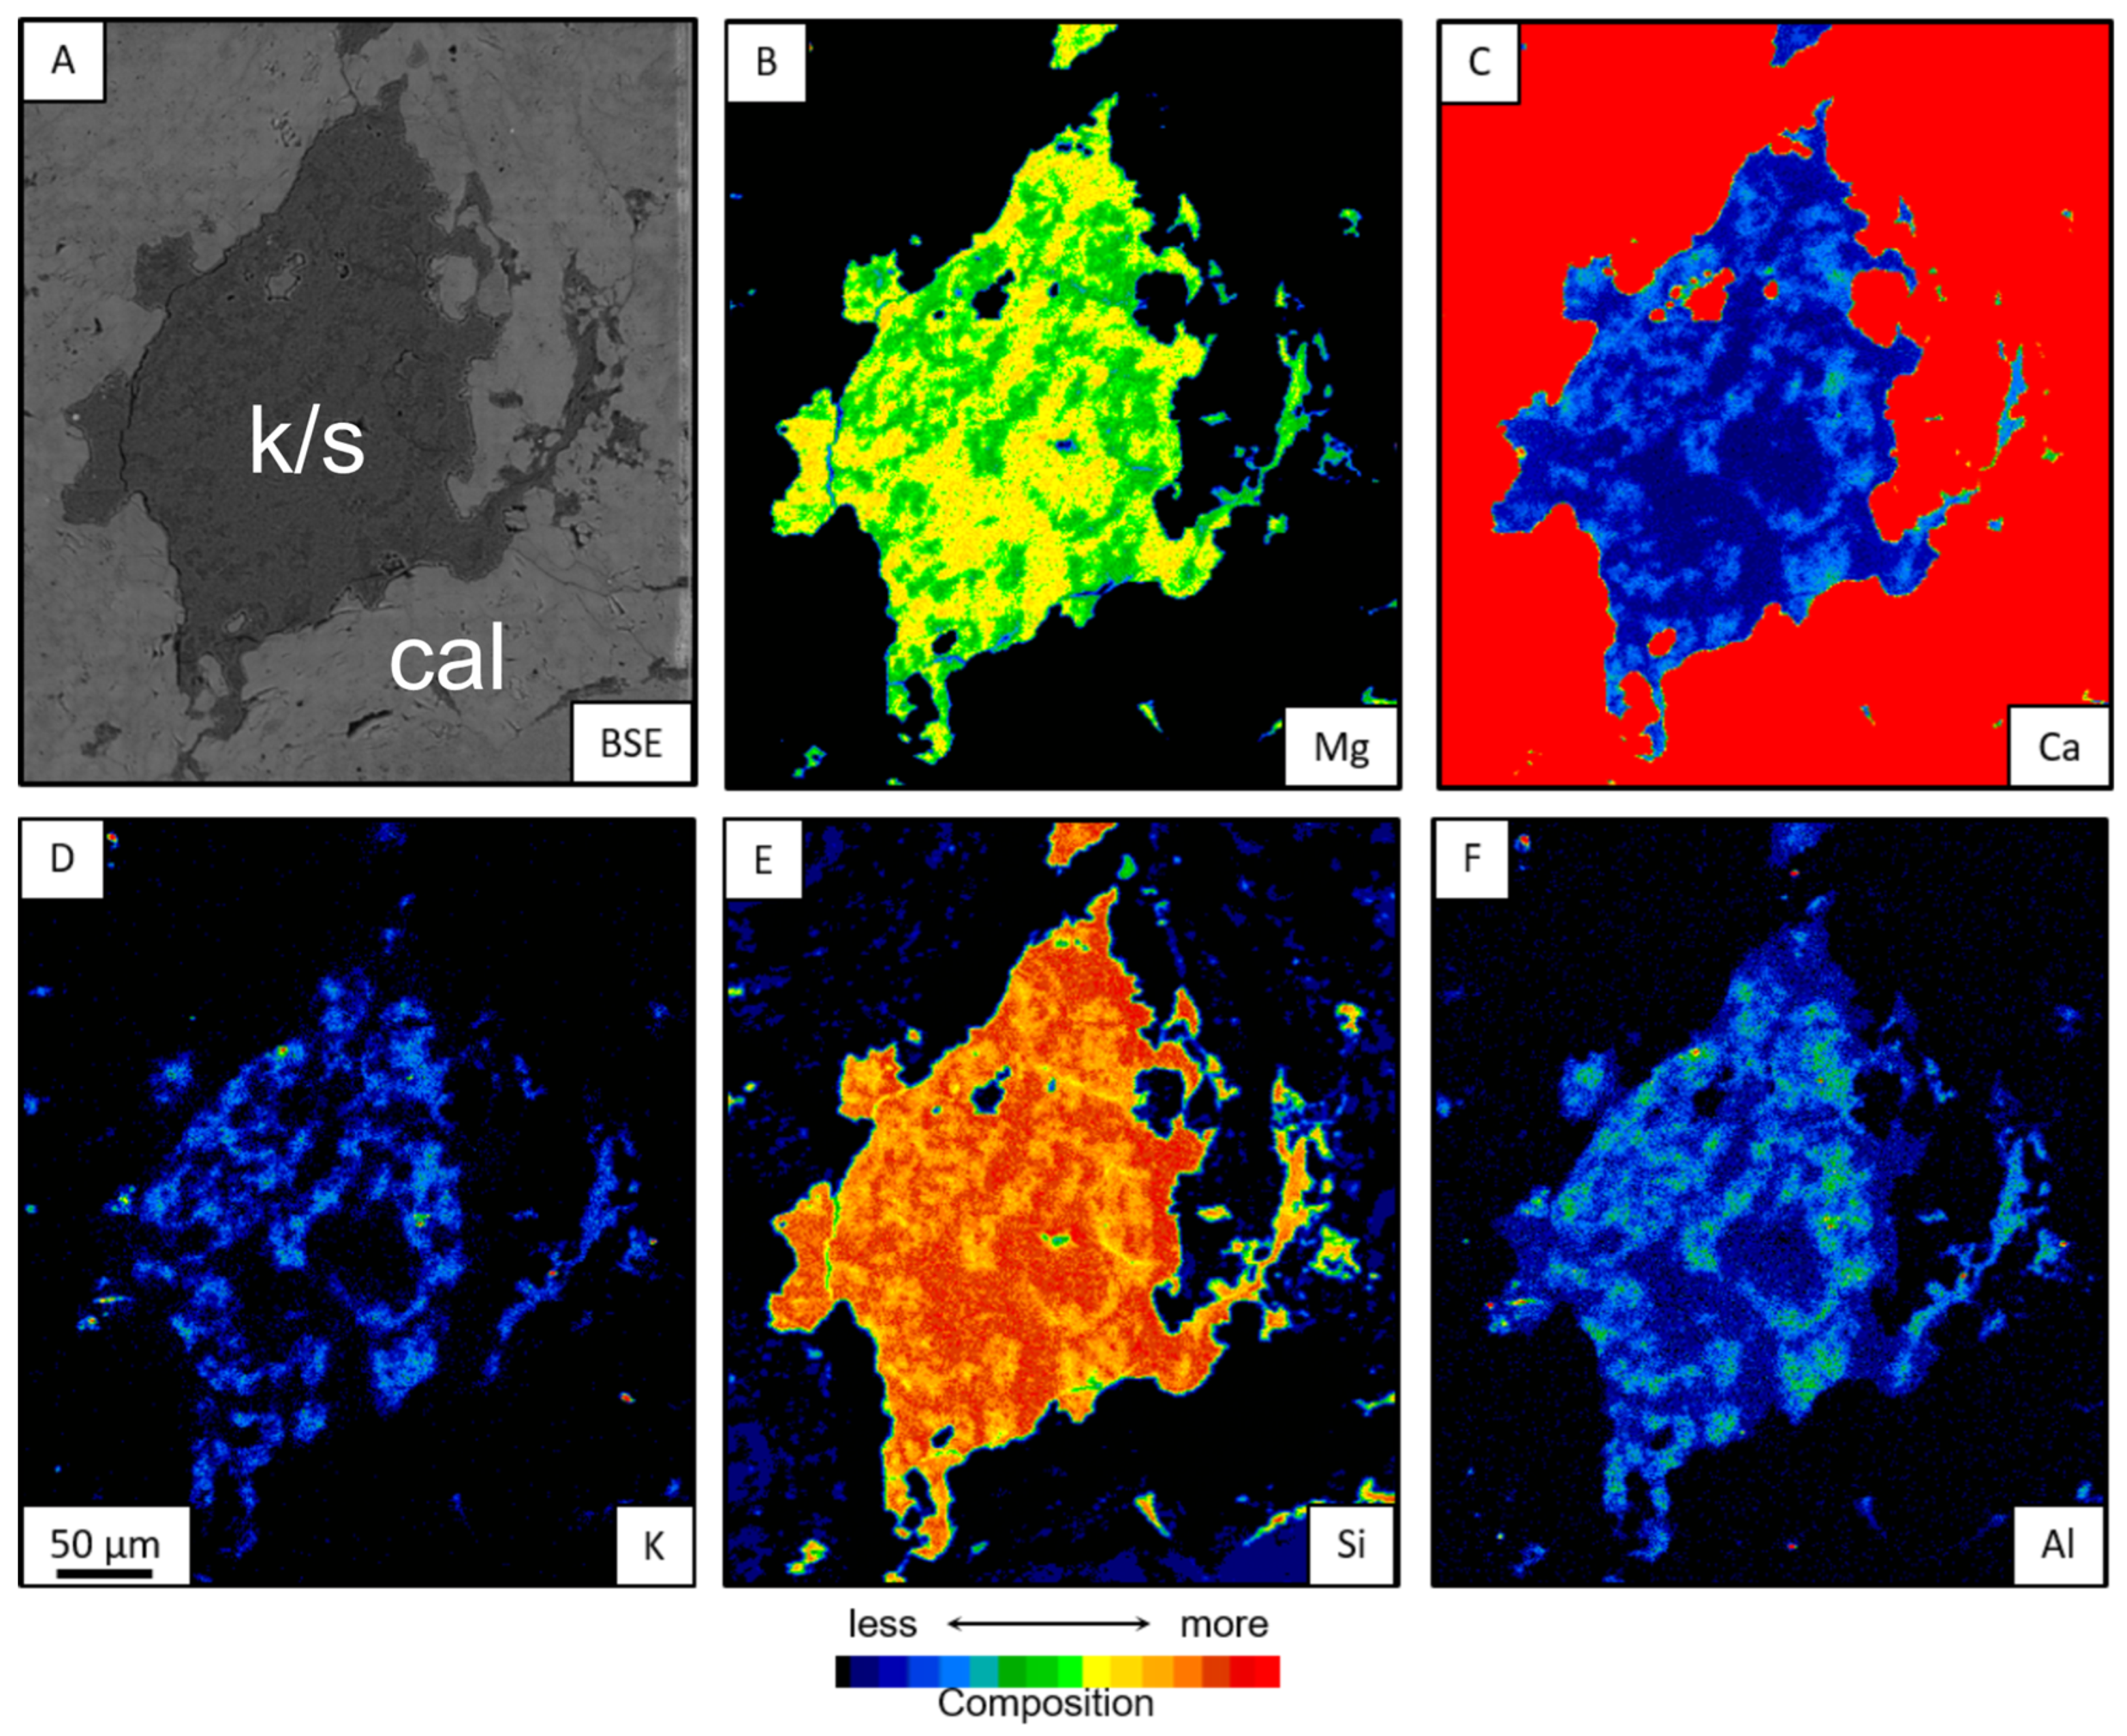
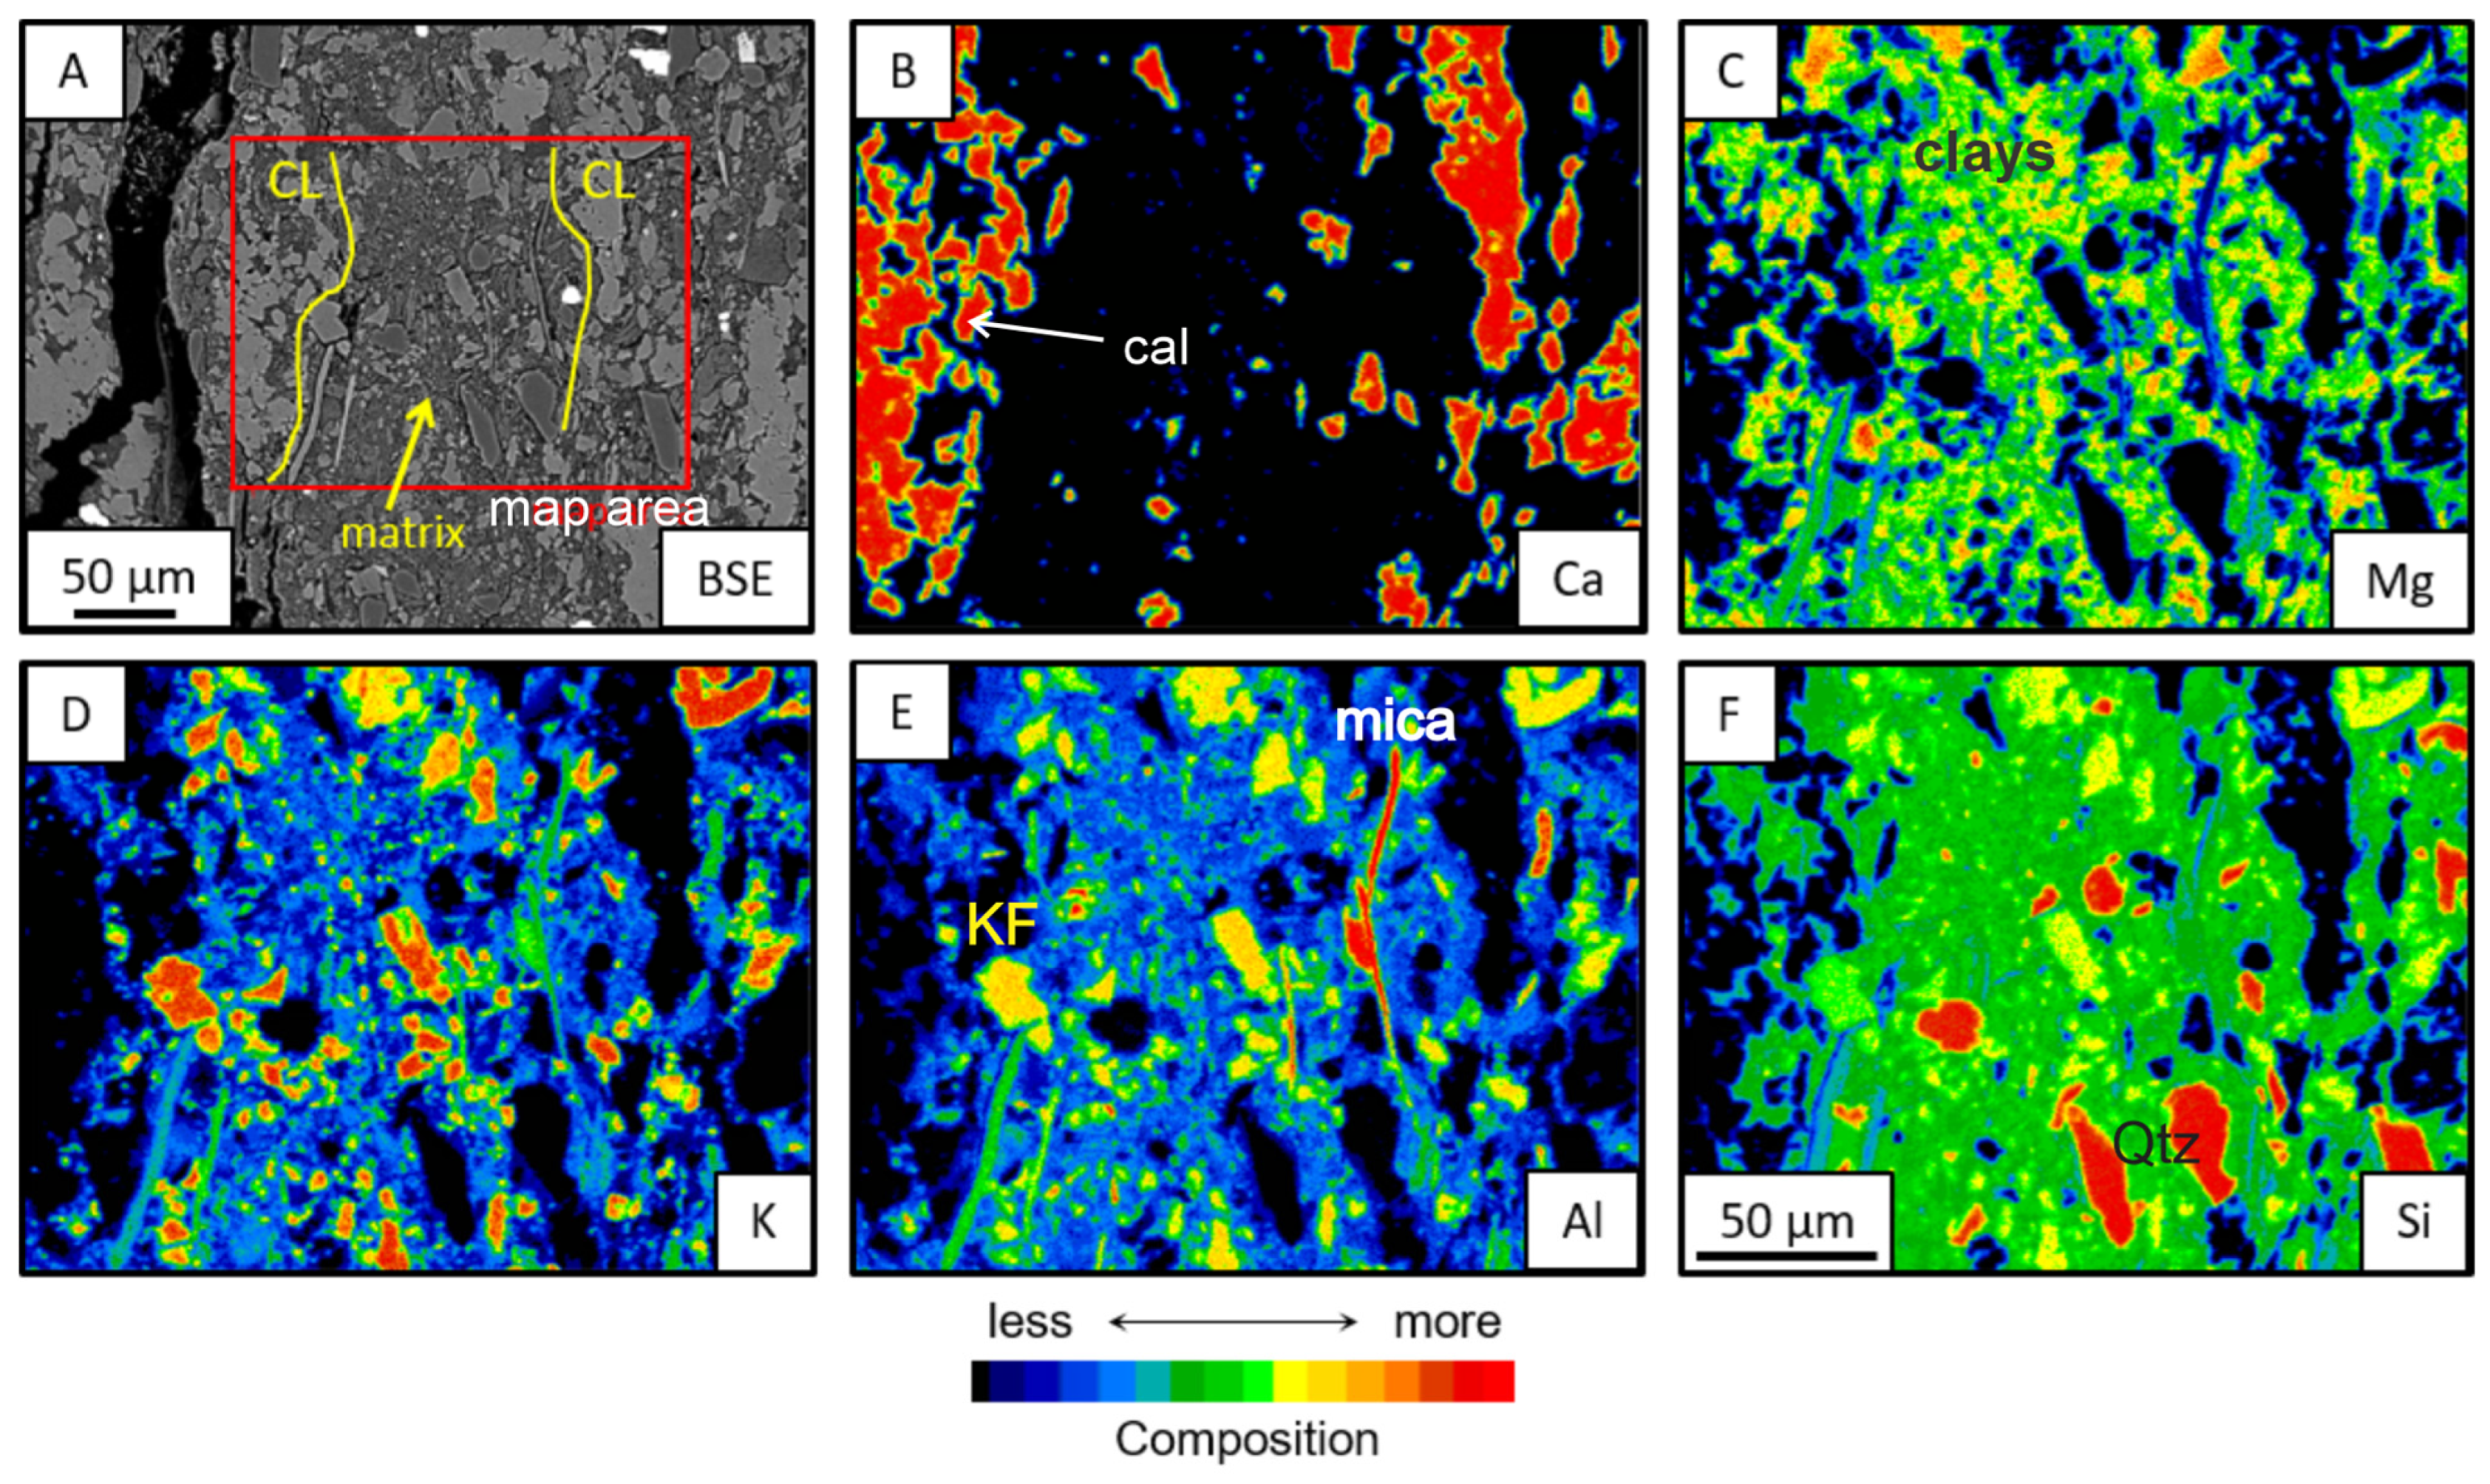
3.3.1. Mineral Chemistry and Chemical Mapping
3.3.2. Morphologies of Clay Aggregates
4. Discussion
5. Conclusions
- It is not possible to determine the precursor clay mineral for the phases studied, as all have undergone burial of approximately 5 km deep for over 100 million years. Clay minerals are sensitive and reactive, especially magnesian ones, which are more disordered and exposed to lake fluids under initial conditions. Additionally, the differences between kerolite and stevensite are subtle, and one phase can easily shift to the stability field of the other.
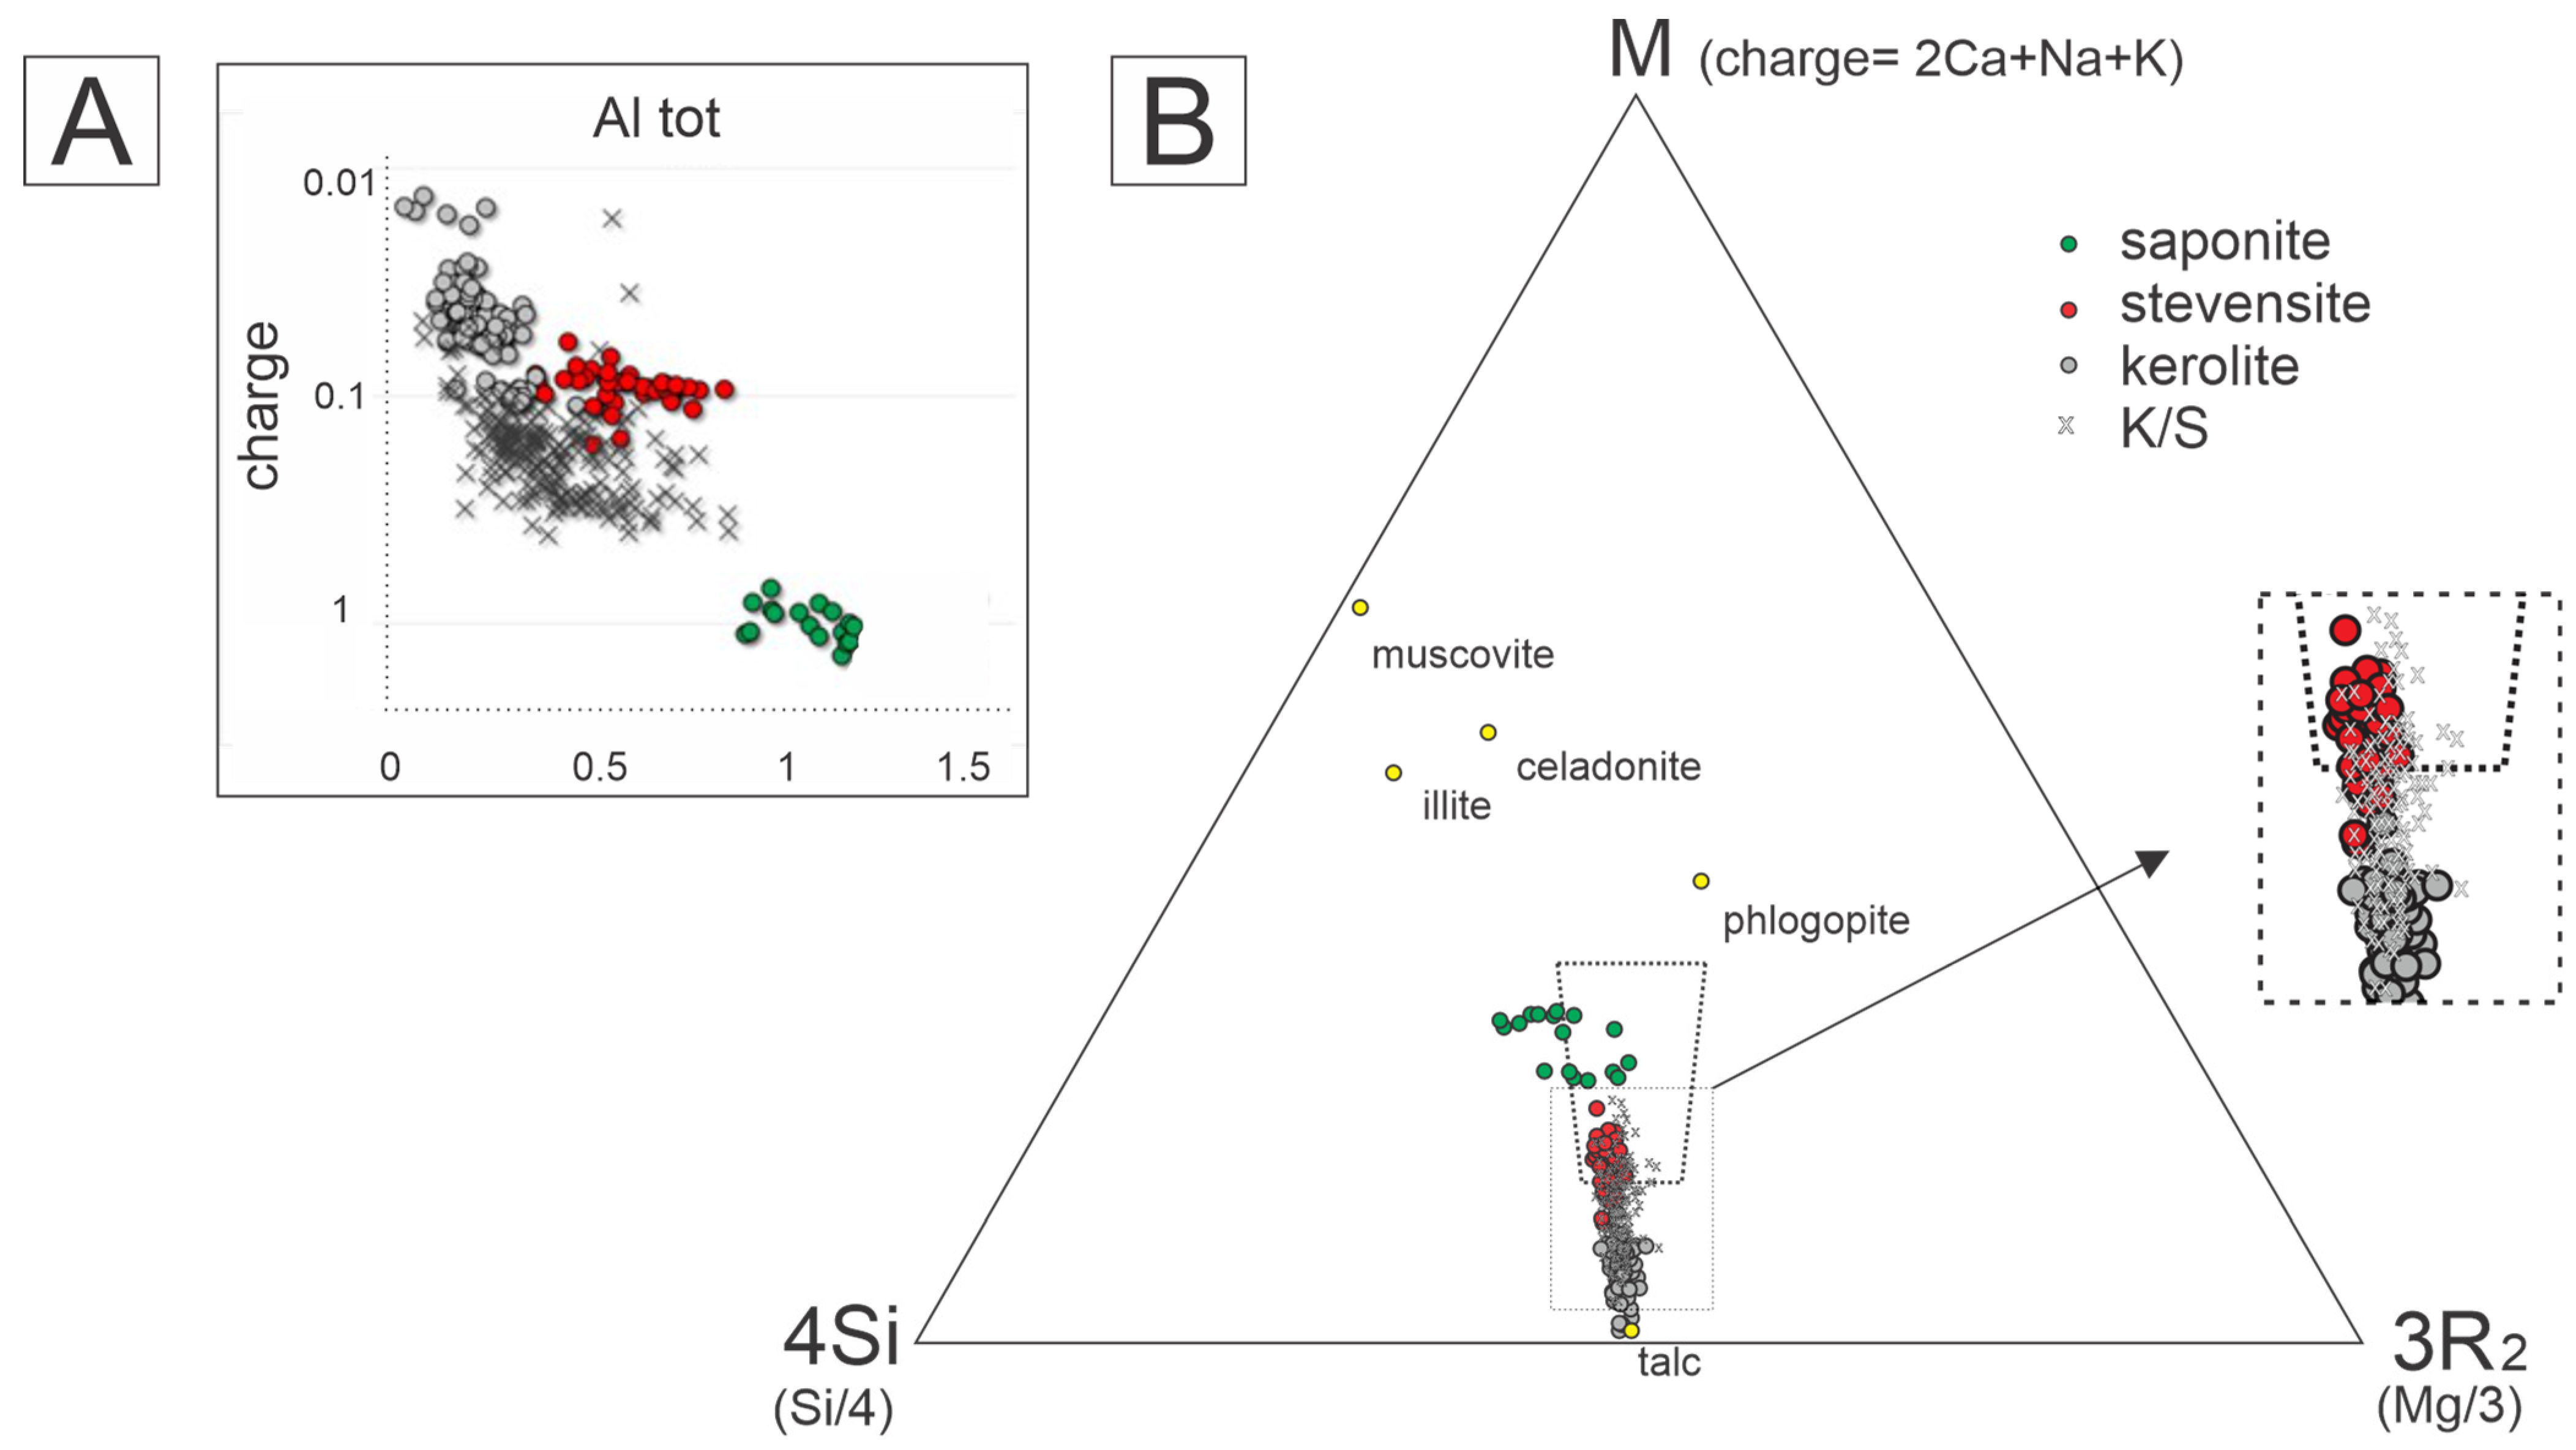
- Saponite is easily distinguishable, with significantly higher values of Al, Fe, and K and lower values of Si and Mg. In the studied rocks, it is consistently associated with detrital minerals, suggesting it may either be a product of the transformation of these minerals or, in part, a detrital clay mineral deposited in the system.
- Stevensite is distinguished from the other phases by its intermediate charge and very low Al content. It is always associated with kerolite in varying proportions. When dominant, it is closely linked to dolomitization and silicification processes, suggesting possible stabilization under these conditions.
- Kerolite is the most abundant clay mineral in the interval and is characterized by a minimal Al content and charge. When occurring in its pure form, it is observed to be free from more intense transformation processes, with only sporadic rhombohedral dolomite, indicating that it was less affected by later diagenetic processes.
- The interstratified K/S mixed layer occurs exclusively with kerolite. In the microsites, it appears as a meta-stable aggregate with two compositions: one intermediate between kerolite and stevensite, and the other equivalent to kerolite. These samples show dolomitization, silicification, and late calcite processes, with varying degrees of matrix substitution, but always with lower intensity compared to the assemblies where stevensite predominates.
- Electron probe microanalysis (EPMA) proved to be an essential tool for in situ chemical analysis, enabling the distinction of clay compositions especially in complex assemblages of strongly interrelated phases. Chemical WDS mapping is a powerful approach to visualizing the elements mobility and distribution and clarifying the processes and products of reactions in microsites scale. Future research should explore additional assemblages and micro-sites from other pre-salt targets (such as the Campos Basin) and analogous areas to validate the findings and proposals made in this study.
Author Contributions
Funding
Data Availability Statement
Acknowledgments
Conflicts of Interest
References
- Pozo, M.; Casas, J. Origin of Kerolite and Associated Mg Clays in Palustrine-Lacustrine Environments. The Esquivias Deposit (Neogene Madrid Basin, Spain). Clay Miner. 1999, 34, 395–418. [Google Scholar] [CrossRef]
- Suquet, H.; de la Calle, C.; Pezerat, H. Swelling and Structural Organization of Saponite. Clays Clay Miner. 1975, 23, 1–9. [Google Scholar] [CrossRef]
- Vidales, J.; Navarro, F.J.; Pozo, M.; Alia, J.M.; Rull, F. Kerolite-Stevensite Mixed-Layers from the Madrid Basin, Central Spain. Clay Miner. 1991, 26, 329–342. [Google Scholar] [CrossRef]
- Eberl, D.D.; Jones, B.F.; Khoury, H.N. Mixed-Layer Kerolite/Stevensite from the Amargosa Desert, Nevada. Clays Clay Miner. 1982, 30, 321–326. [Google Scholar] [CrossRef]
- Hay, R.L.; Hughes, R.E.; Kyser, T.K.; Glass, H.D.; Liu, J. Magnesium-Rich Clays of the Meerschaum Mines in the Amboseli Basin, Tanzania and Kenya. Clays Clay Miner. 1995, 43, 455–466. [Google Scholar] [CrossRef]
- Cuevas, J.; de la Villa, R.V.; Ramirez, S.; Petit, S.; Meunier, A.; Leguey, S. Chemistry of Mg Smectites in Lacustrine Sediments from the Vicalvaro Sepiolite Deposit, Madrid Neogene Basin (Spain). Clays Clay Miner. 2003, 51, 457–472. [Google Scholar] [CrossRef]
- Benhammou, A.; Tanouti, B.; Nibou, L.; Yaacoubi, A.; Bonnet, J.-P. Mineralogical and Physicochemical Investigation of Mg-Smectite from Jbel Ghassoul, Morocco. Clays Clay Miner. 2009, 57, 264–270. [Google Scholar] [CrossRef]
- Rhouta, B.; Kaddami, H.; Elbarqy, J.; Amjoud, M.; Daoudi, L.; Maury, F.; Senocq, F.; Maazouz, A.; Gerard, J.-F. Elucidating the Crystal-Chemistry of Jbel Rhassoul Stevensite (Morocco) by Advanced Analytical Techniques. Clay Miner. 2008, 43, 393–403. [Google Scholar] [CrossRef]
- Da Silva, M.D.; Gomes, M.E.B.; Mexias, A.S.; Pozo, M.; Drago, S.M.; Célia, R.S.; Silva, L.A.C.; Netto, P.; Gomes, L.B.; Porcher, C.C.; et al. Mineralogical Study of Levels with Magnesian Clay Minerals in the Santos Basin, Aptian Pre-Salt Brazil. Minerals 2021, 11, 970. [Google Scholar] [CrossRef]
- Netto, P.R.A. Mg-Clay Minerals as Stratigraphic Proxies for the Paleoenvironmental Interpretation of the Barra Velha Formation (Lower Cretaceous) of the Santos Basin. Ph.D. Thesis, UFRJ, Rio de Janeiro, Brazil, 2022. (In Portuguese). [Google Scholar]
- Ramnani, C.; Ferreira Santos, J.; Parizek-Silva, Y.; Madrucci, V.; Santos, M.; de Araújo, C.C. Diagenesis of Magnesian Clay Minerals in Santos Basin (Aptian). In Proceedings of the AIPEA—XVII International Clay Conference, Istanbul, Turkey, 25–29 July 2022. [Google Scholar]
- Torsvik, T.H.; Rousse, S.; Labails, C.; Smethurst, M.A. A New Scheme for the Opening of the South Atlantic Ocean and the Dissection of an Aptian Salt Basin. Geophys. J. Int. 2009, 177, 1315–1333. [Google Scholar] [CrossRef]
- Moulin, M.; Aslanian, D.; Unternehr, P. A New Starting Point for the South and Equatorial Atlantic Ocean. Earth-Sci. Rev. 2010, 98, 1–37. [Google Scholar] [CrossRef]
- Moreira, J.L.; Madeira, C.V.; Gil, J.A.; Machado, M.A. Bacia de Santos. In Boletim de Geociências da Petrobras: Cartas Estratigraficas; Petrobras: Rio de Janeiro, Brazil, 2007; Volume 15, pp. 531–550. ISBN 0102-9304. [Google Scholar]
- Mizusaki, A.M.P.; Petrini, R.; Bellieni, P.; Comin-Chiaramonti, P.; Dias, J.; De Min, A.; Piccirillo, E.M. Basalt Magmatism along the Passive Continental Margin of SE Brazil (Campos Basin). Contrib. Mineral. Petrol. 1992, 111, 143–160. [Google Scholar] [CrossRef]
- Buckley, J.P.; Bosence, D.; Elders, C. Tectonic Setting and Stratigraphic Architecture of an Early Cretaceous Lacustrine Carbonate Platform, Sugar Loaf High, Santos Basin, Brazil. Geol. Soc. Spec. Publ. 2015, 418, 175–191. [Google Scholar] [CrossRef]
- Arienti, L.; Souza, R.; Viana, S.; Cuglieri, M.; Silva, R.; Tonietto, S.; Paula, L.; Gil, J. Facies Association, Depositional Systems, and Paleophysiografic Models of the Barra Velha Formation, Pre-Salt Sequence -Santos Basin, Brazil. In Proceedings of the AAPG ACE 2018, Salt Lake City, UT, USA, 23–25 July 2018. [Google Scholar]
- Petrology of the Hydrothermal and Evaporitic Continental Cretaceous (Aptian) Pre-Salt Carbonates and Associated Rocks, South Atlantic Santos Basin, Offshore Brazil. Available online: https://www.searchanddiscovery.com/abstracts/html/2018/ace2018/abstracts/2835691.html (accessed on 1 April 2024).
- Wright, V.P.; Barnett, A.J. The Textural Evolution and Ghost Matrices of the Cretaceous Barra Velha Formation Carbonates from the Santos Basin, Offshore Brazil. Facies 2019, 66, 7. [Google Scholar] [CrossRef]
- Dias, J.L. Tectonic, Stratigraphy and Sedimentation during the Aptian along the Brasilian Eastern Margin [Tectonics, Stratigraphy, and Sedimentation in the Aptian Stage of the Eastern Brazilian Margin]. Bol. Geocienc. Petrobras 2004, 13, 7–25. [Google Scholar]
- Terra, G.J.S.; Spadini, A.R.; França, A.; Sombra, C.; Zambonato, E.; Juschaks, L.C.; Arienti, L.; Erthal, M.; Blauth, M.; Franco, M.P.; et al. Carbonate Rock Classification Applied to Brazilian Sedimentary Basins. Bol. Geocienc. Petrobras 2009, 18, 9–29. [Google Scholar]
- Muniz, M.; Bosence, D. Pre-Salt Microbialites from the Campos Basin (Offshore Brazil): Image Log Facies, Facies Model and Cyclicity in Lacustrine Carbonates. Geol. Soc. Lond. Spec. Publ. 2015, 418, 221–242. [Google Scholar] [CrossRef]
- Sabato Ceraldi, T.; Green, D. Evolution of the South Atlantic Lacustrine Deposits in Response to Early Cretaceous Rifting, Subsidence and Lake Hydrology. Geol. Soc. Lond. Spec. Publ. 2016, 438, 77–98. [Google Scholar] [CrossRef]
- Arthur Saller, S.R.; Dickson, J.A.D. (Tony) Presalt Stratigraphy and Depositional Systems in the Kwanza Basin, Offshore Angola. AAPG Bull. 2016, 100, 1135–1164. [Google Scholar] [CrossRef]
- Wright, V.; Barnett, A. An Abiotic Model for the Development of Textures in Some South Atlantic Early Cretaceous Lacustrine Carbonates. Geol. Soc. Lond. Spec. Publ. 2015, 418, 209–219. [Google Scholar] [CrossRef]
- Gomes, J.P.; Bunevich, R.B.; Tedeschi, L.R.; Tucker, M.E.; Whitaker, F.F. Facies Classification and Patterns of Lacustrine Carbonate Deposition of the Barra Velha Formation, Santos Basin, Brazilian Pre-Salt. Mar. Pet. Geol. 2020, 113, 104176. [Google Scholar] [CrossRef]
- Herlinger, R., Jr.; Zambonato, E.E.; De Ros, L.F. Influence of Diagenesis on the Quality of Lower Cretaceous Pre-Salt Lacustrine Carbonate Reservoirs from Northern Campos Basin, Offshore Brazil. J. Sediment. Res. 2017, 87, 1285–1313. [Google Scholar] [CrossRef]
- Lima, B.E.M.; De Ros, L.F. Deposition, Diagenetic and Hydrothermal Processes in the Aptian Pre-Salt Lacustrine Carbonate Reservoirs of the Northern Campos Basin, Offshore Brazil. Sediment. Geol. 2019, 383, 55–81. [Google Scholar] [CrossRef]
- Pietzsch, R.; Oliveira, D.M.; Tedeschi, L.R.; Queiroz Neto, J.V.; Figueiredo, M.F.; Vazquez, J.C.; de Souza, R.S. Palaeohydrology of the Lower Cretaceous Pre-Salt Lacustrine System, from Rift to Post-Rift Phase, Santos Basin, Brazil. Palaeogeogr. Palaeoclimatol. Palaeoecol. 2018, 507, 60–80. [Google Scholar] [CrossRef]
- Wright, V. The Mantle, CO2 and the Giant Aptian Chemogenic Lacustrine Carbonate Factory of the South Atlantic: Some Carbonates Are Made, Not Born. Sedimentology 2020, 69, 47–73. [Google Scholar] [CrossRef]
- De Ros, L. Syngenetic, Diagenetic and Hydrothermal Processes in the Pre-Salt Sag Section of Santos and Campos Basins; European Association of Geoscientists & Engineers: Utrecht, The Netherlands, 2021. [Google Scholar]
- Farias, F.; Szatmari, P.; Bahniuk, A.; França, A.B. Evaporitic Carbonates in the Pre-Salt of Santos Basin—Genesis and Tectonic Implications. Mar. Pet. Geol. 2019, 105, 251–272. [Google Scholar] [CrossRef]
- Minzoni, M.; Cantelli, A.; Thornton, J. Seismic-Scale Geometries and Sequence-Stratigraphic Architecture of Early Cretaceous Syn-Post Rift Lacustrine Carbonate Systems, Pre-Salt Section, South Atlantic Margins. In Sequence Stratigraphy: The Future Defined; SEPM Society for Sedimentary Geology: Tulsa, OK, USA, 2019; ISBN 978-1-944966-36-2. [Google Scholar]
- Tosca, N.J.; Wright, V.P. Diagenetic Pathways Linked to Labile Mg-Clays in Lacustrine Carbonate Reservoirs: A Model for the Origin of Secondary Porosity in the Cretaceous Pre-Salt Barra Velha Formation, Offshore Brazil. Geol. Soc. Lond. Spec. Publ. 2018, 435, 33–46. [Google Scholar] [CrossRef]
- De Ros, L.F.; Oliveira, D.M. An Operational Classification System for the South Atlantic Pre-Salt Rocks. J. Sediment. Res. 2023, 93, 693–704. [Google Scholar] [CrossRef]
- Almeida Carvalho, A.M.; Hamon, Y.; Gomes De Souza, O., Jr.; Goulart Carramal, N.; Collard, N. Facies and Diagenesis Distribution in an Aptian Pre-Salt Carbonate Reservoir of the Santos Basin, Offshore Brazil: A Comprehensive Quantitative Approach. Mar. Pet. Geol. 2022, 141, 105708. [Google Scholar] [CrossRef]
- Netto, P.R.A.; Pozo, M.; da Silva, M.D.; Mexias, A.S.; Gomes, M.E.B.; Borghi, L.; Rios-Netto, A.M. Authigenic Mg-Clay Assemblages in the Barra Velha Formation (Upper Cretaceous) from Santos Basin (Brazil): The Role of Syngenetic and Diagenetic Process. Appl. Clay Sci. 2022, 216, 106339. [Google Scholar] [CrossRef]
- Netto, P.R.A.; Pozo, M.; da Silva, M.D.; Gomes, M.E.B.; Mexias, A.; Ramnani, C.W.; Parizek-Silva, Y.; Borghi, L.; Rios-Netto, A.d.M. Paleoenvironmental Implications of Authigenic Magnesian Clay Formation Sequences in the Barra Velha Formation (Santos Basin, Brazil). Minerals 2022, 12, 200. [Google Scholar] [CrossRef]
- Schrank, A.B.S.; Dos Santos, T.; Altenhofen, S.D.; Freitas, W.; Cembrani, E.; Haubert, T.; Dalla Vecchia, F.; Barili, R.; Rodrigues, A.G.; Maraschin, A.; et al. Interactions between Clays and Carbonates in the Aptian Pre-Salt Reservoirs of Santos Basin, Eastern Brazilian Margin. Minerals 2024, 14, 191. [Google Scholar] [CrossRef]
- Rehim, H.A.A.A.; Pimentel, A.M.; Carvalho, M.; Monteiro, M. Talco e Estevensita Na Formação Lagoa Feia Da Bacia de Campos—Possíveis Implicações No Ambiente Deposicional. An. Congr. Bras. Geol. 1986, 34, 416–425. [Google Scholar]
- Pre-Salt: Dive into This Ultra-Deep Journey. Available online: https://petrobras.com.br/pre-sal (accessed on 2 April 2024).
- Polígono do Pré-Sal. Available online: https://www.gov.br/anp/pt-br/assuntos/exploracao-e-producao-de-oleo-e-gas/dados-tecnicos/mapas-e-p/poligono-do-pre-sal (accessed on 2 April 2024).
- Abelha, M.; Petersohn, E. The State of the Art of the Brazilian Pre-Salt Exploration. In Proceedings of the 2018 AAPG Annual Convention & Exhibition; American Association of Petroleum Geologists: Salt Lake City, UT, USA, 2018. [Google Scholar]
- Deckelman, J.A.; Chi, S.; Hartwig, A.K.; Reuber, K.; Fruehn, J. Chapter 18: The Role of Megaregional Seismic Data in Santos Basin Pre-Salt Exploration and Development. In Memoir 124: The Supergiant Lower Cretaceous Pre-Salt Petroleum Systems of the Santos Basin, Brazil; The American Association of Petroleum Geologists: Tulsa, OK, USA, 2021; pp. 487–516. ISBN 978-0-89181-429-0. [Google Scholar]
- Christidis, G.E.; Koutsopoulou, E. A Simple Approach to the Identification of Trioctahedral Smectites by X-Ray Diffraction. Clay Miner. 2013, 48, 687–696. [Google Scholar] [CrossRef]
- Pouchou, J.-L.; Pichoir, F. Quantitative Analysis of Homogeneous or Stratified Microvolumes Applying the Model “PAP.” In Electron Probe Quantitation; Heinrich, K.F.J., Newbury, D.E., Eds.; Springer: Boston, MA, USA, 1991; pp. 31–75. ISBN 978-1-4899-2617-3. [Google Scholar]
- Ziebold, T.O. Precision and Sensitivity in Electron Microprobe Analysis. Anal. Chem. 1967, 39, 858–861. [Google Scholar] [CrossRef]
- Pauling, L. The Nature of the Chemical Bond and the Structure of Molecules and Crystals: An Introduction to Modern Structural Chemistry; Cornell University Press: Ithaca, NY, USA, 1960; ISBN 978-0-8014-0333-0. [Google Scholar]
- Christidis, G.E.; Chryssikos, G.D.; Derkowski, A.; Dohrmann, R.; Eberl, D.D.; Joussein, E.; Kaufhold, S. Methods for Determination of the Layer Charge of Smectites: A Critical Assessment of Existing Approaches. Clays Clay Miner. 2023, 71, 25–53. [Google Scholar] [CrossRef]
- Meunier, A.; Inoue, A.; Beaufort, D. Chemiographic Analysis of Trioctahedral Smectite-to-Chlorite Conversion Series from the Ohyu Caldera, Japan. Clays Clay Miner. 1991, 39, 409–415. [Google Scholar] [CrossRef]
- Madejová, J.; Gates, W.P.; Petit, S. Chapter 5—IR Spectra of Clay Minerals. In Developments in Clay Science; Elsevier: Amsterdam, The Netherlands, 2017; Volume 8, pp. 107–149. [Google Scholar]
- Kloprogge, J.T.; Ponce, C.P. Spectroscopic Studies of Synthetic and Natural Saponites: A Review. Minerals 2021, 11, 112. [Google Scholar] [CrossRef]
- Pozo, M.; Calvo, J. An Overview of Authigenic Magnesian Clays. Minerals 2018, 8, 520. [Google Scholar] [CrossRef]
- Warren, J. Evaporites. In Encyclopedia of Geochemistry; White, W.M., Ed.; Encyclopedia of Earth Sciences Series; Springer International Publishing: Cham, Switzerland, 2016; pp. 1–8. ISBN 978-3-319-39193-9. [Google Scholar]
- Millot, G. Geology of Clays; Springer: Berlin/Heidelberg, Germany, 1970; ISBN 978-3-662-41611-2. [Google Scholar]
- Meunier, A. Clays; Springer: Berlin/Heidelberg, Germany, 2005; ISBN 978-3-540-21667-4. [Google Scholar]
- Chilingar, G.V.; Bissell, H.J.; Wolf, K.H. Chapter 5 Diagenesis of Carbonate Rocks. In Developments in Sedimentology; Larsen, G., Chilingar, G.V., Eds.; Diagenesis in Sediments; Elsevier: Amsterdam, The Netherlands, 1967; Volume 8, pp. 179–322. [Google Scholar]
- Carramal, N.G.; Oliveira, D.M.; Cacela, A.S.; Cuglieri, M.A.; Rocha, N.P.; Viana, S.M.; Toledo, S.L.; Pedrinha, S.; de Ros, L.F. Paleoenvironmental Insights from the Deposition and Diagenesis of Aptian Pre-Salt Magnesium Silicates from the Lula Field, Santos Basin, Brazil. J. Sediment. Res. 2022, 92, 12–31. [Google Scholar] [CrossRef]
- Rossoni, R.B.; Porcher, C.C.; Koester, E.; Sobiesiak, J.S.; da Silva, L.A.C.; Mexias, A.S.; Gomes, M.E.B.; Ramnani, C.W.; De Ros, L.F. The Role of Compaction in the Diagenetic Evolution of Pre-Salt Aptian Deposits of Santos Basin, Brazil. Sediment. Geol. 2024, 466, 106650. [Google Scholar] [CrossRef]
- Wright, P.; Tosca, N. A Geochemical Model for the Formation of the Pre-Salt Reservoirs, Santos Basin, Brazil: Implications for Understanding Reservoir Distribution. Presented at the AAPG Annual Convention & Exhibition, Calgary, AB, Canada, 19–22 June 2016. [Google Scholar]
- Hofmann, U.; Klemen, R. Verlust Der Austauschfähigkeit von Lithiumionen an Bentonit Durch Erhitzung. Z. Für Anorg. Chem. 1950, 262, 95–99. [Google Scholar] [CrossRef]
- Petit, S.; Righi, D.; Decarreau, A. Transformation of Synthetic Zn-Stevensite to Zn-Talc Induced by the Hofmann-Klemen Effect. Clays Clay Miner. 2008, 56, 645–654. [Google Scholar] [CrossRef]
- Anjos, S.M.C.; De Ros, L.F.; Silva, C.M.A. Chlorite Authigenesis and Porosity Preservation in the Upper Cretaceous Marine Sandstones of the Santos Basin, Offshore Eastern Brazil. In Clay Mineral Cements in Sandstones; Worden, R.H., Morad, S., Eds.; Wiley: Hoboken, NJ, USA, 2003; pp. 289–316. ISBN 978-1-4051-0587-3. [Google Scholar]
- Deocampo, D.M. Evaporative Evolution of Surface Waters and the Role of Aqueous CO2 in Magnesium Silicate Precipitation: Lake Eyasi and Ngorongoro Crater, Northern Tanzania. S. Afr. J. Geol. 2005, 108, 493–504. [Google Scholar] [CrossRef]
- Hover, V.C.; Ashley, G.M. Geochemical Signatures of Paleodepositional and Diagenetic Environments: A STEM/AEM Study of Authigenic Clay Minerals from an Arid Rift Basin, Olduvai Gorge, Tanzania. Clays Clay Miner. 2003, 51, 231–251. [Google Scholar] [CrossRef]
- Chang, H.K.; Mackenzie, F.T.; Schoonmaker, J. Comparisons Between the Diagenesis of Dioctahedral and Trioctahedral Smectite, Brazilian Offshore Basins. Clays Clay Miner. 1986, 34, 407–423. [Google Scholar] [CrossRef]
- Pozo, M.; Calvo, J.P. Madrid Basin (Spain): A Natural Lab for the Formation and Evolution of Magnesian Clay Minerals. In Magnesian Clays: Characterization, Origin and Applications; Pozo, M., Galán, E., Eds.; Digilabs: Bari, Italy, 2015. [Google Scholar]
- Tosca, N. Geochemical Pathways to Mg-Clay Formation. In Magnesian Clays: Characterization, Origin and Applications; AIPEA: Middlebury, VT, USA, 2014; Volume 2, pp. 1–52. [Google Scholar]
- Tutolo, B.M.; Tosca, N.J. Experimental Examination of the Mg-Silicate-Carbonate System at Ambient Temperature: Implications for Alkaline Chemical Sedimentation and Lacustrine Carbonate Formation. Geochim. Cosmochim. Acta 2018, 225, 80–101. [Google Scholar] [CrossRef]
- Clauer, N.; Fallick, A.E.; Galán, E.; Pozo, M.; Taylor, C. Varied Crystallization Conditions for Neogene Sepiolite and Associated Mg-Clays from Madrid Basin (Spain) Traced by Oxygen and Hydrogen Isotope Geochemistry. Geochim. Cosmochim. Acta 2012, 94, 181–198. [Google Scholar] [CrossRef]
- Singer, A.; Galan, E. Palygorskite-Sepiolite: Occurrence, Genesis and Uses. Clay Miner. 1985, 20, 276–277. [Google Scholar] [CrossRef]
- Ramnani, C.; Ferreira Santos, J.; Silva, Y.; Madrucci, V.; de Araújo, C.C.; Vasquez, G.; Morschbacher, M.; Bonzanini, L.; Viana, S.; Souza, R.; et al. Magnesian Clay Minerals in Brazilian Pre-Salt Province. In Proceedings of the IMAGE International Meeting for Applied Geoscience & Energy, Denver, CO, USA, 26 September–1 October 2021. [Google Scholar]
- da Silva, M.; Boscato Gomes, M.; Mexias, A.; Pozo, M.; Silva, L.; Netto, P.; Drago, S.; Driemeyer, D.; Celia, R.; Ros, L.; et al. Caracterização Mineralogica De Argilominerais Magnesianos Na Porção Não Reservatório Dos Depósitos Sag -Pré-Sal da Bacia De Santos. Presented at the SAPIGEO, UFRGS, Porto Alegre, Brazil,, 14–17 March 2022. [Google Scholar]
- Da Silva, M.D.; Gomes, M.E.B.; Mexias, A.S.; Bongiolo EM, E.; da Silva, L.A.C.; Gomes, L.B.; Ramnani, C. Química Mineral De Esmectitas E Suas Assembleias De Ocorrência, Bacia De Santos—Pré-Sal Brasileiro. In Proceedings of the V Semana Acadêmica dos Pós-Graduandos do Instituto de Geociências e Sensoriamento Remoto: Integração, Diálogo e Acolhimento. (5.: 2024.: Porto Alegre, RS). [Anais], Porto Alegre, Brazil, 19–21 March 2024; IGEO UFRGS: Porto Alegre, Brazil, 2024. [Google Scholar]


| Sample Depth (m) | Calcite | Dolomite | Clay Minerals 1 | Quartz | Detritics 2 |
|---|---|---|---|---|---|
| 5115.15 | 42% | 27% | 14% | 17% | |
| 5116.35 | 58% | 20% | 9% | 13% | |
| 5119.55 | 16% | * 58% | 3% | 22% | |
| 5124.40 | 77% | 8% | 12% | 3% | |
| 5125.30 | 76% | 5% | 10% | 10% | |
| 5127.60 | 37% | 5% | 13% | 45% | |
| 5128.40 | 52% | 36% | 9% | 2% | |
| 5129.55 | 75% | 7% | 15% | 3% | |
| 5129.85 | 83% | 5% | 12% | ||
| 5130.85 | 91% | 3% | 6% | 1% | |
| 5132.15 | 82% | 5% | 13% | ||
| 5133.70 | 59% | 30% | 11% | ||
| 5136.90 | 60% | 5% | 35% | ||
| 5137.50 | 48% | 3% | 18% | 3% | 28% |
| 5138.15 | 85% | 5% | 10% | ||
| 5138.50 | 69% | 2% | 11% | 18% | |
| 5140.25 | 81% | 10% | 5% | 2% | |
| 5141.68 | 81% | 13% | 4% | 2% | |
| 5141.75 | 76% | 11% | 13% | ||
| 5141.80 | 78% | 7% | 12% | 3% | |
| 5144.15 | 52% | 14% | 1% | 33% |
| Mineral | Kerolite | K/S Mixed Layer | Stevensite | Saponite | ||||
|---|---|---|---|---|---|---|---|---|
| Sample | 32.15/36.90 | 16.35/30.85 | 15.15/19.55 | 37.50/44.15 | ||||
| n | 118 | 185 | 44 | 19 | ||||
| Oxides | µ | σ | µ | σ | µ | σ | µ | σ |
| SiO2 | 59.454 | 1.555 | 57.183 | 2.388 | 57.612 | 2.042 | 52.071 | 3.059 |
| Al2O3 | 0.296 | 0.114 | 1.070 | 0.504 | 0.556 | 0.081 | 5.896 | 0.874 |
| FeO | 0.150 | 0.031 | 0.190 | 0.088 | 0.098 | 0.023 | 2.717 | 1.586 |
| MgO | 28.091 | 0.820 | 27.154 | 1.355 | 26.380 | 1.065 | 19.751 | 2.796 |
| TiO2 | 0.034 | 0.016 | 0.015 | 0.059 | 0.024 | 0.013 | 0.242 | 0.332 |
| MnO | 0.004 | 0.015 | 0.000 | 0.014 | 0.000 | 0.014 | 0.006 | 0.015 |
| CaO | 0.242 | 0.147 | 0.878 | 0.356 | 0.196 | 0.064 | 0.380 | 0.289 |
| Na2O | 0.563 | 0.119 | 0.319 | 0.135 | 1.488 | 0.241 | 2.029 | 0.355 |
| K2O | 0.206 | 0.057 | 0.380 | 0.192 | 0.755 | 0.146 | 1.879 | 1.140 |
| SUM | 89.873 | 2.221 | 88.306 | 3.065 | 90.595 | 3.062 | 87.869 | 3.611 |
| F- | 0.670 | 0.170 | 0.990 | 0.269 | 3.047 | 0.531 | 0.691 | 0.239 |
| Cations (22 O) | ||||||||
| Si | 8.058 | 0.037 | 7.939 | 0.089 | 8.047 | 0.036 | 7.635 | 0.272 |
| Al | 0.047 | 0.019 | 0.175 | 0.088 | 0.092 | 0.014 | 1.008 | 0.157 |
| Al IV | 0.000 | 0.011 | 0.084 | 0.081 | 0.019 | 0.011 | 0.365 | 0.270 |
| Al VI | 0.046 | 0.020 | 0.113 | 0.052 | 0.090 | 0.019 | 0.550 | 0.239 |
| Fe2+ | 0.017 | 0.004 | 0.022 | 0.011 | 0.012 | 0.003 | 0.328 | 0.195 |
| Mg | 5.653 | 0.076 | 5.610 | 0.118 | 5.459 | 0.098 | 4.357 | 0.616 |
| Ti | 0.003 | 0.002 | 0.001 | 0.006 | 0.003 | 0.001 | 0.028 | 0.036 |
| Mn | 0.000 | 0.002 | 0.000 | 0.002 | 0.000 | 0.002 | 0.001 | 0.002 |
| Ca | 0.035 | 0.022 | 0.134 | 0.055 | 0.031 | 0.010 | 0.060 | 0.045 |
| Na | 0.147 | 0.032 | 0.087 | 0.039 | 0.395 | 0.065 | 0.571 | 0.107 |
| K | 0.036 | 0.010 | 0.067 | 0.036 | 0.135 | 0.029 | 0.348 | 0.189 |
| Charge | 0.265 | 0.053 | 0.430 | 0.155 | 0.624 | 0.104 | 1.095 | 0.102 |
Disclaimer/Publisher’s Note: The statements, opinions and data contained in all publications are solely those of the individual author(s) and contributor(s) and not of MDPI and/or the editor(s). MDPI and/or the editor(s) disclaim responsibility for any injury to people or property resulting from any ideas, methods, instructions or products referred to in the content. |
© 2025 by the authors. Licensee MDPI, Basel, Switzerland. This article is an open access article distributed under the terms and conditions of the Creative Commons Attribution (CC BY) license (https://creativecommons.org/licenses/by/4.0/).
Share and Cite
da Silva, M.D.; Gomes, M.E.B.; Mexias, A.S.; Pozo, M.; Drago, S.M.; Bongiolo, E.M.; Netto, P.; Cardoso, V.S.; Gomes, L.B.; Ramnani, C.W. Geochemical Variations of Kerolite, Stevensite, and Saponite from the Pre-Salt Sag Interval of the Santos Basin: An Approach Using Electron Probe Microanalysis. Minerals 2025, 15, 285. https://doi.org/10.3390/min15030285
da Silva MD, Gomes MEB, Mexias AS, Pozo M, Drago SM, Bongiolo EM, Netto P, Cardoso VS, Gomes LB, Ramnani CW. Geochemical Variations of Kerolite, Stevensite, and Saponite from the Pre-Salt Sag Interval of the Santos Basin: An Approach Using Electron Probe Microanalysis. Minerals. 2025; 15(3):285. https://doi.org/10.3390/min15030285
Chicago/Turabian Styleda Silva, Maurício Dias, Márcia Elisa Boscato Gomes, André Sampaio Mexias, Manuel Pozo, Susan Martins Drago, Everton Marques Bongiolo, Paulo Netto, Victor Soares Cardoso, Lucas Bonan Gomes, and Camila Wense Ramnani. 2025. "Geochemical Variations of Kerolite, Stevensite, and Saponite from the Pre-Salt Sag Interval of the Santos Basin: An Approach Using Electron Probe Microanalysis" Minerals 15, no. 3: 285. https://doi.org/10.3390/min15030285
APA Styleda Silva, M. D., Gomes, M. E. B., Mexias, A. S., Pozo, M., Drago, S. M., Bongiolo, E. M., Netto, P., Cardoso, V. S., Gomes, L. B., & Ramnani, C. W. (2025). Geochemical Variations of Kerolite, Stevensite, and Saponite from the Pre-Salt Sag Interval of the Santos Basin: An Approach Using Electron Probe Microanalysis. Minerals, 15(3), 285. https://doi.org/10.3390/min15030285