
Genesis of the Upper Jurassic Continental Red Sandstones in the Yongjin Area of the Central Junggar Basin: Evidence from Petrology and Geochemistry

 ,
,
Abstract
1. Introduction
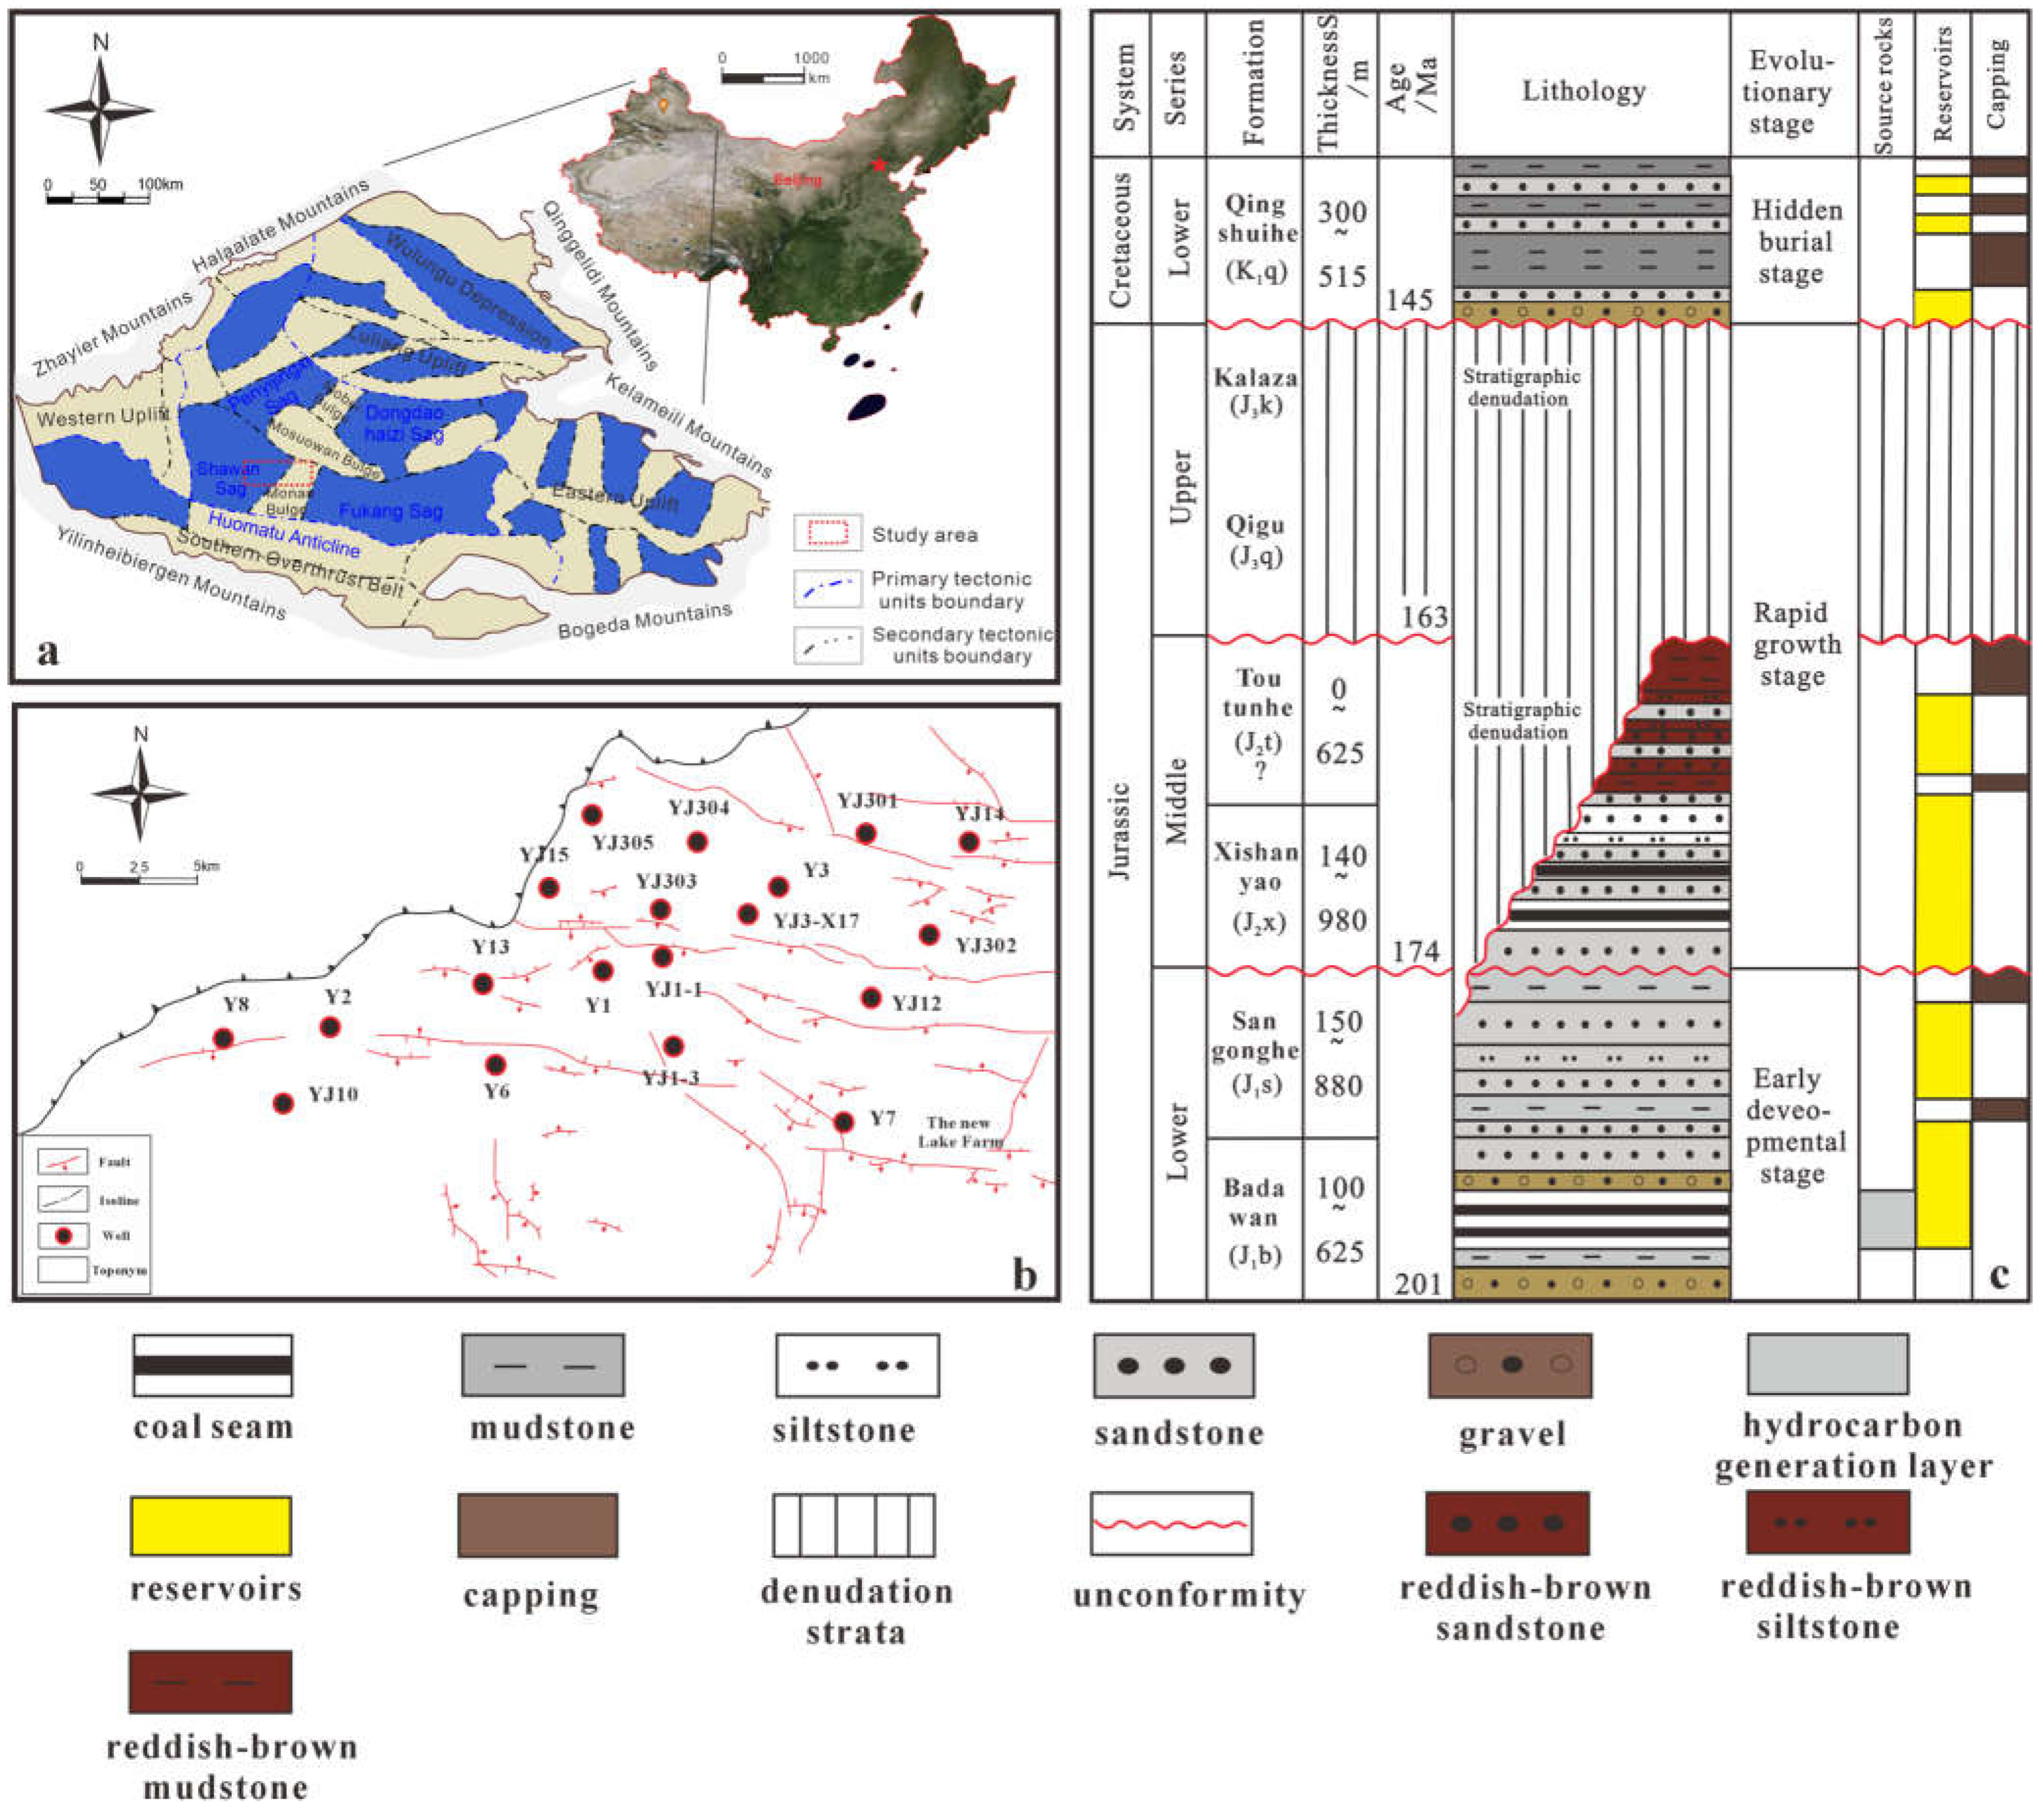
2. Geological Setting
2.1. Tectonic Background
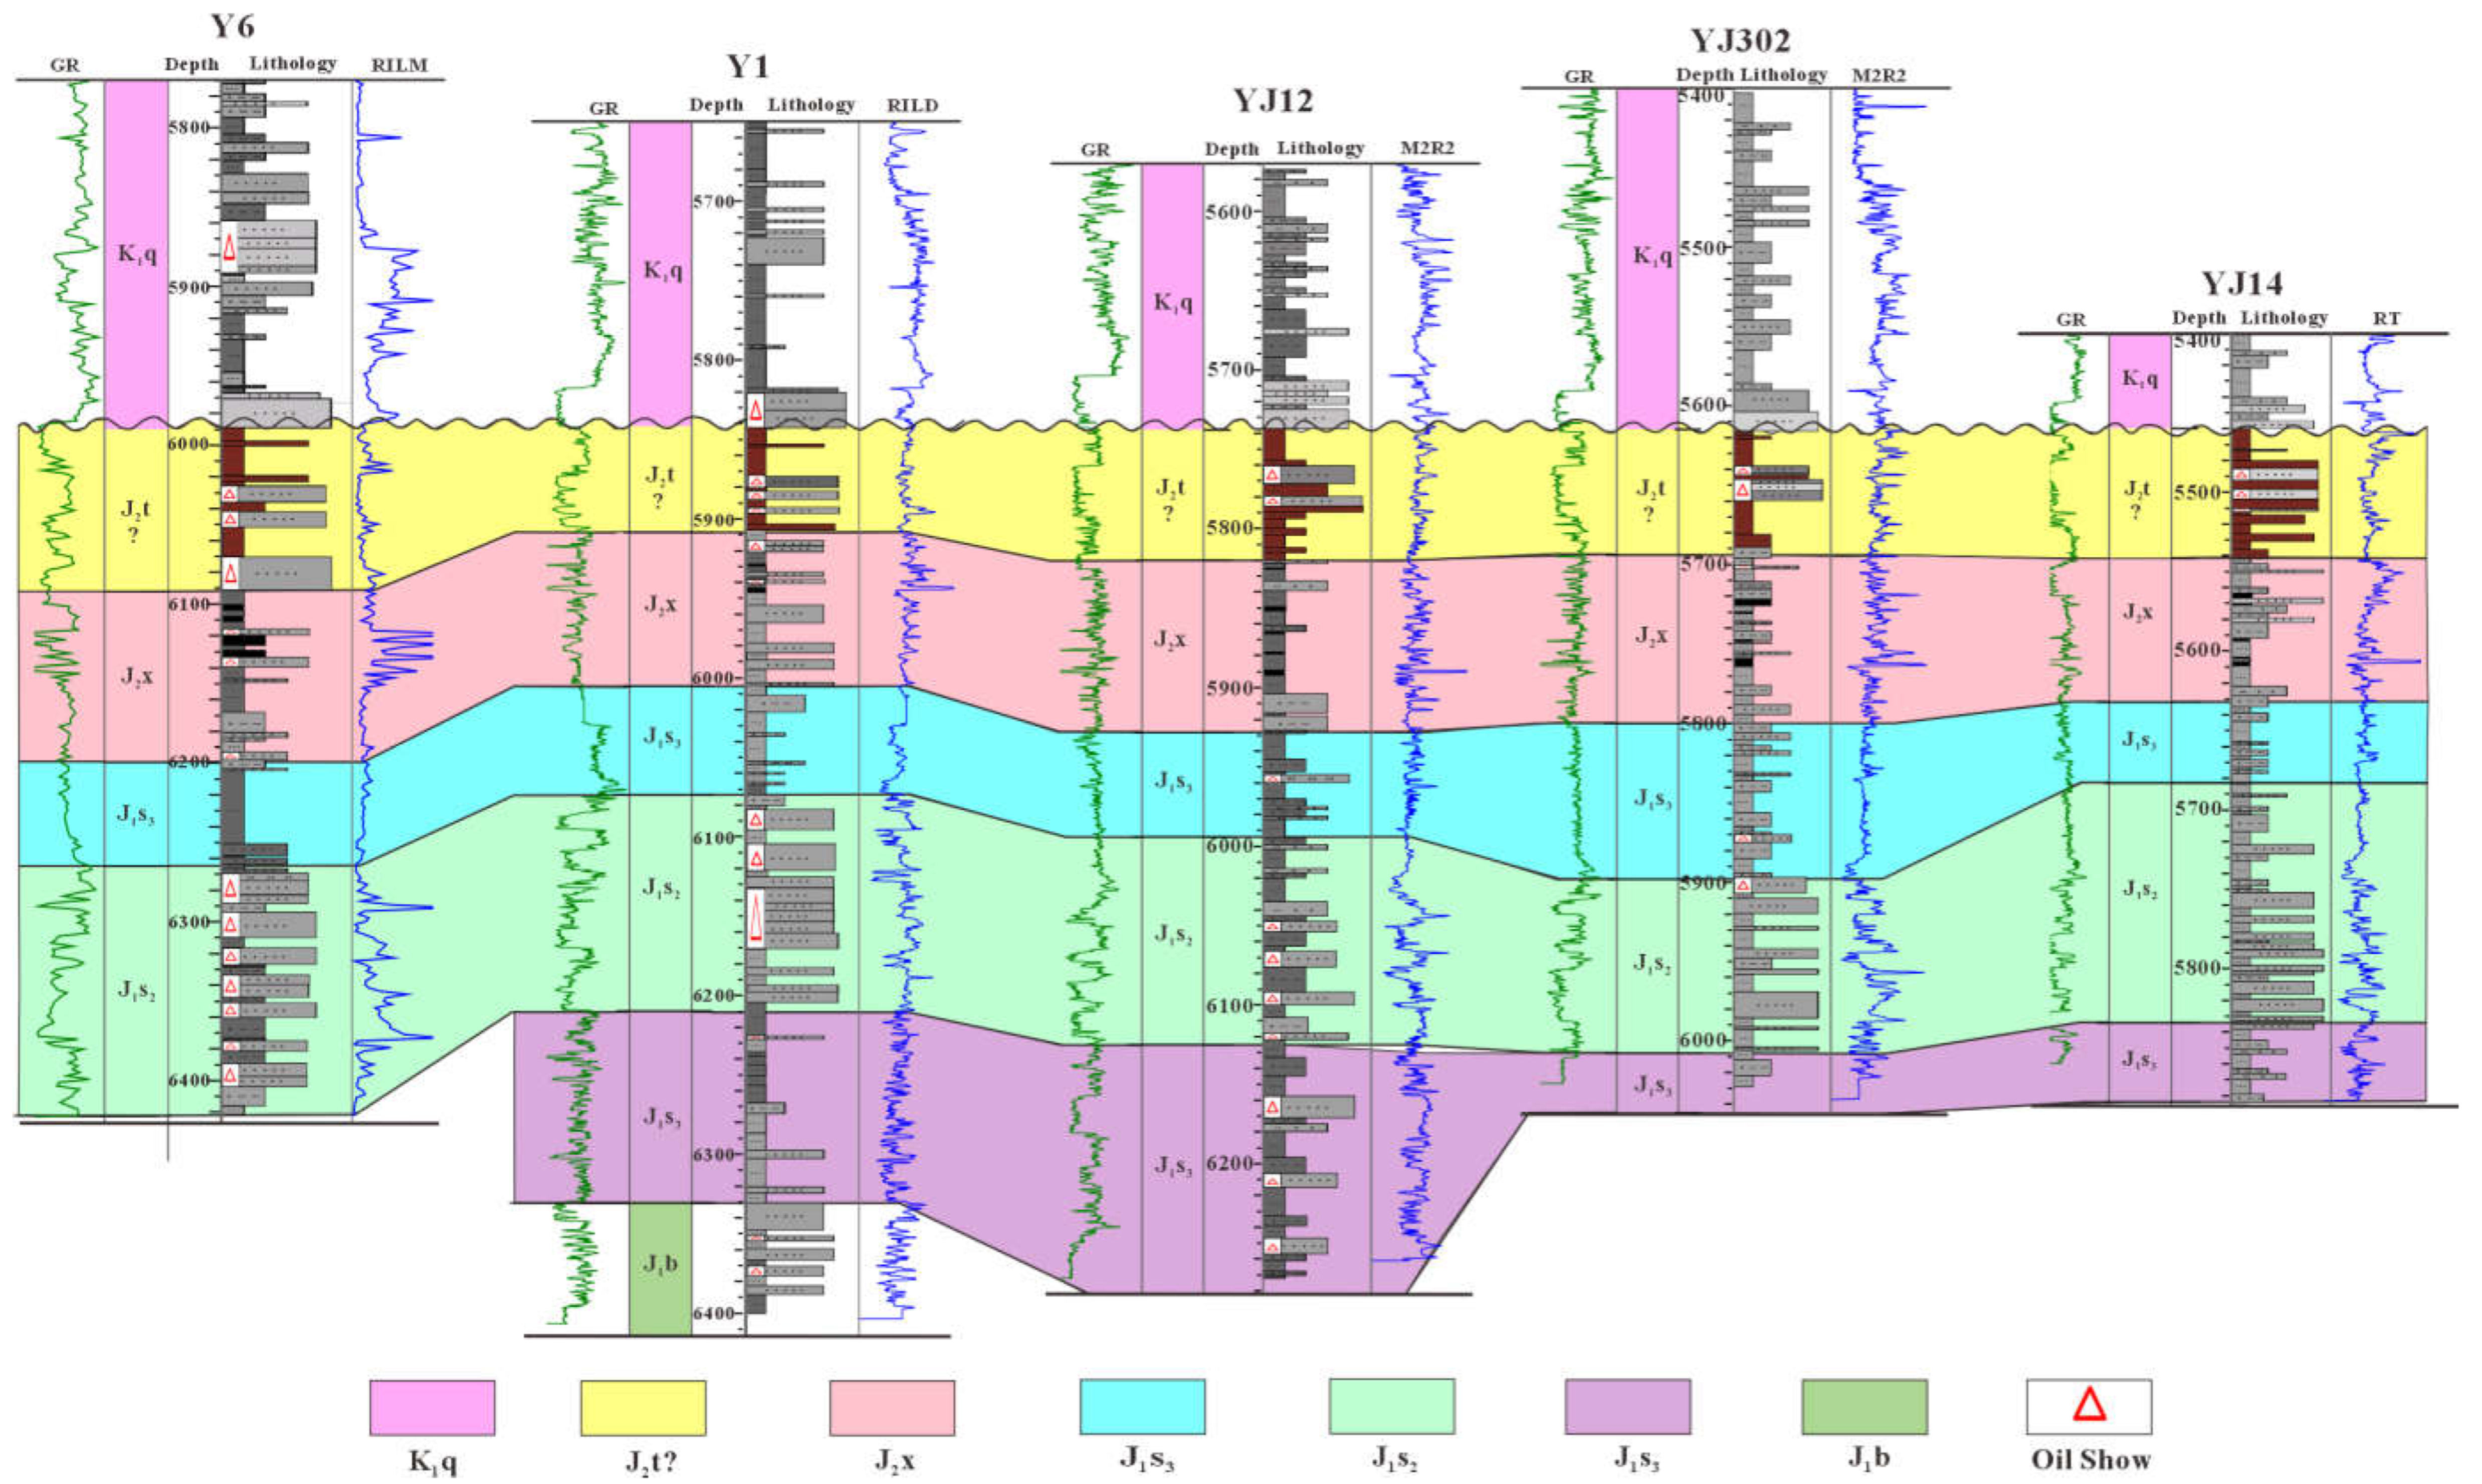
2.2. Jurassic Stratigraphy
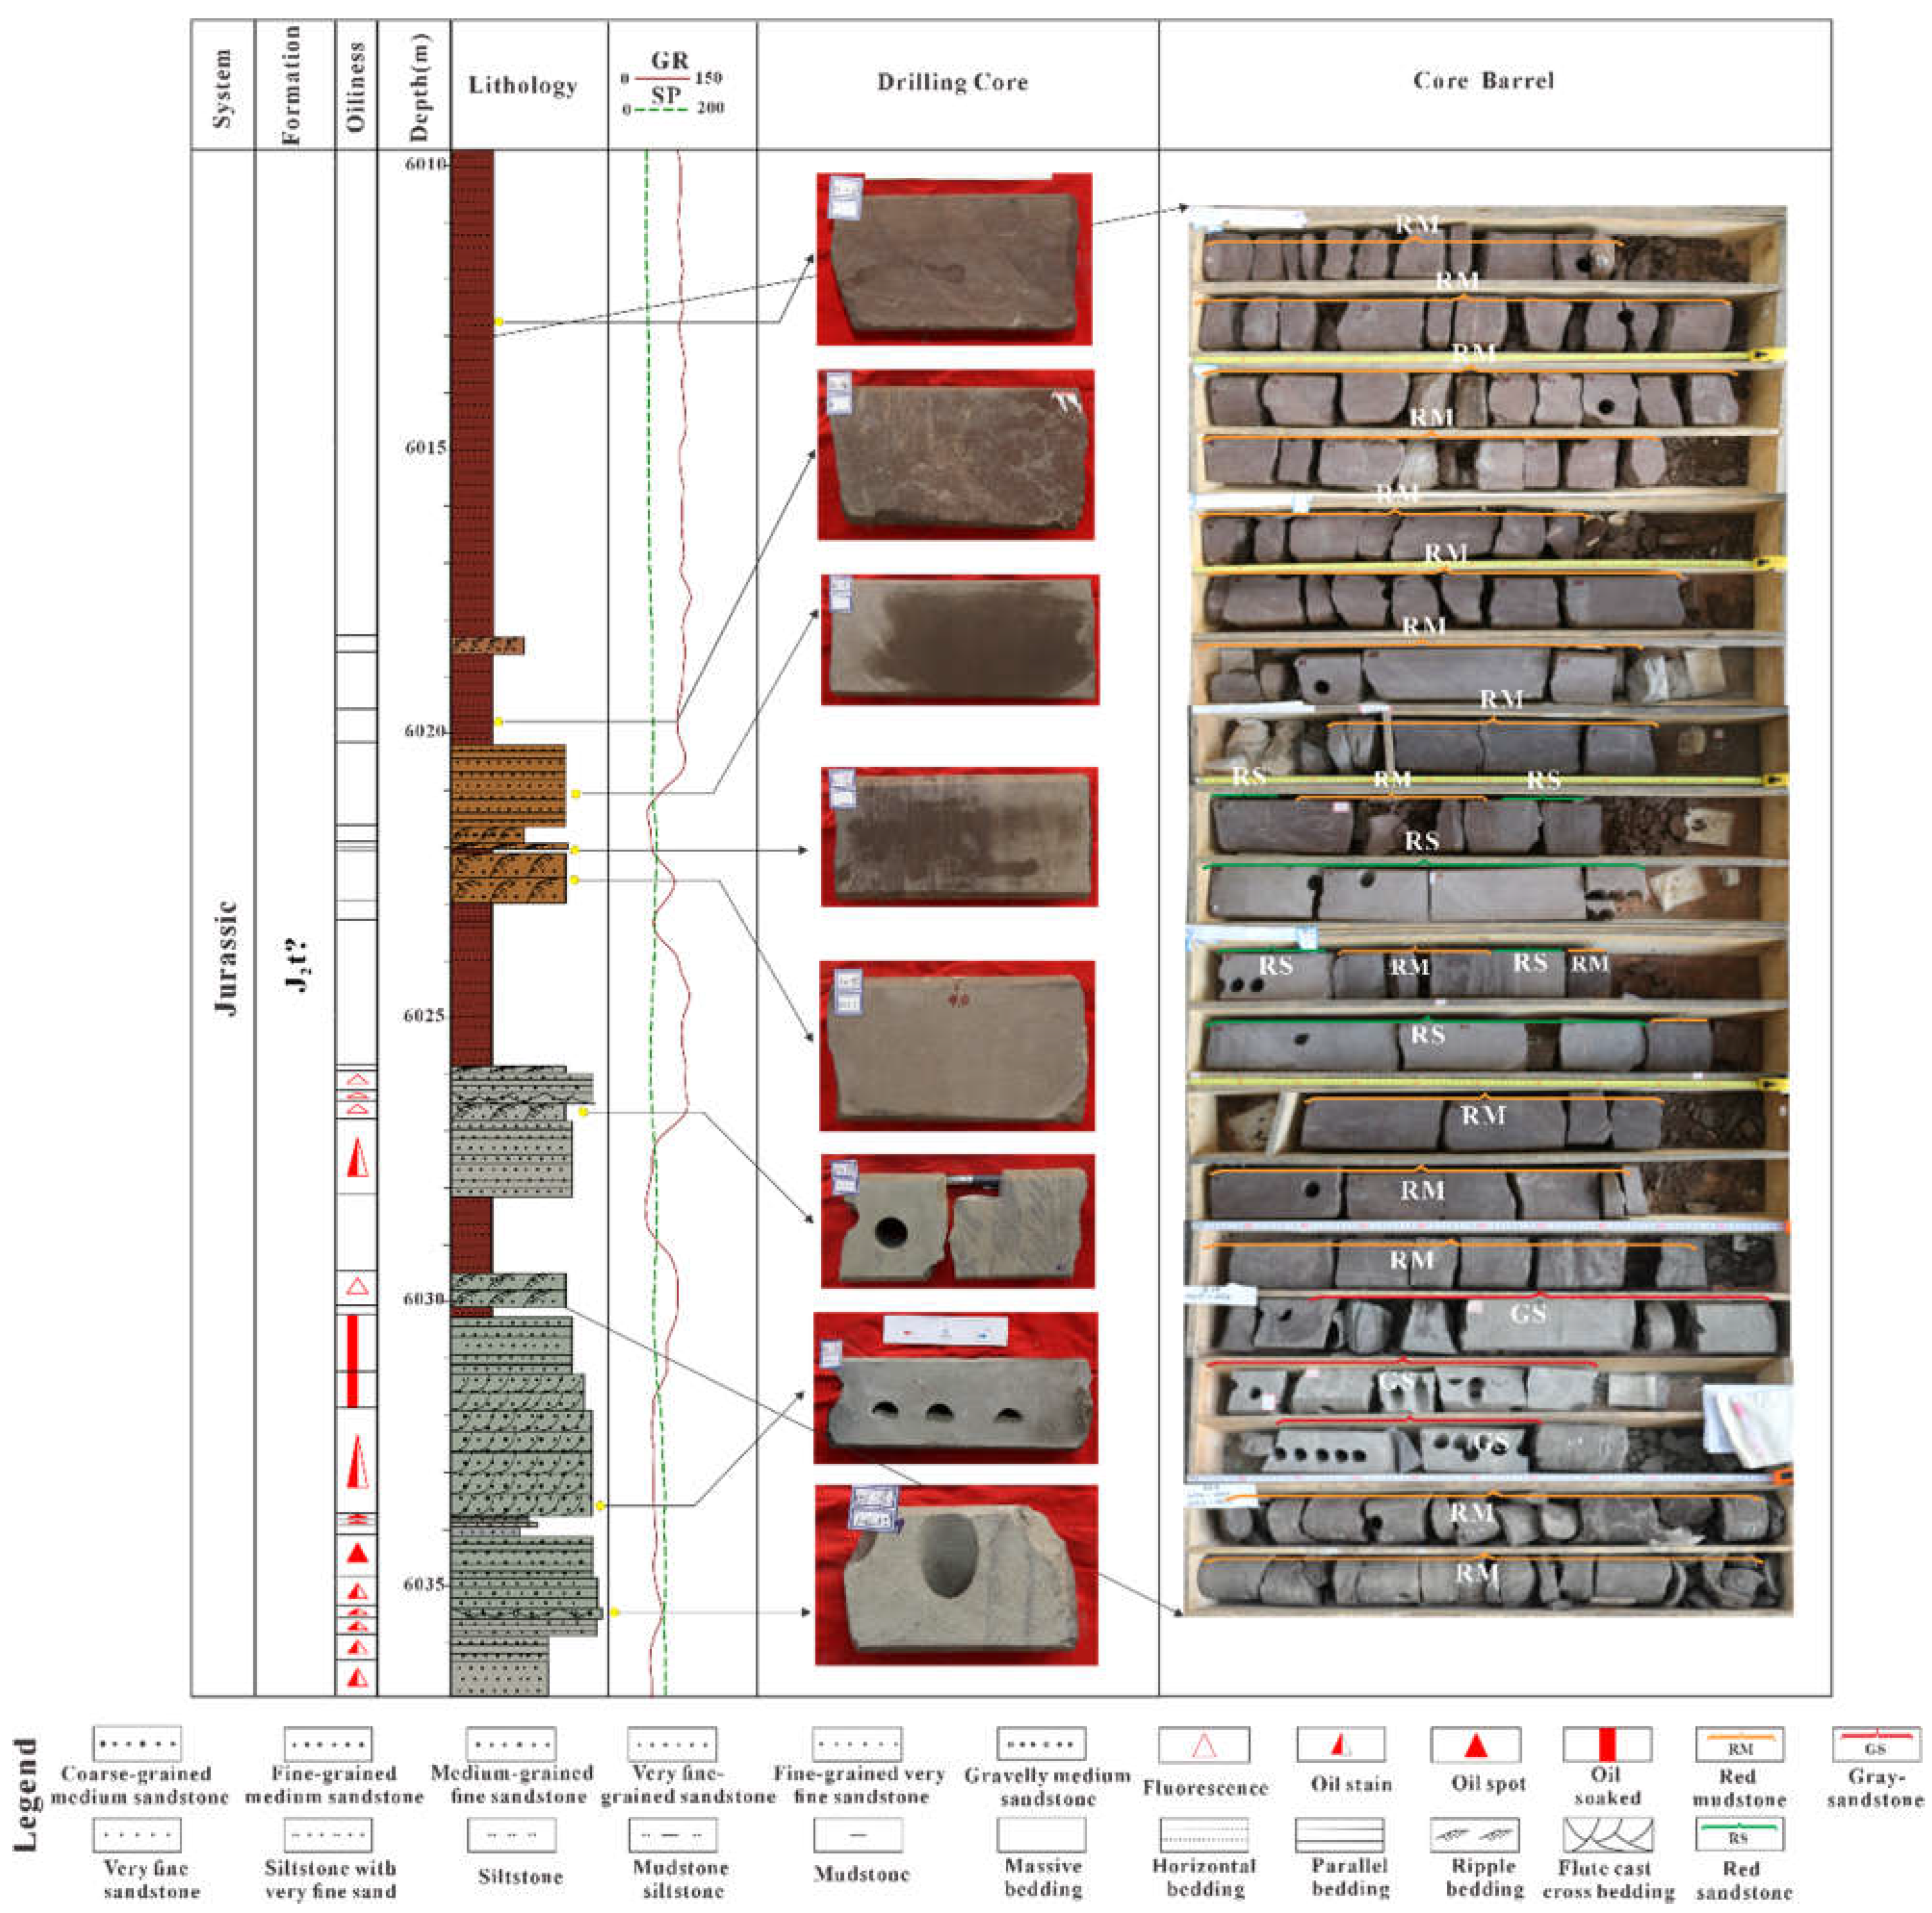
2.3. Sedimentology
3. Materials and Methods
3.1. Petrography
3.2. SEM
3.3. XRD Diffraction
3.4. XRF Spectrum
4. Results
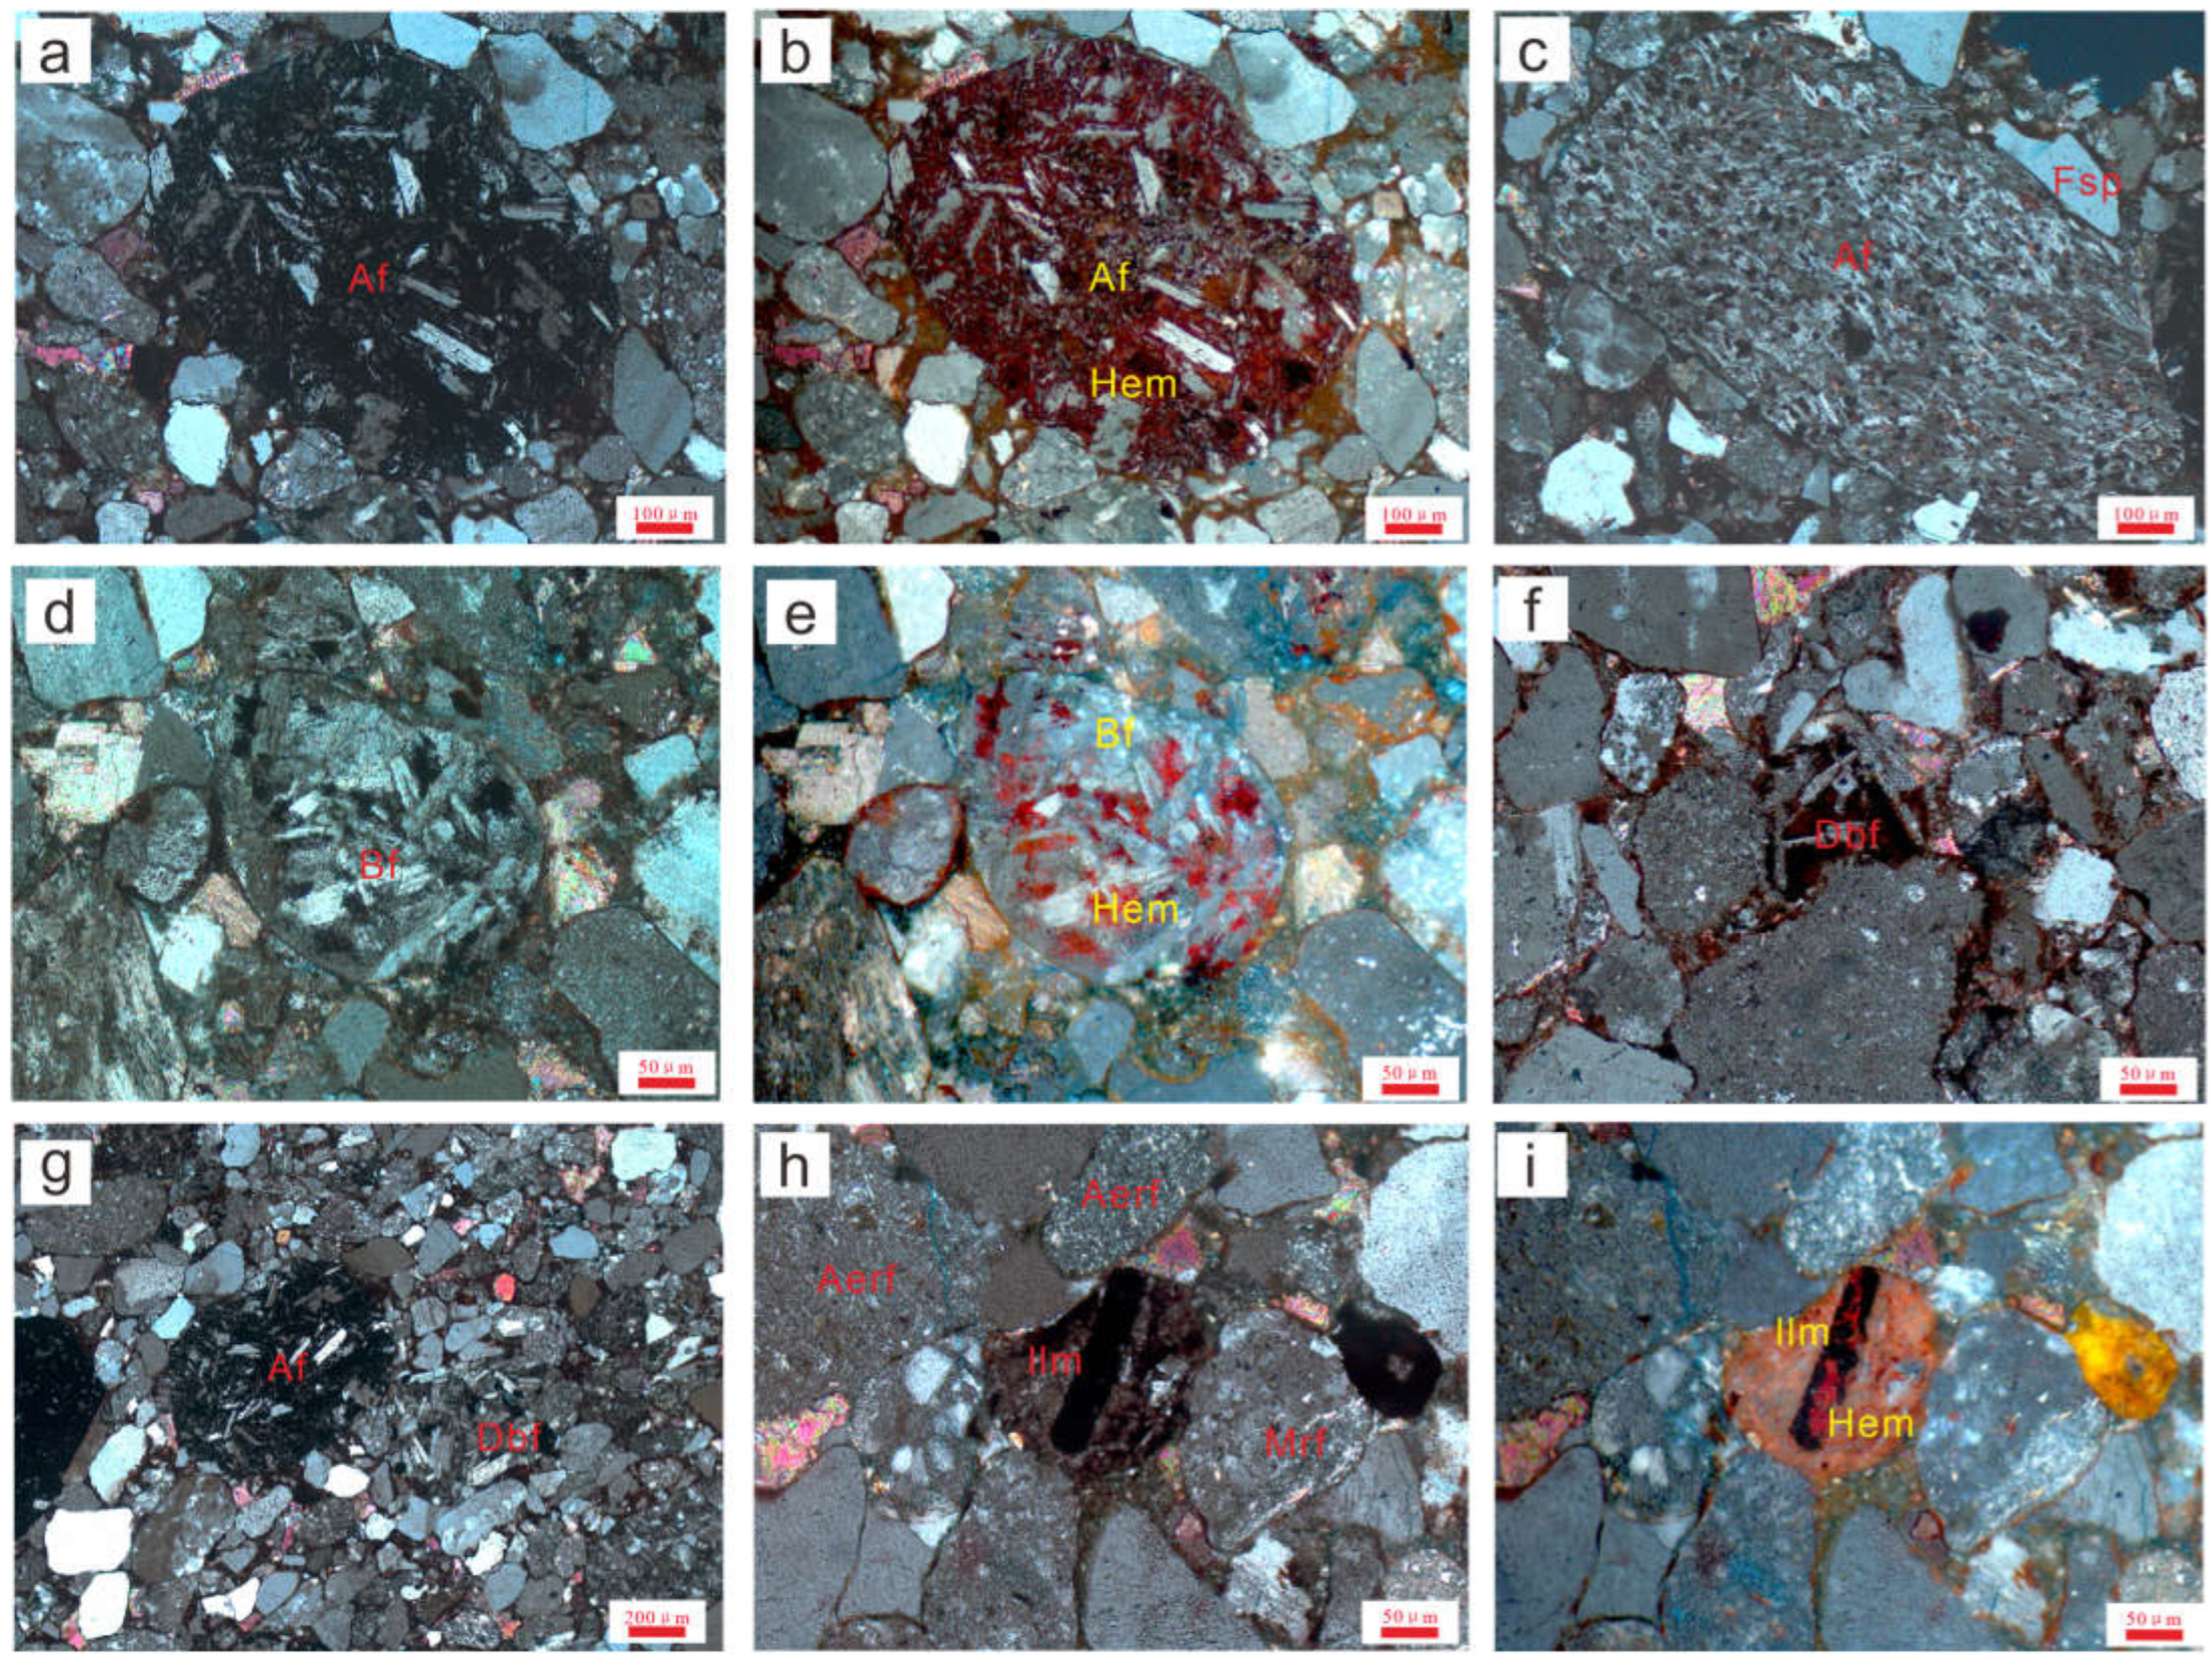
4.1. Petrographic Characteristics of Red Sandstone
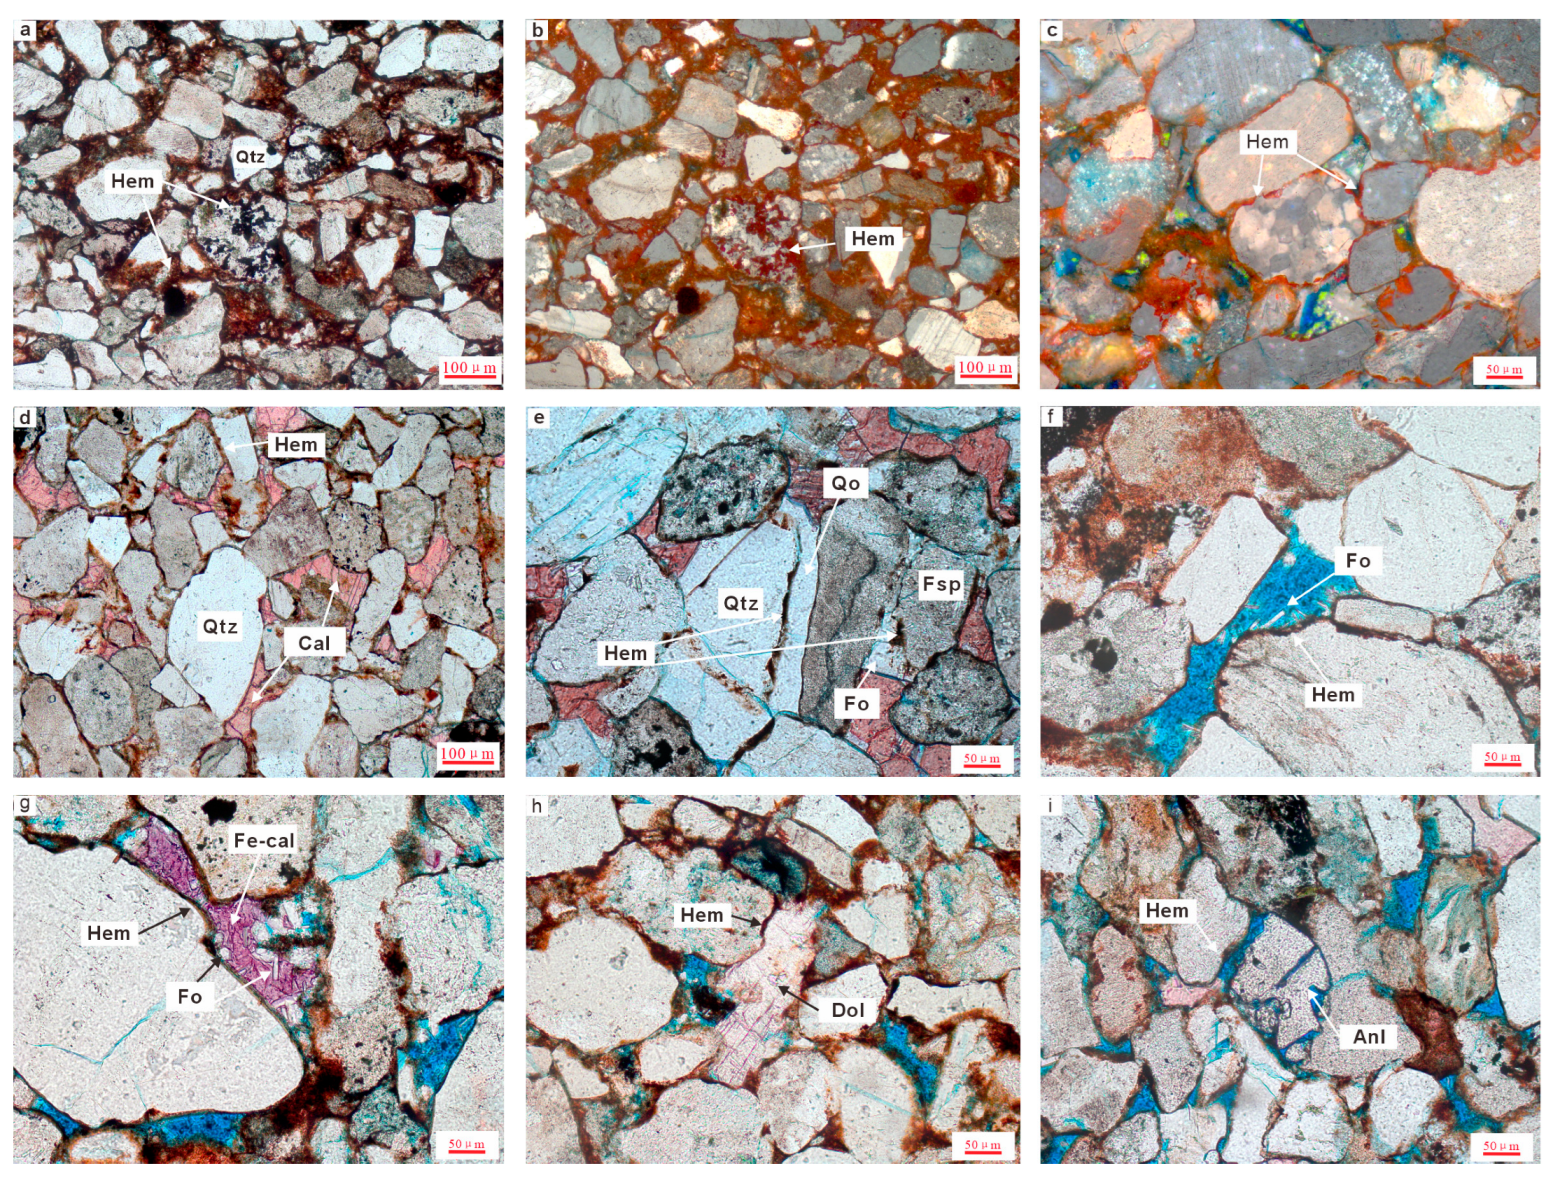
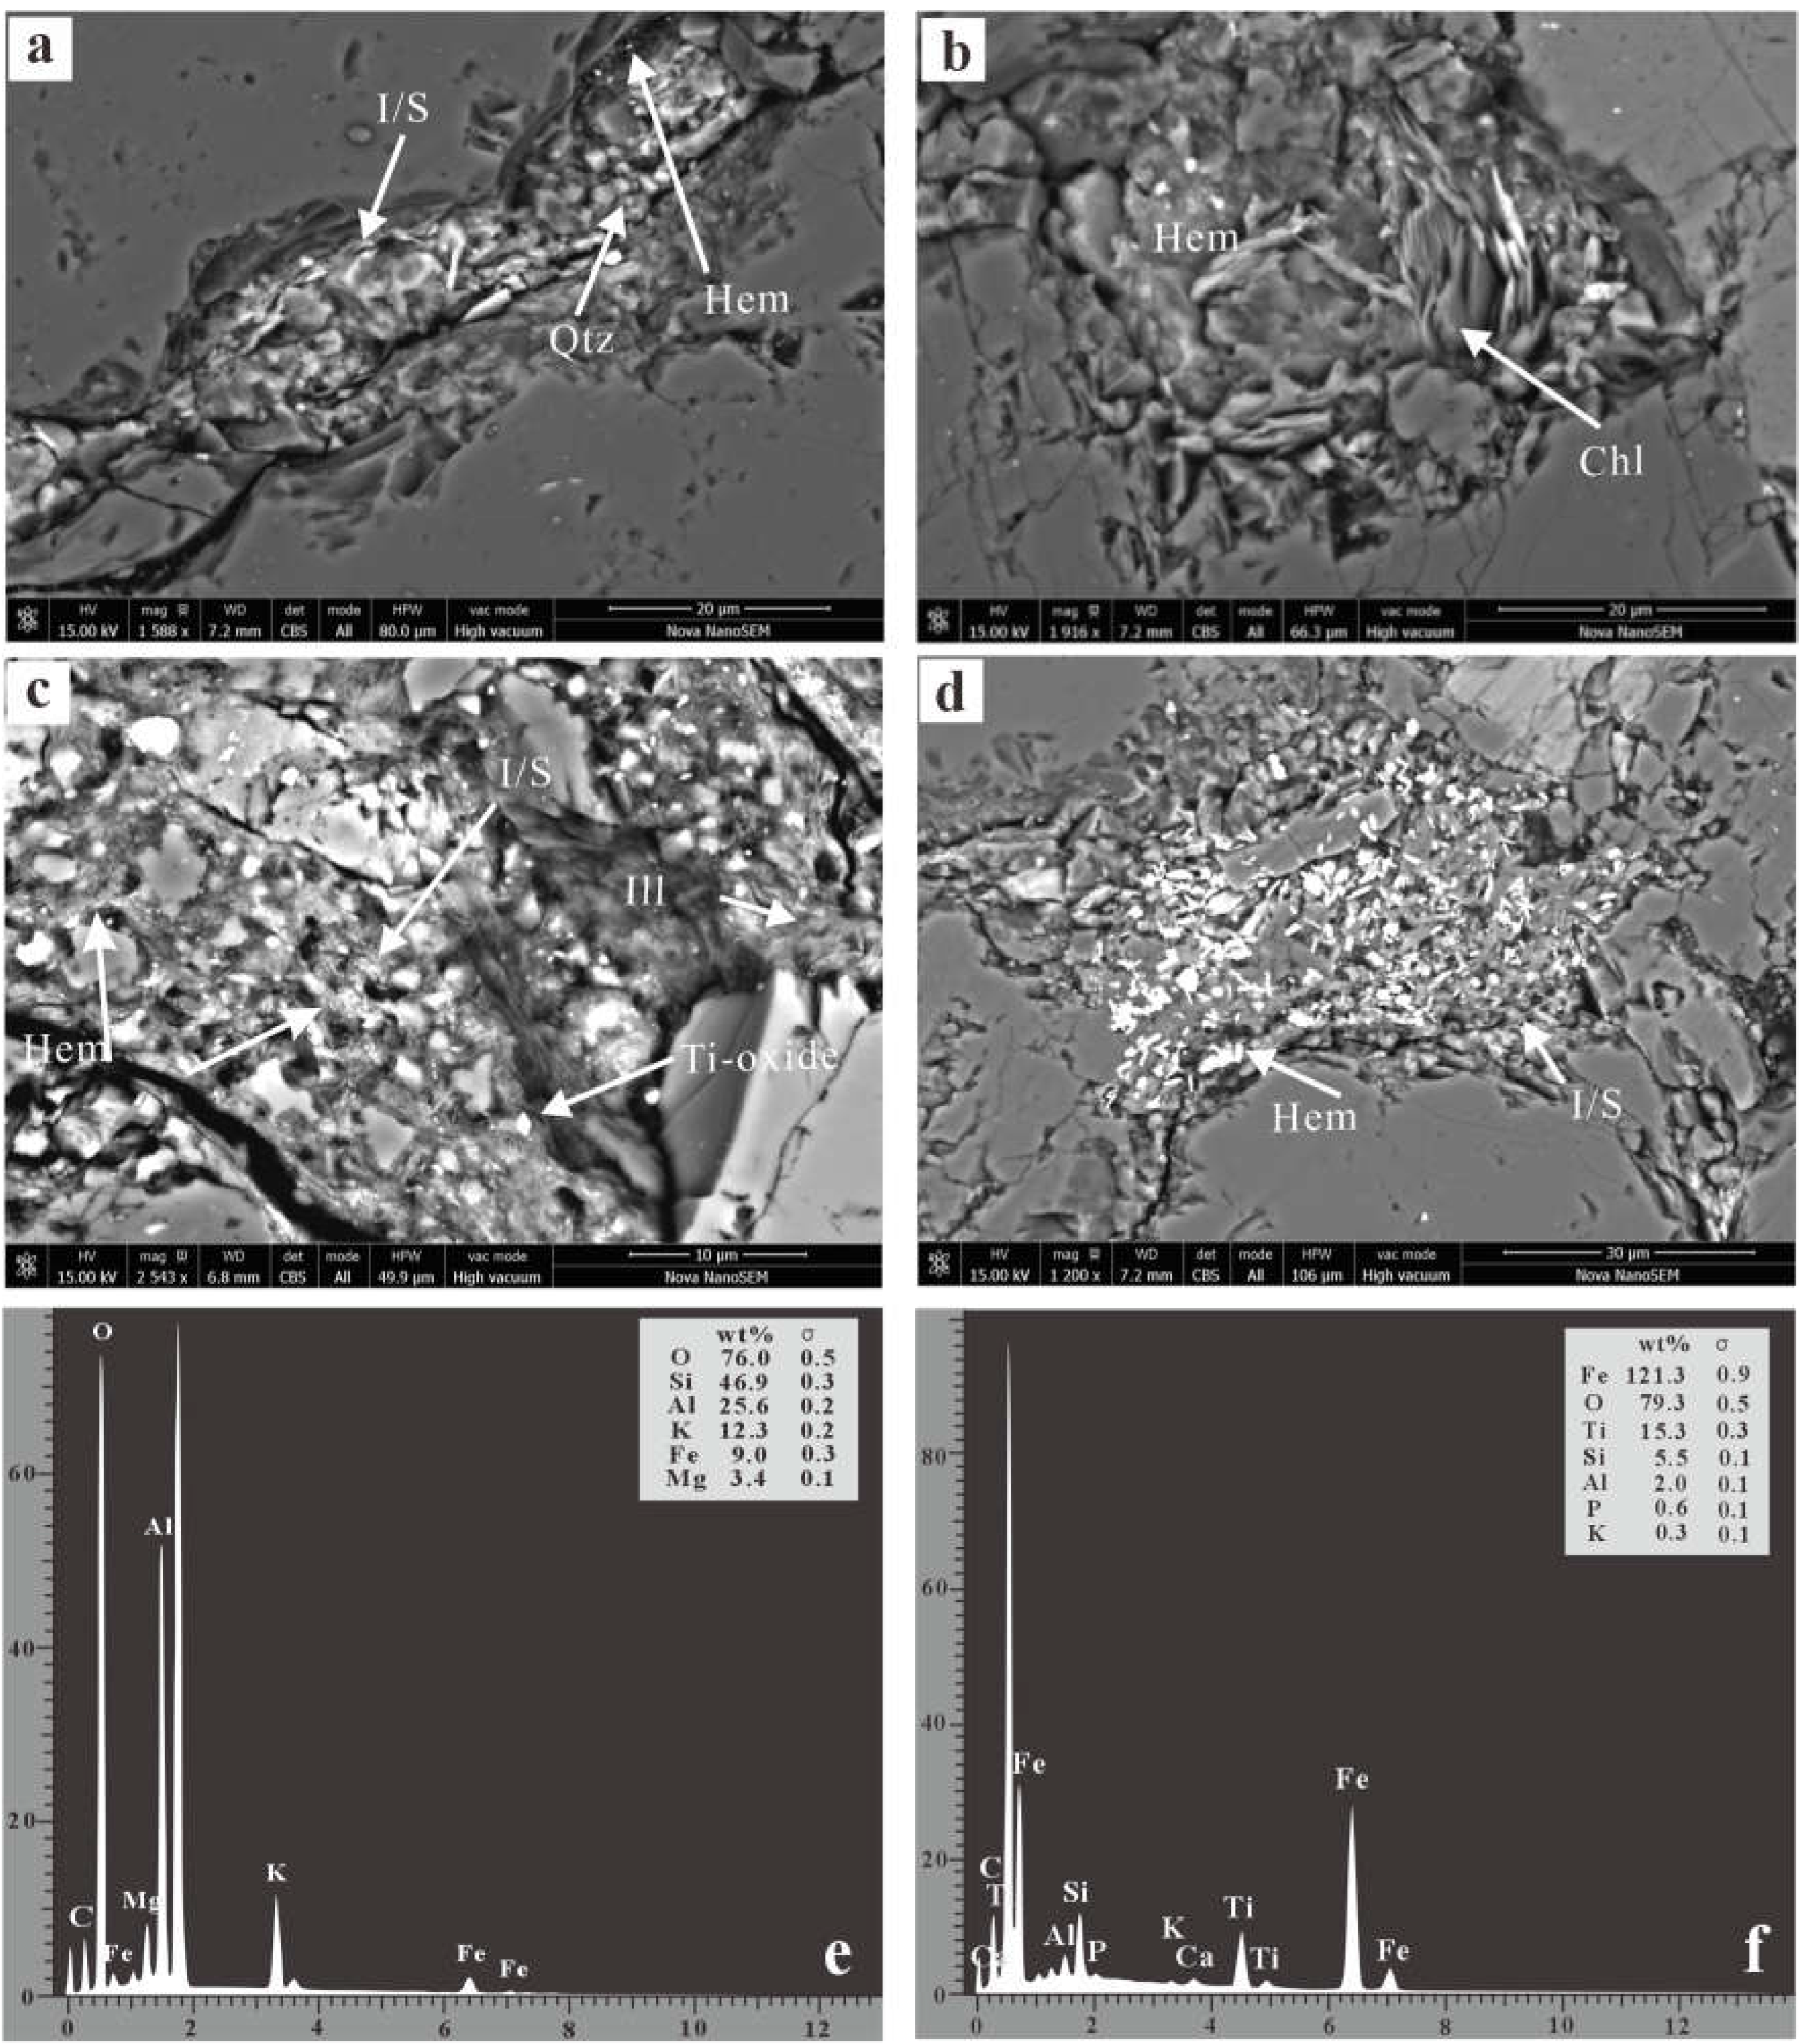
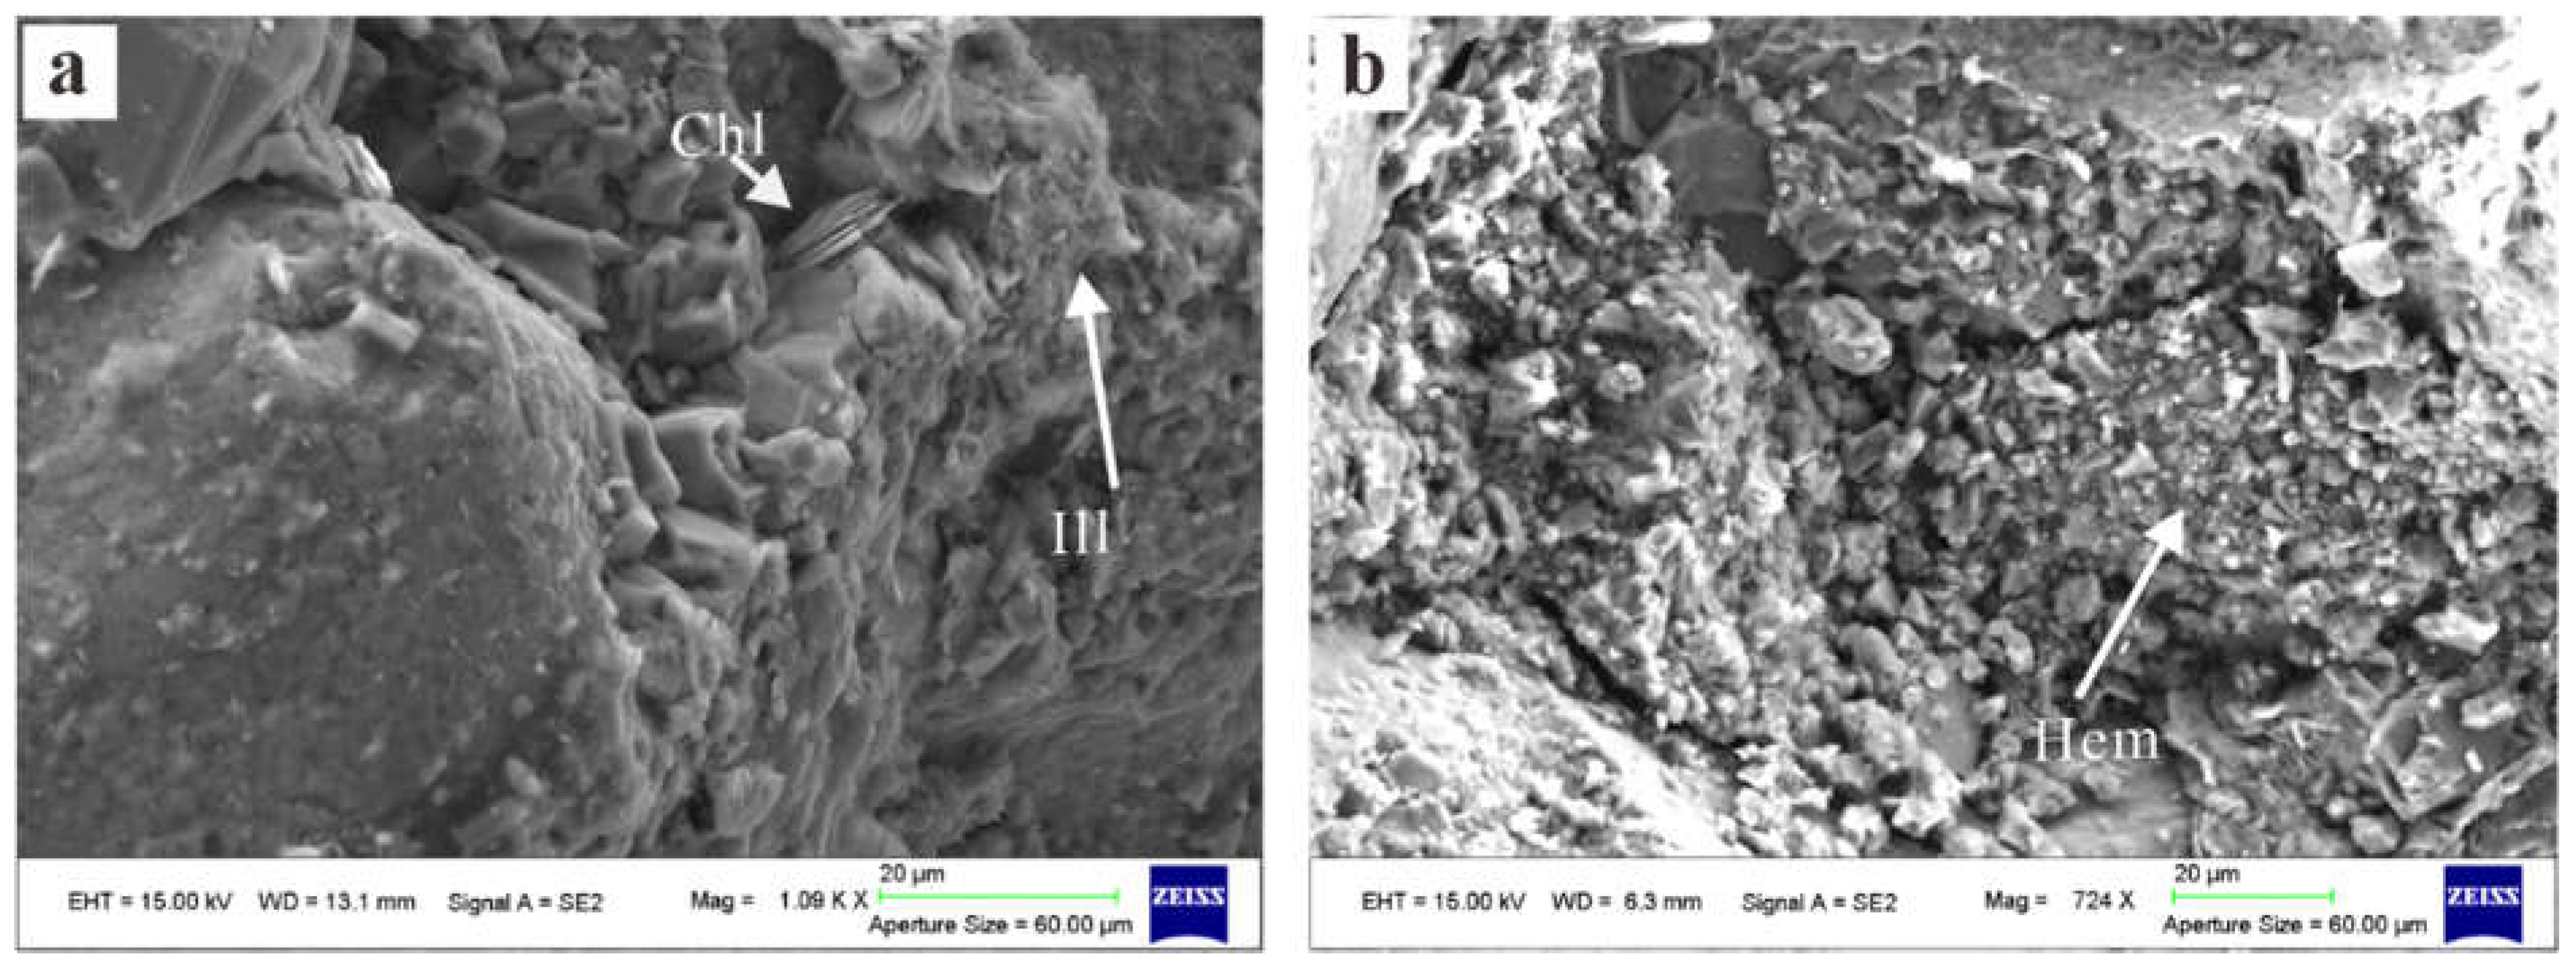
4.2. Diagenetic Authigenic Mineral Characteristics of Red Sandstone
4.2.1. Hematite
4.2.2. Authigenic Carbonate
4.2.3. Secondary Quartz Overgrowth
4.2.4. Authigenic Feldspar
4.2.5. Analcime
4.2.6. Clay Minerals
4.3. X-Ray Diffraction Patterns of Clay Minerals in Red Sandstone and Mudstone
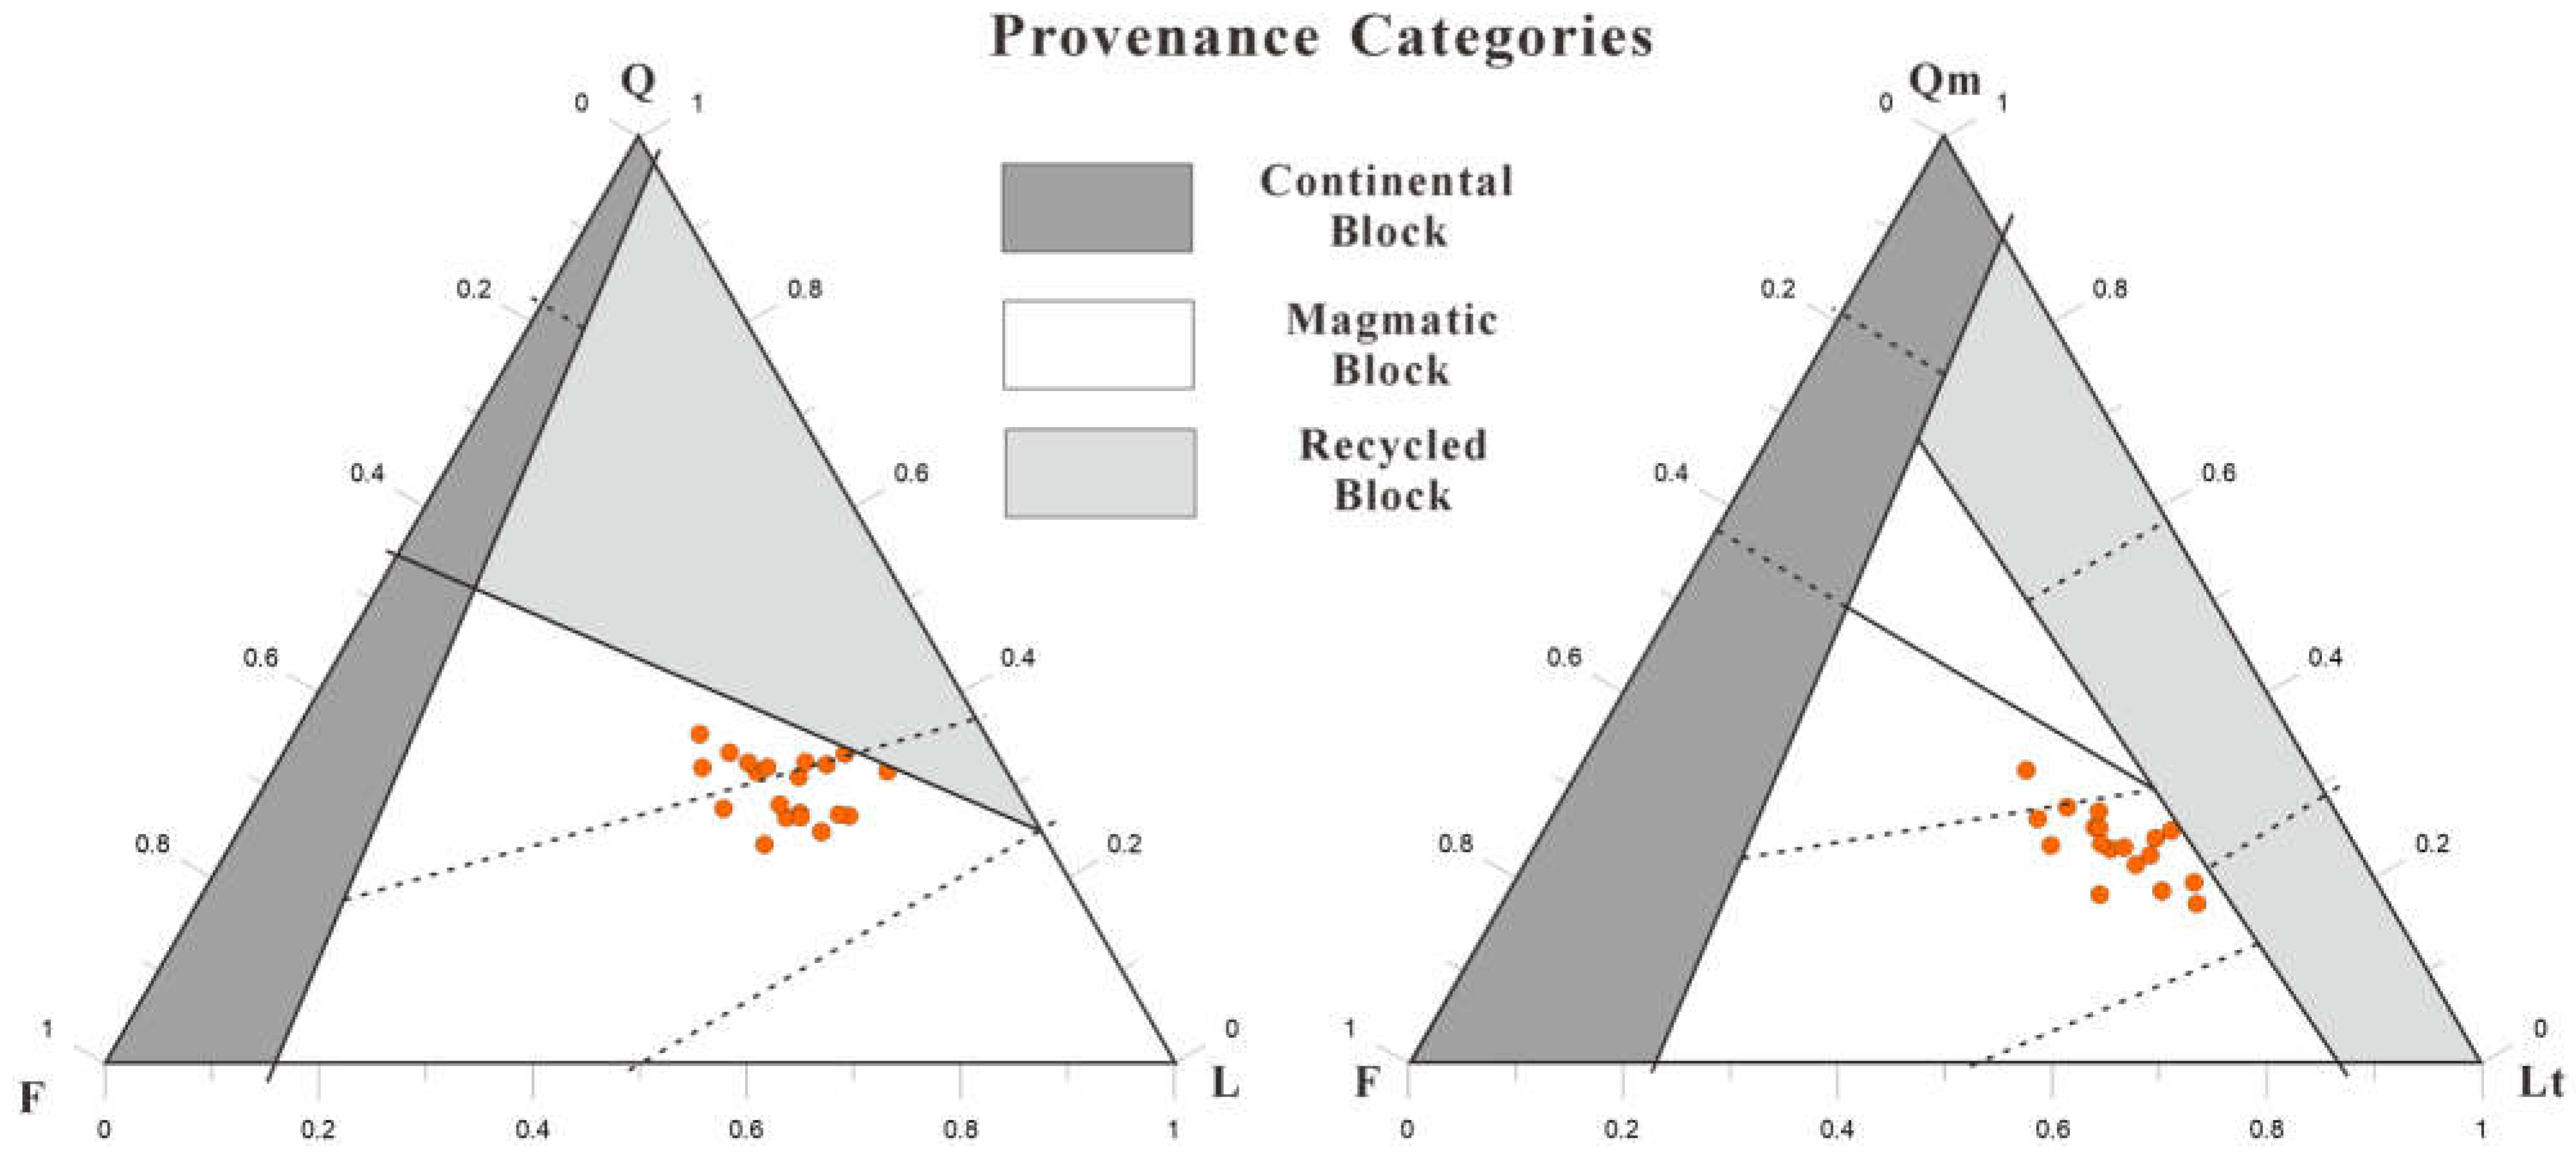
4.4. Geochemical Characteristics
5. Discussion
5.1. Formation Time of Red Beds
5.2. Paleoenvironment and Paleoclimatology of Red Beds

| Region | System | Geochemical Index | Index Range Characteristics | Red Bed Genesis | References |
|---|---|---|---|---|---|
| Songliao Basin, China | Cretaceous | CIA | 56.2~67.8 | The early weathering is weak, and it is formed in an oxygen-rich water environment in an arid climate | Song et al., 2015 [76] |
| V/cr | 1.0~1.7 | ||||
| Ni/Co | 1.9~2.5 | ||||
| U/Th | 0.1~0.2 | ||||
| Sr/Cu | 1.0~10.0 | ||||
| Sichuan Basin, China | Jurassic | CIA | 66.2–75.3 | Weathering of source rocks | Jiang et al., 2023 [32] |
| CIW | 77.5–86.6 | ||||
| Lufengchuan Street Basin, China | Jurassic | CIA | 62.5–78.0 | The weathering conditions are moderate, and the red beds are mainly formed in the post-sedimentary oxygen-rich sedimentary water | Wang et al., 2024 [77] |
| U/Th | 0.16–1.03 | ||||
| V/Cr | 0.50–1.85 | ||||
| Cala Viola, Italy | Permian | CIA | 86.8–98.5 | Non-weathering formation, good drainage, and oxidative sedimentary water conditions promote the formation of red beds | Sheldon et al., 2005 [70] |
| Al2O3 | 4.99%–20.65% | ||||
| CaO | 0.03%–0.18% | ||||
| Sr | 36–272 ppm | ||||
| Mersin area, Turkey | Miocene | Mn/Fe | 0.003–0.023 | It is formed in an alternating wet and dry climate environment, in an oxidizing water sedimentary environment | Eren et al., 2015 [67] |
| Ni/Co | 2.3–9.2 | ||||
| Sr/Ba | 0.3–2.2 | ||||
| Transvaal and Olifantshoek Basin, South Africa | Paleoproterozoic | CIA | 72–78 | Formed by early weathering and post-deposition oxidation | Land et al., 2017 [78] |
| Al2O3 | 12.9–20.3 | ||||
| CaO | 0.01–1.5 | ||||
| MgO | 0.2–2.3 |
5.3. Insights from Red Bed Sedimentary Facies
6. Conclusions
- (1)
- Red beds formed during the earliest diagenetic stage, either during sedimentation or shortly after, with the growth of authigenic cement occurring later than the development of hematite.
- (2)
- The distribution patterns of major and trace elements, along with core observations, indicate that the paleostructure was gentle during the deposition of the red beds. The paleoclimate remained persistently arid, with shallow, oxygen-rich depositional waters, characterizing the overall sedimentation as belonging to an arid deltaic plain.
- (3)
- Petrographic analysis revealed that the iron in hematite mainly comes from the transformation of volcanic rock fragments during the syn-sedimentary and early diagenetic stages, especially those unstable iron-bearing silicates (ilmenite, magnetite, olivine, pyroxene). The conversion of montmorillonite to illite is a secondary source of iron. This study can provide new insights for understanding global red bed sedimentary mechanisms and late Jurassic paleoclimate reconstruction. Notably, the grey organic-rich sandstone interspersed in the red bed sequence may pose a potential interfering factor. Lithofacies and geochemical evidence show that these grey sandstones and adjacent red beds are not significantly different in initial sedimentary environment conditions. We propose a new genetic model: the anomalous coloration of gray sandstone may be due to secondary bleaching caused by hydrocarbon fluid migration in the later diagenetic stage. In order to test this hypothesis, follow-up research plans focus on the geochemical mechanism of the bleaching process and its spatiotemporal evolution.
Author Contributions
Funding
Data Availability Statement
Conflicts of Interest
References
- Parry, W.T.; Chan, M.A.; Nash, B.P. Diagenetic characteristics of the Jurassic Navajo Sandstone in the Covenant oil field, central Utah thrust belt. AAPG Bull. 2009, 93, 1039–1061. [Google Scholar] [CrossRef]
- Leanza, H.A.; Hugo, C.A. Cretaceous red beds from southern NeuquénBasin (Argentina): Age, distribution and stratigraphic discontinuities. In VII International Symposium on Mesozoic Terrestrial Ecosystems; 7º International Symposium on Mesozoic Terrestrial Ecosystems; Asociación Paleontológica Argentina: Buenos Aires, Argentina, 2001; Publicación Especial 7; pp. 117–122, (Abstract). [Google Scholar]
- Aehnelt, M.; Hilse, U.; Pudlo, D.; Heide, K.; Gaupp, R. On the origin of bleaching phenomena in red bed sediments of Triassic Buntsandstein deposits in Central Germany. Geochemistry 2021, 81, 125736. [Google Scholar] [CrossRef]
- Eren, M.; Kadir, S. Colour origin of red sandstone beds within the Hüdai Formation (Early Cambrian), Aydıncık (Mersin), southern Turkey. Turk. J. Earth Sci. 2013, 22, 563–573. [Google Scholar] [CrossRef]
- Xie, D.; Yao, S.; Cao, J.; Hu, W.; Wang, X.; Zhu, N. Diagenetic alteration and geochemical evolution during sandstones bleaching of deep red-bed induced by methane migration in petroliferous basins. Mar. Pet. Geol. 2021, 127, 104940. [Google Scholar] [CrossRef]
- Houten, F.B.V. Origin of Red Beds A Review-1961–1972. Annu. Rev. Earth Planet. Sci. 1973, 1, 39–61. [Google Scholar] [CrossRef]
- Tsirambides, A. Genesis and physical characteristics of the neogene red beds from the cedarhils of thessaloniki, macedonia, Greece. Bull. Geol. Soc. Greece 2018, 36, 708–716. [Google Scholar] [CrossRef]
- Eren, M.; Kadir, S. Colour origin of upper cretaceous pelagic red sediments within the Eastern Pontides, northeast Turkey. Int. J. Earth Sci. 1999, 88, 593–595. [Google Scholar] [CrossRef]
- Turner, P. Diagenetic origin of Cambrian marine red beds: Caerfai Bay Shales, Dyfed, Wales. Sediment. Geol. 1979, 24, 269–281. [Google Scholar] [CrossRef]
- Frostick, L.E.; Reid, I. Tectonic control of desert sediments in rift basins ancient and modern. Geol. Soc. Lond. Spec. Publ. 1987, 35, 53–68. [Google Scholar] [CrossRef]
- Metcalfe, R.; Rochelle, C.A.; Savage, D.; Higgo, J.W. Fluid-rock interactions during continental red bed diagenesis: Implications for theoretical models of mineralization in sedimentary basins. Geol. Soc. Lond. Spec. Publ. 1994, 78, 301–324. [Google Scholar] [CrossRef]
- Lai, J.; Li, D.; Wang, G.; Xiao, C.; Cao, J.; Wu, C.; Han, C.; Zhao, X.; Qin, Z. Can carbonate cementation be inhibited in continental red bed sandstone? J. Pet. Sci. Eng. 2019, 179, 1123–1135. [Google Scholar] [CrossRef]
- He, W.; Yang, Z.; Du, H.; Hu, J.; Zhang, K.; Hou, W.; Li, H. Micro-Mechanisms and Implications of Continental Red Beds. Minerals 2022, 12, 934. [Google Scholar] [CrossRef]
- Xu, Q.; Wang, Y.; Ma, L.; Yue, Y.; Meng, T.; Bi, J.; Jiang, C. Paleoclimate quantitative reconstruction and characteristics of continental red beds: A case study of the lower fourth sub-member of Shahejie Formation in the Bonan Sag. J. Pet. Explor. Prod. Technol. 2023, 13, 1993–2014. [Google Scholar] [CrossRef]
- Kirkham, R. Distribution, settings, and genesis of sediment-hosted stratiform copper deposits. Geol. Assoc. Can. Spec. Pap. 1989, 36, 3–38. [Google Scholar]
- Hölting, B. Geogene Grundwasserbeschaffenheit und ihre regionale Verbreitung in der Bundesrepublik Deutschland. Handb. Bodenschutz 1991, 1, 1300. [Google Scholar]
- Tesmer, M.; Möller, P.; Wieland, S.; Jahnke, C.; Voigt, H.; Pekdeger, A. Deep reaching fluid flow in the North East German Basin: Origin and processes of groundwater salinisation. Hydrogeol. J. 2007, 15, 1291–1306. [Google Scholar] [CrossRef]
- Rödiger, T.; Sauter, M.; Büchel, G. Infiltration und Grundwasserströmung in geklüftet-porösen Buntsandsteingrundwasserleitern im Osten des Thüringer Beckens. Grundwasser 2009, 14, 21–32. [Google Scholar] [CrossRef]
- Tomlinson, C.W. The Origin of Red Beds: A Study of the Conditions of Origin of the Permo-Carboniferous and Triassic Red Beds of the Western United States. J. Geol. 1916, 24, 153–179. [Google Scholar] [CrossRef]
- Walker, T.R. Formation of Red Beds in Modern and Ancient Deserts. GSA Bull. 1967, 78, 353–368. [Google Scholar] [CrossRef]
- Walker, T.R. Diagenetic origin of continental red beds. In The Continental Permain in Central, West, and South Europe: Proceedings of the NATO Advanced Study Institute held at the Johannes Gutenberg University, Mainz, FRG, 23 September–4 October 1975; Springer: Berlin/Heidelberg, Germany, 1976; pp. 240–282. [Google Scholar]
- Franke, W.; Paul, J. Pelagic redbeds in the Devonian of Germany—deposition and diagenesis. Sediment. Geol. 1980, 25, 231–256. [Google Scholar] [CrossRef]
- Goudie, A.S.; Pye, K. (Eds.) Chemical Sediments and Geomorphology: Precipitates and Residua in the Nearsurface Environment; Academic Press: London, UK; New York, NY, USA, 1983; 439p, ISBN 0122934806. [Google Scholar]
- Krynine, P.D. Section of geology and mineralogy: The origin of red beds. Trans. N. Y. Acad. Sci. 1949, 11, 60–68. [Google Scholar] [CrossRef]
- Folk, R.L. Reddening of desert sands; Simpson Desert, NT, Australia. J. Sediment. Res. 1976, 46, 604–615. [Google Scholar] [CrossRef]
- Besly, B.; Turner, P. Origin of red beds in a moist tropical climate (Etruria Formation, Upper Carboniferous, UK). Geol. Soc. Lond. Spec. Publ. 1983, 11, 131–147. [Google Scholar] [CrossRef]
- Miot, J.; Benzerara, K.; Morin, G.; Kappler, A.; Bernard, S.; Obst, M.; Férard, C.; Skouri-Panet, F.; Guigner, J.-M.; Posth, N.; et al. Iron biomineralization by anaerobic neutrophilic iron-oxidizing bacteria. Geochim. Cosmochim. Acta 2009, 73, 696–711. [Google Scholar] [CrossRef]
- Jiang, L.; Chen, G.; Grapes, R.; Peng, Z. Thermal origin of continental red beds in SE China: An experiment study. J. Asian Earth Sci. 2015, 101, 14–19. [Google Scholar] [CrossRef]
- Zhang, L.; Liu, C.; Zhang, S.; Fayek, M.; Lei, K.; Quan, X. Unconformity-controlled bleaching of Jurassic-Triassic sandstones in the Ordos Basin, China. J. Pet. Sci. Eng. 2022, 211, 110154. [Google Scholar] [CrossRef]
- Shahrokhi, S.; Bábek, O.; Mansurbeg, H.; Ackerman, L.; Šimíček, D.; Gregar, F.; Kořenek, M. Investigating the impact of paleoclimatic conditions and diagenesis on the genesis of Permian Continental Red Beds: A case study from the Bohemian Massif, Czechia. Sediment. Geol. 2024, 470, 106723. [Google Scholar] [CrossRef]
- Liu, M.; Ji, C.; Huang, Y.; Ding, Y.; Chen, R.; Chen, M.; Yang, B.; Chen, D. Coloration and Environmental Significance of the Marine Red Bed from the Sowa Formation Carbonate in the Qiangtang Basin. Acta Sedimentol. Sin. 2024, 42, 812–822. [Google Scholar]
- Jiang, H.; Xia, Q.; Liu, S.; Zhang, X.; Li, J.; Wang, Y. Investigation of Weathering Intensity and Color Genesis of Terrestrial Sediments: A Case Study of the Upper Shaximiao Formation in the Middle Jurassic Sichuan Basin. J. Sedimentol. 2023, 41, 1025–1039. [Google Scholar] [CrossRef]
- Guo, X.; Hu, D.; Li, Y.; Duan, J.; Zhang, X.; Fan, X.; Duan, H.; Li, W. Theoretical Advancements and Key Technologies in Onshore Ultra-Deep Oil and Gas Exploration. Engineering 2019, 5, 233–258. [Google Scholar] [CrossRef]
- Guan, X.; Guo, L. New Advances and Prospects in Research on Reservoir Formation of Deep and Ultra-Deep Oil and Gas. Pet. Exp. Geol. 2023, 45, 203–209. [Google Scholar]
- Cao, Y.; Yuan, G.; Yang, H.; Wang, Y.; Liu, K.; Zan, N.; Xi, K.; Wang, J. Current Status of Oil and Gas Exploration in Deep and Ultra-Deep Clastic Rock Basins and Research Progress on the Genesis of Quality Reservoirs. J. Petroleum. 2022, 43, 112–140. [Google Scholar]
- Ma, Y.; Cai, X.; Zhao, P. Characteristics and Formation Mechanisms of Reef Beach Facies Reservoirs in the Changxing and Feixiguan Formations of the Yuanba Gas Field. J. Petroleum. 2014, 35, 1001–1011. [Google Scholar]
- Jinag, X.; Guan, H.; Zheng, H.; Wang, S.; Fan, M.; Bao, Y.; Li, F.; Han, Y. Discussion on the Genesis of Dolomite Reservoirs in the Feixianguan Formation of the Puguang Gas Field in the Sichuan Basin. J. Pet. Exp. Geol. 2014, 36, 332–336+345. [Google Scholar]
- He, Z. The Genesis of the Jurassic Red Beds in the Yongjin Area of the Junggar Basin. Xinjiang Pet. Geol. 2009, 30, 133–135. [Google Scholar]
- Ding, X.; Shen, Y.; Zhao, Y.; Zhang, Y. The Genesis of the Jurassic Red Beds in the Yongjin Area of the Junggar Basin. Pet. Geol. Recovery Effic. 2009, 16, 12–14+111. [Google Scholar]
- Jiao, Y.; Wu, L.; Lu, Y.; Ren, J. The Diagenetic Processes of the Red Beds at the Top of the Jurassic System in the Central Part of the Junggar Basin and the Evolutionary Information of the Chepaizi-Mosuowan Paleouplift. Earth Sci. (J. China Univ. Geosci.) 2008, 33, 219–226. [Google Scholar]
- Li, Z.; Yang, M.; Tian, Z. The Origin and Geological Significance of the Continental Red Beds of the Qi Gu Formation in the Yongjin Area, Southern Margin of the Junggar Basin. Xinjiang Geol. 2023, 41, 577–585. [Google Scholar]
- Zhao, B. The formation and evolution of the Junggar Basin. Xinjiang Pet. Geol. 1992, 13, 191–196. [Google Scholar]
- Zhao, B. The Structural Characteristics and Tectonic Division of the Junggar Basin. Xinjiang Pet. Geol. 1993, 14, 209–216. [Google Scholar]
- Wang, H. The Structural Characteristics of the Zhungarian Oil and Gas Basin in Xinjiang. Xinjiang Pet. Geol. 1983, 4, 1–17. [Google Scholar]
- Zhang, L.; Li, C.; Luo, X.; Zhang, Z.; Zeng, Z.; Ren, X.; Lei, Y.; Zhang, M.; Xie, J.; Cheng, M.; et al. Vertically transferred overpressures along faults in Mesozoic reservoirs in the central Junggar Basin, northwestern China: Implications for hydrocarbon accumulation and preservation. Mar. Pet. Geol. 2023, 150, 106152. [Google Scholar] [CrossRef]
- Zhou, J.; Li, C.; Song, Z.; Zhang, X. Organic Geochemical Characteristics and Hydrocarbon Significance of the Permian System Around the Bogda Mountain, Junggar Basin, Northwest China. Sustainability 2025, 17, 347. [Google Scholar] [CrossRef]
- Li, C.; Zhang, L.; Luo, X.; Zeng, Z.; Xiu, J.; Lei, Y.; Cheng, M.; Hu, C.; Zhang, M.; He, W. Clay mineral transformations of mesozoic mudstones in the central Junggar Basin, northwestern China: Implications for compaction properties and pore pressure responses. Mar. Pet. Geol. 2022, 144, 105847. [Google Scholar] [CrossRef]
- Zhang, Z.; Zhang, L.; Yan, Y.; Zhang, L. Application of Sedimentary Forward Simulation in Predicting the Distribution of Braided River Delta Sand Bodies in the Xishanyao Formation of the Yongjin Area, Junggar Basin. Nat. Gas Geosci. 2024, 35, 2064–2077. [Google Scholar]
- Wu, X.; Zhang, N.; Shi, X.; Zhou, L.; Zhang, Y.; Yang, G.; Guan, S. Structural Characteristics and Hydrocarbon Accumulation Model of the Chemo Uplift in the Junggar Basin. China Pet. Explor. 2006; 11, 65–68+84. [Google Scholar]
- Zhao, H. Evolution of the Chemo Uplift and Its Hydrocarbon Accumulation Control in the Junggar Basin. Xinjiang Pet. Geol. 2006, 160–162. [Google Scholar]
- Qiao, Y.; Sui, F.; Lin, H.; Song, C. The Control of the Che-Mo Paleouplift on Oil and Gas in the Central Part of the Junggar Basin. J. Pet. Nat. Gas Geol. 2013, 35, 56–61. [Google Scholar]
- Jin, X. Sedimentary Reservoir Study of the Jurassic Qigu Formation in the Yongjin Area of the Junggar Basin. Master’s Thesis, China University of Petroleum (Beijing), Beijing, China, 2023. [Google Scholar] [CrossRef]
- Huang, C.; Zhu, X.; Jin, X.; Hu, X.; Xiu, J.; Ren, X.; Cheng, C. Quantitative Characterization of the Impact of Diagenesis on Reservoir Quality of Deep-Buried Sandstones in the Qigu Formation in the Yongjin Area of the Junggar Basin. J. Palaeogeogr. 2024, 26, 683–699. [Google Scholar]
- Luo, Y. Characteristics and Geological Significance of Seismic Sedimentary Rocks in the Jurassic Qigu Formation in the Yongjin Area of the Junggar Basin. Low Carbon World. 2024, 14, 121–123. [Google Scholar] [CrossRef]
- Xie, Y.; Li, H.; Sun, Z. Discovery of a Weathering Crust between Jurassic and Cretaceous and Its Stratigraphic Significance in the Shinan Area of the Junggar Basin. Geol. Rev. 2006, 52, 137–144. [Google Scholar] [CrossRef]
- Yang, Z.; He, S.; Wu, H.; Meng, X. Evidence of Existence and Research Significance of the Toutunhe Formation in the Middle Segment of the Che-Mo Paleouplift Within the Central Part of the Junggar Basin. Acta Geosci. Sin. 2008, 52, 469–477. [Google Scholar]
- Liu, M.; Tian, Y.; Yang, M.; Wang, X.; Huang, H.; Li, G. Sedimentary Characteristics and Depositional Models of the Top Part of the Xishanyao Formation in the Yongjin Area, Junggar Basin. J. East China Inst. Technol. (Nat. Sci. Ed.) 2021, 44, 590–601. [Google Scholar]
- Song, F.; Kong, Q.; Zhang, X.; Cao, H.; Jiao, G.; Yang, Y. Sedimentary Characteristics and Depositional Models of Arid Shallow Water Deltas: A Case Study of the Jurassic Qigu Formation in the Yongjin Area, Central Part of the Junggar Basin. Pet. Geol. Gas Geol. 2024, 45, 1–14. [Google Scholar]
- Qiao, D.; Jin, X.; Shi, G.; Hong, Y.; Shi, Z. Significance of Jurassic Qigu Formation Continental Trace Fossils and Paleoenvironments in the Northern Tianshan Region of Xinjiang. J. Chengdu Univ. Technol. (Nat. Sci. Ed.) 2023, 50, 268–278. [Google Scholar]
- Fang, S.; Guo, Z.; Song, Y.; Wu, C.; Zhang, Z.; Wang, M.; Fan, R. Jurassic Sedimentary Facies Evolution and Basin Configuration in the Southern Margin of the Junggar Basin. J. Palaeogeogr. 2005, 7, 347–356. [Google Scholar]
- Fan, Y. Sedimentary Facies and Depositional Environment of the Upper Jurassic Qigu Formation in the Southern Margin of the Junggar Basin, Xinjiang. Master’s Thesis, Chang’an University, Xi’an, China, 2021. [Google Scholar] [CrossRef]
- Zhang, D.-P.; Xue, D.-S.; Liu, Y.-H.; Wan, B.; Guo, Q.; Guo, J.-J. Comparative Study of Three Mixing Methods in Fusion Technique for Determining Major and Minor Elements Using Wavelength Dispersive X-ray Fluorescence Spectroscopy. Sensors 2020, 20, 5325. [Google Scholar] [CrossRef]
- Folk, R.L. Petrology of Sedimentary Rocks; Hemphill Pub. Co., Hemphill Publishing Company: Austin, TX, USA, 1980. [Google Scholar]
- Dickinson, W.R.; Suczek, C.A. Plate tectonics and sandstone compositions. Aapg Bull. 1979, 63, 2164–2182. [Google Scholar]
- Taylor, S.R.; Mclennan, S.M. The continental crust: Its composition and evolution. J. Geol. 1985, 94, 57–72. [Google Scholar]
- McLennan, S.M. Weathering and Global Denudation. J. Geol. 1993, 101, 295–303. [Google Scholar] [CrossRef]
- Eren, M.; Kadir, S.; Kapur, S.; Huggett, J.; Zucca, C. Colour origin of Tortonian red mudstones within the Mersin area, southern Turkey. Sediment. Geol. 2015, 318, 10–19. [Google Scholar] [CrossRef]
- Hu, X.; Wang, S.; Li, X.; Jansa, L. The Paleogene Ocean Red Beds in Southern Tibet: Rock Types, Sedimentary Environments, and Color Genesis. Sci. China: Earth Sci. 2006, 36, 811–821. [Google Scholar]
- Liu, X.; Meng, J.; Xie, Y.; Li, B.; Chi, Y.; Kang, C.; Sun, L.; Wei, Z.; Liu, H.; Wang, Y.; et al. Color Mechanisms of Continental Red Beds in the Luojiawopeng Formation at the Southeastern Edge of the Songnen Plain. Acta Geosci. Sin. 2024, 1–12. Available online: http://kns.cnki.net/kcms/detail/11.3474.P.20250205.1537.002.html (accessed on 10 February 2025).
- Sheldon, N.D. Do red beds indicate paleoclimatic conditions?: A Permian case study. Palaeogeogr. Palaeoclimatol. Palaeoecol. 2005, 228, 305–319. [Google Scholar] [CrossRef]
- Zhu, Y.; Wang, L.; Zhang, F. Main Controlling Factors of Hidden Hydrocarbon Accumulations in the Yongjin Area. Nat. Gas Ind. 2008, 28, 28–31+138–139. [Google Scholar]
- Xiu, J.; Wang, X.; Liu, S.; Miao, H.; Ding, J. Reservoir Characteristics and Influencing Factors of the Xishanyao Formation in the Yongjin Area, Junggar Basin. Pet. Geol. Eng. 2015, 29, 28–30+145–146. [Google Scholar]
- Lan, X. Discussion on Clay Minerals as Paleoclimatic Indicator Minerals. Geol. Sci. Technol. Inf. 1990, 9, 31–35. [Google Scholar]
- Tang, Y.; Jia, J.; Xie, X. The Environmental Significance of Clay Minerals. Earth Sci. Front. 2002, 9, 94–101. [Google Scholar]
- Dong, H.; Song, Y. Application of Clay Minerals in Paleoenvironmental Reconstruction. Mar. Geol. Quat. Geol. 2009, 29, 119–130. [Google Scholar] [CrossRef]
- Song, S.; Liu, Z.; Sun, P.; Wang, Y.; Xie, W.; Song, Q. Geochemical Characteristics and Provenance Analysis of Red Mudstone Sequences: A Case Study of the Upper Cretaceous Yaojia Formation in the Southeastern Uplift Area of the Songliao Basin. World Geol. 2015, 34, 774–785. [Google Scholar]
- Wang, W.; Li, S.; Zhang, Y.; Yuan, Y.; Pang, Z.; Zhao, J. Characteristics of Greenhouse Climate and Environmental Changes during the Middle to Late Jurassic in the Lufeng-Chuanjie Basin, Central Yunnan, and Their Impact on Biological Preservation. J. Jilin Univ. (Earth Sci. Ed.) 2024, 54, 1530–1543. [Google Scholar] [CrossRef]
- Land, J.S.; Tsikos, H.; Cousins, D.; Luvizotto, G.; Zack, T. Origin of red beds and paleosols in the Palaeoproterozoic Transvaal and Olifansthoek Supergroups of South Africa: Provenance versus metasomatic controls. Geol. J. 2018, 53, 191–202. [Google Scholar] [CrossRef]
- Garzanti, E.; Andò, S.; Padoan, M.; Vezzoli, G.; El Kammar, A. The modern Nile sediment system: Processes and products. Quat. Sci. Rev. 2015, 130, 9–56. [Google Scholar] [CrossRef]
- Boboye, O.A.; Nwosu, O.R. Petrography and geochemical indices of the Lagos lagoon coastal sediments, Dahomey Basin (southwestern Nigeria): Sea level change implications. Quat. Int. 2014, 338, 14–27. [Google Scholar] [CrossRef]
- Sun, J.; Fu, Y.; Lan, C. Trace Element Geochemical Characteristics of Clastic Rocks in Baxiandun, Qingdao, and Their Implications for Sedimentary Environment. Mar. Sci. 2014, 38, 75–81. [Google Scholar]
- Song, L.; Liu, C.; Zhao, H.; Wang, J.; Zhang, X. Geochemical Characteristics of the Huangqikou Formation and Their Implications for Depositional Environment and Tectonic Background in the Ordos Region. Earth Sci. 2016, 41, 1295–1308+1321. [Google Scholar]
- Chen, G.; Li, C.; Li, H.; Cha, K. Geochemical Characteristics of Continental Red Beds from the Upper Cretaceous in the Northern Guangdong Danxia Basin and Their Implications for Paleoclimate. Publ. J. Sedimentol. 2025, 1–32. [Google Scholar] [CrossRef]
- Price, J.R.; Velbel, M.A. Chemical weathering indices applied to weathering profiles developed on heterogeneous felsic metamorphic parent rocks. Chem. Geol. 2003, 202, 397–416. [Google Scholar] [CrossRef]
- Harnois, L. The CIW index: A new chemical index of weathering. Sediment. Geol. 1988, 55, 319–322. [Google Scholar] [CrossRef]
- Feng, L.; Chu, L.; Zhang, Q.; Zhang, T. Chemical Index of Alteration (CIA) and Its Application in Neoproterozoic Clastic Rocks. Earth Sci. Front. 2003, 10, 539–544. [Google Scholar]
- Xu, X.; Shao, L. Limiting Factors in Analyzing the Degree of Weathering in Source Areas Using Clay Mineral Chemical Index of Alteration. J. Palaeogeogr. 2018, 20, 515–522. [Google Scholar]
- Hatch, J.R.; Leventhal, J.S. Relationship between inferred redox potential of the depositional environment and geochemistry of the Upper Pennsylvanian (Missourian) Stark Shale Member of the Dennis Limestone, Wabaunsee County, Kansas, USA. Chem. Geol. 1992, 99, 65–82. [Google Scholar] [CrossRef]
- Jones, B.; Manning, D.A.C. Comparison of geochemical indices used for the interpretation of palaeoredox conditions in ancient mudstones. Chem. Geol. 1994, 111, 111–129. [Google Scholar] [CrossRef]
- Tian, Y. Palynological Assemblages and Paleoclimate Studies of the Jurassic in the Central and Western Regions of the Junggar Basin. Master’s Thesis, China University of Geosciences (Beijing), Beijing, China, 2017. [Google Scholar]
- Liu, D. Paleoclimate Analysis of the Jurassic Shihuogou Formation in the Fukang Depression of the Junggar Basin. Sci. Technol. Inf. 2019, 17, 75–76+78. [Google Scholar] [CrossRef]
- Luo, L.; Gao, X.; Tan, X.; Gluyas, J.; Wang, J.; Kong, X.; Huang, J.; Shao, H.; Qu, F. Paleo-environment and provenance in a lacustrine shallow-water delta-meandering river sedimentary system: Insights from the Middle–Upper Jurassic formations of the Fukang Sag of Junggar Basin, NW China. Aust. J. Earth Sci. 2019, 66, 699–722. [Google Scholar] [CrossRef]
- Liu, X.; Lv, B.; Mao, X.; Wen, C.; Yu, M.; Guo, X.; Chen, J.; Wang, T. Variations of Iron Minerals in Eolian Deposits with Environmental Changes and Their Implications. Quat. Res. 2014, 34, 443–457. [Google Scholar]
- Yang, L. A Study on the Sedimentary Characteristics and Formation Mechanisms of Quaternary Red Soils in the Middle and Lower Reaches of the Yangtze River. Ph.D. Thesis, East China Normal University, Shanghai, China, 2017. [Google Scholar]
- Peng, S.; Guo, Z. Similarities and differences in clay mineral composition between aeolian three-toed horse laterite and Quaternary loess and their environmental significance. In Proceedings of the 2007 Annual Conference of Institute of Geology and Geophysics; Chinese Academy of Sciences: Beijing, China, 2008; p. 9. [Google Scholar]
- Dera, G.; Brigaud, B.; Monna, F.; Laffont, R.; Pucéat, E.; Deconinck, J.-F.; Pellenard, P.; Joachimski, M.M.; Durlet, C. Climatic ups and downs in a disturbed Jurassic world. Geology 2011, 39, 215–218. [Google Scholar] [CrossRef]
- Deng, S.; Lu, Y.; Zhao, Y.; Fan, R.; Wang, Y.; Yang, X.; Li, X.; Sun, B. Paleoclimatic Zonation and Evolution of the Jurassic in China. Earth Sci. Front. 2017, 24, 106–142. [Google Scholar] [CrossRef]
- Beitler, B.; Chan, M.A.; Parry, W.T. Bleaching of Jurassic Navajo Sandstone on Colorado Plateau Laramide highs: Evidence of exhumed hydrocarbon supergiants? Geology 2003, 31, 1041–1044. [Google Scholar] [CrossRef]


| Well | Depth | Qtz | Fsp | Rf | ||||
|---|---|---|---|---|---|---|---|---|
| /m | SCQ/% | PCQ/% | Kfs/% | Plg/% | Vrf/% | Srf/% | Mrf/% | |
| Y2 | 5961.1 | 21.0 | 4.4 | 10.6 | 11.8 | 18.5 | 0.0 | 13.3 |
| Y2 | 5963.9 | 21.3 | 6.1 | 7.0 | 7.0 | 26.9 | 0.4 | 16.5 |
| Y2 | 5966.8 | 17.9 | 6.8 | 9.5 | 6.3 | 14.4 | 0.0 | 25.1 |
| Y2 | 5967.5 | 16.8 | 4.4 | 9.8 | 7.1 | 28.0 | 0.0 | 12.4 |
| Y2 | 5968 | 19.2 | 4.5 | 11.3 | 6.3 | 25.3 | 0.0 | 8.9 |
| Y2 | 5969.4 | 16.8 | 2.5 | 9.1 | 7.7 | 22.4 | 0.0 | 14.4 |
| Y2 | 5974.2 | 17.9 | 1.8 | 11.9 | 4.3 | 17.6 | 0.5 | 16.6 |
| Y6 | 6026.1 | 14.2 | 4.3 | 10.0 | 10.8 | 21.0 | 0.0 | 17.9 |
| Y6 | 6026.8 | 14.8 | 5.5 | 6.5 | 8.3 | 11.5 | 0.0 | 16.0 |
| YJ1-1 | 5832.9 | 17.4 | 3.0 | 8.2 | 12.9 | 12.6 | 0.2 | 19.9 |
| YJ1-3 | 5978.0 | 16.7 | 4.1 | 8.1 | 5.6 | 23.8 | 0.0 | 18.8 |
| YJ12 | 5774.5 | 20.9 | 4.5 | 11.1 | 7.7 | 14.5 | 1.9 | 15.1 |
| YJ12 | 5779.4 | 17.2 | 2.4 | 8.8 | 7.3 | 24.7 | 0.8 | 12.8 |
| YJ12 | 5781.5 | 23.3 | 2.9 | 11.8 | 7.9 | 14.9 | 0.5 | 12.5 |
| YJ12 | 5783.1 | 16.1 | 5.5 | 7.2 | 5.0 | 15.1 | 0.0 | 17.6 |
| YJ12 | 5787 | 15.5 | 5.7 | 6.2 | 7.4 | 29.3 | 0.7 | 14.8 |
| YJ14 | 5504.8 | 12.9 | 7.2 | 9.7 | 3.8 | 23.5 | 0.7 | 17.2 |
| YJ3-X17 | 5733.9 | 21.5 | 3.8 | 10.6 | 6.9 | 23.7 | 0.9 | 11.8 |
| YJ3-X17 | 5735.5 | 13.9 | 4.8 | 8.8 | 6.6 | 26.5 | 0.5 | 13.8 |
| YJ3-X17 | 5741.2 | 22.3 | 2.9 | 12.3 | 7.1 | 19.8 | 0.0 | 10.2 |
| YJ303 | 5734.4 | 16.3 | 5.0 | 6.2 | 2.8 | 31.6 | 2.0 | 14.7 |
| YJ303 | 5752.4 | 20.0 | 9.3 | 6.9 | 3.7 | 24.4 | 0.2 | 13.0 |
| No. | Well | Lithology | Depth (m) | S (%) | I/S (%) | Ill (%) | K (%) | Chl (%) |
|---|---|---|---|---|---|---|---|---|
| 1 | Y2 | sandstone | 5963.9 | 0 | 43 | 28 | 6 | 23 |
| 2 | Y2 | sandstone | 5967.5 | 0 | 43 | 28 | 6 | 23 |
| 3 | Y2 | sandstone | 5968.0 | 0 | 36 | 33 | 6 | 25 |
| 4 | Y6 | sandstone | 6026.8 | 0 | 31 | 38 | 7 | 24 |
| 5 | Y6 | sandstone | 6027.4 | 0 | 33 | 30 | 5 | 32 |
| 6 | Y6 | mudstone | 6013.4 | 0 | 44 | 35 | 5 | 16 |
| 7 | Y6 | mudstone | 6014.7 | 0 | 45 | 39 | 5 | 11 |
| 8 | Y6 | mudstone | 6015.7 | 0 | 39 | 42 | 7 | 12 |
| 9 | Y6 | mudstone | 6017.5 | 0 | 40 | 43 | 6 | 11 |
| 10 | Y6 | mudstone | 6020.7 | 0 | 42 | 42 | 5 | 11 |
| No | Well | Depth (m) | Lithology | SiO2 | TiO2 | Al2O3 | TFe2O3 | MnO | MgO | CaO | Na2O | K2O | P2O5 | LOI | Total | CIA | CIW |
|---|---|---|---|---|---|---|---|---|---|---|---|---|---|---|---|---|---|
| wt.% | wt.% | wt.% | wt.% | wt.% | wt.% | wt.% | wt.% | wt.% | wt.% | wt.% | wt.% | ||||||
| 1 | Y2 | 5961.1 | sandstone | 76.54 | 0.29 | 11.3 | 2.04 | 0.03 | 0.8 | 0.7 | 3.72 | 2.27 | 0.09 | 1.55 | 99.34 | 52.8 | 59.7 |
| 2 | Y2 | 5963.9 | sandstone | 78 | 0.31 | 10.25 | 2.05 | 0.06 | 0.83 | 1.12 | 3.52 | 1.97 | 0.09 | 1.96 | 100.15 | 49.4 | 55.1 |
| 3 | Y2 | 5966.8 | sandstone | 66.47 | 0.47 | 10.76 | 3.43 | 0.28 | 2.51 | 4.21 | 3.19 | 2.17 | 0.1 | 6.59 | 100.18 | 50.2 | 56.4 |
| 4 | Y2 | 5967.5 | sandstone | 78.14 | 0.31 | 10.18 | 2.22 | 0.04 | 0.7 | 0.96 | 3.39 | 2.1 | 0.1 | 1.6 | 99.73 | 50.5 | 56.9 |
| 5 | Y2 | 5969.4 | sandstone | 75.86 | 0.44 | 11.16 | 3.1 | 0.04 | 0.87 | 0.75 | 3.52 | 2.23 | 0.12 | 1.6 | 99.68 | 53.4 | 60.3 |
| 6 | Y2 | 5974.2 | sandstone | 72.11 | 0.31 | 10.67 | 2.25 | 0.07 | 0.7 | 3.61 | 3.58 | 1.99 | 0.1 | 4.03 | 99.42 | 55.1 | 62.0 |
| 7 | YJ1-1 | 5832.9 | sandstone | 73.08 | 0.29 | 10.15 | 2.72 | 0.13 | 0.8 | 3.83 | 2.93 | 2.34 | 0.09 | 4.14 | 100.5 | 50.2 | 57.3 |
| 8 | YJ12 | 5779.4 | sandstone | 68.5 | 0.39 | 10.19 | 2.82 | 0.29 | 2.31 | 4.07 | 3.14 | 2.17 | 0.1 | 6.37 | 100.34 | 49.6 | 56.0 |
| 9 | YJ14 | 5504.8 | sandstone | 76.91 | 0.36 | 10.65 | 2.32 | 0.04 | 0.86 | 1.25 | 3.29 | 2.3 | 0.1 | 2.1 | 100.18 | 49.7 | 56.2 |
| 10 | YJ3-X17 | 5735.5 | sandstone | 73.37 | 0.35 | 10.27 | 2.51 | 0.08 | 0.65 | 3.28 | 3.36 | 2.01 | 0.09 | 3.68 | 99.65 | 56.1 | 63.6 |
| 11 | YJ303 | 5734.4 | sandstone | 70.98 | 0.42 | 11.05 | 3.13 | 0.12 | 0.82 | 3.88 | 3.26 | 2.28 | 0.11 | 4.31 | 100.36 | 52.8 | 59.8 |
| 12 | YJ303 | 5752.4 | sandstone | 66.45 | 0.71 | 15.5 | 4.82 | 0.03 | 1.28 | 0.51 | 3.59 | 3.37 | 0.13 | 3.37 | 99.77 | 59.7 | 69.5 |
| 13 | YJ303 | 5732 | mudstone | 56.52 | 0.73 | 17.72 | 7.4 | 0.09 | 2.62 | 1.62 | 3.59 | 3.59 | 0.17 | 6.29 | 100.33 | 56.9 | 65.0 |
| 14 | YJ1-3 | 5966 | mudstone | 58.23 | 0.7 | 17.25 | 7.26 | 0.07 | 2.46 | 1.21 | 3.25 | 3.67 | 0.17 | 5.23 | 99.5 | 59.2 | 68.6 |
| No | Well | Depth (m) | Lithology | Ba | Co | Cr | Ni | Sr | V | Zn |
|---|---|---|---|---|---|---|---|---|---|---|
| (ppm) | (ppm) | (ppm) | (ppm) | (ppm) | (ppm) | (ppm) | ||||
| 1 | Y2 | 5961.1 | sandstone | 565.20 | 6.40 | 26.60 | 9.40 | 151.00 | 34.90 | 26.20 |
| 2 | Y2 | 5963.9 | sandstone | 860.10 | 8.00 | 157.90 | 119.50 | 153.60 | 32.60 | 24.50 |
| 3 | Y2 | 5966.8 | sandstone | 372.20 | 13.60 | 63.80 | 12.90 | 189.30 | 49.50 | 38.60 |
| 4 | Y2 | 5967.5 | sandstone | 433.80 | 8.10 | 37.00 | 11.10 | 146.30 | 34.50 | 27.20 |
| 5 | Y2 | 5969.4 | sandstone | 628.90 | 11.00 | 51.70 | 15.90 | 156.60 | 56.50 | 35.70 |
| 6 | Y2 | 5974.2 | sandstone | 1263.00 | 14.00 | 58.70 | 14.20 | 167.10 | 41.00 | 34.90 |
| 7 | YJ1-1 | 5832.9 | sandstone | 384.30 | 13.40 | 130.60 | 46.10 | 191.80 | 41.60 | 33.40 |
| 8 | YJ12 | 5779.4 | sandstone | 761.60 | 8.70 | 114.90 | 52.80 | 180.00 | 53.40 | 37.30 |
| 9 | YJ14 | 5504.8 | sandstone | 506.40 | 6.80 | 75.00 | 92.40 | 141.30 | 44.10 | 29.40 |
| 10 | YJ3-X17 | 5735.5 | sandstone | 1017.10 | 7.50 | 46.00 | 7.40 | 183.30 | 47.80 | 30.30 |
| 11 | YJ303 | 5734.4 | sandstone | 396.70 | 17.40 | 297.00 | 229.90 | 210.90 | 65.70 | 39.80 |
| 12 | YJ303 | 5752.4 | sandstone | 414.00 | 12.70 | 55.10 | 26.60 | 164.20 | 103.30 | 66.00 |
| 13 | YJ303 | 5732.0 | mudstone | 274.40 | 20.70 | 64.00 | 44.60 | 190.80 | 117.00 | 107.00 |
| 14 | YJ1-3 | 5966.0 | mudstone | 502.30 | 19.40 | 89.00 | 57.30 | 170.70 | 110.50 | 98.10 |
| *15 | YJ301 | 5514.0 | mudstone | 1567.00 | 12.62 | 113.30 | 37.62 | 345.10 | 69.38 | 50.41 |
| *16 | YJ301 | 5582.0 | mudstone | 1975.00 | 12.16 | 75.74 | 37.55 | 383.80 | 59.45 | 69.57 |
| *17 | YJ1-1 | 5821.7 | mudstone | 279.60 | 17.68 | 100.60 | 49.37 | 142.60 | 95.36 | 102.50 |
| *18 | Y6 | 6024.6 | mudstone | 530.00 | 17.66 | 142.90 | 43.90 | 128.40 | 97.89 | 88.68 |
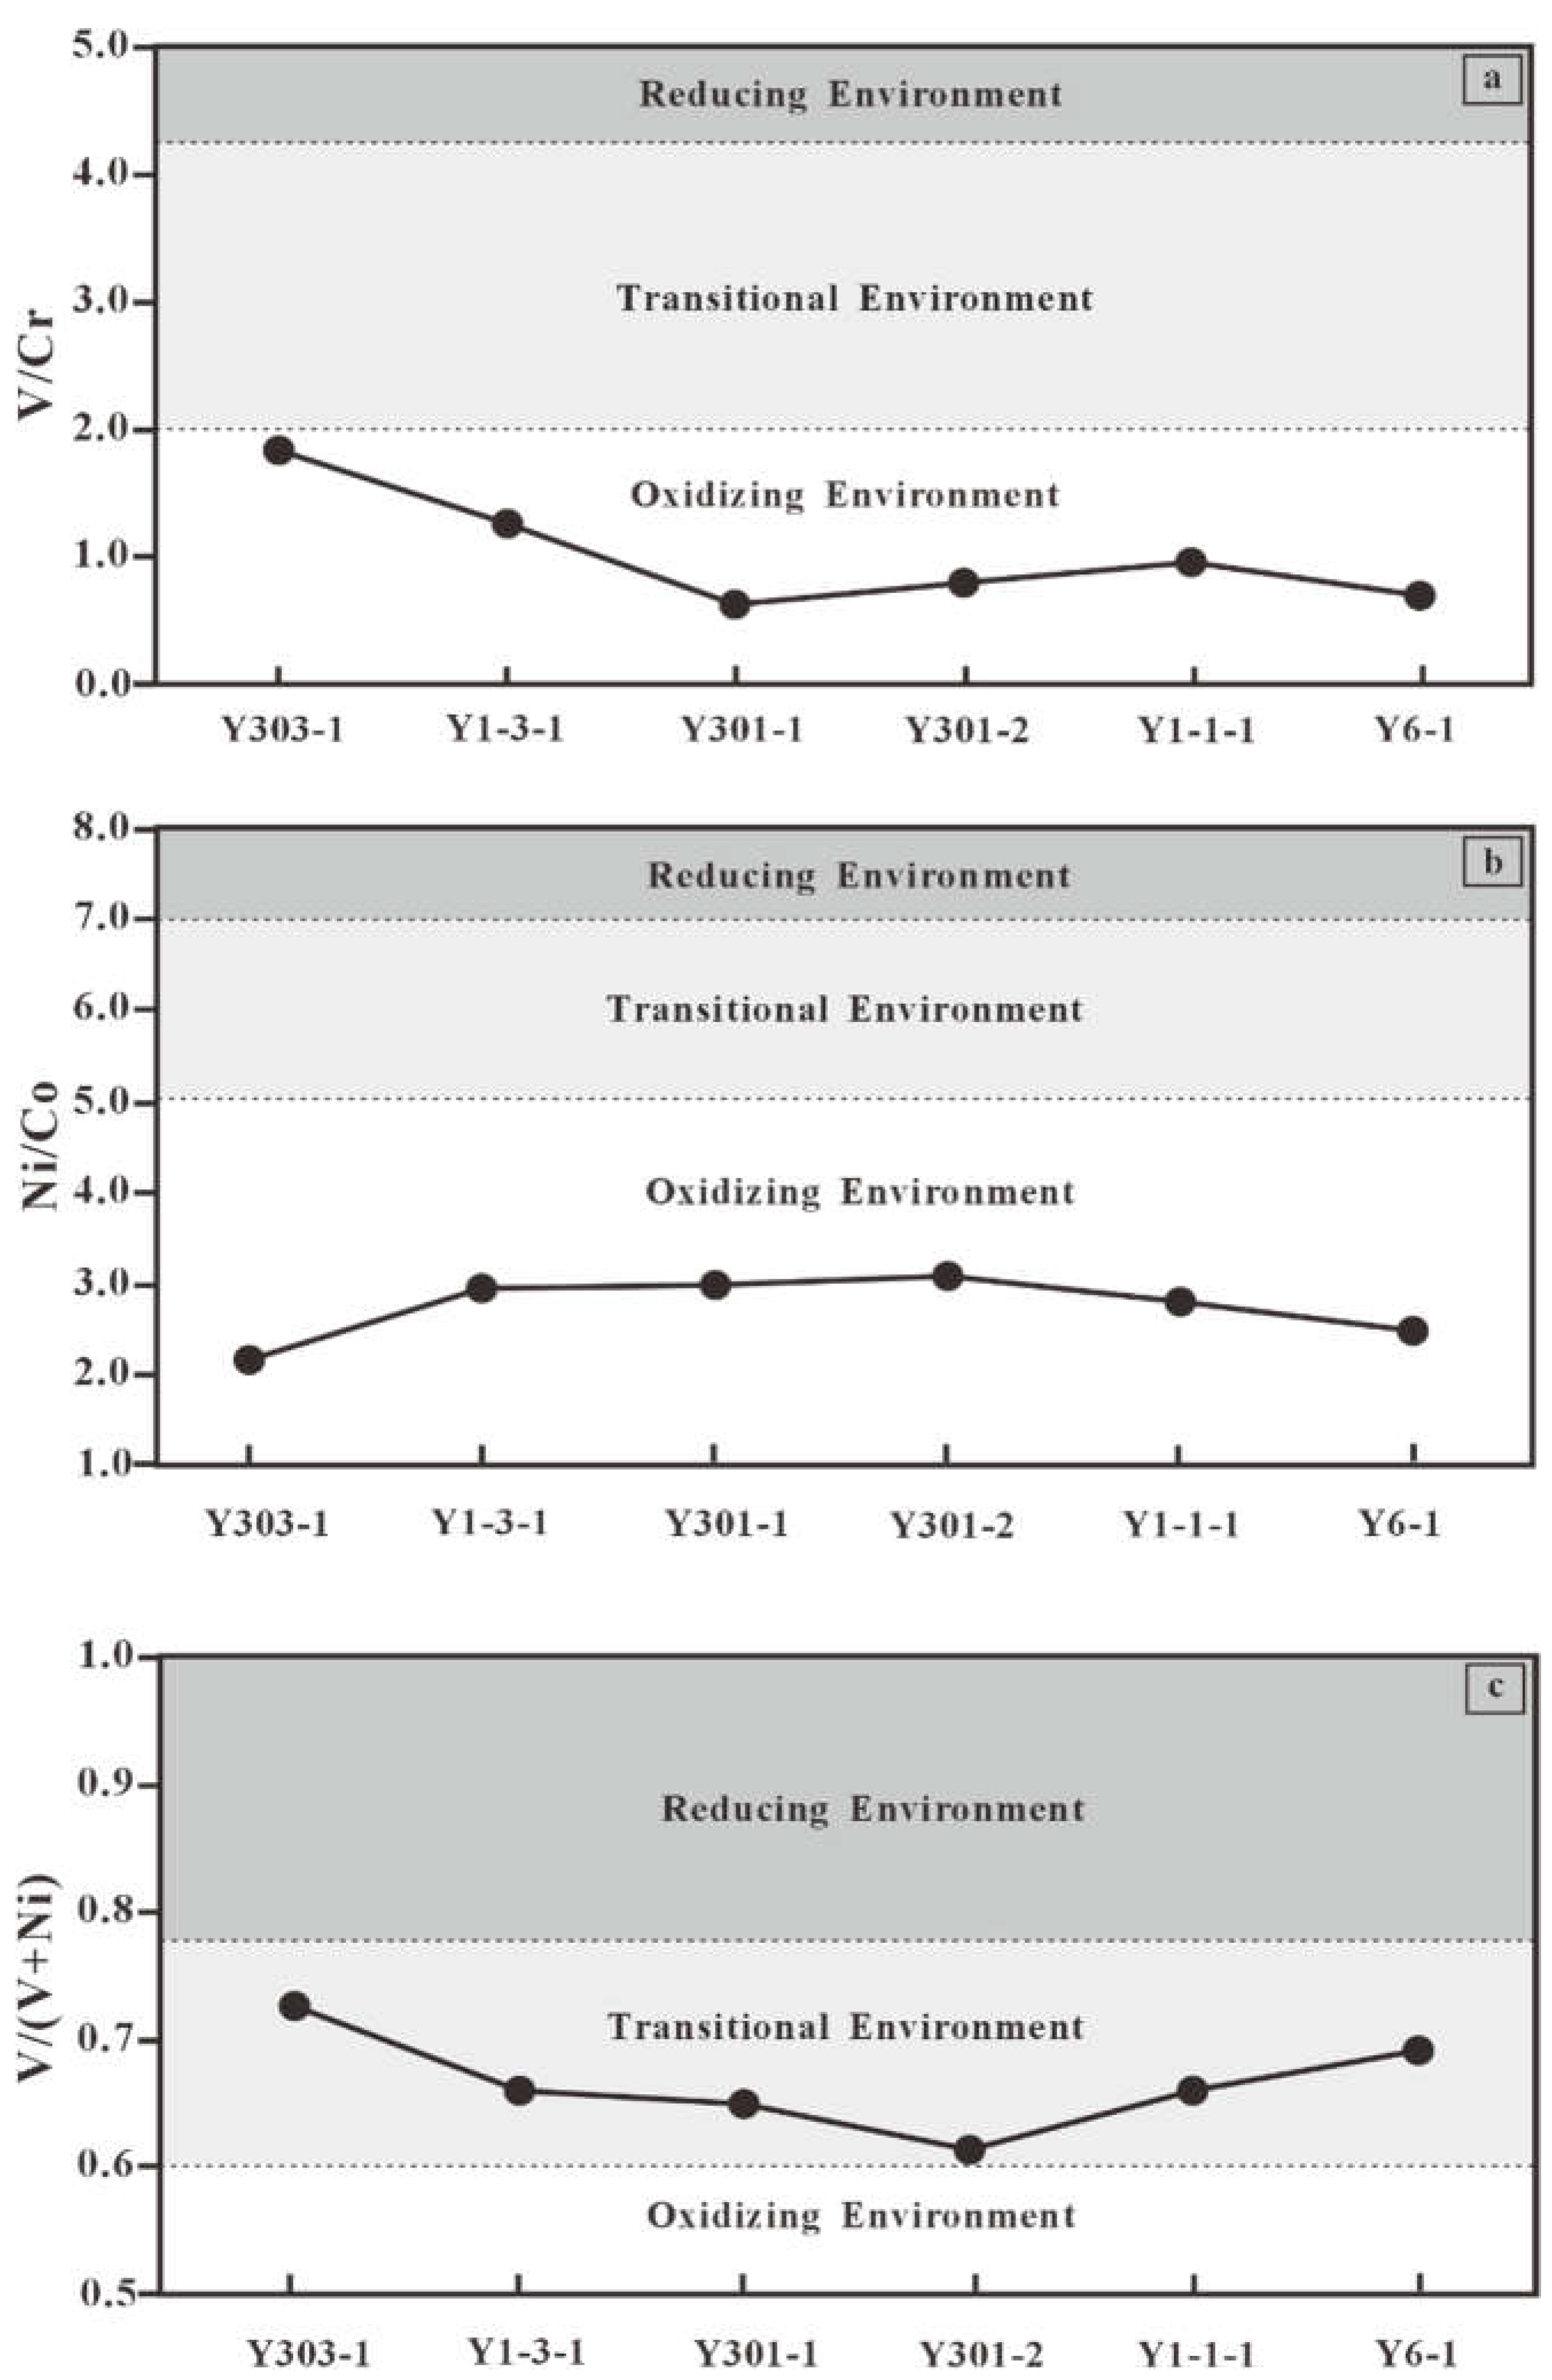
| Trace Element | RE | WOE–WRE | OE | Min–Max | Average | Sources |
|---|---|---|---|---|---|---|
| V/(V+Ni) | >0.84 | 0.6~0.84 | <0.6 | 0.61–0.81 | 0.69 | Hatch J R et al., 1992 [88] |
| V/Cr | >4.25 | 2.0~4.25 | <2.0 | 0.61–2.98 | 1.32 | Jones B et al., 1994 [89] |
| Ni/Co | >7.0 | 5.0~7.0 | <5.0 | 2.15–3.09 | 2.74 | Jones B et al., 1994 [89] |
Disclaimer/Publisher’s Note: The statements, opinions and data contained in all publications are solely those of the individual author(s) and contributor(s) and not of MDPI and/or the editor(s). MDPI and/or the editor(s) disclaim responsibility for any injury to people or property resulting from any ideas, methods, instructions or products referred to in the content. |
© 2025 by the authors. Licensee MDPI, Basel, Switzerland. This article is an open access article distributed under the terms and conditions of the Creative Commons Attribution (CC BY) license (https://creativecommons.org/licenses/by/4.0/).
Share and Cite
Guo, Y.; Li, C.; Zhang, L.; Lei, Y.; Hu, C.; Yu, L.; Zheng, Z.; Xu, B.; Liu, N.; Jia, Y.; et al. Genesis of the Upper Jurassic Continental Red Sandstones in the Yongjin Area of the Central Junggar Basin: Evidence from Petrology and Geochemistry. Minerals 2025, 15, 347. https://doi.org/10.3390/min15040347
Guo Y, Li C, Zhang L, Lei Y, Hu C, Yu L, Zheng Z, Xu B, Liu N, Jia Y, et al. Genesis of the Upper Jurassic Continental Red Sandstones in the Yongjin Area of the Central Junggar Basin: Evidence from Petrology and Geochemistry. Minerals. 2025; 15(4):347. https://doi.org/10.3390/min15040347
Chicago/Turabian StyleGuo, Yongming, Chao Li, Likuan Zhang, Yuhong Lei, Caizhi Hu, Lan Yu, Zongyuan Zheng, Bingbing Xu, Naigui Liu, Yuedi Jia, and et al. 2025. "Genesis of the Upper Jurassic Continental Red Sandstones in the Yongjin Area of the Central Junggar Basin: Evidence from Petrology and Geochemistry" Minerals 15, no. 4: 347. https://doi.org/10.3390/min15040347
APA StyleGuo, Y., Li, C., Zhang, L., Lei, Y., Hu, C., Yu, L., Zheng, Z., Xu, B., Liu, N., Jia, Y., & Li, Y. (2025). Genesis of the Upper Jurassic Continental Red Sandstones in the Yongjin Area of the Central Junggar Basin: Evidence from Petrology and Geochemistry. Minerals, 15(4), 347. https://doi.org/10.3390/min15040347