Abstract
The cleaning circuit of the collective Cu-Mo flotation plant at Collahuasi (north of Chile) consisted of two parallel flotation rows, each one of three first cleaner cells in series with six cleaner–scavenger cells. The second cleaner consisted of 10 parallel columns (6 rectangular and 4 circular), whose tailings were directly recycled to the first cleaner. Recently, a project was developed to upgrade the cleaning circuit by decreasing the large Mo circulating load and improving the cleaning circuit performance. For this purpose, a testing strategy was set up at a pilot scale to evaluate the use of intensified flotation (Jameson cells), mainly for collecting the fine Mo particles accumulated in the circulating load, which contributes to the Mo losses from the scavenger stage into the final tailings. The preliminary results regarding kinetics at the pilot scale showed good potential to improve the metallurgical performance of Mo and Cu, and a sensitivity study was carried out to evaluate the application of this technology in the industrial cleaning circuit. Then, two parallel Jameson cells were selected to re-treat the whole column tailings stream. This operation allowed for the generation of a direct final Cu-Mo concentrate (that joins the columns concentrate) while recycling their tailings to the first cleaner. After commissioning, three sampling campaigns were performed on the whole flotation plant, particularly on the overall cleaning circuit, to evaluate the impact of the new flotation cells. Results showed that the Jameson cells effectively decreased the minerals circulating loads in the cleaning stage, mainly for Mo (in 49%). The Jameson cells directly contribute 48% of Mo and 25% Cu of the minerals in the final concentrate and allow for increasing the Mo final grade (0.45% Mo vs. 0.29% from columns). These results were in good agreement with predictions from the pilot testing.
Keywords:
flotation kinetics; particle size; liberation; plant surveys; cleaner; scavenger; Jameson cells; copper; molybdenum 1. Introduction
A cleaning circuit typically consists of one or more cleaner stages to reach the final concentrate grade. Normally, different types of equipment are combined in cleaning circuits, e.g., mechanical cells and pneumatic columns, which are known as hybrid circuits. In general, the cleaner circuits include cleaner and scavenger stages, whose objectives are to reach a suitable concentrate grade and minimize the mineral losses, respectively. The tailings of the scavenger stage go to the final plant tailings, representing around 10%–15% of the overall plant losses [1,2].
The cleaning circuit operation depends on the mineral characteristics, such as particle size after regrinding, mineral liberation, circuit arrangement, and operating conditions [3,4]. A challenge arises when large circulating loads appear in the cleaning circuits, due to limitations in recovering valuable minerals into the final concentrate [5]. This situation can be related to an excess of fine particles (e.g., overgrinding), the presence of some types of clays, and others. This becomes critical when two valuable minerals are competing for sites in the last concentration stages, and/or when the minerals are overgrinded, so fine particle recovery decreases (e.g., for Mo). This issue sometimes occurs in the collective flotation of Cu and Mo minerals and overloads the cleaning circuit, with the consequence of losing the valuable minerals in the scavenger tailings.
The particles containing floatable minerals in a cleaning circuit have high liberation due to regrinding, but the effective particle collection will depend on the collision efficiency, which decreases in conventional mechanical cells and columns, as particles become finer [6]. An alternative to address this challenge is the incorporation of intensified flotation cells, particularly for the capture of fine and ultrafine particles. One of these technologies is the Jameson cell, which has a downcomer, a zone of intense energy dissipation where the feed enters at high velocity through a nozzle, providing the vacuum required for the air admission. This produces small bubbles, large gas holdup, and a turbulent mixture, which enhances the collection process [7].
This paper presents a case study on improving the cleaning circuit performance at Collahuasi mining, a Cu-Mo operation located in the north of Chile, at 4400 masl. In this case, Molybdenum is recovered as a sub-product, favoring the Copper recovery. As a background from the Collahuasi plant, it had been observed that the main fraction of Mo processes in the columns (second cleaner) went to the column tailings, creating a large Mo circulating load towards the first cleaner and scavenger stages. Then, the Mo ended up being lost by overloading the scavenger circuit, mainly in fine and liberated particles. To address this issue, an intensified flotation cell was tested for incorporation into the cleaning circuit, treating the columns’ tailings, in order to contribute to recovering Mo (and also Cu) from the circulating load, and producing final concentrate.
In this study, the results of testing the operation of Jameson cells, at pilot scale, as a first evaluation, and then at industrial scale, after commissioning, are presented. The main objective of the study was to evaluate the feasibility of installing two industrial Jameson cells into Collahuasi’s flotation plant to reduce the circulating load of Mo in the cleaning circuit.
2. Methodology
2.1. Pilot Tests Using an Intensified Flotation Cell
A pilot testing campaign was carried out to evaluate the potential upgrade of the cleaning circuit of Collahuasi’s concentrator plant. For this purpose, a Jameson cell L-150, operating in closed circuit (batch flotation), was used to assess the Mo recovery from the column tailings [8,9].
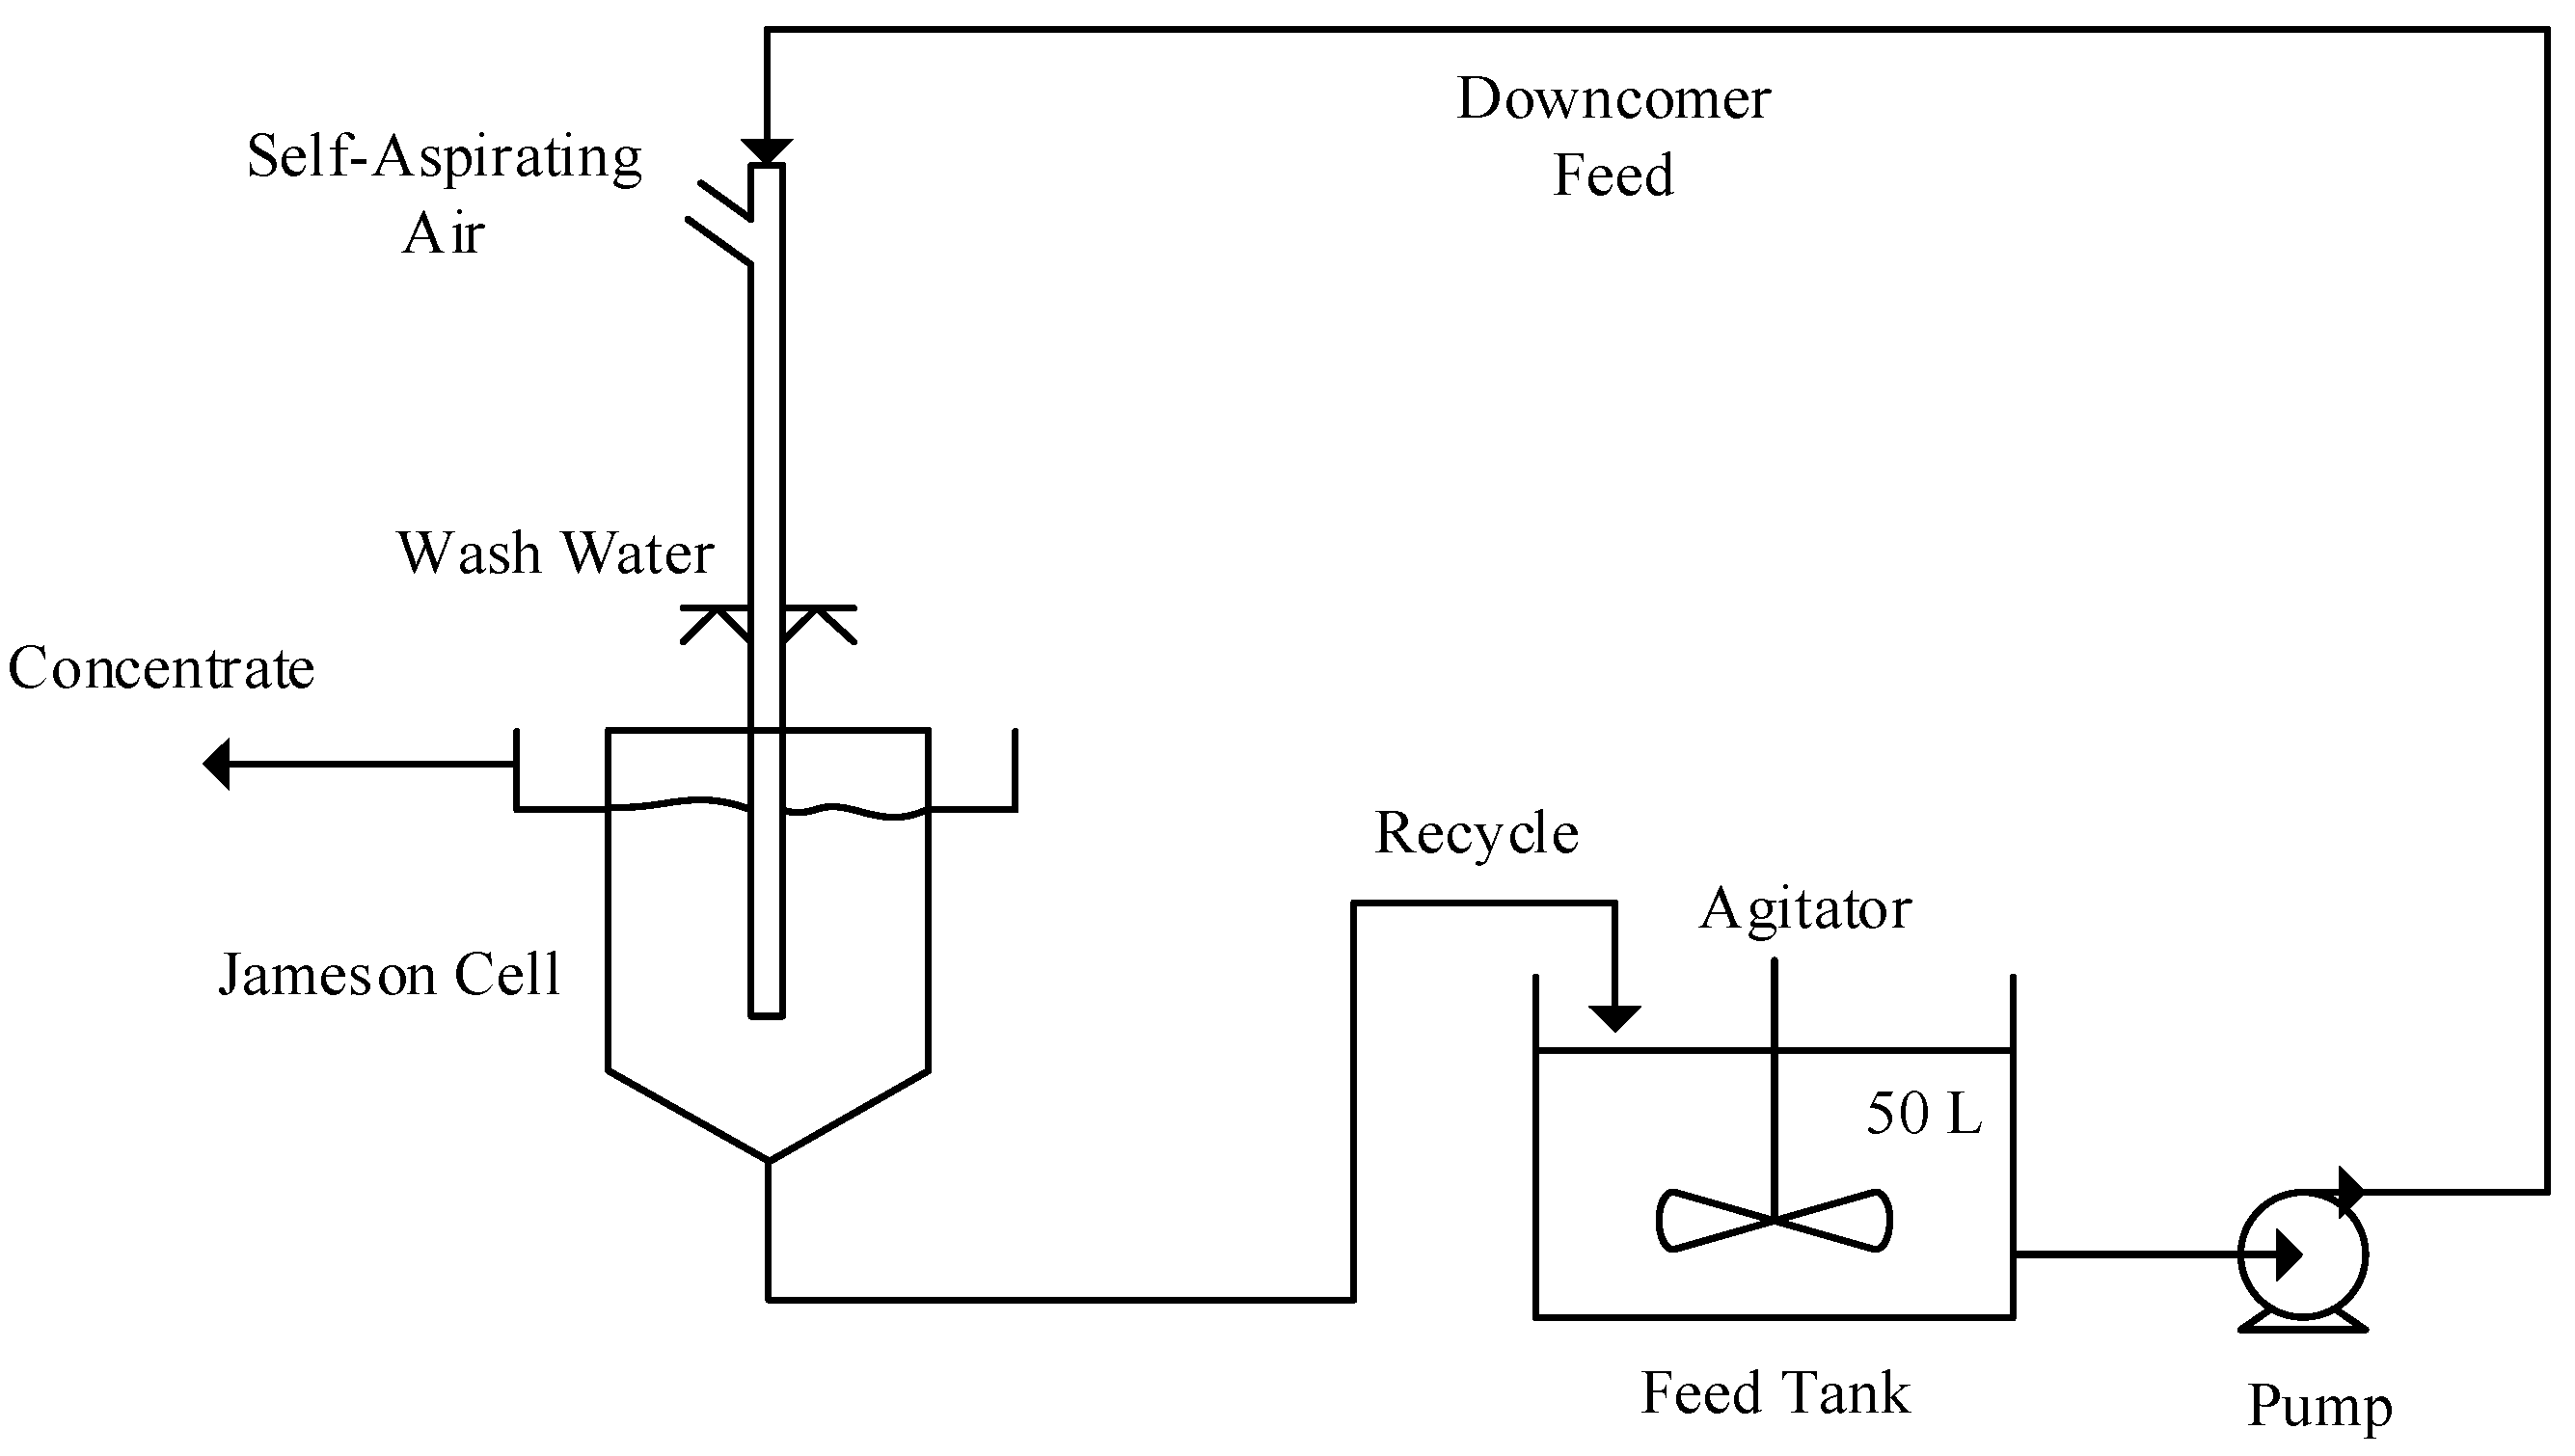
The experimental setup to develop the flotation tests is shown in Figure 1. First, about 60 L of pulp from the column tailings tank was collected and poured into the feed tank. Then, the tank agitator and the pump were activated, sending pulp from the feed tank to the Jameson cell. After adjusting the froth depth and wash water ratio, each test starts by opening the air valve to allow air into the cell. The operating conditions used in the tests were a froth depth of 19 cm, wash water flow of 100 m3/h, and air flow of 0.25 m3/h (JG of around 0.4 cm/s).

Figure 1.
Experimental setup for flotation tests in a Jameson cell L-150.
Samples from the feed were taken before starting each test (minute 0). In addition, during the tests, concentrate samples were taken at different times: 0.5, 1.0, 2.0, 3.5, 6.0, 9.0, and 14.5 min. Once the test has finished, the system is operated only with recirculation (no concentrate discharge) to take tailing samples. All samples were submitted to chemical, particle size, and mineralogical analysis.
Four tests were carried out following the procedure previously mentioned.
The data from the pilot flotation tests were fitted using a batch kinetic model (first order) with a single rate constant (k) and a maximum recovery () as kinetic parameters. Then, these parameters were used for the industrial scale-up using a kinetic model for continuous operation to estimate the recovery of industrial minerals. The samples from the column tailings showed Mo and Cu grades in the ranges of 0.65%–0.91% and 8.9%–18.6%, respectively.
To assess the application of this technology in the industrial plant, a model of a single cell was considered, assuming a perfect mixing regime, as a conservative approach to emulate the internal pulp recycling in the Jameson cell, under continuous operation (Equation (1)).
Recent studies have shown that the mixing characteristics of pilot Jameson cells, operating continuously, are closer to a perfect mixer and sensitive to the percentage of recycling [10].
Thus, from the pilot test results, a sensitivity study was developed to estimate the impact of Jameson cells on the industrial plant performance. Changes in the feed grade and circulating loads of the cleaning circuit were included in the study.
2.2. Sampling Surveys in the Industrial Cleaning Circuit with Jameson Cells
After installing two Jameson cells B6500/24, of around 100 m3 each, at Collahuasi’s flotation plant to process the column tailings, three sampling surveys (M1, M2, and M3) were carried out to characterize the metallurgical performance of the cleaning circuit. This concentrator plant is located at 4.400 masl in the Atacama Desert, Chile.
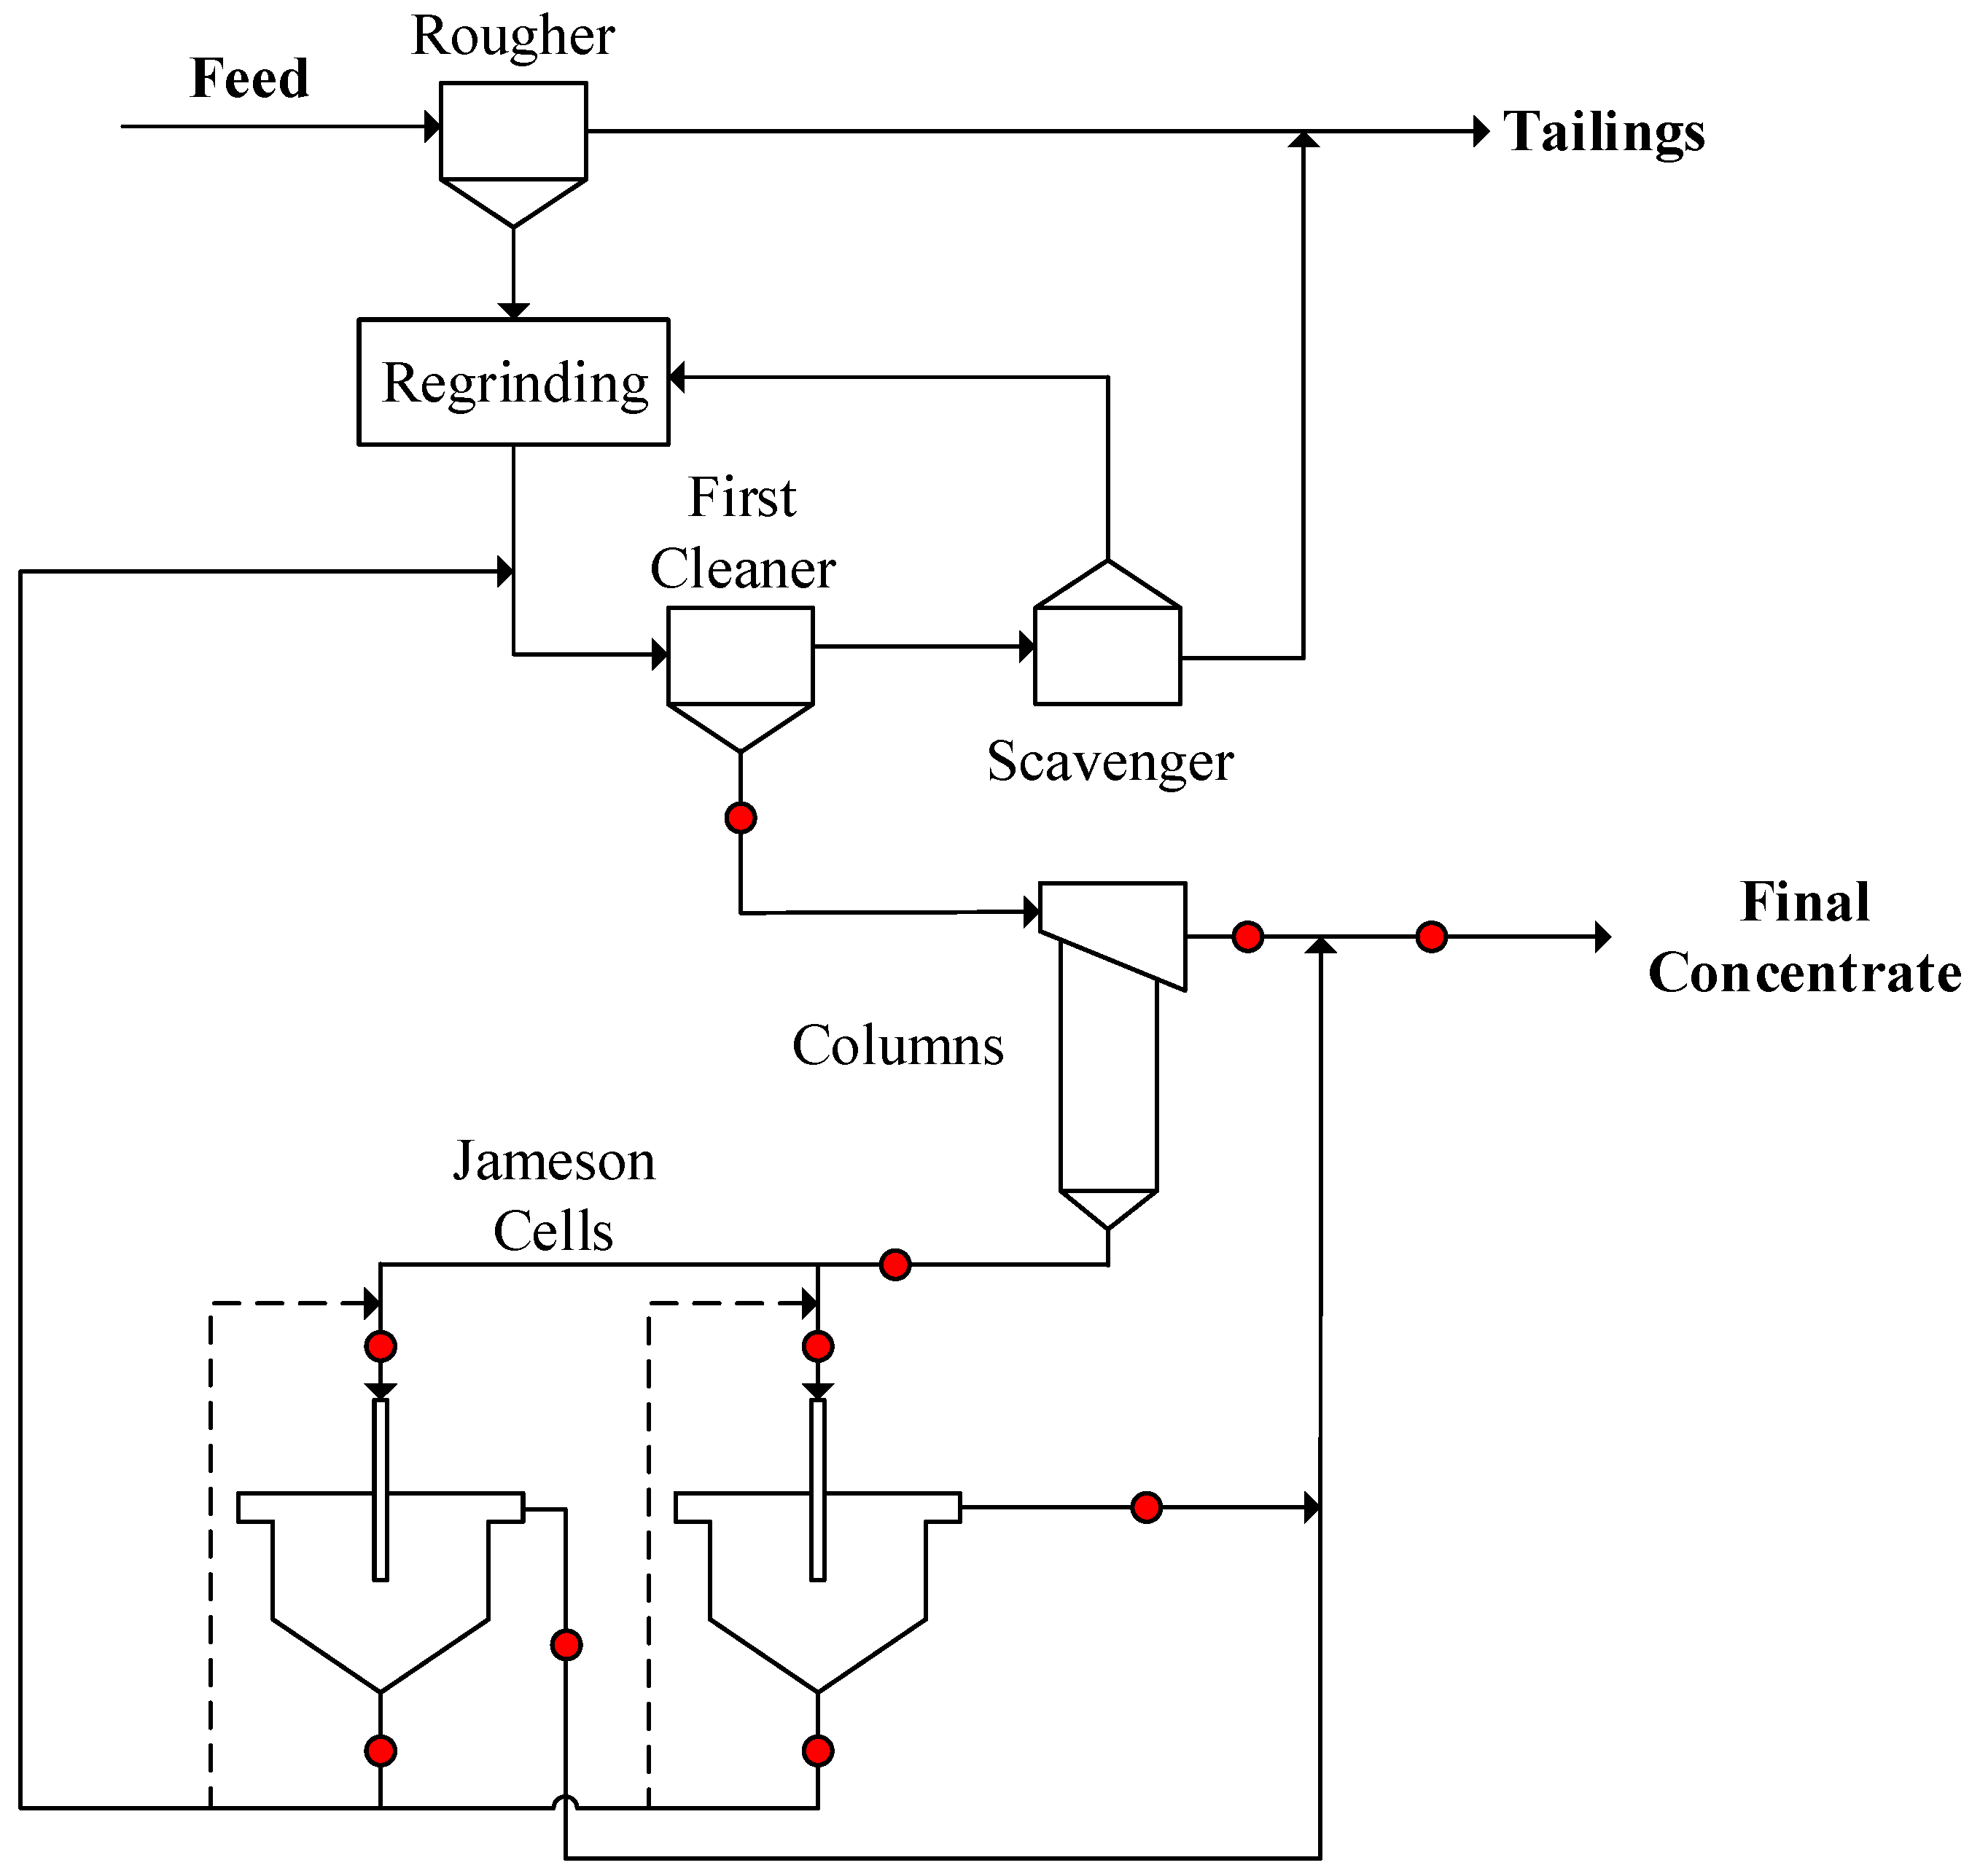
Figure 2 shows a summary diagram of the concentrator plant, which has a rougher stage, regrinding, and a cleaner stage. The sampling points in the cleaning stage for each survey are also shown in Figure 2 (red dots). The cleaner circuit consists of 5 parallel banks of the first cleaner plus scavenger duties. Two of them consist of nine forced-air cells of 160 m3, and the other three banks consist of nine self-aerated cells of 127 m3 [11]. The first cells of each bank correspond to the first cleaner stage, and the last cells belong to the scavenger stage. The first cleaner concentrate goes to the flotation column stage, consisting of ten columns in parallel: six rectangular columns and four circular columns. The columns produce final concentrate, while their tailings go to the two Jameson cells. These cells also produce final concentrate, and their tailings are recycled to the first cleaner. The internal recycling of the Jameson cells is shown as dashed lines.
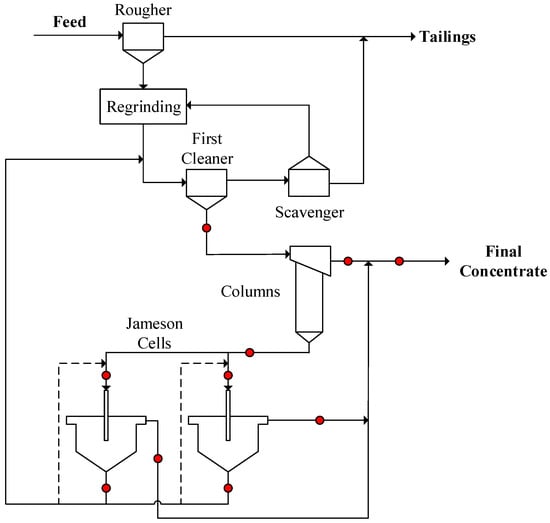
Figure 2.
Flotation circuit at Collahuasi mining.
The feed, concentrate, and tail streams were sampled, which allowed for the characterization of the metallurgical performance of each stage and the circuit columns, plus Jameson cells, after a mass balance data reconciliation. The sample collection was either manual or automatic, and samples were submitted for chemical and mineralogical analysis.
3. Results and Discussion
3.1. Pilot Tests with Jameson Cells
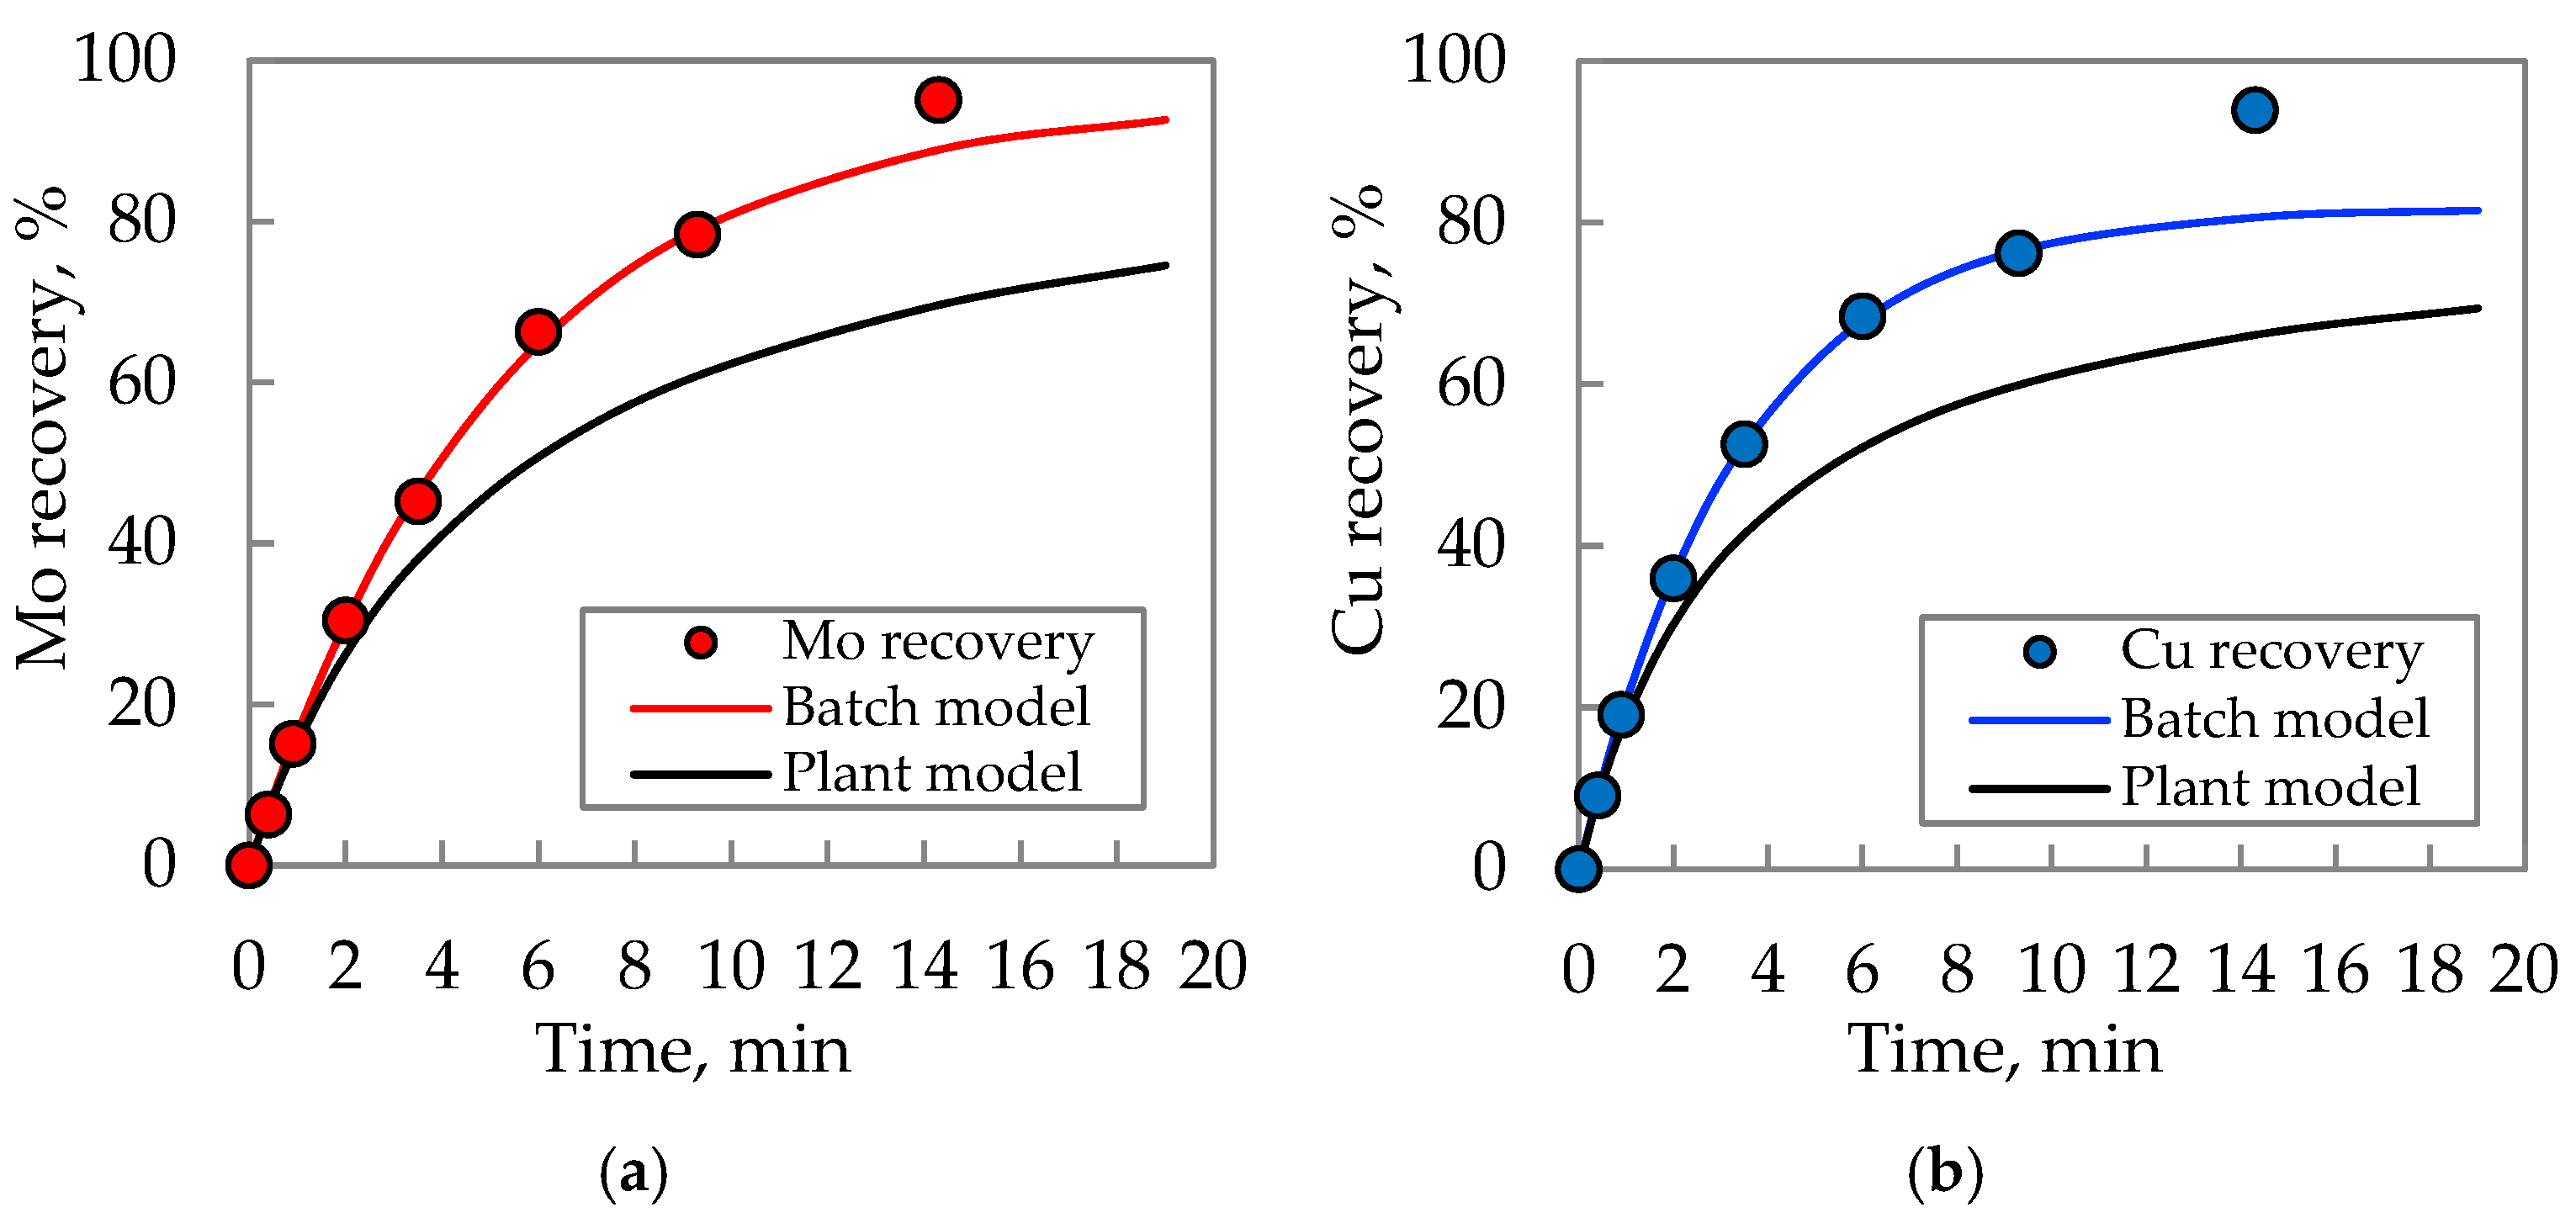
Figure 3 shows an example of the flotation results from the pilot testing for Mo and Cu, and the estimated response for the continuous plant operation. In this case, results show a change in the data trend for the last point, due to a change in the cell operating condition. Therefore, this point was not included in the kinetic study.
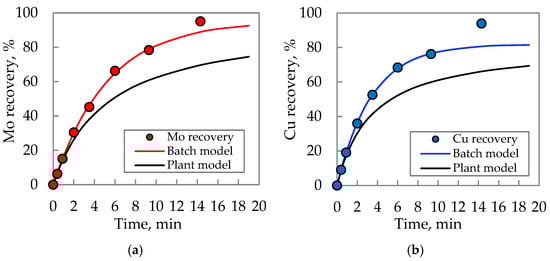
Figure 3.
Example of flotation recovery from one of the pilot tests: (a) Mo, (b) Cu.
For Mo, the rate constant and the maximum recovery for the pilot test were 0.191 (min−1) and 95.2%, respectively (Figure 3a). For Cu, these parameters were 0.294 (min−1) and 81.9% (Figure 3b). The fitting showed R2 coefficients of 0.9990 and 0.9998 for Cu and Mo, respectively.
The overall pilot testing showed that the Mo recovery in continuous operation would be in the range of 40%–70% and the Cu recovery in the range of 42%–62%, for a residence time of 4–6 min. In this range, the expected Cu concentrate grade from the Jameson cells was around 28%–30% [12], which would allow for sending this product to final concentrate directly (without extra diesel addition). Additionally, the Mo recovery would increase 1.9% in the plant, together with a decrease in the circulating load.
The operation of Jameson cells (pneumatic and intensified flotation cells) allows for contacting the pulp and air under intensive energy dissipation in the “downcomer tube”, generating fine bubbles and high gas holdup, which enhances the collection of fine particles.
3.2. Sampling Surveys at the Industrial Plant
3.2.1. Mass Balance Results
Table 1 shows the overall mass balance results carried out around the Jameson cells. A greater selectivity for Cu relative to Mo was observed. However, the Jameson cells reach Mo concentrate grades significantly higher than in columns. In addition, the Cu and Mo recoveries in the Jameson cells were around 52% and 37%, respectively, with a mass pull of around 30%. These results allowed for a significant decrease in the circulating load of Cu and Mo (41% and 49%, respectively) in the cleaning circuit.

Table 1.
Concentrate and grades of Cu and Mo, in Jameson cells.
On the other hand, Table 1 shows a high variability in the feed Cu and Mo grades of the Jameson cells (column tailings). However, the Jameson cells produce a higher and more stable Cu concentrate grade (29.3 ± 0.7%), which slightly contributes to upgrading the final Cu collective concentrate.
In addition, the Mo grade (0.762 ± 0.200%) in the concentrate stream of the Jameson cells was similar to that in the feed stream, with no enrichment and similar variability. However, it contributes, on average, to a significant enhancement of the Mo grades in the final concentrate.
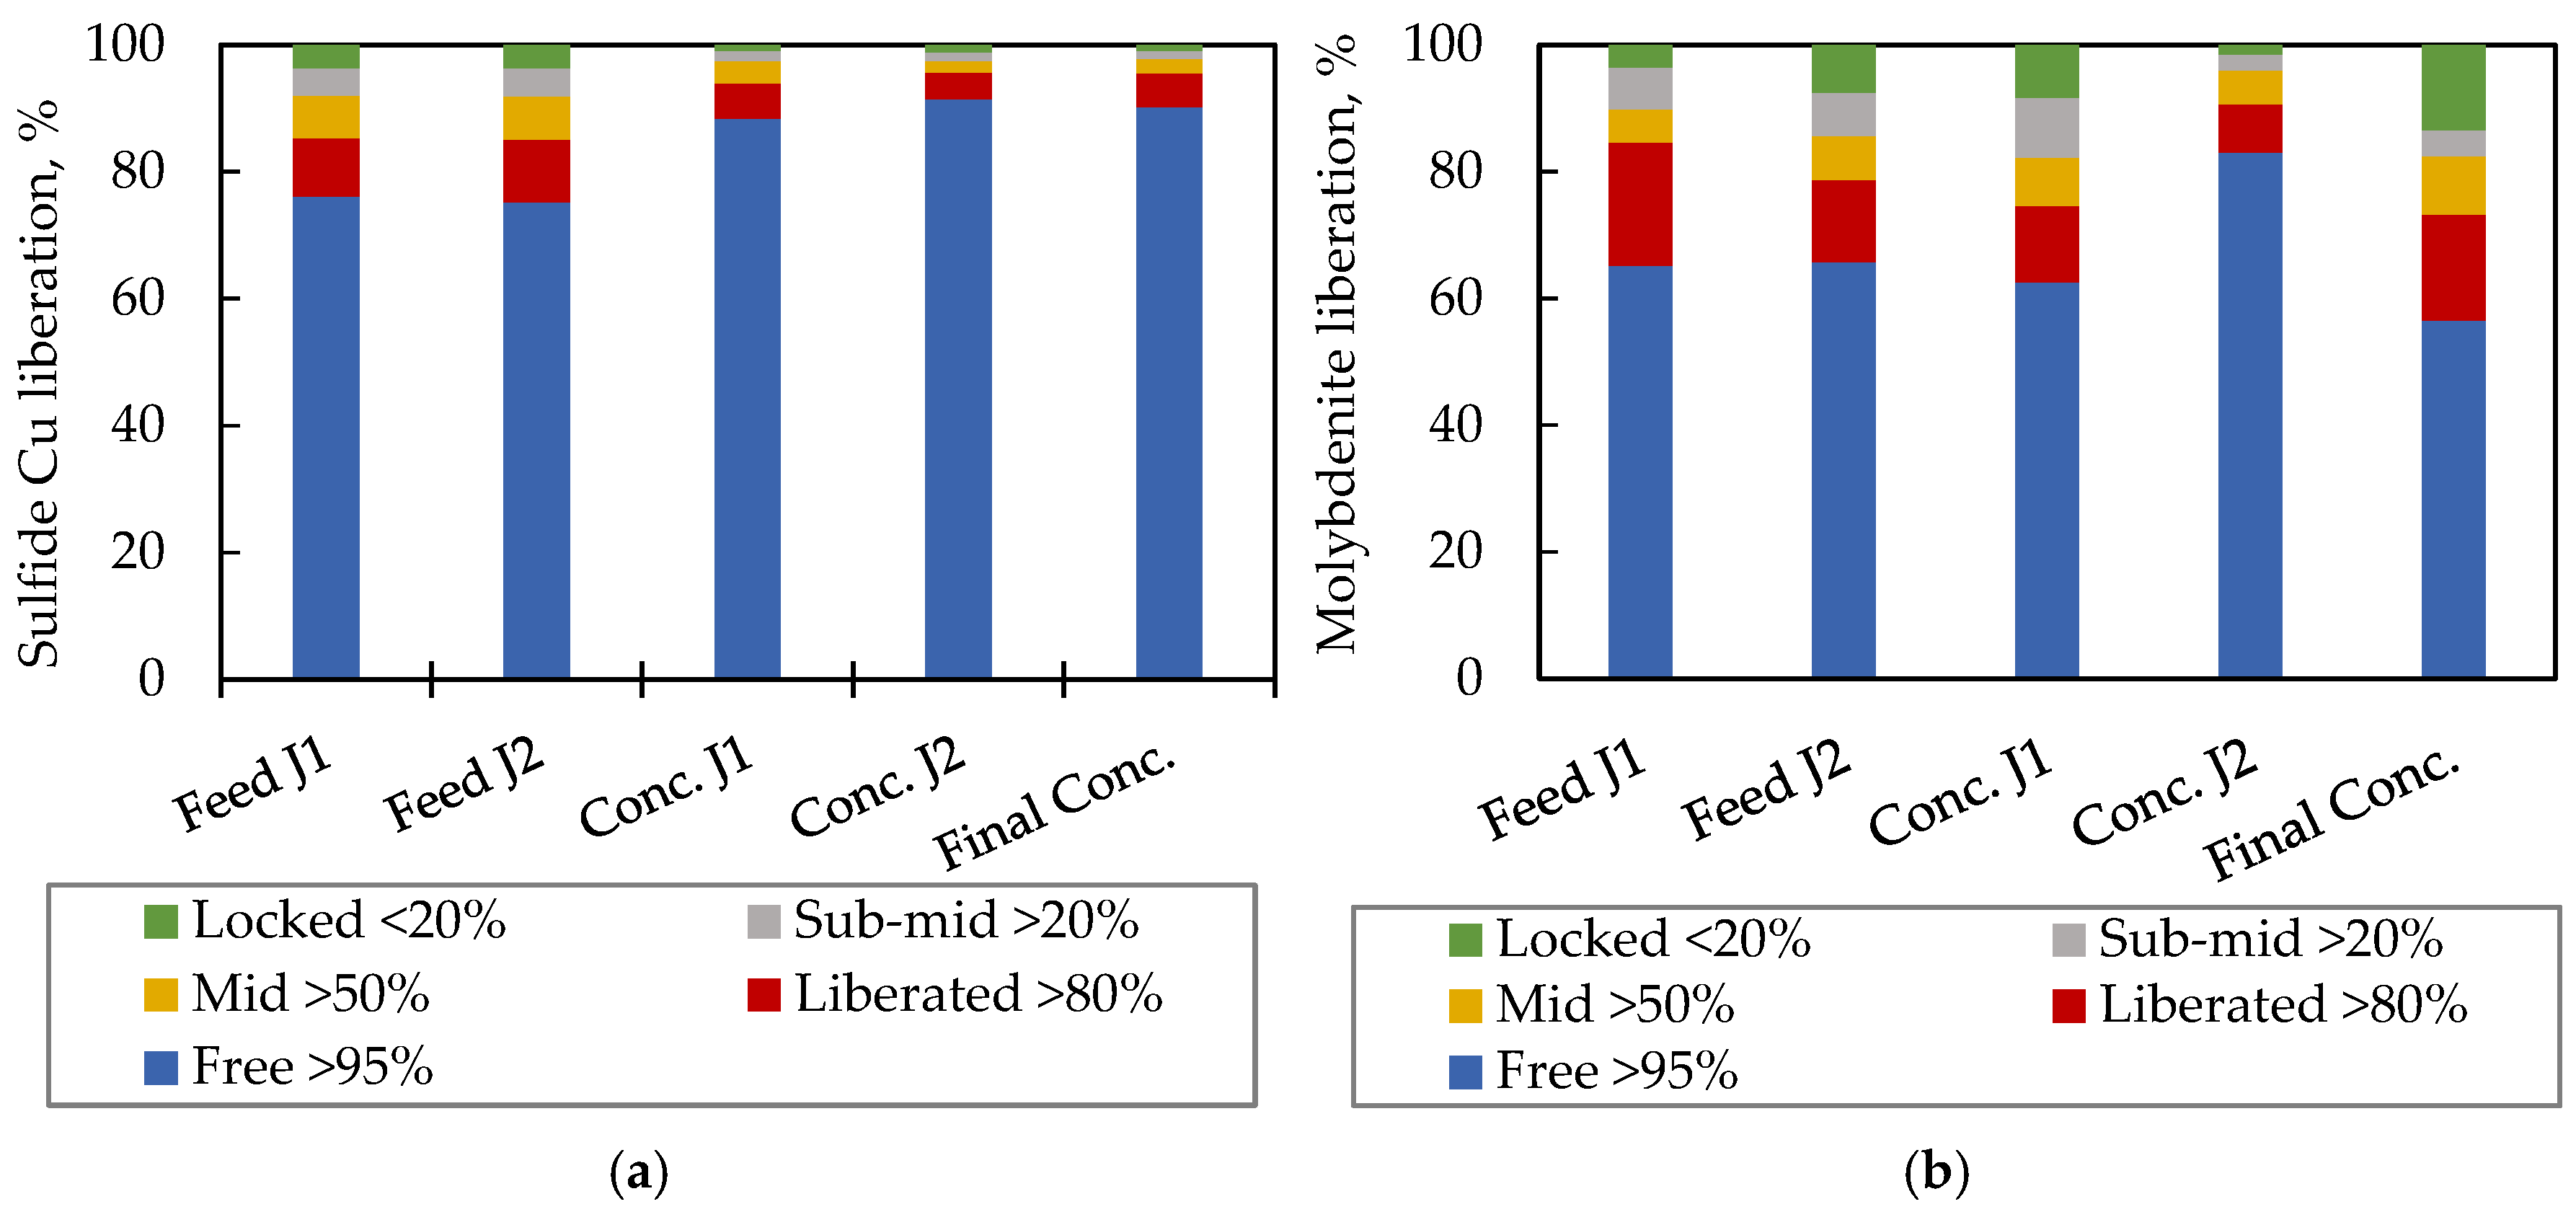
In terms of liberation, Figure 4 shows the liberation distribution in concentrate and feed streams of the Jameson cells for Cu Sulfides (Figure 4a) and Molybdenite (Figure 4b). Five liberation classes were analyzed: Free (>95% lib.), Liberated (80%–95% lib.), Middling (50%–80% lib.), Sub-middling (20%–50% lib.), and Locked (<20% lib.).
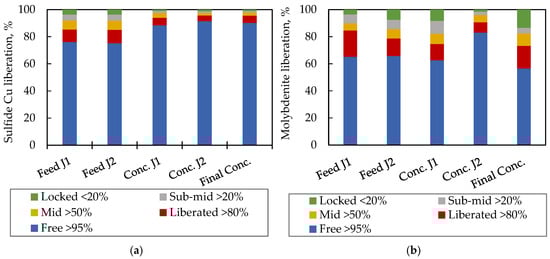
Figure 4.
Liberation in the main streams of Jameson cells, sampling M2: (a) Cu sulfides, (b) Molybdenite.
3.2.2. Operating Conditions of the Jameson Cells
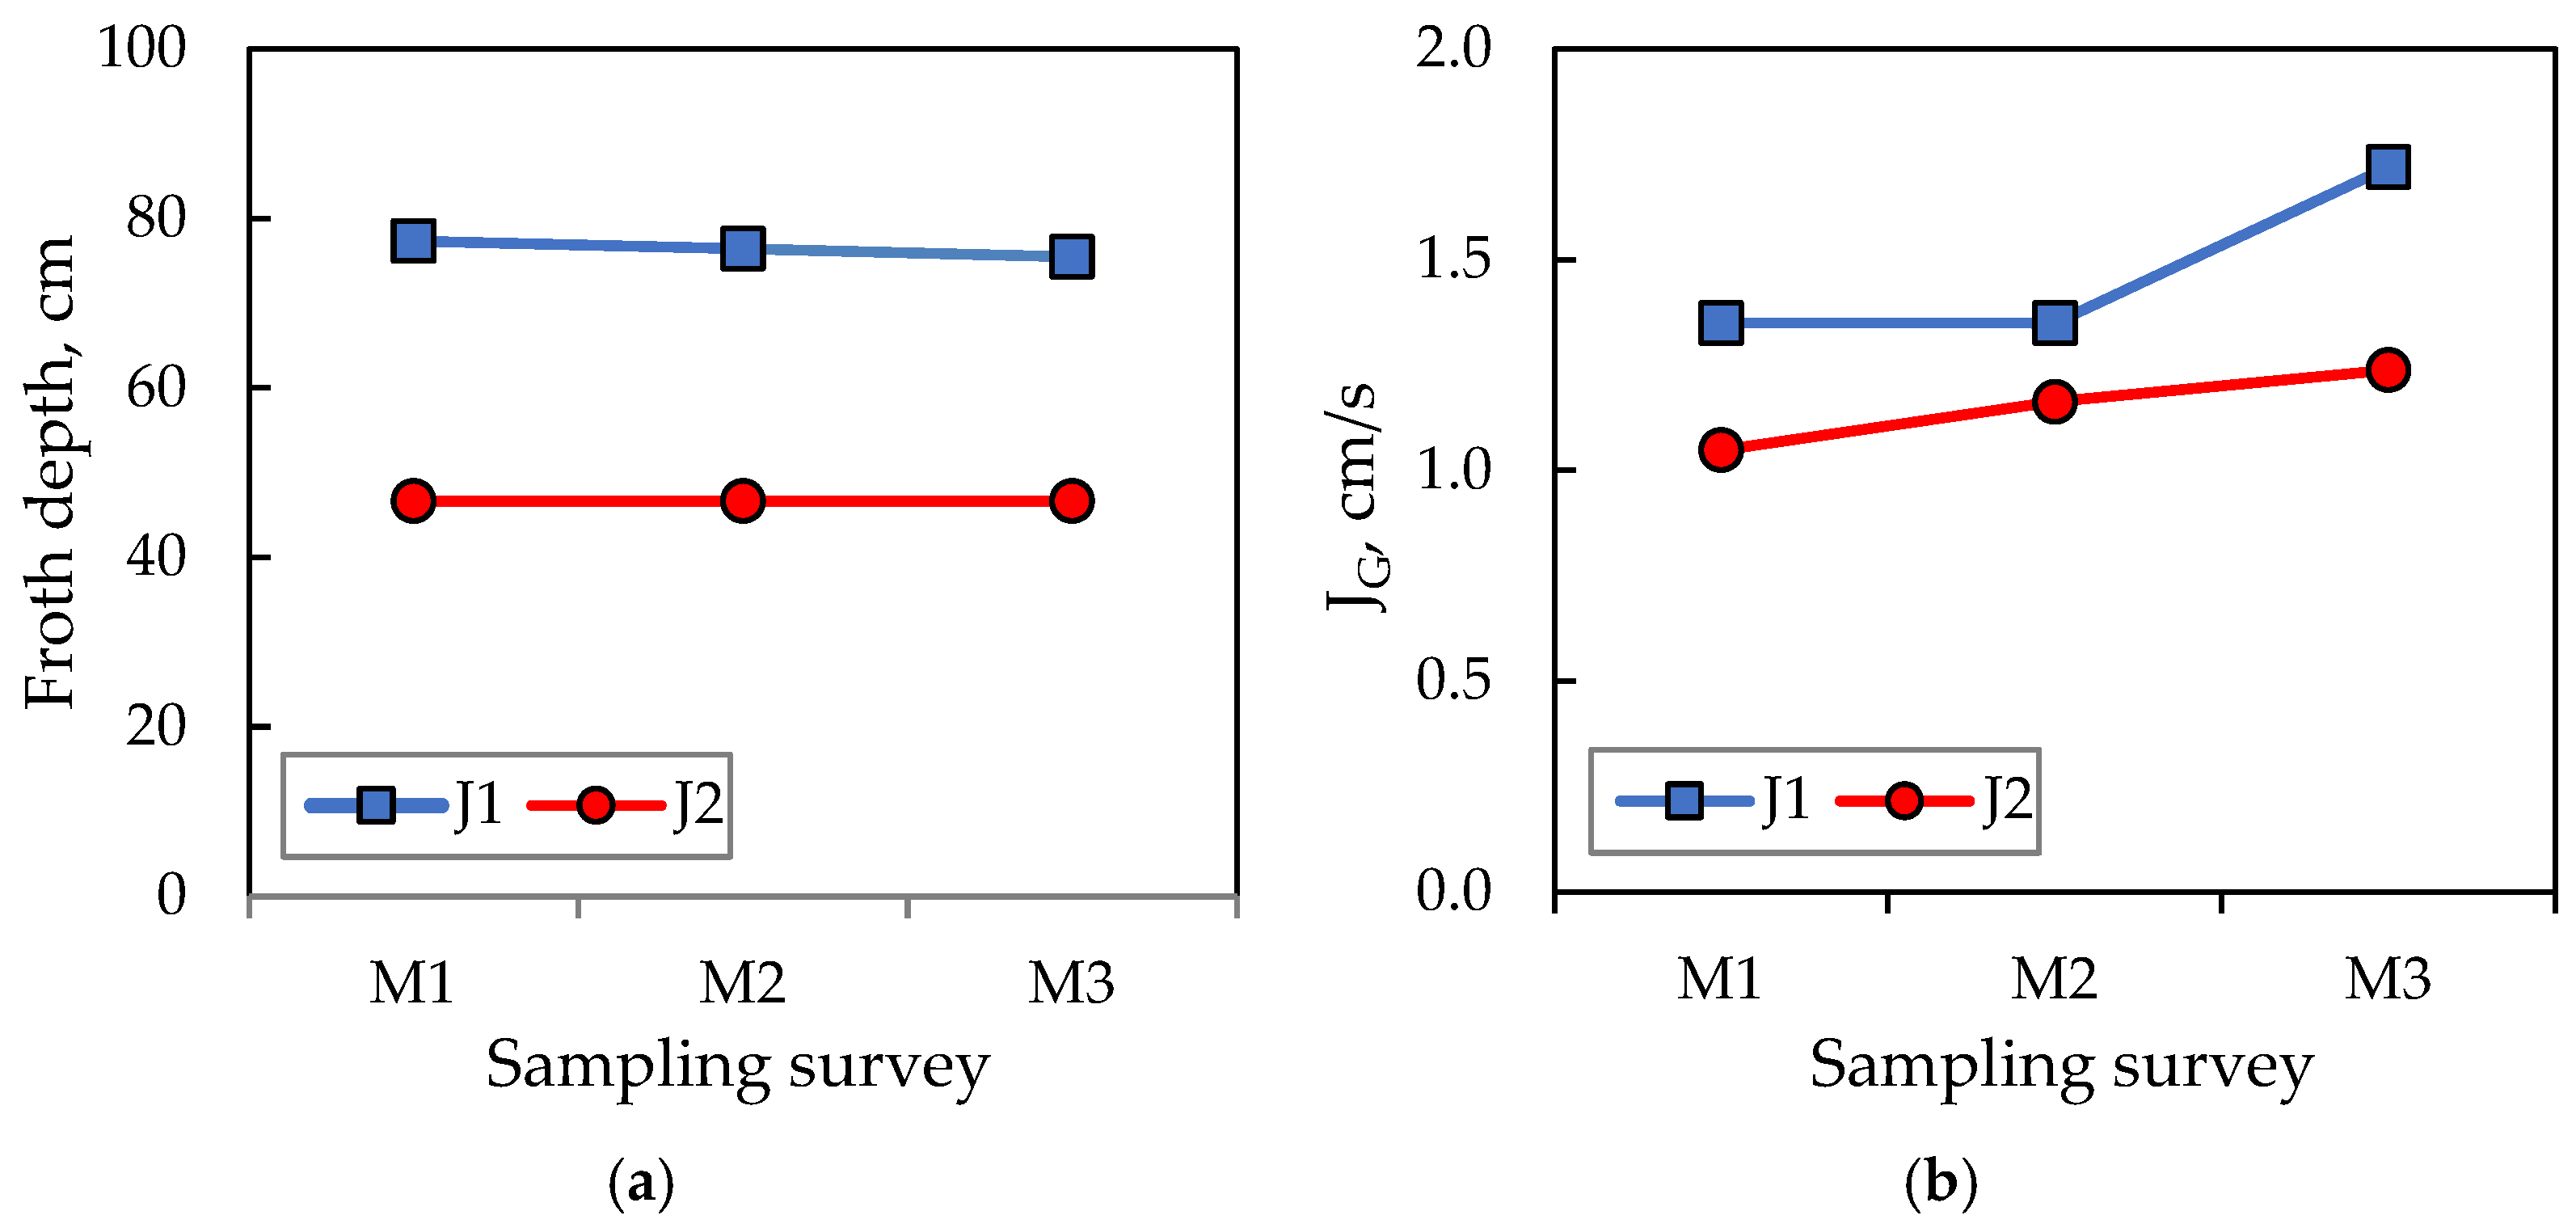
Figure 5 shows the froth depth and superficial gas rate in the Jameson cells (J1 and J2). The Jameson cell J1 showed a froth depth in the range of 75–77 cm (Figure 5a), and a range of JG = 1.3–1.7 cm/s (Figure 5b). On the other hand, the Jameson cell J2 showed a relatively constant froth depth, around 47 cm, and a JG in the range of 1.0–1.2 cm/s.
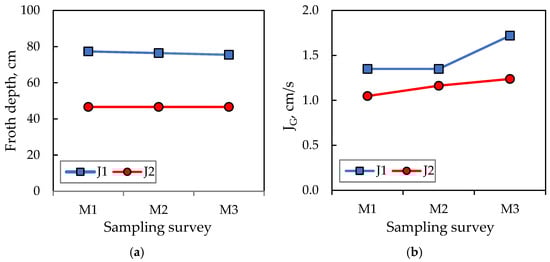
Figure 5.
Jameson cells operation in sampling surveys. (a) Froth depth, (b) superficial gas rate.
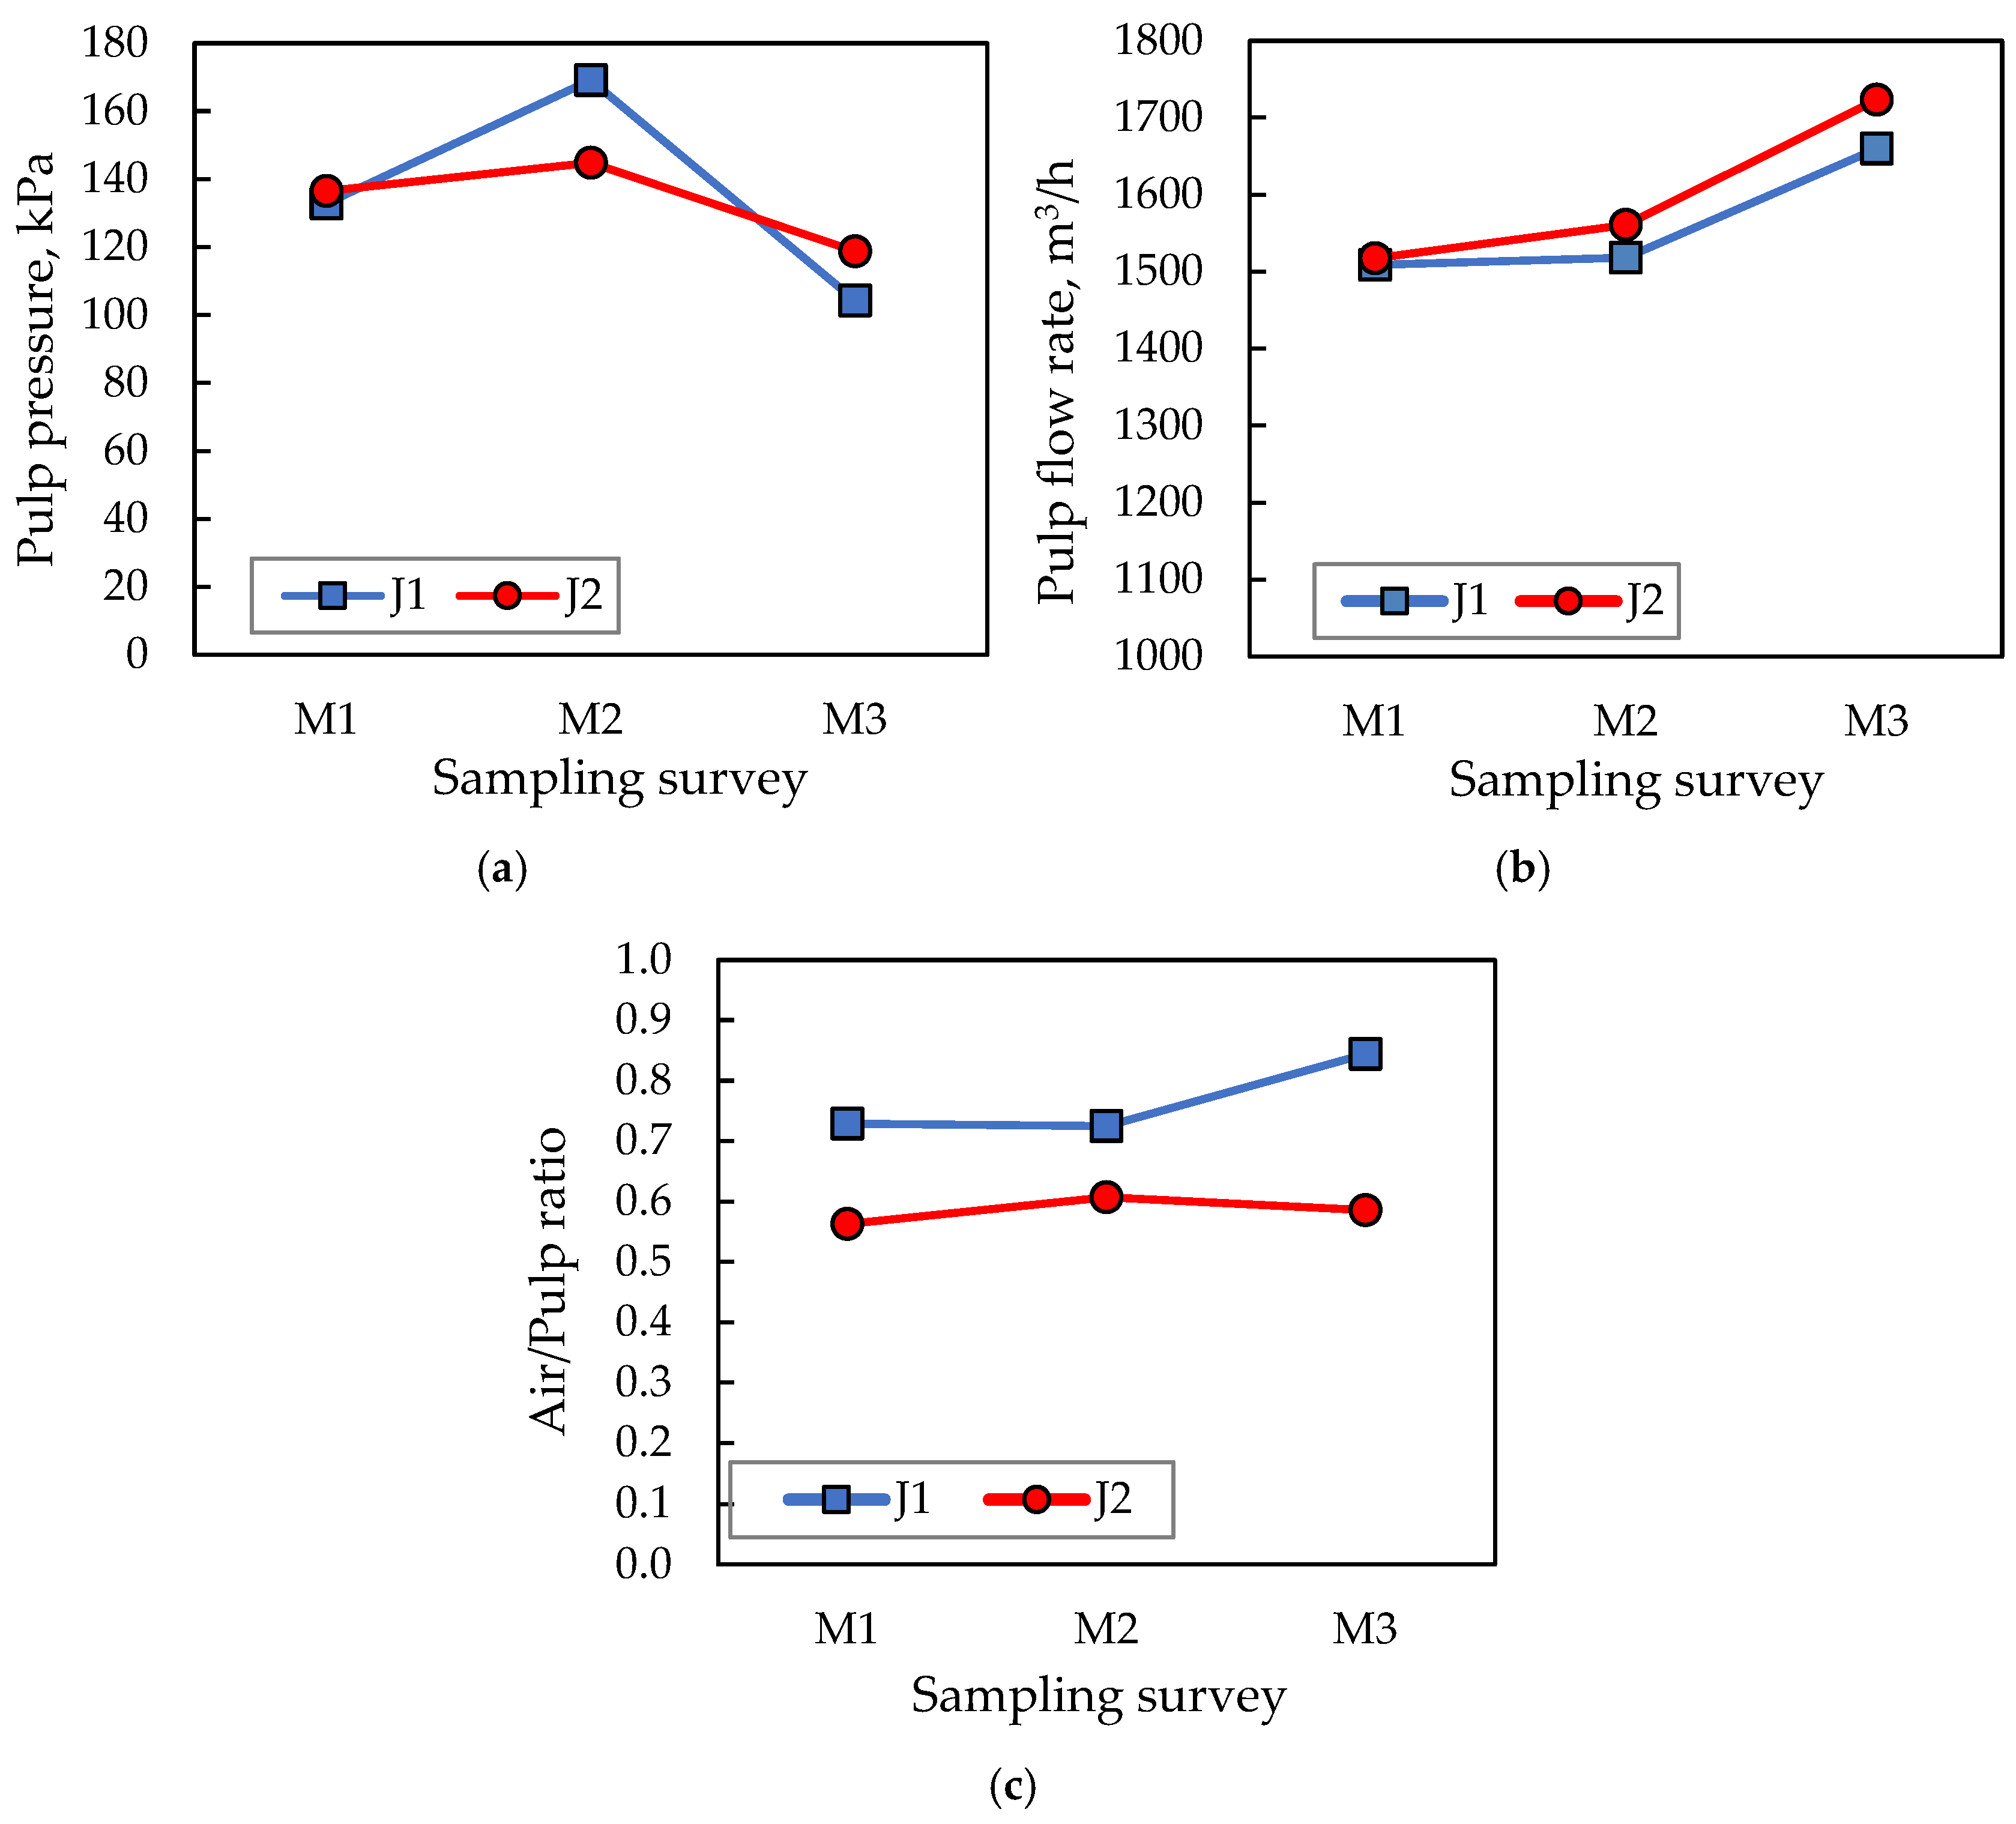
Figure 6 shows the pulp pressure (Figure 6a), pulp flow rate (Figure 6b), and the air/pulp ratio (Figure 6c) in the Jameson cells feed during sampling. The average pulp pressure during sampling was 135.5 kPa in cell J1 and 133.4 kPa in cell J2. Both cells showed a similar average operating condition, with a larger variability in cell J1. The pulp flow rate, which depends on the pulp pressure, was similar in both cells: about 1550 m3/h in M1 and M2, and 1700 m3/h in the last sampling survey (M3). On the other hand, the gas flow rate, which is directly related to the pulp flow rate, was slightly higher in cell J1 (JG = 1.43 cm/s on average), compared with cell J2 (JG = 1.13 cm/s on average). Consequently, the average air/pulp ratio was larger in cell J1, about 0.73, versus 0.60 in cell J2.
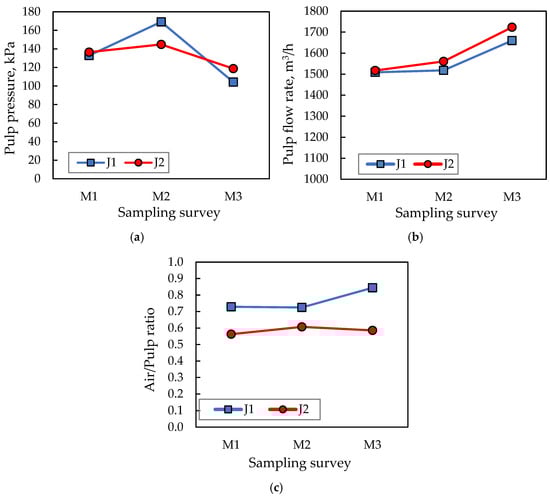
Figure 6.
Jameson cells operation in sampling surveys: (a) Pulp pressure, (b) pulp flow rate, and (c) air/pulp ratio.
3.2.3. Metallurgical Performance of the Cleaning Circuit
From the mass balance results, the concentrate grades of the first cleaner were 23.4% Cu and 0.55% Mo (columns feed). Additionally, the mass pull was 42%, and the Cu and Mo recoveries were 73% and 49%, respectively, with a lower selectivity of Mo.
The scavenger circuit showed a higher mass pull of 53%, with Cu and Mo recoveries of 94% and 98%, respectively, and concentrate grades of 11.1% Cu and 0.76% Mo. The scavenger stage operation causes high mineral circulating loads in the cleaning circuit while decreasing the Mo losses generated in the first cleaner.
The second cleaner circuit (columns) showed a mass pull of 54%, with Cu and Mo recoveries of 63% and 35%, respectively, and concentrate grades of 27.5% Cu and 0.29% Mo. This stage causes high mineral circulating loads in the cleaning circuit, mainly for Mo, but the Jameson cells partially recover these minerals to avoid a high circulating load to the first cleaner.
Table 2 shows a summary of the cleaning circuit results, in terms of average recoveries and concentrate grades for each stage. The Jameson cells’ results are included, but they are presented in more detail in Figure 7.
Table 2.
Mass balance results of the cleaning circuit stages.
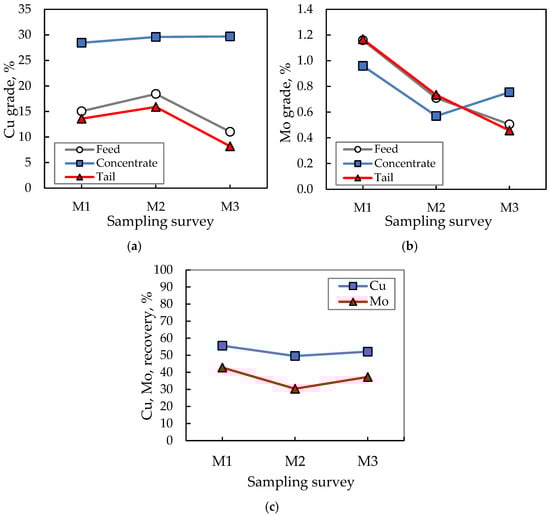
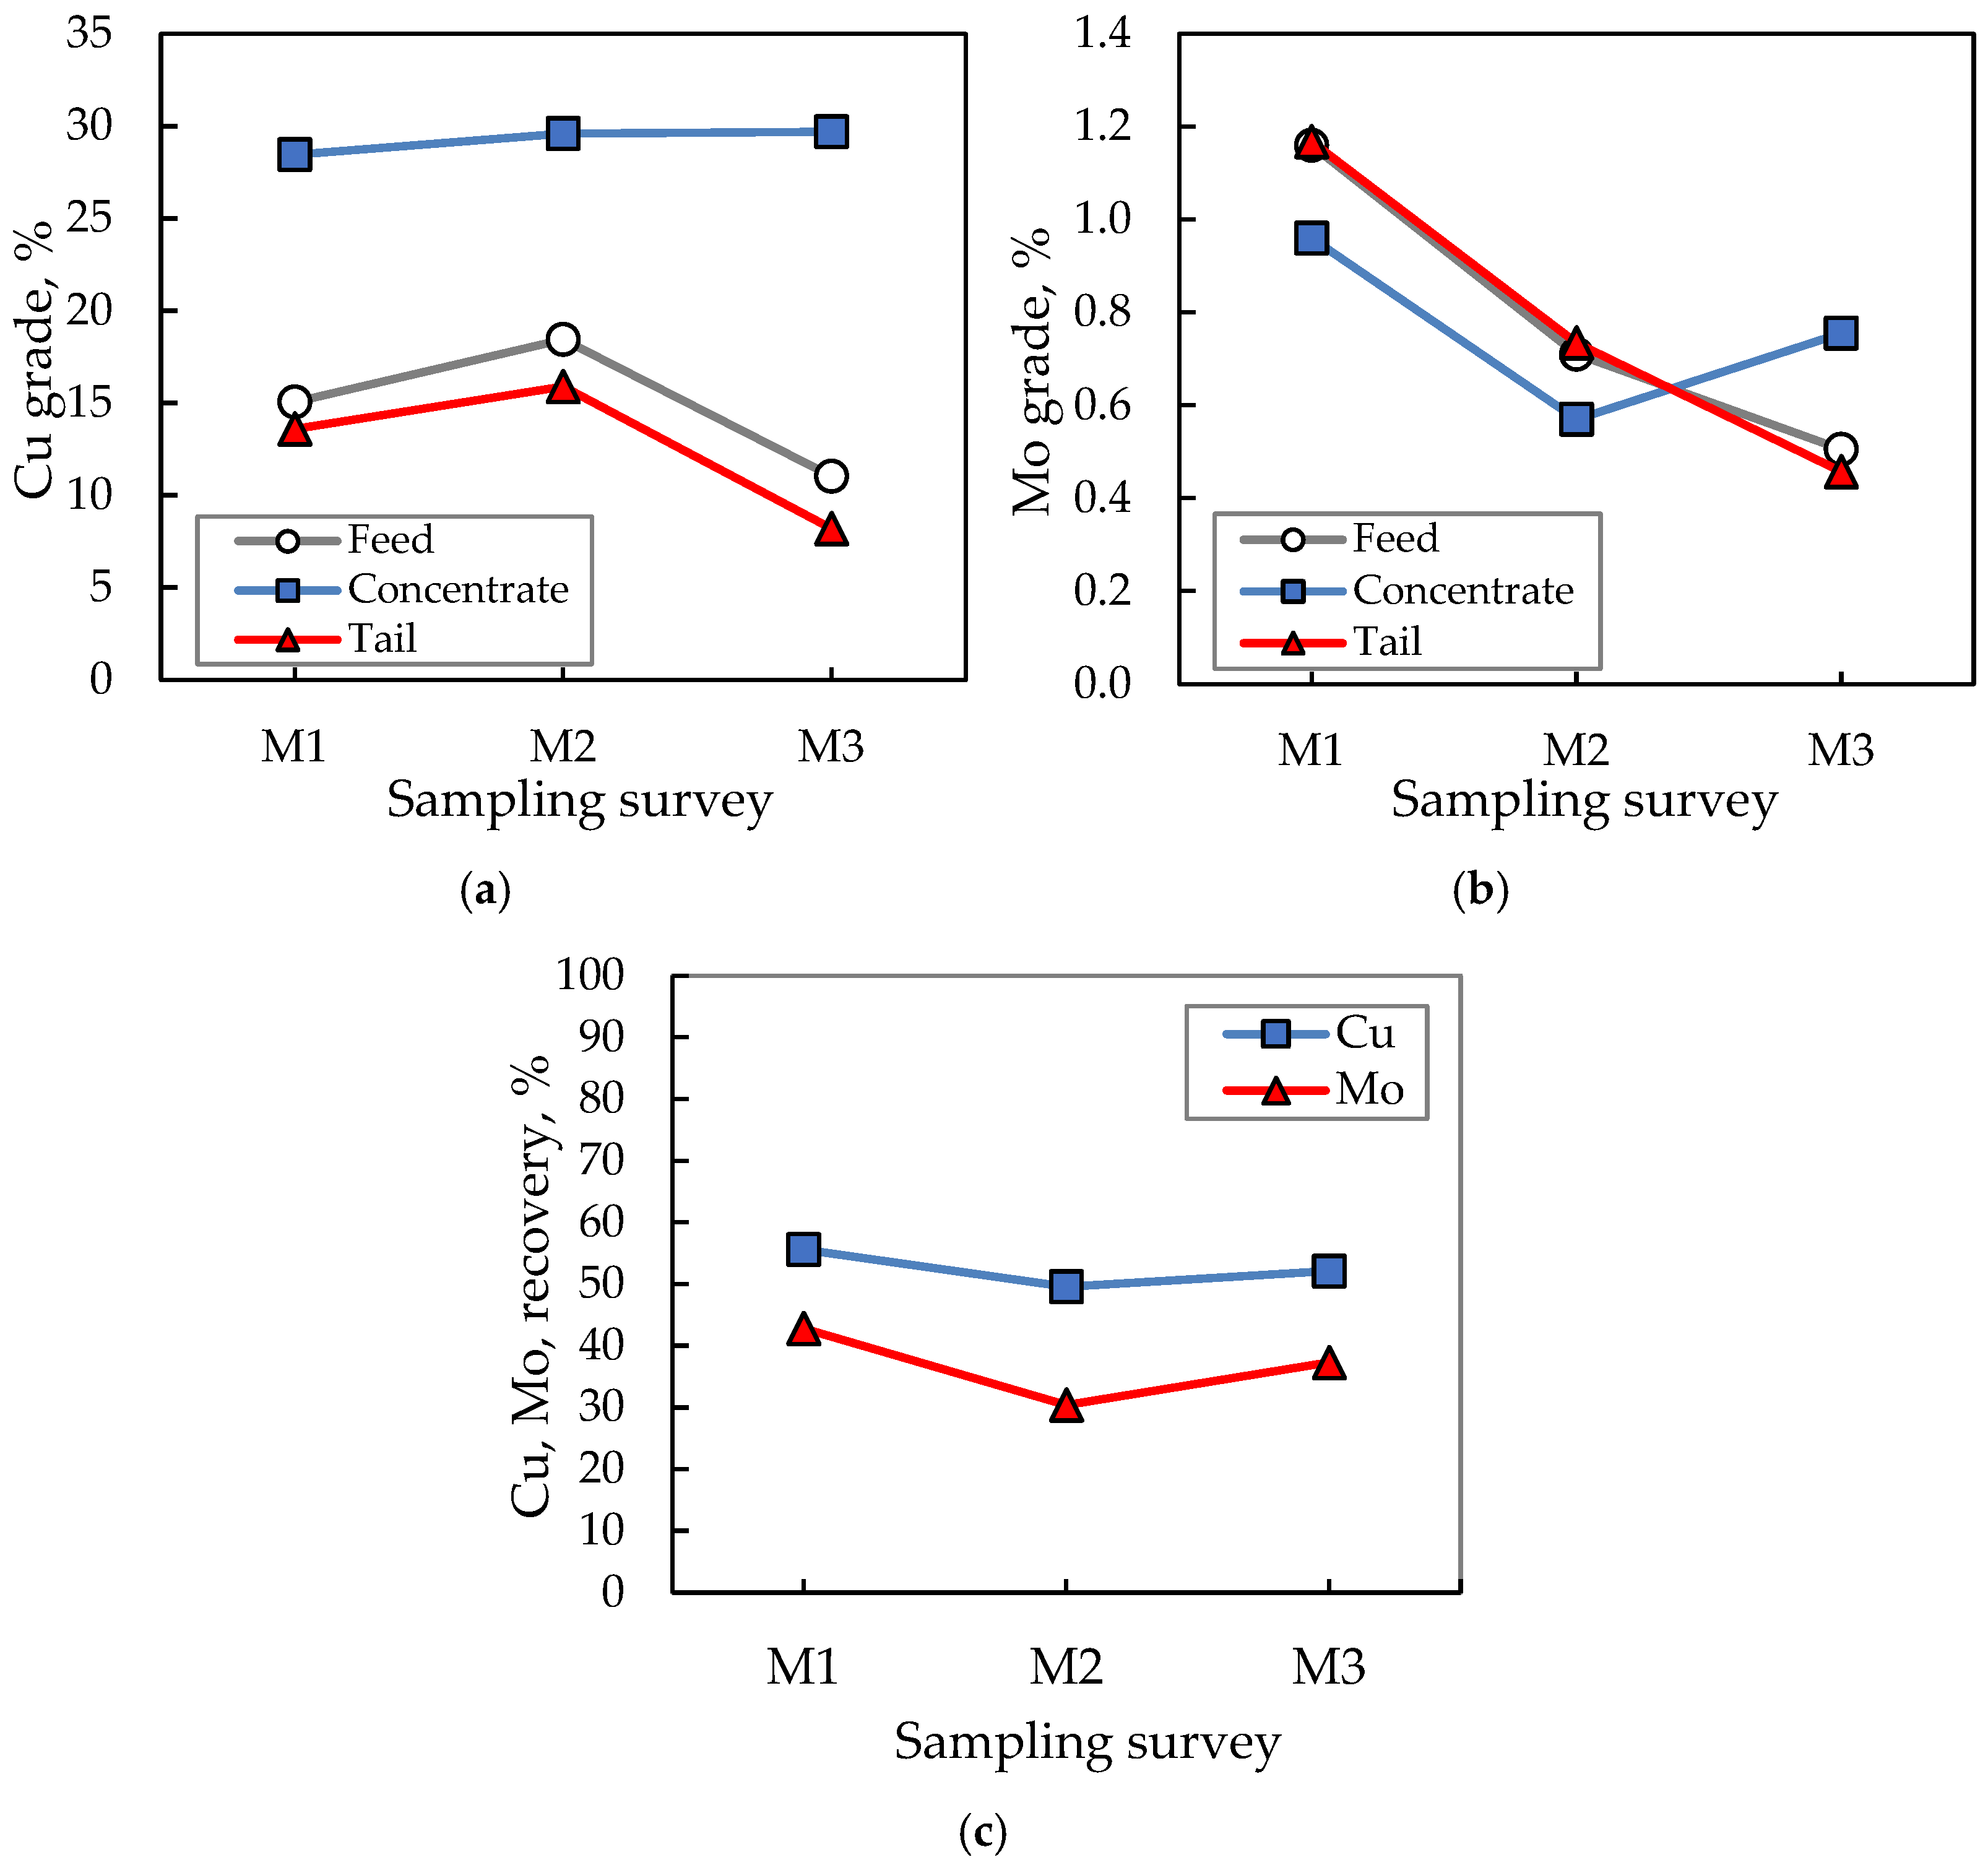
Figure 7.
Jameson cells: Grades in main streams, (a) Cu, (b) Mo; and (c) Cu and Mo recovery.
Figure 7 shows the Cu and Mo grades in the main streams of the Jameson cells (Figure 7a and Figure 7b, respectively), as well as the Cu and Mo recoveries (Figure 7c), during the sampling surveys M1, M2, and M3.
The results show a variable Cu feed grade (11%–18%) during the surveys, but the concentrate grades reach values of 28%–30% Cu (Figure 7a), which are directly final concentrate, as predicted from the pilot study. In addition, the Mo feed grades were also variable (0.5%–1.2%), Figure 7b, in a wider range than in the pilot testing, but the concentrate grade was kept closer to the feed grade (0.8%–1.0%). Then, a significant amount of the Mo contained in the circulating load was withdrawn and sent to the final concentrate. This allowed for an increase in Mo recovery and the final concentrate Mo grade.
The installation of the two Jameson cells to recover the Mo and Cu recycled from the columns’ tailings in the cleaning circuit allowed for increasing the Mo plant recovery by around 4%, also increasing the final concentrate Mo grade by 50% [13,14].
4. Conclusions
The evaluation of a pilot Jameson cell showed the potential to significantly recover Mo and Cu from the column tailings at Collahuasi’s collective flotation plant. This cell was able to enhance the plant metallurgical performance because it was able to produce a final concentrate with a high Mo grade and recover liberated and fine particles.
After the installation of two industrial Jameson cells into the concentrator plant, positive results were observed for the cleaning circuit.
Originally, the columns stage reached recoveries of about 63% Cu and 35% Mo, with relatively low enrichment of Cu (from 23.4% to 27.9%) and a decrease in the Mo grade, from 0.55% in feed to 0.29% in concentrate. This operation showed a large Mo circulating load, from the column tailings to the first cleaner.
The installation of two industrial Jameson cells allowed Cu and Mo to be recovered from the column tailings and sent directly to the final concentrate. Thus, the mineral circulating load was reduced by 49%, with better enrichment of Cu and Mo than the columns, reaching concentrate grades of 29.3% Cu and 0.76% Mo. In this way, the Jameson cells contributed 25% of Cu and 48% of Mo of the total mass of these elements in the final concentrate.
The Mo circulating load from the Jameson cells to the first cleaner was lower than 50%, which is significantly lower than the other Mo circulating load, from the scavenger circuit to the regrinding stage (100%–300%).
The Jameson cells operated with 32% mass pull, and Cu and Mo recoveries of 53% and 37%, respectively, which supported the estimation previously carried out from the pilot testing.
Author Contributions
Conceptualization, P.V. and J.Y.; methodology, P.V., J.Y. and J.C.; software, P.V.; validation, J.Y., P.V. and M.R.; formal analysis, P.V.; investigation, J.Y. and P.V.; resources, M.R. and J.C.; data curation, P.V., J.Y. and J.C.; writing—original draft preparation, P.V. and J.Y.; writing—review and editing, P.V., M.R. and J.C.; visualization, J.Y.; supervision, J.Y. and M.R.; project administration, J.Y. and M.R.; funding acquisition, J.Y. and M.R. All authors have read and agreed to the published version of the manuscript.
Funding
This research was funded by the Agencia Nacional de Investigación y Desarrollo (ANID), Fondecyt Project 1241830.
Data Availability Statement
The data presented in this study are available on request from the corresponding author. The data are not publicly available due to confidentiality restrictions.
Acknowledgments
The authors are grateful to the Agencia Nacional de Investigación y Desarrollo (ANID), FONDECYT Project 1241830, and Universidad Técnica Federico Santa María, Chile, for providing funding for process modelling and control research. Additionally, we would like to thank Doña Inés de Collahuasi Mining Company, Chile, for allowing this collaborative work to be published.
Conflicts of Interest
The authors declare no conflicts of interest. The funders had no role in the design of the study; in the collection, analyses, or interpretation of data; in the writing of the manuscript; or in the decision to publish the results.
References
- Schena, G.; Casali, A. Column flotation circuits in Chilean copper concentrators. Miner. Eng. 1994, 7, 1473–1486. [Google Scholar] [CrossRef]
- Wills, B.; Finch, J. Wills’ Mineral Processing Technology: An Introduction to the Practical Aspects of ore Treatment and Mineral Recovery, 8th ed.; Elsevier: Amsterdam, The Netherlands, 2016; pp. 351–366. [Google Scholar]
- Radmehr, V.; Shafaei, S.Z.; Noaparast, M.; Abdollahi, H. Optimizing Flotation Circuit Recovery by Effective Stage Arrangements: A Case Study. Minerals 2018, 8, 417. [Google Scholar] [CrossRef]
- Cisternas, L.A.; Méndez, D.A.; Gálvez, E.D.; Jorquera, R.E. A MILP model for design of flotation circuits with bank/column and regrind/no regrind selection. Int. J. Miner. Process. 2006, 79, 253–263. [Google Scholar] [CrossRef]
- Knoblauch, J.; Thanasekaran, H.; Wasmund, E. Improved cleaner circuit performance at the Degrusa copper mine with an in-situ column sparging system. In Proceedings of the Canadian Mineral Processor National Conference, Ottawa, ON, Canada, 20 January 2016. [Google Scholar]
- Hassanzadeh, A.; Vaziri, B.; Kouachi, S.; Brabcova, Z.; Çelik, M. Effect of bubble size and velocity on collision efficiency in chalcopyrite flotation. Colloids Surf. A Physicochem. Eng. Asp. 2016, 498, 258–267. [Google Scholar] [CrossRef]
- Harbort, G.J.; Manlapig, E.V.; Debono, S.K. Particle collection within the Jameson cell downcomer. Miner. Process. Extr. Metall. Rev. 2002, 111, 1–10. [Google Scholar] [CrossRef]
- Arburo, K. Exploratory Jameson Cell Batch Tests Results-CMDIC Cleaning Circuit; Internal Report; Xstrata Technology: Santiago, Chile, 2013. [Google Scholar]
- Xstrata Technology. Engineering Study-Collahuasi Jameson Cell Installation; Internal Report; Xstrata Technology: Brisbane, Australia, 2014. [Google Scholar]
- Benítez, M.; Vallejos, P.; Yianatos, J.; Vinnett, L. The mixing effect on scale-up factor of Jameson cells. In Proceedings of the 20th International Conference on Mineral Processing and Geo-Metallurgy (Procemin-Geomet), Santiago, Chile, 7–9 August 2024. [Google Scholar]
- Vallejos, P.; Yianatos, J.; Rodríguez, M.; Cortínez, J. Size-by-liberation characterization of an industrial flotation bank in Rougher and Cleaner-Scavenger operation. Minerals 2023, 13, 875. [Google Scholar] [CrossRef]
- Yianatos, J.; Vallejos, P. Evaluación de Mejoras en la Recuperación de Mo al Implementar Celdas Jameson en la Etapa de Limpieza de la Planta Concentradora CMDIC. Internal Report; Universidad Técnica Federico Santa María: Valparaíso, Chile, 2017. [Google Scholar]
- Catalán, E. Comportamiento Celdas Neumáticas Etapa de Limpieza Flotación Colectiva CMDIC. In Proceedings of the XIV Congress of Flotation, FLOTAMIN (Edoctum), Viña del Mar, Chile, 26–27 August 2021. [Google Scholar]
- Rodríguez, M. Optimización Planta de Flotación. In Proceedings of the II International Congress of Flotation FLOTAC, Viña del Mar, Chile, 30–31 March 2023. [Google Scholar]
Disclaimer/Publisher’s Note: The statements, opinions and data contained in all publications are solely those of the individual author(s) and contributor(s) and not of MDPI and/or the editor(s). MDPI and/or the editor(s) disclaim responsibility for any injury to people or property resulting from any ideas, methods, instructions or products referred to in the content. |
© 2025 by the authors. Licensee MDPI, Basel, Switzerland. This article is an open access article distributed under the terms and conditions of the Creative Commons Attribution (CC BY) license (https://creativecommons.org/licenses/by/4.0/).