Abstract
Mining wastes containing sulfide minerals can generate contaminated waters as acid mine drainage (AMD) and contaminated neutral drainage (CND). This occurs when such minerals are exposed to oxygen and water. Nowadays, mineralogical work—when it is done—is independently and differentially done according to the needs of the exploration, geotechnics, metallurgy or environment department, at different stages in the mine development process. Moreover, environmental impact assessments (EIA) are realized late in the process and rarely contain pertinent mineralogical characterization on ores and wastes, depending on countries’ regulations. Contaminant-bearing minerals are often not detected at an early stage of the mine life cycle and environmental problems could occur during production or once the mine has come to the end of its productive life. This work puts forward a more reliable methodology, based on mineralogical characterization of the ore at the exploration stages, which, in turn, will be useful for each stage of the mining project and limit the unforeseen environmental or metallurgical issues. Three polymetallic sulfide ores and seven gold deposits from various origins around the world were studied. Crushed ore samples representing feed ore of advanced projects and of production mines were used to validate the methodology with realistic cases. The mineralogical methodology consisted in chemical assays and XRD, optical microscopy, SEM and EPMA were done. Five of the ores were also submitted to geochemical tests to compare mineralogical prediction results with their experimental leaching behavior. Major, minor, and trace minerals were identified, quantified, and the bearing minerals were examined for the polluting elements (and valuables). The main conclusion is that detailed mineralogical work can avert redundant work, save time and money, and allow detection of the problems at the beginning of the mine development phase, improving waste management and closure planning.
1. Introduction
With the growing demand for new technologies and in life quality of emerging countries, mineral and metal productions will become critical in years to come. The industry has to adapt its practices to be more efficient. Moreover, the mining industry, like other industries, produces waste that have negative impacts on the environment [1]. To maintain license-to-operate, companies must consider and address social issues and environmental concerns throughout the life cycle of the project [2]. Moreover, decisions in mining projects are mainly based on valuable metal grades without taking into account environmental issues. Contaminants are often not taken into account during the first stages (exploration or feasibility stages) of a mine project. In addition, if they are, geologists will not consider them at their potential contaminating value because their focus is on mineralization and deposit geology where trace elements are less informative. This can lead to major environmental challenges underestimation. Frequently, problems regarding the release of toxic elements are discovered after the mine starts up. Consequently, mining companies should modify their treatment techniques, their effluent management (liquid and solid) and their closure plan. This can generate unexpected and supplementary costs. In the case of a belated discovery of a contaminant, the issue is generally explained by the mineralogy of the ore or of the waste [3,4].
The contaminants are mostly brought about through weathering of sulfides containing metals and metalloids such as As, Cu, Ni, Sb, Zn, etc. Indeed, when solid mine wastes contain sulfides or sulfosalts, and are exposed to air and oxygen, chemical reactions will occur and the mine wastes will generate poor water quality. When the pH is acidic, the phenomenon is called acid mine drainage (AMD). The sulfides react at different oxidation rates according to their nature and crystallography and differently contribute to water pollution [5,6,7,8,9,10,11,12]. Sulfosalt minerals are considered as “trash minerals”, as they contain numerous toxic elements (As, Bi, Co, Hg, Ni, Tl, Sb, Se, etc.), and dissolve easily when exposed to weathering conditions and are more likely to generate contaminants. Another phenomenon, called contaminated neutral drainage (CND), can occur when neutralizing minerals are present or when not enough sulfides are found in the solids. The pH is circumneutral, but metals and metalloids concentrations are present in the leachates above regulation levels.
Microscale mineral dissolution in mine wastes will determine the weathering processes and the minerals are the sources of metal concentrations in the leachates [13]. Mineral dissolution, oxidation, or precipitation depend on several mineralogical parameters: amount, composition, particle size distribution, liberation degree, other mineral associations, ore texture, and surface properties [14]. For example, the associations of minerals can play a significant role in the acidity and contaminants generation, as their association can change the reactivity rates of the minerals. In the case of sulfides, which are semiconducting minerals, galvanic interactions occur and will accelerate or inhibit the oxidation of the affected sulfides [15,16,17]. Over the last few years, some authors have demonstrated that the mineralogy is decisive in AMD and CND generation [18,19,20,21]. Applied mineralogy in environmental studies would help to predict the water quality and to characterize the problematic minerals in a sample [22,23]. The various elements dispersed into the environment from a given sample are strongly influenced by the major and trace element composition of the minerals present in this sample.
Mineralogical information is important for all the mining departments: geology, metallurgy, and environment [24]. Mineralogical investigations are necessary to identify and quantify major, minor and trace minerals and can detect valuable elements as by-products that could improve the recovery efficiency of the ore and increase the value of the deposit. Valuable elements can be found as the main element of trace minerals like platinum in sperrylite (PtAs2), or as a trace element in major, minor, or trace minerals like indium in sphalerite (ZnS). Moreover, valuable minerals in small amounts can be detected and beneficiated as well. If their detection is early in the development process, the appropriate treatment can be implemented.
Likewise, AMD and CND prediction studies can be conducted on the wastes to assess their environmental behavior. They mainly consist in geochemical testing. A few mineralogical characterizations can be done in specific cases (e.g., contaminant detection in the leachates of the geochemical tests) [25]. But tailing samples are only available after metallurgical pilot tests are preformed, which means that the project is in an advanced stage. In order to predict the environmental impact of the mining deposit at an earlier stage (like exploration), the studies could be performed directly on the ore. Unfortunately, the quality of the mine drainage is not always predictable with ore products. As Dold [21] recommends, refined methodologies must be applied to characterize ore deposits before mine start up and to assess the geochemical behavior of mine products. This might give us the opportunity to design optimized processes for efficient metal recovery of the different mineral assemblages in an ore deposit and, at the same time, to minimize the future environmental impact and costs for mine waste management.
This study proposes to implement a reliable and simple methodology for ore characterization, combining accurate chemical analysis as well as rigorous mineralogical analysis and observations, as early as the exploration stage. The procurement of an ore profile will allow detection of the contaminating elements as well as the valuable elements, related to metallurgical and environmental challenges. This approach is based on the mineralogy of the ores and will take into account bearing minerals and the element speciation. Geochemical tests have been also completed on five ores to link the mineralogical results with the geochemical results. The final aim is to develop tools to acquire information providing companies with a better assessment of the environmental impacts of a future exploitation and a better preparation for metallurgical issues that they will have to face, as early as possible in the mining development.
2. Materials and Methods
2.1. Materials
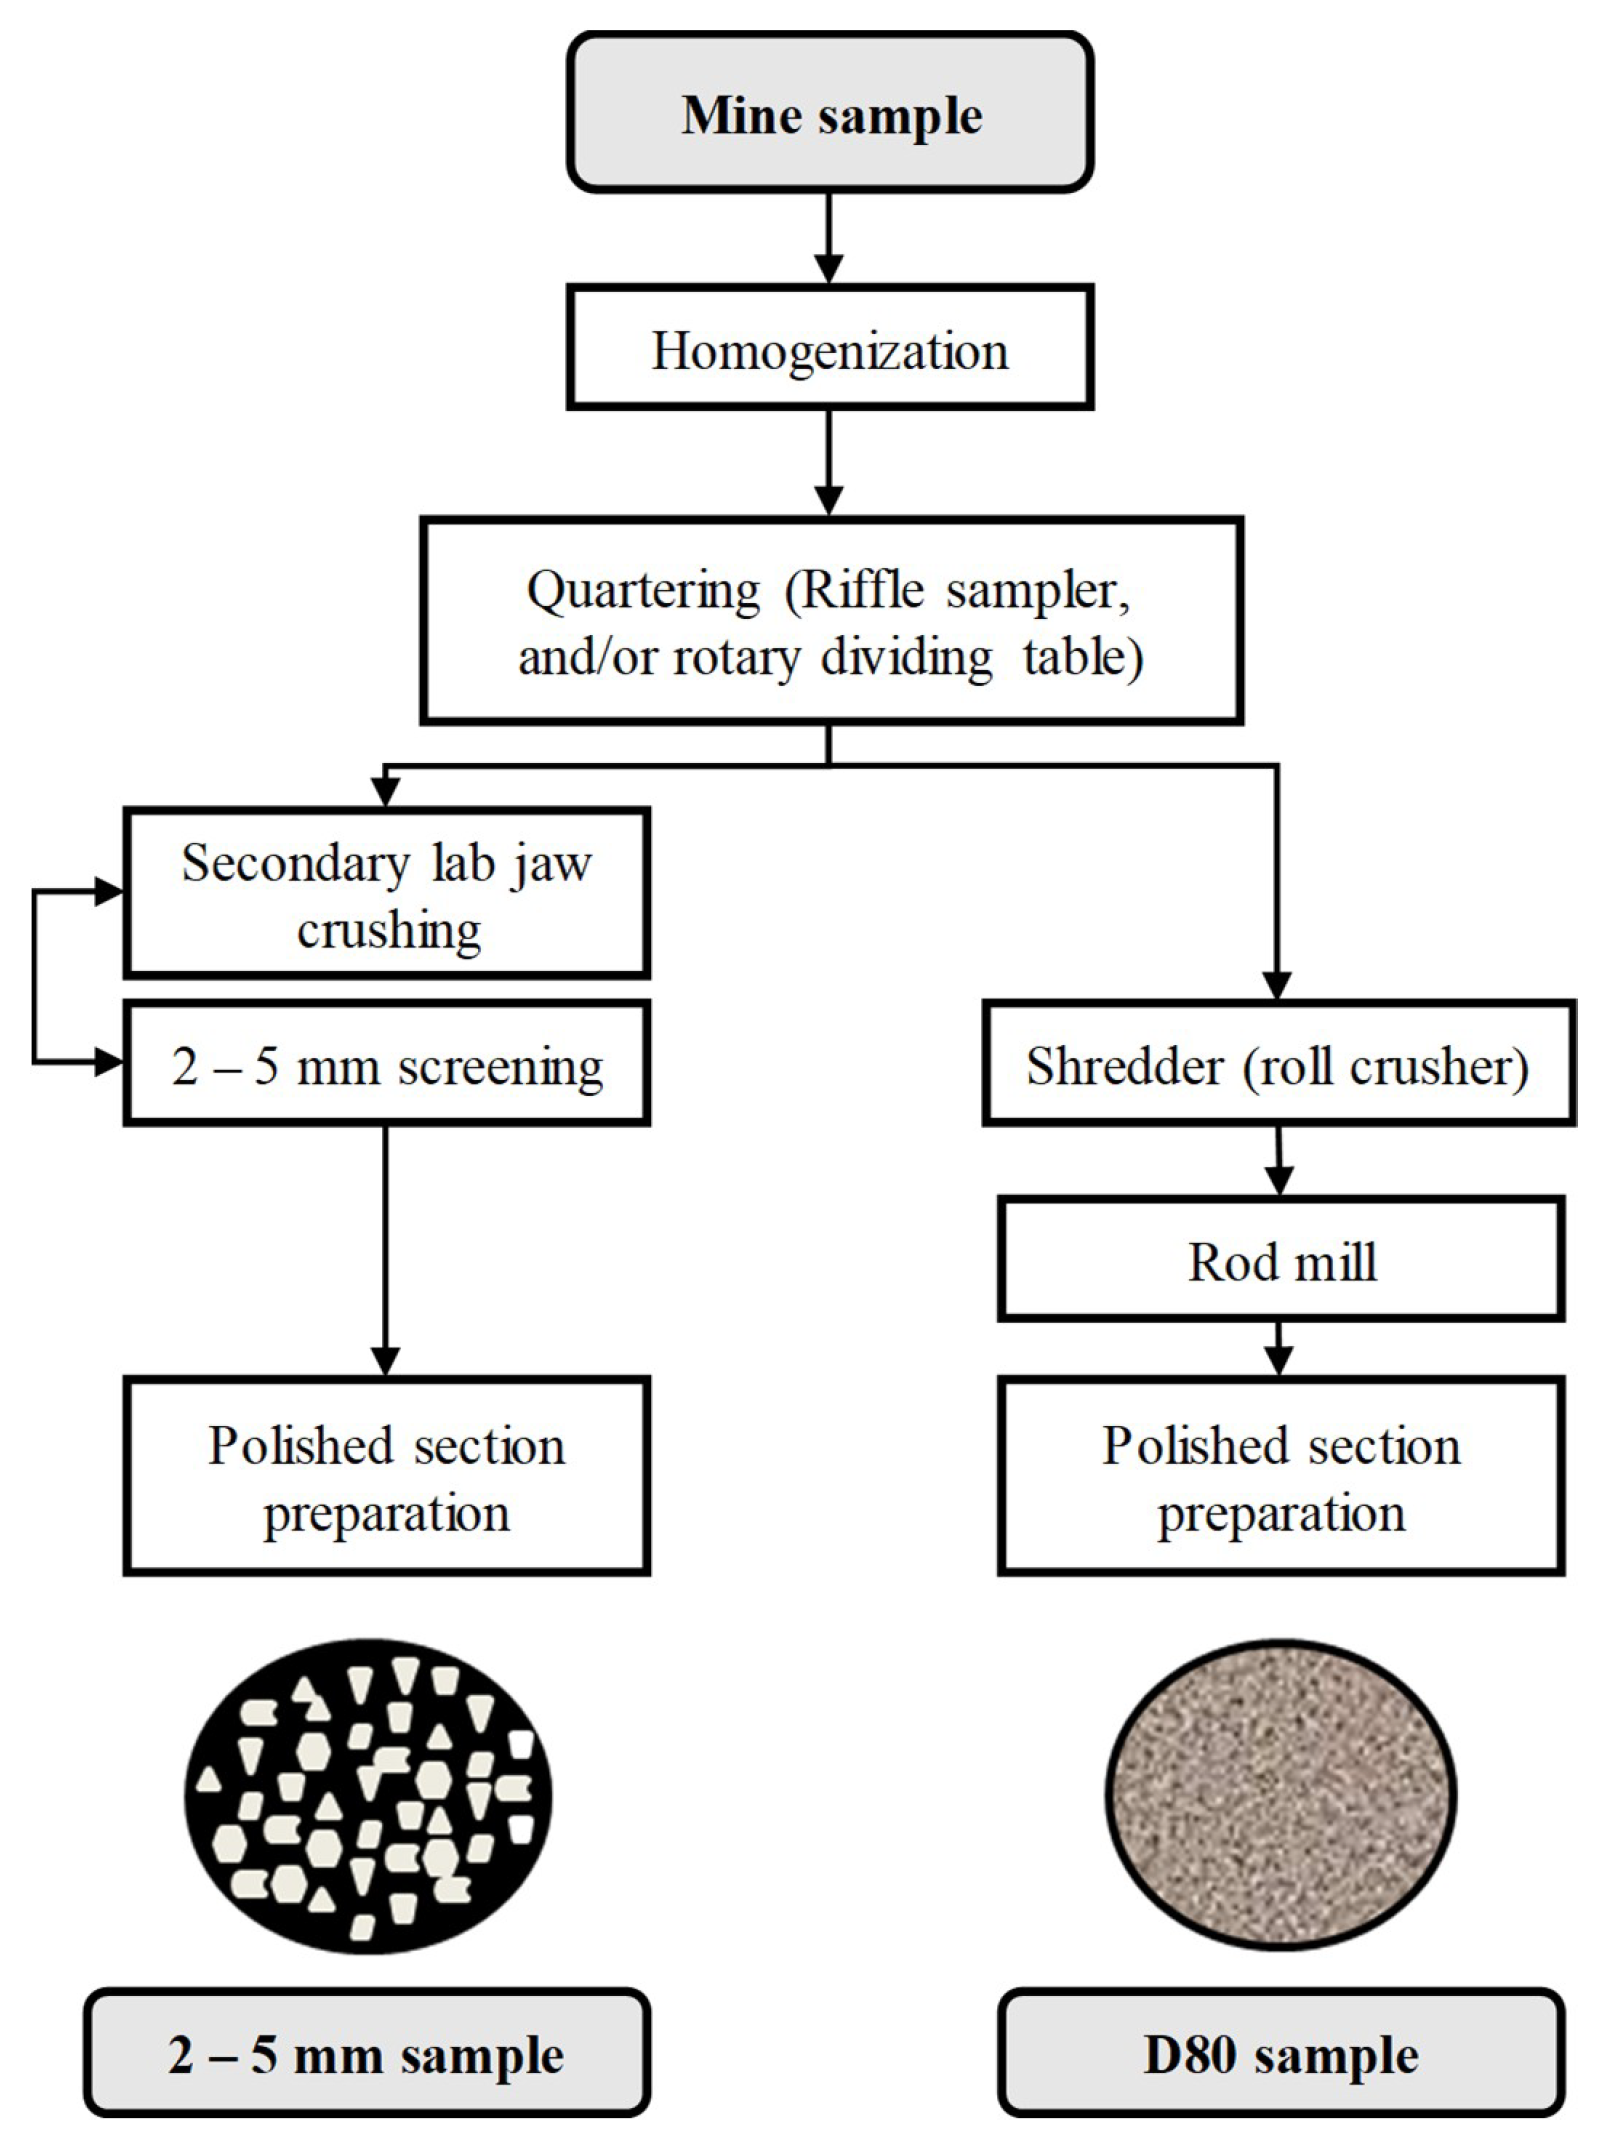
Three polymetallic and seven gold deposits were studied, mainly from Canada, but also from Argentina, Finland and Mexico. Table 1 briefly describes the deposits. Operators collected the samples of these ores on the mine sites, except for Westwood, where the collection was done by the authors. Some samples collected were already prepared in the mines’ lab. All samples were then submitted to a meticulous preparation to remain representative of the initial sample. The initial sample was considered a part of the feed. The feed ore is the first solid material to meticulously characterize environmental and ore processing behaviors. Inline Appendix A Table A1 describes in detail the different sample collection and the mine’s preparation. The preparation described in Figure 1 aimed to obtain two 500 g samples of different particle size. The first one is a 2–5 mm sample, prepared in polished section, to allow observation of the ore texture. The second one is a milled sample with a D80 approximately the same as the plant’s final product. The latter was used for all chemical and mineralogical analyses and to be quantitatively representative when observed on polished sections by microscopy. The samples already with a particle size of ≤2 mm were directly screened at 1 mm and kept despite their fine particle size distribution, and then rod milled to obtain the chosen D80. The representativeness of the initial material was kept thanks to successive homogenization and dividing with appropriate techniques (Figure 1). The ore powders containing less than 5 wt. % sulfur were also concentrated with a heavy liquid (bromoform) by centrifugation to maximize sulfide grain observation. The polished sections were prepared with epoxy resin, hardener and black carbon powder. The black carbon powder aims to avoid particles sedimentation and improve the representativeness of the analyzed surface, to limit differential removal of particles by polishing, and to reduce the particles in contact in the polished section [26]. This preparation has the advantage of making the surface conductive without carbon coating, which allows successive observations by optical and electron microscopy.

Table 1.
Deposits description: country, geology, mineralization, and products.
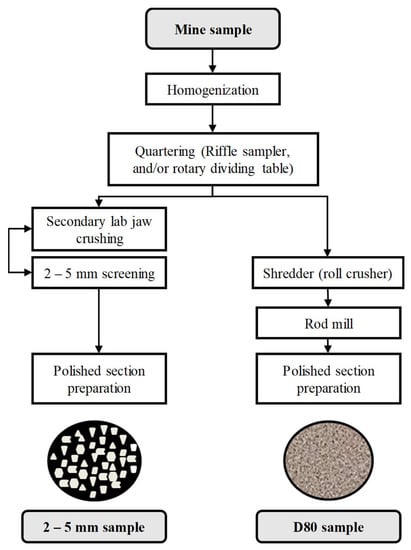
Figure 1.
Lab preparation procedure to obtain the two different polished sections.
2.2. Methods
2.2.1. Particle Size Distribution
The particle size distributions of the successive milling step samples and of the final powders were measured with a S3500 laser grain size analyzer (Microtrac) [27].
2.2.2. Chemical Characterization
Several chemical analysis techniques were tested to obtain a reliable chemical composition of the samples. The selected methods are described here. The sulfur and carbon content were analyzed by a CS-2000 induction furnace ELTRA (Haan, Germany) coupled with an infrared analyzer. The major elementary composition (Na, Mg, Al, Si, P, Cl, K, Ca, Ti, V, Cr, Mn, Fe) was determined with a whole rock analysis by fused discs (lithium metaborate fusion) [28,29,30,31] and by multi-acid digestion in the microwave which was followed by analysis using an Optima 3100 ICP-AES instrument (Perkin Elmer, Waltham, MA, USA) to obtain more accurate results for the smaller concentrations of these elements. The elementary chemical composition (As, Ba, Bi, Cd, Co, Cu, Mo, Ni, Pb, Sb, Se, Sn, and Zn) was determined by an Optima 3100 ICP-AES analysis following a multi-acid digestion (HNO3-Br2-HF-HCl) of 500 mg of a pulverized aliquot in the microwave and by a combined ICP-AES and ICP-MS following a sodium peroxide fusion. The trace elements (rare earths and others) were analyzed by ICP-MS following the sodium peroxide fusion. The analysis of gold was performed using a 50 g subsample by a fire assay procedure combined with both gravimetric and atomic absorption spectroscopy (AAS). The PGEs (Pd and Pt) were analyzed by fire assay combined with AAS. The mercury content was determined by thermal decomposition, amalgamations and AAS.
2.2.3. Mineralogical Characterization
The powder samples were micronized to be analyzed by X-ray diffraction with an AXS Advance D8 system (Bruker) equipped with a copper cathode, acquired at a rate of 0.02° s−1 between 2θ values of 5° and 70°. The DiffracPlus EVA software (Version 9.0) was used to identify the mineral species, and the quantitative mineralogical compositions were evaluated using the TOPAS software (Version 2.1) with a Rietveld refinement [32]. The absolute precision of this quantification method is ± 0.5 to 1% [33,34], but in practice, 1% to 5% should be considered. The identification of the minerals and the texture observations were performed in reflected light mode using an AxioImager M2m optical microscope (Zeiss, Oberkochen, Germany) equipped with the AxioVision (Version 4.8) software. Scanning electron microscopy (SEM) observations using backscattered electrons (BSE) for texture observations were made on a S-3500N microscope (Hitachi, Chiyoda, Tokyo, Japan) with the INCA software (450 Energy). The major element chemical composition of individual minerals was determined using an energy dispersive spectrometer (EDS; Oxford SDD, X-Max 20mm²). The SEM observations and microanalyses were performed with 15 mm working distance and 100-µA current at 20 kV. Then, the more precise composition of some minerals and trace elements quantification in arsenopyrite, chalcopyrite, galena, pentlandite, pyrite, pyrrhotite and sphalerite were achieved by analyzing a minimum of ten particles from each mineral using a SX100 Electron Probe Micro-Analyzer (EPMA, Cameca) coupled with four WDS (Wavelength-dispersive X-ray Spectrometry) spectrometers. All quantitative analyzes were realized using an accelerating voltage of 20 kV and a constant beam current of 20 nA. The counting time on each peak/background was 10 s on the major elements and 40 s on the trace elements: Ag, As, Au, Cd, Co, In, Mn, Ni, Pb, Se, Sn, Te, and Tl. Depending on the sample studied, pyrite was analyzed for S, Fe, As, Au, Ag, Tl, and Se; pyrrhotite for S, Fe, Co, and Ni; arsenopyrite for S, Fe, As, and Au; chalcopyrite for S, Cu, Fe, Ag, As, Sn, Tl, Te, and Cd; sphalerite for S, Zn, Fe, Ag, In, Cd, Mn, Pb, and Tl; galena for S, Pb, Fe, and Ag; and pentlandite for S, Fe, Ni, and Co.
2.2.4. Geochemical Testing
The geochemical behavior of five ores was evaluated using modified weathering cell tests. These weathering cells are small-scale humidity cells that render similar results for the rates of reactions [35,36,37]. A 100 mm Büchner funnel with a 0.45 µm glass-fiber filter is held with 67 g of material. The sample is leached twice a week with 50 mL deionized water. The cells were placed in a controlled-weather box to maintain the samples under optimal saturation conditions ranges and avoid extreme drying [38]. Leachates from the weathering cells were analyzed for pH, conductivity, Eh, sulfur and elemental concentrations. The element concentrations in the leachates were analyzed by ICP-AES on an aliquot acidified to 2% HNO3 for preservation. The weathering cells were run for thirty cycles.
2.3. General Methodology
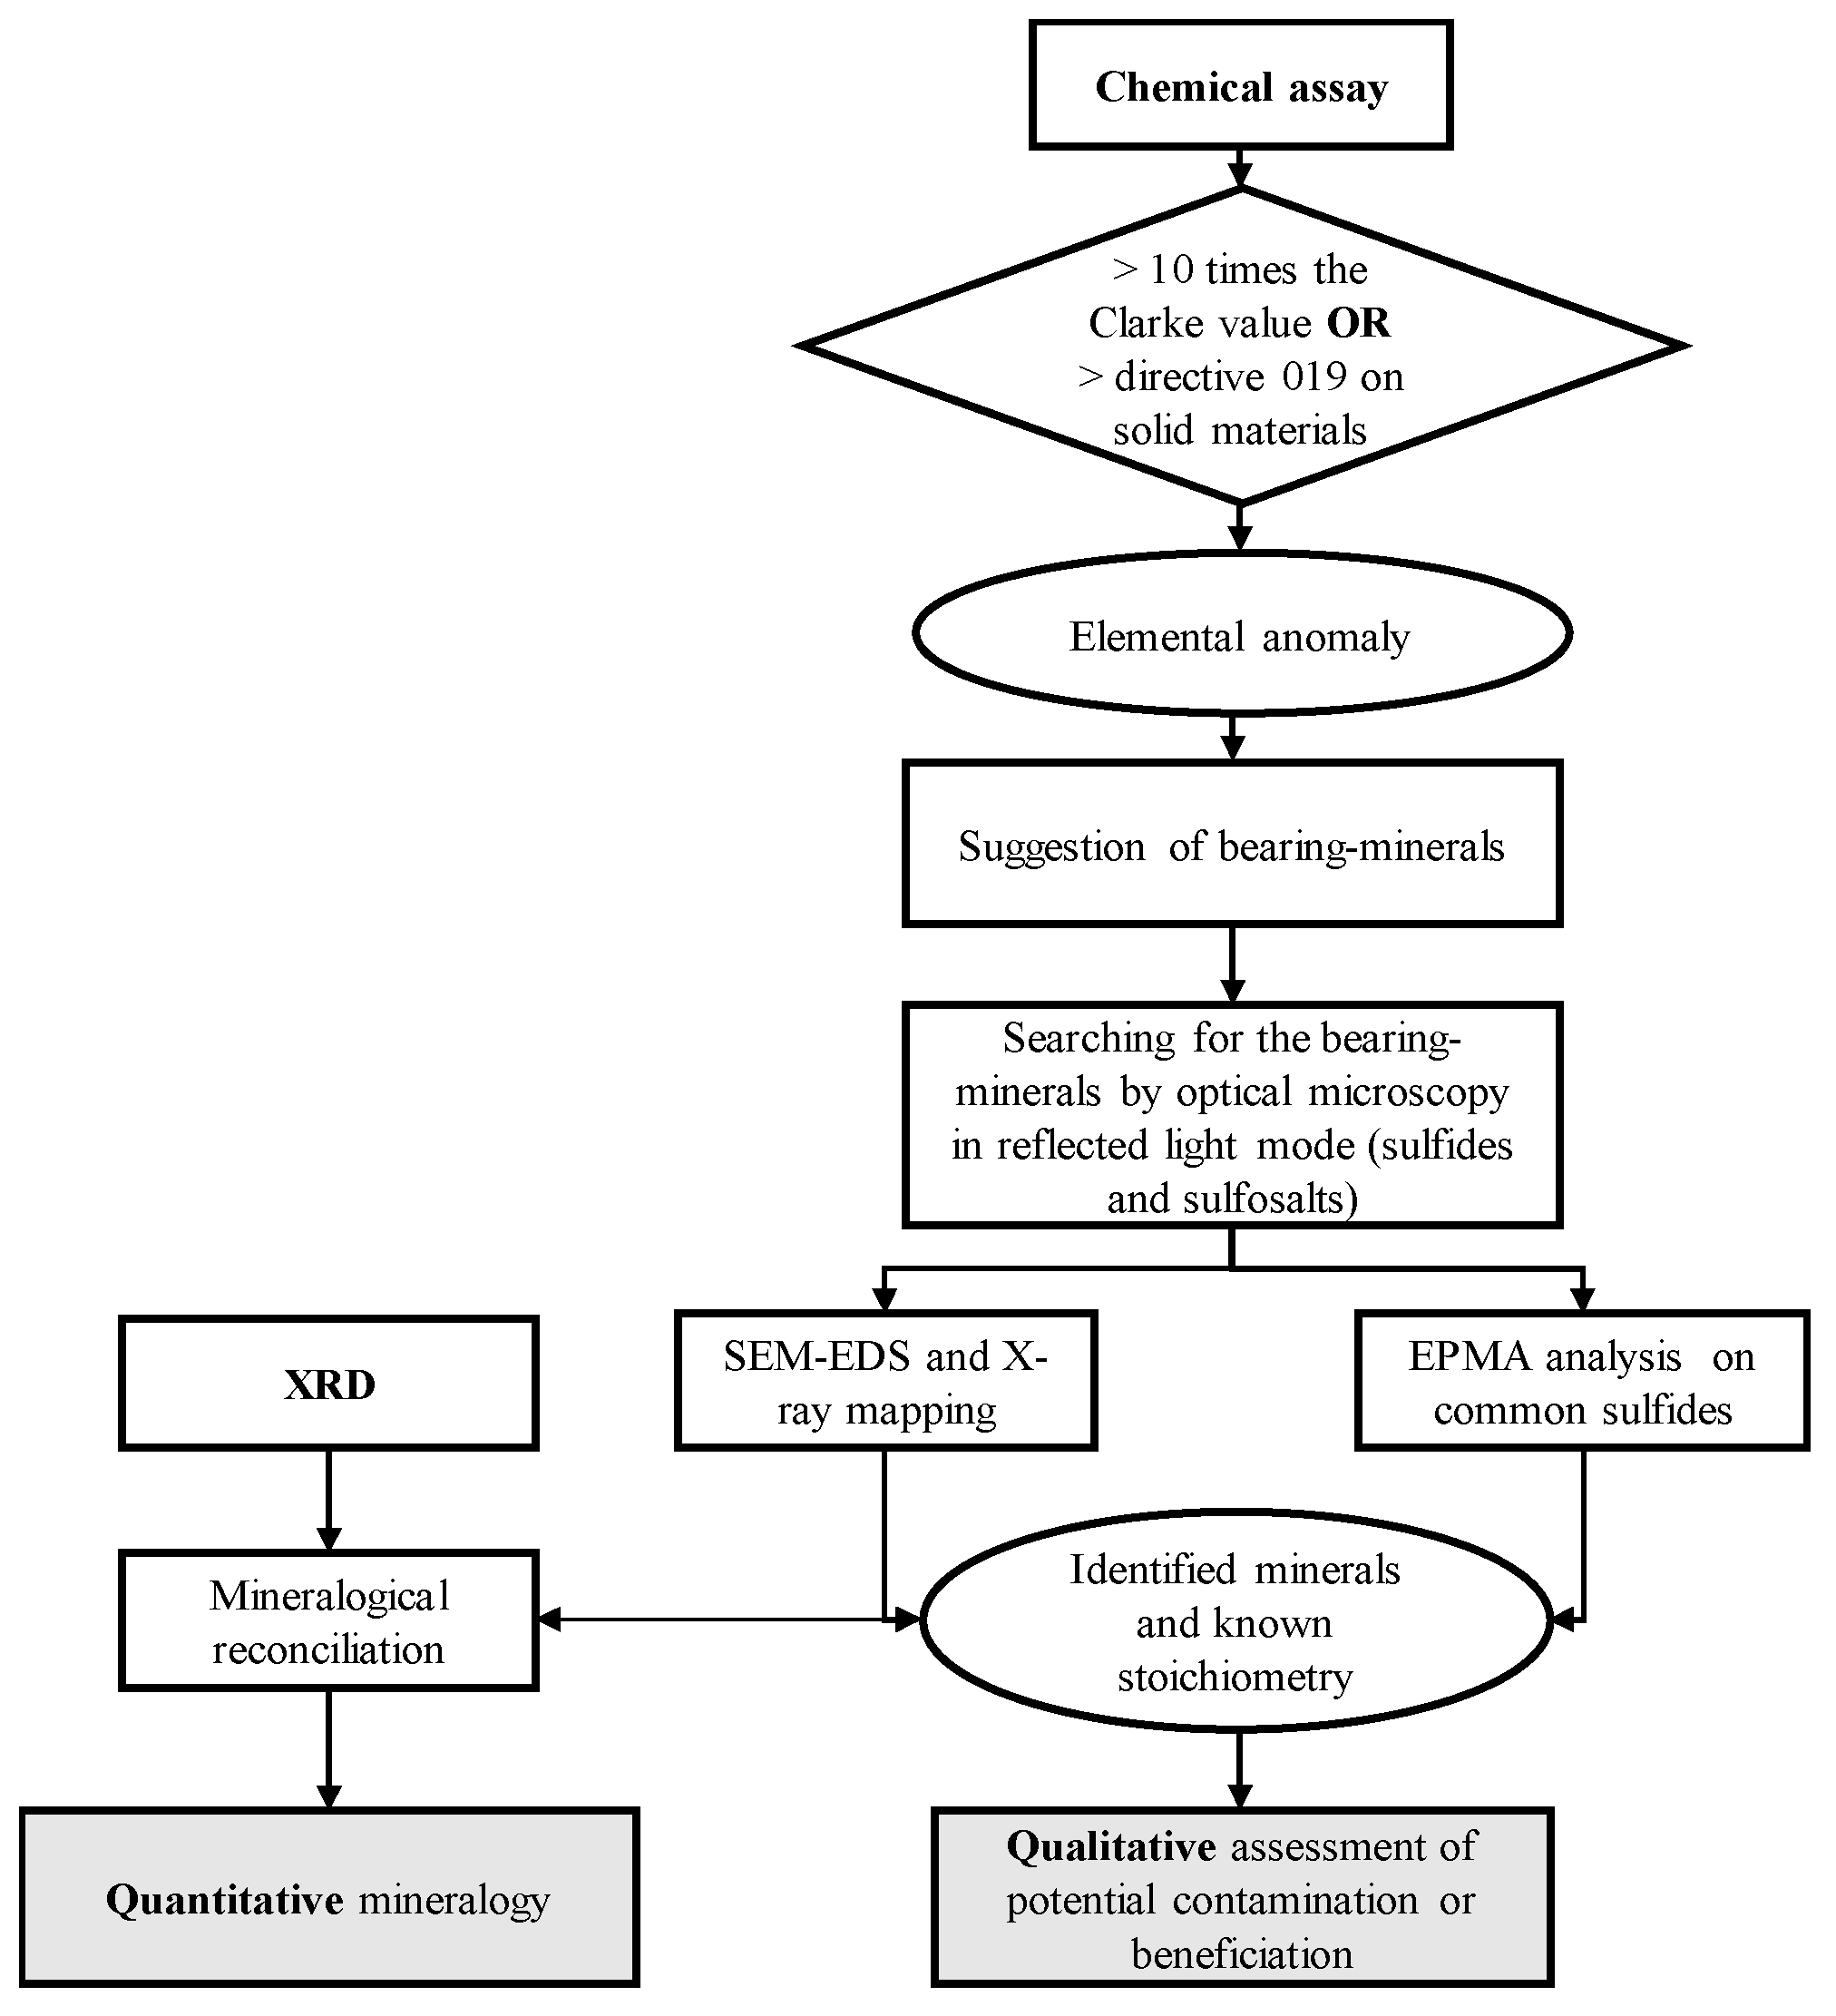
The approach used in this study is mainly based on the chemical assay, obtained with a thorough methodology taking into account the mineralogy of the sample. In this paper, the reliability of the chemical assay is considered. Each element, valuable or contaminant, present in a higher concentration than one or several defined thresholds, are examined for their bearing minerals. The thresholds chosen in this study correspond to the elemental grade either superior at ten times the Clarke value [39,40], or superior at the threshold values determined in Quebec Directive 019, for the regulation of mine solid materials. As most of the elements sought are contained in sulfides or sulfosalts, the identification of these opaque minerals is made by optical microscopy in reflected light mode. Then, the minerals of interest are circled to be further analyzed by electron microscopy, to get a higher magnification or EDS-microanalyses with a detection limit around 5000 ppm. For the detection of suspected trace elements in certain minerals, EPMA analyses were performed with different detection limits according to the counting time of the detectors. Figure 2 presents the logical diagram of the methodology. The greyed-out rectangles represent the results obtained and necessary for the following steps of exploitation and management.
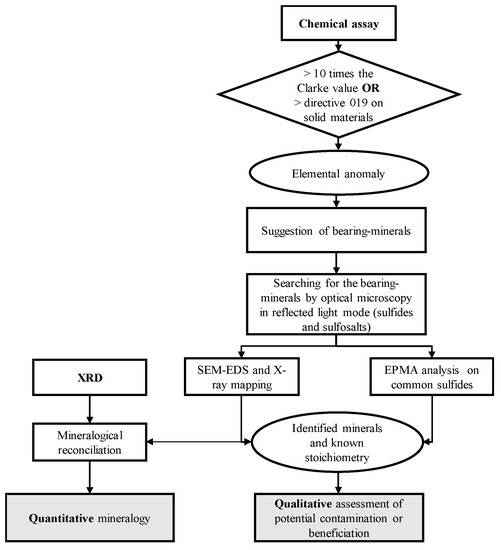
Figure 2.
Logical diagram of the methodology of environmental and processing prediction applied at the stage of exploration. Then, a reconciliation of all the results is made by spreadsheet calculations to obtain a quantitative mineralogical characterization. The quantitative mineralogy was calculated with X-ray powder diffraction (XRD) mineralogy, chemical assay, and stoichiometry of the minerals. This stoichiometry was either theoretical or determined by electron probe micro-analyzer (EPMA).
3. Results and Discussion
3.1. Chemical Characterization
Major, minor, and trace elements contained in the ore samples are presented in Appendix A Table A2 and Table A3. Elements were classified per grade value in the ore. The interest may be either for contamination or for recovery. In this paper, the focus is given on the contaminating elements. All the studied ores contain sulfur in significant amounts (>0.3% S), except for Pinos Altos. Arsenic (As), mercury (Hg) and antimony (Sb) are largely above the defined thresholds in all the ores. The most abundant polluting elements in the ores studied are: As, Hg, Sb, bismuth (Bi), cadmium (Cd), copper (Cu), lead (Pb), selenium (Se) and zinc (Zn). To a lesser extent, barium (Ba), cobalt (Co), chromium (Cr), manganese (Mn), molybdenum (Mo), nickel (Ni), tin (Sn), strontium (Sr), tellurium (Te), and thallium (Tl) are present in the ores. The rare-earth elements were also analyzed, but no significant amount was identified. We chose to exclude these elements from the study. The valuable elements Ag, Au, In, Li, Pd, and Pt were identified. Gold was found in all the ores, even in small amount in Raglan and Pirquitas. Silver was found in most of the ores, except in Canadian Malartic, Goldex, and Kittilä. A significant amount of indium (30 ppm) was found in the Pirquitas sample and a non-negligible amount in LaRonde and Westwood (1 and 0.5 ppm, respectively). It is difficult to state the amount of lithium in the ores. Palladium and platinum were logically found in Raglan, but platinum was also found in small amounts in Meliadine and Pinos Altos.
3.2. Mineralogical Characterization and Identification of the Bearing Minerals
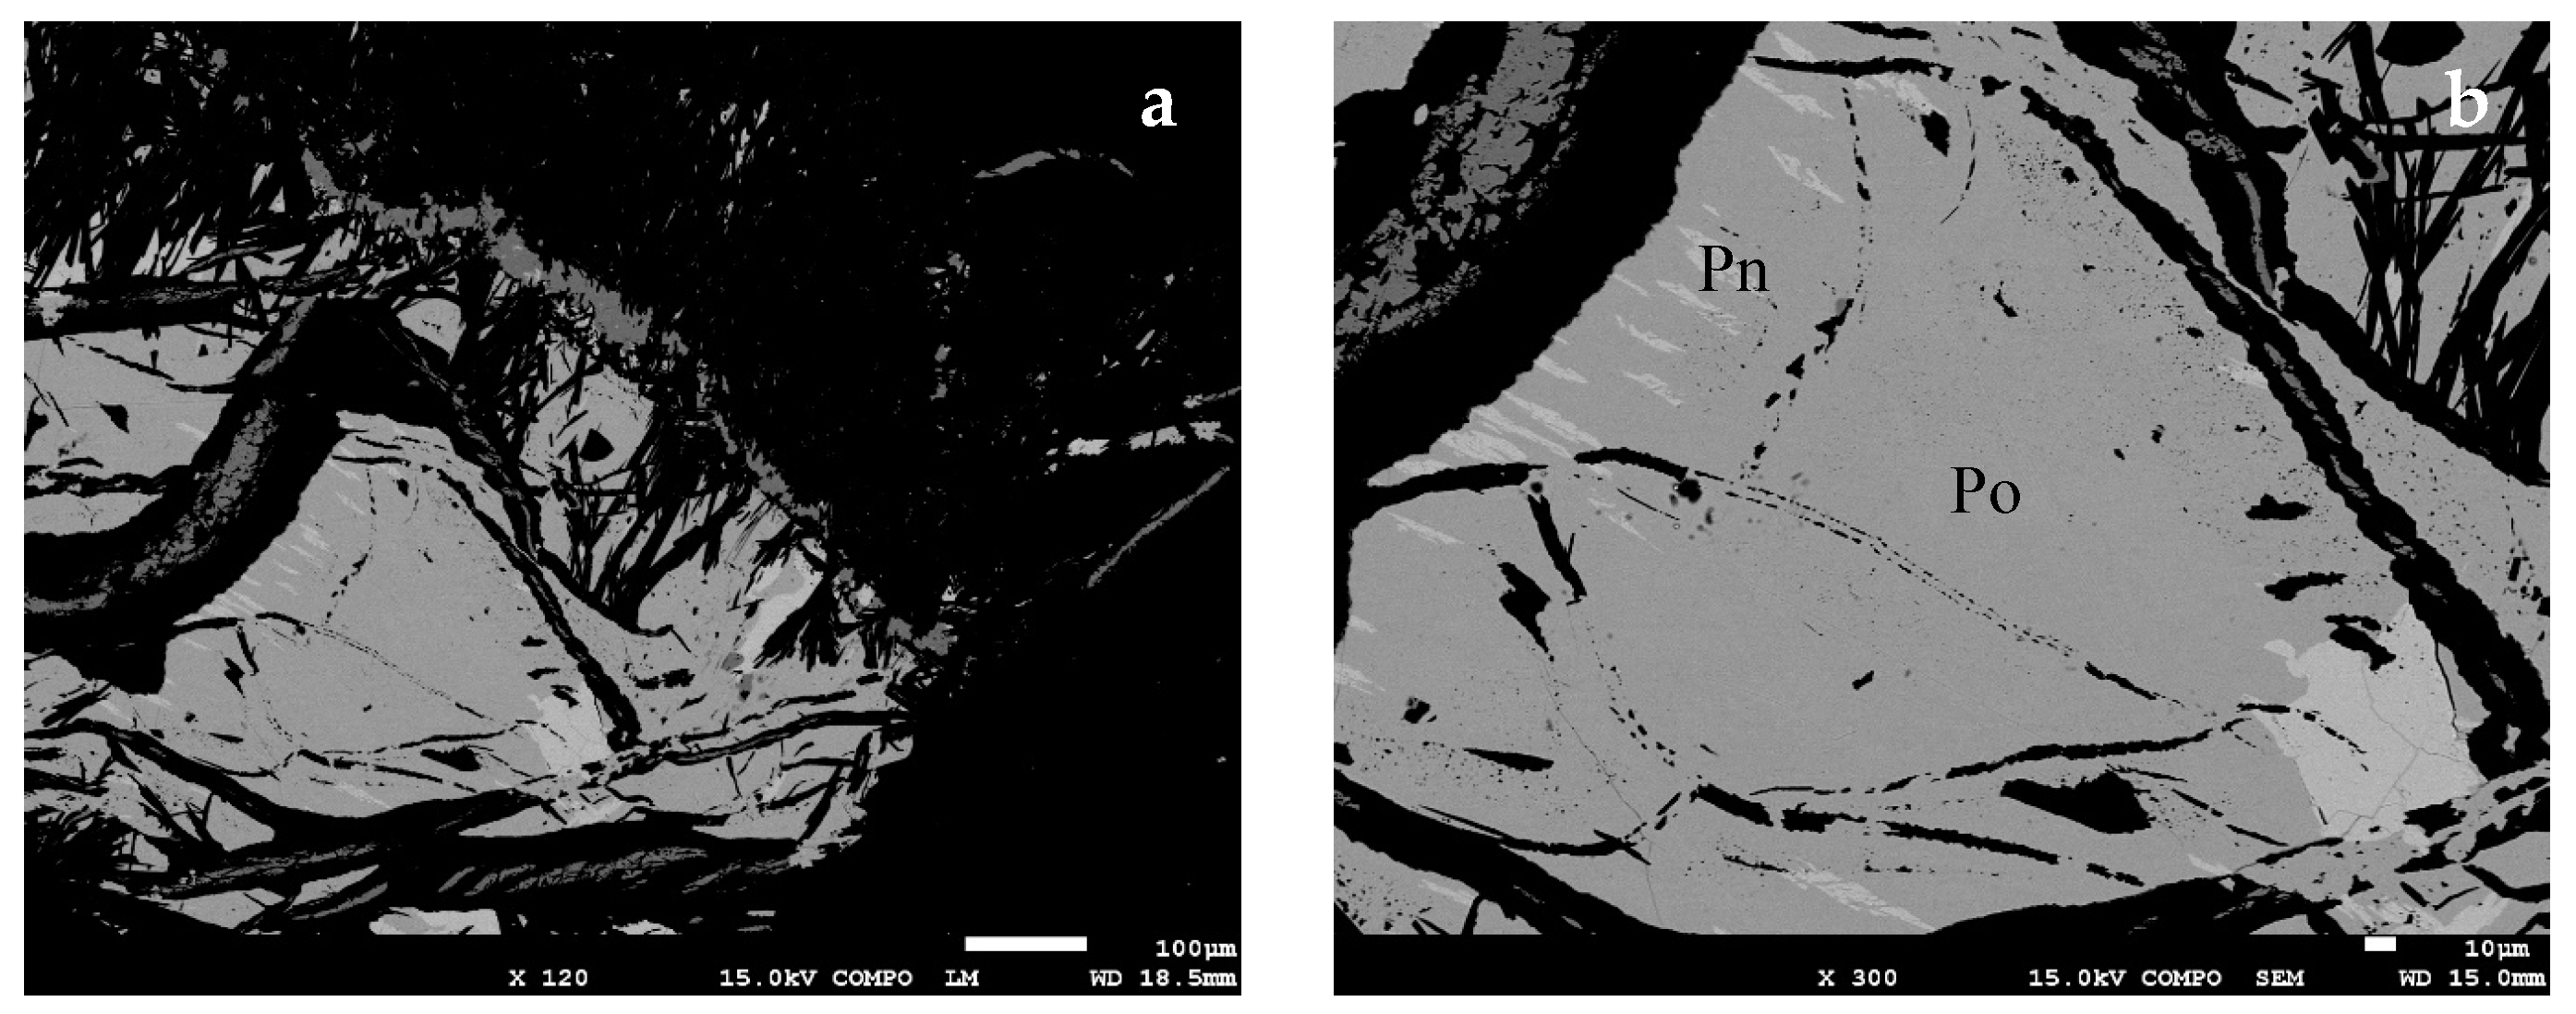
After selecting the potential contaminating elements, the polished sections were observed under the optical microscope. The optical microscope is very useful to identify accessory minerals. As most of the contaminants identified are contained in accessory minerals, the optical microscope was used to detect the bearing minerals of these contaminants. Then, a SEM-EDS analyze allowed us to confirm the approximate stoichiometry of the mineral and/or to recognize the minerals not identifiable only by the physical and optical properties under optical microscopy. As the mineralogical state of a given element determines its geochemical behavior during dissolution and further transport, it is of importance to know the elemental speciation to assess the contaminating potential (or recovery potential). Table 2 presents the bearing minerals of the elements of interest for all the ores, classified in a decreasing order of elemental concentrations. The LaRonde sample presents a complex mix of sulfide minerals, incorporating varied metals (Cu, Zn, Pb, Bi, Sn, Ag, Cd, Au, Tl, In) and metalloids (As, Sb, Te). The Pirquitas sample presents a very complex mix of sulfides and sulfosalts. The sulfosalts of Pirquitas (Aramayoite, Freibergite, Matildite, Owyheeite, Pyrargyrite (see Table 2 for formulae) contain Ag, Cu, Sb, As, Bi, Pb, and Co. The Raglan sample shows lower concentrations (Zn < 88 ppm; As, Se < 20 ppm; Sb, Bi, Te, Ag, Cd < 10 ppm; and Pt, Hg, Au < 1 ppm). Therefore, it was more difficult to identify the bearing minerals and to detect the elements in the minerals in a relatively short time, since the mineral phase detection limit depends on the number of observed grains and the elemental detection limit depends on photon counting time. Only pentlandite, pyrrhotite, chalcopyrite, chromite, and sperrylite were observed and analyzed. The principal assemblage in the sample consists of pyrrhotite and pentlandite, with pentlandite in “flames” (Figure 3).
Table 2.
Observed bearing minerals of the elements of interest for the ten ores. S, 16.2%; Fe, 15.5%. * Products; ** By-products.
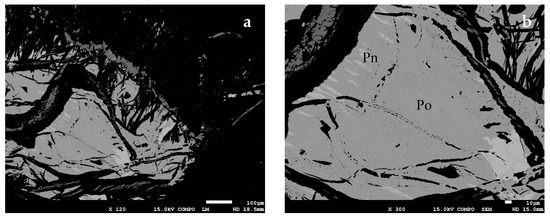
Figure 3.
(a) Flames of pentlandite in a pyrrhotite grain, Raglan sample; (b) Zoom on the flames of pentlandite (Pn) in pyrrhotite (Po).
The gold ore samples mainly display pyrite as sulfide, except for Lapa, where pyrrhotite is dominant. In general, all the gold ores contain Zn in too high concentrations, except for Goldex and Canadian Malartic. The main bearing mineral for Zn is sphalerite. Cd and Tl were also found in sphalerite. Mo is present in several gold ores (from 1.7 to 8 ppm). Sb is present in all samples, except for Pinos Altos, where the geological context is different. The bearing minerals for Sb are often difficult to identify as a unique grain of this mineral is enough to give concentrations above 10 times the Clarke value. Ullmannite (NiSbS), berthierite (FeSb2S4) and tetrahedrite ((Cu,Fe)12Sb4S13) sulfosalts were identified. As and Cu are present most of the time as arsenopyrite and chalcopyrite, but sulfosalts are also present, as gersdorffite (NiAsS) and tetrahedrite. Cubanite (CuFe2S3) was also found in Westwood, As-pyrite in Pinos Altos, Kittilä, and Meliadine, and As-ullmannite in Lapa. Ni was present only in two samples, as argentopentlandite (Ag(Fe,Ni)8S8) in Pinos Altos and pentlandite ((Fe,Ni)9S8) and pyrrhotite (Fe0.93S) in Lapa and Raglan.
Lead tellurides were found in Westwood, however, galena is the main bearing mineral for Pb. Se and Bi are present in almost all the samples, in amount varying from 0.33 ppm to 139 ppm, and from 2.8 ppm to 169 ppm. No bearing minerals were identified for Se. Bi was found as kochkarite (PbBi4Te7) in Westwood; as native bismuth and kawazulite (Bi2(Te,Se,S)3) in LaRonde as matildite and in galena; aramayoite and owyheeite in Pirquitas. Co was found in Lapa as gersdorffite. Finally, Tl and Hg were found in very low amount (from 0.02 to 1.4 ppm) in Pinos Altos, Goldex, Kittilä, and Westwood. These two elements are very toxic for ecosystems. Gold is present as free grains, electrum and inclusions in arsenopyrite. Structural gold was not analyzed in the present study, as the focus is on contaminating elements. The Pinos Altos sample is different from the others as its sulfur content is below 0.3 wt. % and the sample contains oxides and sulfates.
As a general remark, it was difficult to detect the bearing minerals of elements present in too small concentrations, except when the element is coupled with another major element present in higher concentrations (e.g., Cd in sphalerite as Zn is sought and Cd is suspected to be included in sphalerite). For some major elements not identified and suspected in minor minerals, longer SEM work would be necessary with the applications of the X-ray mapping on polished sections.
EPMA Results
EPMA results are presented in Appendix A Table A4. The major sulfides known for bearing the elements of interest only were analyzed by EPMA, as this mineralogical technique is less available and more time-consuming than others are. The methodology has to stay simple and affordable. However, EPMA is very useful to find the exact concentration of trace elements in a known mineral and the exact stoichiometry of a rarer mineral (like a sulfosalt). In this study, the major sulfides (cited later) are the main bearing minerals of the main contaminants (As, Cd, Co, Cu, Mn, Zn) except for sulfosalts and for certain valuable elements (Ag, In). So, grains of pyrite, pyrrhotite, arsenopyrite, chalcopyrite, sphalerite, galena, and pentlandite were analyzed. The pyrite grains were arseniferous in the Pirquitas and Kittilä samples. The pyrite of Pirquitas also contains Ag and Tl. The pyrrhotite grains were nickeliferous in the Raglan and Meliadine samples. No cobalt was found in the pyrrhotite grains. For arsenopyrite, according to the percentage of arsenic, it is possible to estimate the amount of gold possibly present in the grains [41]. According to the atomic percentage of arsenic in Kittilä (30.9) and Meliadine (31.1), no more than 4000 ppm in weight of gold could be found in these arsenopyrite grains. The detection limit was of 1300 ppm and no gold was detected. The chalcopyrite grains of Meliadine contain Cd, but no other trace element in chalcopyrite were found in any sample. All the grains of sphalerite analyzed were iron sphalerite and contain Cd: 1.16 ± 0.09 wt. % in the LaRonde sample, 0.37 ± 0.21 wt. % in the Pirquitas sample, and 1.00 ± 0.12 wt. % in the Westwood sample. Tl was also found in sphalerite in no negligible amount: 0.1 ± 0.09 wt. % in LaRonde and 0.33 ± 0.22 wt. % in Pirquitas. The LaRonde and Pirquitas grains of sphalerite contain In, 0.45 ± 0.10 wt. % and 0.25 ± 0.18 wt. % respectively. Galena was only detected in the Meliadine sample. Galena exhibits a composition close to the theoretical stoichiometry, but contains Fe (1.37 ± 0.20 wt. %) and Ag (0.09 ± 0.04 wt. %). These elements have already been found in traces in galena [42,43]. Finally, the pentlandite of Raglan contains Co, 0.75 ± 0.08 wt. %.
3.3. Chemical and Mineralogical Data Reconciliation
The quantification of the major gangue minerals and of the bearing minerals of major and minor elements was determined thanks to the combination of XRD analysis and data reconciliation with the chemical analyses [44,45]. The trace elements are not considered in the reconciliation, as their amount in not significant enough to be quantified. Thus, the bearing minerals of precious metals are not quantified, as well as the bearing minerals of sparse elements. Twenty-six elements were used for the data reconciliation: Al, As, Ba, Bi, C, Ca, Cd, Co, Cr, Cu, Fe, K, Mg, Mn, Mo, Na, Ni, Pb, S, Sb, Si, Ti, Zn, and Sn. Se and Sr were not used as their bearing minerals and were not identified, likely because of their presence in very few grains. The EPMA results were used for a better quantification of the sulfides. The results are presented in Table 3. The main concern with the reconciliation between the chemical and mineralogical data was about the Al content. For example, for the Raglan sample, the chemistry calculated by the mineralogical composition and the whole rock result are not corresponding. Moreover, senaite and chromite were not taken into consideration for the Raglan sample. Another issue is with the pyrite and pyrrhotite quantification, as well as the hematite and magnetite quantification, where linear systems of N equations with N unknowns should be solved, and several solutions can be found. The content of pyrite, pyrrhotite, hematite, or even magnetite can then be misestimated. These issues can be resolved by analyzing the polished sections under optical microscopy [46].
Table 3.
Quantitative mineralogical composition determined by chemical/mineralogical reconciliation.
3.4. Geochemical Results
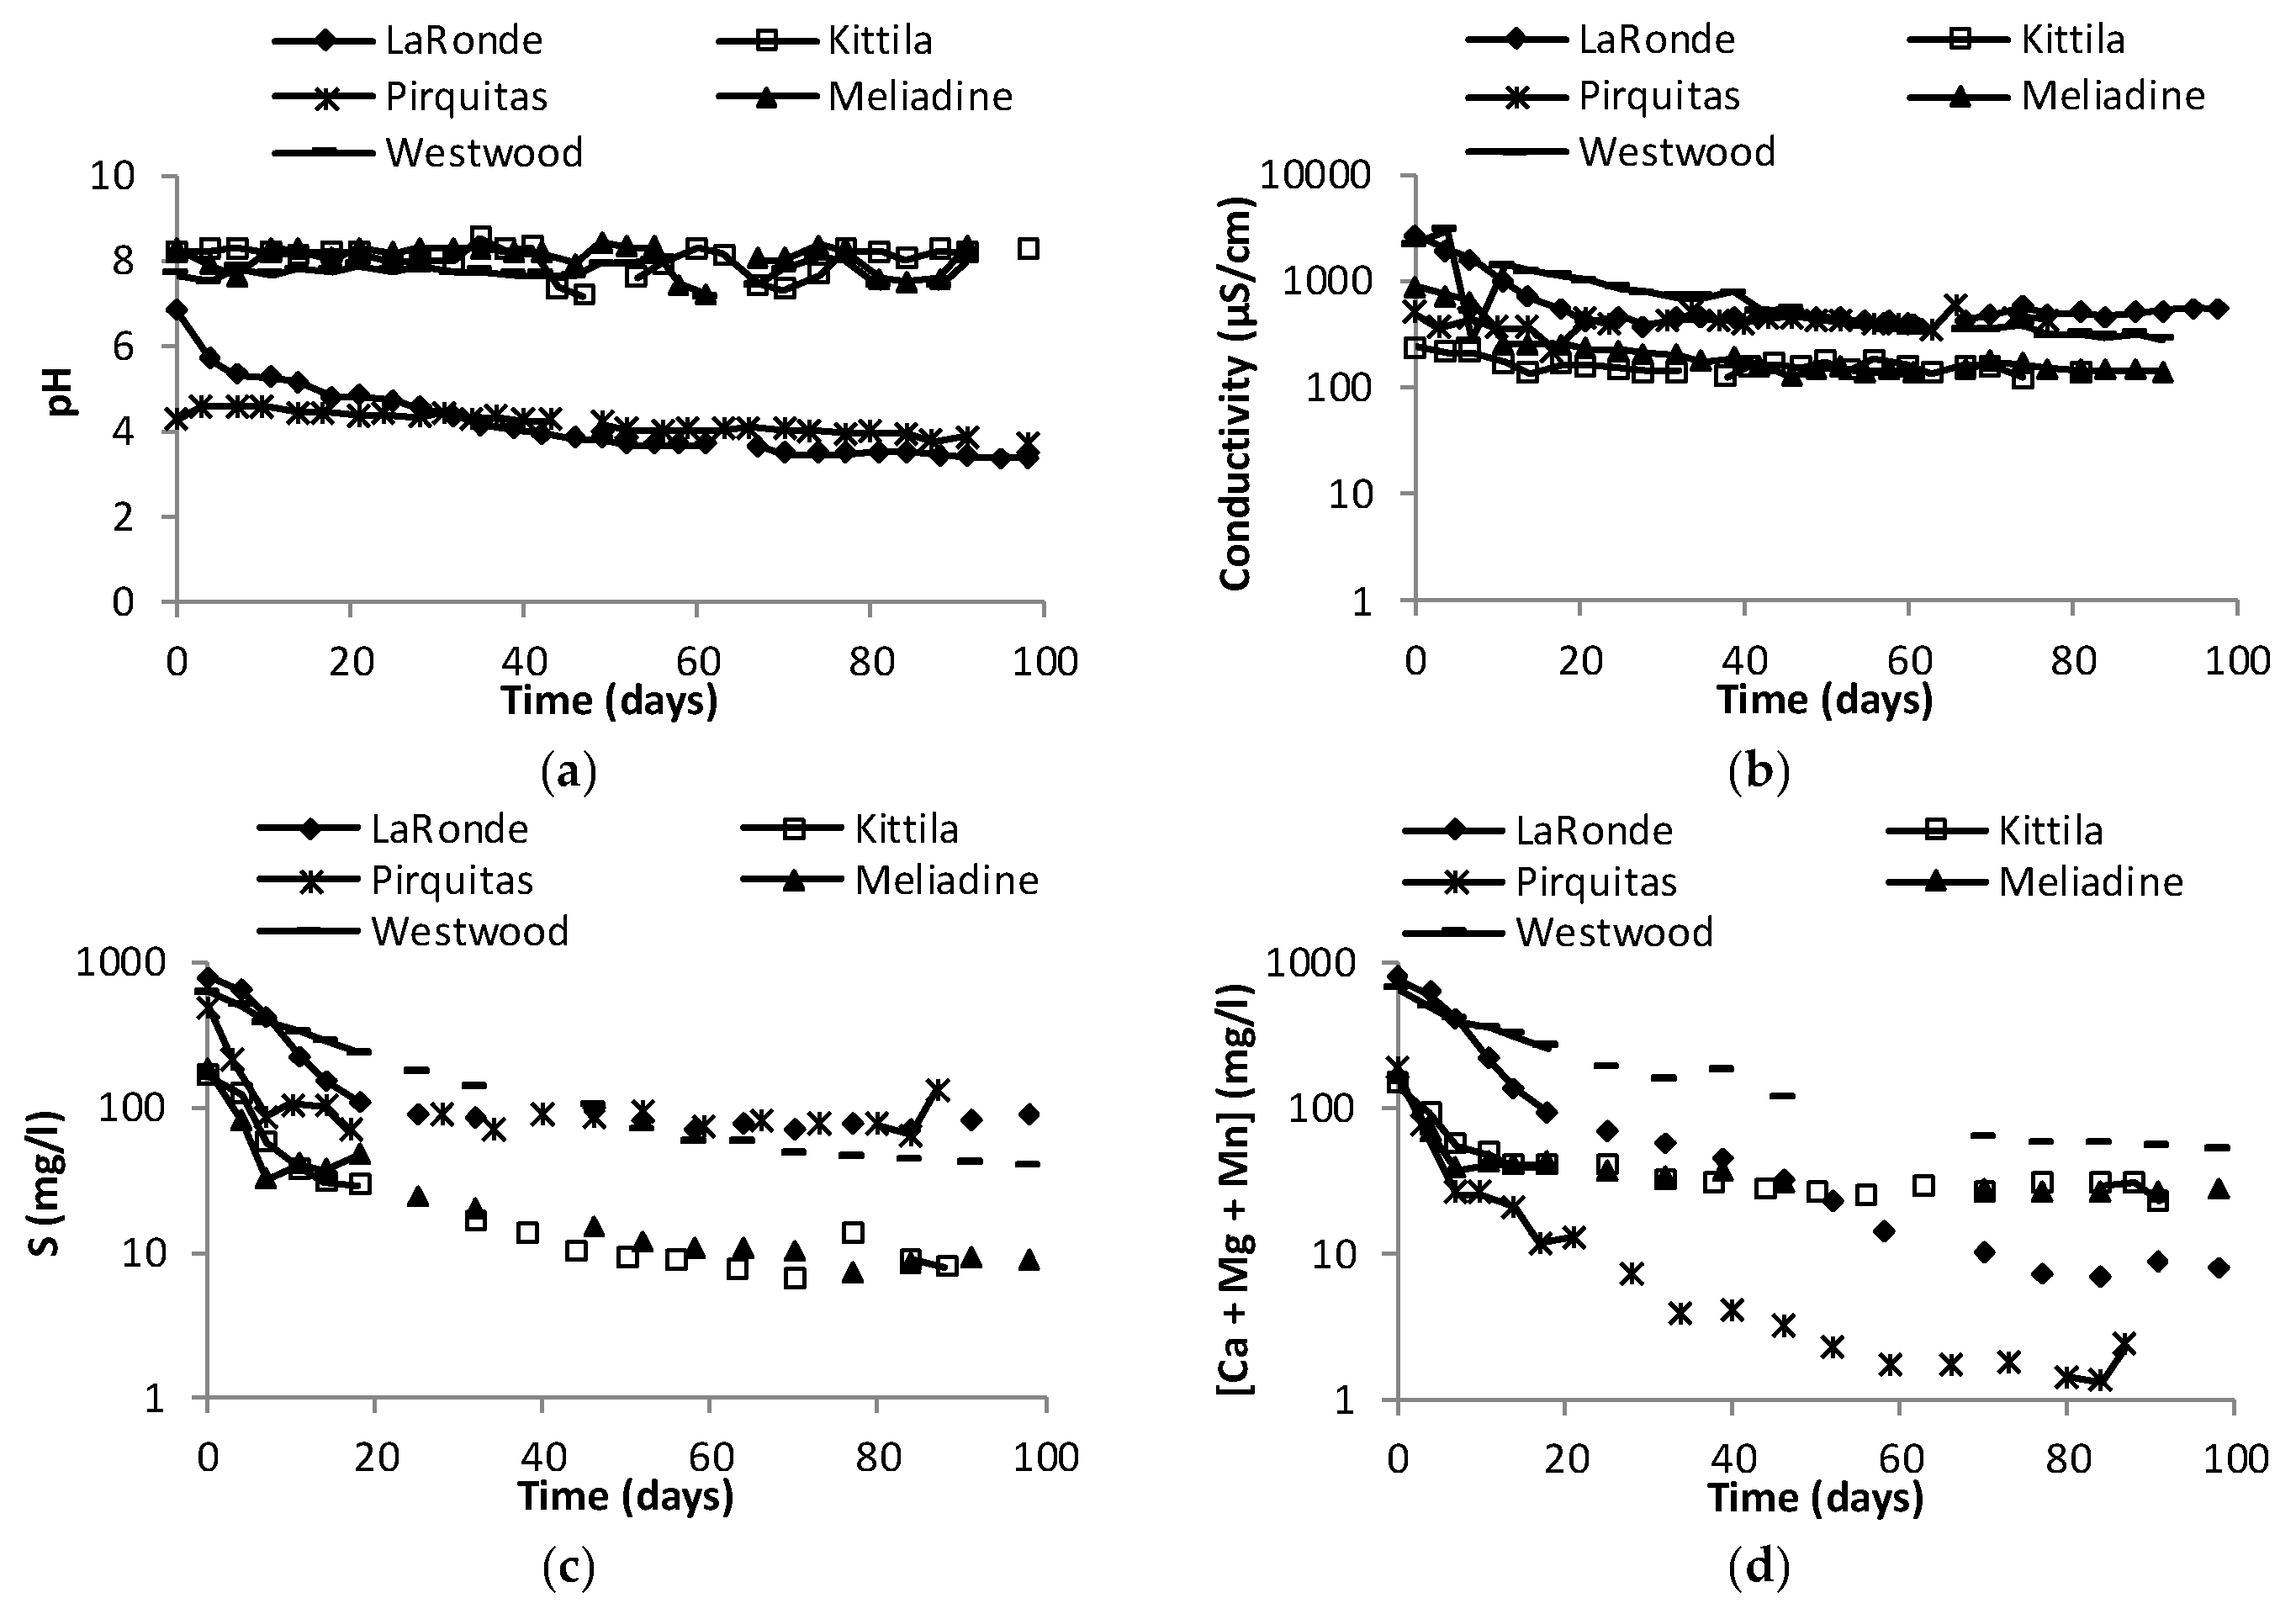
The pH and electrical conductivity results from the modified weathering cells are shown in Figure 4a,b, respectively. The pH is neutral and relatively stable for Kittilä, Meliadine, and Westwood, varying from 7.2 to 8.5, 7.2 to 8.4, and 7.1 to 8.1, respectively. The electrical conductivity of Kittilä and Meliadine is quite low at an average of 230 µS/cm and 240 µS/cm, respectively, whereas Westwood presents higher electrical conductivity values with an average of 750 µS/cm and median of 470 µS/cm. The pH of the LaRonde leachates has been found to decrease from 6.9 in the beginning, to 3.4 after a hundred days of testing, with an average of 4.2. The electrical conductivity (median of 490 µS/cm) decreases from 2770 µS/cm to 400 µS/cm after sixty days of testing and increases up to 600 µS/cm after one hundred days. The pH of the Pirquitas sample is acidic and relatively stable, varying from 3.7 to 4.6, with a slight drop all along the test. Its electrical conductivity is very high for the first three flushes (2250, 970, and 540 µS/cm) and then stabilizes (median of 440 µS/cm). This behavior is due to the dissolution of initial oxidation products and probably to the sulfosalts at the beginning of leaching. Sulfur concentrations are in the same order of magnitude for Kittilä and Meliadine (average of 30 mg/L) and for Pirquitas, LaRonde, and Westwood it averages 110 mg/L, and 190 mg/L, respectively. Moreover, Westwood presents the highest [Ca + Mg + Mn] concentrations, averaging at 230 mg/L, which is representative of the neutralization potential [44], and mostly due to Ca concentrations. Ca is present in calcite in the Westwood sample. Although Kittilä contains the highest Ca concentration in solid, the leachates of the sample do not contain the highest concentrations in Ca (average of 25 mg/L) as Ca is present as dolomite and ankerite, which are dissolved more slowly than calcite. The neutralizing element concentrations [Ca + Mg + Mn] decreases quickly until 10 mg/L for LaRonde. Meliadine presents concentrations decreasing from 170 mg/L to 30 mg/Lwith Ca and Mg as the major contributing elements. Calcite, siderite and ankerite are present in the Meliadine sample. Pirquitas has the highest Mn concentration and [Ca + Mg + Mn] concentration decreases from 190 to 2 mg/L.
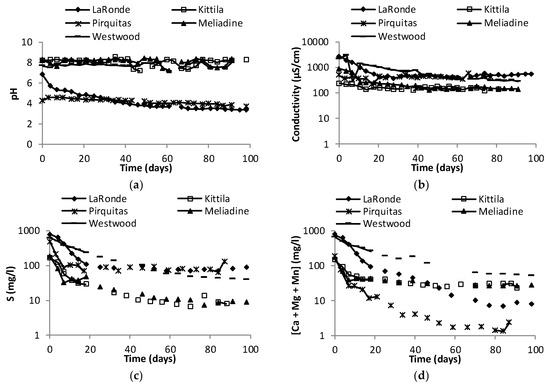
Figure 4.
Geochemical results from the weathering cells: (a) pH and (b) electrical conductivity; (c,d) concentrations (mg/L) of metals associated with sulfide oxidation in the ore samples: (c) S, (d) Ca + Mg + Mn.
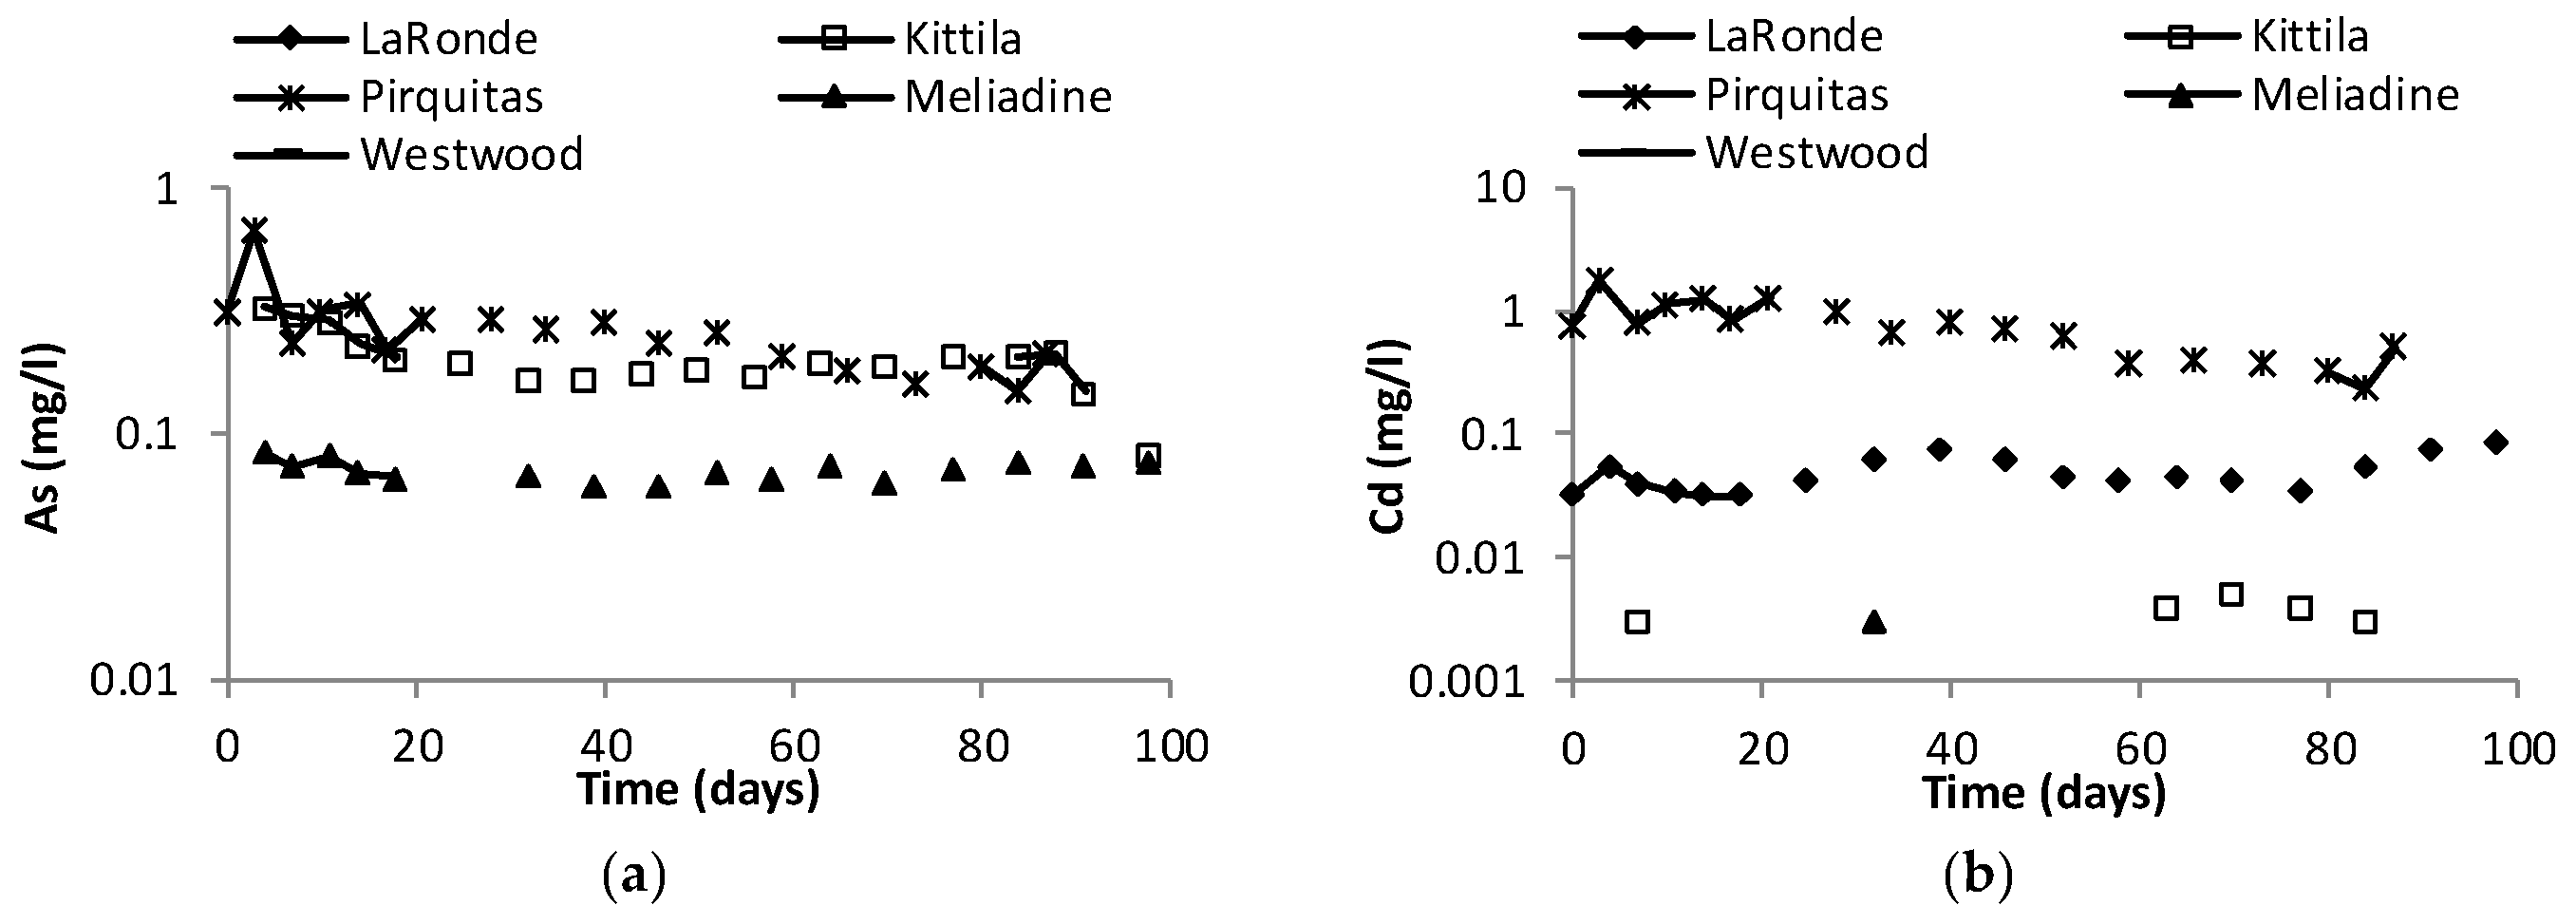
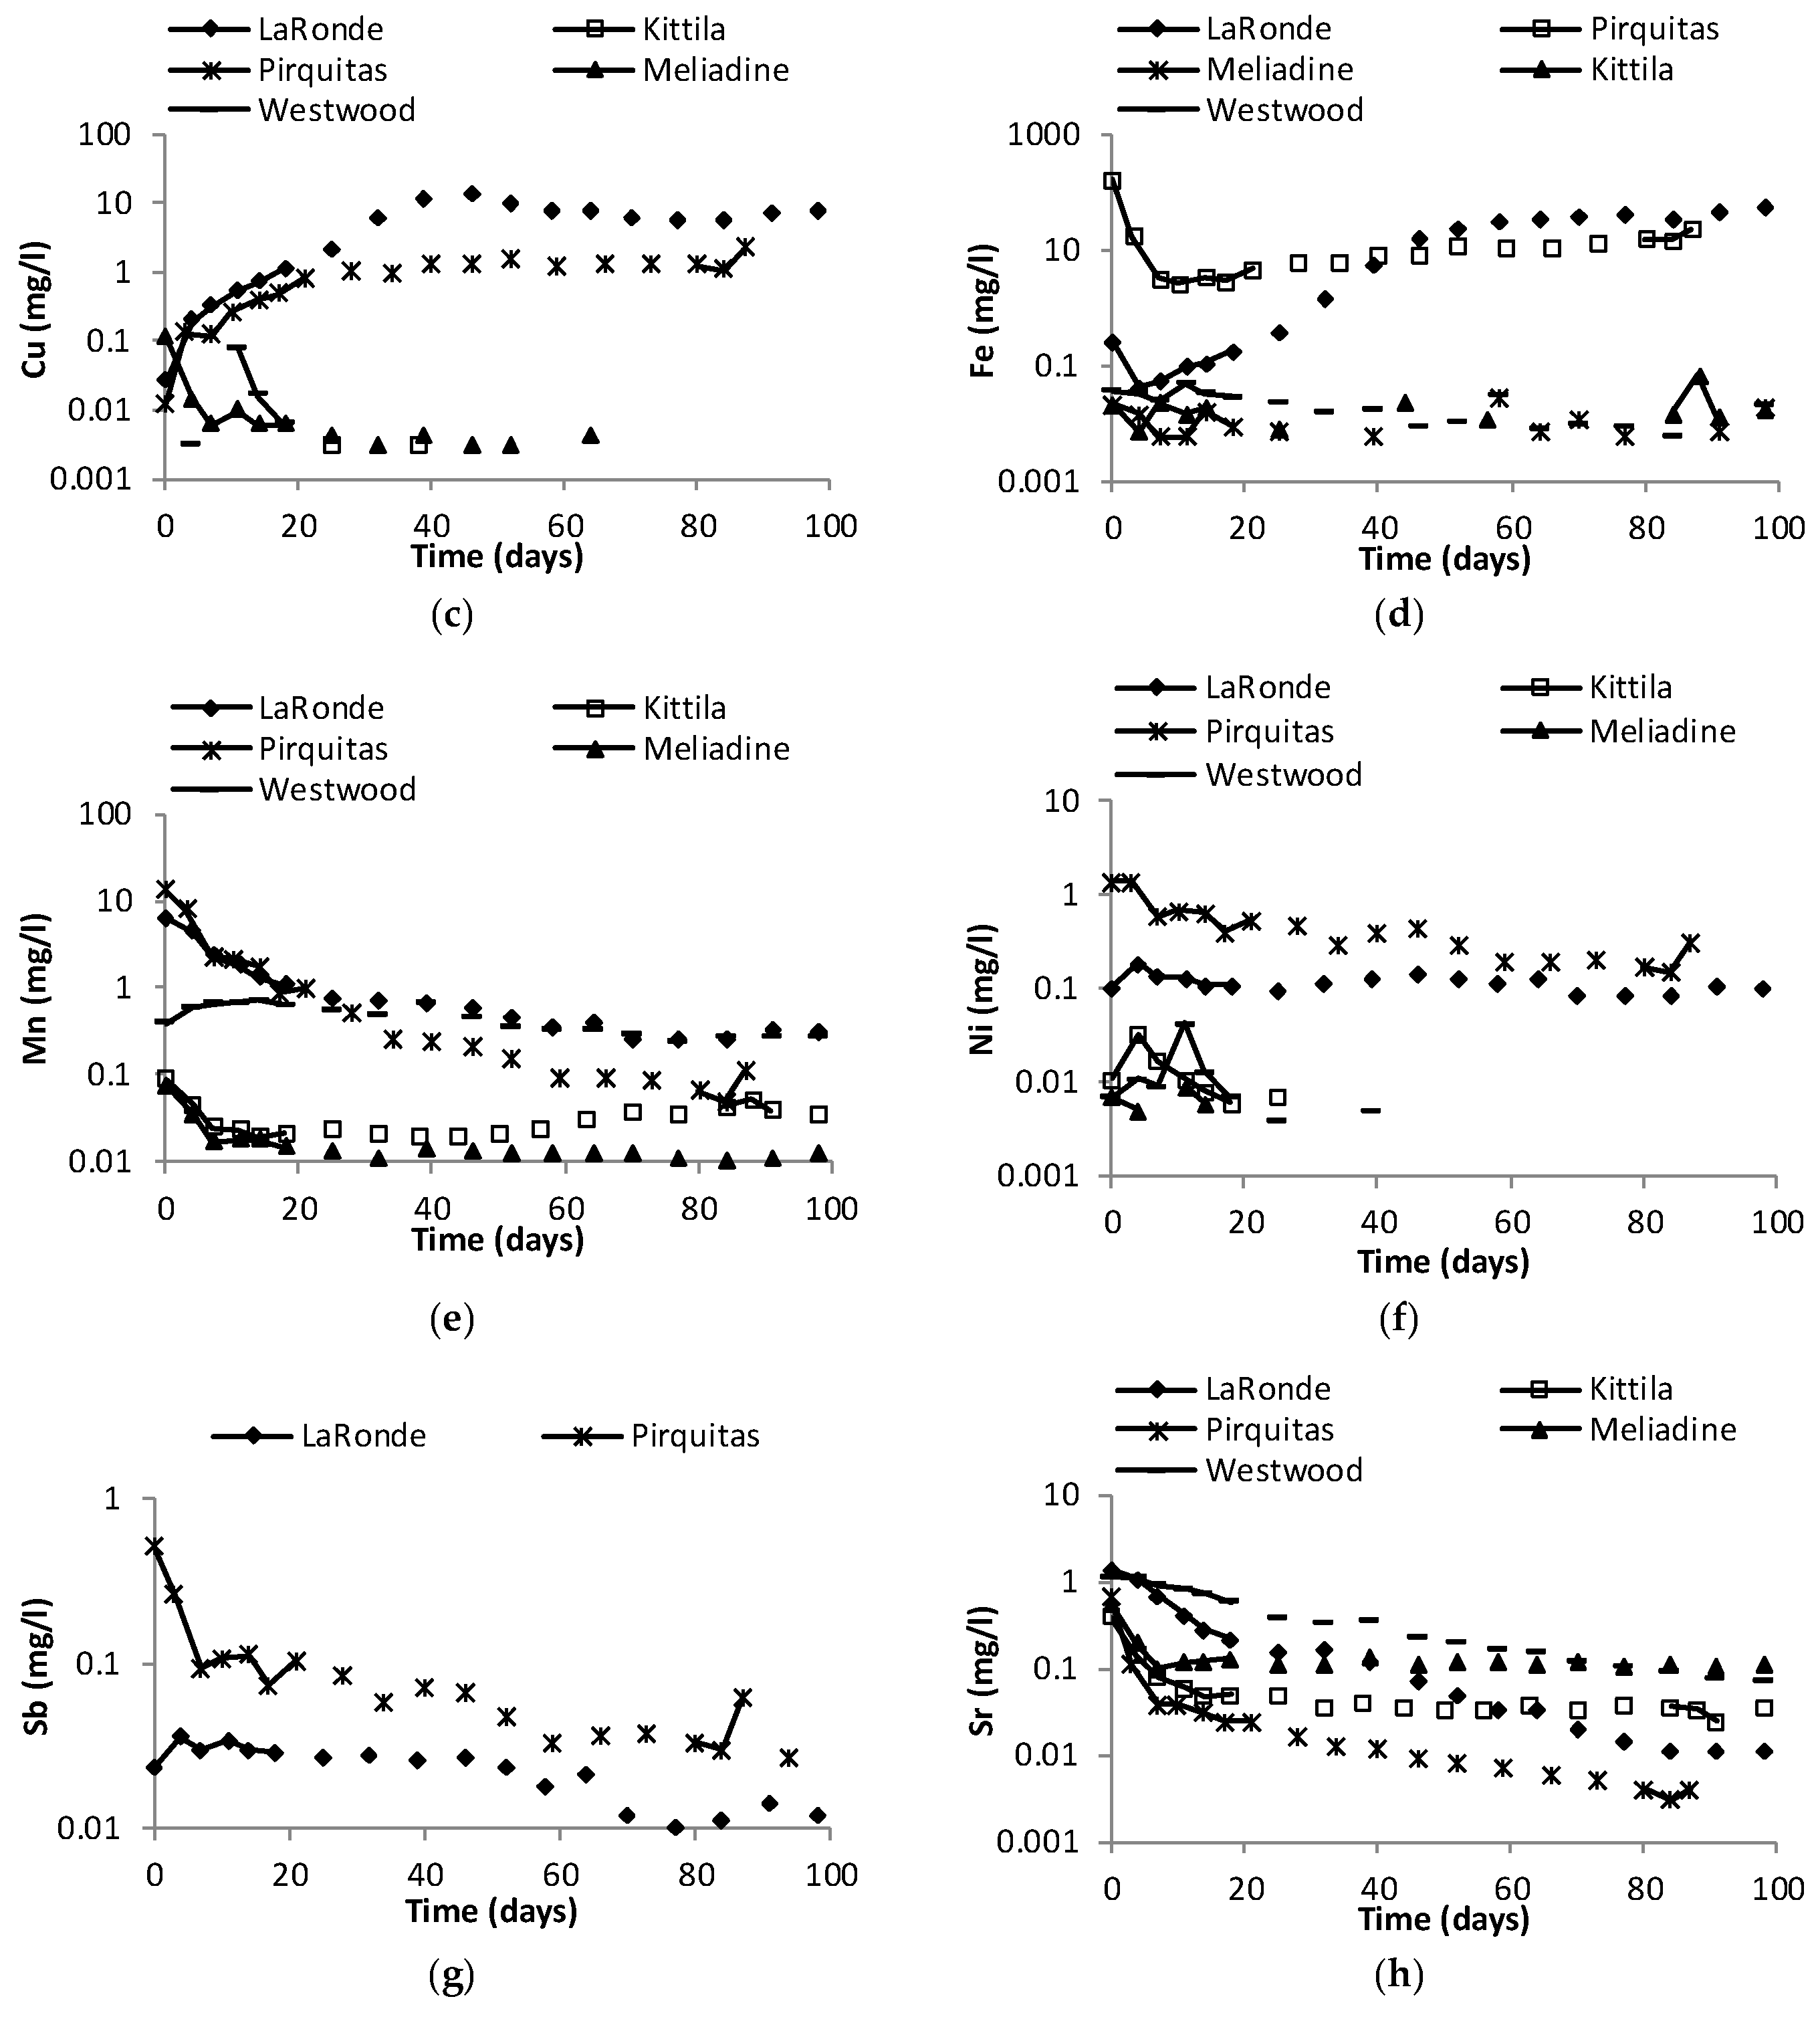
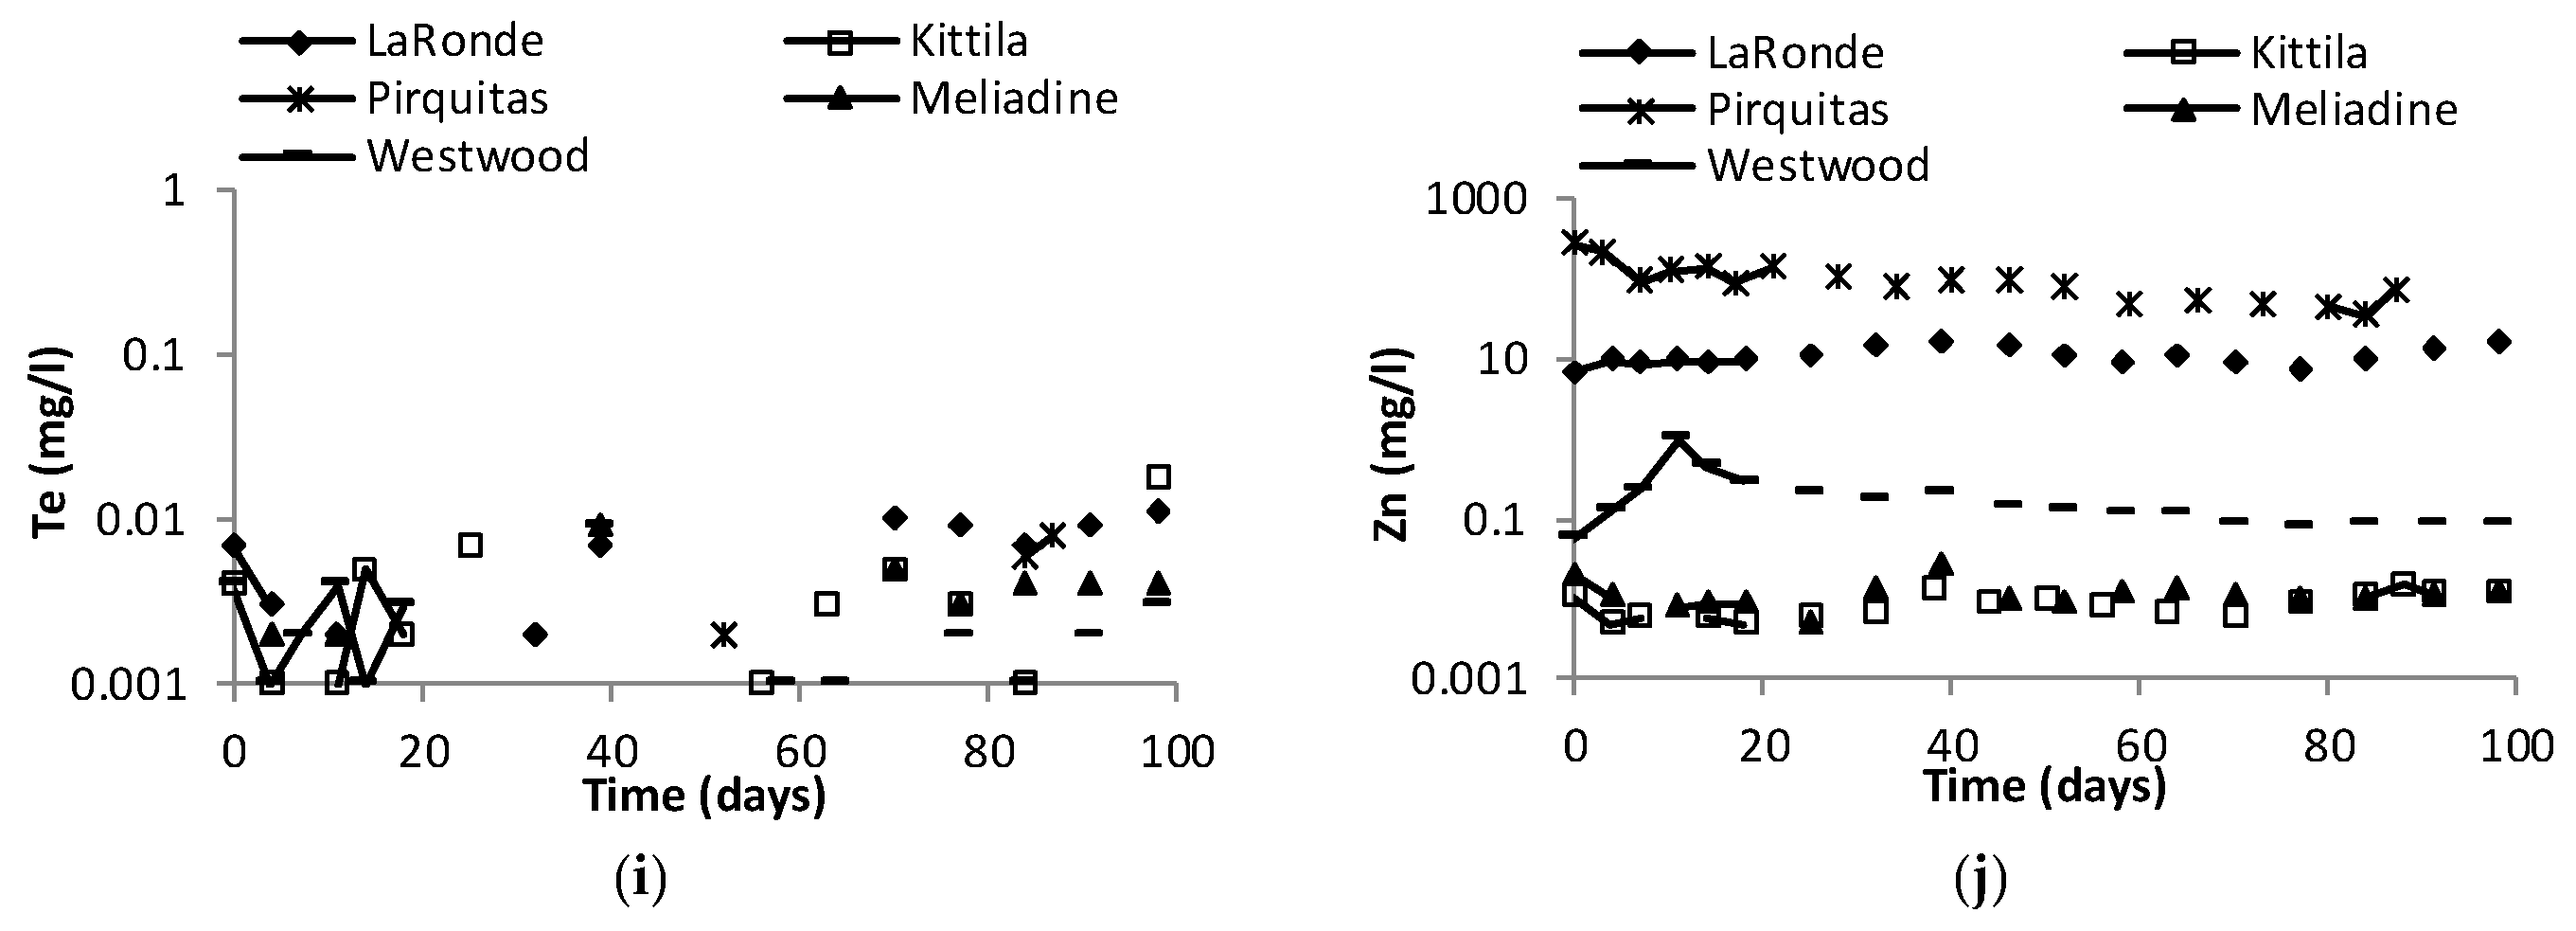
The concentrations of elements associated with metal sulfide oxidation (sulfates and metals) are shown in Figure 5. Despite their content in the solid samples, no Bi concentrations were found in the leachates. Pb was found in the first flush for Pirquitas, and in the leachates of LaRonde (average of 0.6 mg/L). Mo was found in the leachates of Meliadine. Hg, Sn and Tl were not analyzed. Table 4 presents the average and median leachate concentrations in mg/l and the initial content in the solid samples. Although all the ores contain Sb in significant amount, it was only found in the leachates with an acidic pH (LaRonde and Pirquitas).
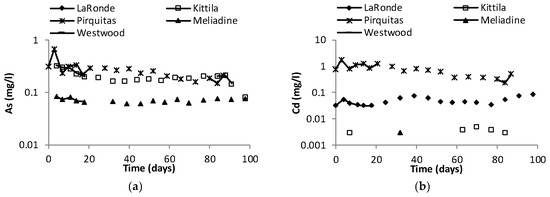
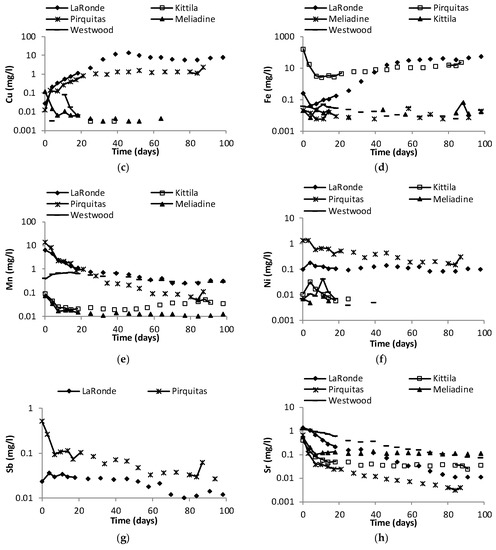
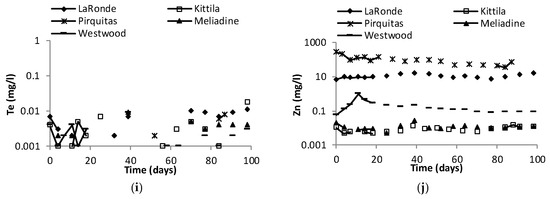
Figure 5.
Geochemical results from the weathering cells: concentrations (mg/L) of metals associated with sulfide oxidation in the ore samples; (a) As, (b) Cd, (c) Cu, (d) Fe, (e) Mn, (f) Ni, (g) Sb, (h) Sr, (i) Te, and (j) Zn.
Table 4.
Initial content and metal concentrations in the leachates of geochemical testing in the Kittilä, Meliadine, Westwood, LaRonde and Pirquitas ore samples.
For the other elements, the concentrations are generally higher in the first leachates, except for elements such as Cd, Cu, Fe, or Te. Cd is relatively stable all along the test for LaRonde, Pirquitas (average of 0.05 mg/L, 0.7 mg/L, respectively). These concentrations are above the resurgence norm of the directive 019 of Quebec (0.0021 mg/L). In the LaRonde leachates, Cu and Fe follow the same behavior, which could signalize galvanic interactions between the sulfides [47] and a preferential oxidation of chalcopyrite. Although the Sb and As content are lower in Pirquitas and Kittilä than in Meliadine, their concentrations in the leachates are higher (average of 0.26 mg/L and 0.20 mg/L for Pirquitas and Kittilä, respectively, and average of 0.07 mg/L for Meliadine) than in the leachates of Meliadine, because As and Sb are present as sulfosalts in Pirquitas and Kittilä.
The mineralogy of the various ores in this study has influenced the water quality results. Metals have been leached from both acid generating and buffering reactions. However, these metals would stay under soluble form depending on the solubility product on the compound and of the sorption mechanisms at different pH. Table 5 presents the yield of the release of elements that are possible to follow. Therefore, the release of Zn, Cd, Cu, Pb, Co, As, and Sb was assessed by calculating the yield according to the following equation:
where η = yield in percentage, El100: cumulative values of the element E after a hundred days of testing, Ei: initial amount of the element E in the weathering cell.
Table 5.
Geochemical parameters of the LaRonde, Kittilä, Pirquitas, Meliadine, and Westwood samples, and pure samples of sphalerite, chalcopyrite, galena, and arsenopyrite.
The yield was calculated for the elements in the five ores and in the weathering cells of pure materials [12], to compare the reactivity of these minerals according to their associations and their occurrence in a material. Similarly, the reactivity rates of the same elements were calculated on the stabilized portion of the geochemical tests, which means from forty to one hundred days, normalized by the initial amount in the sample (Table 5). As expected, the release of elements is strongly correlated with the pH of the solution. For instance, the yield of sphalerite for Zn and Cd is twenty times higher in LaRonde and Pirquitas than in the pure sphalerite sample. That can be explained in part with the pH as it is of 6.3 for the leachates of pure sphalerite. However, arsenopyrite has a different behavior in ores than it does in pure samples. Despite the content in the initial solid, the LaRonde sample does not release arsenic. This may be due to the liberation parameters of the arsenopyrite grains. In contrast, Kittilä (As-pyrite and gersdorffite) and Pirquitas (As-pyrite and freibergite) release arsenic since the bearing minerals differ, and the grains are accessible for the reaction. The yields for chalcopyrite dissolution are the same for the pure mineral geochemical test than in the LaRonde and Pirquitas tests.
The reactivity rate is ten times higher in LaRonde and Pirquitas than in the pure chalcopyrite sample. That may be due to galvanic interactions occurring in the ore samples [47]. For sphalerite, it is less evident as the pH plays a great role in the reaction mechanisms.
3.5. Acid Mine Drainage Estimation
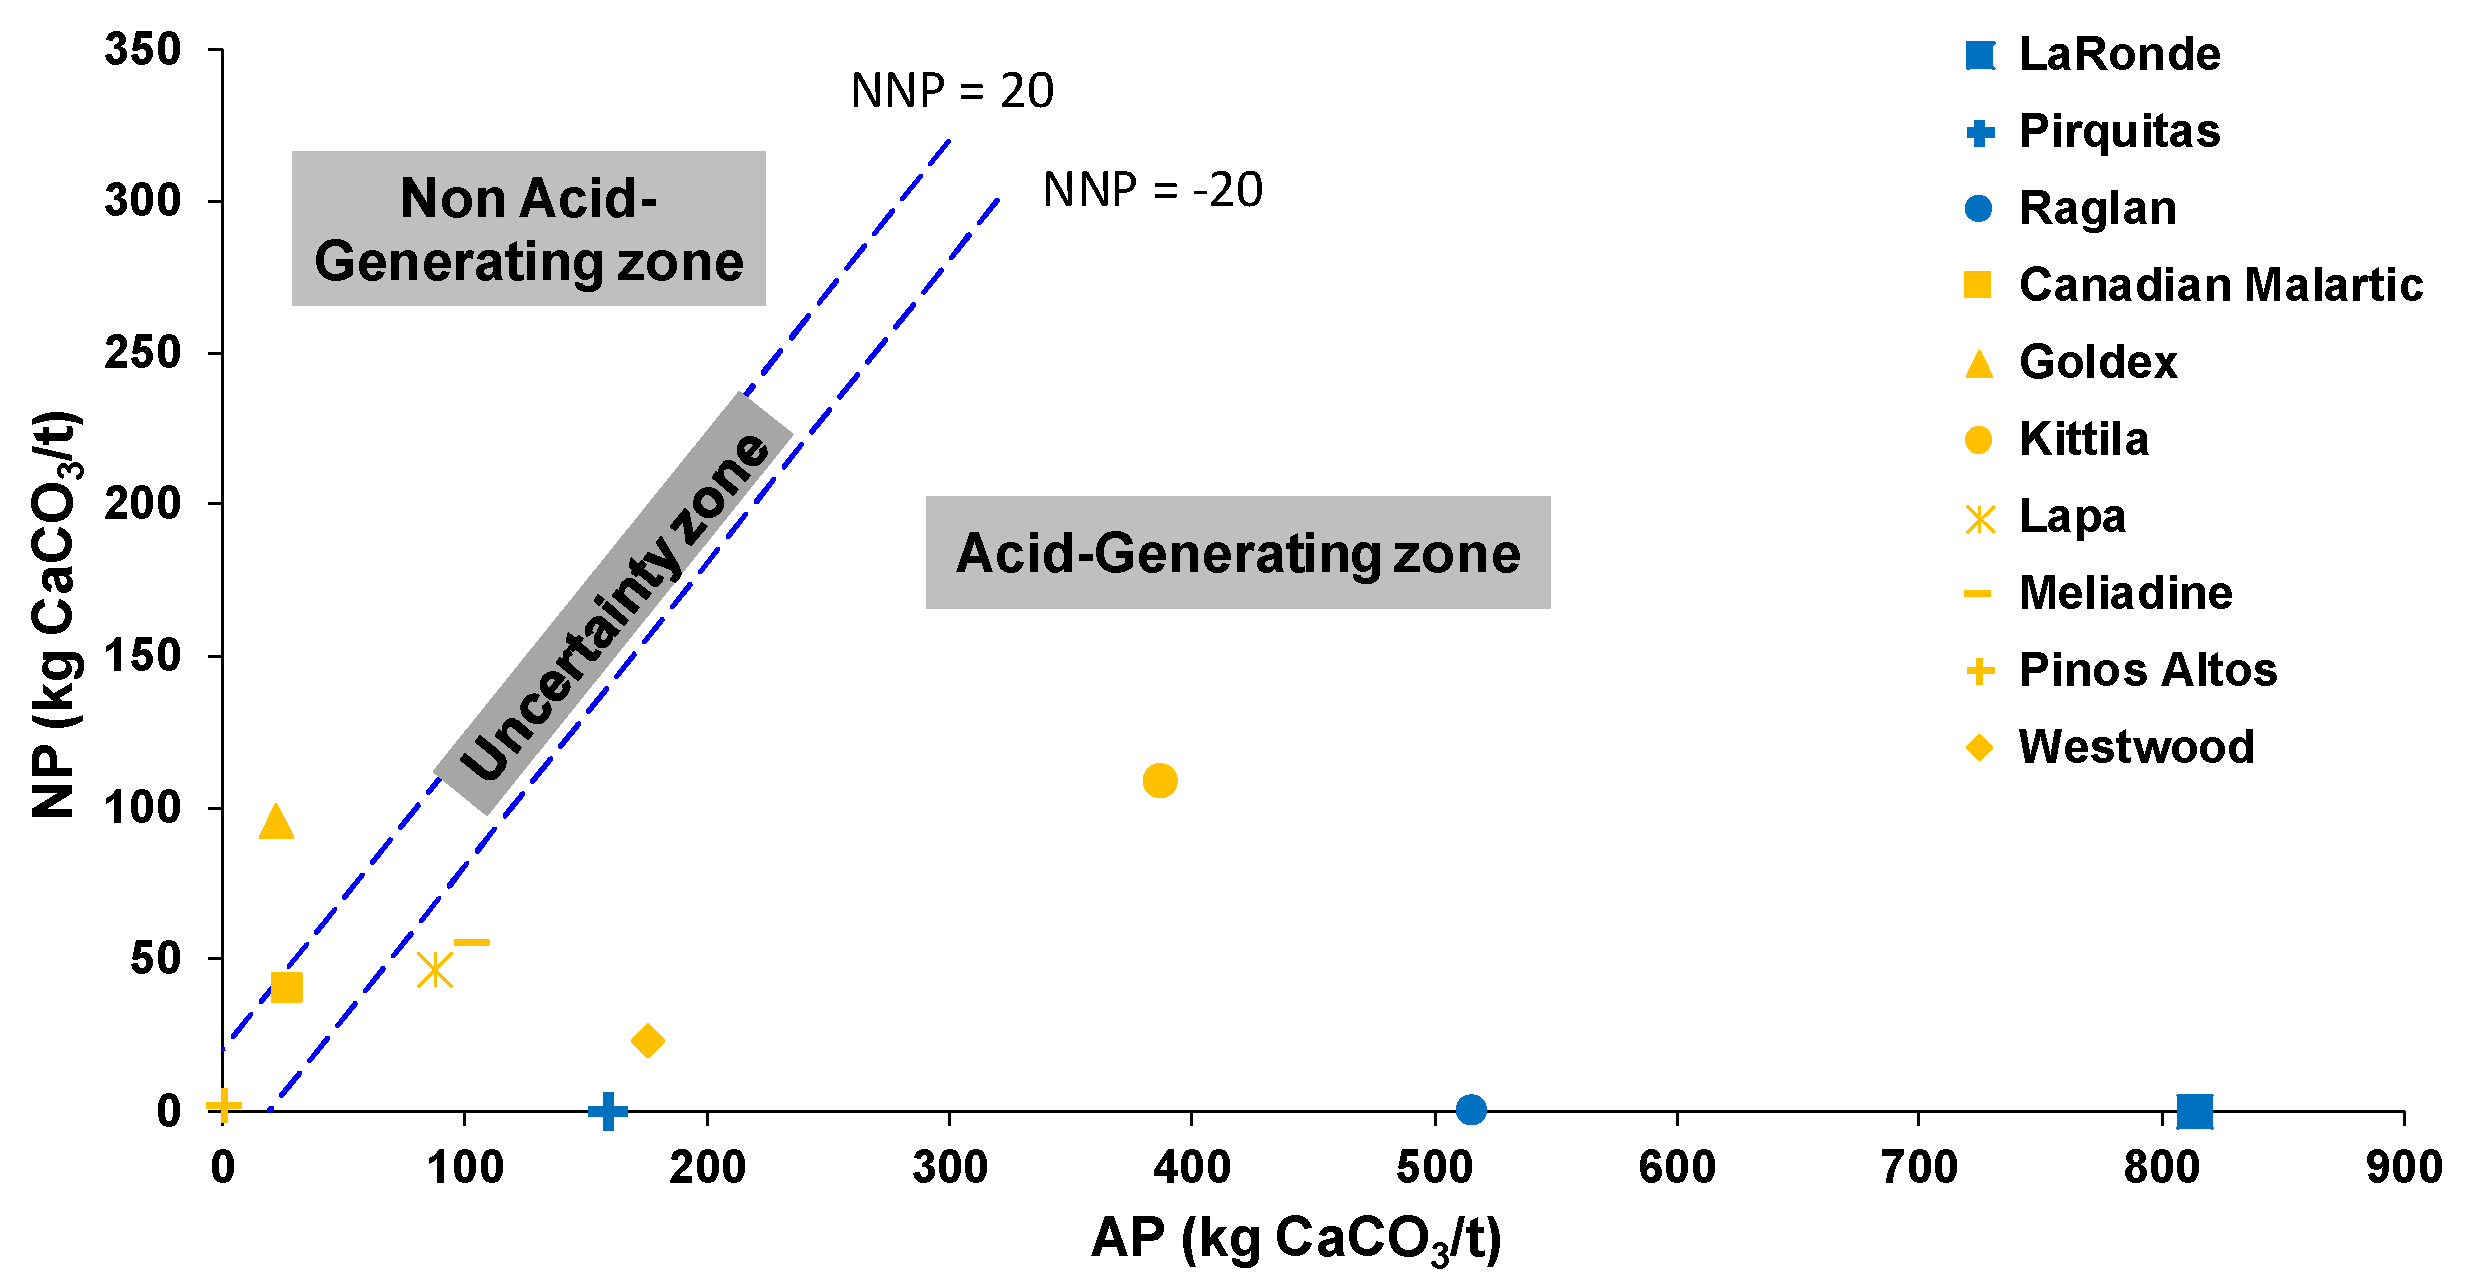
After determining the precise mineralogy of the ores, the quality of the drainage generated by the wastes can be assessed. The differences in mineral textures and rock competency bring complications, as do microbial activity and the different oxidation rates of the sulfide minerals according to their trace-element content. Approximations are unavoidable [48]. Moreover, static tests are used in this study, as they are a first screening to determine which sample and which part of the deposit will need careful geochemical testing and further mineralogical characterization (liberation degree and mineralogical associations). Appendix A Table A5 exposes the different estimations of the acid-generation potential (AP) and the neutralization potential (NP) according to different mineralogical methods: Sobek, Schuller [49], Paktunc [25], Bouzahzah, Benzaazoua [44] and unpublished work from the authors for the AP calculation and Lawrence and Scheske [50], Paktunc [51], Plante, Bussière [52] and the standard carbonate NP (CNP) and corrected CNP (CCNP) methods [53] for the NP calculations. These static tests, their characteristics, their advantages and disadvantages are fully explained in Plante, Bussière [52] and in Bouzahzah, Benzaazoua [44]. In the case of the polymetallic ores, the minerals of economic interest are, in a first approximation, considered to be 95% recovered in the plant. Therefore, the contribution of chalcopyrite, sphalerite, and galena has been removed from the calculations in the AP determination for the LaRonde sample, the contribution of sphalerite and stannite for the Pirquitas sample, and of pentlandite and chalcopyrite for the Raglan sample. This estimation can change according to the ore processing method and its particular extraction yields. The net neutralization potential (NNP) and the ratio AP/NP were calculated with all possibilities of AP and NP results according to the various methods, by the matrix. Two combinations were used to calculate NNP and AP/NP: the AP and NP calculations by the Paktunc [51] methods, and the AP by Chopard, Benzaazoua [54] with the NP by Plante, Bussière [52]. The classification used here is from Ferguson and Morin [55] for the NNP value and from Price, Morin [56] for the NP/AP ratio value. If the NNP is below −20 kg CaCO3/t, the material is considered acid generating; if the NNP is comprised between −20 and +20 kg CaCO3/t, the material is classified uncertain, and if the NNP is above 20 kg CaCO3/t, therefore, the material is not considered acid generating. If NP/AP < 1, the wastes will be acid generating; if 1 < NP/AP > 2, the wastes are likely to be acid generating. If 2 < NP/AP < 4, the wastes are not likely to be acid generating. Finally, if NP/AP > 4, the wastes are considered as not acid generating. Bouzahzah, Benzaazoua [44] recommends the use of the NNP as a classification’s criterion, whereas Sherlock, Lawence [57] recommend the use of the NP/AP ratio. Figure 6 shows the results for the NNP calculation with the methods of Plante, Bussière [52] and Chopard, Benzaazoua [54].
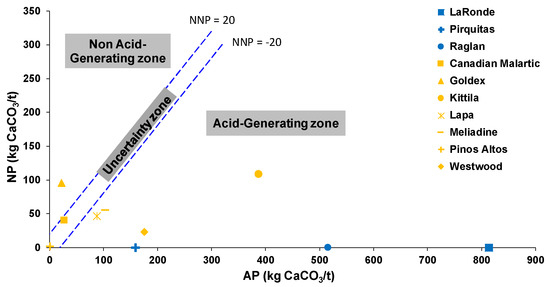
Figure 6.
Net neutralization potential values for the ten ore samples calculated from the neutralization potential (NP) by Plante [52] and from the acid-generation potential (AP) by Chopard et al. [54].
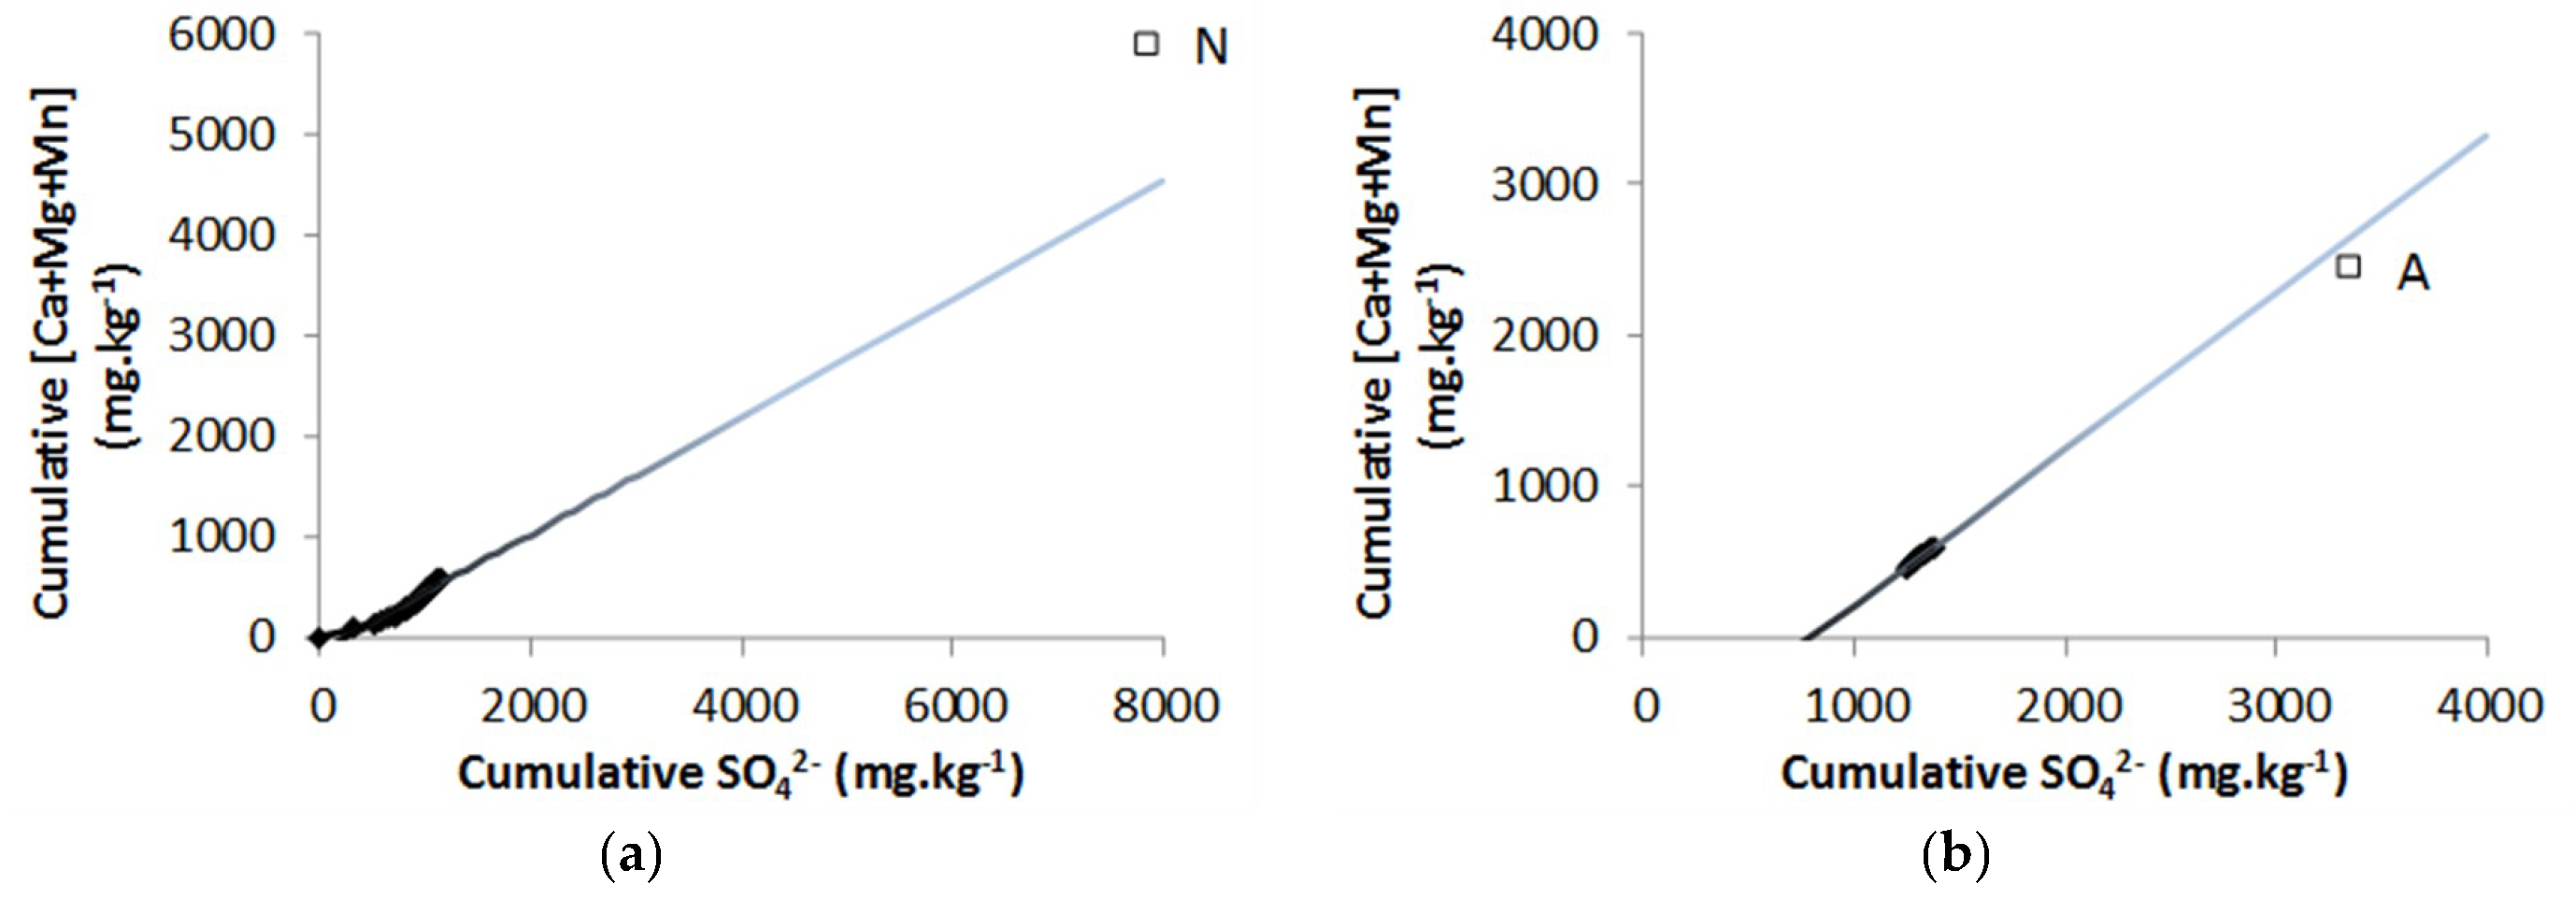
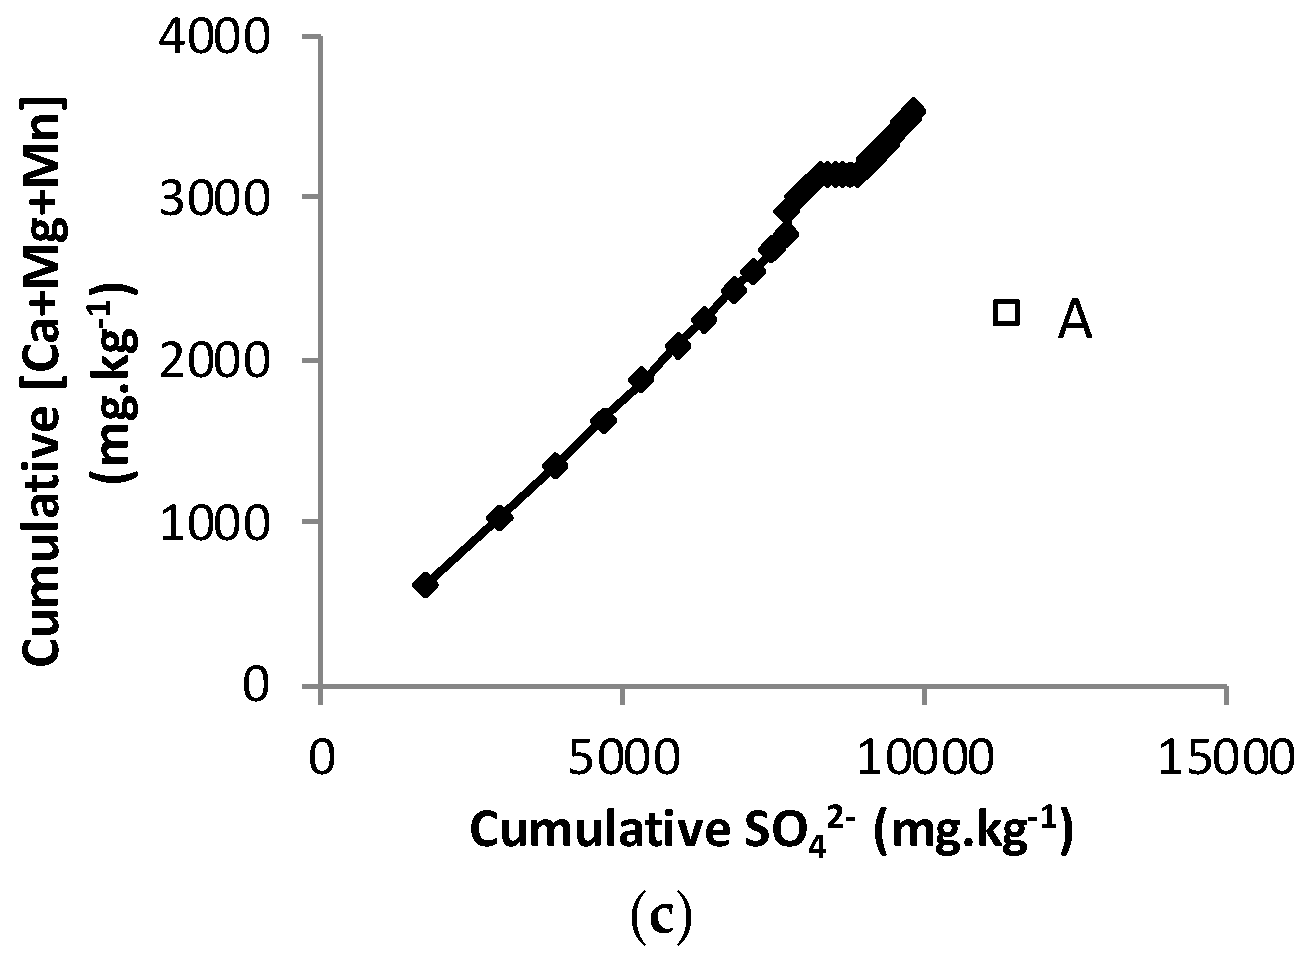
Despite the possible removal of certain minerals by flotation, all polymetallic samples studied will generate acid-generating wastes. Therefore, contaminants will also be released. This is confirmed by the geochemical tests on the LaRonde and Pirquitas samples, as their pH is acidic (average of 4.2) and by the elemental concentrations found in the leachates. For gold ores, it was evaluated that all sulfides would go into the waste materials. Westwood, Kittilä and Meliadine would be acid generating, however the kinetic test results are in contradiction with this estimation. On the first hundred days of testing, as the pH of the leachates is comprised between 7.0 and 8.2 for these samples. This contradiction may be explained by the texture of the ores and by the short testing time. The lag time for acid generation is indeed an important consideration in acid rock drainage (ARD) prevention and the early results of geochemical testing may not be representative of long-term behavior [58]. Conversely, the SEM observations have shown partially or totally liberated sulfides. Thus, the oxidation-neutralization curve [59,60] was plotted to compare the cumulative extracted amounts of the main sulfide oxidation products (sulfates) and the main acid neutralization products (calcium, magnesium, and manganese) (Figure 7) to attempt to explain predictable results. The acid-generating potential can be assessed by extrapolating the oxidation-neutralization curve on a longer period and by projecting the initial sulfur and Ca + Mg + Mn initial contents of the sample.
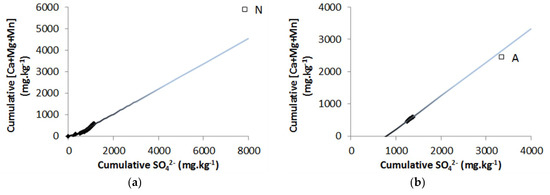

Figure 7.
Extrapolation of the oxidation-neutralization curves and projection of the samples initial compositions for (a) Kittilä, (b) Meliadine, and (c) Westwood. A: acid-generating samples; N: neutralizing samples.
For Kittilä, the initial composed projection is over the oxidation-neutralization curve, which means that the sample contains neutralizing minerals in sufficient amount to neutralize the acidity generated by sulfide oxidation. In this case, the material should not be acid generating in the long-term. This statement should be established by taking into account the ore’s texture and other mineralogical parameters than modal mineralogy. Contrariwise, for Meliadine and Westwood, the initial composition projections are under the oxidation-neutralization curve. The samples would be acid generating in the long term, and thus the results of the static test would be relevant and the initial geochemical behavior of the two samples would not reflect the whole behavior in the long run. Lapa would be acid generating too, but according to the methods of Paktunc [25,51], it would be classified as uncertain. Canadian Malartic and Pinos Altos will be uncertain. Only the Goldex wastes will be classified as not acid generating.
4. Conclusions and Perspectives
Ten samples were submitted to a detailed mineralogical characterization to identify the possible issues of their future exploitation, for environmental and ore processing considerations. This work allowed to determine the specification of valuable elements (Ag, Au, Li, In, Pd, Pt) and potential contaminants (As, Ba, Bi, Cd, Co, Cr, Cu, Hg, Mn, Mo, Ni, Se, Sn, Sr, Te, Tl, and Zn). Regarding the methodology itself, firstly, it is important to be confident in the assay, using the appropriate chemical methods. Then, the reconciliation of mineralogical data (XRD, optical microscopy, SEM-EDS, and EPMA) and the assay is necessary to obtain a reliable quantitative mineralogy (as XRD is only a semi-quantification technique) and improve the estimation of the acid-generation potential. The mineralogical difficulties occurred when the concentrations of an element were too low to detect its bearing mineral. The geochemical interpretation difficulties were causes by the changing pH of the leachates. The possible contaminants will be found in the leachates only if they are soluble under the pH conditions of the water. It was difficult to consider this parameter here, as three of the five ore tests have presented a neutral pH at the beginning of the geochemical test but have not presented high levels of concentrations of the possible contaminants identified by the mineralogical characterization. The pH effects on the geochemical and environmental behavior of samples (like the release of contaminants) will be investigated in a later study.
The strength of this study is due to the availability and relatively cost-effectiveness of the main mineralogical techniques used to identify the elements and the minerals (optical and electron microscopy), and the possibility to choose if EPMA will be necessary to bring benefit for upcoming decisions. The cost of the methodology is very low compared with the time and costs saved by the mineralogical information obtained on the ores. This knowledge will enable a complete planning and integrated waste management strategy at the stage of exploration. Regarding the identification of secondary valuable elements, a detailed mineralogical characterization would also allow junior companies to minimize the risks associated with a deposit and then to increase the economic value of a potential site after its sale.
The goal of this study was to propose a simple and low-cost methodology based on a mineralogical characterization. However, other work could be done at the stage of exploration to still better estimate the environmental and mineral processing challenges, particularly, automated mineralogy could be done in addition to this methodology to bring supplementary information. Samples must be carefully chosen, as automated mineralogy is largely more expensive. The information on particle size, distribution, liberation and minerals association should be integrated in the methodology to assess for instance the availability of the minerals for reactions or the elements to be leached (or recovered). More work could be done on thermochemical equilibrium calculations with PhreeqC to perform mineral speciation and saturation index calculations to determine the major sources of ionic elements in water.
Author Contributions
Conceptualization, R.M.-B. and M.B.; Data curation, A.C.; Formal analysis, A.C.; Funding acquisition, M.B.; Investigation, A.C.; Methodology, A.C.; Project administration, B.P. and M.B.; Resources, R.M.-B. and M.B.; Supervision, P.M., B.P. and M.B.; Validation, P.M., B.P. and M.B.; Visualization, M.B.; Writing—original draft, A.C.; Writing—review & editing, P.M., R.M.-B., B.P. and M.B.
Funding
This research received no external funding.
Acknowledgments
The authors greatly thank to the technical staff of the URSTM for helping in the preparation samples and making the chemical digestion and analysis. Thank you to the IRME partners: Agnico Eagle Mines Limited, Canadian Malartic Mine, IamGold Corporation, Raglan Mine – Glencore, and Rio Tinto Fer and Titane Inc. The analysis services of the GeoRessources laboratory at the University of Lorraine in France are also gratefully acknowledged.
Conflicts of Interest
The authors declare no conflict of interest.
Appendix A
Table A1.
Initial sample description and final D80 desired.
Table A1.
Initial sample description and final D80 desired.
| Mine’s Name | Sample | Mine’s Lab Preparation | Initial Mass (g) | Initial Particle Size | Final Target D80 (µm) |
|---|---|---|---|---|---|
| LaRonde | Blasted ore | No | 2150 | D80 ≈ 80 mm | 68 |
| Pirquitas | JIG feed ore | Unknown | 900 | <10 mm | 48 |
| Raglan | Blasted ore | No | 39,000 | D80 ≈ 80 mm | 79 |
| C. Malartic | Stockpile | No | 12,000 | D80 ≈ 100 mm | 64 |
| Goldex | Jaw crusher sample | Crushed, split | 1630 | D80 ≈ 7.1 mm | 66 |
| Kittilä | GTK composite | Crushed, split | 2650 | <1 mm | 85 |
| Lapa | Composite | Crushed, split | 1000 | <2 mm | 80 |
| Meliadine | Tiriganiaq open pit Composite | Crushed, split | 1000 | <2 mm | 63 |
| Pinos Altos | Santo Niño Composite | Crushed, split | 4300 | <2 mm | 74 |
| Westwood | Stockpile | No | 35,000 | D80 ≈ 100 mm | 64 |
Table A2.
Precious elements in the ores’ samples. The values above ten times the Clarke value are in gray.
Table A2.
Precious elements in the ores’ samples. The values above ten times the Clarke value are in gray.
| Precious Metals (ppb) | ||||||
|---|---|---|---|---|---|---|
| Ag | Au | In | Li | Pd | Pt | |
| Clarke value | 70 | 1.1 | 50 | 60,000 | 15 | 1 |
| LaRonde | 14,000 | 2534 | 1000 | 20,000 | ||
| Pirquitas | 141,000 | 42 | 30,200 | 60,000 | ||
| Raglan | 2000 | 60 | 1627 | 694 | ||
| C. Malartic | 560 | 20,000 | ||||
| Goldex | 2097 | |||||
| Kittilä | 6628 | 20,000 | ||||
| Lapa | ||||||
| Meliadine | 1000 | 4018 | 20,000 | 22 | ||
| Pinos Altos | 88,000 | 3207 | 90,000 | 30 | ||
| Westwood | 3000 | 3582 | 500 | 20,000 | ||
Table A3.
Major, minor and trace elements of the ores’ sample. For minor and trace elements, and for Cr, Mn, and S, the values above the Directive 019 values are in light gray, the values above ten times the Clarke values or above both the defined thresholds are in dark gray; ND: No determined.
Table A3.
Major, minor and trace elements of the ores’ sample. For minor and trace elements, and for Cr, Mn, and S, the values above the Directive 019 values are in light gray, the values above ten times the Clarke values or above both the defined thresholds are in dark gray; ND: No determined.
| Minor and Trace Elements (ppm) | ||||||||||||||||||
| As | Ba | Bi | Cd | Co | Cu | Hg | Mo | Ni | Pb | Sb | Se | Sn | Sr | Te | Tl | Zn | ||
| Clarke value | 5 | 250 | 0.2 | 0.15 | 25 | 70 | 0.007 | 1.5 | 80 | 16 | 0.2 | 0.05 | 2.2 | 375 | 0.005 | 0.45 | 75 | |
| Directive 019 | 5 | 200 | ND | 0.9 | 20 | 50 | 0.1 | 6 | 50 | 40 | ND | 3 | 5 | ND | ND | ND | 120 | |
| LaRonde | 143 | 150 | 168.8 | 3.47 | 11 | 3039 | 0.04 | 0.7 | 39 | 219 | 5.0 | <0.0004 | ND | 110 | 14 | 2.4 | 946 | |
| Pirquitas | 1160 | 360 | 122.5 | 40.0 | 10 | 307 | 0.07 | 1.1 | <0.0007 | 134 | 54.8 | 1.88 | 2280 | 460 | 2.0 | 11 | 8380 | |
| Raglan | 16 | 20 | 4.9 | 1.55 | 548 | 6033 | 0.09 | 0.6 | 24460 | 13 | 7.8 | 14.2 | ND | 20 | 4 | <0.5 | 88 | |
| C. Malartic | 17 | 700 | 5.1 | 0.09 | 16 | 122 | <0.01 | 5.3 | 20 | 25 | 22.7 | 1.56 | ND | 570 | <2 | <0.5 | 65 | |
| Goldex | 36 | 250 | 10.4 | 0.08 | 14 | 79 | 0.51 | 2.6 | 126 | 7 | 445.9 | 0.05 | ND | 460 | <2 | <0.5 | 54 | |
| Kittilä | 12,200 | 220 | 1.9 | 0.75 | 25 | 104 | 0.40 | 1.5 | 32 | 15 | 76.9 | 1.25 | ND | 120 | <2 | 1 | 153 | |
| Lapa | 1865 | 250 | <0.1 | 0.48 | 52 | 65 | <0.01 | 1.2 | 623 | 13 | 141 | <0.0004 | 1.3 | <10 | <2 | <0.5 | 114 | |
| Meliadine | 13,600 | 450 | 5.0 | 0.77 | 15 | 92 | <0.01 | 8.0 | <0.0007 | 101 | 16.8 | 0.33 | ND | 260 | <2 | <0.5 | 213 | |
| Pinos Altos | 44 | 730 | 2.8 | 1.00 | 6 | 67 | 0.82 | 1.7 | <0.0007 | 89 | 65.9 | 0.43 | ND | 100 | <2 | 1.4 | 197 | |
| Westwood | 42 | 810 | 10.1 | 7.62 | 18 | 245 | 0.02 | 1.7 | <0.0007 | 186 | 57.4 | 3.55 | ND | 110 | <2 | <0.5 | 3244 | |
| Major Elements (wt. %) | ||||||||||||||||||
| Al | Ca | Cr | Fe | K | Mg | Mn | Na | Si | Ti | S | ||||||||
| Clarke value | 0.08 | 3.6–4.1 | 0.01–0.02 | 4.1–5 | 2.1–2.5 | 2.1–2.3 | 0.04–0.16 | 2.4–2.8 | 0.45 | 0.03–0.05 | ||||||||
| Directive 019 | ND | ND | 0.0085 | ND | ND | ND | 0.1 | ND | ND | ND | ND | |||||||
| LaRonde | 5.79 | 0.30 | 0.0069 | 15.5 | 0.78 | 0.12 | 0.04 | 0.53 | 26.17 | 0.31 | 16.2 | |||||||
| Pirquitas | 7.46 | 0.16 | 0.0079 | 4.74 | 2.00 | 0.14 | 0.00 | 0.26 | 32.81 | 0.35 | 5.50 | |||||||
| Raglan | 1.20 | 0.25 | 0.2294 | 21.7 | 0.39 | 17.49 | 0.07 | 0.01 | 13.15 | 0.05 | 10.1 | |||||||
| C. Malartic | 7.79 | 1.91 | 0.0169 | 3.67 | 2.49 | 1.62 | 0.04 | 3.51 | 26.31 | 0.29 | 0.94 | |||||||
| Goldex | 8.22 | 3.55 | 0.0099 | 2.91 | 0.44 | 1.72 | 0.03 | 3.67 | 26.22 | 0.19 | 0.75 | |||||||
| Kittilä | 5.88 | 5.19 | 0.0155 | 9.67 | 1.69 | 3.39 | 0.24 | 1.22 | 21.24 | 0.98 | 3.91 | |||||||
| Lapa | 4.80 | 3.97 | 0.1008 | 6.35 | 0.96 | 9.33 | 0.10 | 0.90 | 24.01 | 0.31 | 0.45 | |||||||
| Meliadine | 5.66 | 2.42 | 0.0079 | 9.78 | 1.47 | 1.21 | 0.03 | 1.36 | 26.69 | 0.19 | 1.66 | |||||||
| Pinos Altos | 3.80 | 0.25 | 0.0074 | 2.07 | 2.46 | 0.36 | 0.07 | 0.36 | 38.51 | 0.15 | 0.11 | |||||||
| Westwood | 7.40 | 1.96 | 0.0066 | 7.06 | 2.02 | 1.39 | 0.07 | 1.06 | 28.16 | 0.40 | 5.66 | |||||||
Table A4.
EPMA analysis of the elements of interest in certain minerals observed.
Table A4.
EPMA analysis of the elements of interest in certain minerals observed.
| Polymetallic Ores | Gold Ores | |||||||||
|---|---|---|---|---|---|---|---|---|---|---|
| Mineral | Elt (%) | DDL (ppm) | LaRonde | Pirquitas | Raglan | Canadian Malartic | Goldex | Kittilä | Meliadine | Westwood |
| Pyrite | S | 53.53 ± 0.31 | 51.8 ± 3.71 | 53.2 ± 3.07 | 53.3 ± 3.07 | 50.4 ± 3.92 | 53.2 ± 3.08 | 54.1 ± 0.31 | ||
| Fe | 46.47 ± 0.44 | 46.9 ±1.79 | 46.8 ± 2.15 | 46.7 ± 2.14 | 46.3 ± 2.37 | 46.8 ± 2.15 | 45.9 ±0.44 | |||
| As | 650 | <2000 ppm | 0.83 ± 0.26 | <650 ppm | <650 ppm | 3.26 ± 0.49 | <650 ppm | <2000 ppm | ||
| Au | 1100 | NA | NA | NA | NA | <1100 ppm | NA | NA | ||
| Ag | 1400 | NA | 0.40 ± 0.25 | NA | NA | NA | NA | NA | ||
| Tl | 1500 | NA | 0.45 ± 0.27 | NA | NA | NA | NA | NA | ||
| Se | 650 | <650 ppm | NA | NA | <650 ppm | <650 ppm | NA | <650 ppm | ||
| Pyrrhotite | S | 40.0 ± 1.82 | 39.8 ± 1.81 | 39.3 ± 1.76 | ||||||
| Fe | 59.7 ± 1.94 | 60.2 ± 1.95 | 60.6 ± 1.92 | |||||||
| Co | 330 | <330 ppm | <330 ppm | <330 ppm | ||||||
| Ni | 550 | 0.37 ± 0.22 | <550 ppm | 0.10 ± 0.10 | ||||||
| Arsenopyrite | S | 21.1 ± 1.88 | 21.1 ± 1.89 | |||||||
| As | 43.9 ± 3.08 | 43.6 ± 3.08 | ||||||||
| Fe | 35.0 ± 1.90 | 35.2 ± 1.92 | ||||||||
| Au | 1300 | <1300 ppm | <1300 ppm | |||||||
| Chalcopyrite | S | 35.5 ± 1.74 | 34.7 ± 1.64 | NA | ||||||
| Cu | 34.2 ± 1.85 | 34.5 ± 1.22 | NA | |||||||
| Fe | 30.2 ± 1.39 | 30.5 ± 1.21 | NA | |||||||
| Ag | 430 | NA | <430 ppm | <430 ppm | ||||||
| As | 1700 | <1700 ppm | NA | NA | ||||||
| Sn | 700 | <700 ppm | NA | NA | ||||||
| Tl | 2000 | <2000 ppm | NA | NA | ||||||
| Te | 1600 | <1600 ppm | NA | NA | ||||||
| Cd | 500 | <500 ppm | 0.37 ± 0.10 | NA | ||||||
| Sphalerite | S | 33.1 ± 1.57 | 33.6 ± 2.53 | 33.4 ± 1.62 | ||||||
| Zn | 60.7 ± 2.33 | 63.8 ± 2.13 | 61.2 ± 2.64 | |||||||
| Fe | 950 | 4.39 ± 0.43 | 2.06 ± 0.30 | 4.31 ± 0.42 | ||||||
| Ag | 680 | NA | 0.84 ± 0.27 | NA | ||||||
| In | 475 | 0.45 ± 0.10 | 0.25 ± 0.18 | NA | ||||||
| Cd | 550 | 1.16 ± 0.09 | 0.37 ± 0.21 | 1.00 ± 0.12 | ||||||
| Mn | 400 | 0.25 ± 0.09 | NA | 0.16 ± 0.09 | ||||||
| Pb | 2600 | NA | 0.71 ± 0.65 | NA | ||||||
| Tl | 1500 | 0.1 ± 0.09 | 0.33 ± 0.22 | NA | ||||||
| Galena | S | 13.2 ± 0.32 | ||||||||
| Pb | 85.4 ± 1.06 | |||||||||
| Fe | 1.37 ± 0.20 | |||||||||
| Ag | 430 | 0.09 ± 0.04 | ||||||||
| Pentlandite | S | 33.8 ± 1.67 | ||||||||
| Fe | 30.0 ± 1.22 | |||||||||
| Ni | 35.5 ± 1.34 | |||||||||
| Co | 330 | 0.75 ± 0.08 | ||||||||
Table A5.
Different estimations of the acid-generation potential (AP) and the neutralization potential (NP) according to different mineralogical methods; and neutralization net potential (NNP) and NP/AP ratios.
Table A5.
Different estimations of the acid-generation potential (AP) and the neutralization potential (NP) according to different mineralogical methods; and neutralization net potential (NNP) and NP/AP ratios.
| LaRonde | Pirquitas | Raglan | ||||||
| NP (kg CaCO3/t) | Lawrence & Scheske [50] | 2 | 2 | 88 | ||||
| CNP | 0 | 6 | 8 | |||||
| CCNP | 0 | 6 | 8 | |||||
| Paktunc [51] | 0 | 0 | 0 | |||||
| Plante [52] | 0 | 0 | 0 | |||||
| AP (kg CaCO3/t) | Sobek et al. [49] | 496 | 160 | 225 | ||||
| Paktunc [51] | 483 | 158 | 205 | |||||
| Bouzahzah et al. [44] | 483 | 159 | 205 | |||||
| Chopard et al. [54] | 814 | 159 | 516 | |||||
| NNP | Paktunc [51] | −483 | −158 | −205 | ||||
| Chopard et al. [54] & Plante [52] | −814 | −159 | −516 | |||||
| NP/AP | Paktunc [51] | 0 | 0 | 0 | ||||
| Chopard et al. [54] & Plante [52] | 0 | 0 | 0 | |||||
| Canadian Malartic | Goldex | Kittilä | Lapa | Meliadine | Pinos Altos | Westwood | ||
| NP (kg CaCO3/t) | Lawrence & Scheske [50] | 55 | 105 | 134 | 101 | 127 | 5 | 31 |
| CNP | 47 | 103 | 302 | 101 | 126 | 0 | 23 | |
| CCNP | 47 | 103 | 302 | 101 | 63 | 0 | 23 | |
| Paktunc [51] | 40 | 95 | 103 | 38 | 55 | 2 | 23 | |
| Plante [52] | 40 | 96 | 109 | 47 | 55 | 2 | 23 | |
| AP (kg CaCO3/t) | Sobek et al. [49] | 29 | 23 | 122 | 14 | 52 | 3 | 177 |
| Paktunc [51] | 28 | 23 | 120 | 13 | 44 | 1 | 171 | |
| Bouzahzah et al. [44] | 28 | 23 | 142 | 15 | 73 | 0 | 166 | |
| Chopard et al. [54] | 28 | 23 | 387 | 88 | 103 | 1 | 176 | |
| NNP | Paktunc [51] | 11 | 72 | −17 | 25 | 10 | 2 | −148 |
| Chopard et al. [54] & Plante [52] | 12 | 73 | −278 | −41 | −48 | 1 | −153 | |
| NP/AP | Paktunc [51] | 1.40 | 4.12 | 0.86 | 2.89 | 1.23 | 3.66 | 0.13 |
| Chopard et al. [54] & Plante [52] | 1.41 | 4.16 | 0.28 | 0.53 | 0.54 | 2.48 | 0.13 | |
References
- EPA. Acid Mine Drainage Prediction; U.S. Environmental Protection Agency Office of Solid Waste Special Waste Branch: Washington, DC, USA, 1994.
- Natural Resources Canada NR. Evaluation Report: Green Mining Initiative; Canada NR: Ottawa, ON, Canada, 2015.
- Plante, B.; Benzaazoua, M.; Bussière, B. Predicting Geochemical Behaviour of Waste Rock with Low Acid Generating Potential Using Laboratory Kinetic Tests. Mine Water Environ. 2010, 30, 2–21. [Google Scholar] [CrossRef]
- El Adnani, M.; Plante, B.; Benzaazoua, M.; Hakkou, R.; Bouzahzah, H. Tailings Weathering and Arsenic Mobility at the Abandoned Zgounder Silver Mine, Morocco. Mine Water Environ. 2015, 35, 508–524. [Google Scholar] [CrossRef]
- Steger, H.; Desjardins, L. Oxidation of sulfide minerals, 4. Pyrite, chalcopyrite and pyrrhotite. Chem. Geol. 1978, 23, 225–237. [Google Scholar] [CrossRef]
- Steger, H.; Desjardins, L. Oxidation of sulfide minerals; V, Galena, sphalerite and chalcocite. Can. Mineral. 1980, 18, 365–372. [Google Scholar]
- Rimstidt, J.D.; Chermak, J.A.; Gagen, P.M. Rates of Reaction of Galena, Sphalerite, Chalcopyrite, and Arsenopyrite with Fe (III). in Acidic Solutions; ACS symposium series; American Chemical Society: Washington, DC, USA, 1994; pp. 2–13. [Google Scholar]
- Nicholson, R. Iron-sulfide oxidation mechanisms: Laboratory studies. Environ. Geochem. Sulphide Mine Wastes 1994, 22, 163–183. [Google Scholar]
- Morin, K.; Hutt, N.; Ferguson, K. Measured rates of sulfide oxidation and acid neutralization in humidity cells: Statistical lessons from the database. In Proceedings of the Sudbury ‘95: Mining and the Environment, Sudbury, ON, Canada, 28 May–1 June 1995. [Google Scholar]
- Thomas, J.E.; Smart, R.S.C.; Skinner, W.M. Kinetic factors for oxidative and non-oxidative dissolution of iron sulfides. Miner. Eng. 2000, 13, 1149–1159. [Google Scholar] [CrossRef]
- Frostad, S.; Klein, B.; Lawrence, R.W. Evaluation of Laboratory Kinetic Test Methods for Measuring Rates of Weathering. Mine Water Environ. 2002, 21, 183–192. [Google Scholar] [CrossRef]
- Chopard, A.; Benzaazoua, M.; Plante, B.; Bouzahzah, H.; Marion, P. Kinetic tests to evaluate the relative oxidation rates of various sulfides and sulfosalts. In Proceedings of the 10th ICARD Conference on Acid Rock Drainage, and IMWA, Santiago, Chile, 21–24 April 2015. [Google Scholar]
- Diehl, S.; Hageman, P.L.; Smith, K.S. What’s weathering? Mineralogy and field leach studies in mine waste, Leadville and Montezuma mining districts, Colorado. In Proceedings of the 7th International Conference on Acid Rock Drainage (ICARD 7), St. Louis, MO, USA, 26–30 March 2006; pp. 507–527. [Google Scholar]
- Petruk, W. Applied Mineralogy in the Mining Industry; Elsevier: Amsterdam, The Netherlands, 2000. [Google Scholar]
- Kwong, Y.J.; Swerhone, G.W.; Lawrence, J.R. Galvanic sulphide oxidation as a metal-leaching mechanism and its environmental implications. Geochem. Explor. Environ. Anal. 2003, 3, 337–343. [Google Scholar] [CrossRef]
- Cruz, R.; Luna-Sánchez, R.M.; Lapidus, G.T.; González, I.; Monroy, M. An experimental strategy to determine galvanic interactions affecting the reactivity of sulfide mineral concentrates. Hydrometallurgy 2005, 78, 198–208. [Google Scholar] [CrossRef]
- Liu, Q.; Li, H.; Zhou, L. Galvanic interactions between metal sulfide minerals in a flowing system: Implications for mines environmental restoration. Appl. Geochem. 2008, 23, 2316–2323. [Google Scholar] [CrossRef]
- Lottermoser, B. Mine Wastes: Characterization, Treatment and Environmental Impacts; Springer: Berlin, Germany, 2010. [Google Scholar]
- Parbhakar-Fox, A.K.; Edraki, M.; Walters, S.; Bradshaw, D. Development of a textural index for the prediction of acid rock drainage. Miner. Eng. 2011, 24, 1277–1287. [Google Scholar] [CrossRef]
- Brough, C.P.; Warrender, R.; Bowell, R.J.; Barnes, A.; Parbhakar-Fox, A. The process mineralogy of mine wastes. Miner. Eng. 2013, 52, 125–135. [Google Scholar] [CrossRef]
- Dold, B. Pre-mining Characterization of Ore Deposits: What Information Do We Need to Increase Sustainability of the Mining Process? In Proceedings of the 10th International Conference on Acid Rock Drainage (ICARD) & IMWA Annual Conference, Santiago, Chile, 21–24 April 2015. [Google Scholar]
- Parbhakar-Fox, A.; Lottermoser, B.; Bradshaw, D. Evaluating waste rock mineralogy and microtexture during kinetic testing for improved acid rock drainage prediction. Miner. Eng. 2013, 52, 111–124. [Google Scholar] [CrossRef]
- Bouzahzah, H.; Benzaazoua, M.; Bussière, B.; Plante, B. Revue de Littérature Détaillée sur les Tests Statiques et les Essais Cinétiques Comme Outils de Prédiction du Drainage Minier Acide. Déchets Sciences et Techniques Techniques. 2014, pp. 14–31. Available online: http://lodel.irevues.inist.fr/dechets-sciences-technique/docannexe/file/340/2_bouzahzah.pdf (accessed on 27 June 2019).
- Goodall, W.R.; Cropp, A. Integrating Mineralogy into Everyday Solutions; MinAssist: Carlton, Australia, 2013. [Google Scholar]
- Paktunc, A.D. Characterization of Mine Wastes for Prediction of Acid Mine Drainage Environmental Impacts of Mining Activities; Springer: Berlin, Germany, 1999; pp. 19–40. [Google Scholar]
- Bouzahzah, H.; Benzaazoua, M.; Mermillod-Blondin, R.; Pirard, E. A novel procedure for polished section preparation for automated mineralogy avoiding internal particle settlement. In Proceedings of the 12th International Congress for Applied Mineralogy (ICAM), Istanbul, Turkey, 10–12 August 2015. [Google Scholar]
- Merkus, H.G. Particle Size Measurements: Fundamentals, Practice, Quality; Springer Science & Business Media: Berlin, Germany, 2009. [Google Scholar]
- Couture, R.A. An improved fusion technique for major-element rock analysis by XRF. Adv. X-ray Anal. 1989, 32, 233–238. [Google Scholar]
- Alvarez, M. Glass disk fusion method for the X-ray fluorescence analysis of rocks and silicates. X-ray Spectrom. 1990, 19, 203–206. [Google Scholar] [CrossRef]
- Spangenberg, J.; Fontbote, L.; Pernicka, E. X-Ray fluorescence analysis of base metal sulphide and iron-manganese oxide ore samples in fused glass disc. X-ray Spectrom. 1994, 23, 83–90. [Google Scholar] [CrossRef]
- Claisse, F. Glass Disks and Solutions by Fusion in Borates for Users of Claisse Fluxers; Corporation Scientific Claisse Inc.: Sainte-Foy, QC, Canada, 1995. [Google Scholar]
- Young, D.S.; Sachais, B.S.; Jefferies, L.C. The Rietveld Method; International union of crystallography: Chester, UK, 1993. [Google Scholar]
- Raudsepp, M.; Pani, E. Application of Rietveld analysis to environmental mineralogy. Environ. Asp. Mine Wastes 2003, 31, 165–180. [Google Scholar]
- Bouzahzah, H.; Califice, A.; Benzaazoua, M.; Mermillod-Blondin, R.; Pirard, E. Modal analysis of mineral blends using optical image analysis versus X ray diffraction. In Proceedings of the International Congress for Applied Mineralogy ICAM08, Brisbane, Australia, 8–10 September 2008; AusIMM: Carlton, Australia, 2008. [Google Scholar]
- Cruz, R.; Bertrand, V.; Monroy, M.; González, I. Effect of sulfide impurities on the reactivity of pyrite and pyritic concentrates: A multi-tool approach. Appl. Geochem. 2001, 16, 803–819. [Google Scholar] [CrossRef]
- Villeneuve, M.; Bussière, B.; Benzaazoua, M.; Aubertin, M. Assessment of interpretation methods for kinetic tests performed on tailings having a low acid generating potential. In Proceedings of the 8th International Conference on Acid Rock Drainage was held in Conjunction with Securing the Future, Skelleftea, Sweden, 23–26 June 2009. [Google Scholar]
- Plante, B.; Benzaazoua, M.; Bussière, B. Kinetic Testing and Sorption Studies by Modified Weathering Cells to Characterize the Potential to Generate Contaminated Neutral Drainage. Mine Water Environ. 2011, 30, 22–37. [Google Scholar] [CrossRef]
- Bouzahzah, H.; Benzaazoua, M.; Bussiere, B.; Plante, B. Prediction of acid mine drainage: Importance of mineralogy and the test protocols for static and kinetic tests. Mine Water Environ. 2014, 33, 54–65. [Google Scholar] [CrossRef]
- Clarke, F.W. The Data of Geochemistry; US Government Printing Office: Washington, DC, USA, 1920.
- Taylor, S. Abundance of chemical elements in the continental crust: A new table. Geochimica et Cosmochimica Acta 1964, 28, 1273–1285. [Google Scholar] [CrossRef]
- Benzaazoua, M.; Marion, P.; Robaut, F.; Pinto, A. Gold-bearing arsenopyrite and pyrite in refractory ores: Analytical refinements and new understanding of gold mineralogy. Mineral. Mag. 2007, 71, 123–142. [Google Scholar] [CrossRef]
- Blackburn, W.H.; Schwendeman, J.F. Trace-element substitution in galena. Can. Mineral. 1977, 15, 365. [Google Scholar]
- George, L.; Cook, N.J.; Cristiana, L.; Wade, B.P. Trace and minor elements in galena: A reconnaissance LA-ICP-MS study. Am. Mineral. 2015, 100, 548–569. [Google Scholar] [CrossRef]
- Bouzahzah, H.; Benzaazoua, M.; Bussière, B. Acid-generating potential calculation using mineralogical static test: Modification of the Paktunc equation. In Proceedings of the 23rd World Mining Congress (WMC 2013), Montréal, QC, Canada, 11–15 August 2013. [Google Scholar]
- Mermillod-Blondin, R.; Benzaazoua, M.H.B.; Leroux, D. Development and calibration of a reconciliated mineralogy method based on multitechnique analyses: Application to acid mine drainage prediction. In Proceedings of the 28th International Mineral Processing Congress (IMPC), Québec, QC, Canada, 11–15 September 2016. [Google Scholar]
- Chopard, A.; Marion, P.; Royer, J.J.; Taza, R.; Bouzahzah, H.; Benzaazoua, M. Automated sulfides quantification by multispectral optical microscopy. Miner. Eng. 2019, 131, 38–50. [Google Scholar] [CrossRef]
- Chopard, A.; Plante, B.; Benzaazoua, M.; Bouzahzah, H.; Marion, P. Geochemical investigation of the galvanic effects during oxidation of pyrite and base-metals sulfides. Chemosphere 2017, 166, 281–291. [Google Scholar] [CrossRef] [PubMed]
- Kwong, Y.-T.J. Prediction and Prevention of Acid Rock Drainage from a Geological and Mineralogical Perspective. MEND, 1993. Available online: http://mend-nedem.org/wp-content/uploads/1.32.1.pdf (accessed on 27 June 2019).
- Sobek, A.A.; Schuller, W.; Freeman, J.; Smith, R. Field and Laboratory Methods Applicable to Overburdens and Minesoils; US Environmental Protection Agency: Cincinnati, OH, USA, 1978; Volume 45268, pp. 47–50.
- Lawrence, R.W.; Scheske, M.A. Method to calculate the neutralization potential of mining wastes. Environ. Geol. 1997, 32, 100–106. [Google Scholar] [CrossRef]
- Paktunc, A.D. Mineralogical constraints on the determination of neutralization potential and prediction of acid mine drainage. Environ. Geol. 1999, 39, 103–112. [Google Scholar] [CrossRef]
- Plante, B.; Bussière, B.; Benzaazoua, M. Static tests response on 5 Canadian hard rock mine tailings with low net acid-generating potentials. J. Geochem. Explor. 2012, 114, 57–69. [Google Scholar] [CrossRef]
- Frostad, S.R.; Price, W.A.; Bent, H. Operational NP determination—Accounting for iron manganese carbonates and developing a site-specific fizz rating. In Proceedings of the Sudbury ’95: Mining and the Environment III, Sudbury, ON, Canada, 28 May–1 June 1995. [Google Scholar]
- Chopard, A.; Benzaazoua, M.; Bouzahzah, H.; Plante, B.; Marion, P. A contribution to improve the calculation of the acid generating potential of mining wastes. Chemosphere 2017, 175, 97–107. [Google Scholar] [CrossRef]
- Ferguson, K.D.; Morin, K.A. The prediction of acid rock drainage—Lessons from the database. In Proceedings of the Second International Conference on the Abatement of Acidic Drainage, Montreal, QC, Canada, 16–18 September 1991; Quebec Mining Association: Quebec City, QC, Canada. [Google Scholar]
- Price, W.A.; Morin, K.; Hutt, N. Guidelines for the prediction of acid rock drainage and metal leaching for mines in British Columbia: Part II. Recommended procedures for static and kinetic testing. In Proceedings of the 4th International Conference on Acid Rock Drainage, Vancouver, BC, Canada, 31 May–6 June 1997; pp. 15–30. [Google Scholar]
- Sherlock, E.J.; Lawence, R.W.; Poulin, R. On the neutralization of acid rock drainage by carbonate and silicate minerals. Int. J. Rock Mech. Min. Sci. Geomech. Abstr. 1995, 32, 43–54. [Google Scholar] [CrossRef]
- GARD G 2.4. The Acid Generation Process; INAP: Atlanta, GA, USA, 2016. [Google Scholar]
- Benzaazoua, M.; Bussière, B.; Dagenais, A. Comparison of kinetic tests for sulfide mine tailings. In Proceedings of the English International Conference on Tailings and Mine waste 01, Fort Collins, CO, USA, 16–19 January 2001; Balkema: Danvers, MA, USA, 2001; pp. 263–272. [Google Scholar]
- Benzaazoua, M.; Bussière, B.; Dagenais, A.-M.; Archambault, M. Kinetic tests comparison and interpretation for prediction of the Joutel tailings acid generation potential. Environ. Geol. 2004, 46, 1086–1101. [Google Scholar] [CrossRef]
© 2019 by the authors. Licensee MDPI, Basel, Switzerland. This article is an open access article distributed under the terms and conditions of the Creative Commons Attribution (CC BY) license (http://creativecommons.org/licenses/by/4.0/).