Abstract
Ranked set sampling (RSS) has been proven an efficient alternative to simple random sampling (SRS). The use of auxiliary information also helps to improve the efficiency of the estimation procedures. Therefore, to accomplish higher efficiency and discuss the optimality issues, we proffer some optimal classes of estimators under RSS by employing multi-auxiliary information. It is seen that the ordinary mean estimator, traditional regression, and ratio estimators are the subsets of the proffered estimators. The expressions of the bias and mean square error are reported. An analytical comparison under some optimality conditions points out the ascendancy of the proffered classes of estimators over all reviewed works. The theoretical results have been furnished with computational study by employing some artificial and natural populations. The computational results show that the proffered estimators outperform the conventional estimators reviewed in this study. Furthermore, apposite advices are suggested to the survey persons.
MSC:
2020; 62D04
1. Introduction
In the survey literature, usually more efficient estimates can be obtained by making appropriate utilization of additional data pertaining to the supplementary variables linked to the study variable. The data associated with the auxiliary variables are used either at the evaluation phase or at the design phase or at both. The ratio, regression, and product methods of evaluation are utilized widely at the estimation stage, whereas stratification of population and choice of units with probability relative to the size of the units are used at the design phase. Sometimes in vast surveys, the efficacy of the estimation procedures may increase by accumulating information on several auxiliary variables. Ref. [1] was the first who envisaged the ratio estimator in SRS by considering multi-auxiliary information (MAI) correlated positively with the study variable. Subsequently, many renowned statisticians like [2,3,4,5,6,7,8,9] suggested some estimators in SRS by using MAI.
The primary goal of any surveyor during survey is to achieve the observational economy by utilizing frugal and effective sampling schemes. In this context, ref. [10] envisaged the thought of RSS as a cost proficient substitute of SRS without any numerical support to his thought. Ref. [11] put up the requisite numerical support to the RSS theory. The circumstances of perfectly ranked units in RSS were studied simultaneously by [10,11]. Ref. [12] proved that the ranked set sample mean is an unbiased estimator of the population mean when the units are ranked imperfectly and perfectly. Ref. [13] deduced the estimates of the parameters in simple linear regression using RSS. Ref. [14] proved that the efficiency of the ratio estimator can be enhanced by ranking the denominator variable. Ref. [15] suggested a ratio estimation of the population mean utilizing auxiliary information under SRS and median RSS. Ref. [16] investigated a double quartile RSS for computing the population ratio utilizing auxiliary information. Ref. [17] developed the ratio estimators of the population mean in case of missing values under RSS. Ref. [18] examined a ratio estimation approach based on multistage median RSS. Ref. [19] investigated a novel class of regression cum ratio estimators of population mean based on RSS. Some comprehensive studies based on RSS were presented by [20,21,22,23,24,25,26,27,28,29,30,31,32,33,34].
Furthermore, in extensive surveys, in the case of bivariate auxiliary information (BAI), ref. [35] deliberated the ratio type population mean estimators utilizing supplementary information in RSS. An enhanced ratio estimator consisting of BAI under RSS was analyzed by [36]. Refs. [37,38] discussed the improved ratio kind of estimators by using BAI in RSS. Ref. [39] investigated efficient population mean estimators based on BAI under RSS. Ref. [40] suggested some efficient population mean estimation methods under stratified RSS consisting of BAI.
Under the ranked set sampling framework, when multi-auxiliary information is available, then no prominent works are available till date. Therefore, we extended the multivariate version of the existing estimators as well as proffered our estimators using bivariate and multi-auxiliary information. The main contributions of this study to the existing body of knowledge is:
- (i).
- to provide some optimal classes of estimators based on multi-auxiliary information having the maximum relative efficiency and the least ,
- (ii).
- to provide a comparative study theoretically,
- (iii).
- to provide an extensive simulation study and a real data application for comparison with the existing estimators.
The further manuscript is designed in a few sections. Section 2 describes the sampling methodology and notations used throughout this study. Section 3 describes a concise review of the conventional estimators under RSS. The proffered estimators are suggested in Section 4 with the properties. The conditions of optimality are deduced by comparing the proffered estimators with the conventional aspirants in Section 5, whereas Section 6 comprises the computational study and discussion of the results administered to enhance the theoretical findings. The conclusion is drafted in Section 7.
2. Methodology and Notations
The methodology of RSS is consisting of drawing m simple random samples independently, m elements without replacement from the population of length N. Here, m is a design parameter known as set size which should kept small to avoid large ranking errors. Let the ranking be performed over the characteristic of either the research variable or the auxiliary variable. Suppose the research variable is notified by y and the auxiliary variables are notified by and , then trivariate random samples are drawn from the population and randomly allocated in m sets, all of length m. Every set is now ranked regarding one of the auxiliary variable or . Here, ranking is performed on the basis of the auxiliary variable . Now, from the first set, the element assigned the lowest rank of , along with the variables y and linked to the lowest rank of is quantified. From the second set of length m, the variables y and linked to the second lowest rank of are quantified. The above procedure is kept on until the y and values assigned the largest rank of are quantified from the set m. The above sampling process consummates one cycle. The iteration of this cycle with r count furnishes ranked set samples. Hence, in RSS, overall elements are extracted from the population out of which only elements are quantified for further study.
Let be a finite population having N identifiable units from which a ranked set sample of size n is quantified. Let , , and be, respectively, the population mean, population variance, and population coefficient of variation of the research variable y. The information on supplementary variables and are used to estimate the population mean . Let , and be the population mean, population variance, and population coefficient of variation of auxiliary variables and , respectively, which are supposed to be available. Let the ranking be carried out here over the auxiliary variable . Let and be, respectively, the judgement order statistics and denote the order statistics of a sample of size m in the cycle j of the variables y, and consist of ranked set sample quantified from the population . Here, the units are perfectly ranked according to , denoted by and therefore, ranking of y and are imperfect, denoted by , meaning thereby that they may not be sorted in the same order as that of .
To determine the mean square error () and bias of the proffered estimators, we assume the undermentioned terminologies in this paper.
Let be the error terms provided , , , and . Also,
where , , , , , , , , , , , , , , , , , , , , and .
Here, , , and are the ranked set sample mean of variables y, , and , respectively.
We elucidate that the quantities , , and rely upon order statistics from any particular distribution are taken from [41], but, when the error judgement orderings are absent, then the values , , and are taken as equal given that both auxiliary variables and , and the study variable y possess the identical distribution (see [12]).
3. Review
The present section discusses the prominent conventional estimators suggested under RSS by using BAI and MAI, respectively.
The traditional unbiased estimator of the population mean is considered under RSS as
When study and auxiliary variables are strongly positively correlated and when the regression line of y on and follows a straight line through the origin, then the ratio estimator is more effective. Considering this benefit, we define the RSS based conventional ratio estimator envisaged by [14] using BAI as
The conventional ratio estimator consisting of MAI is given by
Sometimes the study and auxiliary variables are linearly regressed but the regression line passes a location far from the origin. In such situations, the efficiency of the ratio estimator is very poor. Regression estimator is the best option in these situations. Therefore, on the lines of [42], we consider BAI and define the RSS based conventional regression estimator as
where and denote, respectively, the regression coefficients of y on and .
The conventional regression estimator consisting of MAI is defined as
where denotes the regression coefficient of y on , respectively.
Ref. [35] developed some ratio type estimators based on BAI as
where are properly selected scalars and .
The estimators of [35] consisting of MAI are defined as
where and are properly selected scalars and the sum of is 1.
Motivated by [1,36] suggested the ratio type estimator as
where and are properly selected scalars.
The estimator of [36] using MAI is stated as
Following [43], we define some RSS based ratio-cum-product type estimators using BAI as
where and are the coefficient of kurtosis of auxiliary variables and , respectively.
The above estimators utilizing MAI are prescribed as
where is the coefficient of kurtosis of supplementary variable .
Ref. [37] considered BAI and introduced the following estimators as
where and are properly selected scalars and , and are the weights such that .
The estimator of [37] based on MAI is expressed as
where is a properly selected scalars and are weights whose sum is 1.
Ref. [38] suggested the following estimator utilizing two auxiliary variables in RSS as
where and are properly selected scalars.
The estimator of [38] utilizing MAI is expressed as
where is a properly selected scalar.
Ref. [39] introduced the following estimators considering BAI under RSS as
where and are properly selected scalars and and are the same as defined earlier.
The estimator of [39] consisting of MAI is defined as
where is a properly selected scalars.
The of these estimators are reported in Appendix A.
4. Proposed Estimators
The inspiration of this study is to proffer some optimal classes of estimators as an optimal choice over the reviewed estimators. Motivated by [20], we extended the work of [21] using BAI and MAI and proffer some difference and ratio type estimators under RSS.
4.1. Proposed Estimators Using BAI
The proffered classes of estimators consisting of BAI are given as
where , , , , , and ; are properly selected scalars.
4.2. Proposed Estimators Using MAI
The proffered classes of estimators based on MAI are given as
where ; are properly selected scalars.
It can be easily seen that the class and are generalized classes of regression type estimators and we get the regression type estimators as their special cases by putting and . Similarly, the estimators and are generalized classes of ratio and product type estimators, and we get the ratio and product estimators as their special cases by putting , and , , respectively. Furthermore, the ratio cum product estimators can also be obtained by suitably choosing to be either −1 or +1. Similarly, it can be easily seen that the class and are generalized classes of ratio type estimators and we get the ratio estimators as their special cases by putting , and . Similarly, some other subclasses can also be provided.
4.3. Bias and Minimum MSE of the Proffered Estimators
Theorem 1.
The expressions of bias and minimum MSE of the proffered difference type estimators are given below as
where
Proof.
Appendix B contains the proof’s outline. □
Theorem 2.
The expressions of bias and minimum MSE of the proffered ratio type estimators are given below as
Proof.
Appendix B contains the proof’s outline. The definitions of , , and are given in Appendix B. □
The of the proposed estimator obtained in (1) depends on the values of and , while the of the proposed estimators obtained in (4) depends on the values of and , when the population size is large. In the numerical study section, following [44,45], we will examine the effect of the variations of the , , and values on the of the proposed estimators.
Corollary 1.
The proffered ratio type estimators are superior than the proffered difference type estimator , iff
and vice-versa. Otherwise, these are evenly effective provided that the equality sustains in (5).
5. Optimality Conditions
The minimum s of the suggested estimators and the reviewed estimators are theoretically compared in this part, and the optimality conditions are reported.
The proffered estimator dominates the usual mean estimator , if
The proffered estimators dominate the usual mean estimator , if
The proffered estimator dominates the usual ratio estimator , if
The proffered estimators dominate the usual ratio estimator , if
The proffered estimator dominates the usual regression estimator , ref. [35] estimator and [38] estimator if
The proffered estimators dominate the usual regression estimator , ref. [35] estimator and [38] estimator if
The proffered estimator dominates [35] estimator , if
The proffered estimators dominate [35] estimator , if
The proffered estimator dominates [36] estimator , if
The proffered estimators dominate [36] estimator , if
The proffered estimator dominates [43] estimator , if
The proffered estimators dominate [43] estimator , if
The proffered estimator dominates [43] estimator , if
The proffered estimators dominate [43] estimator , if
The proffered estimator dominates [43] estimator , if
The proffered estimators dominate [43] estimator , if
The proffered estimator dominates [43] estimator , if
The proffered estimators dominate [43] estimator , if
The proffered estimator dominates [37] estimator , if
The proffered estimators dominate [37] estimator , if
The proffered estimator dominates [39] estimator , if
The proffered estimators dominate [39] estimator , if
6. Computational Study
Four subsections—a numerical study utilizing real populations, a simulation study utilizing real populations, a simulation study utilizing artificially created populations, and a discussion of computational results are used to conduct a computational study in the current section.
6.1. Numerical Study Utilizing Real Populations
To exemplify the practicability of the proffered classes of estimators in real life scenarios, we carry out a numerical study by utilizing some real populations. These populations are discussed hereunder.
Population 1:
Origine: [46], page no. 662–665, = 1983 import (in millions of U.S. dollar), = 1983 export (in millions of U.S. dollars), y = 1983 population (in millions), = 14,604.49, = 14,276.03, = 36.6516, , , , , , , and N = 124.
Population 2:
Origine: [47] page no. 1115, y = 1996 seasonal average price (in U.S. dollar) per pound, = 1995 seasonal average price (in U.S. dollar) per pound, = 1994 seasonal average price (in U.S. dollar) per pound, = 0.2032, = 0.1856, = 0.1708, , , , , , , and N = 36.
Population 3:
Origine: [47], page no. 1116, y = quantity of fish caught in 1995, = quantity of fish caught in 1994, = quantity of fish caught in 1993, = 4514.89, = 4954.43, = 4591.07, , , , , , , and N = 69.
Population 4:
Origine: [46], page no. 652–659, y = real estate values as per 1984 assessment (in millions of kroner), = 1975 population (in thousand), = number of municipal employees in 1984, = 3077.52, = 29.28, = 1779.06, , , , , , , and N = 284.
We quantify a ranked set sample with m = 3 and r = 4 provided = 12 units from Populations 1–4. The and percent relative efficiency (PRE) are tabulated for each population utilizing the formula given as
The numerical results are shown by and PRE in Table 1.

Table 1.
Results of numerical study for real populations.
For a detailed analysis of the values of the proposed estimators computed using (1) and (4), we examine the values for different values of , , and using Population 1 as shown in Figure 1, Figure 2 and Figure 3. We observe the effect of the values when , , and values increase. Note that when increases, increases, while and increases, decrease.
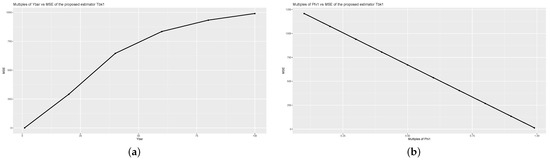
Figure 1.
Graph of (a) Multiples of and of estimator (b) Multiples of and of estimator for the Population 1.
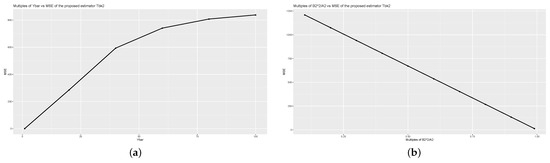
Figure 2.
Graph of (a) Multiples of and of estimator (b) Multiples of and of estimator for the Population 1.
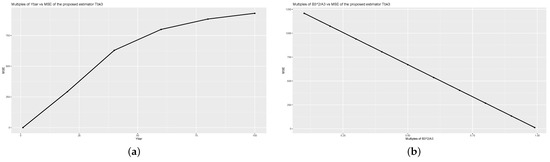
Figure 3.
Graph of (a) Multiples of and of estimator (b) Multiples of and of estimator for the Population 1.
In Figure 1, Figure 2 and Figure 3, for graphs (a), we multiply by 1 to 100, and for graphs (b), we vary and from 0.1 to 0.99, given on x-axis. The values are shown on the y-axis. From Figure 1, Figure 2 and Figure 3, we observe that the increasing values of increase the values, while the increasing values of and , decrease the values of the proposed estimators. From these results, an optimal point might be found to obtain the minimum for the data sets. The similar effect can be shown using other data sets.
Furthermore, the efficiency conditions obtained in Section 5 are numerically illustrated in Table 2 using the real Population 1.
Table 2.
Numerical illustration of the efficiency conditions obtained in Section 5 using Population 1.
6.2. Simulation Study Utilizing Real Populations
To extrapolate the numerical results, we administer a simulation study by utilizing real populations. The simulation study is based on the following points.
- (i).
- Take the natural populations reported in Section 6.1.
- (ii).
- Select a ranked set sample with r = 4 and m = 3 so that size units using RSS from every population.
- (iii).
- Obtain the necessary summary statistics.
- (iv).
- Repeat the aforementioned steps 15,000 times and tabulate the and PRE for each population.
The simulated PRE is tabulated as
Table 3 lists the results of the simulation study by and PRE for each real population.
Table 3.
Results of simulation study for real populations.
6.3. Simulation Study Using Artificially Drawn Populations
In the sequence of having better perception about the proffered estimators regarding the reviewed estimators, a simulation experiment has been executed utilizing artificially drawn populations which are discussed below.
Population 1:
The trivariate population having N = 500 is generated from the multivariate normal distribution using R language with parameters = 15, = 20, , = 5, = 6, , and varying amount of correlation coefficients , and in between their respective subscripts.
Population 2:
The trivariate population of size N = 500 is generated using Weibull distribution such that Weibull(2, 3), N(0, 1), = 1.5 and y = 1.2 + 0.2 + e where .
Population 3:
The trivariate population of size N = 500 is generated using gamma distribution such that Gamma(2.5, 1), N(0, 1), = 1.5 and where .
Population 4:
The trivariate population of size N = 500 is generated utilizing an exponential distribution provided that Exponential(1.2), N(0, 1), = 1.5 and where .
Population 5:
The trivariate population having N = 500 is generated employing -distribution provided , N(0, 1), = 1.5 and where .
Taking RSS methodology into consideration, we select a ranked set sample of length n = 12 with r = 4 and m = 3 from each population. Using 15,000 repeated samples, the and PRE of the proffered estimators are calculated for each population and the outcomes are disclosed from Table 4 to Table 5. The simulation study is described in the points as:
Table 4.
Results of simulation study for first artificially generated population.
Table 5.
Results of simulation study for artificially generated Populations 2–5.
- (i).
- Quantify simple random samples from the parent population with replacement.
- (ii).
- Extract ranked set sample by utilizing the RSS methodology.
- (iii).
- Calculate the required statistics.
- (iv).
- Calculate the and PRE of several estimators by repeating the prior points 15,000 times.
The simulated and PRE are calculated as
6.4. Discussion of Computational Findings
After carefully observing the results of the computational study revealed from Table 1, Table 2, Table 3, Table 4 and Table 5, we draw the following discussion.
- (i).
- The numerical findings tabulated using real populations are displayed in Table 1 that show that the proffered estimators repress the existing estimators , , , , , , and by lowest and highest PRE.
- (ii).
- The simulation findings displayed in Table 3 for real populations show that the proffered estimators are found to be superior than the existing estimators.
- (iii).
- The simulation findings displayed in Table 4 for the artificially generated normal population exhibit that the proffered estimators attain the lowest and highest PRE regarding the existing estimators for various values of correlation coefficients. Moreover, it is also observed that the decreases as the correlation coefficient increases and vice versa in the sense of PRE.
- (iv).
- From Table 5 consisting of the findings of the simulation study for artificially generated asymmetric populations, the proffered estimators repress the conventional estimators with the lowest and highest PRE.
- (v).
- Moreover, from the findings of Table 1, Table 4 and Table 5 consisting of a numerical study using real populations and a simulation study using artificially generated populations, the proffered estimator is established to be superior among the proffered classes of estimators whereas the proffered estimator is found to be superior among the proffered classes of estimators from the results of Table 3 based on simulation study using real populations.
7. Conclusions
The present article has considered some optimal classes of estimators under RSS based on MAI with their properties. It is noteworthy that the conventional mean estimator, conventional regression and ratio estimators, and [35] estimators are found out to be the subclass of the proffered classes of estimators for properly selected values of the characterizing scalars as discussed in Section 4. The conditions of optimality have been determined under which the proffered estimators prevail on the conventional aspirants. From the results of the computational study, it is observed that the proffered classes of estimators exhibit their dominance by the lowest and highest PRE over the existing estimators, namely, usual mean estimator , conventional ratio estimator , conventional regression estimator , ref. [35] estimators , , ref. [36] estimator , ref. [43] estimators , ref. [37] estimator , ref. [38] estimator , ref. [39] estimator owing to the satisfaction of the optimality conditions derived in Section 5. Thus, the ensured deportment of the proffered classes of estimators will encourage the survey persons to consider the suggested classes of estimators for real life use, whenever MAI is available.
The proffered optimal classes of estimators can also be developed for the imputation of missing data under different sampling designs and it is the authors next supervision of this work.
Author Contributions
Supervision, S.B.; conceptualization, S.B. and A.K.; methodology, S.B. and A.K.; software, A.K.; validation, A.K.; writing—original draft preparation, A.K.; writing—review and editing, S.B., A.K., N.A., M.S.M. and M.M.A.; project administrator, N.A.; funding acquisition, N.A. All authors have read and agreed to the published version of the manuscript.
Funding
This research is supported by researchers supporting project number (RSPD2023R548), King Saud University, Riyadh, Saudi Arabia.
Data Availability Statement
The data that used in this study is available within the paper.
Acknowledgments
The authors are grateful for the support by researchers supporting project number (RSPD2023R548), King Saud University, Riyadh, Saudi Arabia.
Conflicts of Interest
The authors say they have no competing interest.
Appendix A
The unbiased estimator’s is expressed as
The conventional ratio estimator’s and is expressed as
The conventional regression estimator’s and is expressed as
Partially differentiating the regarding and , and regarding and equating to 0, we get the optimum values of scalars , and as
Putting the optimum values of , in the and in the , we get the minimum s as
The estimator’s and is expressed as
Partially differentiating the regarding , and , and regarding and equating to 0, we get the optimum values of scalars , , , , , and as
Putting the optimum values of , , , and in the , and the optimum value of and in the , we get the minimum as
The estimator’s and is
Partially differentiating the regarding and , and regarding and equating to 0, we get the optimum values of scalars , , and as
Putting the optimum values of and in the , and the optimum value of in the , we get the minimum as
The estimator’s , k = 1,2,3,4 are
where , , , , , , , , , , , and .
The estimator’s and minimum is expressed by
where
The estimator’s and minimum is expressed by
where , and .
It was noticed that the minimized of [35] estimators , and [38] estimators , attains the minimized of the conventional regression estimator and , respectively.
Appendix B
The outline of the proof of Section 4.3 is discussed below.
We consider the estimator as
Taking the terminologies explained in Section 2 into consideration, we rewrite the estimator as
If we consider the expectations on both sides of (A1), we obtain
If we consider the square and expectation to each side of (A1), we obtain
The optimum values of , and can be determined by partially differentiating (A2) w.r.t , , and , and equating to 0 as
Putting , and in (A2), we get the minimized as
Similarly, the minimum of the estimator is determined as
where
Similarly, the estimator’s is provided as
which can be expressed by
Now partially differentiating (A3) w.r.t. and equating to 0, we get
Putting the value of in (A3), we get
In similar lines, we can derive the of other proffered estimators . In particular, we can write
The is optimized for as
where
The optimum values of are tabulated as
References
- Olkin, I. Multivariate ratio estimation for finite population. Biometrika 1958, 43, 154–163. [Google Scholar] [CrossRef]
- Raj, D. On a method of using multiauxiliary information in sample survey. J. Am. Stat. Assoc. 1965, 62, 270–277. [Google Scholar] [CrossRef]
- Shukla, G.K. An alternative multivariate ratio finite population. Calcutta Stat. Assoc. Bull. 1966, 15, 127–134. [Google Scholar] [CrossRef]
- Rao, P.S.R.S.; Mudholkar, G.S. Generalized multivariate estimator for the mean of finite populations. J. Am. Stat. Assoc. 1967, 15, 1009–1012. [Google Scholar] [CrossRef]
- Srivastava, S.K. An estimator of the mean of a finite population using several auxiliary variables. J. Ind. Stat. Assoc. 1965, 3, 189–194. [Google Scholar]
- Srivastava, S.K. A generalized estimator for the mean of a finite population using multi-auxiliary information. J. Am. Stat. Assoc. 1971, 66, 404–407. [Google Scholar] [CrossRef]
- Robinson, P.M. A class of estimators for the mean of a finite population using auxiliary information. Sankhya B 1994, 56, 389–399. [Google Scholar]
- Tracy, D.S.; Singh, H.P.; Singh, R. An alternative to the ratio-cum-product estimator in sample surveys. J. Stat. Plan. Inference 1995, 53, 375–387. [Google Scholar] [CrossRef]
- Diana, G.; Perri, P.F. Estimation of finite population mean using multi-auxiliary information. Int. J. Stat. 2007, 65, 99–112. [Google Scholar]
- McIntyre, G.A. A method of unbiased selective sampling using ranked set. Aust. J. Agric. Res. 1952, 3, 385–390. [Google Scholar] [CrossRef]
- Takahasi, K.; Wakimoto, K. On unbiased estimates of the population mean based on the sample stratified by means of ordering. Ann. Inst. Stat. Math. 1968, 20, 1–31. [Google Scholar] [CrossRef]
- Dell, T.R.; Clutter, J.L. Ranked set sampling theory with order statistics background. Biometrics 1972, 28, 545–555. [Google Scholar] [CrossRef]
- Muttlak, H.A. Parameter estimation in simple linear regression using ranked set sampling. Biom. J. 1995, 37, 799–810. [Google Scholar] [CrossRef]
- Samawi, H.M.; Muttlak, H.A. Estimation of ratio using ranked set sampling. Biom. J. 1996, 38, 753–764. [Google Scholar] [CrossRef]
- Al-Omari, A.I. Ratio estimation of the population mean using auxiliary information in simple random sampling and median ranked set sampling. Stat. Probab. Lett. 2012, 82, 1883–1890. [Google Scholar] [CrossRef]
- Al-Omari, A.I.; Gupta, S. Double quartile ranked set sampling for estimating population ratio using auxiliary information. Pakistan J. Stat. 2014, 30, 513–535. [Google Scholar]
- Al-Omari, A.I.; Bouza, C. Ratio estimators of the population mean with missing values using ranked set sampling. Environmetrics 2015, 26, 67–76. [Google Scholar] [CrossRef]
- Al-Omari, A.I.; Al-Nasser, A.D. Ratio estimation using multistage median ranked set sampling approach. J. Stat. Theory. Pract. 2018, 12, 512–529. [Google Scholar] [CrossRef]
- Khan, L.; Shabbir, J.; Khalil, A. A new class of regression cum ratio estimators of population mean in ranked set sampling. Life Cyc. Relia. Safety Eng. 2019, 8, 201–204. [Google Scholar] [CrossRef]
- Bhushan, S.; Kumar, A. New efficient logarithmic estimators using multi-auxiliary information under ranked set sampling. Concurr. Comput. 2022, 34, e7337. [Google Scholar] [CrossRef]
- Bhushan, S.; Kumar, A. On optimal classes of estimators under ranked set sampling. Commun. Stat. Theory Methods 2022, 51, 2610–2639. [Google Scholar] [CrossRef]
- Bhushan, S.; Kumar, A. Novel log type class of estimators under ranked set sampling. Sankhya B 2022, 84, 421–447. [Google Scholar] [CrossRef]
- Bhushan, S.; Kumar, A. Predictive estimation approach using difference and ratio type estimators in ranked set sampling. J. Comput. Appl. Math. 2022, 410, 114214. [Google Scholar] [CrossRef]
- Bhushan, S.; Kumar, A. An efficient class of estimators based on ranked set sampling. Life Cyc. Relia. Safety Eng. 2022, 11, 39–48. [Google Scholar] [CrossRef]
- Bhushan, S.; Kumar, A. On the quest of optimal class of estimators using ranked set sampling. Sci. Iran. 2022; in press. [Google Scholar] [CrossRef]
- Bhushan, S.; Kumar, A.; Lone, S.A. On some novel classes of estimators under ranked set sampling. AEJ Alex. Eng. J. 2022, 61, 5465–5474. [Google Scholar] [CrossRef]
- Zamanzade, E.; Mahdizadeh, M. Entropy estimation from ranked set samples with application to test of fit. Rev. Colomb. Estad. 2017, 40, 223–241. [Google Scholar] [CrossRef]
- Zamanzade, E.; Wang, X. Proportion estimation in ranked set sampling in the presence of tie information. Comput. Stat. 2018, 33, 1349–1366. [Google Scholar] [CrossRef]
- Mahdizadeh, M.; Zamanzade, E. Interval estimation of P(X<Y) in ranked set sampling. Comput. Stat. 2018, 33, 1325–1348. [Google Scholar]
- Mahdizadeh, M.; Zamanzade, E. Estimation of a symmetric distribution function in multistage ranked set sampling. Stat. Papers. 2019, 61, 851–867. [Google Scholar] [CrossRef]
- Mahdizadeh, M.; Zamanzade, E. Using a rank-based design in estimating prevalence of breast cancer. Soft Comput. 2022, 26, 3161–3170. [Google Scholar] [CrossRef]
- Rehman, S.A.; Shabbir, J. An efficient class of estimators for finite population mean in the presence of non-response under ranked set sampling (RSS). PLoS ONE 2022, 17, e0277232. [Google Scholar] [CrossRef] [PubMed]
- Koçyiğit, E.G.; Kadilar, C. Ratio estimators for ranked set sampling in the presence of tie information. Commun. Stat. Simul. Comput. 2022, 51, 6826–6839. [Google Scholar] [CrossRef]
- Koçyiğit, E.G.; Rather, K.U.I. The new sub-regression type estimator in ranked set sampling. J. Stat. Theory Pract. 2023, 17, 27. [Google Scholar] [CrossRef]
- Abu-Dayyeh, W.A.; Ahmed, M.S.; Ahmed, R.A.; Muttlak, H.A. Some estimators for the population mean using auxiliary information under ranked set sampling. J. Mod. Appl. Stat. Methods 2009, 8, 253–265. [Google Scholar] [CrossRef]
- Mehta, N.; Mandowara, V.L. Improved ratio estimators using two auxiliary variables in raked set sampling. J. Int. Acad. Res. Multidiscip. 2014, 2, 2320–5083. [Google Scholar]
- Khan, L.; Shabbir, J. Improved ratio type estimators of population mean in ranked set sampling using two concomitant variables. Pakistan J. Stat. Oper. Res. 2016, 12, 507–518. [Google Scholar] [CrossRef]
- Khan, L.; Shabbir, J. Generalized exponential-type ratio-cum ratio estimators of population mean in ranked set and stratified ranked set sampling. J. Stat. Manag. Syst. 2017, 20, 133–151. [Google Scholar] [CrossRef]
- Khan, L.; Shabbir, J.; Khan, S.A. Efficient estimators of population mean in ranked set sampling scheme using two concomitant variables. J. Stat. Manag. Syst. 2019, 22, 1467–1480. [Google Scholar] [CrossRef]
- Bhushan, S.; Kumar, A.; Shahab, S.; Lone, S.A.; Akhtar, M.T. On efficient estimation of population mean under stratified ranked set sampling. J. Math. 2022, 2022, 6196142. [Google Scholar] [CrossRef]
- Arnold, B.C.; Balakrishnan, N.; Nagaraja, H.N. A First Course in Order Statistics; Wiley: New York, NY, USA, 1993. [Google Scholar]
- Yu, P.L.H.; Lam, K. Regression estimator in ranked set sampling. Biometrics 1997, 53, 1070–1080. [Google Scholar] [CrossRef] [PubMed]
- Mehta, N.; Mandowara, V.L. A modified ratio-cum-product estimator of finite population mean using ranked set sampling. Commun. Stat. Theory Methods 2016, 45, 267–276. [Google Scholar] [CrossRef]
- Cekim, H.O.; Kadilar, C. ln-type variance estimators in simple random sampling. Pakistan J. Stat. Oper. Res. 2020, 16, 689–696. [Google Scholar] [CrossRef]
- Cekim, H.O.; Kadilar, C. ln-type estimators for the population variance in stratified random sampling. Commun. Stat. Simul. Comput. 2020, 49, 1665–1677. [Google Scholar] [CrossRef]
- Sarndal, C.E.; Swensson, B.; Wretman, J. Model Assisted Survey Sampling; Springer: New York, NY, USA, 2003. [Google Scholar]
- Singh, S. Advanced Sampling Theory with Applications: How Michael Selected Amy; Kluwer: Amsterdam, The Netherlands, 2003; Volume 1–2. [Google Scholar]


Disclaimer/Publisher’s Note: The statements, opinions and data contained in all publications are solely those of the individual author(s) and contributor(s) and not of MDPI and/or the editor(s). MDPI and/or the editor(s) disclaim responsibility for any injury to people or property resulting from any ideas, methods, instructions or products referred to in the content. |
© 2023 by the authors. Licensee MDPI, Basel, Switzerland. This article is an open access article distributed under the terms and conditions of the Creative Commons Attribution (CC BY) license (https://creativecommons.org/licenses/by/4.0/).