Abstract
A deregulated electricity market provides open access to all market players. In an open-access power market, the system operator is responsible for ensuring that all contracted power is dispatched. However, if this results in line flows that exceed their acceptable range, then it could threaten the system’s security. Therefore, the system operator checks for congestion as the line flow exceeds its limit. For congestion management, the system operator applies different curtailment strategies to limit the requested transaction. Therefore, in this work, an optimal power dispatch model has been presented in order to reduce the curtailment of requested power. A modified moth flame optimization technique has been implemented to frame this OPD model. The impact of congestion management on power dispatch has been analyzed, considering bilateral and multilateral dispatch in an electricity market. In addition, the effect of FACTS devices on reducing congestion and curtailing power is studied. Verification studies showed that the proposed solution reduces congestion costs by 27.14% and 29.4% in 14- and 30-bus systems, respectively. It has been verified that the MMFO approach with the FACTS device improves transaction deviations and ensures that the deregulated system provides secure energy with less cost reflected on the customers.
Keywords:
deregulated power market; optimal power dispatch; modified moth flame optimization algorithm; FACTS; congestion management; load curtailment MSC:
93C99; 97M50; 97R99
1. Introduction
Around the globe, electric power utilities are apparently going through restructuring and adopting a deregulated market strategy. This deregulation structure makes the electrical system more competitive. This competitiveness among the market players eases the way for power trading. It will enhance industrial sector productivity and minimize the cost of electrical energy for all customers [1]. Market participants such as power producers, consumers, and system operators will benefit from a deregulated energy market. However, the energy market has a lot of issues like generation loss, line outages, etc. [2,3]. The restructuration of the electric market has led to extensive use of transmission systems for power trading. To obtain an incorporated operation in a deregulated system, there has to be relevant formulation between regulating agencies, such as pool operators or system operators.
The main aim of a system operator is to provide reliable service and maintain system security [4]. However, there are numerous obstacles to executing the deregulation plans due to the increased number of market participants. The system operators are now confronted with an additional problem, termed as congestion, as a result of the increased participants. In this deregulated energy market, the generating companies sell energy to customers under an energy contract [5]. For energy transfer, the transmission lines used by these GENCOs are the existing ones. As a result, there may be a chance of overloading the transmission line due to bad weather, bilateral transactions, etc., and GENCOs are unable to send contracted energy to customers. This situation becomes congested, and the main reason behind this is overloading conditions, mismatches between demand and generation, and unexpected rises in demand [6]. Congestion management is a cost-effective alternative to network expansion, which is the only way to keep up with rising demand. It is nothing but the reduction of extra electricity flowing via overloaded transmission lines [7,8,9]. By managing congestion in a proper way, contracted energy can be transmitted without violating system constraints. In this paper, congestion is managed by applying three different curtailment strategies, namely group curtailment, separate curtailment, and point-by-point curtailment, and the OPD problem has been formulated in order to reduce the curtailment of requested power.
In a deregulated electricity market, so many participants take part in power trading, which increases the number of power contracts made between GENCOs and customers. This leads to transmission network congestion as the GENCOs need to send contracted energy to customers using the same transmission line. Therefore, to minimize congestion in the transmission network, congestion management has to be done by the system operators in the present era. This congestion can be relieved in the process of rescheduling and dispatching either by including line constraints or by redirecting the power flow with FACTS devices or energy routers [10,11,12,13]. The authors in [14,15] proposed two methodologies based on optimal power flow and available transfer capability using locational marginal prices and congestion rent contributions for mitigation of congestion in a bilateral dispatch-deregulated environment. In [16], Verma et al. suggested an algorithm for teaching learning-based optimization techniques in a pool-structured power market for minimizing the deviation in generation and its corresponding congestion cost, considering various operational constraints.
Congestion management is done by curtailing requested power transactions [17,18], where the authors provide an approach for power dispatch applying different curtailment strategies in a competitive electricity market. To minimize the transaction deviation, the authors in [19] made an optimal power flow model for a restructured power market with different contracts like bilateral, multilateral, and firm contracts. The strategy for congestion management has been developed by authors [20,21] considering transmission dispatch methodology in an open market environment where pool dispatch, bilateral dispatch, and multilateral dispatch were done. For mitigating congestion, authors in [22,23] provide two methods: LMPD and congestion rent based on pricing. The authors in [24,25] analyze the impact of congestion management in a deregulated electricity market.
The above-mentioned literature has not focused on FACTS devices, which play a vital role in maintaining the voltage profile and power flow and hence controlling congestion in transmission lines. The congestion can be managed by employing different series and shunt FACTS devices in the transmission network. For controlling congestion, the optimal location of different FACTS devices in different bus systems, considering constraints [26,27,28], has been analyzed by the authors. These papers mostly focus on FACTS devices like SVC, TCSC, etc. In general, series and shunt FACTS devices are utilized to manage power flow and improve voltage profiles. Whereas the combination of both series and shunt devices like UPFC allows for continuous control of all these factors. Some work has been done by the authors to reduce congestion by employing UPFC [29,30,31]. From the literature [24,25,26,27,28,29,30,31], which utilized different FACTS devices, it is observed that the UPFC FACTS device plays a vital role in controlling congestion. Additionally, Table A1 summarizes and compares the relevant studies in order to categorize the research conducted and works evaluated in the literature.
As the power system consists of non-linear equations, to tackle congestion management, optimization approaches have been used to make it simpler. Various optimization approaches, such as the Firefly algorithm [32], the adaptive particle swarm optimization algorithm [33], the satin bowerbird optimization algorithm [34], and particle swarm optimization [35], were utilized for managing congestion situations in different systems. To reduce transmission line overloading, congestion management has been carried out using gray-wolf optimization techniques [36].
From the literature study, it is observed that many optimization techniques as well as many congestion control techniques have been proposed for mitigating congestion in the transmission network, which yields reductions in congestion cost and loss. Still, there is scope for amplifying the quality of the solution in terms of reducing transaction curtailment, loss, and rescheduling costs. Therefore, in this work, UPFC is utilized for the first time with the Modified Moth Flame Optimization (MMFO) technique to control the congestion occurring in the transmission network.
Paper Contribution
- This paper implements the MMFO technique for reducing the curtailment in power transactions to provide contract power dispatch requested by market participants.
- Congestion management is performed by employing three different curtailment strategies: group curtailment, separate curtailment, and point-to-point curtailment.
- Effectively reduces the overload in the transmission line by employing UPFC.
- The use of FACTS devices reduces the total cost of rescheduling by 27.14% and 29.4% in 14-bus and 30-bus systems, respectively.
2. Problem Formulation
2.1. Mathematical Modeling of Optimal Power Dispatch
In the deregulated electricity market, the optimal power dispatch model has been formulated to minimize the deviation from the contract power transaction required by market utilities. At the same time, the different operational equality and inequality constraints have to be satisfied for making all the transaction without curtailment.
The mathematical formulation for this optimal power dispatch model [6] can be written as:
And the constraints for the problem formulation are:
Equations (2) and (3) represent the equality constraints, and Equations (4)–(6) are the inequality constraints, respectively.
2.2. Power Transactions in a Deregulated Environment
In the case study, different types of transactions are analyzed. These are (a) bilateral transactions and (b) multilateral transactions.
Bilateral Transaction: here the power dispatch is made between a particular GENCO and a particular DISCO without the interference of a third party.
Multilateral Transaction: It is an extension of bilateral dispatching. Here, the dispatch is done by energy brokerage operators to reduce the risk and involves more than two market utilities.
Consider a power system having n number of buses among them, where the first m buses are considered generator buses and the remaining (n-m) buses are considered load buses. For simplicity, bus-1 is chosen as the slack bus, which is taken into account for compensating transmission loss.
In the case of a bilateral contract, a particular GENCO injects a certain amount of power at one generating bus, and a particular DISCO takes this power at another load bus. Whereas in a multilateral contract, the total power injection by a set of GENCOs at a set of generating buses equals the total power taken by a set of DISCOs at another set of load buses.
Thus, for the individual and group contracts, the active power injection at bus-i and extraction at bus-j can be given as follows:
For the bilateral and multilateral contracts, the power balance equations are:
2.3. Congestion Management by Using Curtailment Strategies
There are different curtailment strategies [10], which are put into operation by the system operator in alliance with the market utilities for optimal power dispatch. The curtailment strategy used for bilateral contracts is point-to-point curtailment. The curtailment strategies used for multilateral contracts are group curtailment and separate curtailment strategies.
In a point-to-point curtailment strategy, the curtailment of requested power injected at a GENCO must be the same as the curtailment of requested power extracted at a DISCO. In this case, the objective function becomes
where, is the willingness-to-pay price factor used in bilateral contracts between ( for avoiding curtailment.
In a group curtailment strategy, the main aim is to provide the requested power without any curtailment, although individual generators inside that group have to be rescheduled, and when curtailment is needed, it must spread among the participants of that group. So the objective function for the optimal dispatch problem becomes
where, is the willingness-to-pay price factor used in gth group transfer for avoiding curtailment.
In a separate curtailment strategy, the concern is to minimize the change at every GENCO and DISCO of the concerned group based upon the willingness-to-pay factor, considering the group power balance constraint. For this objective function becomes
where, is willingness-to-pay price factor of power injection for avoiding curtailment.
3. Facts Devices for Modeling of Optimal Power Dispatch
FACTS devices are inherently capable of operating the power systems in a safe, economical, flexible, and advanced way. Generating systems, which tend to have a bulk flow of power, are having subsequently higher losses and a decrease in safety and stability factors. In addition, there are many constraints arising because of potential outages. Under these circumstances, FACTS devices are efficient in making necessary improvements to the system’s performance by regulating the power flow in the system. In general, series and shunt FACTS devices are utilized to manage power flow and improve voltage profiles [26,27,28]. Whereas the combination of both series and shunt devices like UPFC [37] allows for continuous control of all these factors.
In this work, the optimal power-dispatch problem is formulated, including FACTS devices in the system. In the present scenario of a deregulated system, as the number of independent GENCOs increases, the power system requires a more advanced version of power control. So, here, UPFC [37] has been used for controlling the power flow and improving the line loading in comparison to the other FACTS devices like SVC and TCSC [28]. The optimal location of UPFC is found optimally in different bus systems [29], where it improves line loading by minimizing transmission congestion.
Modeling of UPFC
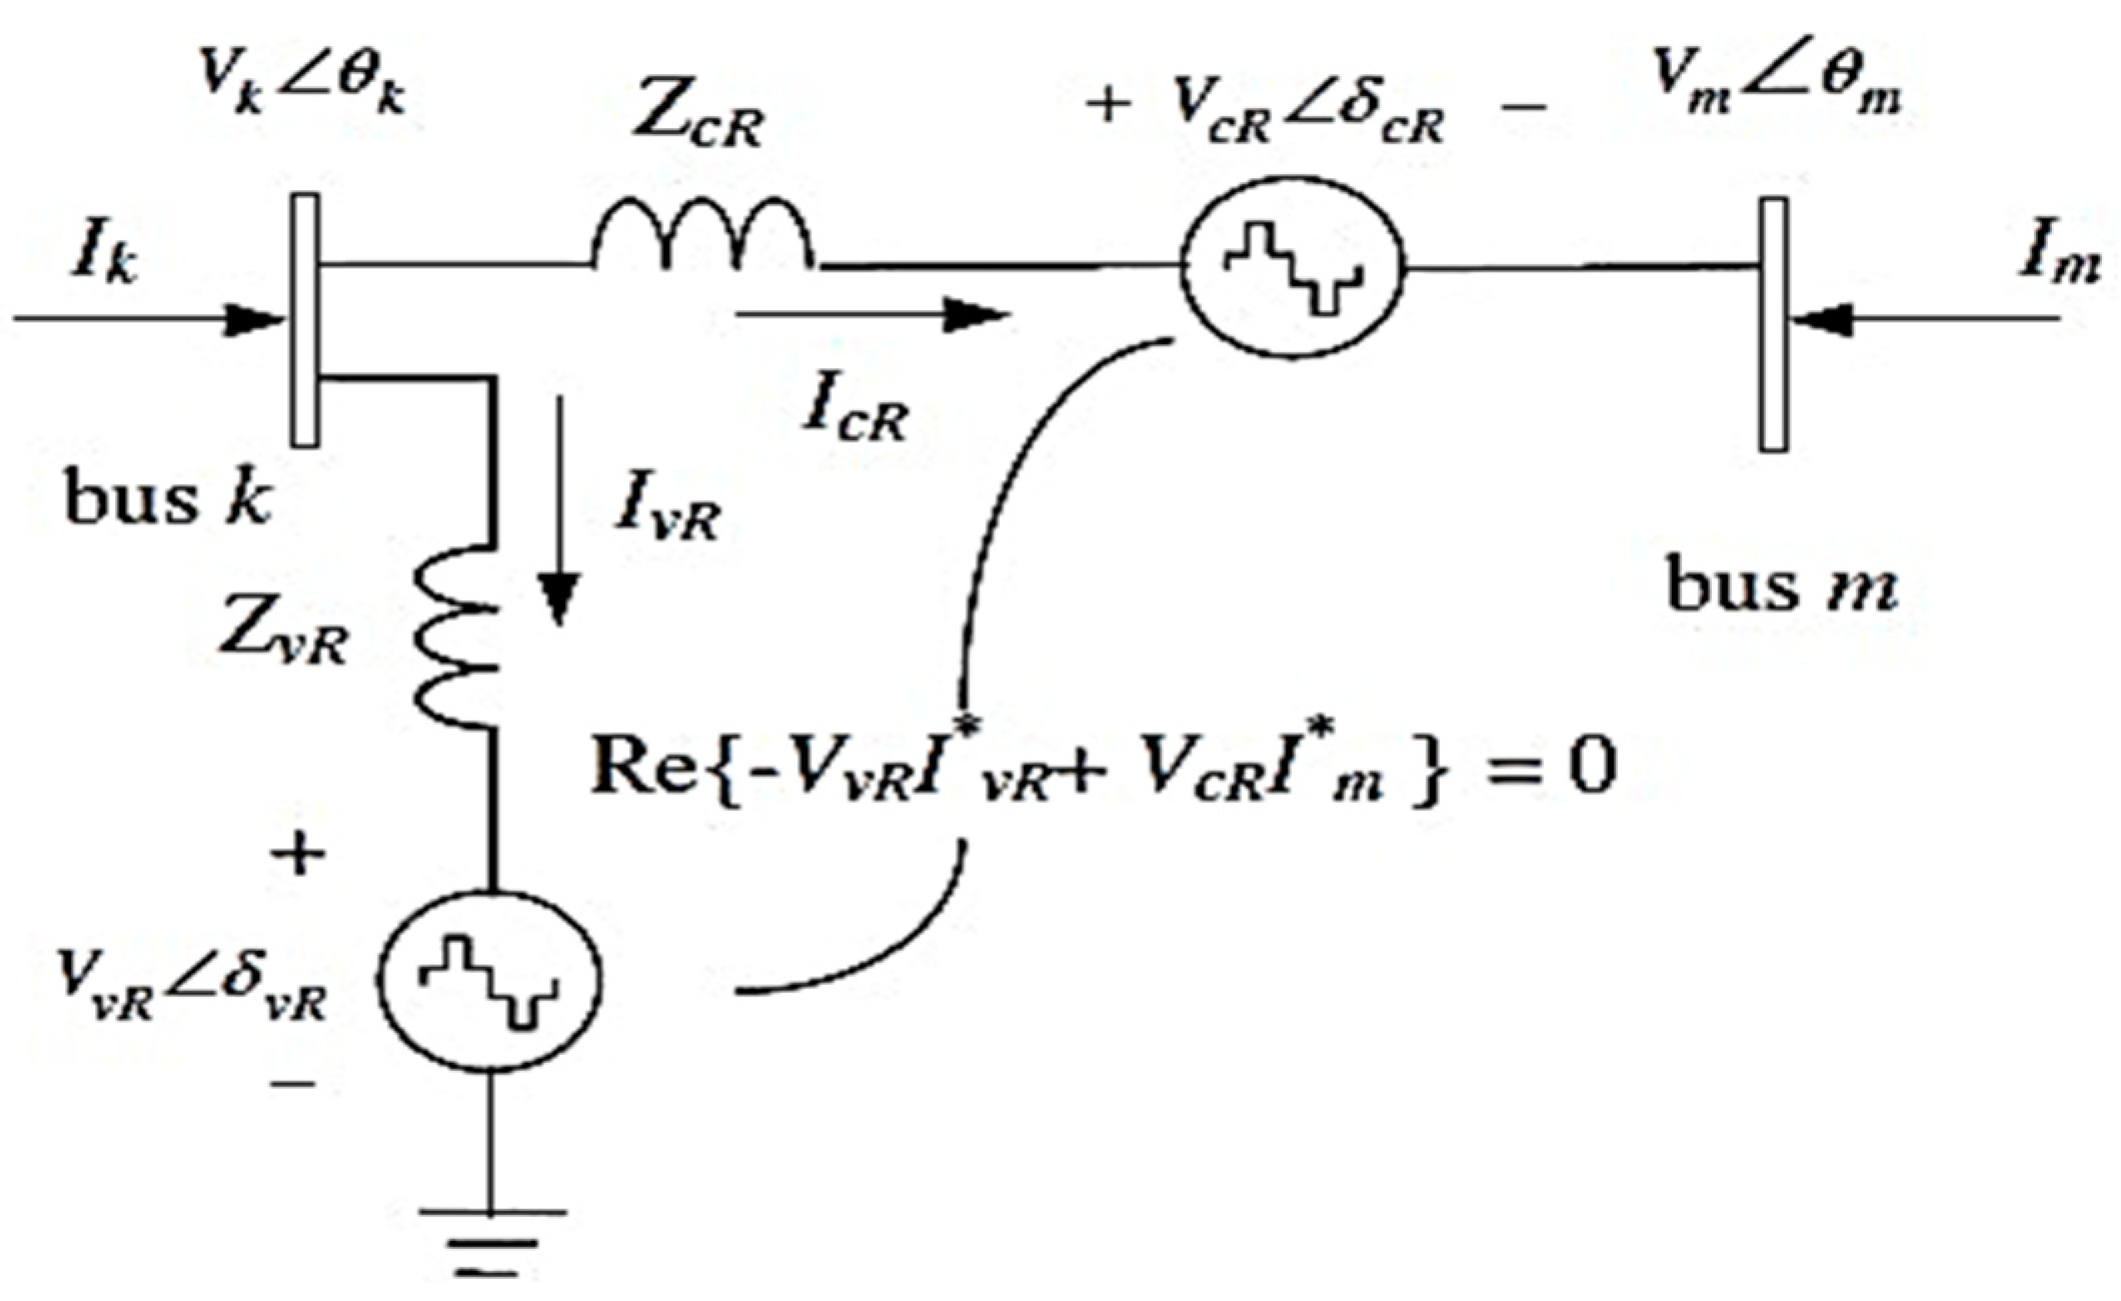
The circuit of UPFC consists of two voltage sources, as shown in Figure 1. The UPFC voltage sources are:
where, is the controllable magnitude of the voltage source of the shunt converter, which must lie in the range () and is the controllable phase angle of the voltage source of the shunt converter, which lies in the range (. Likewise and are the voltage magnitude and phase angle of the series converter, and their corresponding controllable limits are () and (), respectively. The phase angle of the series injected voltage determines the mode of power flow control.
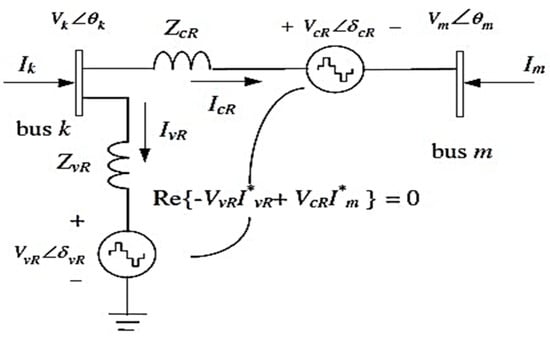
Figure 1.
Equivalent circuit of UPFC.
Based on the equivalent circuit as shown in Figure 1, the active and reactive power equations are given as follows:
At bus-k:
At bus-m:
Series Converter:
Shunt Converter:
After inserting UPFC, it injects real and reactive power ( and the equality constraints become
4. MFO Algorithm
The MFO technique [38] is an absolutely creative and inspirational technique based on natural instinct. This technique is growing day by day because of its better convergent results. The MFO algorithm is quite efficient at solving optimization problems and exploring the global best solution. Its application in different problem formulations like optimal power flow, reactive power, and economic power dispatch has been studied in [39,40,41,42]. Due to the better results obtained in the literature, the MFO technique is more appropriate for obtaining the required outcome than other algorithms and has been adopted for the same.
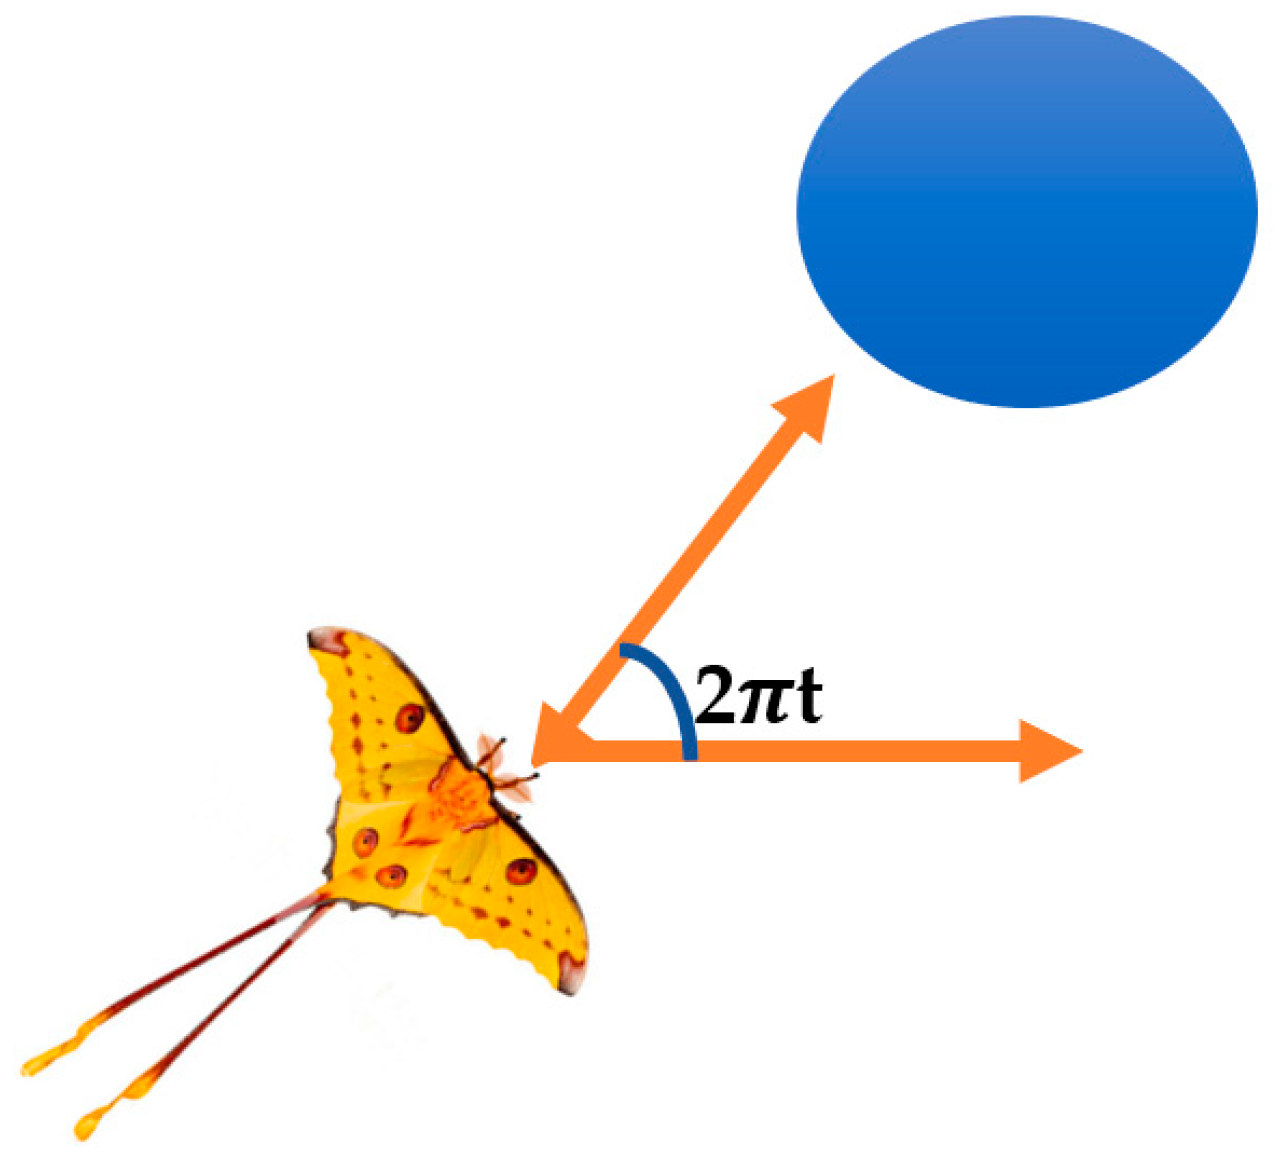
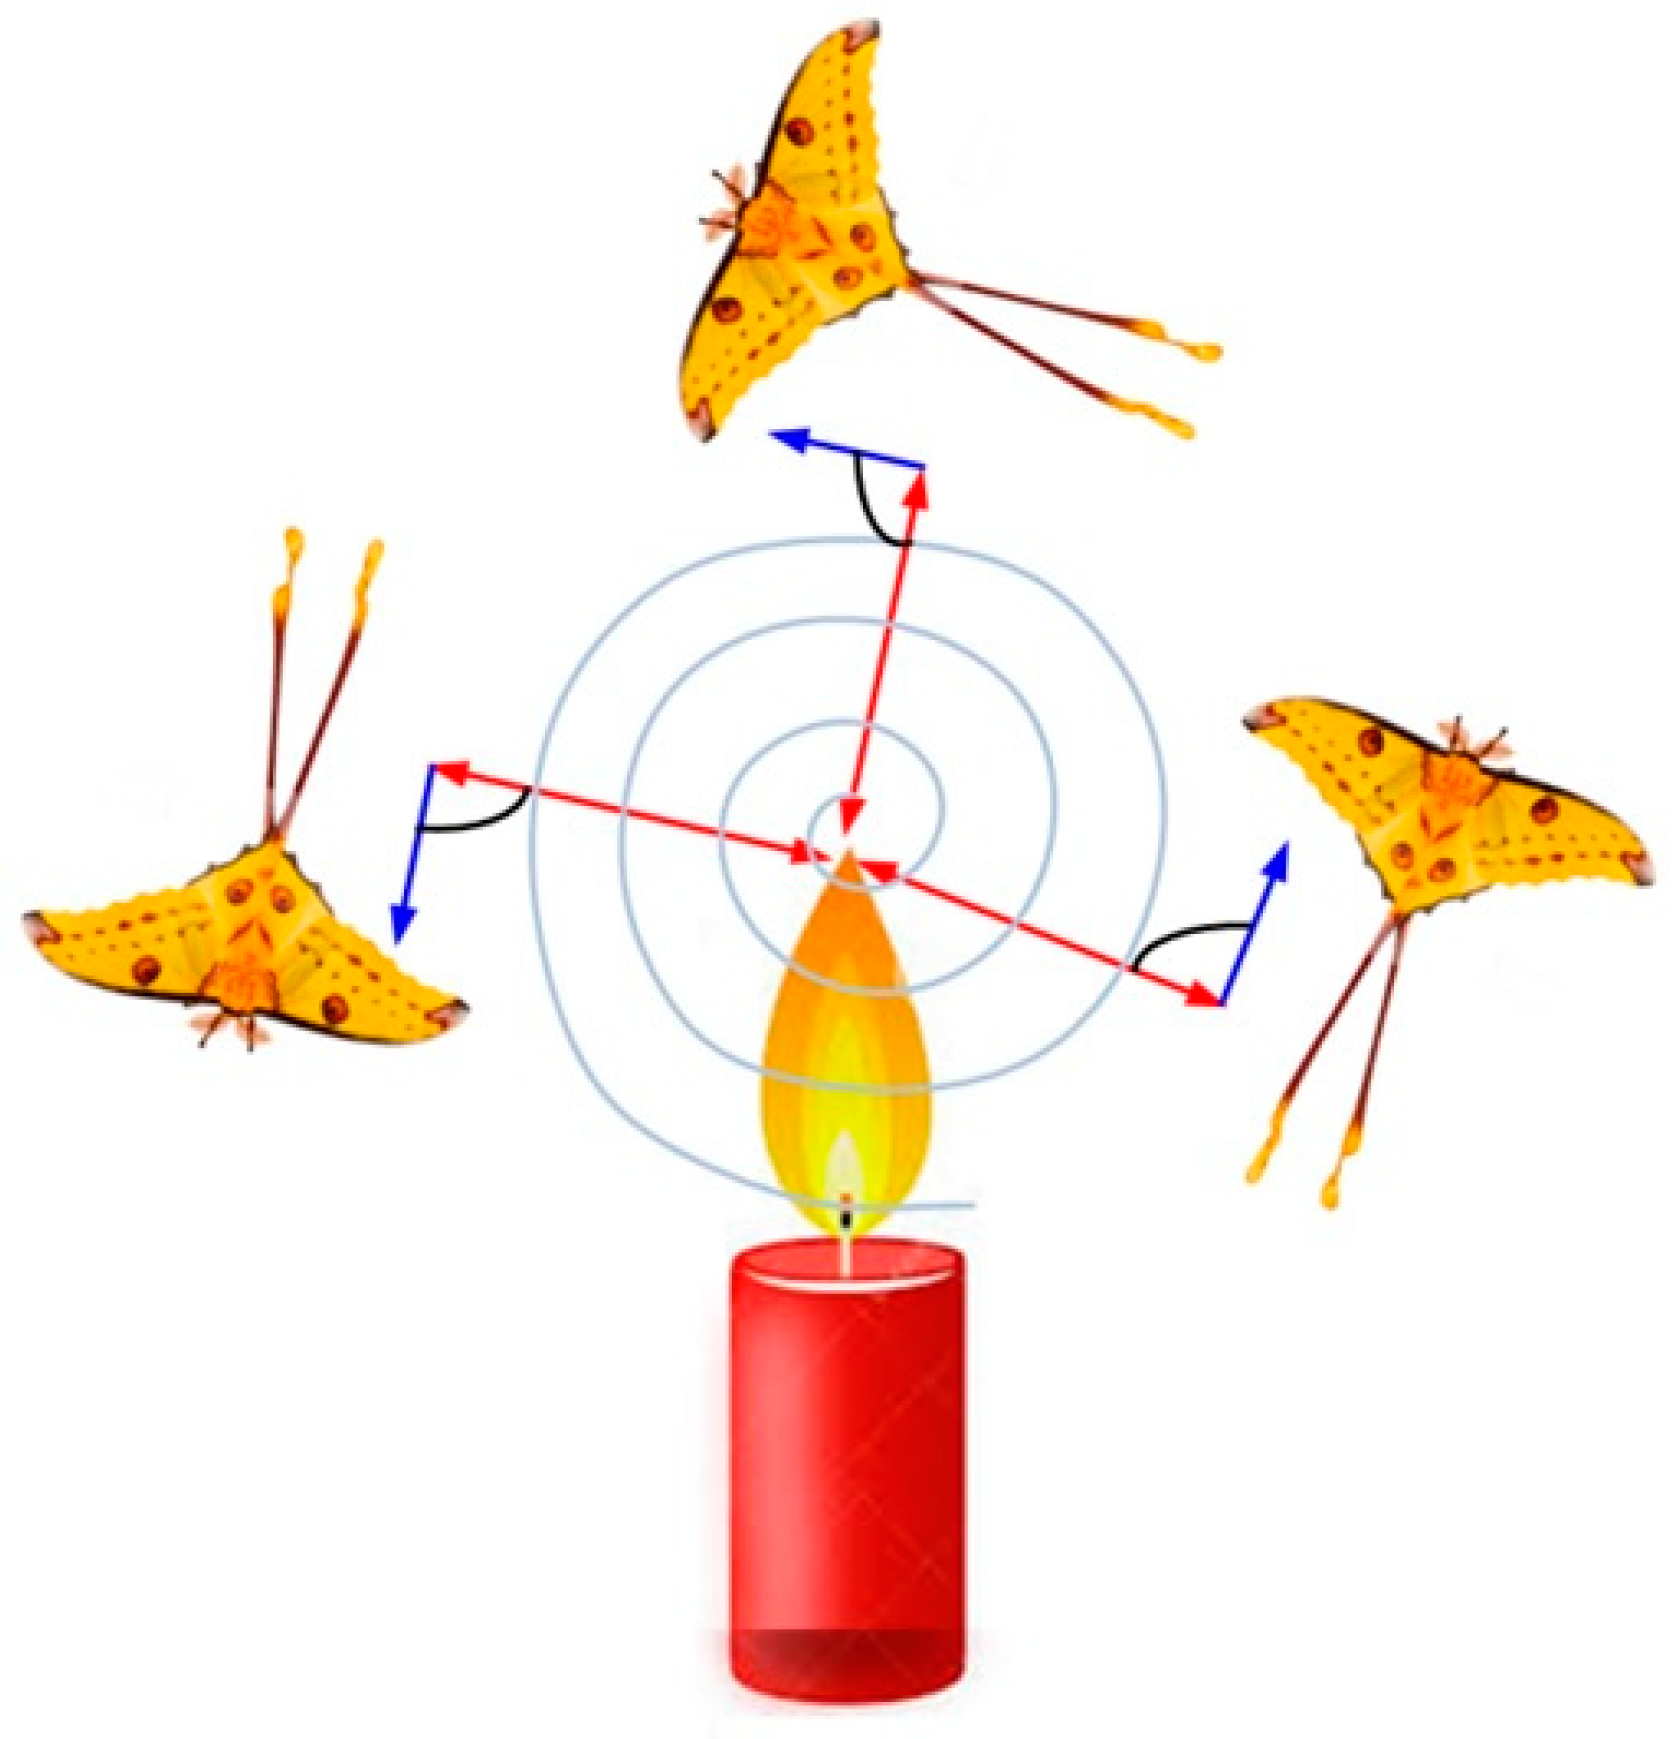
The real inspiration that is derived from nature in order to achieve the optimized solution is nothing but the transverse orientation-based moth’s navigation method. Under darkness, during the night, with respect to the direction of flight, moths fly in a specific direction by keeping a fixed angle, as shown in Figure 2. This is an efficient technique for moths to move long distances in a straight line. While moving long distances, these insects face trouble following the artificial lights. They usually get trapped in a spiral path while traveling under artificial lights, as depicted in Figure 3. The moths, which act as the search agents, move close to search space, and the flame’s best position is updated using the moth’s best position obtained in search space.

Figure 2.
Movement of the moth fly, keeping a fixed angle.

Figure 3.
Movement of the moth fly in a spiral path.
Mathematical Formulation for Updating Moths’ Spiral Path and Distance
For this algorithm, the candidate solutions represent moths, and the problem’s variables represent their corresponding positions. The moths can fly in one-dimensional, two-dimensional, three-dimensional, or hyper-dimensional space by changing their positions. As this algorithm is based on population, the first foremost component, i.e., a set of moths, represents the population that is symbolized in the form of a matrix as follows:
where n and d represent the number of moths and variables, respectively.
Taking all moths into consideration, an array can be formulated for storing the corresponding fitness values, as represented below:
In this proposed algorithm, other important entities are said to be flames. Here, one can analyze the matrix shown below as similar to the moth matrix.
Here, n and d represent the number of moths and variables, respectively.
And, in the case of flames, an array is taken into account to keep the corresponding fitness values as described below:
The entire concept explained before in this section describes the whole inspiration of the algorithm, and that is called a transverse orientation. All the behavioral studies of a moth for finding its best solution during search can be mathematically modeled, which explains that the update of position with respect to a flame for each moth is expressed by the following equation:
where, indicates ith moth, indicates jth flame, and S is a spiral function.
S is given as follows:
where b is a constant used for the shape of the logarithmic spiral, and t is a random number in [1, 1].
is the distance of the ith moth from the jth flame, and D is calculated as follows:
where, is ith moth, is jth flame.
D is the distance of the ith moth from the jth flame.
A moth flies around a flame in a spiral path, seeking its best solution. The exploration process is said to take place only when the mechanism for updating positions between the moth and flame lies in the next outside position. However, the exploitation is said to happen when position updating happens between the moth and flame. Eventually, during the iterations of search and updating, the best solution is obtained to get the best position of the moth around the flame in a spiral path. The following equation is used for this concern:
where ‘l ’identifies the present iteration; ‘N’ identifies the maximum number of flames; ‘T’ identifies the maximum number of iterations.
5. Modified MFO (MMFO) Technique
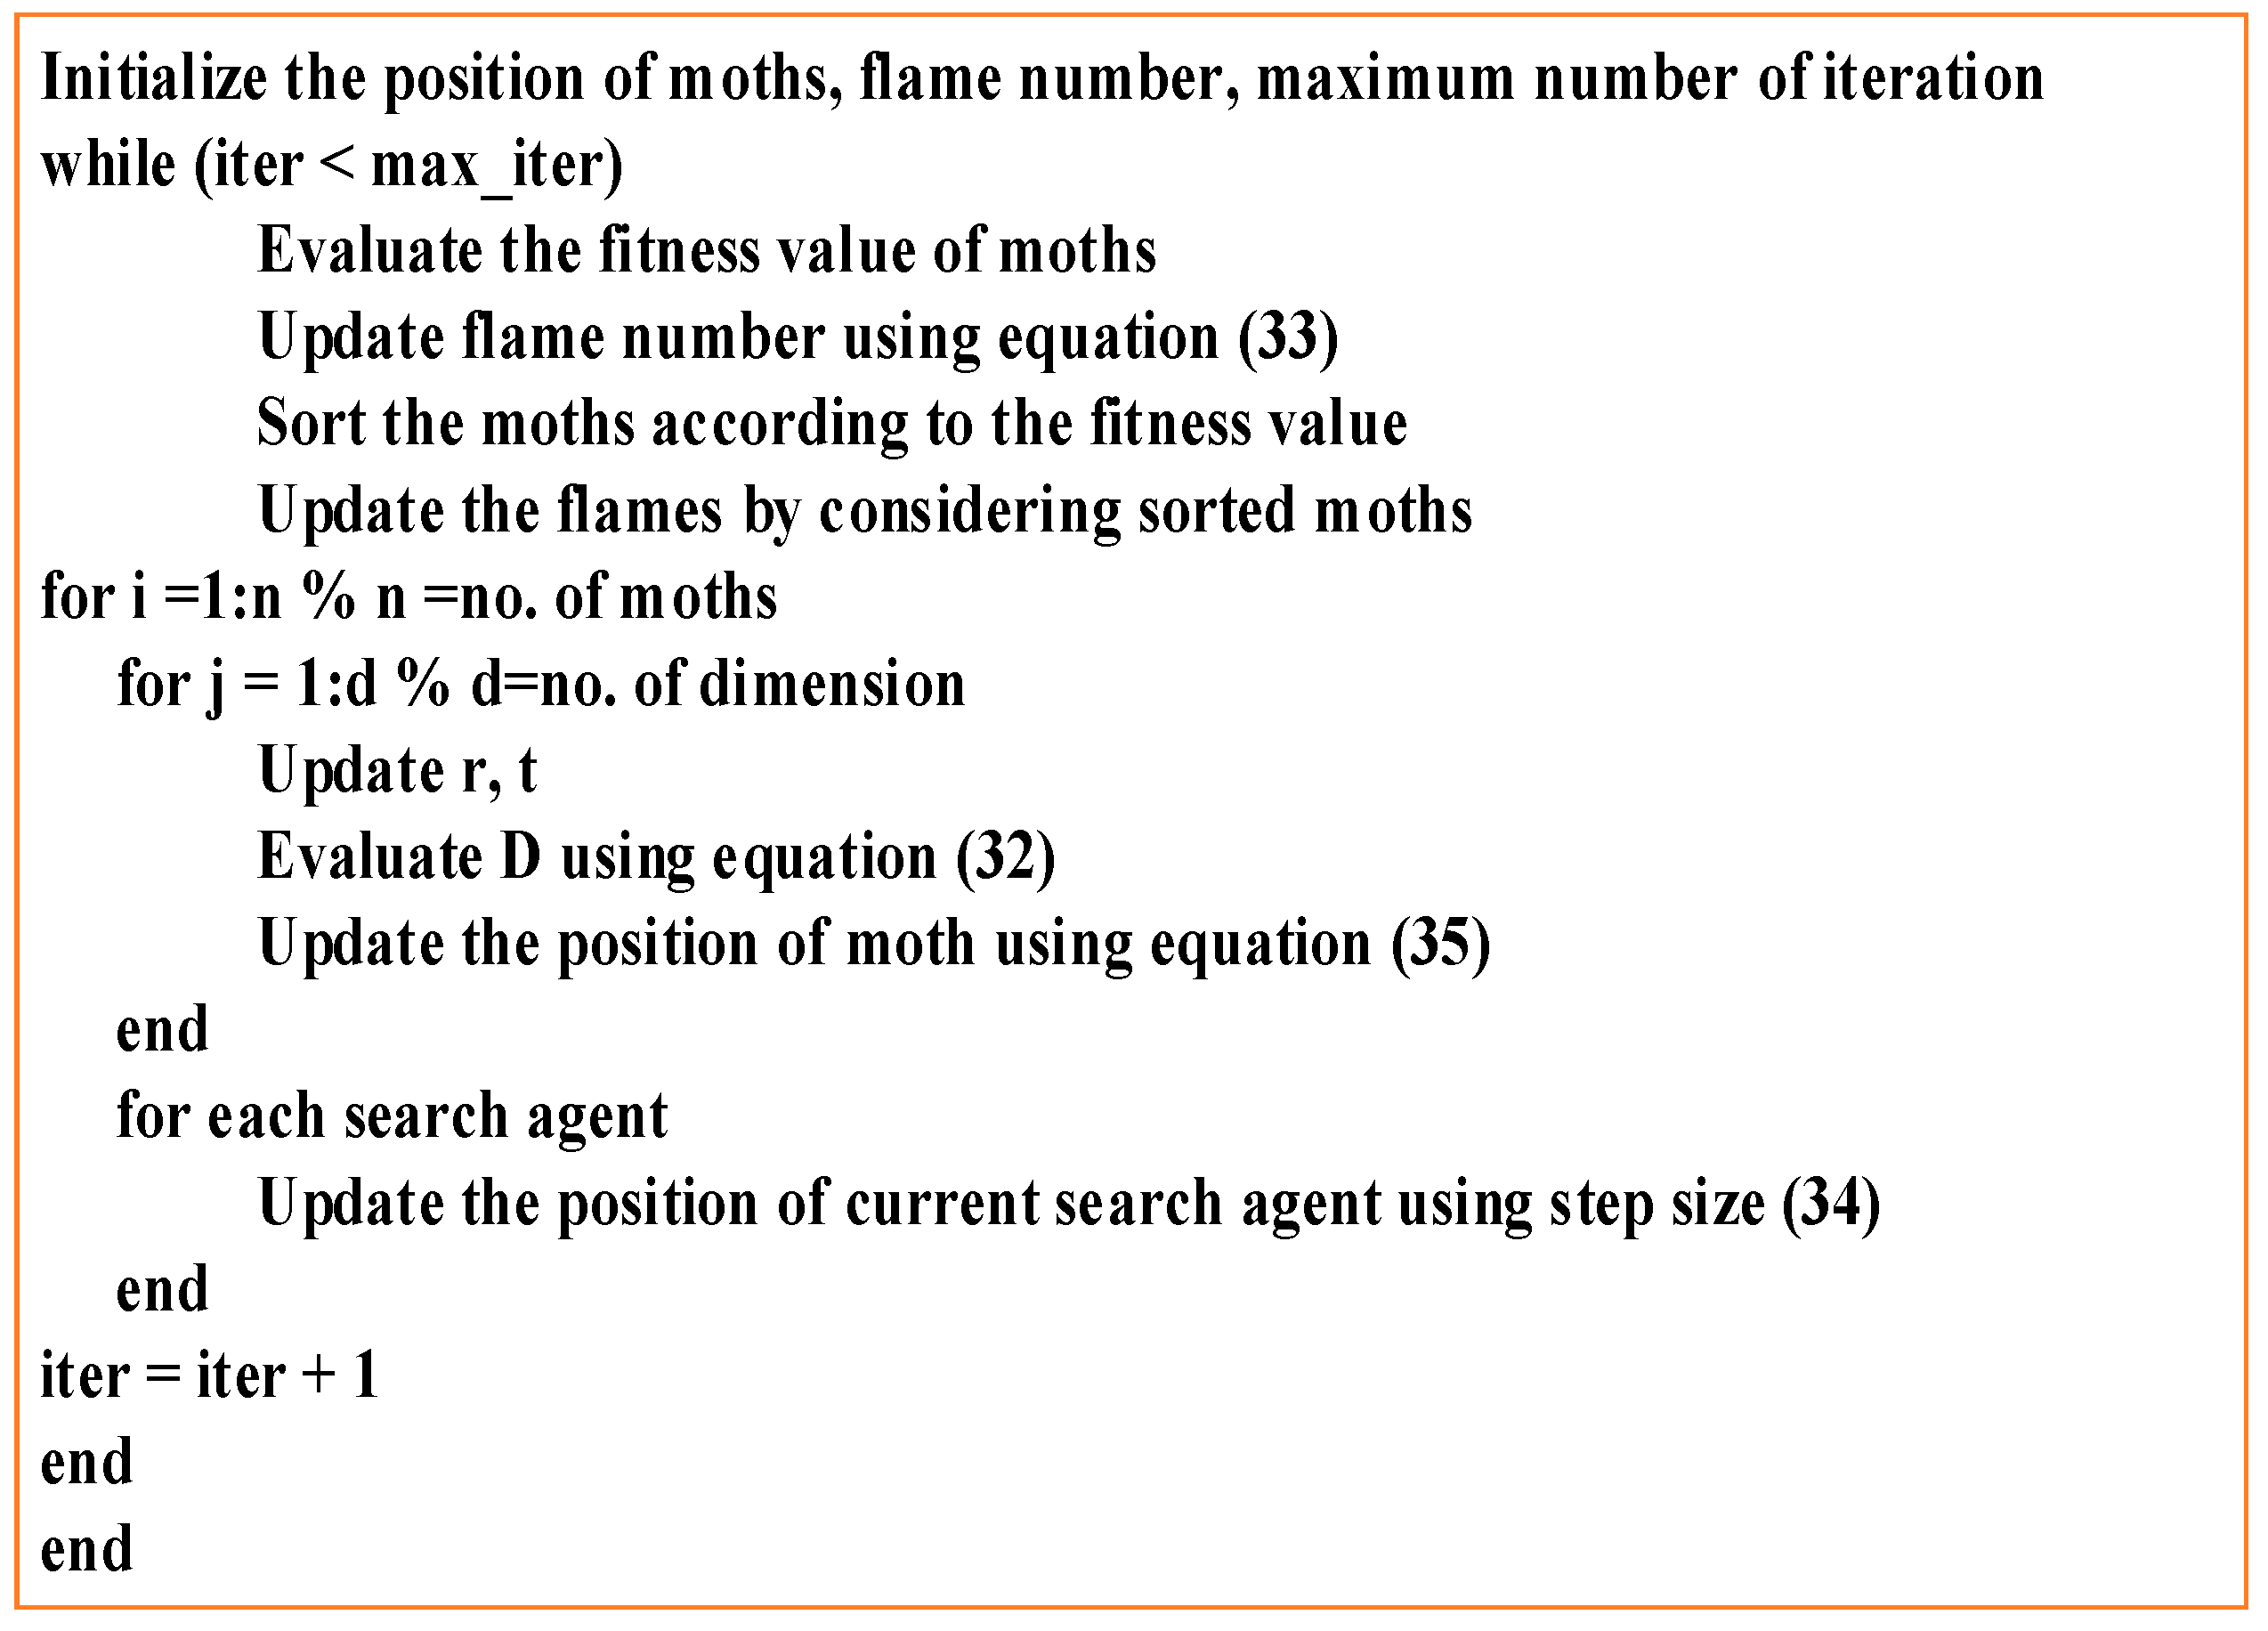
Exploitation and exploration are two main parts of an optimization algorithm. In addition, randomization plays a dynamic role in the algorithm. In a normal scenario, MFO updates its search agents towards candidate solutions. The effectiveness of the MFO [38] technique is indubitable, concerning the period of computation where it converges to the optimum values. Yet the process of searching may be lethargic. So, for improving the rate of convergence of the MFO technique as well as finding the global optimum solution, an enhanced searching process is depicted here [43], like the adaptive cuckoo search technique. Figure 4 shows the pseudocode of the modified MFO approach, i.e., MMFO.
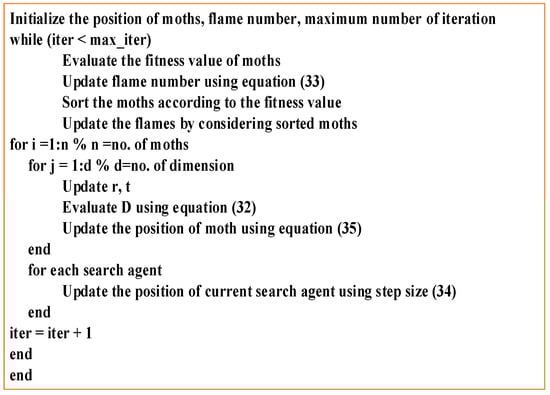
Figure 4.
Pseudocode of the modified MFO approach.
In the standard MFO technique, the position of the moth is updated using Equation (26). In this paper, step size is included considering the current position, best position, and worst position of moths, which determines the distance between the new moth’s positions and the current moth’s position. As shown in Equation (34), step size changes inversely with respect to iteration, i.e., the step size eases with increasing the number of iterations. The new position of the moth is achieved by adding the intended step size to the current position of the moth, as shown by Equation (35).
where, = current iteration
= current position of moth
= best position of moth
= worst position of moth
5.1. Mathematical Formulation for Updating Moths’ Spiral Path and Distance
To evaluate the performance of the proposed MMFO technique, optimization is carried out on standard benchmark functions. Two types of benchmark functions, i.e., unimodal (F1-F7) and multimodal (F8-F13), were used. Unimodal functions are those that have only one local minimum, while multimodal ones have multiple local minima. For the study of analysis, the expressions, dimensions (Dim), ranges, and optimum solutions (fmin) of the corresponding benchmark functions were adopted from [38]. The consequences of the suggested technique are compared with different metaheuristic algorithms such as MFO, PSO, and GA. Table 1 and Table 2 show the comparison of statistical parameters like averages and standard deviations for unimodal and multimodal functions, respectively. The performance is tested by preferring search agents and a maximum number of iterations of 30 and 1000, respectively. The outcomes are obtained by doing 30 independent runs.

Table 1.
Average and standard deviation values of MMFO in comparison with other techniques for unimodal benchmark functions.
Table 2.
Average and standard deviation values of MMFO in comparison with other techniques for multimodal benchmark functions.
From the observation, it is perceived that the MMFO technique provides significantly better outcomes in comparison to the MFO, PSO, GSA, and GA algorithms for six out of seven unimodal test functions except F3. Additionally, the MMFO outperformed all the algorithms for (F1, F2, F4, F6, and F7) unimodal functions. For the F5 unimodal function, MMFO outperformed the PSO and GA algorithms. For any new technique, unimodal functions are suitable candidates for analyzing the capability of exploitation. From Table 1, it is obtained that the capability of exploitation is high for the MMFO technique.
Likewise, Table 2 shows the ability to widely explore the search space by recognizing the favorable areas of MMFO. The MMFO technique yields better performance in comparison to the above-mentioned algorithms for the multimodal functions (F8-F13). The evasion of local optima by MMFO draws attention to various applications.
5.2. Optimal Power Dispatch Using MMFO
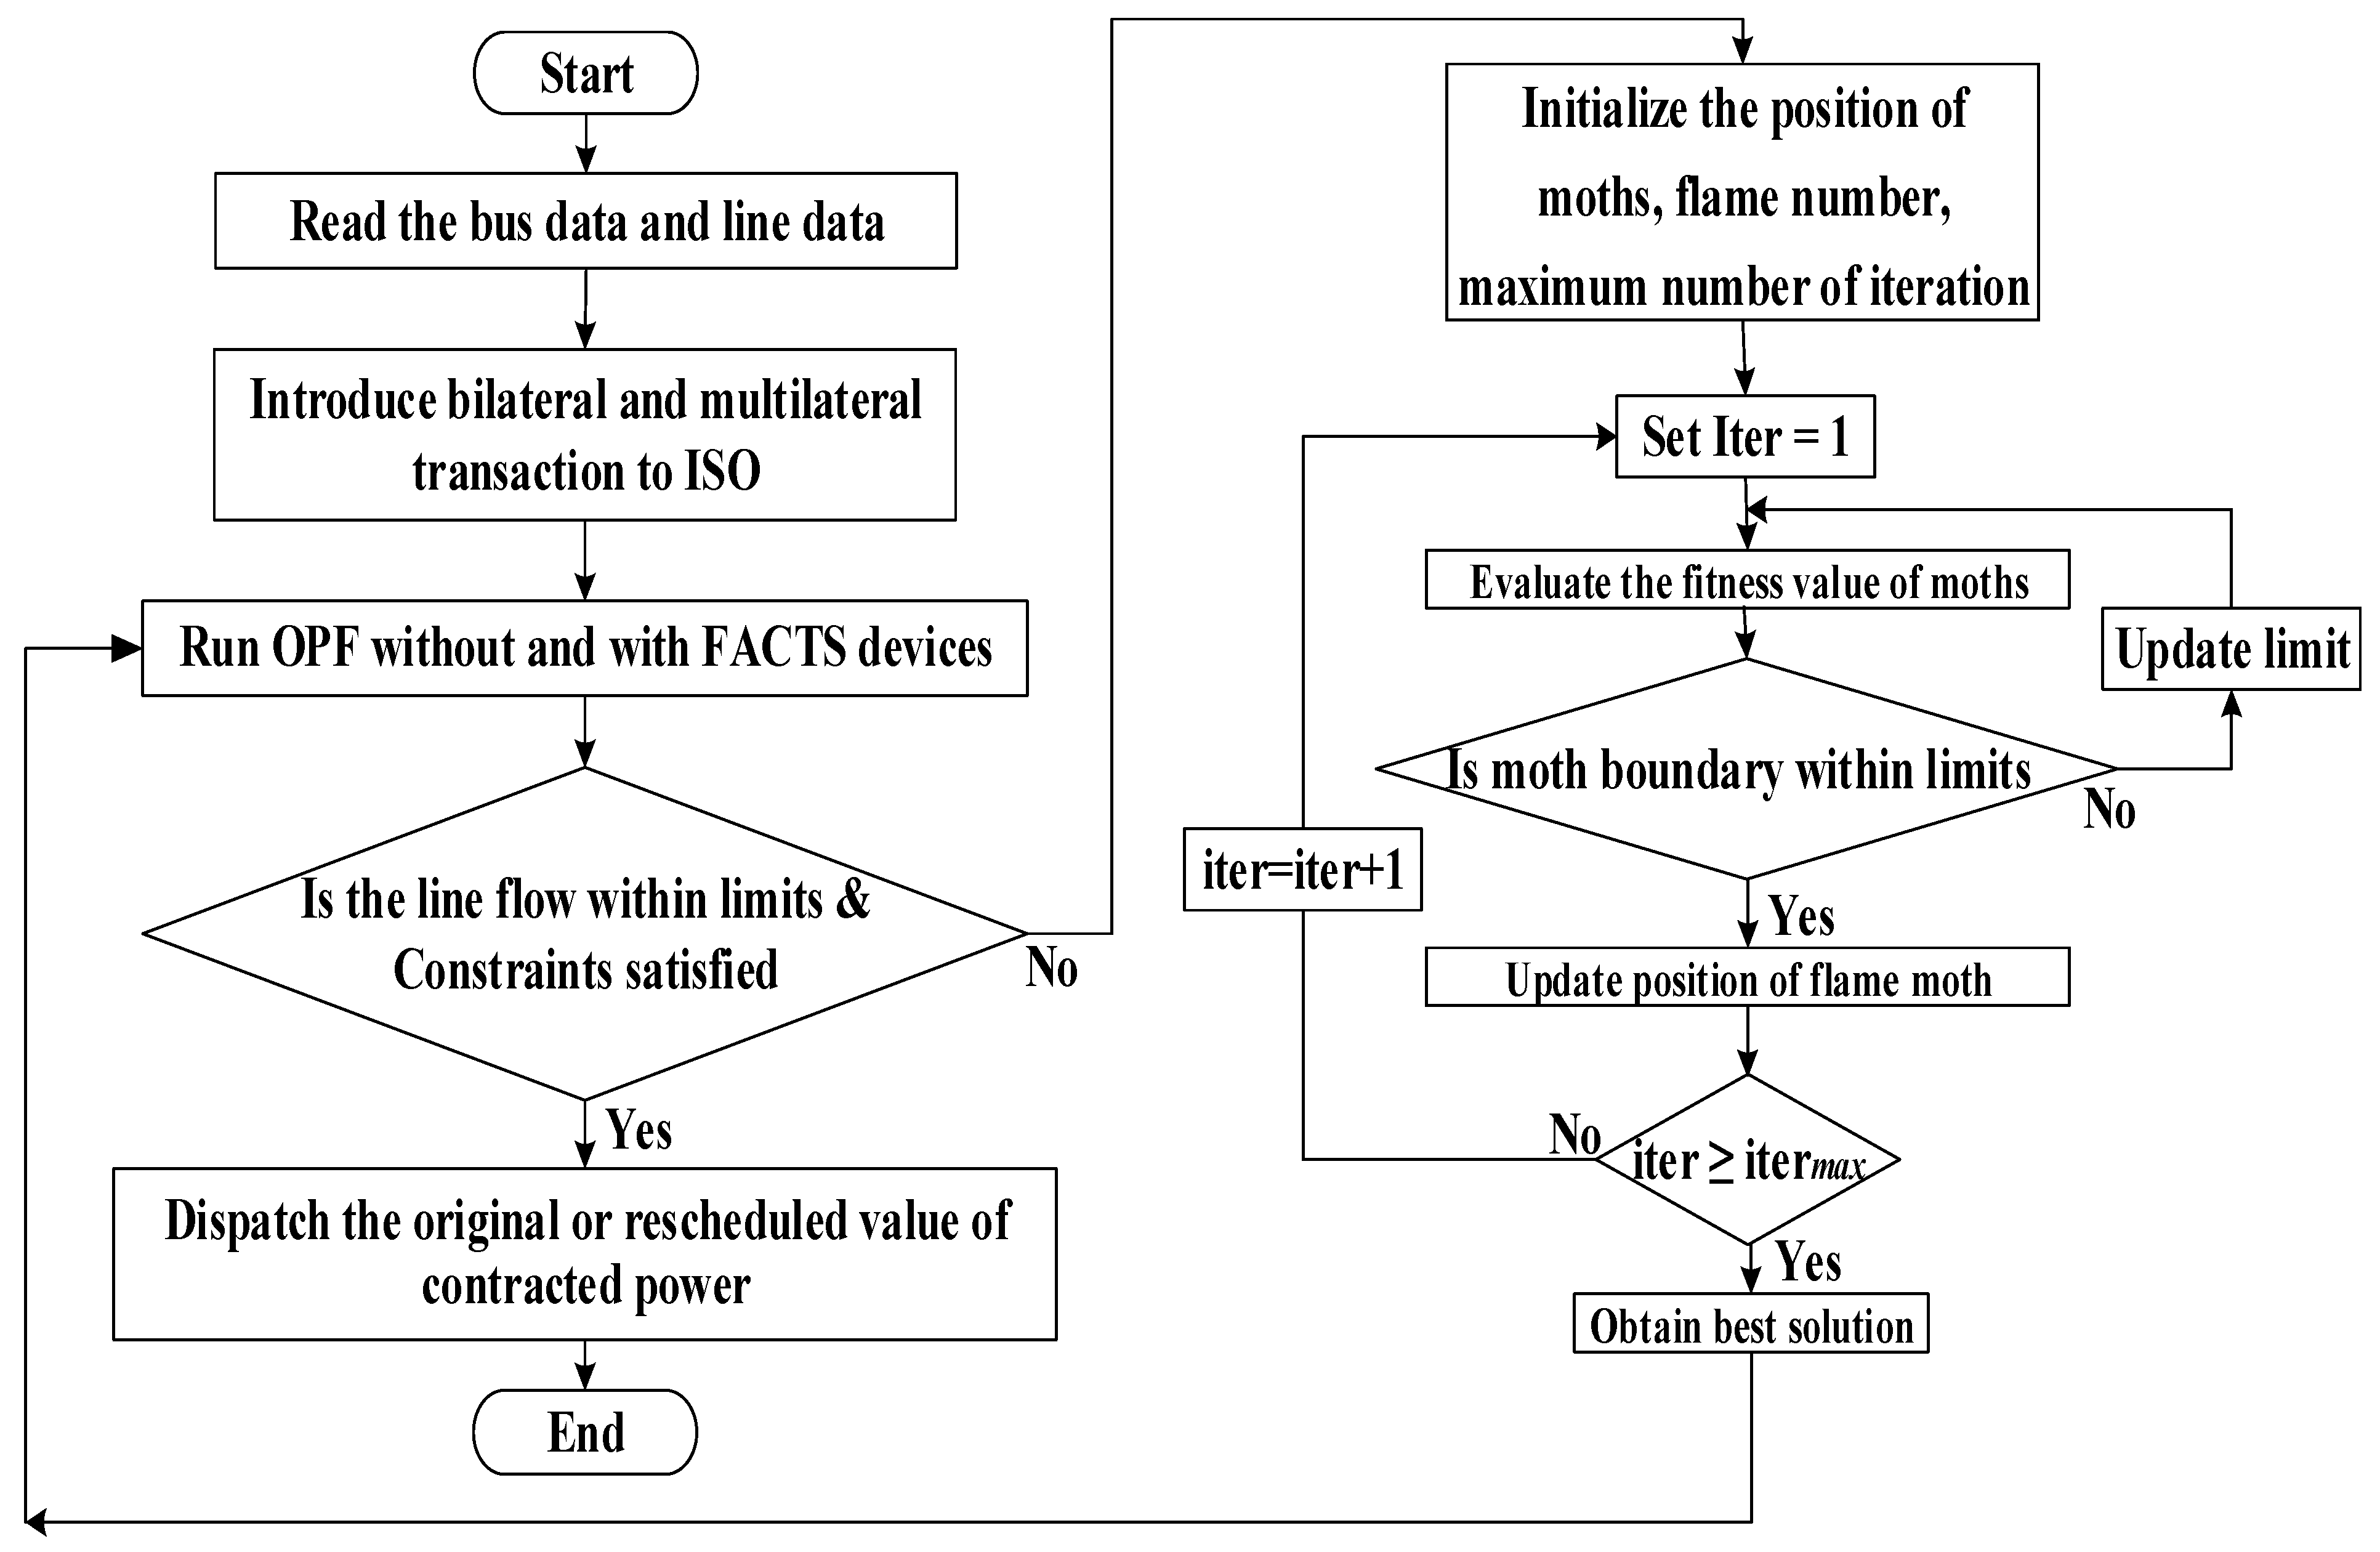
Modified Moth Flame Optimization technique exhibits itself to be the most efficient technique for dispatching power in a restructured power market using load curtailment strategies and minimizing the deviation in transactions. Figure 5 represents the implementation flowchart of the suggested MMFO algorithm.
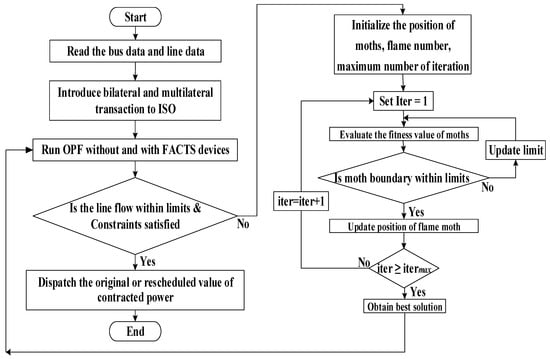
Figure 5.
Flowchart of implementing optimal power dispatch using MMFO.
6. Case Studies and Discussions
6.1. Case Studies
The execution of the proposed algorithm is performed under different market transactions like bilateral dispatch and multilateral dispatch correspondingly, considering the modified IEEE 14-bus system, which consists of 5-generator buses, 9-load buses, and 20 transmission lines, and the IEEE 30-bus system, which consists of 6-generator buses, 24-load buses, and 41-transmission lines. For simplicity, bus-1 is chosen as the slack bus in each case, which is responsible for loss calculation in each bus system. The bus data and line data for 14-bus and 30-bus are taken from [5,16], respectively. The generator data for 14-bus and 30-bus are given in Table A2 and Table A3, respectively. The corresponding single-line diagram is given in Figure 6 for a 14-bus system. The complete relative studies are performed in the MATLAB R2018a, 64-bit version environment. The modified algorithm is tested, preferring search agents and a maximum number of iterations of 30 and 300, respectively. The outcomes were obtained for 30 independent runs.
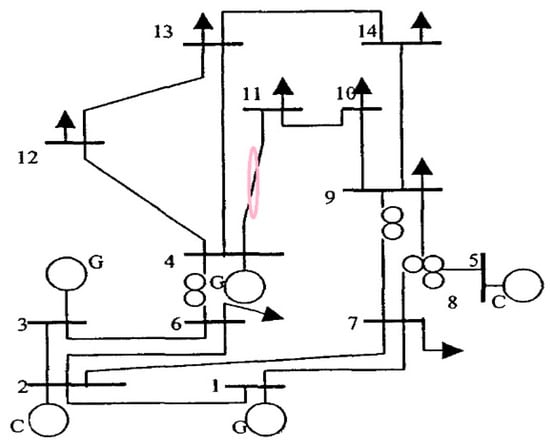
Figure 6.
Single-line diagram of the 14-Bus system.
6.1.1. Case 1: IEEE 14-Bus System
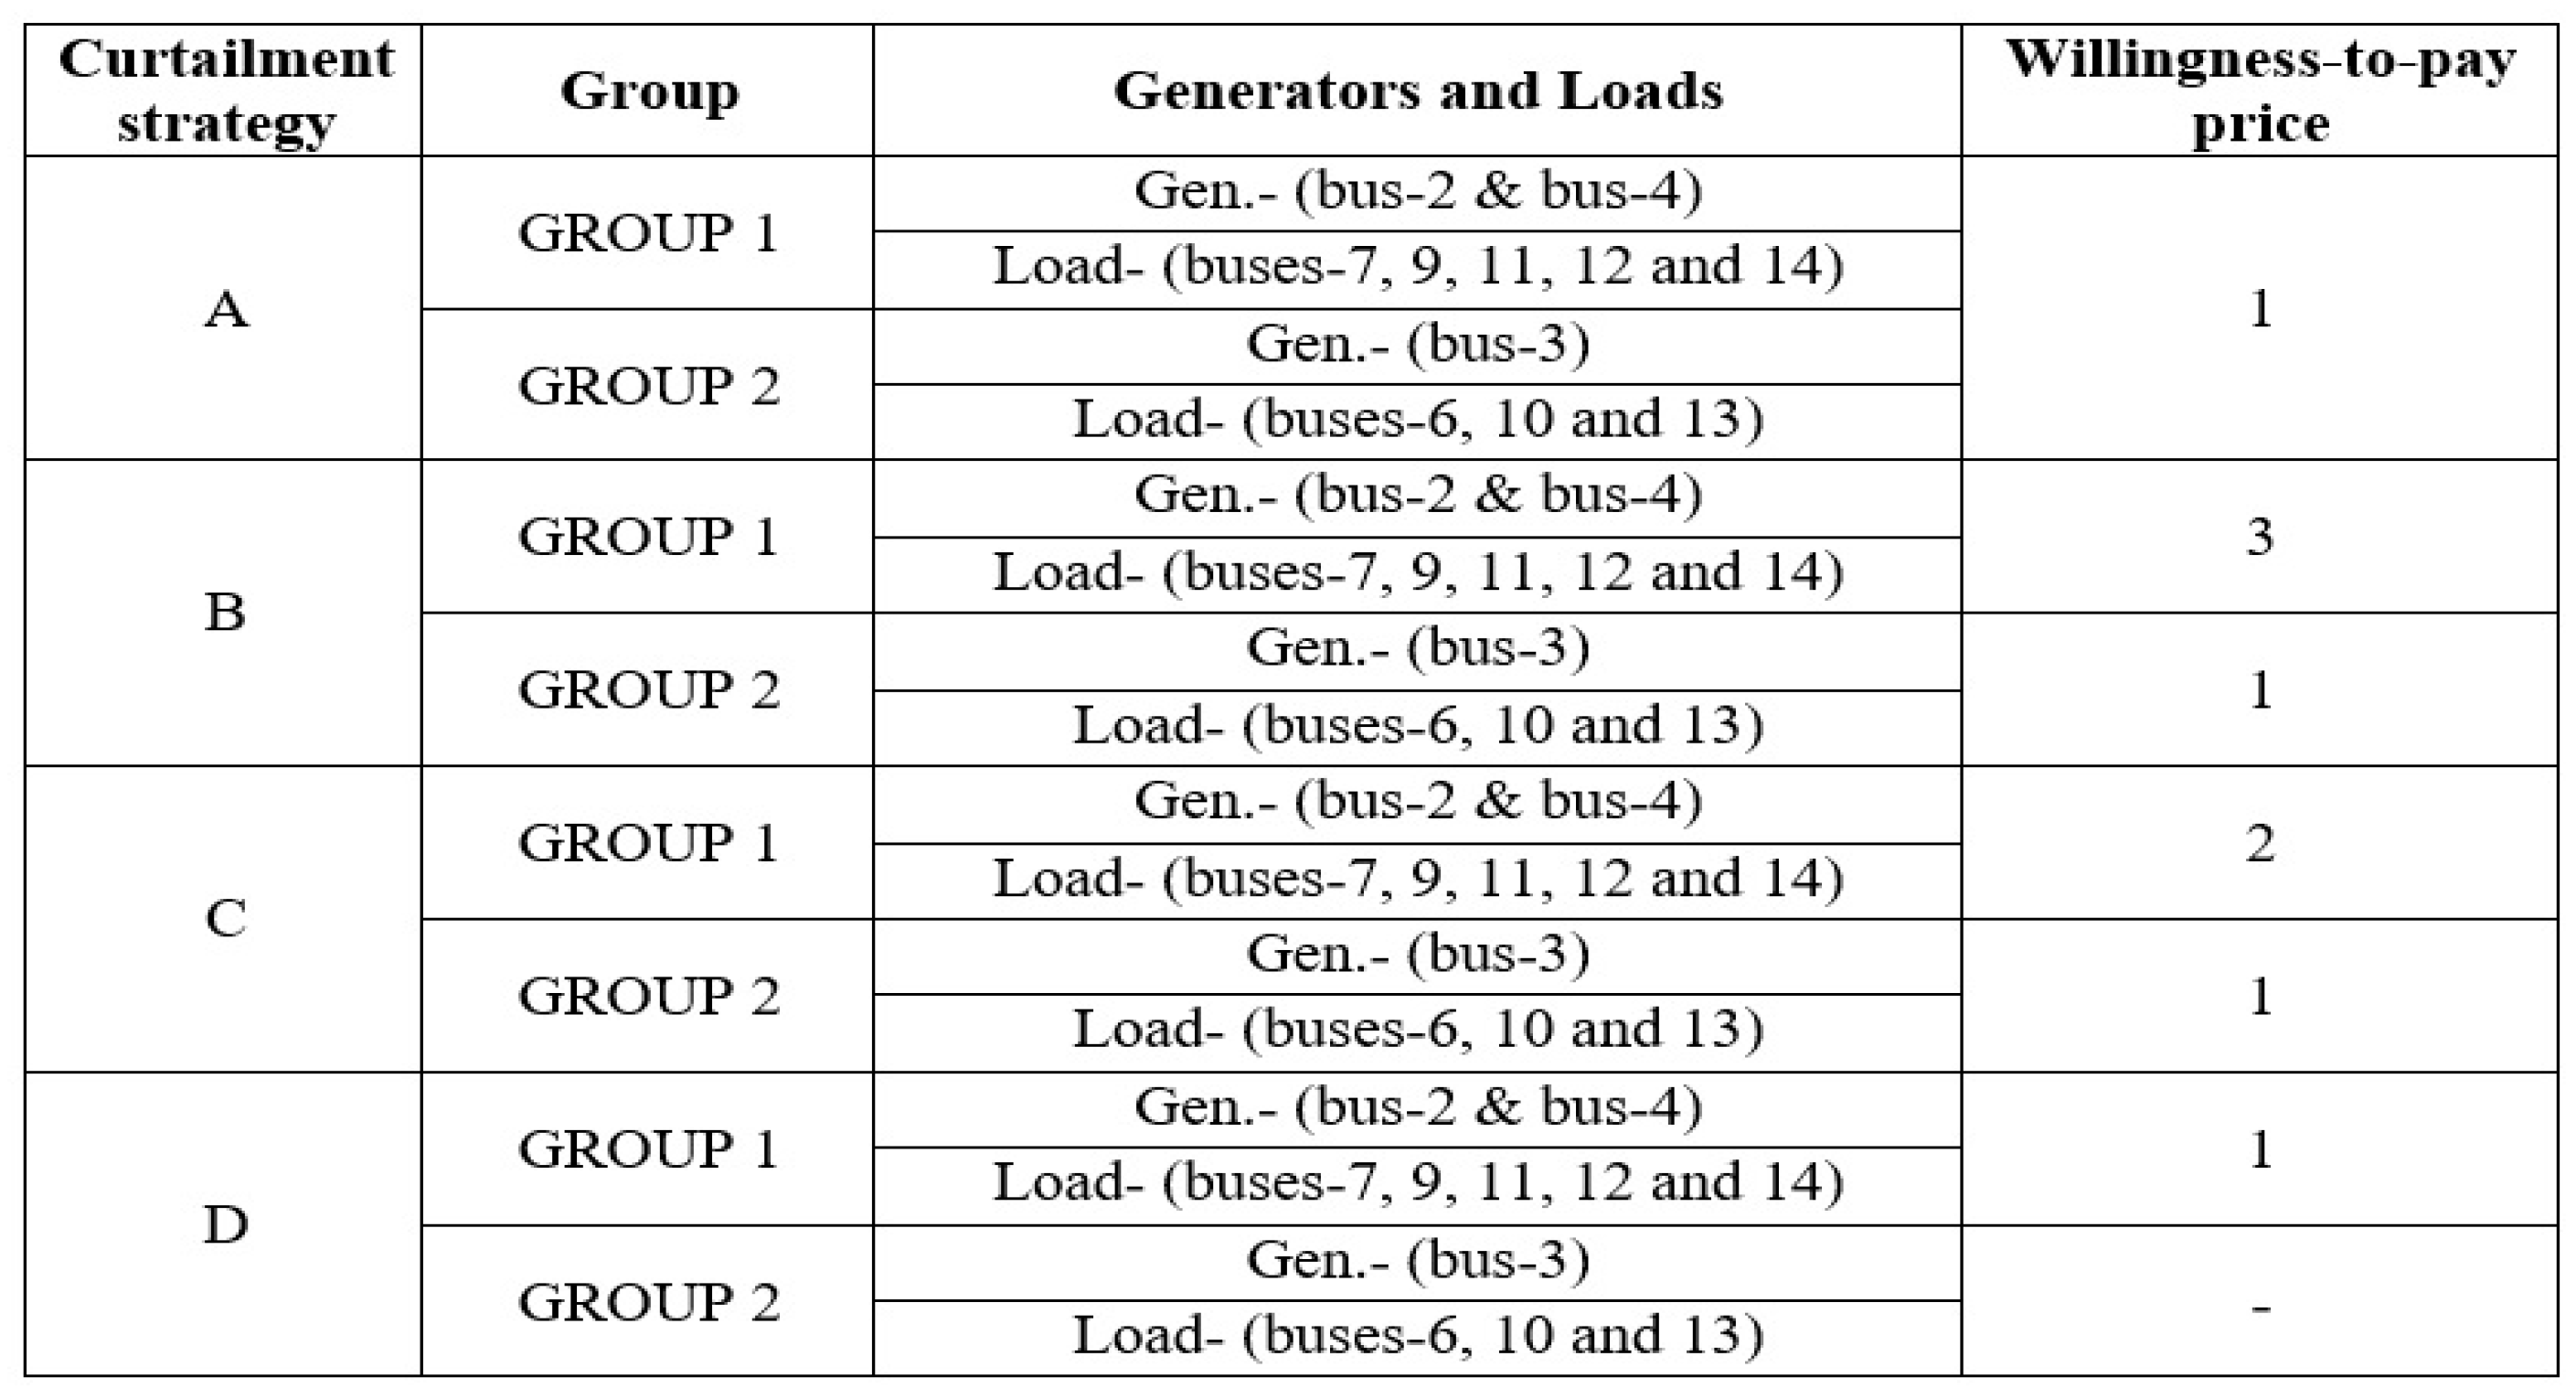
In this case, two groups are considered for the dispatch of power between market participants. Group-1 consists of two GENCOs (bus-2 and bus-4) and five DISCOs (buses-7, 9, 11, 12, and 14). Similarly, group-2 consists of one GENCO (bus-3) and three DISCOs (buses-6, 10, and 13). The desired generation and load of both groups are given in Table 3. Initially, when the dispatch is done for the desired transaction without curtailment, then, line limit exceeds in line 4–11 as given in Table 4. So, UPFC [37] is optimally placed at line 4–13, which decreases congestion by reducing the line flow to 0.2580 pu from 0.3222 pu that are obtained without FACTS devices. The effect of UPFC on improving line loading is shown in Figure 7. Even after placing the UPFC, the system operator has to curtail the contracted power to bring the line flow within limits. So for congestion management, the system operator follows four curtailment strategies taken from [10] and depicted in Figure 8, which are mentioned below:
- A.
- The group curtailment strategy is applied to both groups, and the curtailment follows a linear relationship among the loads of each group. The willingness to pay price factor is chosen as 1 $/MWh ($ signifies an arbitrary unit of currency) for all the participants in the groups.
- B.
- The curtailment strategy is the same as in A, but the willingness to pay price factor for group-1 is chosen three times as often as in group-2.
- C.
- Here, the GENCOs of group-1 follow a separate curtailment strategy, and the willingness to pay price factor for bus-4 is three times that of bus-2. Others follow the same strategy as A.
- D.
- Here, group-2 follows a point-to-point curtailment strategy for dispatching bilateral contracts between buses 3–6, 3–10, and 3–13. Others follow the same strategy as A.
Table 3.
Optimal power dispatch without FACTS devices.
Table 3.
Optimal power dispatch without FACTS devices.
| Gr. No. | Bus No. | Desired Generation and Load (MW) | Case 2A | Case 2B | Case 2C | Case 2D | |
|---|---|---|---|---|---|---|---|
| 1 | Gene. | 2 | 157.7 | 157.7 | 157.7 | 150.9 | 157.7 |
| 4 | 98.0 | 77.8 | 78.04 | 81.26 | 79.709 | ||
| Load | 7 | 102.9 | 94.771 | 94.87 | 93.43 | 95.53 | |
| 9 | 57.8 | 53.234 | 53.289 | 52.482 | 53.66 | ||
| 11 | 53.5 | 49.274 | 49.325 | 48.57 | 49.67 | ||
| 12 | 16.1 | 14.274 | 14.844 | 14.61 | 14.94 | ||
| 14 | 25.4 | 23.394 | 23.118 | 23.06 | 23.58 | ||
| 2 | Gene. | 3 | 214.1 | 209.96 | 201.83 | 203.81 | 202.85 |
| Load | 6 | 167.8 | 164.55 | 158.18 | 159.71 | 164.05 | |
| 10 | 19.0 | 18.633 | 17.912 | 18.082 | 15.25 | ||
| 13 | 27.3 | 26.772 | 26.772 | 25.98 | 23.551 | ||
| Loss | 1 | 29.78 | 27.896 | 26.73 | 26.24 | 26.77 | |
| Total Transaction byGene. (2 + 3 + 4) | 469.8 | 445.46 | 437.58 | 435.98 | 440.25 | ||
| Deviation in Power Transaction (MW) | 24.34 | 32.22 | 33.82 | 29.55 | |||
| Rescheduling Cost of generation ($/h) | 913 | 1229.08 | 1309.78 | 1126.76 | |||
Table 4.
Line loading of an IEEE 14-bus system with and without FACTS Devices.
Table 4.
Line loading of an IEEE 14-bus system with and without FACTS Devices.
| Tr. Line No. | Line Designation | Line Rating (p.u.) | Line Loading (p.u.) | ||
|---|---|---|---|---|---|
| without FACTS | with TCSC [10] | with UPFC | |||
| 8 | 4–11 | 0.2500 | 0.3222 | 0.2933 | 0.2580 |
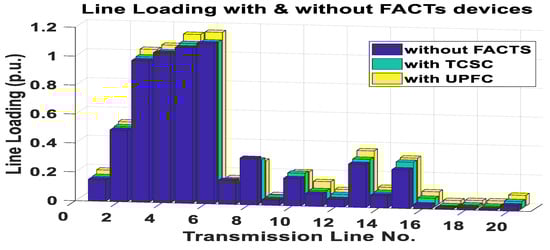
Figure 7.
Line loading with and without FACTS devices of the IEEE 14-bus system.
Figure 7.
Line loading with and without FACTS devices of the IEEE 14-bus system.


Figure 8.
Information utilized for load curtailment.
Figure 8.
Information utilized for load curtailment.
After applying the above curtailment strategies, congestion becomes eliminated and line flow in 4–11 reduces to 0.2460 pu, as shown in Table 5, and the outcomes of this case obtained from optimal dispatch for all cases without FACTS devices have been summarized in Table 5. This optimal dispatch model is also solved in the presence of UPFC using a genetic algorithm [29], a particle swarm optimization technique (PSO) [35], a moth flame optimization technique (MFO) [38], and a proposed MMFO technique considering curtailment strategies A.
Table 5.
Congested line flow before and after congestion.
In this case study, three different curtailment strategies were applied to manage the congestion situation. These curtailment strategies were implemented by using the willingness-to-pay price factor. The optimal dispatch of generating units and load units after implementing three curtailment strategies is presented in Table 5. From this table, it is observed that for case 2A, which followed the group curtailment strategy, contracted power was curtailed in varying amounts for all the groups. Here, the total transaction deviates to 445.46 MW from the total desired transaction of 469.8 MW. However, for case 2B, where group-1 utilities are paying a higher value of willingness to pay, it benefits only the group-1 utilities by 0.24 MW from case 2A. However, the curtailment of 8.13 MW badly affects group-2 utilities. In case 2C, which followed a separate curtailment strategy, group-1 paid a higher willingness to pay price, due to which bus-4 got an increase in its output by 81.26 MW from 77.8 MW obtained by case 2A, whereas at the same time the output of bus-2 decreased to 150.9 MW from 157.7 MW attained by case 2A. For case 2D which follows point-to-point curtailment strategy, the loads in group-2 at bus-10 affect badly by 3.38 MW from case 2A even after paying same willingness price as of case 2A.
From the comparative analysis of different curtailment strategies implemented for congestion management, it is seen that group curtailment strategies are most suitable for the control of congestion due to their lower curtailment of power transactions. Therefore, system operators mostly follow group curtailment strategies for congestion management. Now, using this group strategy, the optimal power dispatch is found for the 14 bus systems in the electricity market.
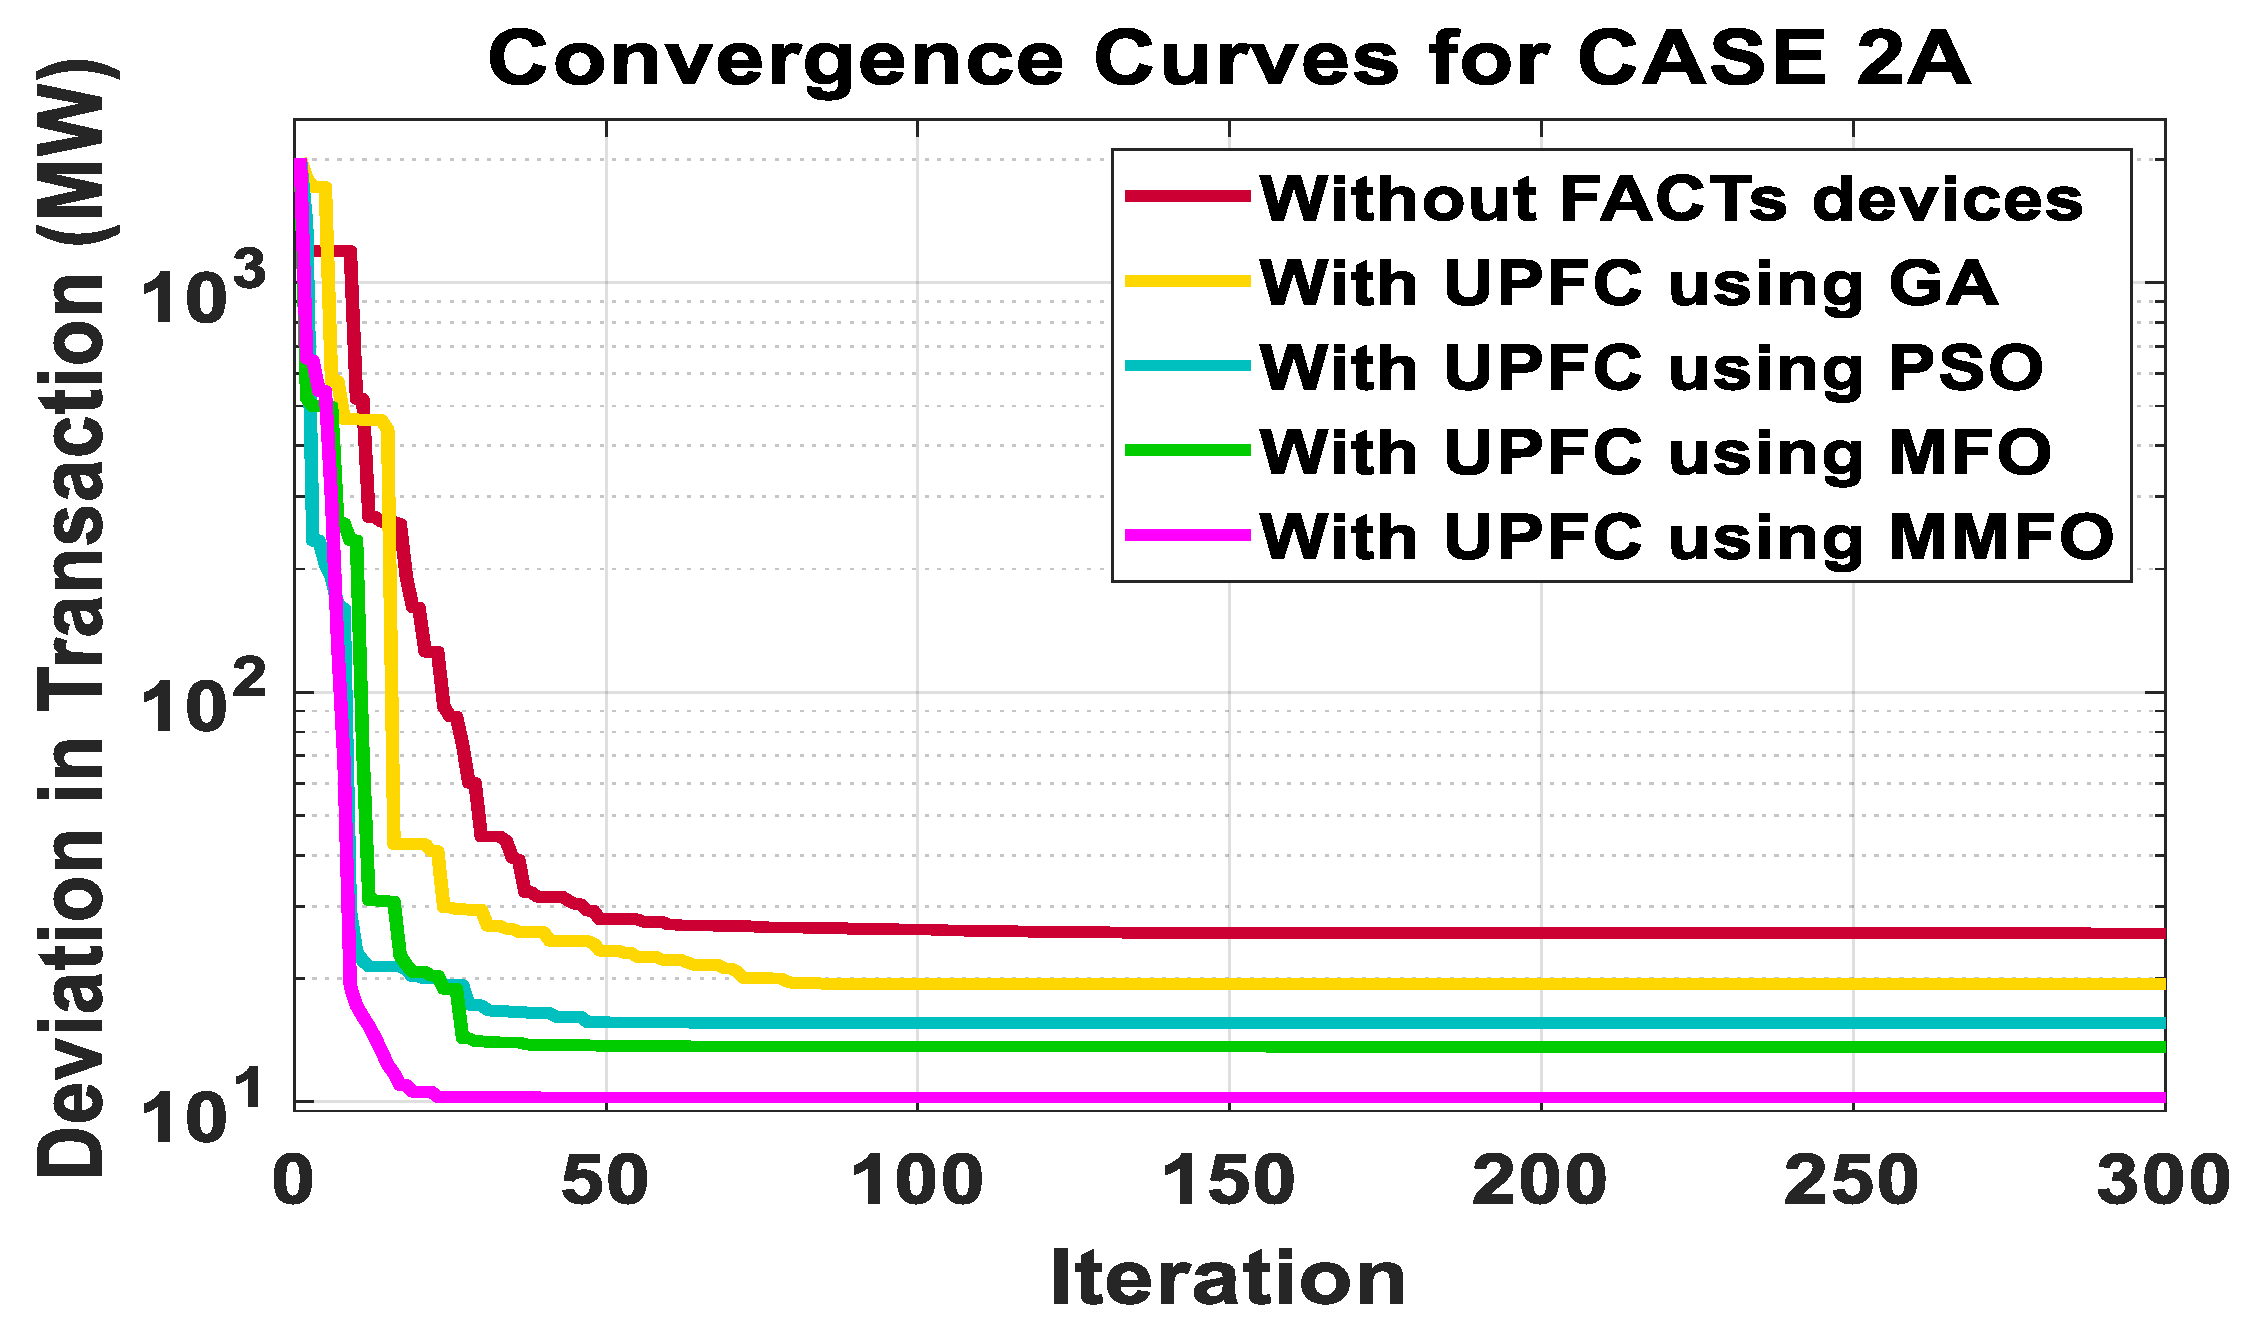
The outcomes referring to the group curtailment strategy for the 14-bus system are given in Table 6. It gives the optimal dispatch of power with FACTS using the MMFO technique. It is observed that outcomes obtained by the MMFO technique are better in comparison to other techniques. The total power transaction and individual power transaction are increased to a large extent in comparison to GA, PSO, and MFO. From the comparison study, it is obtained that the total transaction value has increased to 459.56 MW by MMFO from transaction value of 445.46 MW, 452.52 MW, 453.9 MW, and 456.16 MW obtained without FACTS, GA, PSO, and MFO techniques, respectively. The deviations in power transactions attained without FACTS, GA, PSO, and MFO techniques are 24.34 MW, 17.28 MW, 15.9 MW, 13.64 MW, and 10.24 MW, respectively. However, the deviation is very low for the proposed MMFO technique. It also shows that losses are reduced significantly by transactions obtained without FACTS devices and other techniques. The rescheduling cost of generation [32] is calculated for all the cases considering Equation (36) which shows the cost reduces to 665.16 $/h by using the MMFO technique, which is minimum in comparison to 913 $/h, 798.96 $/h, 749.01 $/h, and 699.42 $/h found by using FACTS, GA, PSO, and MFO algorithms, respectively. Figure 9 shows transactions made by generators 2, 3, and 4 following the group-curtailment strategy implemented by the proposed MMFO and other aforementioned techniques without FACTS. Its convergence characteristic is shown in Figure 10 without FACTS devices and with UPFC using different techniques. Timing is reported in Table 7. It is seen that the proposed technique achieves faster convergence with respect to others. The outcomes attained by the proposed technique show its effectiveness in achieving optimized outputs.
Table 6.
Optimal power dispatch with UPFC considering case 2A.
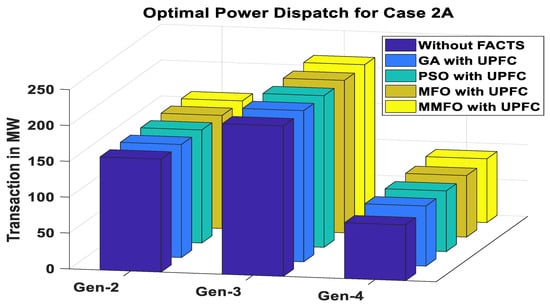
Figure 9.
Optimal power dispatch for case 2A.
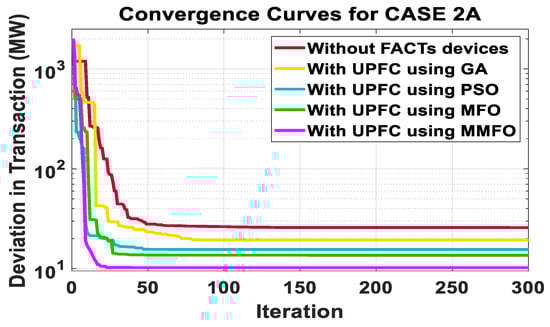
Figure 10.
The convergence characteristic for case 2A.
Table 7.
Convergence time required by different techniques for case 2A.
Subsequently, the efficacy of the proposed approach is being tested for an IEEE 30-bus system.
where, are the increment and decrement bid prices submitted by GENCOs.
are the increase or decrease in real power from the scheduled transactions of GENCOs.
shows the number of generators present in the system.
6.1.2. Case 2: IEEE 30-Bus System
In this case, three groups are considered for the dispatch of power between market participants. Group-1 consists of one GENCO (bus-2) and four DISCOs (buses-8, 10, 13, and 16). Similarly, group-2 consists of one GENCO (bus-4) and six DISCOs (buses-7, 18, 19, 20, 24, and 29). Group-3 consists of three GENCOs (buses-3, 5, and 6) and eight DISCOs (buses-12, 14, 15, 17, 21, 23, 26, and 30). The desired generation and load of all the groups are given in Table 8. When dispatch is done for the desired transaction without curtailment, the line limit exceeds lines 1–2, 2–4, and 2–6, as shown in Table 9 Therefore, UPFC is optimally placed at lines 3–4 and 4–6, respectively, to reduce the line flow and eliminate congestion. Even after placing the UPFC, the system operator has to curtail the contracted power to bring the line flow within limits. For curtailment of contracted power, the system operator follows two curtailment strategies as follows:
- A.
- The group curtailment strategy is applied to all the groups, and the curtailment follows a linear relationship among the loads of each group. The willingness to pay price factor is chosen as 1$/MWh ($ signifies an arbitrary unit of currency) for all the participants in the groups.
- B.
- Here, groups 1 and 2 follow a point-to-point curtailment strategy for dispatching bilateral contracts. Others follow the same strategy as A.
Table 8.
Optimal power dispatch without FACTS devices.
Table 8.
Optimal power dispatch without FACTS devices.
| Gr. No. | Bus No. | Desired Gene. and Load (MW) | Case 2A | Case 2B | |
|---|---|---|---|---|---|
| 1 | Gene. | 2 | 67.65 | 63.84 | 58.24 |
| Load | 8 | 11.4 | 10.94 | 9.25 | |
| 10 | 34.2 | 33.26 | 31.14 | ||
| 13 | 16.8 | 15.35 | 13.64 | ||
| 16 | 5.25 | 4.29 | 4.21 | ||
| 2 | Gene. | 4 | 40.6 | 36.84 | 31.33 |
| Load | 7 | 3.6 | 3.14 | 2.51 | |
| 18 | 3.8 | 3.28 | 2.68 | ||
| 19 | 13.25 | 12.74 | 11.23 | ||
| 20 | 3.3 | 2.7 | 1.85 | ||
| 24 | 13.05 | 12.17 | 11.21 | ||
| 29 | 3.6 | 2.81 | 1.85 | ||
| 3 | Gene. | 3 | 44.41 | 40.23 | 40.54 |
| 5 | 24.15 | 20.27 | 20.71 | ||
| 6 | 28.03 | 23.96 | 23.98 | ||
| Load | 12 | 8.7 | 7.1 | 7.3 | |
| 14 | 9.4 | 8.12 | 8.31 | ||
| 15 | 12.5 | 11.24 | 11.32 | ||
| 17 | 13.6 | 11.68 | 11.7 | ||
| 21 | 26.28 | 23.14 | 23.45 | ||
| 23 | 4.83 | 3.92 | 3.95 | ||
| 26 | 5.38 | 4.74 | 4.75 | ||
| 30 | 15.9 | 14.42 | 14.45 | ||
| Loss | 1 | 15.27 | 14.34 | 13.69 | |
| Total Transaction by Gene. (2 + 3 + 4 + 5 + 6) | 204.84 | 185.14 | 174.8 | ||
| Deviation in Power transaction (MW) | 19.7 | 30.04 | |||
| Rescheduling Cost of generation ($/h) | 664.88 | 947.19 | |||
Table 9.
Line loading of the 30-bus system.
Table 9.
Line loading of the 30-bus system.
| Line Designation | Line Rating (p.u.) | Line Loading (p.u.) | |
|---|---|---|---|
| without FACTS | with UPFC | ||
| 1–2 | 1.3 | 2.327 | 1.317 |
| 2–4 | 0.65 | 0.856 | 0.648 |
| 2–6 | 0.65 | 0.945 | 0.65 |
In this case study, two curtailment strategies were applied to mitigate congestion that occurred during power dispatch. These curtailment strategies were implemented by using the willingness-to-pay price factor. After applying the above curtailment strategies, mitigation of congestion reduces the line flow of 1–2 lines to 1.294 pu, as shown in Table 10, and the outcomes of this case obtained from optimal dispatch without FACTS devices have been summarized in Table 10. From this table, it is obtained that for case 3A, where a group curtailment strategy was followed and the contracted power of all utilities was curtailed in varying amounts. Here, the transaction deviates to 185.14 MW from the desired transaction of 204.84 MW. Whereas for case 3B, the point-to-point curtailment strategy has been followed by groups 1 and 2, so the loads are badly affected badly with respect to the loads of group 3, and the transaction reduces to 174.8 MW from the desired transaction. From a comparative study, it is clear that the system operator mostly follows the group curtailment strategy due to its low power curtailment during power dispatch. Now, using this group strategy, the optimal power dispatch is found for 30 bus systems in the electricity market.
Table 10.
Congested line flow before and after congestion.
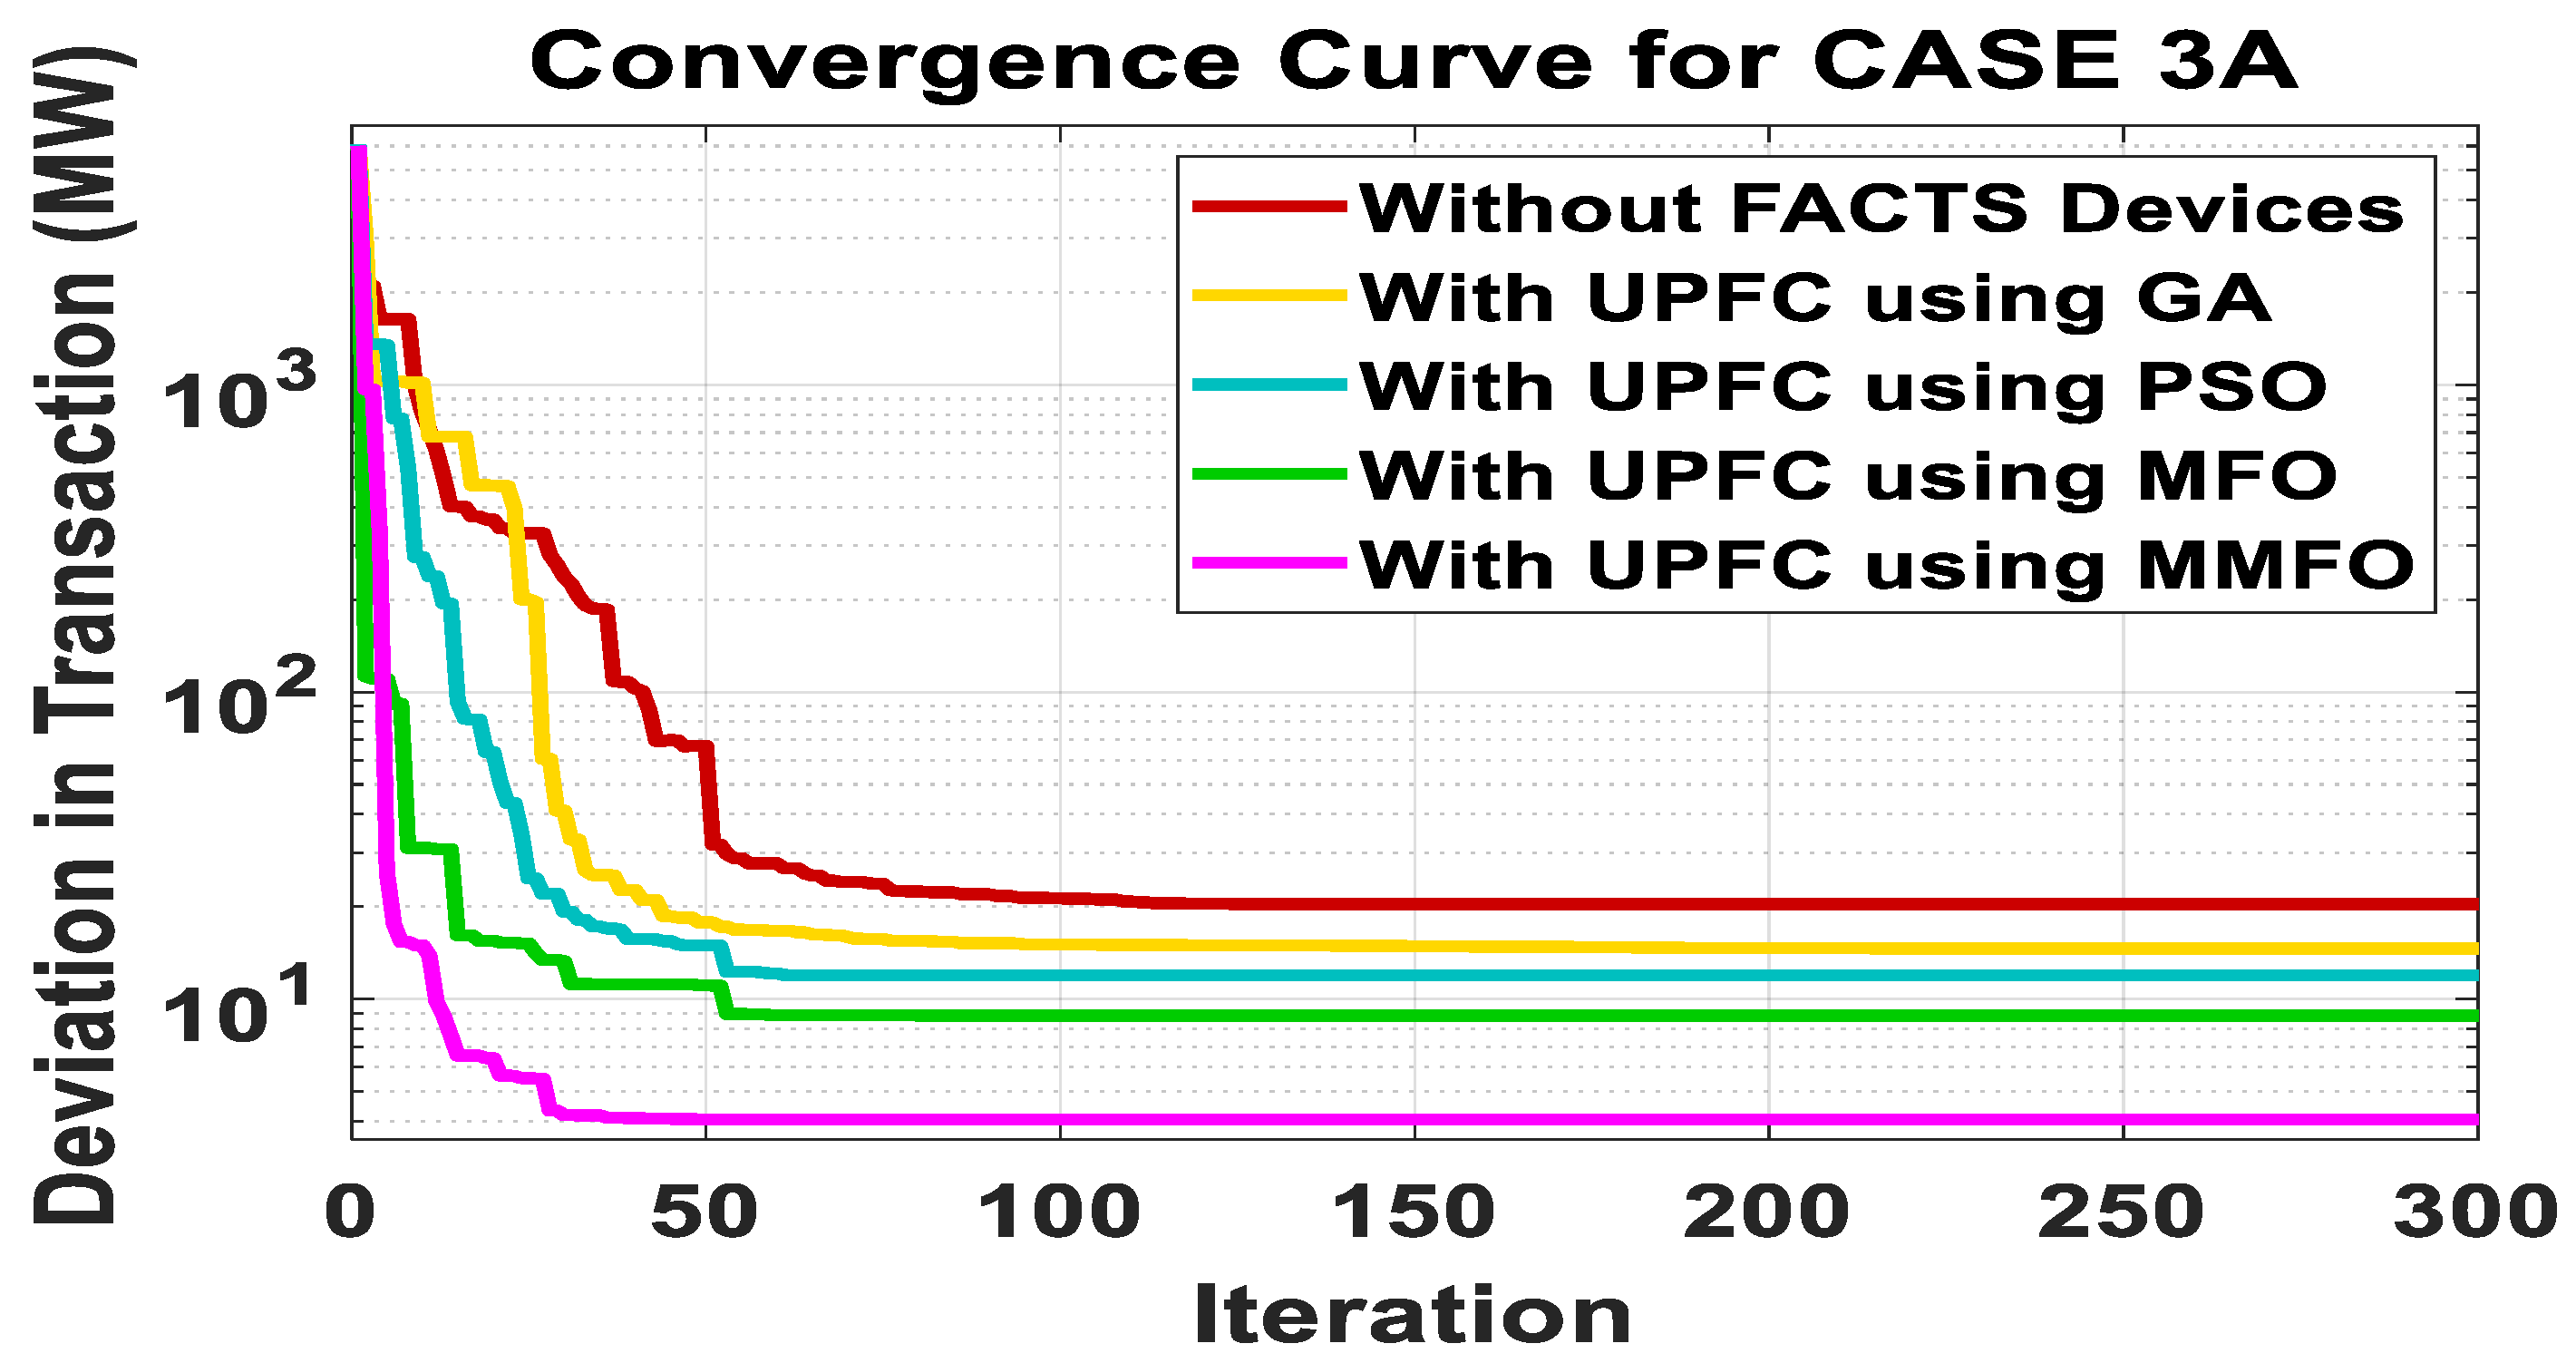
The optimal power dispatch modeling with UPFC considering group curtailment strategy using genetic algorithm (GA) [29], particle swarm optimization technique (PSO) [35], and moth flame optimization (MFO) techniques is solved here, and the outcomes obtained from all methods have been summarized in Table 11. From this table, it is observed that MMFO provides better results in comparison to other techniques. The total power transaction and individual power transactions are increased to a large extent by the MMFO technique in comparison to the aforementioned techniques. The total transaction occurring by generators using the MMFO technique is 200.41 MW, which shows an increase in total transaction with respect to 185.14 MW, 187.09 MW, 189.924 MW, and 195.57 MW attained by generators without FACTS, GA, PSO, and MFO techniques, respectively. It is also inferred that transactions done by generators 2, 3, 4, 5, and 6 using UPFC are greater than those done without FACTS. Hence, the impact of UPFC increases the transaction amount. Similarly, the deviation in transaction from the desired value attained by the suggested MMFO using UPFC is reduced to 4.43 MW from 19.7 MW attained without FACTS, it was also reduced from 17.75 MW, 14.916 MW, and 9.27 MW attained by GA, PSO, and MFO, respectively. The rescheduling cost obtained by the MMFO method is 469.12 $/h, whereas it becomes 493.6 $/h, 546.48 $/h, and 601.14 $/h by MFO, PSO, and GA, respectively. The addition of UPFC to the 30-bus system reduces the rescheduling cost from 469.12 $/h to 664.88 $/h, which is not achieved without FACTS devices. The loss [19] obtained by MMFO is 10.94 MW, which is found to be the least when compared with 11.31 MW, 13.65 MW, and 14.17 MW obtained by other techniques. Figure 11 shows optimal power dispatch with and without UPFC using different techniques, and its convergence characteristic is shown in Figure 12. From this convergence curve, it is obtained that MMFO convergence is faster with fewer iterations and with less time, as given in Table 12.
Table 11.
Optimal power dispatch with FACTS devices.
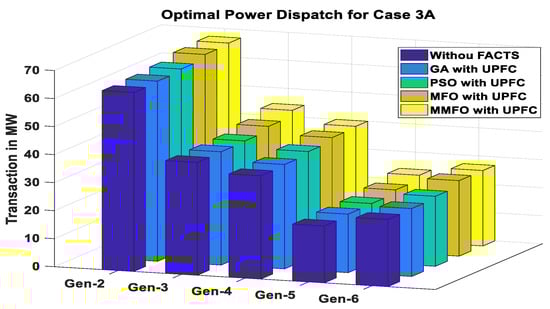
Figure 11.
Optimal power dispatch for case 3A.
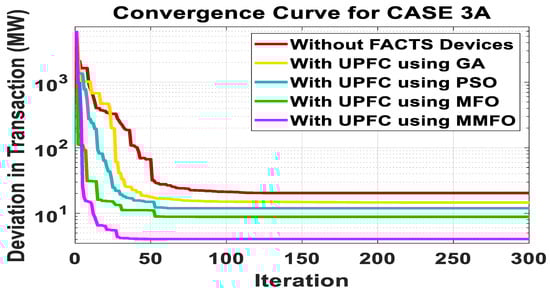
Figure 12.
Optimal power dispatch for case 3A.
Table 12.
Convergence time required by different techniques for case 3A.
6.2. Discussions: 14-Bus System and 30-Bus System
From the comparative analysis of the 14-bus system and the 30-bus system, it is found that deviations in requested transactions are minimized by the proposed MMFO technique using UPFC. It is also observed that the impact of UPFC on both systems has increased power dispatch. The loss attained by the proposed method is also very low for both systems. From the convergence characteristics shown in Figure 10 and Figure 12, it is seen that MMFO convergence is faster as compared to other techniques such as GA, PSO, and MFO, both with and without UPFC. The proposed technique provides optimized outcomes by satisfying all operational constraints. The time required to converge by all the aforementioned techniques is given in Table 7 and Table 12. The suggested technique achieves faster convergence with less time (16.91 s for a 14-bus system and 23.10 s for a 30-bus system) in comparison to other techniques and obtains a global optima rather than a local optima. Hence, from the relative studies, it can be inferred that the proposed approach is more efficient and reliable. The accuracy of this technique is higher because it reduces the deviation in power transactions.
7. Conclusions
In this paper, the MMFO technique is utilized with UPFC for the first time to reduce the deviation in power transactions in the deregulated electric market. Modification of the aforementioned optimization technique is achieved by suitably adapting its exploitation and exploration stages. The performance assessment of the suggested MMFO is verified by applying it to the standard test benchmark. The performance of MMFO when compared with other algorithms shows superiority for the suggested modification in the present context. In the proposed optimal power dispatch model, congestion management is done by employing three different curtailment strategies, such as group, separate, and point-to-point strategies. The deviation of power of each unit has been reduced considering these curtailment strategies, and among them, the group-curtailment strategy imparts the least curtailment. Furthermore, willingness-to-pay price factors are used to avoid power curtailment, and this provides intuition into the nature of competition in the emerging transmission market. In addition, the effect of UPFC has been analyzed for improving line loading and reducing congestion. Transmission loss and rescheduling cost of generation have been calculated for modified IEEE 14-bus and IEEE 30-bus systems. The impact of congestion management reduces loss and rescheduling costs by 20% and 27.14%, respectively, in a 14-bus system. And in a 30-bus system, these factors are reduced by 28% and 29.14%, respectively. From the comparative study, it is found that the proposed MMFO technique converges faster and yields better results by satisfying all operational constraints in terms of consistency and feasibility for minimizing transaction deviation and loss when compared with MFO, PSO, and GA techniques. However, if a larger system is taken into consideration along with renewable sources, then it will add more constraints to the system and make the problem more complex. Hence, a proper constraint handling method must be employed for the satisfaction of all operational constraints. Hence, the authors intend to manage congestion in larger power systems and study the impact of renewable energy generating units on power congestion.
Author Contributions
Conceptualization, A.S. and P.K.H.; methodology, A.S., F.A., P.K.H. and T.S.U.; software, A.S.; validation, A.S.; formal analysis, A.S. and T.S.U.; investigation, A.S. and P.R.S.; resources, A.S.; data curation, A.S.; writing—original draft preparation, A.S., P.K.H. and P.R.S.; writing—review and editing, F.A. and T.S.U.; visualization, A.S., S.A. and P.R.S.; supervision, P.K.H. and T.S.U.; project administration, T.S.U.; funding acquisition, T.S.U. All authors have read and agreed to the published version of the manuscript.
Funding
This research received no external funding.
Data Availability Statement
Not available.
Acknowledgments
This work was supported by the Researchers Supporting Project Number (RSPD2023R646), King Saud University, Riyadh, Saudi Arabia.
Conflicts of Interest
The authors declare no conflict of interest.
Nomenclature
| OPD | optimal power dispatch |
| MFO | moth flame optimization |
| MMFO | modified moth flame optimization |
| GENCOs | generating companies |
| DISCOs | distribution companies |
| LMPD | locational marginal-price dispatch |
| UPFC | unified power flow controller |
| A | a constant matrix that shows curtailment strategies follows by market utilities |
| w | diagonal matrix having elements of willingness-to-pay price factor |
| actual and desired control variables respectively i.e., active power injection or extraction. | |
| u | number of market participants |
| active and reactive power generation of GENCO-i | |
| active and reactive power demand of DISCO-i | |
| and | active and reactive power’s lower and upper limits of GENCO-i |
| voltage limit of GENCO-i | |
| G | number of group transfers |
| power injection at GENCO-i in pursuance of bilateral contract with aDISCO-j. | |
| power extraction by DISCO-j in pursuance of bilateral contract with aGENCO-i. | |
| power injection at GENCO-i under multilateral contract | |
| power extraction by DISCO-j under multilateral contract |
Appendix A
Table A1.
Detailed report of Literature.
Table A1.
Detailed report of Literature.
| Ref. | Problem’s Objective | Methodology | Techniques Used |
|---|---|---|---|
| [1] (2019) | minimize congestion rent | optimal power flow and available transfer capability | Gravitational search assisted algorithm |
| [2] (2015) | minimizing fuel and emission penalty cost of generators and congestion management | Optimal Location of Series FACTS Devices | Hybrid Bacterial Foraging and Nelder Mead Algorithm |
| [4] (1998) | Minimize transaction deviation for congestion management | Load curtailment using curtailment strtageies | Optimal power flow |
| [10] (2000) | minimize the curtailment of the contracted powers in a power market | Curtailment strategy | Optimal power flow |
| [25] (2021) | Minimize congestion cost | Voltagesecurity margin (λ) and corrected transient energy margin (CTEM) | MultiObjective Dragonfly Algorithm (MODA) |
| [33] (2019) | Minimization of Active Power Rescheduling Cost | By Identifying the Participating Rescheduling Generators | Twin Extremity Chaotic Map Adaptive Particle Swarm Optimization |
| [43] (2017) | improving voltage profile and reducing the power loss | Optimal placement and sizing of DGs | Moth flame optimization |
| [44] (2023) | minimize the cost of rescheduling and the total change in power after rescheduling. | sensitivity based rescheduling of generators | improved monarch butterfly optimization |
| [45] (2022) | optimizes the generating power and manages the congestion with minimized rescheduling cost. | rescheduling of generators | Hybridizing lion and moth search models |
| [46] (2022) | lower the cost of active and reactive power of the generators | reduce the deviation of rescheduled active and reactive power from scheduled values | Particle Swarm Optimization Algorithm |
| [47] (2023) | reduce transmission network congestion in a pool-based energy market | active power rescheduling of generators via Optimal DG Capacity | Firefly algorithm |
| [48] (2023) | minimum congestion cost | rescheduling of generators | Hybrid Deep Neural Network |
| [49] (2022) | minimizes the congestion with the smallest possible rescheduling price | rescheduling of generators | Particle Swarm Optimization with Distributed Acceleration Constants |
| [50] (2023) | Optimal location and sizing of DGs | optimum placement and sizing of DGs to be integrated with a transmission line system | Load Flow Based Scheme |
| [51] (2022) | minimum voltage security margin (VSM) index to eliminate the congestion of electrical lines | Transmission Switching (TS) based cost-effective approach | Load Flow Based Scheme |
| [52] (2021) | To Minimize Real Power Losses, Generation Cost and Voltage Deviations | Optimal Location of TCSC | Improved Grey Wolf Optimization (IGWO) |
Table A2.
Generator data for the 14-Bus System.
Table A2.
Generator data for the 14-Bus System.
| Generator Number | Voltage Limits | Reactive Power Limits | ||
|---|---|---|---|---|
| 1 | 0.95 | 1.08 | 0 | 40 |
| 2 | 0.95 | 1.08 | 0 | 60 |
| 3 | 0.95 | 1.08 | −20 | 100 |
| 4 | 0.95 | 1.08 | 0 | 87 |
| 5 | 0.95 | 1.09 | 0 | 35 |
Table A3.
Generator data for the 30-Bus System.
Table A3.
Generator data for the 30-Bus System.
| Generator Number | Voltage Limits | Reactive Power Limits | ||
|---|---|---|---|---|
| 1 | 0.96 | 1.06 | −30 | 100 |
| 2 | 0.96 | 1.043 | −30 | 100 |
| 3 | 0.96 | 1.01 | −30 | 100 |
| 4 | 0.96 | 1.01 | −30 | 100 |
| 5 | 0.96 | 1.082 | −30 | 100 |
| 6 | 0.96 | 1.071 | −30 | 100 |
References
- Shrestha, G.B.; Feng, W. Effects of series compensation on spot price power markets. Int. J. Electr. Power Energy Syst. 2005, 27, 428–436. [Google Scholar]
- Basu, J.B.; Dawn, S.; Saha, P.K.; Chakraborty, M.R.; Alsaif, F.; Alsulamy, S.; Ustun, T.S. Risk Mitigation & Profit Improvement of a Wind-Fuel Cell Hybrid System With TCSC Placement. IEEE Access 2023, 11, 39431–39447. [Google Scholar]
- Sharma, A.; Jain, S.K. Gravitational search assisted algorithm for TCSC placement for congestion control in deregulated power system. Electr. Power Syst. Res. 2019, 174, 105874. [Google Scholar]
- David, A.K. Dispatch methodologies for open access transmission systems. IEEE Trans. Power Syst. 1998, 13, 46–53. [Google Scholar]
- Patil, G.S.; Mulla, A.; Dawn, S.; Ustun, T.S. Profit Maximization with Imbalance Cost Improvement by Solar PV-Battery Hybrid System in Deregulated Power Market. Energies 2022, 15, 5290. [Google Scholar]
- Vengadesan, A. Transmission Congestion Management through Optimal Placement and Sizing of TCSC Devices in a Deregulated Power Network. Turk. J. Comput. Math. Ed. 2021, 12, 5390–5403. [Google Scholar]
- Patil, G.S.; Mulla, A.; Ustun, T.S. Impact of Wind Farm Integration on LMP in Deregulated Energy Markets. Sustainability 2022, 14, 4354. [Google Scholar]
- Pillay, A.; Karthikeyan, S.P.; Kothari, D.P. Congestion management in power systems—A review. Int. J. Electr. Power Energy Syst. 2015, 70, 83–90. [Google Scholar]
- Basu, J.B.; Dawn, S.; Saha, P.K.; Chakraborty, M.R.; Ustun, T.S. A Comparative Study on System Profit Maximization of a Renewable Combined Deregulated Power System. Electronics 2022, 11, 2857. [Google Scholar]
- Hussain, S.M.S.; Aftab, M.A.; Nadeem, F.; Ali, I.; Ustun, T.S. Optimal Energy Routing in Microgrids with IEC 61850 Based Energy Routers. IEEE Trans. Ind. Electr. 2020, 67, 5161–5169. [Google Scholar]
- Das, A.; Dawn, S.; Gope, S.; Ustun, T.S. A Strategy for System Risk Mitigation Using FACTS Devices in a Wind Incorporated Competitive Power System. Sustainability 2022, 14, 8069. [Google Scholar]
- Pal, S.; Sen, S.; Sengupta, S. Power network reconfiguration for congestion management and loss minimization using Genetic Algorithm. In Proceedings of the Michael Faraday IET International Summit 2015, Kolkata, India, 12–13 September 2015; pp. 291–296. [Google Scholar]
- Houndjéga, M.; Muriithi, C.M.; Wekesa, C.W. Active power rescheduling for congestion management based on generator sensitivity factor using ant lion optimization algorithm. Int. J. Eng. Res. Technol. 2018, 11, 1565–1582. [Google Scholar]
- Gupta, D.; Jain, S.K. Available transfer capability enhancement by FACTS devices using metaheuristic evolutionary particle swarm optimization (MEEPSO) technique. Energies 2021, 14, 869. [Google Scholar]
- Gautam, A.; Sharma, G.; Bokoro, P.N.; Ahmer, M.F. Available transfer capability enhancement in deregulated power system through tlbo optimised tcsc. Energies 2022, 15, 4448. [Google Scholar]
- Verma, S.; Saha, S.; Mukherjee, V. Optimal rescheduling of real power generation for congestion management using teaching-learning-based optimization algorithm. J. Electr. Syst. Inf. Technol. 2018, 5, 889–907. [Google Scholar]
- Singh, J.G.; Qazi, H.W.; Ghandhari, M. Load curtailment minimization by optimal placement of Unified Power Flow Controller. Int. Trans. Electr. Energy Syst. 2016, 26, 2272–2284. [Google Scholar]
- Fang, R.S.; David, A.K. Optimal dispatch under transmission contracts. IEEE Trans. Power Syst. 1999, 14, 732–737. [Google Scholar]
- Srivastava, S.C.; Kumar, P. Optimal power dispatch in deregulated market considering congestion management. In Proceedings of the IEEE International Conference on Electric Utility Deregulation and Restructuring and Power Technologies, London, UK, 4–7 April 2000; pp. 53–59. [Google Scholar]
- Fang, R.S.; David, A.K. Transmission congestion management in an electricity market. IEEE Trans. Power Syst. 1999, 14, 877–883. [Google Scholar]
- Agrawal, A.; Pandey, S.N.; Srivastava, L.; Walde, P.; Saket, R.K.; Khan, B. Multiobjective Salp Swarm Algorithm Approach for Transmission Congestion Management. Int. Trans. Electr. Energy Syst. 2022, 2022, 8256908. [Google Scholar] [CrossRef]
- Dashtdar, M.; Najafi, M.; Esmaeilbeig, M. Calculating the locational marginal price and solving optimal power flow problem based on congestion management using GA-GSF algorithm. Electr. Eng. 2020, 102, 1549–1566. [Google Scholar]
- Wang, Q.; Zhang, G.; McCalley, J.D.; Zheng, T.; Litvinov, E. Risk-based locational marginal pricing and congestion management. IEEE Trans. Power Syst. 2014, 29, 2518–2528. [Google Scholar]
- Acharya, N.; Mithulananthan, N. Locating series FACTS devices for congestion management in deregulated electricity markets. Electr. Power Syst. Res. 2007, 77, 352–360. [Google Scholar]
- Saravanan, C.; Anbalagan, P. Multi objective dragonfly algorithm for congestion management in deregulated power systems. J. Ambient Intell. Humaniz. Comput. 2021, 12, 7519–7528. [Google Scholar]
- Esmaili, M.; Shayanfar, H.A.; Moslemi, R. Locating series FACTS devices for multi-objective congestion management improving voltage and transient stability. Eur. J. Oper. Res. 2014, 236, 763–773. [Google Scholar]
- Mishra, A. Congestion management of deregulated power systems by optimal setting of Interline Power Flow Controller using Gravitational Search algorithm. J. Electr. Syst. Inf. Technol. 2017, 4, 198–212. [Google Scholar]
- Jamnani, J.G.; Pandya, M. Coordination of SVC and TCSC for management of power flow by particle swarm optimization. Energy Procedia 2019, 156, 321–326. [Google Scholar]
- Kumar, S.V.; Sreenivasulu, J.; Kumar, K.V. Genetic Algorithm based Congestion Management by using Optimal Power Flow Technique to Incorporate FACTS Devices in Deregulated Environment. Int. J. Innov. Res. Electr. Electron. Instrum. Control Eng. 2014, 2, 2220–2225. [Google Scholar]
- Vijayakumar, K. Optimal location of FACTS devices for congestion management in deregulated power systems. Int. J. Comput. Appl. 2011, 16, 29–37. [Google Scholar]
- Bavithra, K.; Raja, S.C.; Venkatesh, P. Optimal setting of FACTS devices using particle swarm optimization for ATC enhancement in deregulated power system. IFAC-Pap. Line 2016, 49, 450–455. [Google Scholar]
- Verma, S.; Mukherjee, V. Firefly algorithm for congestion management in deregulated environment. Eng. Sci. Technol. Int. J. 2016, 19, 1254–1265. [Google Scholar]
- Batra, I.; Ghosh, S. A novel approach of congestion management in deregulated power system using an advanced and intelligently trained twin extremity chaotic map adaptive particle swarm optimization algorithm. Arab. J. Sci. Eng. 2019, 44, 6861–6886. [Google Scholar]
- Chintam, J.R.; Daniel, M. Real-power rescheduling of generators for congestion management using a novel satin bowerbird optimization algorithm. Energies 2018, 11, 183–198. [Google Scholar]
- Dutta, S.; Singh, S.P. Optimal rescheduling of generators for congestion management based on particle swarm optimization. IEEE Trans. Power Syst. 2008, 23, 1560–1569. [Google Scholar]
- Gautam, A.; Sharma, P.; Kumar, Y. Mitigating congestion in restructured power system using FACTS allocation by sensitivity factors and parameter optimized by GWO. Adv. Sci. Technol. Eng. Syst. J. 2020, 5, 1–10. [Google Scholar]
- Kumar, B.V.; Srikanth, N.V. Optimal location and sizing of Unified Power Flow Controller (UPFC) to improve dynamic stability: A hybrid technique. Int. J. Electr. Power Energy Syst. 2015, 64, 429–438. [Google Scholar]
- Mirjalili, S. Moth-flame optimization algorithm: A novel nature-inspired heuristic paradigm. Knowl.-Based Syst. 2015, 89, 228–249. [Google Scholar]
- Chauhan, A.; Upadhyay, S.; Khan, M.T.; Hussain, S.M.S.; Ustun, T.S. Performance Investigation of a Solar Photovoltaic/Diesel Generator Based Hybrid System with Cycle Charging Strategy Using BBO Algorithm. Sustainability 2021, 13, 8048. [Google Scholar]
- Bentouati, B.; Chaib, L.; Chettih, S. Optimal power flow using the moth flam optimizer: A case study of the Algerian power system. Indones. J. Electr. Eng. Comput. Sci. 2016, 1, 431–445. [Google Scholar]
- Mei, R.N.S.; Sulaiman, M.H.; Mustaffa, Z.; Daniyal, H. Optimal reactive power dispatch solution by loss minimization using moth-flame optimization technique. Appl. Soft Comput. 2017, 59, 210–222. [Google Scholar]
- Sahoo, A.; Hota, P.K. Moth Flame optimization algorithm based optimal strategic bidding in deregulated electricity market. In Proceedings of the IEEE Region 10 Conference (TENCON), Kochi, India, 17–20 October 2019; pp. 2105–2110. [Google Scholar]
- Hussien, S.A.; Mahmoud, H. Optimal placement and sizing of DGs in distribution system for improving voltage profile and reducing the power loss using moth flame optimization technique. Int. J. Sci. Res. Eng. Technol. 2017, 6, 161–167. [Google Scholar]
- Singh, V.; Fozdar, M.; Malik, H.; Márquez, F.P.G. Transmission congestion management through sensitivity based rescheduling of generators using improved monarch butterfly optimization. Int. J. Electr. Power Energy Syst. 2023, 145, 108729. [Google Scholar]
- Srivastava, J.; Yadav, N.K. Rescheduling-based congestion management by metaheuristic algorithm: Hybridizing lion and moth search models. Int. J. Numer. Model. Electron. Netw. Devices Fields 2022, 35, e2952. [Google Scholar]
- Ogunwole, E.I.; Krishnamurthy, S. Transmission Congestion Management Using Generator Sensitivity Factors for Active and Reactive Power Rescheduling Using Particle Swarm Optimization Algorithm. IEEE Access 2022, 10, 122882–122900. [Google Scholar]
- Thiruvel, A.; Thiruppathi, S.; Chidambararaj, N.; Aravindhan, K. Modern Power System Operations in Effective Transmission Congestion Management via Optimal DG Capacity Using Firefly Algorithms. In Proceedings of the 2023 9th International Conference on Electrical Energy Systems (ICEES), Chennai, India, 23–25 March 2023; pp. 360–365. [Google Scholar]
- Agrawal, A.; Pandey, S.N.; Srivastava, L.; Walde, P.; Singh, S.; Khan, B.; Saket, R.K. Hybrid deep neural network-based generation rescheduling for congestion mitigation in spot power market. IEEE Access 2022, 10, 29267–29276. [Google Scholar]
- Yadav, N.K. A novel hybridized algorithm for rescheduling based congestion management. Wirel. Netw. 2023, 1–16. [Google Scholar] [CrossRef]
- Varghese, J.P.; Sundaramoorthy, K.; Sankaran, A. Development and Validation of a Load Flow Based Scheme for Optimum Placing and Quantifying of Distributed Generation for Alleviation of Congestion in Interconnected Power Systems. Energies 2023, 16, 2536. [Google Scholar]
- Roustaei, M.; Letafat, A.; Sheikh, M.; Sadoughi, R.; Ardeshiri, M. A cost-effective voltage security constrained congestion management approach for transmission system operation improvement. Electr. Power Syst. Res. 2022, 203, 107674. [Google Scholar]
- Behera, S.K.; Mohanty, N.K. Congestion management using thyristor controlled series compensator employing Improved Grey Wolf Optimization technique. Int. J. Electr. Eng. Educ. 2021, 58, 179–199. [Google Scholar]


Disclaimer/Publisher’s Note: The statements, opinions and data contained in all publications are solely those of the individual author(s) and contributor(s) and not of MDPI and/or the editor(s). MDPI and/or the editor(s) disclaim responsibility for any injury to people or property resulting from any ideas, methods, instructions or products referred to in the content. |
© 2023 by the authors. Licensee MDPI, Basel, Switzerland. This article is an open access article distributed under the terms and conditions of the Creative Commons Attribution (CC BY) license (https://creativecommons.org/licenses/by/4.0/).