Article

The Influence of the Material Type and the Placement in the Print Chamber on the Roughness of MJF-Printed 3D Objects

Department of Manufacturing Systems, Faculty of Mechanical Engineering and Robotics, AGH University of Science and Technology, 30-059 Kraków, Poland
Machines 2022, 10(1), 49; https://doi.org/10.3390/machines10010049
Submission received: 29 November 2021 / Revised: 24 December 2021 / Accepted: 4 January 2022 / Published: 9 January 2022

Abstract

:
This paper describes a surface-roughness study performed on samples manufactured additively using the Multi Jet Fusion (MJF) technology. The samples were divided into three groups based on the material used in the process: polypropylene (PP), thermoplastic polyurethane (TPU), and polyamide 11 (PA11). Subsequently, they were tested by means of a roughness-measuring system, which made it possible to determine the typical surface roughness parameters ( R a , R q , R z ). The tests were designed to examine whether the placement and orientation of 3D objects while printing, in connection with the material used, can significantly influence the surface quality of MJF-printed objects. The results show that the TPU samples have a surface roughness much higher than the PP and PA11 ones, which exhibit roughness levels very similar to each other. It can also be concluded that surfaces printed vertically (along the Z-axis) tend to be less smooth—similarly to the surfaces of objects made of TPU located in the central zones of the print chamber during printing. This information may be of value in cases where low surface roughness is preferred (e.g., manufacturing patient-specific orthoses), although this particular study does not focus on one specific application.

1. Introduction

Additive manufacturing in the form of 3D printing is becoming more and more accessible and affordable. It is being used by an ever-increasing number of people, even in the comfort of their own homes [1]. Although fused-deposition modeling (FDM) is still the predominant 3D printing method, other technologies, including powder bed fusion (PBF) ones, are becoming more and more popular. Three-dimensional prints can be analyzed in a number of ways—for example, from the point of view of their watertightness [2], strength [3], roughness [4], or their general dimensional accuracy [5]. Both the material and the technology used can definitely influence the quality of the final product, and that also includes its surface quality.
Even though thermoplastics are still the most commonly used materials in the field of 3D printing, they are not the only ones that can be used for that purpose. Other materials are used, as well, including such materials that no one would have thought of a decade ago. Printing in metal, despite being a relatively old technology, is currently gaining momentum and has the potential of manufacturing parts that are much stronger than those made of plastic [6]. With recent developments in biomedicine, 3D printing of tissues is already possible, and it may also be feasible to print entire organs in the future [7]. Three-dimensional printing also has its place in the world of electronics, where it can be used to manufacture electronic objects such as circuit boards [8]. A class of much larger 3D printers includes those capable of printing in concrete, which makes it possible to obtain building-like structures [9]. Finally, there are also 3D printers that can manufacture food items, not only for visual effect, but for nutritional value [10].
Selective laser sintering (SLS) is a 3D printing method that involves sintering, (i.e., coalescing into a solid or porous mass by means of heating without melting) powdered thermoplastic materials by using a heat source, such as CO2, diode, or optical fiber lasers. Materials that are commonly used in SLS include mainly polyamides (nylons), especially PA11 and PA12. It is significantly older than the Multi Jet Fusion technology, as it was initially developed as early as 1986 [11]. It belongs to the same family as MJF (powder bed fusion); hence it is listed here for comparison.
Multi Jet Fusion (MJF) is a relatively new and promising technology developed by Hewlett-Packard (HP) and introduced in 2017 [12]. Just like SLS, it uses powdered materials; however, instead of sintering the particles by means of a laser heat source, an inkjet printhead forms 3D components by applying two different binder fluids (fusing and detailing agents) to the surface of the powder bed. The fusing agent is applied inside the model boundaries, while the detailing agent is applied at the edges of the model [13]. Additionally, the CMYK (cyan, magenta, yellow, key) coloring agent gives a hue to selected regions of the print, which makes it possible to obtain a specific surface color, as in the case of traditional color printers. MJF is more predictable than SLS, since it takes the same amount of time for each layer to be printed, regardless of the shape or the size of the model. In general, it is also at least two times faster than SLS. Moreover, it offers high reusability, as printing materials are designed to minimize powder waste and can be reused in a later build [14]. It has also been reported that, being capable of printing 30 million drops per second across the width of the printing area, it can achieve very accurate dimensional precision (±0.2%) in comparison with other technologies [15].
Some of the unconventional applications of 3D printing include biomedical ones, such as for orthoses that are tailor-made for individual patients [16,17]. Achieving the optimal surface quality can definitely improve the overall comfort of using an orthosis and also reduce the wearing out of clothes that come in contact with it. Therefore, it is desirable to make the roughness of those surfaces as low as possible. MJF is much better than FDM in terms of surface quality and even better than SLS in terms of dimensional accuracy. Moreover, MJF-printed objects are not as brittle as those made using SLS when it comes to breaking [13].
The present study aimed to verify whether the placement and orientation inside the print chamber can increase or decrease the overall surface roughness of MJF-printed parts. At the same time, the surface roughness of the three different materials—polypropylene (PP), thermoplastic polyurethane (TPU), and polyamide 11 (PA11)—was tested. Those materials are not the most common when it comes to MJF printing [18], which is why they seem to provide an interesting area of research. The following paragraphs contain some background information concerning the materials themselves.
Polypropylene is the second-most-common petroleum-based plastic material next to polyethylene, to which it is similar, although it exhibits a much higher resistance to stress cracking [19].
Thermoplastic polyurethane is a versatile polymeric material exhibiting excellent physical properties [20]. It has high elasticity as well as impact strength, and it retains flexibility over a wide temperature range while also displaying high-energy radiation resistance [21].
Polyamide 11, being a bioplastic that belongs to the nylon family, is unique among other polyamides in that it is non-petroleum sourced [22] and is derived from castor plants [23]. It is also less common than, e.g., PA12 in the field of 3D printing.
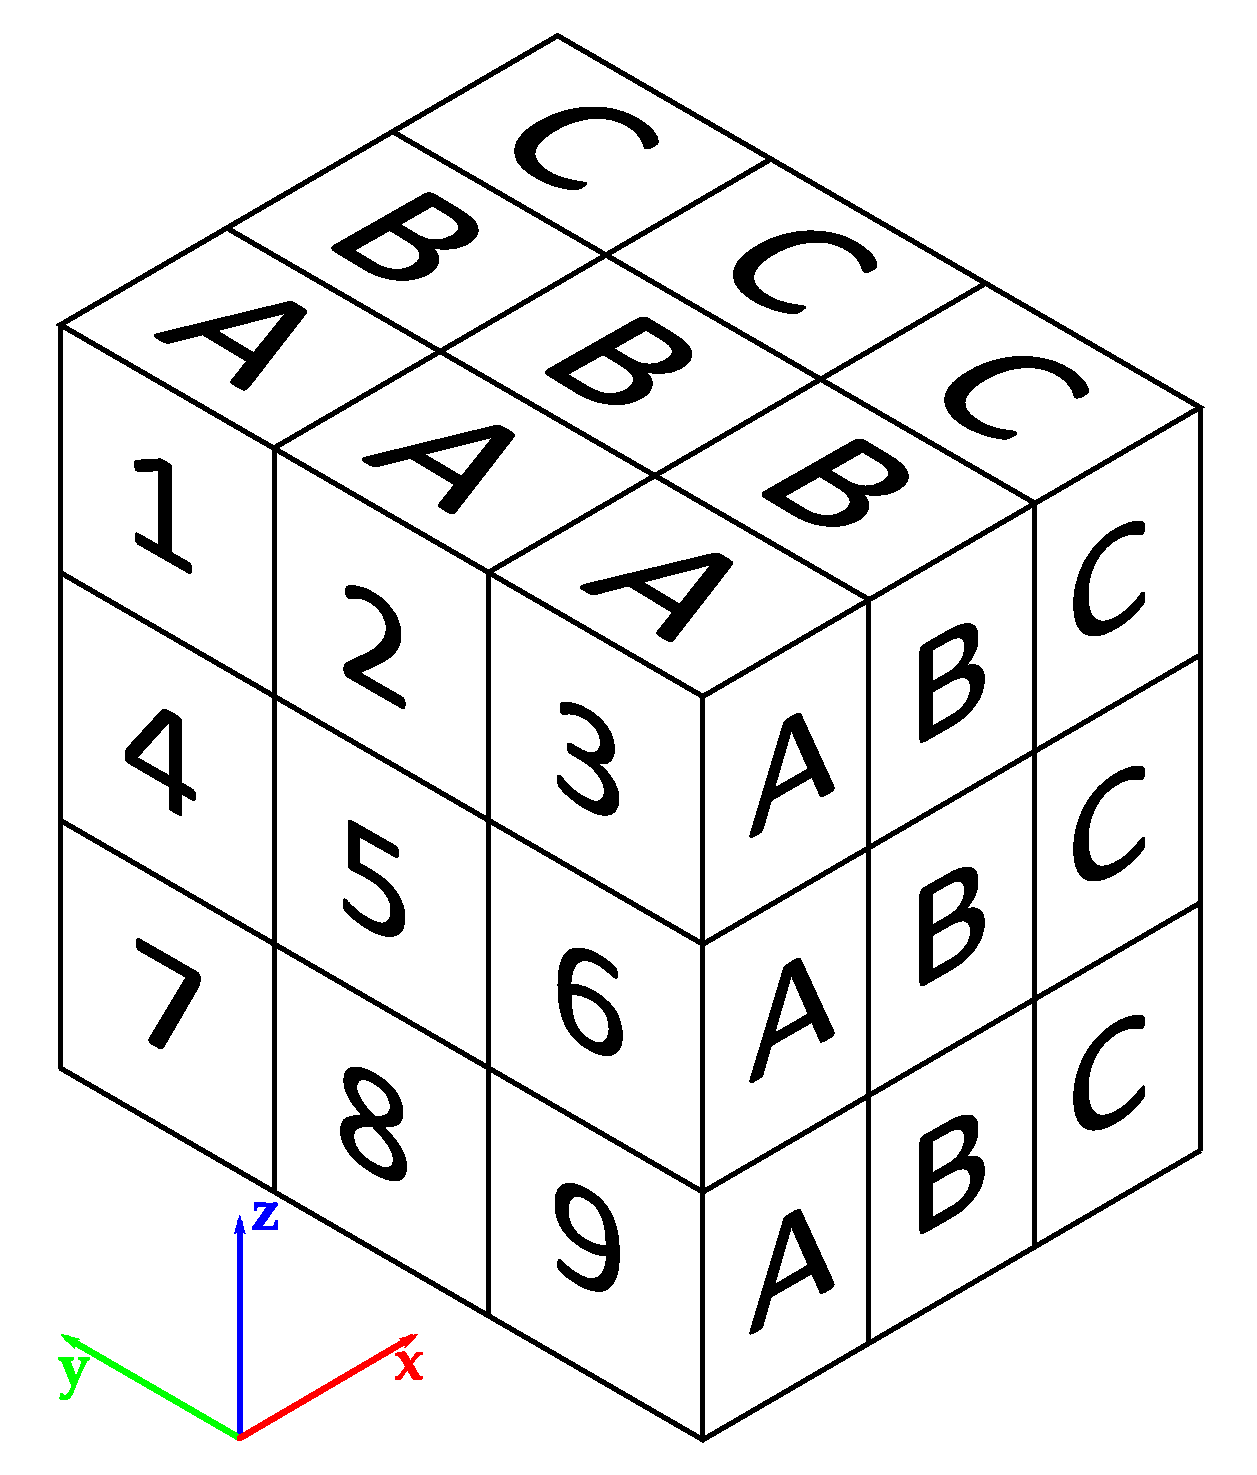
There have been surface quality and dimensional accuracy tests performed, for example, on MJF-printed cubes; however, the number of samples was rather low, and the polymer used was PA12 [24]. It is therefore worth verifying whether the other polymers perform better in terms of the resulting surface quality, which is also one of the goals of this study.

2. Materials and Methods

2.1. Print Method

The technology used for this experiment was Multi Jet Fusion (MJF). In this printing method, the build process begins by spreading a thin layer of powdered material across the working area. The material is placed on the print bed layer by layer, and the HP inkjet printheads, mounted on the printing and fusing carriage moving from left to right, carefully apply fusing agents, detailing agents, and CMYK coloring agents to the surface of the powder. Next, a heat source—namely an infrared lamp—goes over the print bed. The leading energy source preheats the working area immediately before printing, in order to provide consistent and accurate temperature control of each layer as it is printed [14]. The fusing agent is a dark substance that absorbs heat. The area of the print chamber to which that agent has been applied absorbs the energy from the lamps, and the powder melts, fusing the consecutive layers on the voxel level. During the next stage, the appropriate combination of the CMYK coloring agents (cyan, magenta, yellow, and key) is applied. The infrared light used causes the powder to melt. An illustration that presents the concept of 3D printing with the MJF technology is provided in Figure 1.
The samples were printed using the HP Jet Fusion 580 Color 3D printer with a built volume of 332 × 190 × 248 mm3 (a fuller list of its specifications can be found in Table 1). The printing resolution was 50 μm, and the layer height was set to 80 μm (the lowest possible). Those are the only adjustable parameters that the printer offers. The designed model placed the samples inside the print chamber in different zones and orientations, so as to examine the potential influence of the placement and print direction on the surface quality of the obtained objects. A 3D model of the distribution and orientation of the samples is presented in Figure 2, while the distribution of the zones and their designations can be seen in Figure 3. Each of the 27 zones of the print chamber included 6 samples in 6 different orientations (XY, XZ, YX, YZ, ZX, ZY) for each material used. There are also other shapes visible there, which were printed to be subjected to other types of tests.

2.2. Samples

For the measurements, “dog-bone”-shaped tensile test bars had been provided. The shape is based on the ISO 527 standard for evaluating tensile properties [25], although it does not seem to follow it completely. Since the samples were provided by a third party, it was not entirely clear what further tests had been arranged for them. Therefore, whether the shape fully meets the aforementioned standard is irrelevant from the point of view of this study, seeing that it meets all the criteria for performing roughness measurements. The specimens were made of different thermoplastics. More specifically, the materials included:
  • PP (polypropylene);
  • TPU (thermoplastic polyurethane);
  • PA11 (polyamide 11).
A total of 162 samples (27 subzones, 6 orientations) made of each material, 486 in total, were analyzed. The examined samples had not undergone any further processing, except being subjected to pressurized air, since every MJF part is subjected to that. The theoretical, ideal dimensions of the samples have been presented in Figure 4.
In Figure 5, we can see a series of nine samples printed from thermoplastic polyurethane (TPU). More interesting than the overall shape of the samples is the surface structure for each type of material, and that can be seen in Figure 6. The surface obtained for polypropylene is visually almost identical to that in the case of polyamide 11. The samples for each material had been divided into 18 sets in order to facilitate the taking of measurement and the exporting of the obtained results (according to the main zones and orientation in space).

2.3. Measurements

All of the roughness measurements were taken using the Mitutoyo Formtracer SV-C3000 roughness and contour measuring system equipped with the SV-C4500 roughness detector, which is compliant with the ISO-1997 and JIS-2001 standards. It has a measuring force of 0.75 mN and a tip radius of 1 μm. The vertical (Z1 axis) resolution of the detector is 0.01 μm. A more complete list of its specifications can be found in Table 2. A technical drawing of the detector unit is shown in Figure 7, while an actual picture can be seen in Figure 8, together with a PP sample being measured.
The measuring conditions were chosen in accordance with ISO 4288 [27] and ISO 3274 [28] for non-periodic profiles. The surfaces of objects 3D-printed using powder bed fusion technologies can be classified as directionless in terms of their structure, since it is not really possible to define any regular traces in a specific direction on them, unlike in the popular FDM technology, for example.
Three common roughness parameters were used to assess the quality of the surface. They are usually defined as follows:
The R a parameter expresses the arithmetic mean deviation of the roughness profile from its center line. In practice, it is typically calculated for a finite set of values and can be approximated by a sum, as in Equation (1):
R a = 1 l 0 l | z ( x ) | d x 1 n i = 1 n | z i | ,
where l stands for the evaluation length, and z ( x ) . is the distance from the mean line to the measurement point on the surface profile. The discrete version of the formula replaces the evaluation length with the number of registered samples, n .
The R q parameter, known as the root mean square (RMS) deviation of the roughness profile, is expressed by Equation (2). The rest of the symbols are identical to those in the previous equation.
R q = 1 l 0 l z 2 ( x ) d x 1 n i = 1 n | z i 2 | .
The 10-point mean roughness height, denoted by R z , is the sum of the mean value of the five highest peaks and the mean value of the five deepest valleys within the evaluation length l . More precisely, it is computed according to Equation (3):
R z = 1 5 ( i = 1 5 | z p i | + i = 1 5 | z v i | ) ,
where z p i corresponds to the five highest profile peaks and z v i corresponds to the five deepest valleys of the roughness profile over the evaluation length.
Every sample was placed flat horizontally in a precision vise without applying too much force so as to avoid deforming the sample. The vertical metal bar was used to ensure that each measurement began at a similar location on the surface of the sample (the stylus was set to return to the initial position after it had traveled the full distance). In each case, the measurement length was set to 48 mm (which is the recommended stylus travel distance), the evaluation length to 40 mm, and parameters describing surface roughness such as R a , R q , and R z were computed by the software Formtracepak provided with the measuring system, which facilitates the acquisition as well as the processing of measurement results. The distance between the consecutive points was set to 0.005 mm, and the sampling length was 8 mm (five line segments per evaluation length).
There might have been samples whose roughness was slightly lower than 10 μm, but there were only a few of them, especially considering the total number of samples. Therefore, the most appropriate settings for the measurements were chosen based on the majority of the samples. In general, sometimes, there may be insufficient space for the stylus to travel the recommended distance, and it may therefore be necessary to adjust the rest of the parameters, but in these tests, all of the samples were long enough, since the measurements were taken along their length. The roughness of each sample was measured along its length on the front part (where the symbol was), as close to its symmetry line as possible. The measurement parameters are listed collectively in Table 3.
In order to make the measurements as reliable as possible, each surface had to be kept as level as possible, since the vertical range of the stylus movement in that particular device is from −0.4 to 0.4 mm. Any deviations outside that range could result in the measurement being finished prematurely or in something akin to clipping known from audio processing. Either way, that would make the results highly questionable. This problem was particularly relevant in the case of the TPU samples, because those samples were the most flexible ones. The relatively high measuring length (48 mm) was also an unfavorable factor to consider, as it could render the results unreliable if the sample was improperly aligned.

3. Results and Discussion

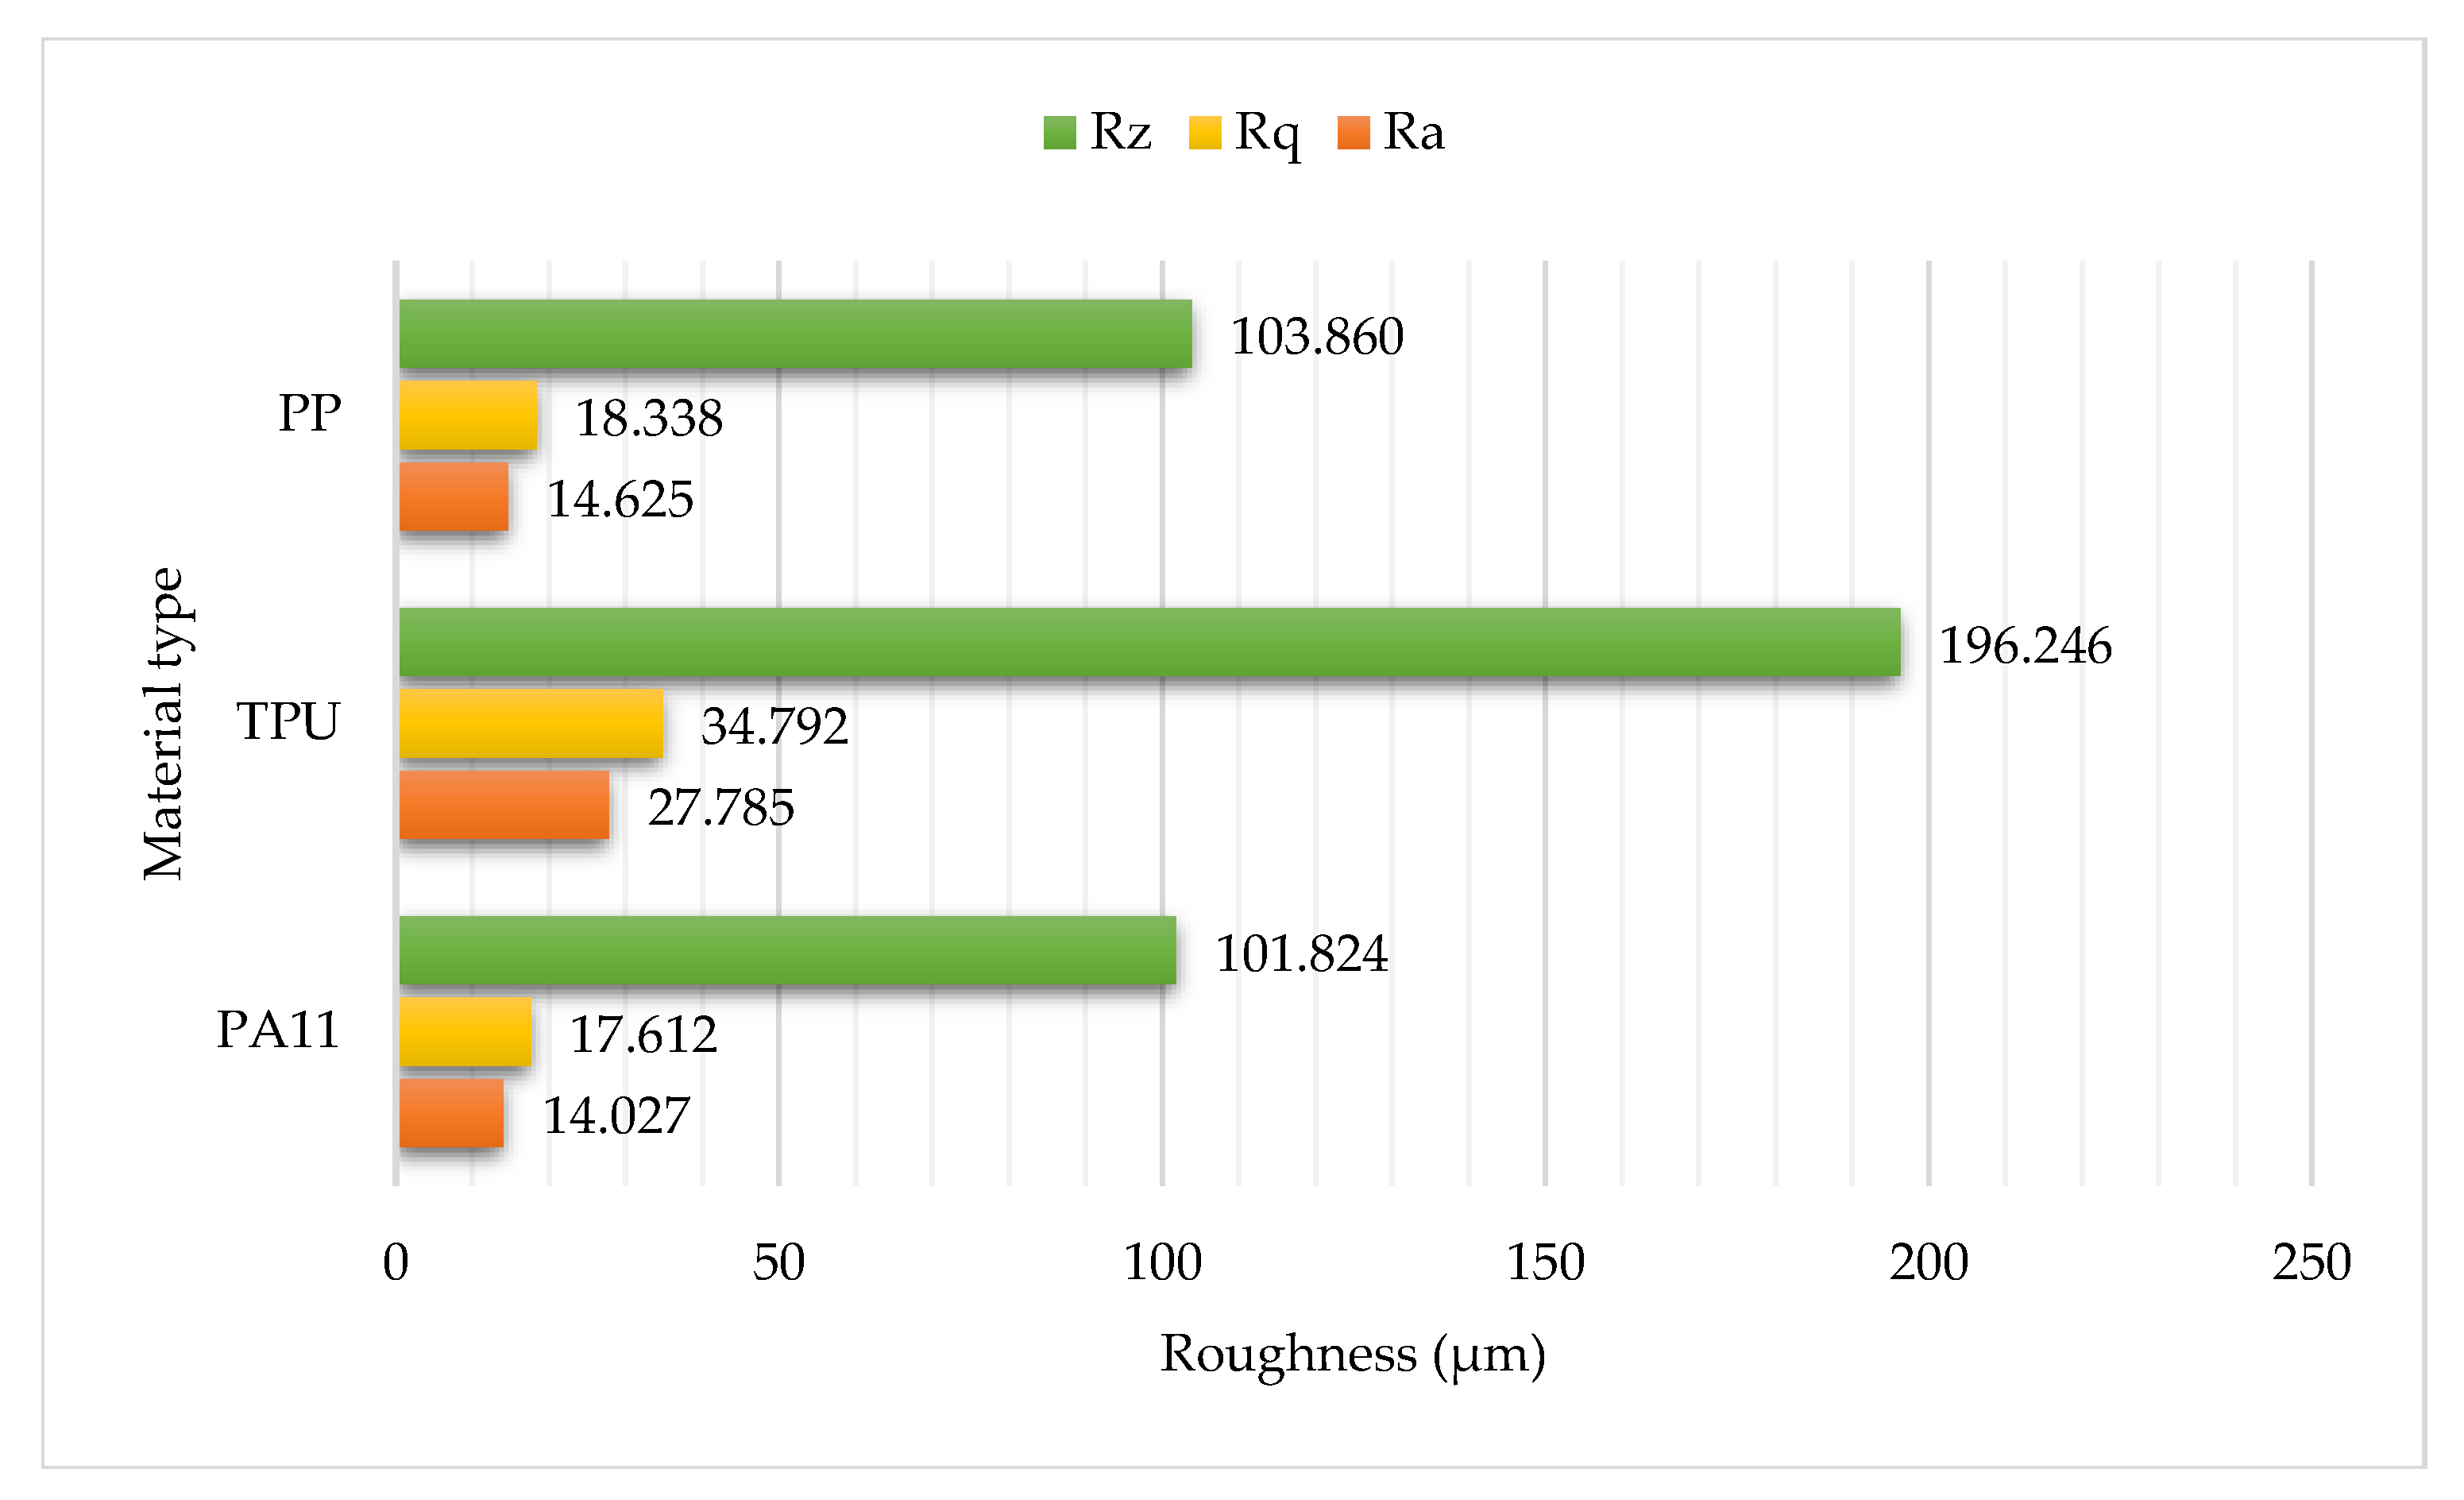
After measuring all of the samples, the computer-calculated values of the selected parameters were exported and analyzed. The obtained results have been grouped and presented graphically both for the respective materials and the print chamber zones along with the orientation. This should make it easier to analyze and interpret them. In Figure 9, we can see the arithmetic mean values of the three typical roughness parameters obtained for the respective material types. All of the parameters employed are expressed in micrometers.
On the next plot, shown in Figure 10, the standard deviations for the three computed roughness parameters have been presented in order to see how much, on average, the results diverge from the determined mean values.
Based on the averaged-out values for the respective materials, it can be observed that the samples made of flexible thermoplastic polyurethane (TPU) display a roughness level that is nearly twice as high as that for the other two materials, and their average R a comes up almost to 28 µm. The surface roughness of the polypropylene (PP) samples is similar to that of the polyamide 11 (PA11) samples, with the average R a falling within the interval from 14 to 15 µm.
The mean value of the R a parameter for the material PP was 14.625 μm; for TPU, it was 27.785 μm, and for PA11—14.027 μm. For comparison, Table 4 lists the typical R a values obtained in some other manufacturing technologies for selected materials.
Next, we can observe how the R a values for each material are correlated if we look at Figure 11, where the samples are ordered by their respective zones and orientations, from A1XY to C9ZY. Even visually, one can see that the results for PP and PA11 are more closely correlated than those for PP and TPU. For PP and PA11, the calculated value of the Pearson correlation coefficient was 0.415, which suggests a moderate correlation, whereas for PP and TPU, the calculated correlation was only 0.037. The two-tailed p-value for PP and PA11, under the assumption that both datasets were normally distributed (which they roughly were), was as low as 0.00000004041. This indicates that the probability of uncorrelated datasets yielding a similar value of the Pearson coefficient was extremely low. As could be expected, the p-value obtained for PP and TPU was significantly higher and reached 0.6408.
Figure 12 shows the averaged-out values of R a for the respective print chambers (including all six orientations). The highest nine values in the print chamber are marked in red, and the lowest nine values are marked in green. The intermediate values are highlighted in yellow.
A brief analysis of the averaged-out results does not suggest any significant relationship between the roughness of a sample and its location when considering all 27 subzones for PP and PA11. Nonetheless, particularly for TPU, we can see that most of the maximum values are found in zone B treated as a whole.
For the samples made of PP, the highest R a value was registered for zone B4 in the ZX orientation (18.784 μm). For the same zone and the same material, the highest values of R q (23.613 μm) and R z (138.538 μm) were also recorded. In the case of TPU, it was mainly zone B9 in the XY orientation, where R a was 36.885 μm and R q was 45.333 μm. On the other hand, R z was the highest in zone B7 and the YX orientation, and it reached 250.839 μm. For the last material, PA11, R a reached 18.371 μm in zone B4 and the ZX orientation, R q was 23.227 μm there, and the maximum R z was 133.205 μm, but in zone C3 and the ZY orientation. The R a values were noticeably higher in most of the subzones of zone B, especially the outlying ones (1, 4, 7 and 3, 6, 9).
For PP, the mean R a value in zone B was 14.69 μm. For TPU, it was 29.067 μm in the same zone. For PA11, it was 14.293 μm, also for zone B. The relative difference was the lowest in the case of PP, where the averaged-out R a parameter value for zone A reached 14.687 μm. In the remaining cases, the differences were much more noticeable.
Additionally, one-way and two-way ANOVA (analysis of variance) tests were performed on the datasets for each material, with the null hypothesis ( H 0 ) stating that neither the location nor the print orientation had any impact on the surface roughness. Seeing that the 27 subzones were too many for a statistically meaningful conclusion, that number was reduced to 3, each encompassing 9 of the previous subzones. The results of the one-way test can be viewed in Table 5, whereas the values obtained in the two-way test are listed in Table 6.
Based on those tests, we can see that it is the orientation that has the greater statistical significance, especially in the case of polypropylene, for which the p-value was calculated as less than 2 × 10⁻¹⁶ (0.0000000000000002), while the F-value was fairly high. For both PP and PA11, the location of the sample in the print chamber appears to be statistically insignificant. Only in the case of TPU, the p-value for that category could be spoken of as being statistically significant (less than 0.001). This seems to harmonize with the rest of the observations.
Let us also juxtapose the results in terms of the sample orientation for each material, which is shown on the plots in Figure 13, Figure 14 and Figure 15. The standard deviation for each parameter and orientation is also included in the form of an error bar, from its negative value to its positive value.
The plots of the mean roughness values for the different orientations suggest that a surface printed in a vertical orientation (ZX or ZY) coincident with the measurement direction tends to have a higher surface roughness compared with the other possible orientations (XY, XZ, YX, YZ). A similar trend was also noticed in the study conducted by Sagbas B. et al. [19], who reported higher dimensional deviations and roughness values for the Z surfaces in their cube-shaped samples (with R a reaching 23.46 μm for PA12).

4. Conclusions

While the mean roughness of the TPU samples is almost twice as high as that of the PP or PA11 ones, the latter two exhibit roughness levels that are very similar to each other. For that reason, it is difficult to declare the winner between those two materials—at least without applying any post-processing—even after taking the standard deviation into account.
The correlation between how the roughness levels are spread across the corresponding zones and orientations is drastically higher for PP and PA11 than for PP and TPU. This may indicate that such common trends are much more likely to occur for materials whose surface roughness values fall within similar intervals.
Most of the maximum values of the arithmetic mean profile deviation occurred in zone B considered as a whole, that is, without it being split into nine smaller subzones. This was especially true for the TPU samples, where the R a values were significantly higher in most of the subzones of zone B, especially the outlying ones. A similar relationship was observed for the averaged-out values for the three main zones (A, B, C), with zone B characterized by the highest mean roughness, even though not in every case were there considerable relative differences among the main zones.
It appears that the possible increase in roughness is not dependent on the shape of the object so much as on its spatial orientation. The relationship between roughness and orientation is particularly apparent for the harder materials (PP and PA11). In the case of the most flexible material of all three, TPU, this trend appears to be broken, which may have to do with its flexibility and surface structure.
Apart from the case of the TPU samples, as confirmed by the two-way ANOVA test, no clear relationship has been established between the print chamber zone in which the object being printed was located and the resulting mean roughness. The statistical significance of the print chamber zone for PP and PA11 turned out to be very low. What had a more noticeable impact on the surface quality was the orientation of the sample in the print chamber, although the computed standard deviation values indicate that those results may to some extent diverge from the mean value for the given orientation and could also potentially overlap. Nonetheless, the statistics indicate that there exists a certain relationship between the sample orientation and the obtained surface roughness, and its values are usually higher in the Z direction. Finally, as expected, the type of material used to produce the samples is bound to have the greatest impact on their surface quality.
It is also necessary to add that, despite some differences in the roughness of the samples printed in the ZX and ZY planes for the two examined materials, it is not something as significant as in the case of the popular FDM technology, where the roughness is usually much higher when measured across the layers, by possibly even two or three times for certain materials [30]. Therefore, we can expect greater isotropy for 3D prints based on the Multi Jet Fusion technology, as well as a more predictable and regular surface structure regardless of the direction. However, this does not mean that the angle at which an object is printed will not affect its tensile strength, and printing at 45° may actually improve its tensile properties, as shown by Lee K. P. M. et al. in their work [31]. Another factor to consider in the future may be how much the roughness of a surface is influenced by whether it faces up or down. Research findings indicate that the bottom surface tends to be the least smooth of all. When it comes to tensile strength, the same authors have reported that MJF samples deform more than SLS specimens before they break, and they also exhibit a ductile fracture mechanism [13].
Since there exist some surface characteristics inherent to Multi Jet Fusion that cannot necessarily be adjusted or influenced during the process itself, additional post-processing may be required to produce a positive effect on the smoothness of the obtained surface, which should also constitute the next step in this ongoing research.

Funding

This research received no external funding. All samples provided by HP.

Institutional Review Board Statement

Not applicable.

Informed Consent Statement

Not applicable.

Data Availability Statement

The data used in this study can be made available on request from the corresponding author.

Acknowledgments

I am grateful to the Lord for the strength to complete this. I thank my relatives and my wife for their general support. I would like to thank HP for printing the samples and Jan Pawlik for bringing them. I am also grateful to Mitutoyo for their equipment. An additional thank-you to Panagiotis Karmiris-Obratański for his advice on publishing in this journal and to Piotr Dudek for his initial tips. My sincere thanks to prof. Jacek Cieślik for his continued encouragement and to prof. Michał Bembenek for his advice during the review phase. Last but not least, a thank-you to Agnieszka Dzindziora for believing this could happen, and to anyone I perhaps have missed.

Conflicts of Interest

The author declare no conflict of interest.

References

  1. Shahrubudin, N.; Lee, T.C.; Ramlan, R. An overview on 3D printing technology: Technological, materials, and applications. Procedia Manuf. 2019, 35, 1286–1296. [Google Scholar] [CrossRef]
  2. AL-Hasni, S.; Santori, G. 3D printing of vacuum and pressure tight polymer vessels for thermally driven chillers and heat pumps. Vacuum 2020, 171, 109017. [Google Scholar] [CrossRef]
  3. Tanikella, N.G.; Wittbrodt, B.; Pearce, J.M. Tensile strength of commercial polymer materials for fused filament fabrication 3D printing. Addit. Manuf. 2017, 15, 40–47. [Google Scholar] [CrossRef] [Green Version]
  4. Nagendra, J.; Srinath, M.K.; Sujeeth, S.; Naresh, K.S.; Prasad, M.S.G. Optimization of process parameters and evaluation of surface roughness for 3D printed nylon-aramid composite. Mater. Today Proc. 2021, 44, 674–682. [Google Scholar] [CrossRef]
  5. Msallem, B.; Sharma, N.; Cao, S.; Halbeisen, F.S.; Zeilhofer, H.F.; Thieringer, F.M. Evaluation of the dimensional accuracy of 3D-printed anatomical mandibular models using FFF, SLA, SLS, MJ, and BJ printing technology. J. Clin. Med. 2020, 9, 817. [Google Scholar] [CrossRef] [PubMed] [Green Version]
  6. Gadagi, B.; Lekurwale, R. A review on advances in 3D metal printing. Mater. Today Proc. 2021, 45, 277–283. [Google Scholar] [CrossRef]
  7. Murphy, S.V.; Atala, A. 3D bioprinting of tissues and organs. Nat. Biotechnol. 2014, 32, 773–785. [Google Scholar] [CrossRef] [PubMed]
  8. Goh, G.L.; Zhang, H.; Chong, T.H.; Yeong, W.Y. 3D printing of multilayered and multimaterial electronics: A review. Adv. Electron. Mater. 2021, 7, 2100445. [Google Scholar] [CrossRef]
  9. Ngo, T.D.; Kashani, A.; Imbalzano, G.; Nguyen, K.T.Q.; Hui, D. Additive manufacturing (3D printing): A review of materials, methods, applications and challenges. Compos. Part B Eng. 2018, 143, 172–196. [Google Scholar] [CrossRef]
  10. Yang, F.; Zhang, M.; Bhandari, B. Recent development in 3D food printing. Crit. Rev. Food Sci. Nutr. 2017, 57, 3145–3153. [Google Scholar] [CrossRef]
  11. Jucan, O.D.; Gădălean, R.V.; Chicinaş, H.F.; Hering, M.; Bâlc, N.; Popa, C.O. Study on the indirect selective laser sintering (SLS) of WC-Co/PA12 powders for the manufacturing of cemented carbide parts. Int. J. Refract. Hard. Met. 2021, 96, 105498. [Google Scholar] [CrossRef]
  12. Wiese, M.; Leiden, A.; Rogall, C.; Thiede, S.; Herrmann, C. Modeling energy and resource use in additive manufacturing of automotive series parts with multi-jet fusion and selective laser sintering. Procedia CIRP 2021, 98, 358–363. [Google Scholar] [CrossRef]
  13. Rosso, S.; Meneghello, R.; Biasetto, L.; Grigolato, L.; Concheri, G.; Savio, G. In-depth comparison of polyamide 12 parts manufactured by Multi Jet Fusion and Selective Laser Sintering. Addit. Manuf. 2020, 36, 101713. [Google Scholar] [CrossRef]
  14. Packard, H. A Disruptive 3D Printing Technology for a New Era of Manufacturing. Available online: https://www.cloudpapers.com/a-disruptive-3d-printing-technology-for-a-new-era-of-manufacturing/ (accessed on 3 January 2022).
  15. Morales-Planas, S.; Minguella-Canela, J.; Lluma-Fuentes, J.; Travieso-Rodriguez, J.A.; García-Granada, A.A. Multi Jet Fusion PA12 manufacturing parameters for watertightness, strength and tolerances. Materials 2018, 11, 1472. [Google Scholar] [CrossRef] [PubMed] [Green Version]
  16. Cha, Y.H.; Lee, K.H.; Ryu, H.J.; Joo, I.W.; Seo, A.; Kim, D.H.; Kim, S.J. Ankle-foot orthosis made by 3D printing technique and automated design software. Appl. Bionics Biomech. 2017, 2017, 9610468. [Google Scholar] [CrossRef] [Green Version]
  17. Dal Maso, A.; Cosmi, F. 3D-printed ankle-foot orthosis: A design method. Mater. Today Proc. 2019, 12, 252–261. [Google Scholar] [CrossRef]
  18. Cai, C.; Tey, W.S.; Chen, J.; Zhu, W.; Liu, X.; Liu, T.; Zhao, L.; Zhou, K. Comparative study on 3D printing of polyamide 12 by selective laser sintering and multi jet fusion. J. Mater. Process. Technol. 2021, 288, 116882. [Google Scholar] [CrossRef]
  19. Jeon, J.M.; Park, S.J.; Choi, T.R.; Park, J.H.; Yang, Y.H.; Yoon, J.J. Biodegradation of polyethylene and polypropylene by Lysinibacillus species JJY0216 isolated from soil grove. Polym. Degrad. Stab. 2021, 191, 109662. [Google Scholar] [CrossRef]
  20. Liu, L.C.; Liang, W.C.; Chen, C.M. Manufacture of recyclable thermoplastic polyurethane (TPU)/Silicone blends and their mechanical properties. Manuf. Lett. 2021, 31, 1–5. [Google Scholar] [CrossRef]
  21. Nagasundaram, N.; Devi, R.S.; Rajkumar, M.K.; Sakthivelrajan, K.; Arravind, R. Experimental investigation of injection moulding using thermoplastic polyurethane. Mater. Today Proc. 2021, 45, 2286–2288. [Google Scholar] [CrossRef]
  22. Esposito, G.R.; Dingemans, T.J.; Pearson, R.A. Changes in Polyamide 11 Microstructure and Chemistry During Selective Laser Sintering. Addit. Manuf. 2021, 102445. [Google Scholar] [CrossRef]
  23. Pandelidi, C.; Lee, K.P.M.; Kajtaz, M. Effects of polyamide-11 powder refresh ratios in multi-jet fusion: A comparison of new and used powder. Addit. Manuf. 2021, 40, 101933. [Google Scholar] [CrossRef]
  24. Sagbas, B.; Gümüş, B.E.; Kahraman, Y.; Dowling, D.P. Impact of print bed build location on the dimensional accuracy and surface quality of parts printed by multi jet fusion. J. Manuf. Process. 2021, 70, 290–299. [Google Scholar] [CrossRef]
  25. ISO 527-1:2019; Plastics—Determination of Tensile Properties—Part 1: General Principles. International Organization for Standardization: Geneva, Switzerland, 2019.
  26. Mitutoyo. Dual-Purpose Measurement and Powerful Analysis of Surface Roughness and Contour Combined with High Accuracy, High Drive Speed and Simplified CNC Measurement; Surface Roughness/Contour Measuring System Formtracer SV-C3200/4500 Series; Bulletin No. 2195(2); Mitutoyo: Kawasaki, Japan, 2012; Available online: http://www.farnell.com/datasheets/1929584.pdf (accessed on 3 January 2022).
  27. ISO 4288:1996; Geometrical Product Specifications (GPS)—Surface Texture: Profile Method—Rules and Procedures for the Assessment of Surface Texture. International Organization for Standardization: Geneva, Switzerland, 1996.
  28. ISO 3274:1996; Geometrical Product Specifications (GPS)—Surface Texture: Profile Method—Nominal Characteristics of Contact (Stylus) Instruments. International Organization for Standardization: Geneva, Switzerland, 1996.
  29. Rahim, T.N.A.T.; Abdullah, A.M.; Akil, H.M.; Mohamad, D. Comparison of mechanical properties for polyamide 12 composite-based biomaterials fabricated by fused filament fabrication and injection molding. AIP Conf. Proc. 2016, 1791, 020007. [Google Scholar]
  30. Dzienniak, D.; Pawlik, J. Analysis of the surface quality of polycaprolactam 3D prints enriched with carbon and glass fiber. MATEC Web Conf. 2021, 338, 01005. [Google Scholar] [CrossRef]
  31. Lee, K.P.M.; Pandelidi, C.; Kajtaz, M. Build orientation effects on mechanical properties and porosity of polyamide-11 fabricated via multi jet fusion. Addit. Manuf. 2020, 36, 101533. [Google Scholar] [CrossRef]
Figure 1. A scheme of the Multi Jet Fusion printing process for the HP Jet Fusion 580 Color 3D printer.
Machines 10 00049 g001
Figure 2. The distribution and orientation of the respective samples inside the print chamber.
Machines 10 00049 g002
Figure 3. The placement and designations of the zones inside the print chamber.
Machines 10 00049 g003
Figure 4. Sample dimensions.
Machines 10 00049 g004
Figure 5. A set of nine samples made of TPU prepared for the tests.
Machines 10 00049 g005
Figure 6. Surface structure for the different types of material.
Machines 10 00049 g006
Figure 7. The 178-396-2 roughness detector with the standard stylus. Adapted from ref. [26].
Machines 10 00049 g007
Figure 8. The stand for measuring surface roughness while measuring a PP sample.
Machines 10 00049 g008
Figure 9. The average surface roughness of the samples grouped by material.
Machines 10 00049 g009
Figure 10. The standard deviation of the roughness for the samples grouped by material.
Machines 10 00049 g010
Figure 11. The average roughness profile deviation ( R a ) for all of the samples.
Machines 10 00049 g011
Figure 12. The averaged-out R a values for the different materials and respective zones (green—the 9 lowest values; yellow—the 9 intermediate values; red—the 9 highest values).
Machines 10 00049 g012
Figure 13. The average roughness and standard deviation of the polypropylene (PP) samples grouped by orientation.
Machines 10 00049 g013
Figure 14. The average roughness and standard deviation of the thermoplastic polyurethane (TPU) samples grouped by orientation.
Machines 10 00049 g014
Figure 15. The average roughness and standard deviation of the polyamide 11 (PA11) samples grouped by orientation.
Machines 10 00049 g015
Table 1. Specifications of the HP Jet Fusion 580 Color 3D printer.
ParameterValue
Maximum Build Volume332 × 190 × 248 mm3 (15.64 L)
Build Rate2340 cm3/h
Minimum Layer Height0.08 mm
Resolution1200 dpi
Table 2. Specifications of the roughness detector.
ParameterValue
Measuring Force0.75 mN
Stylus Length5.2 mm
Tip Radius1 μm
Z1 Axis Measuring Range800 μm
Z1 Axis Resolution0.01 μm
Table 3. Roughness measurement parameters.
ParameterValue
Measurement Length48 mm
Evaluation Length40 mm
Sample Length8 mm
Step Size5 μm
Stylus Travel Speed2 mm/s
Table 4. The typical R a values for some other manufacturing methods.
Processing TypeExpected Ra Value (μm)
FDM 3D printing (PA6)18–30
UV 3D printing (resin)1.5–5
Turning/milling (PA12)Depending on the processing, very low values possible
Injection molding (PA12) [29]10–20
Table 5. A one-way ANOVA test for the different materials (DoFs—degrees of freedom, SS—the sum of squares, MSS—the mean of the sum of squares, F-value—test statistic from the F-test, p-value—p-value of the F-statistic).
CategoryDoFsSSMSSF-Valuep-Value
Material: PP
Orientation5191.738.3527<2 × 10⁻¹⁶
Residuals156221.51.42
Material: PA11
Orientation519639.1920.757.38 × 10−16
Residuals156294.71.89
Material: TPU
Orientation5529.7105.9314.012.61 × 10−11
Residuals1561179.67.56
Table 6. A two-way ANOVA test for the different materials (symbols the same as previously).
CategoryDoFsSSMSSF-Valuep-Value
Material: PP
Zone21.290.650.4520.637
Orientation5191.7338.3526.812<2 × 10⁻¹⁶
Residuals154220.251.43
Material: PA11
Zone26.433.211.7160.183
Orientation5195.9739.1920.9406.21 × 10−16
Residuals154288.251.87
Material: TPU
Zone2148.374.1611.073.21 × 10−5
Orientation5529.7105.9315.821.47 × 10−12
Residuals1541031.36.70
Publisher’s Note: MDPI stays neutral with regard to jurisdictional claims in published maps and institutional affiliations.

