
Reliability-Based Robust Design Optimization for Maximizing the Output Torque of Brushless Direct Current (BLDC) Motors Considering Manufacturing Uncertainty
 ,
,
Abstract
:1. Introduction
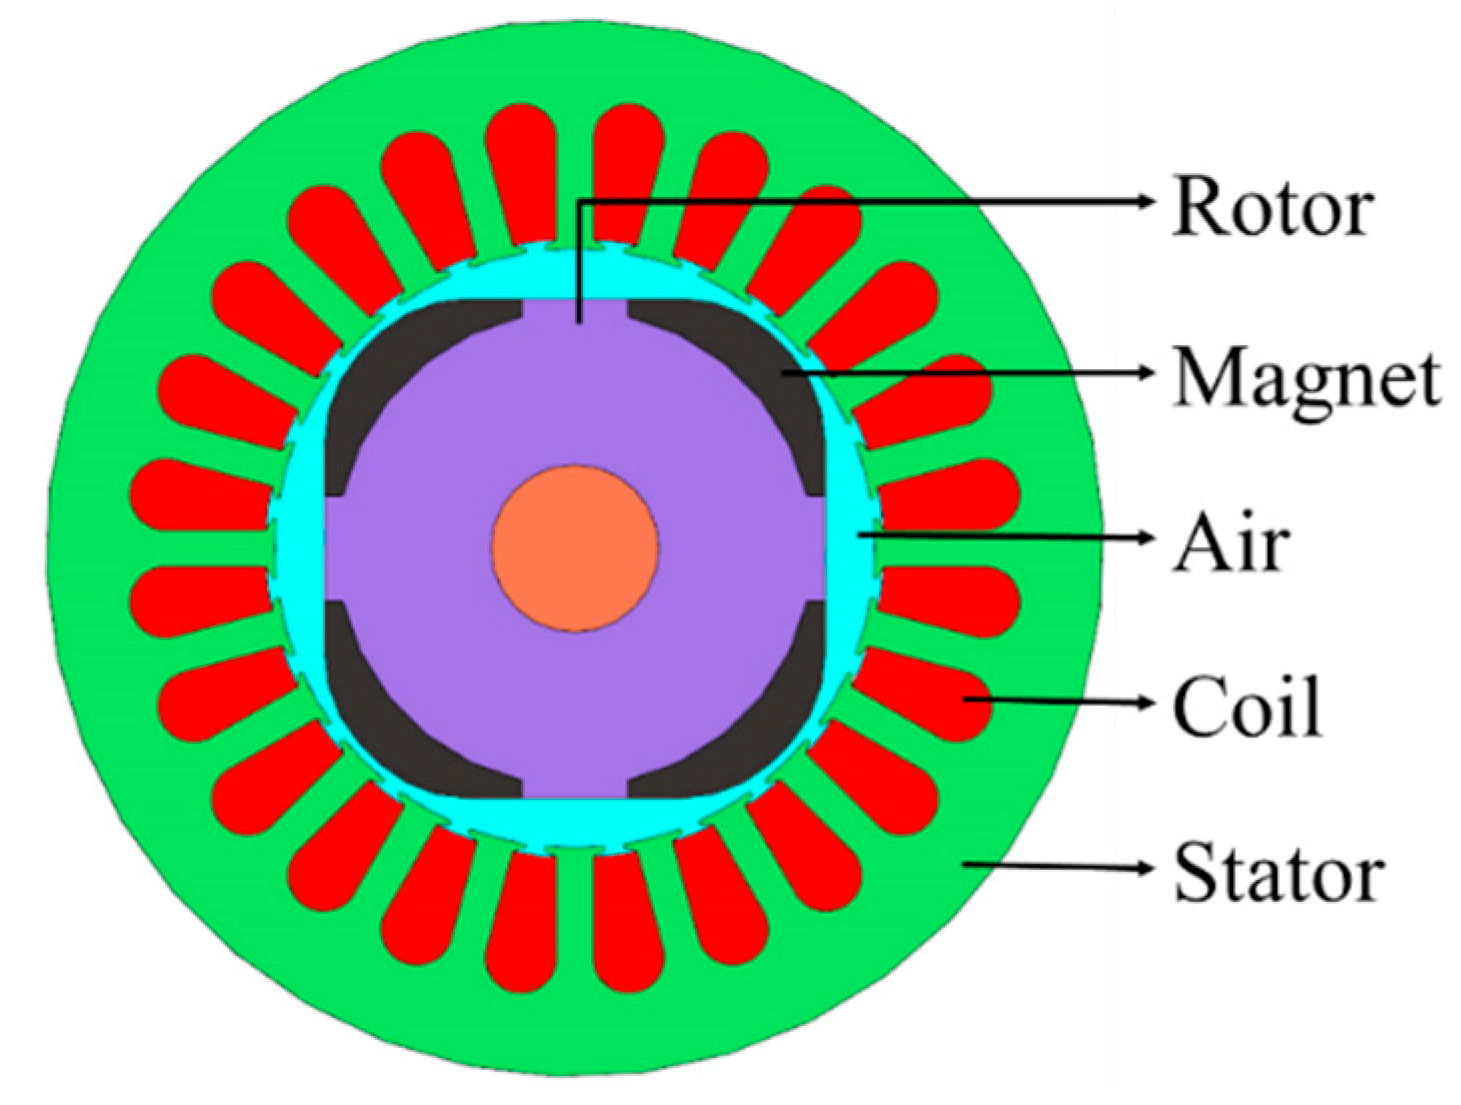
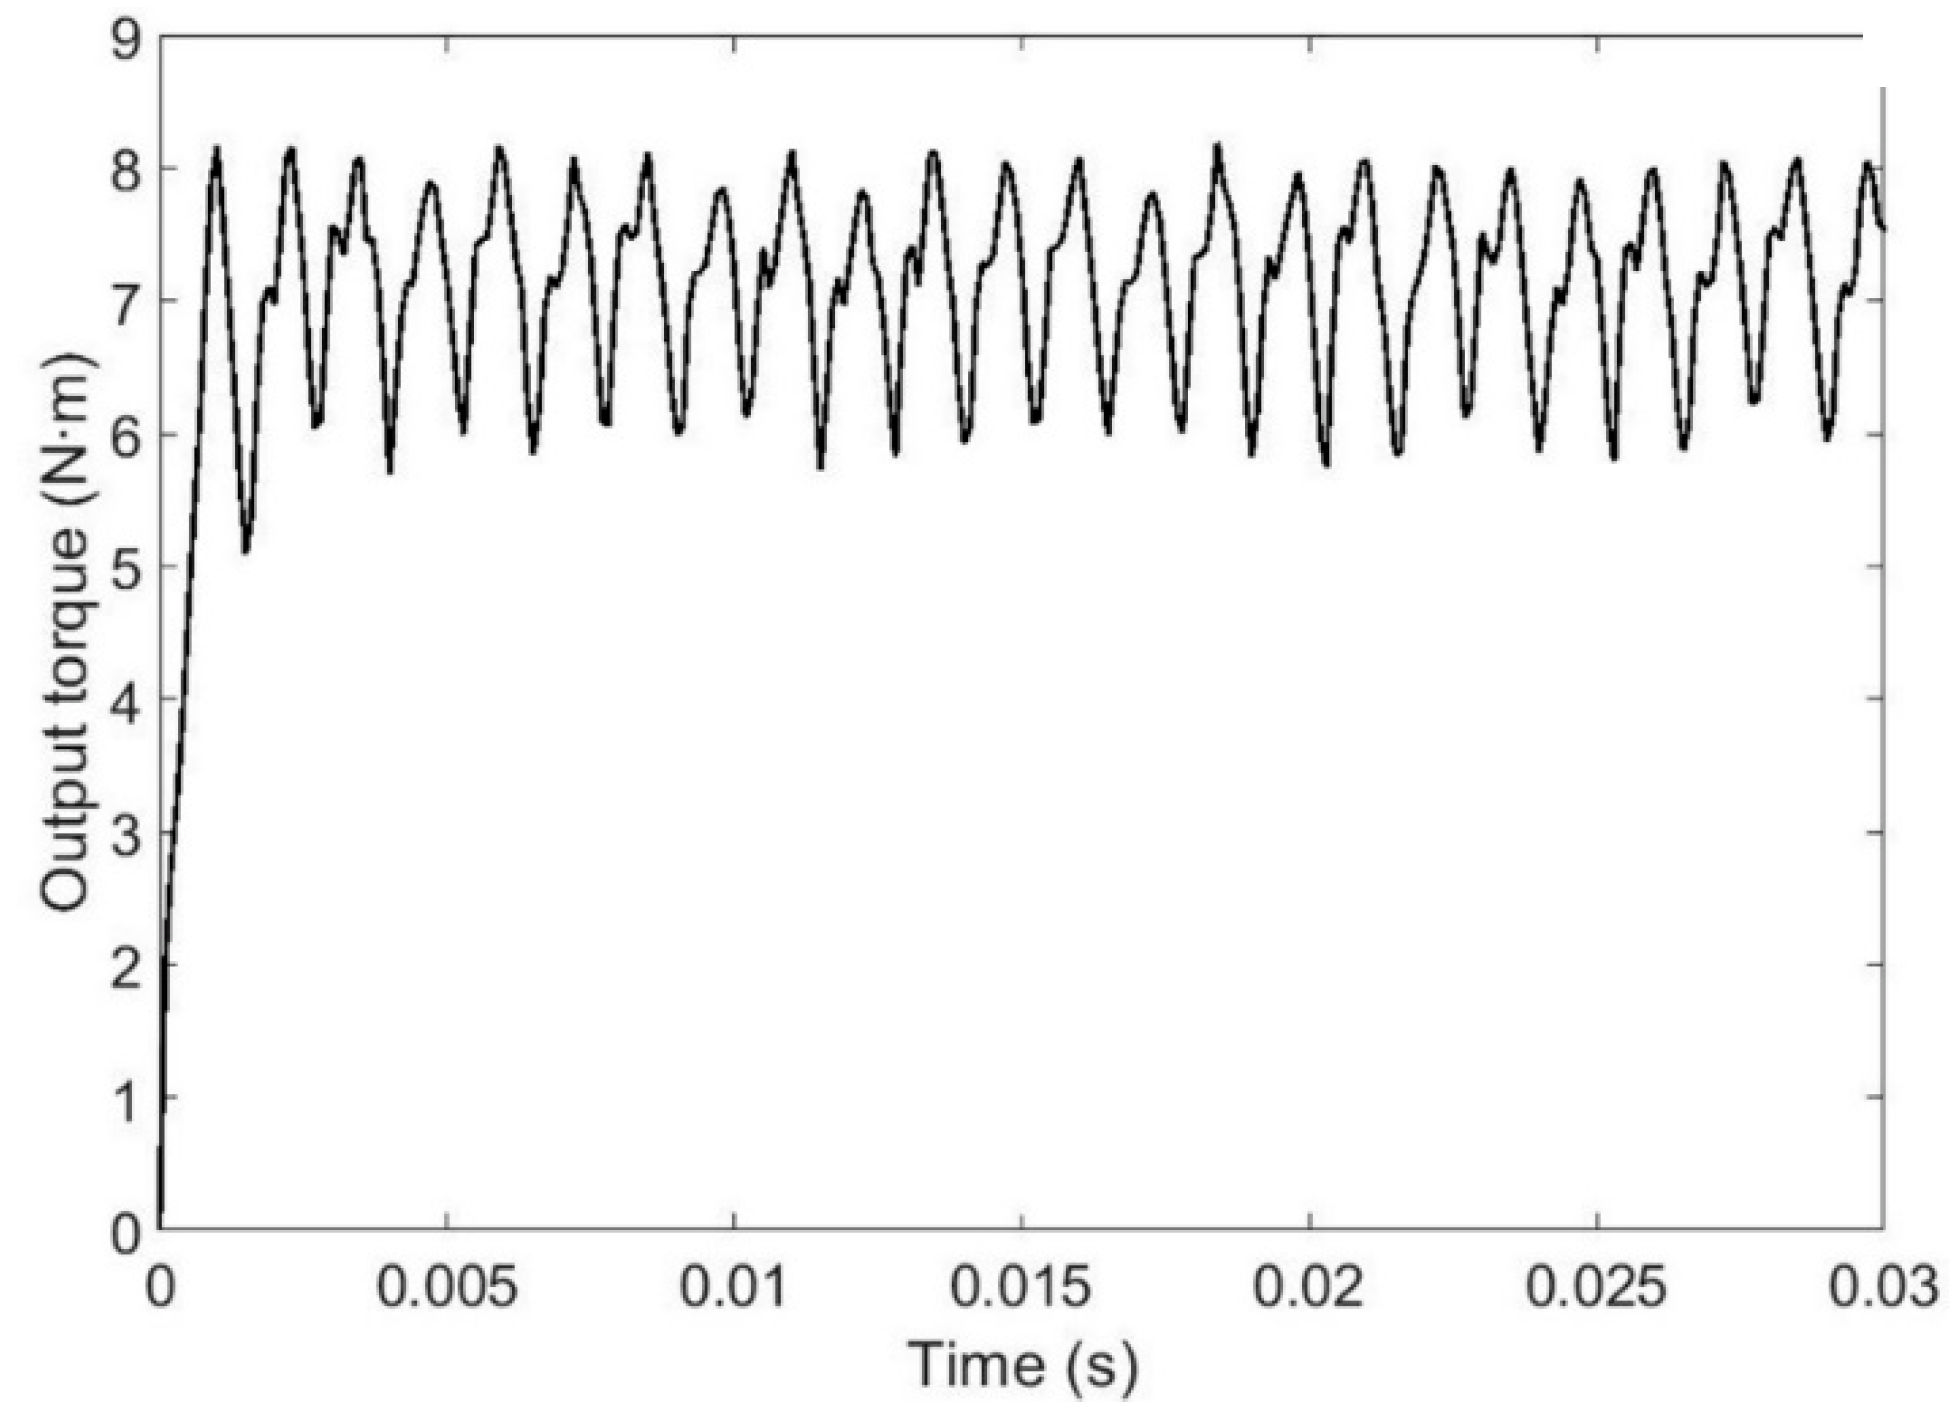
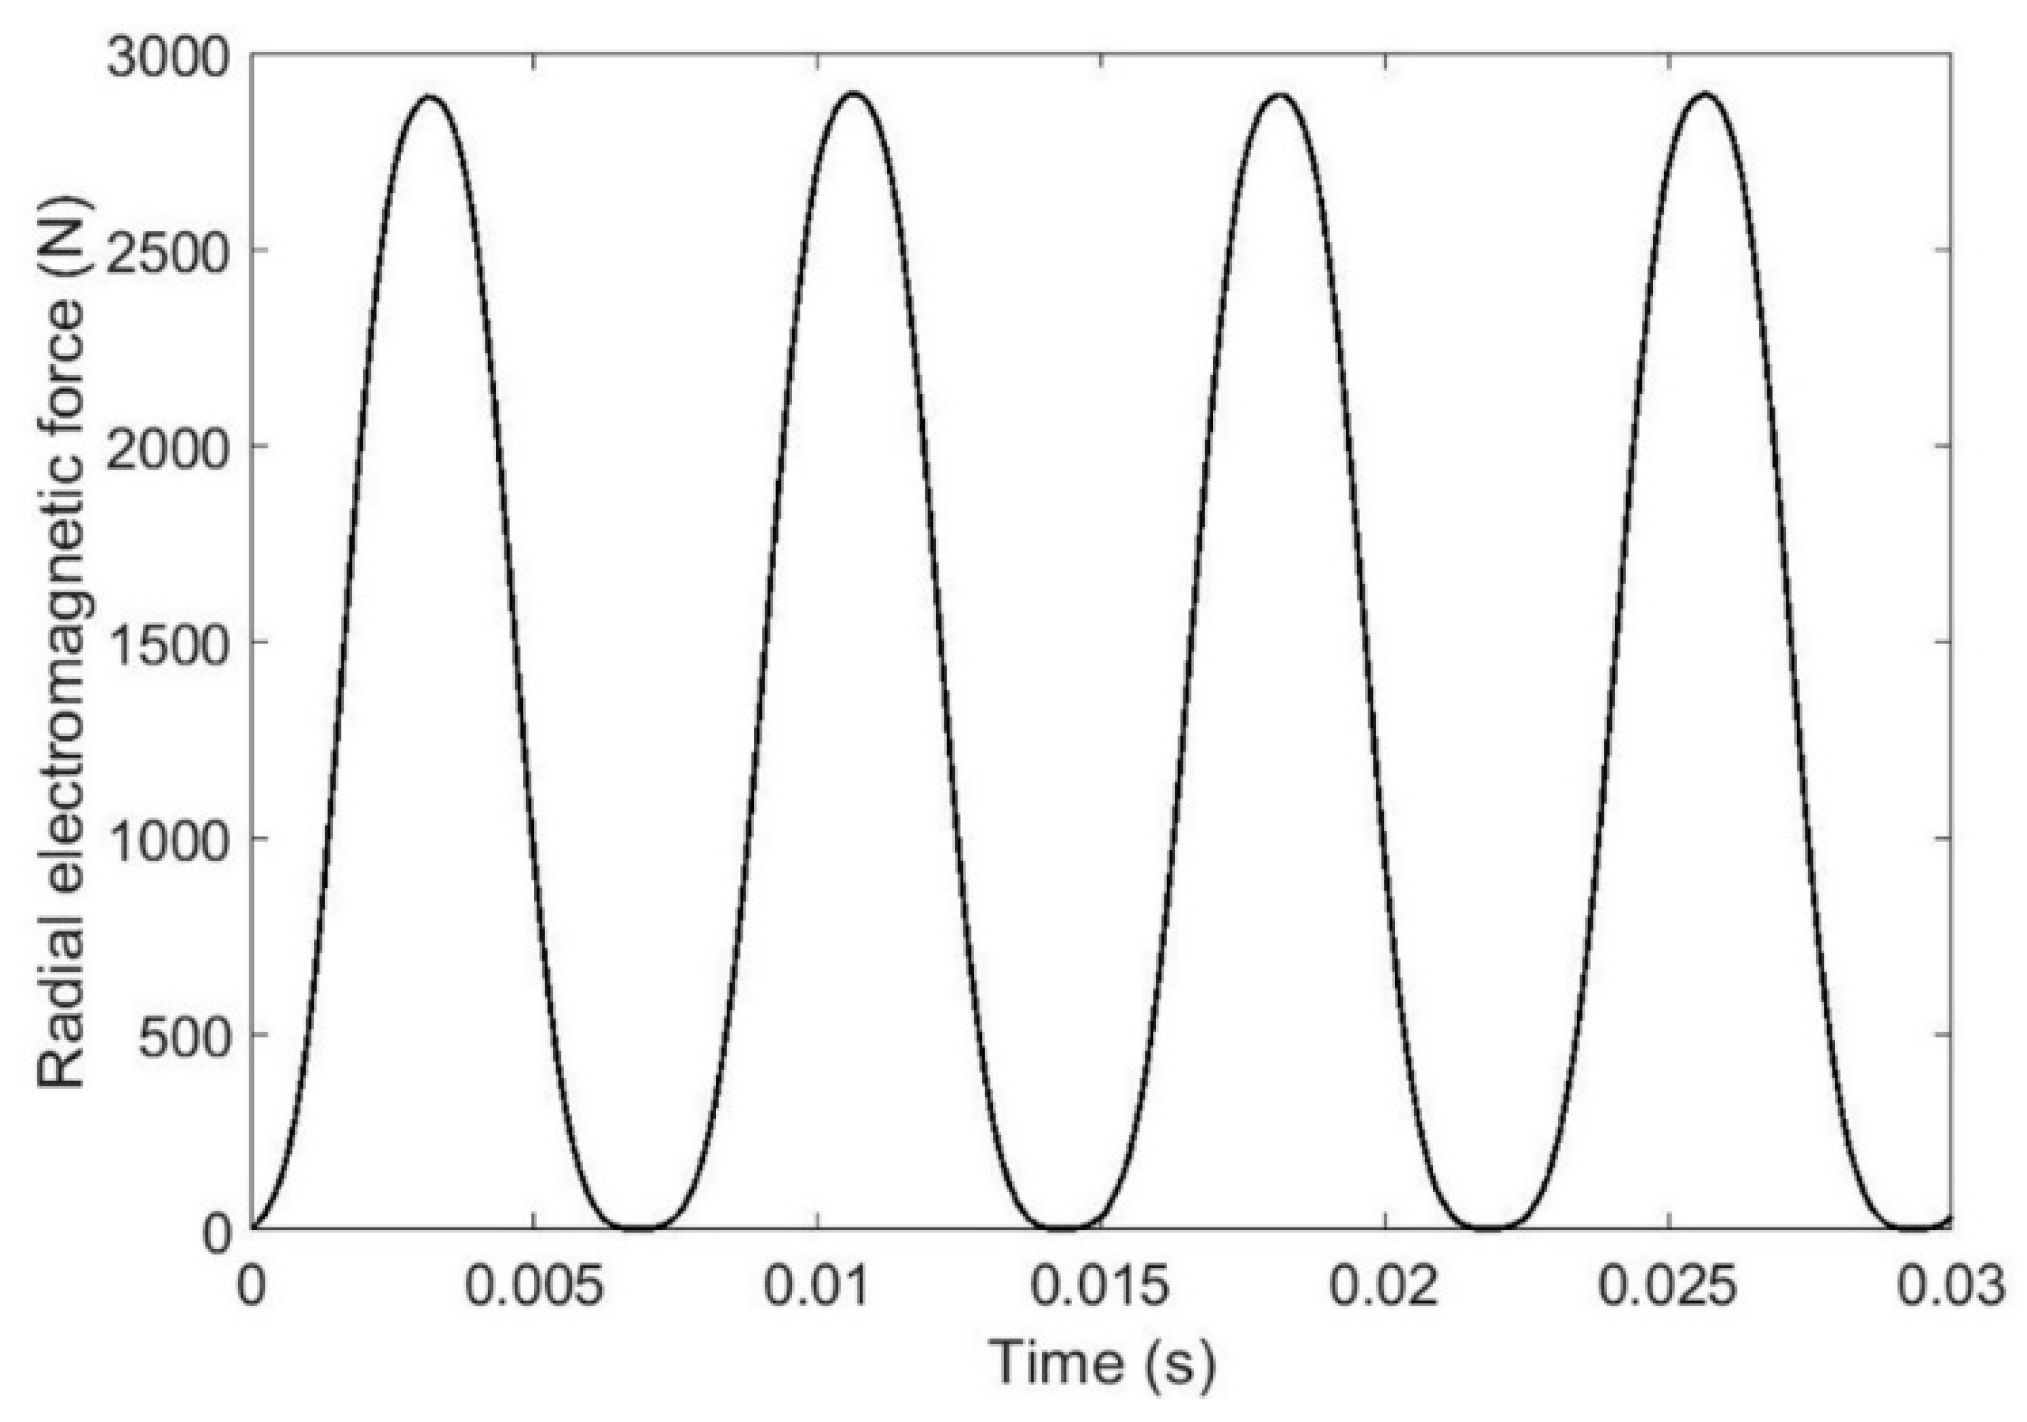
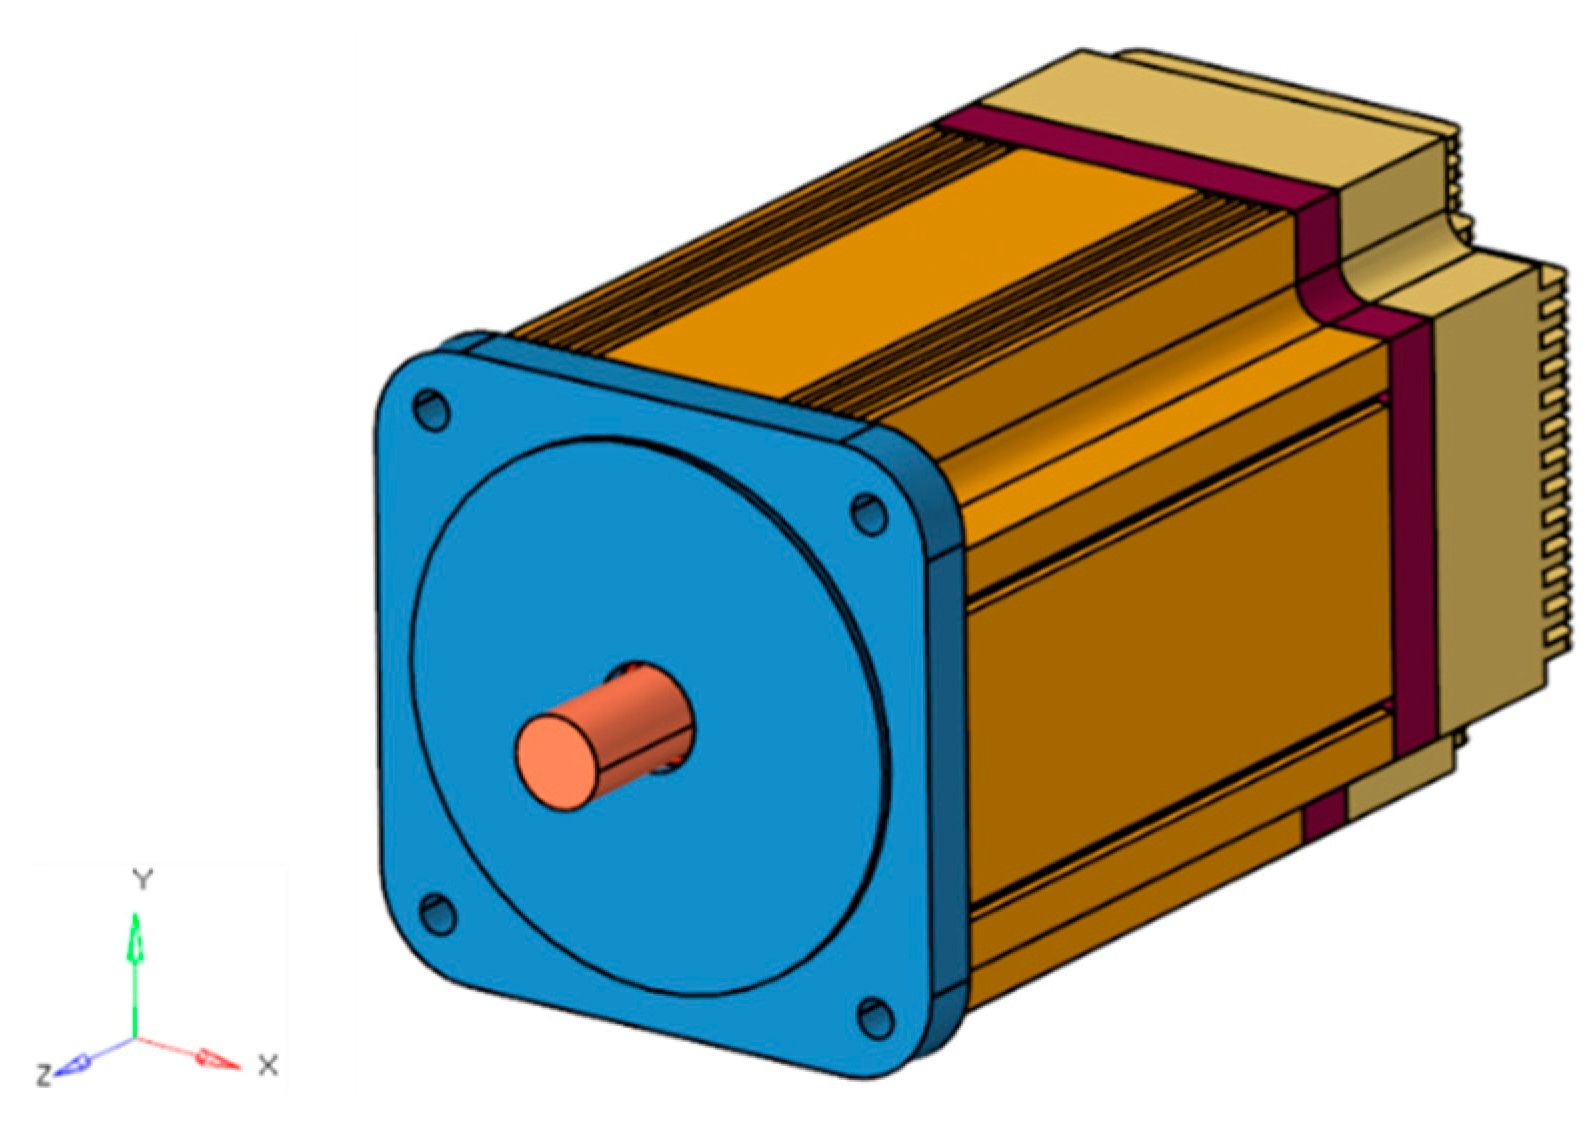
2. Electromagnetic–Structural Coupled Analysis
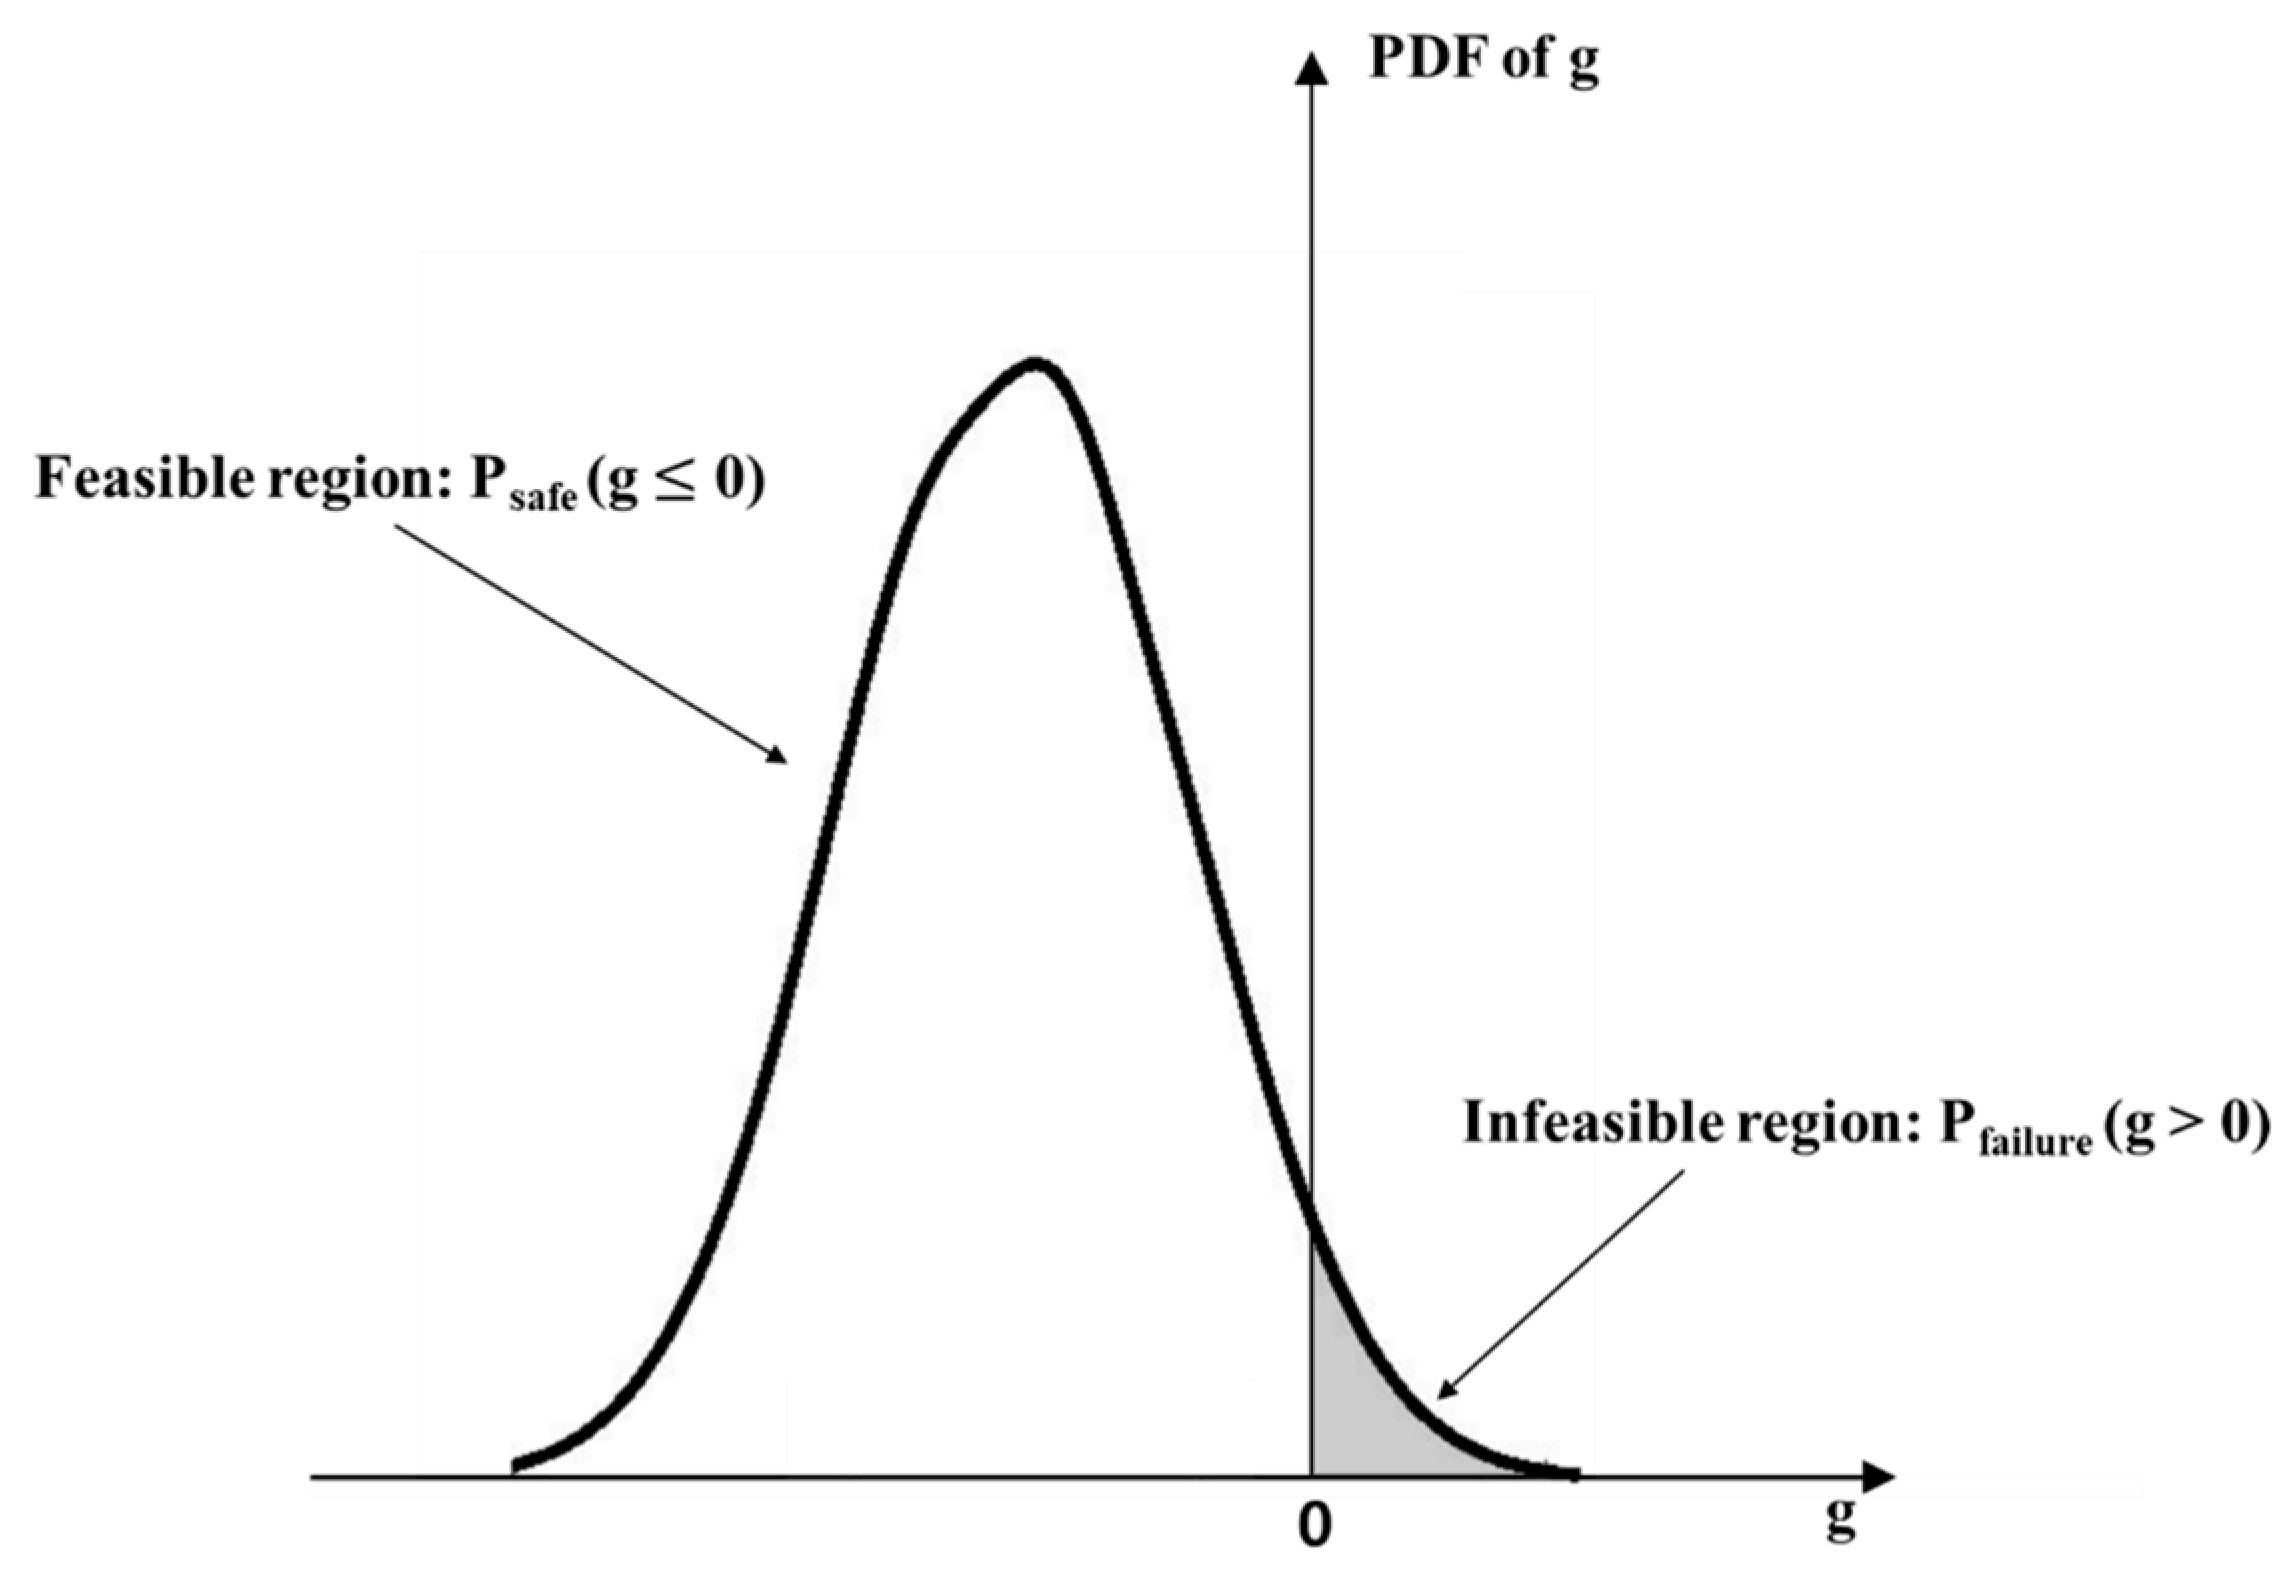
3. Probabilistic Design Optimization
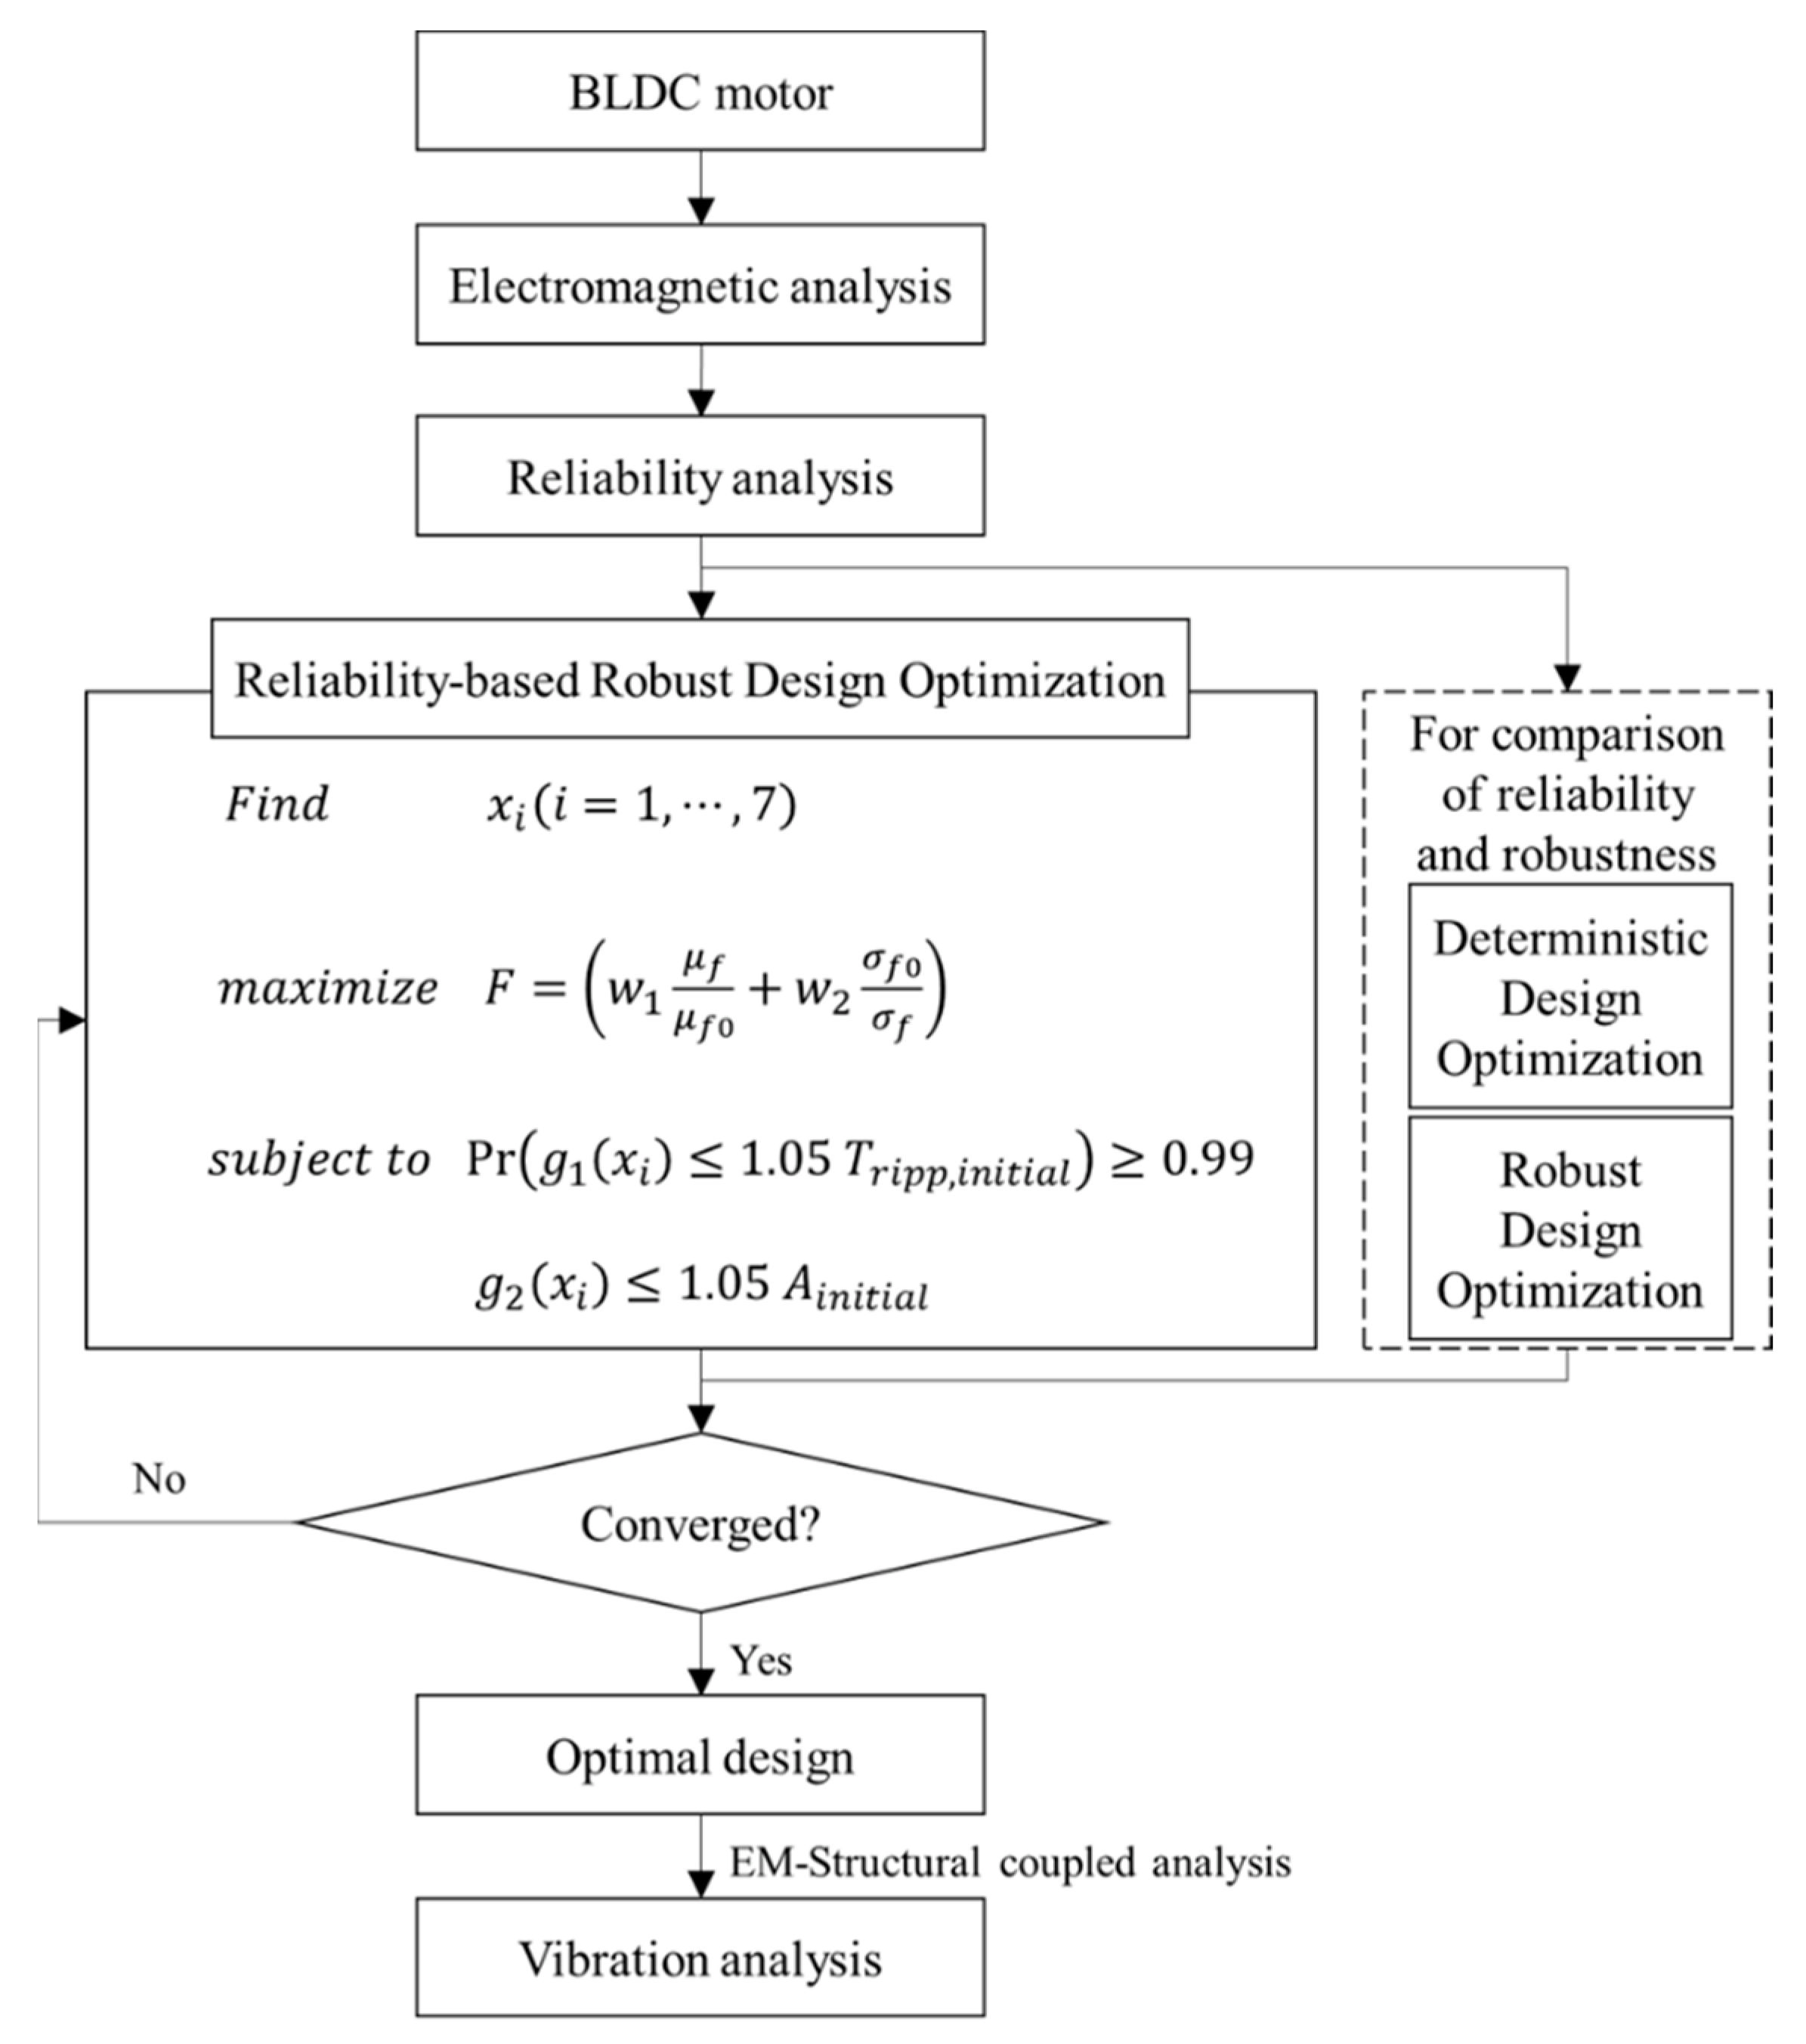
4. Reliability-Based Robust Design Optimization of the BLDC Motor
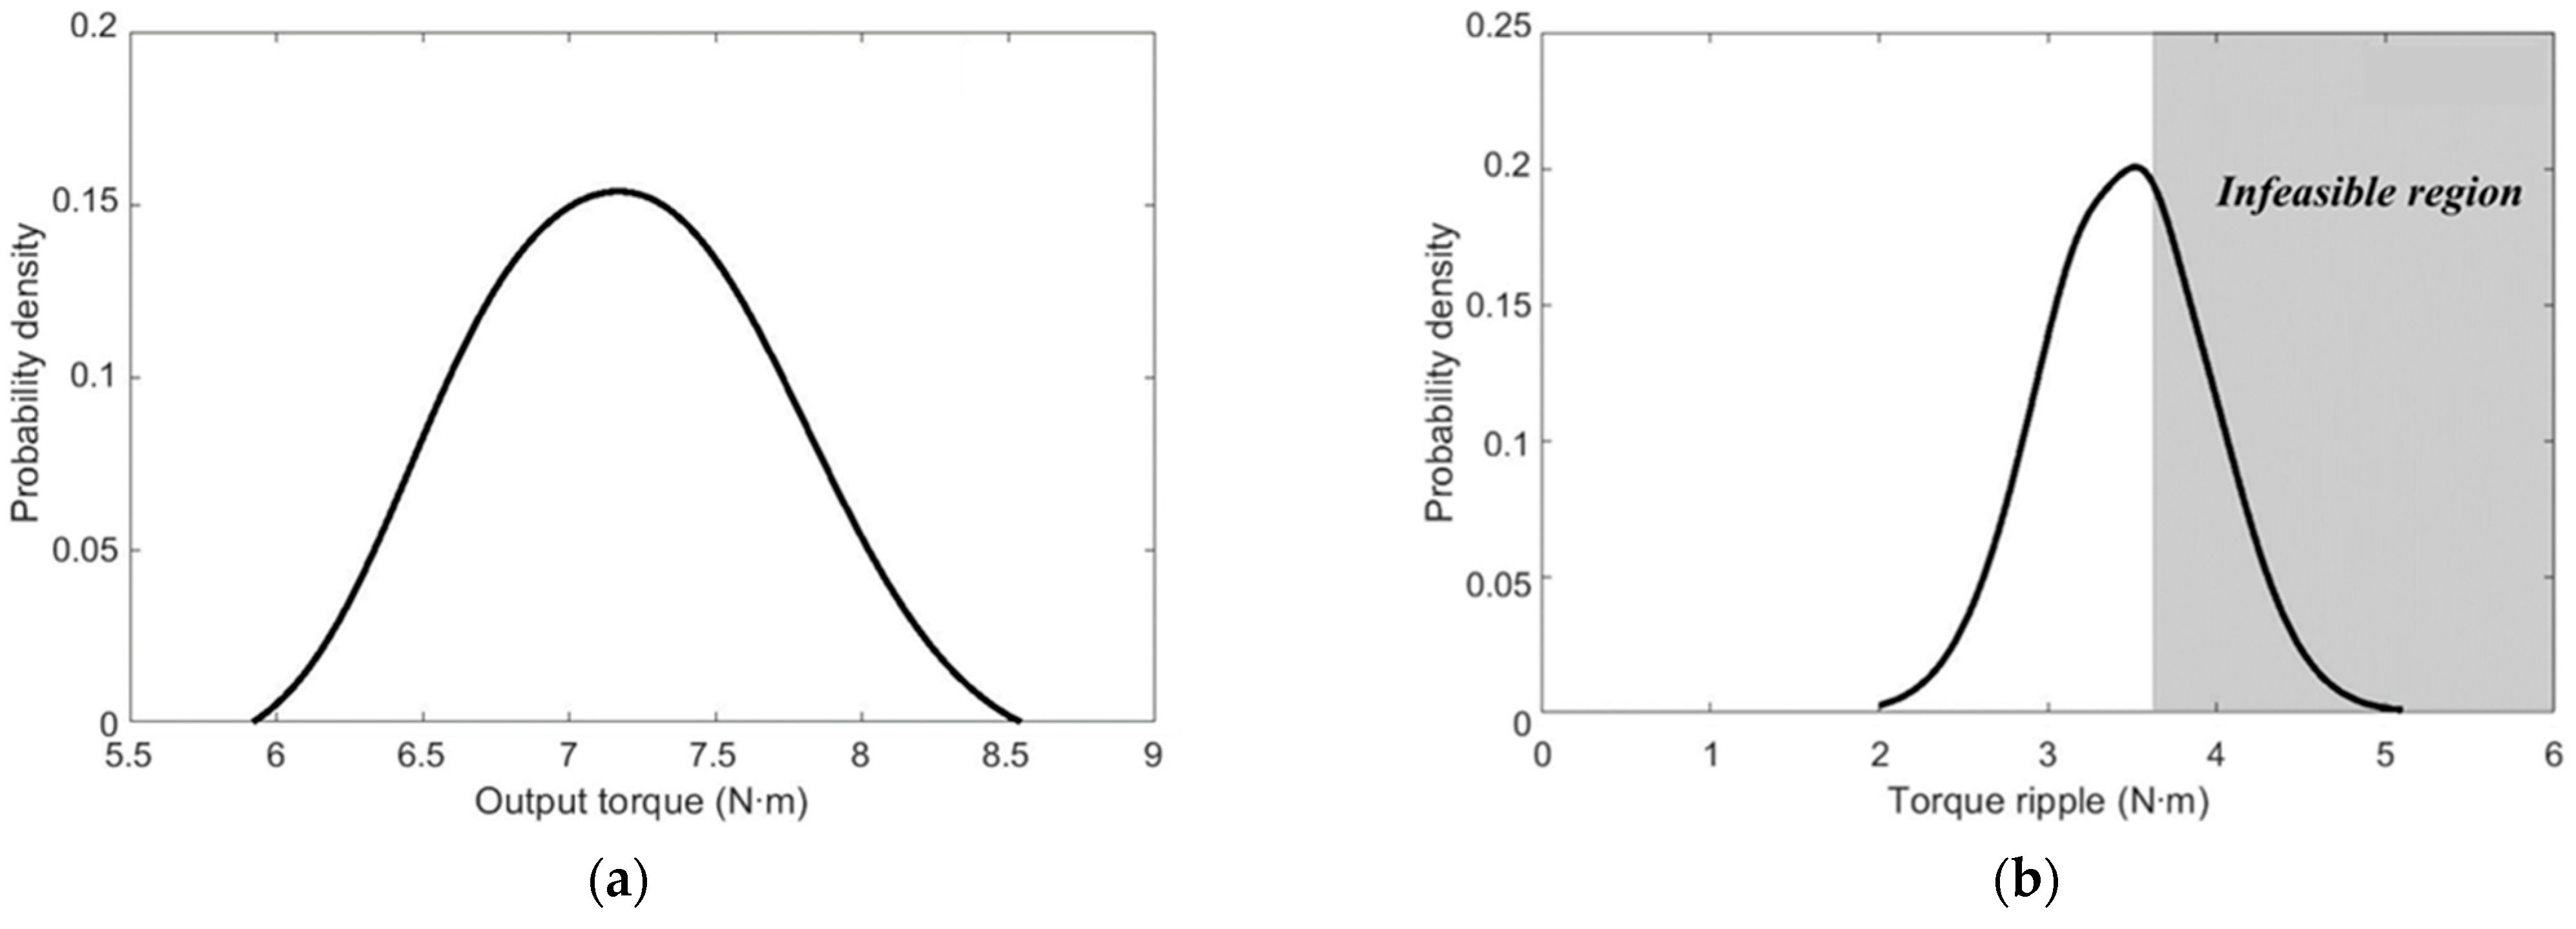
4.1. Reliability Analysis of the BLDC Motor
4.2. Design Optimization for Maximizing the Output Torque of the BLDC Motor
5. Results and Discussion
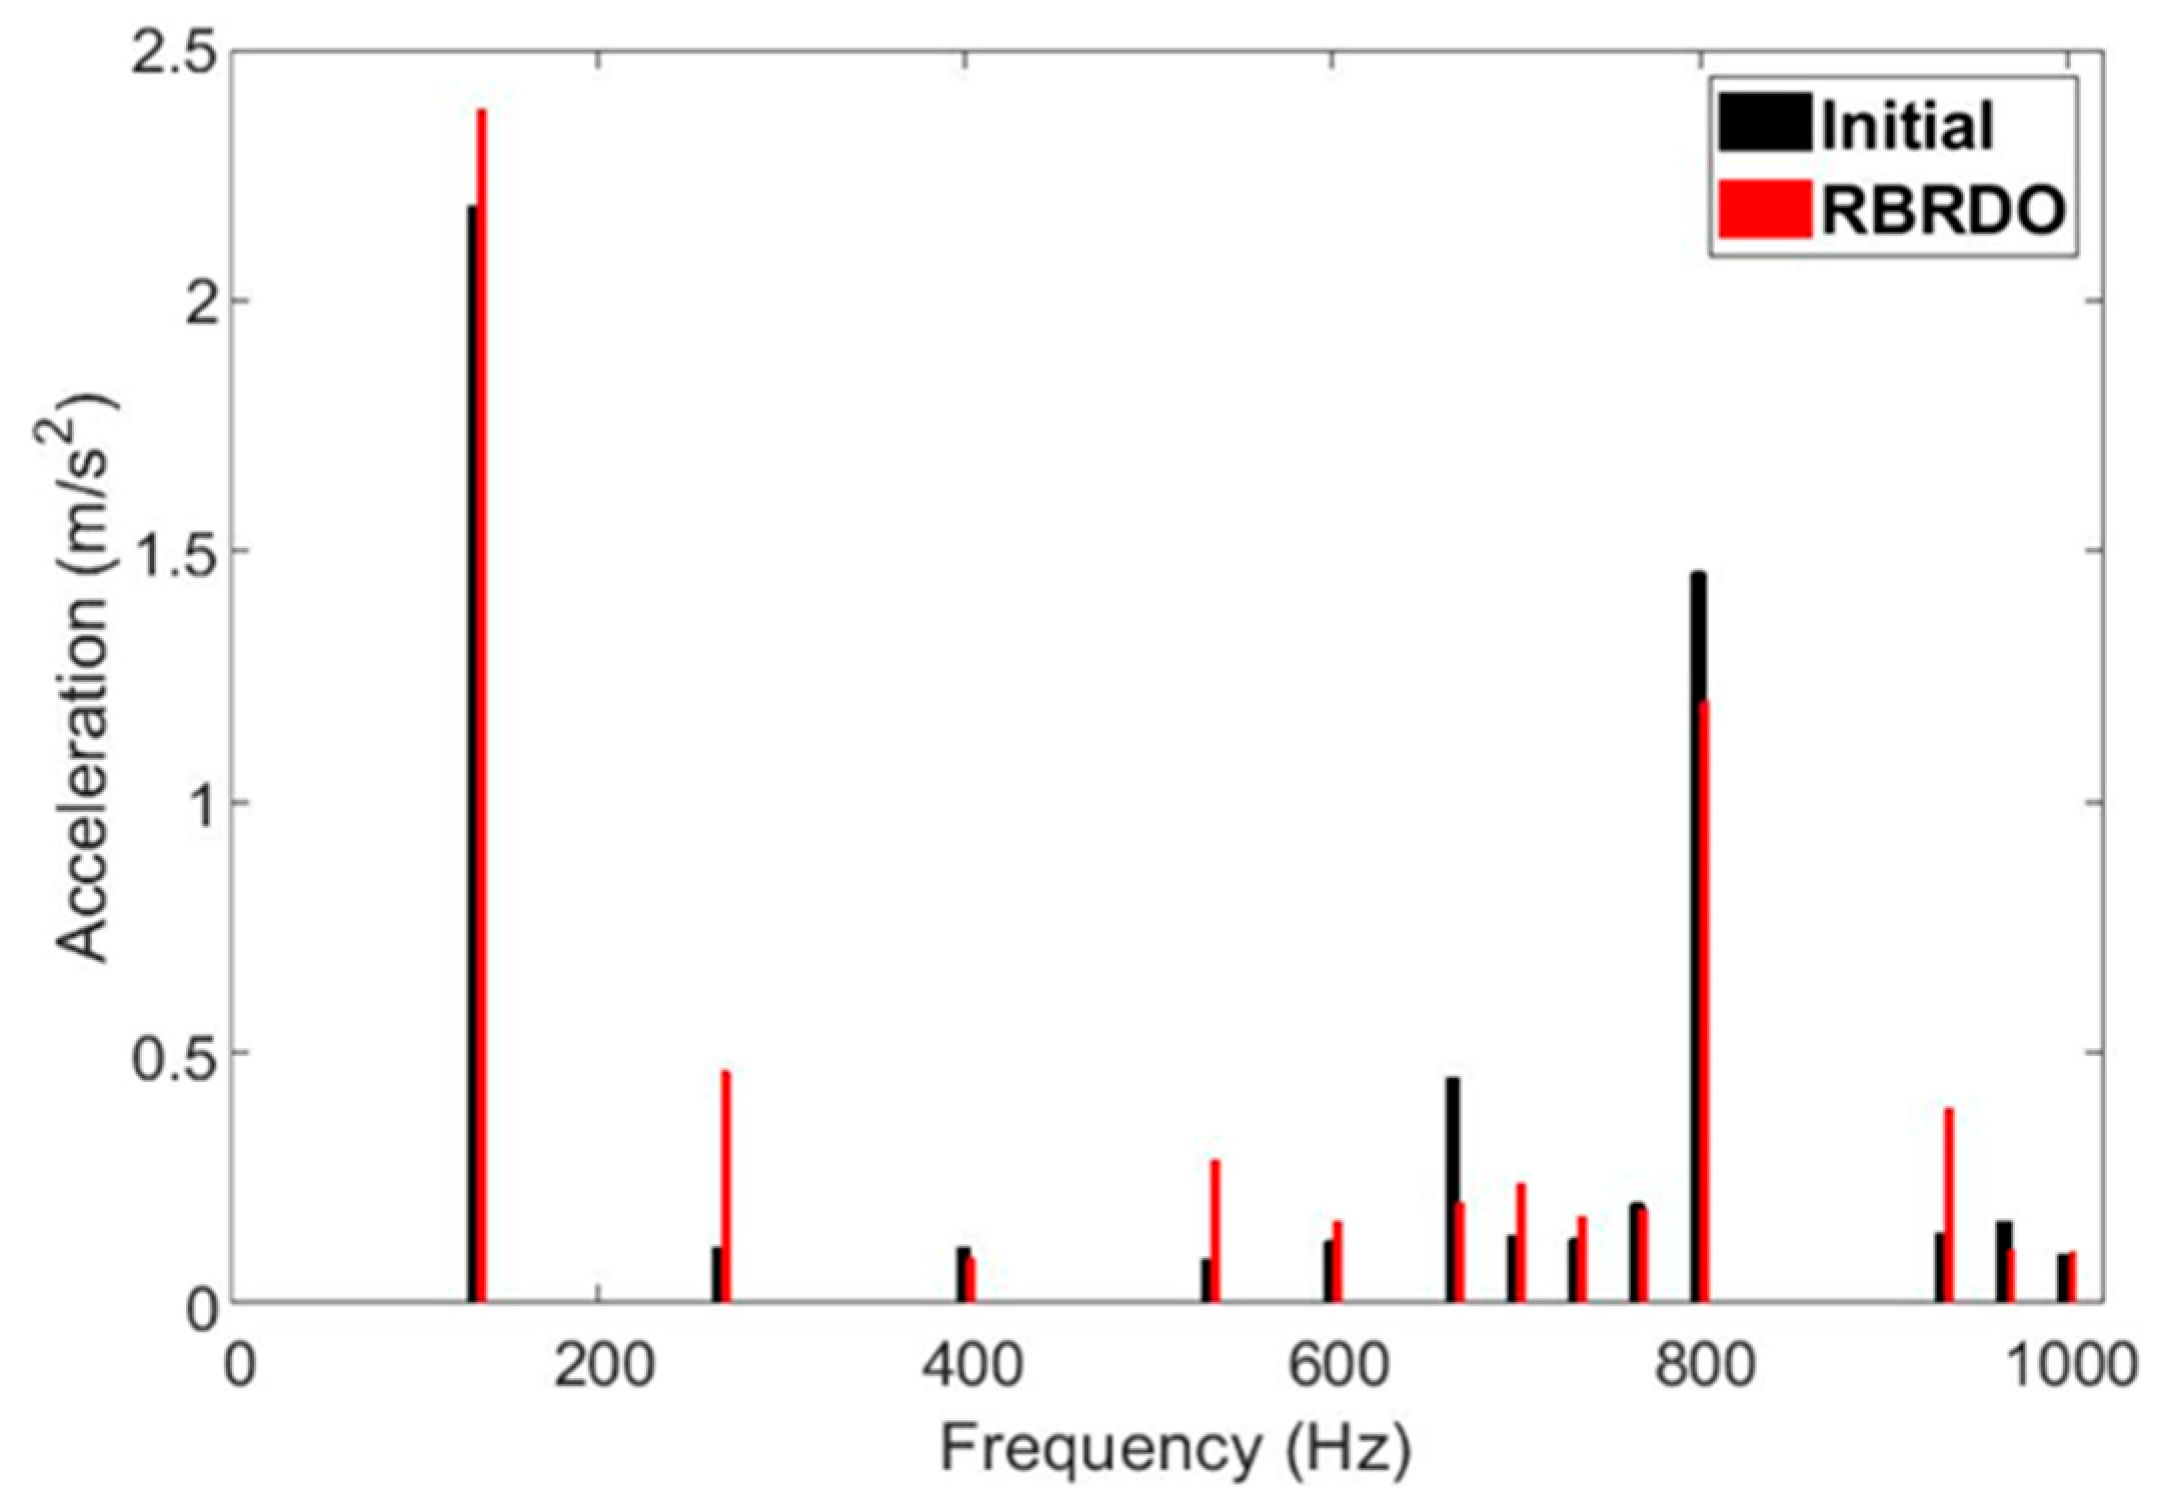
5.1. RBRDO Results
5.2. Comparison of Results of RBRDO with Those of DDO and RDO
6. Conclusions
Author Contributions
Funding
Institutional Review Board Statement
Informed Consent Statement
Data Availability Statement
Conflicts of Interest
References
- Islam, R.; Husain, I.; Fardoun, A.; McLaughlin, K. Permanent magnet synchronous motor magnet designs with skewing for torque ripple and cogging torque reduction. In Proceedings of the 2007 IEEE Industry Applications Annual Meeting, New Orleans, LA, USA, 23–27 September 2007; pp. 1552–1559. [Google Scholar]
- Studer, C.; Keyhani, A.; Sebastian, T.; Murthy, S.K. Study of cogging torque in permanent magnet machines. In Proceedings of the IAS’97. Conference Record of the 1997 IEEE Industry Applications Conference Thirty-Second IAS Annual Meeting, New Orleans, LA, USA, 5–9 October 1997; pp. 42–49. [Google Scholar]
- Dai, M.; Keyhani, A.; Sebastian, T. Torque ripple analysis of a PM brushless DC motor using finite element method. IEEE Trans. Energy Convers. 2004, 19, 40–45. [Google Scholar] [CrossRef]
- Hong, J.P.; Ha, K.H.; Lee, J. Stator pole and yoke design for vibration reduction of switched reluctance motor. IEEE Trans. Magn. 2002, 38, 929–932. [Google Scholar] [CrossRef]
- Choi, Y.K.; Yoon, H.S.; Koh, C.S. Pole-shape optimization of a switched-reluctance motor for torque ripple reduction. IEEE Trans. Magn. 2007, 43, 1797–1800. [Google Scholar] [CrossRef]
- Kim, H.W.; Kim, K.T.; Jo, Y.S.; Hur, J. Optimization methods of torque density for developing the neodymium free SPOKE-type BLDC motor. IEEE Trans. Magn. 2013, 49, 2173–2176. [Google Scholar] [CrossRef]
- Sarac, V. Performance optimization of permanent magnet synchronous motor by cogging torque reduction. J. Electr. Eng. 2019, 70, 218–226. [Google Scholar] [CrossRef]
- Lee, C.; Lee, J.; Jang, I.G. Shape optimization-based design investigation of the switched reluctance motors regarding the target torque and current limitation. Struct. Multidiscip. Optim. 2021, 64, 859–870. [Google Scholar] [CrossRef]
- Lee, C.; Jang, I.G. Topology optimization of multiple-barrier synchronous reluctance motors with initial random hollow circles. Struct. Multidiscip. Optim. 2021, 64, 2213–2224. [Google Scholar] [CrossRef]
- Kuci, E.; Henrotte, F.; Duysinx, P.; Geuzaine, C. Combination of topology optimization and Lie derivative-based shape optimization for electro-mechanical design. Struct. Multidiscip. Optim. 2019, 59, 1723–1731. [Google Scholar] [CrossRef]
- Choi, J.S.; Izui, K.; Nishiwaki, S.; Kawamoto, A.; Nomura, T. Rotor pole design of IPM motors for a sinusoidal air-gap flux density distribution. Struct. Multidiscip. Optim. 2012, 46, 445–455. [Google Scholar] [CrossRef]
- Jang, J.; Cho, S.G.; Lee, S.J.; Kim, K.S.; Kim, J.M.; Hong, J.P.; Lee, T.H. Reliability-based robust design optimization with kernel density estimation for electric power steering motor considering manufacturing uncertainties. IEEE Trans. Magn. 2015, 51, 8001904. [Google Scholar] [CrossRef]
- Kim, N.K.; Kim, D.H.; Kim, D.W.; Kim, H.G.; Lowther, D.A.; Sykulski, J.K. Robust optimization utilizing the second-order design sensitivity information. IEEE Trans. Magn. 2010, 46, 3117–3120. [Google Scholar] [CrossRef]
- Park, G.J.; Lee, T.H.; Lee, K.H.; Hwang, K.H. Robust design: An overview. AIAA J. 2006, 44, 181–191. [Google Scholar] [CrossRef]
- Youn, B.D.; Choi, K.K.; Du, L. Enriched Performance Measure Approach for Reliability-Based Design Optimization. AIAA J. 2005, 43, 874–884. [Google Scholar] [CrossRef]
- Kim, D.W.; Choi, N.S.; Lee, C.U.; Kim, D.H. Assessment of statistical moments of a performance function for robust design of electromagnetic devices. IEEE Trans. Magn. 2015, 51, 7205104. [Google Scholar] [CrossRef]
- Lee, S.J.; Kim, K.S.; Cho, S.G.; Jang, J.; Lee, T.; Hong, J.P. Taguchi robust design of back electromotive force considering the manufacturing tolerances in IPMSM. In Proceedings of the 2012 Sixth International Conference on Electromagnetic Field Problems and Applications, Dalian, China, 19–21 June 2012; pp. 1–4. [Google Scholar]
- Lee, S.G.; Kim, S.; Park, J.C.; Park, M.R.; Lee, T.H.; Lim, M.S. Robust Design Optimization of SPMSM for Robotic Actuator Considering Assembly Imperfection of Segmented Stator Core. IEEE Trans. Energy Convers. 2020, 35, 2076–2085. [Google Scholar] [CrossRef]
- Kim, S.; Lee, S.G.; Kim, J.M.; Lee, T.H.; Lim, M.S. Robust design optimization of surface-mounted permanent magnet synchronous motor using uncertainty characterization by bootstrap method. IEEE Trans. Energy Convers. 2020, 35, 2056–2065. [Google Scholar] [CrossRef]
- Ren, Z.; Ma, J.; Qi, Y.; Zhang, D.; Koh, C.S. Managing Uncertainties of Permanent Magnet Synchronous Machine by Adaptive Kriging Assisted Weight Index Monte Carlo Simulation Method. IEEE Trans. Energy Convers. 2020, 35, 2162–2169. [Google Scholar] [CrossRef]
- Mun, J.; Lim, J.; Kwak, Y.; Kang, B.; Choi, K.K.; Kim, D.H. Reliability-based design optimization of a permanent magnet motor under manufacturing tolerance and temperature fluctuation. IEEE Trans. Magn. 2021, 57, 8203304. [Google Scholar] [CrossRef]
- Kim, D.W.; Kang, B.; Choi, K.K.; Kim, D.H. A comparative study on probabilistic optimization methods for electromagnetic design. IEEE Trans. Magn. 2015, 52, 7201304. [Google Scholar] [CrossRef]
- Hao, Z.; Haowen, L.; Pengcheng, W.; Guobiao, C.; Feng, H. Uncertainty analysis and design optimization of solid rocket motors with finocyl grain. Struct. Multidiscip. Optim. 2020, 62, 3521–3537. [Google Scholar] [CrossRef]
- Jang, G.U.; Kim, C.W.; Bae, D.; Cho, Y.; Lee, J.J.; Cho, S. Reliability-based robust design optimization for torque ripple reduction considering manufacturing uncertainty of interior permanent magnet synchronous motor. J. Mech. Sci. Technol. 2020, 34, 1249–1256. [Google Scholar] [CrossRef]
- Gieras, J.F.; Wang, C.; Lai, J.C. Noise of Polyphase Electric Motors; CRC Press: Boca Raton, FL, USA, 2018. [Google Scholar]
- Cho, S.; Hwang, J.; Kim, C.W. A study on vibration characteristics of brushless dc motor by electromagnetic-structural coupled analysis using entire finite element model. IEEE Trans. Energy Convers. 2018, 33, 1712–1718. [Google Scholar] [CrossRef]
- Kang, B.; Choi, K.K.; Kim, D.H. An efficient serial-loop strategy for reliability-based robust optimization of electromagnetic design problems. IEEE Trans. Magn. 2017, 54, 7000904. [Google Scholar] [CrossRef]
- Taguchi, G. Introduction to Quality Engineering: Designing Quality into Products and Processes; Asian Productivity Organization: Tokyo, Japan, 1986. [Google Scholar]
- Taguchi, G. System of Experimental Design; Engineering Methods to Optimize Quality and Minimize Costs; UNIPUB/Kraus International Publications: White Plains, NY, USA, 1987. [Google Scholar]
- Park, G.J. Design of experiments. In Analytic Methods for Design Practice; Springer: London, UK, 2007; pp. 309–391. [Google Scholar]
- Baron, J.; Hammett, P.; Smith, D. Stamping Process Variation: An Analysis of Stamping Process Capability and Implications for Design, Die Tryout and Process Control; Technical Report Prepared for the Auto Steel Partnership Program: Southfield, MI, USA, 1999. [Google Scholar]
- Tillman, F.A.; Hwang, C.L.; Kuo, W. Optimization techniques for system reliability with Redundancy—A review. IEEE Trans. Reliab. 1977, 26, 148–155. [Google Scholar] [CrossRef]


| Specifications | Quantity |
|---|---|
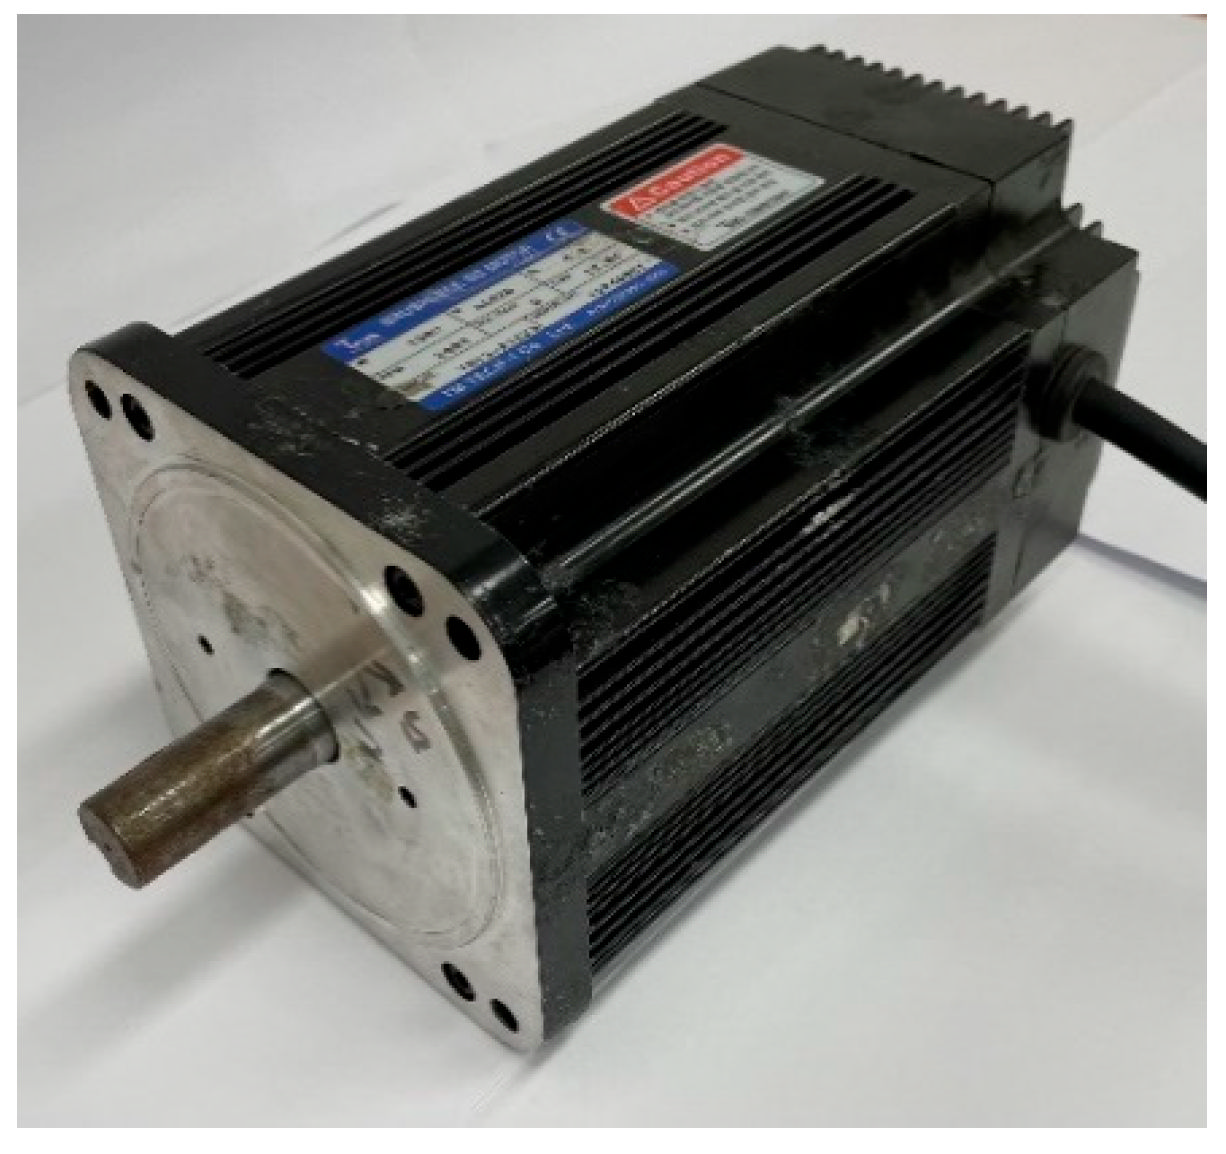
| Type | BLDC |
| Number of poles | 4 |
| Number of slots | 24 |
| Rated power | 1.5 kW |
| Rated torque | 7.17 N∙m |
| Rated speed | 2000 rpm |
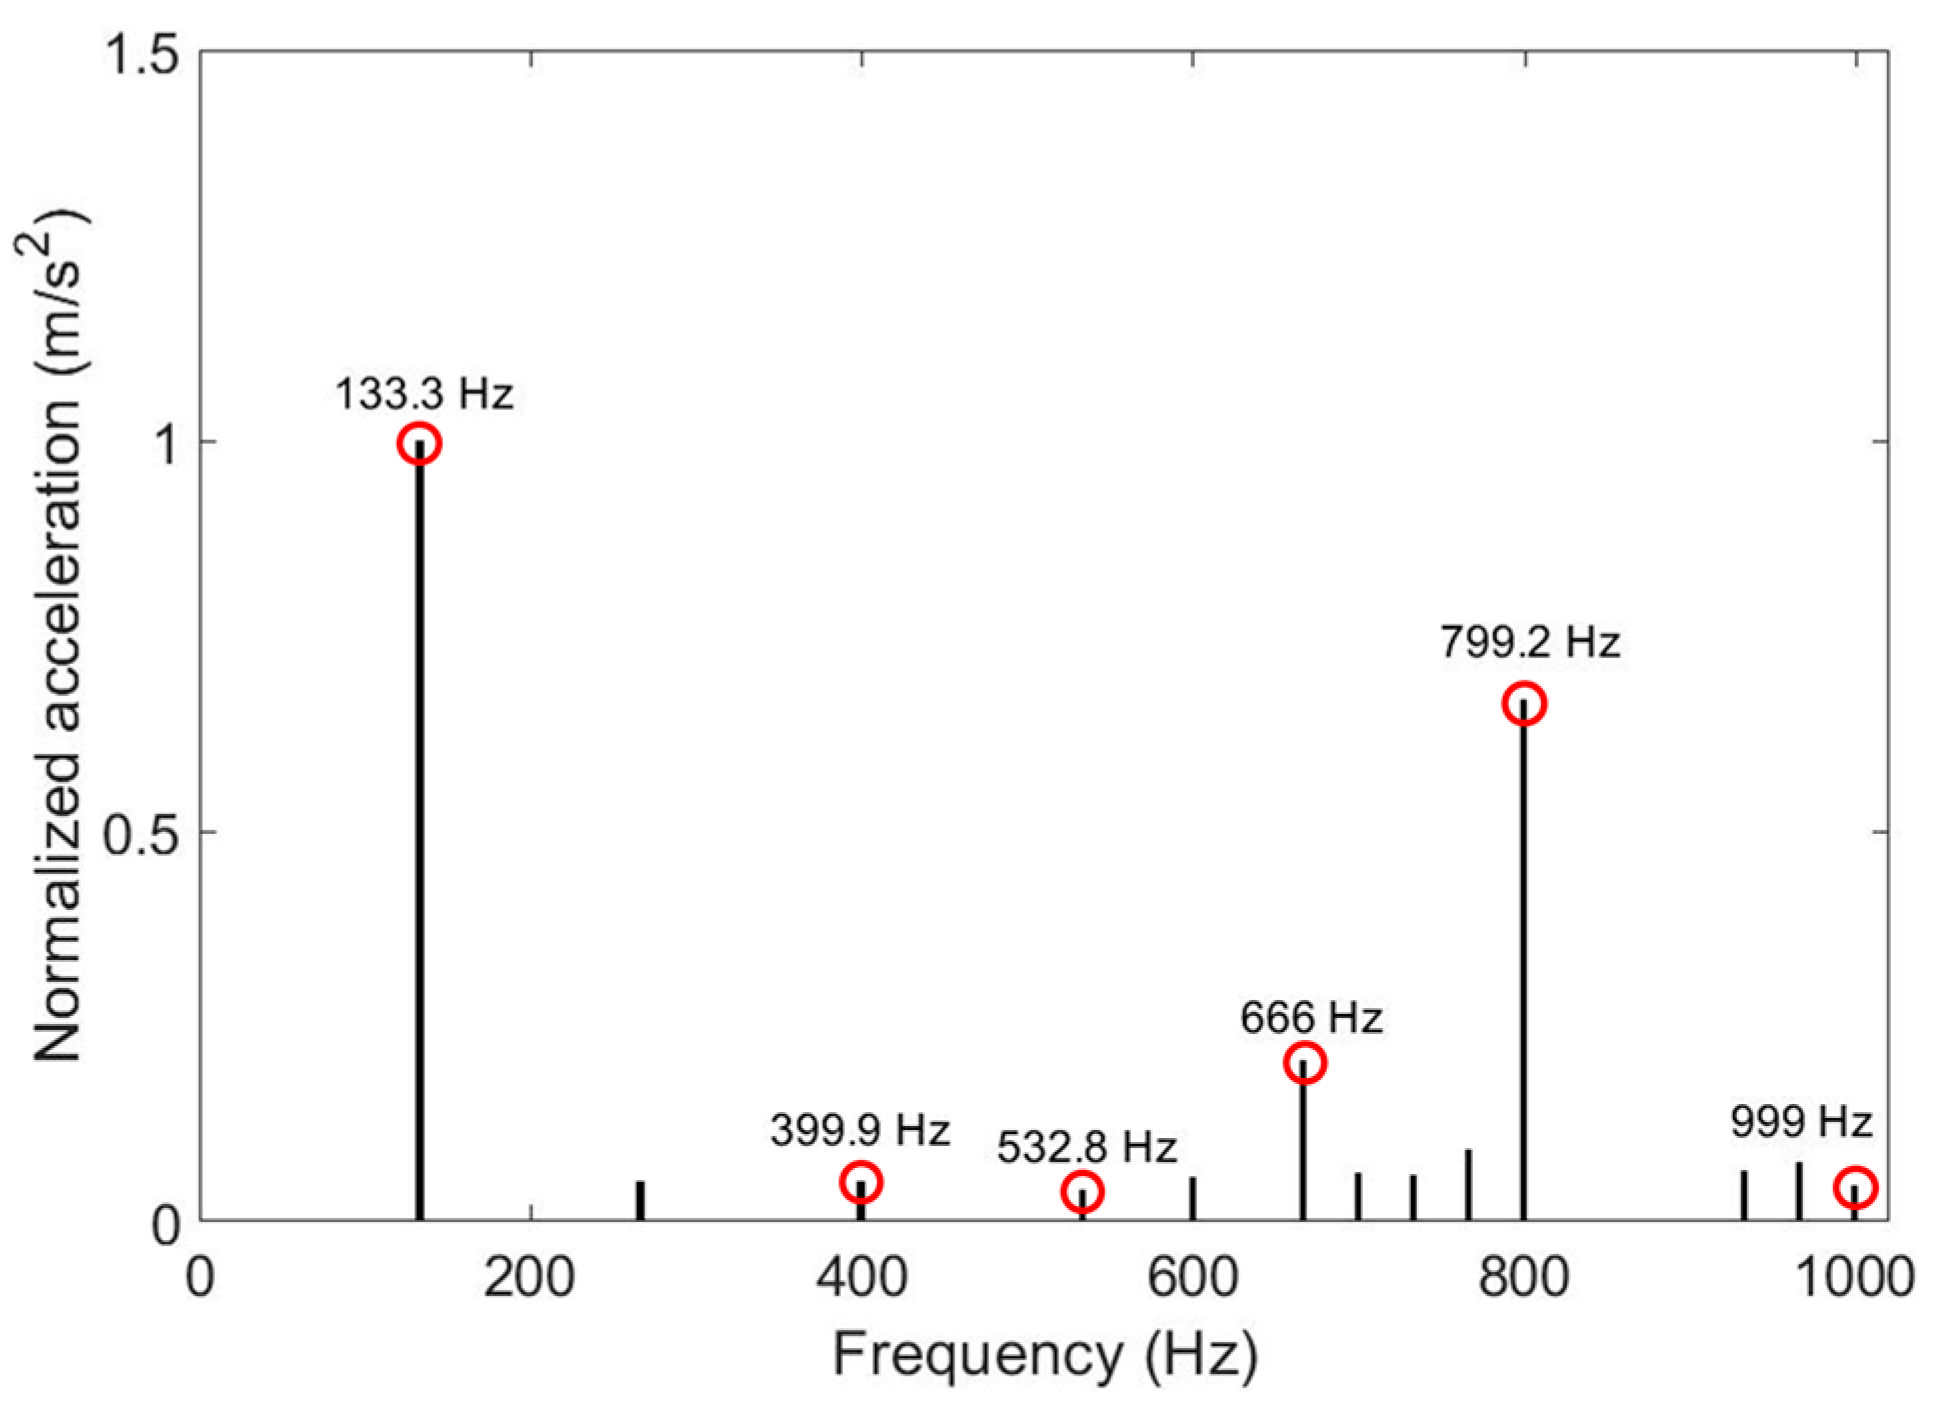
| Measured Peak Frequency (Hz) | Simulated Peak Frequency (Hz) | Relative Error (%) |
|---|---|---|
| 133 | 133.3 | 0.23% |
| 276 | 266.6 | −3.48% |
| 403 | 399.9 | −0.77% |
| 540 | 532.8 | −1.33% |
| 612 | 599.4 | −2.06% |
| 670 | 666 | −0.60% |
| 705 | 699.3 | −0.81% |
| 724 | 732.6 | 1.19% |
| 780 | 765.9 | −1.81% |
| 820 | 799.2 | −2.54% |
| 943 | 932.4 | −1.12% |
| 986 | 965.7 | −2.06% |
| 1000 | 999 | −0.10% |
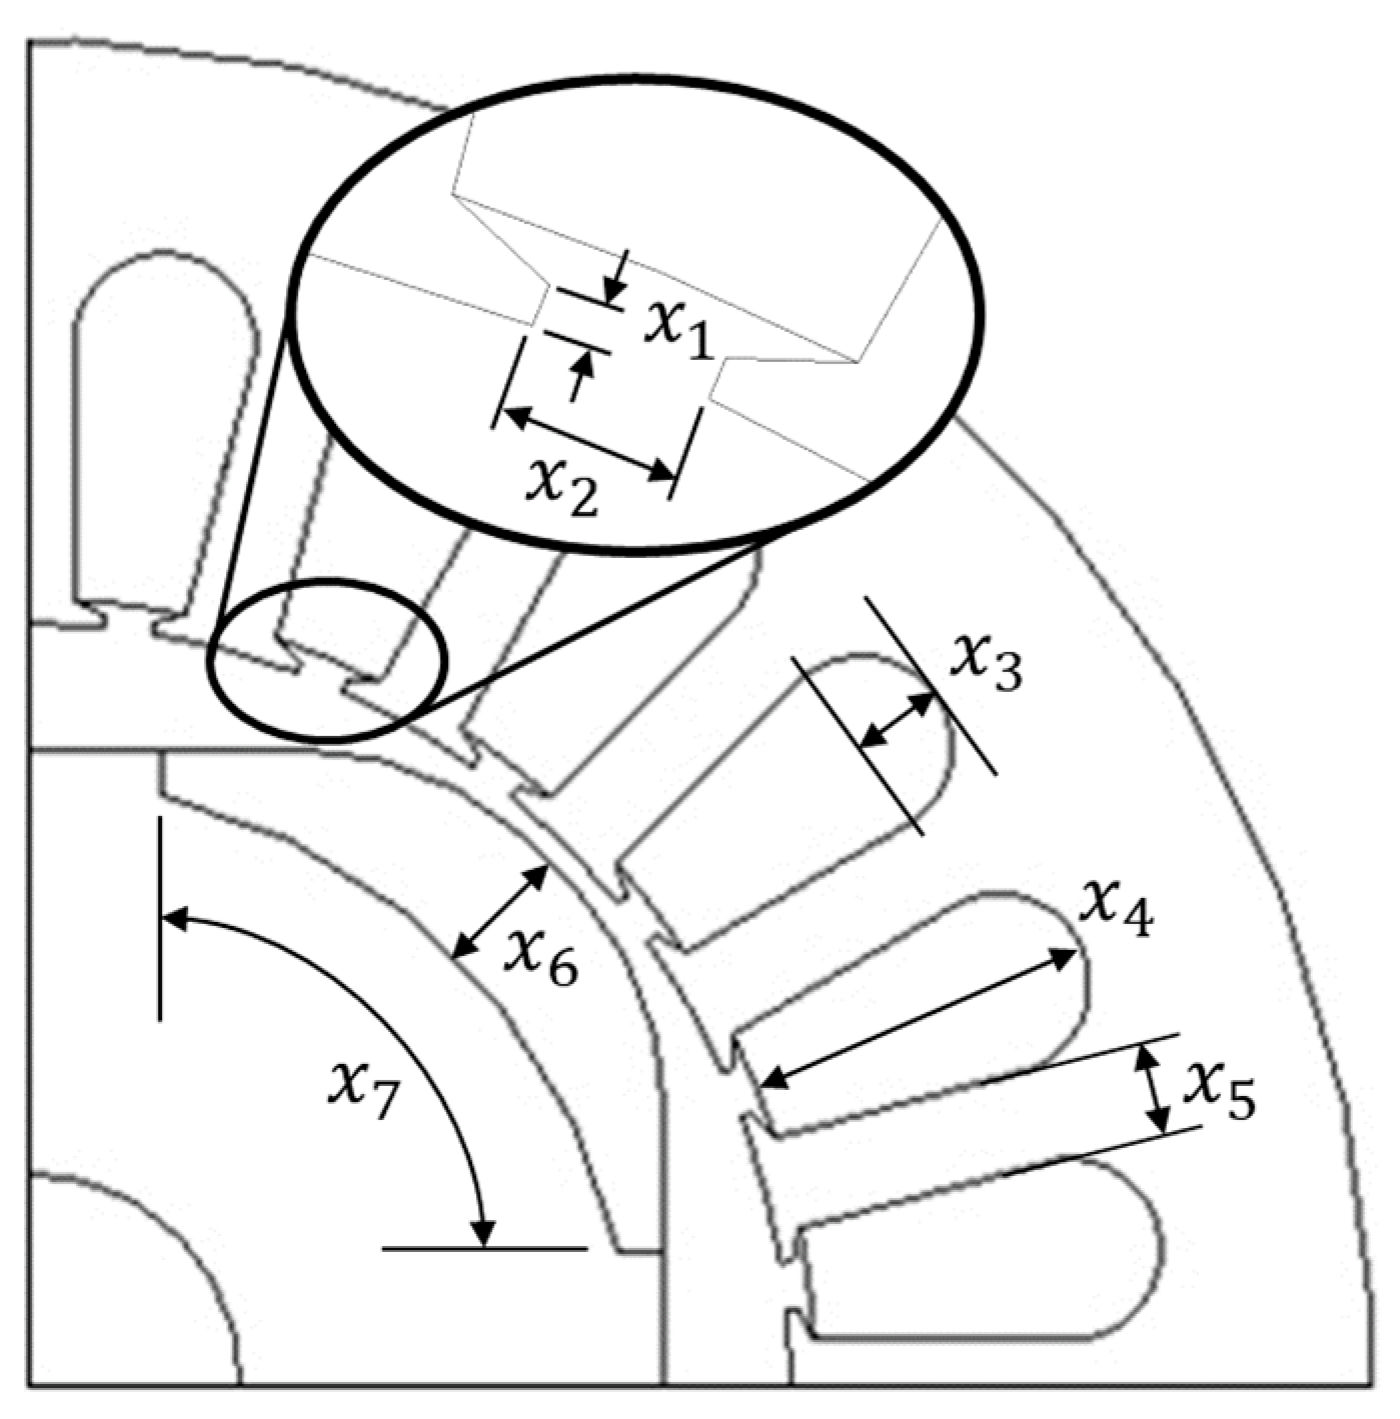
| Parameters | Unit | Mean | Standard Deviation | Distribution |
|---|---|---|---|---|
| mm | 0.5 | 0.06 | Normal | |
| mm | 2.18 | 0.06 | Normal | |
| mm | 4.05 | 0.06 | Normal | |
| mm | 15.86 | 0.06 | Normal | |
| mm | 4.19 | 0.06 | Normal | |
| mm | 6 | 0.06 | Normal | |
| mm | 37.53 | 0.06 | Normal |
| Output torque | Mean (N∙m) | 7.16 |
| Standard deviation | 0.49 | |
| Torque ripple | Mean (N∙m) | 3.46 |
| Probability of failure (%) | 36.81 |
| Design Variables | Unit | Design Spaces |
|---|---|---|
| mm | < 0.98 | |
| mm | < 2.39 | |
| mm | < 4.45 | |
| mm | < 20.56 | |
| mm | < 4.68 | |
| mm | < 8.35 | |
| mm | < 39.53 |
| Design Variables and Performance | Initial Design | RBRDO | Rate of Change (%) | |
|---|---|---|---|---|
| Tooth thickness (mm) | 0.5 | 0.46 | −8.0 | |
| SO width (mm) | 2.18 | 2.37 | +8.7 | |
| Slot radius (mm) | 4.05 | 3.78 | −6.7 | |
| Slot depth (mm) | 15.86 | 11.2 | −29.5 | |
| Tooth width (mm) | 4.19 | 3.70 | −11.9 | |
| Magnet thickness (mm) | 6 | 5 | −16.7 | |
| Magnet length (mm) | 37.53 | 39.52 | +5.3 | |
| Output torque | Mean (N∙m) | 7.16 | 7.79 | +8.8 |
| Standard deviation | 0.49 | 0.26 | −46.9 | |
| Torque ripple | Mean (N∙m) | 3.46 | 1.67 | −51.7 |
| Probability of failure (%) | 36.8 | 0.28 | −99.2 | |
| Magnet area (mm2) | 152.5 | 151.1 | −0.92 | |
| Optimization Method | ||||
|---|---|---|---|---|
| DDO | RDO | RBRDO | ||
| Output torque (N∙m) | Mean | 8.49 | 8.28 | 7.79 |
| Standard deviation | 0.54 | 0.24 | 0.26 | |
| Torque ripple (N∙m) | Mean | 3.35 | 2.63 | 1.67 |
| Probability of failure (%) | 33.0 | 10.1 | 0.28 | |
| Magnet area (mm2) | 160.0 | 153.2 | 151.1 | |
Publisher’s Note: MDPI stays neutral with regard to jurisdictional claims in published maps and institutional affiliations. |
© 2022 by the authors. Licensee MDPI, Basel, Switzerland. This article is an open access article distributed under the terms and conditions of the Creative Commons Attribution (CC BY) license (https://creativecommons.org/licenses/by/4.0/).
Share and Cite
Jeon, K.; Yoo, D.; Park, J.; Lee, K.-D.; Lee, J.-J.; Kim, C.-W. Reliability-Based Robust Design Optimization for Maximizing the Output Torque of Brushless Direct Current (BLDC) Motors Considering Manufacturing Uncertainty. Machines 2022, 10, 797. https://doi.org/10.3390/machines10090797
Jeon K, Yoo D, Park J, Lee K-D, Lee J-J, Kim C-W. Reliability-Based Robust Design Optimization for Maximizing the Output Torque of Brushless Direct Current (BLDC) Motors Considering Manufacturing Uncertainty. Machines. 2022; 10(9):797. https://doi.org/10.3390/machines10090797
Chicago/Turabian StyleJeon, Kyunghun, Donghyeon Yoo, Jongjin Park, Ki-Deok Lee, Jeong-Jong Lee, and Chang-Wan Kim. 2022. "Reliability-Based Robust Design Optimization for Maximizing the Output Torque of Brushless Direct Current (BLDC) Motors Considering Manufacturing Uncertainty" Machines 10, no. 9: 797. https://doi.org/10.3390/machines10090797