
Oil Cavitation Morphology Analysis of Textured Cylindrical Rotating Friction Pair on Circular-Disk End Faces


Abstract
:1. Introduction
2. Governing Equations
2.1. Homogeneous Equilibrium Model
2.2. Turbulence Equations
2.3. Cavitation Equations
2.4. Fluid Mechanics Equations
- (1)
- There is no relative slippage on the contact surface of fluid oil and friction disks.
- (2)
- The disks are always parallel to each other without bias grinding, the oil film thickness is always greater than 0, and there is no convex peak contact.
- (3)
- The flow field flow is laminar flow.
- (4)
- The effect of volume force and inertia terms are neglected and only the effect of centrifugal terms is considered.
- (5)
- Neglecting the axial movement of oil.
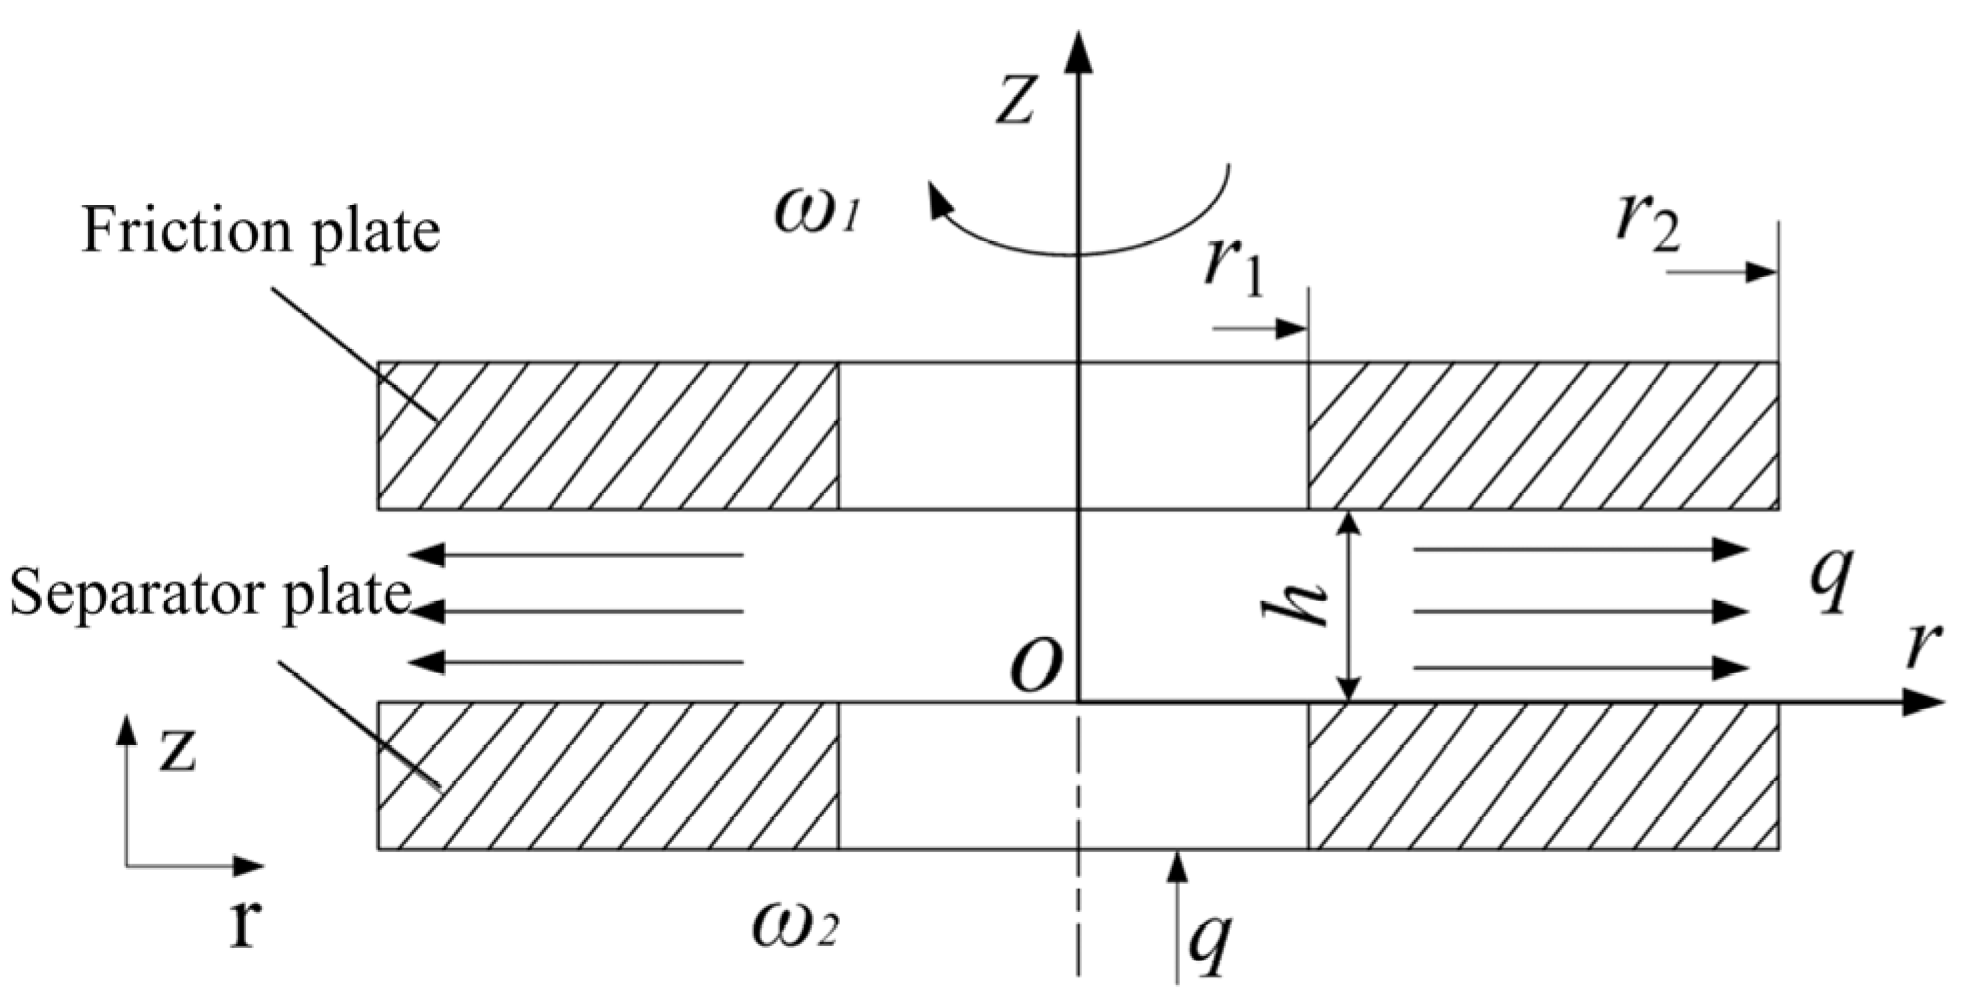
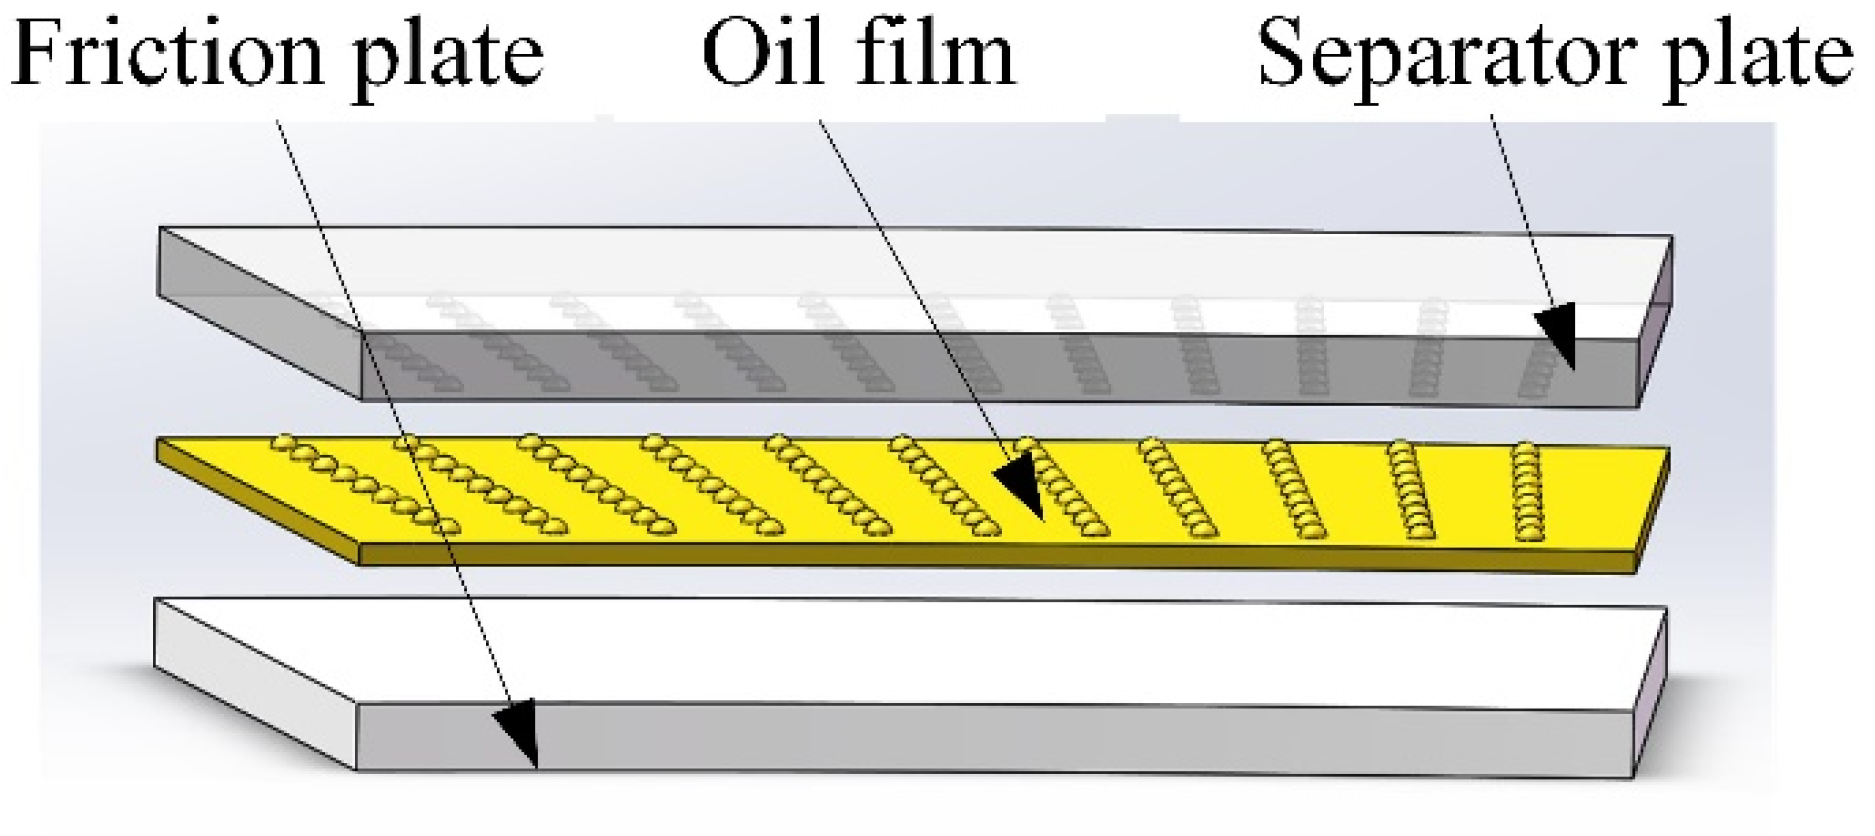
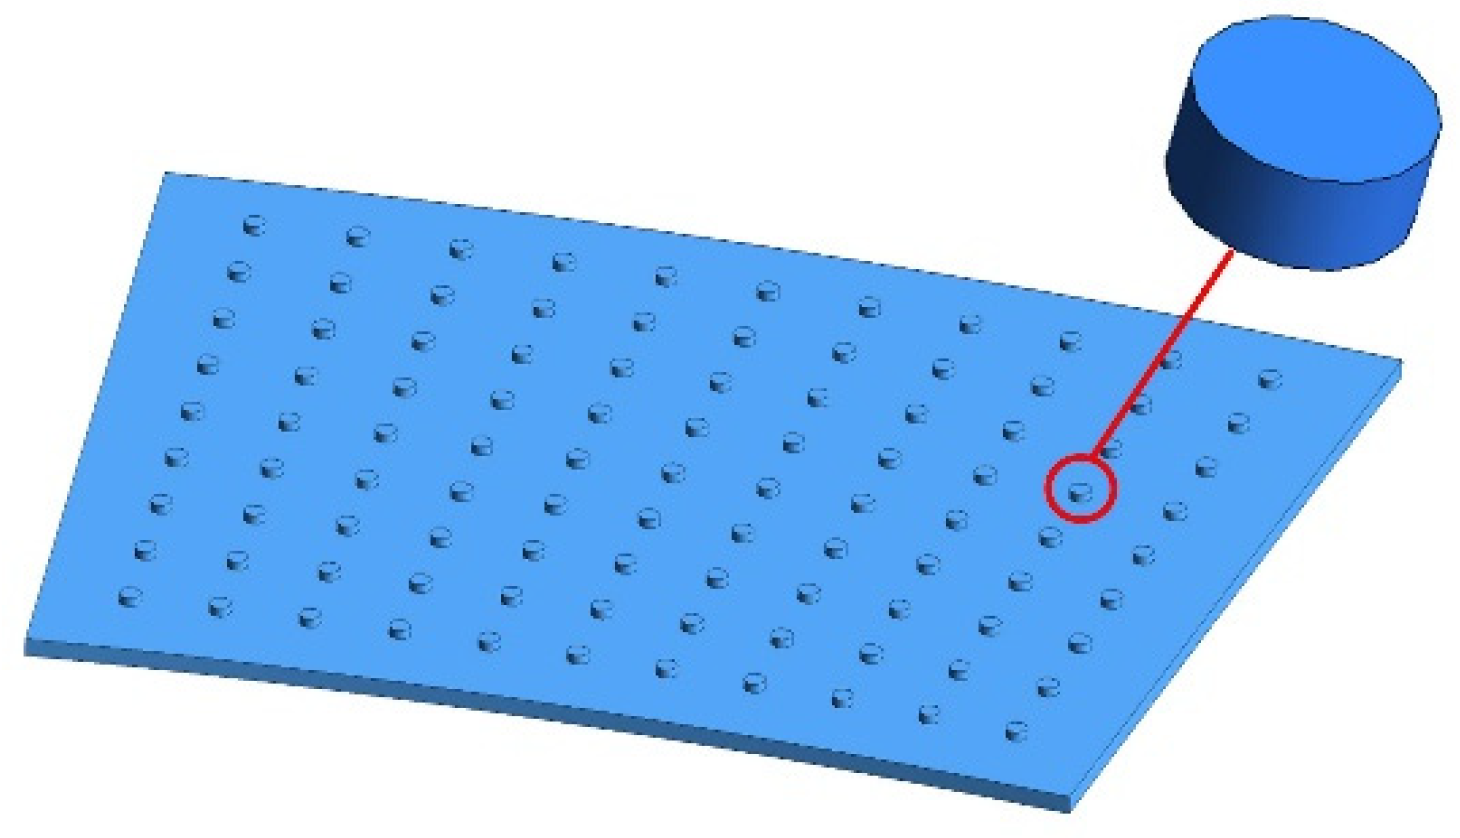
3. Model Analysis
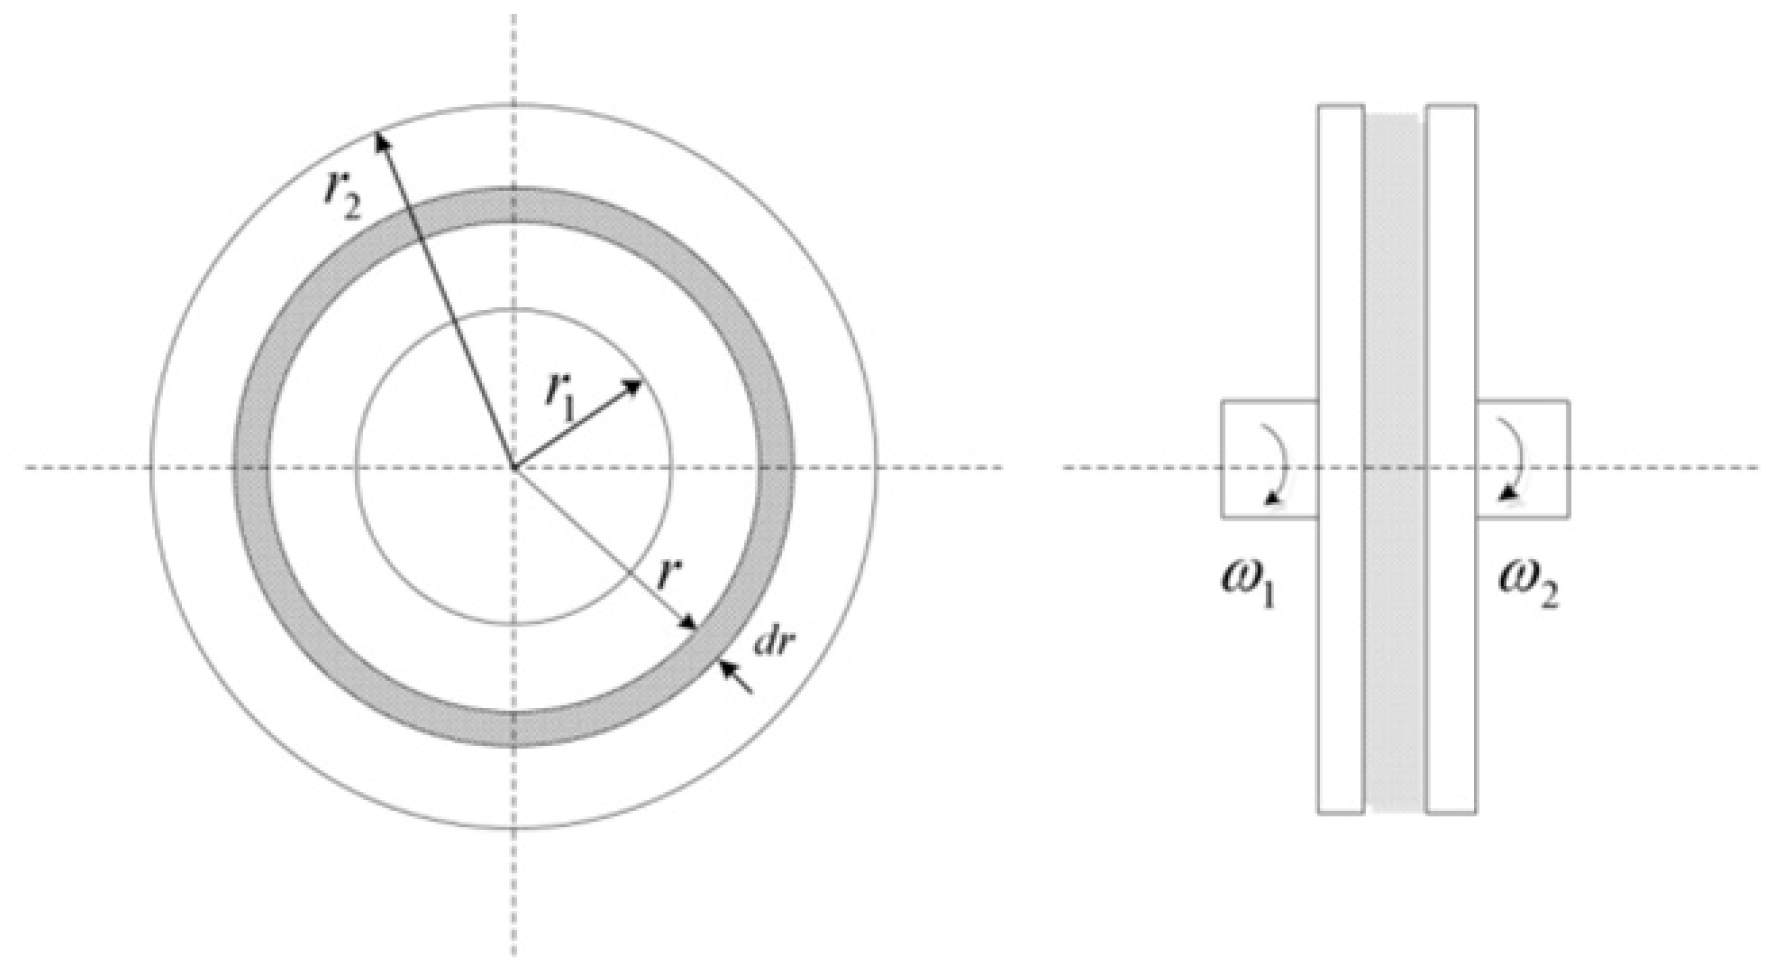
3.1. Geometric Model
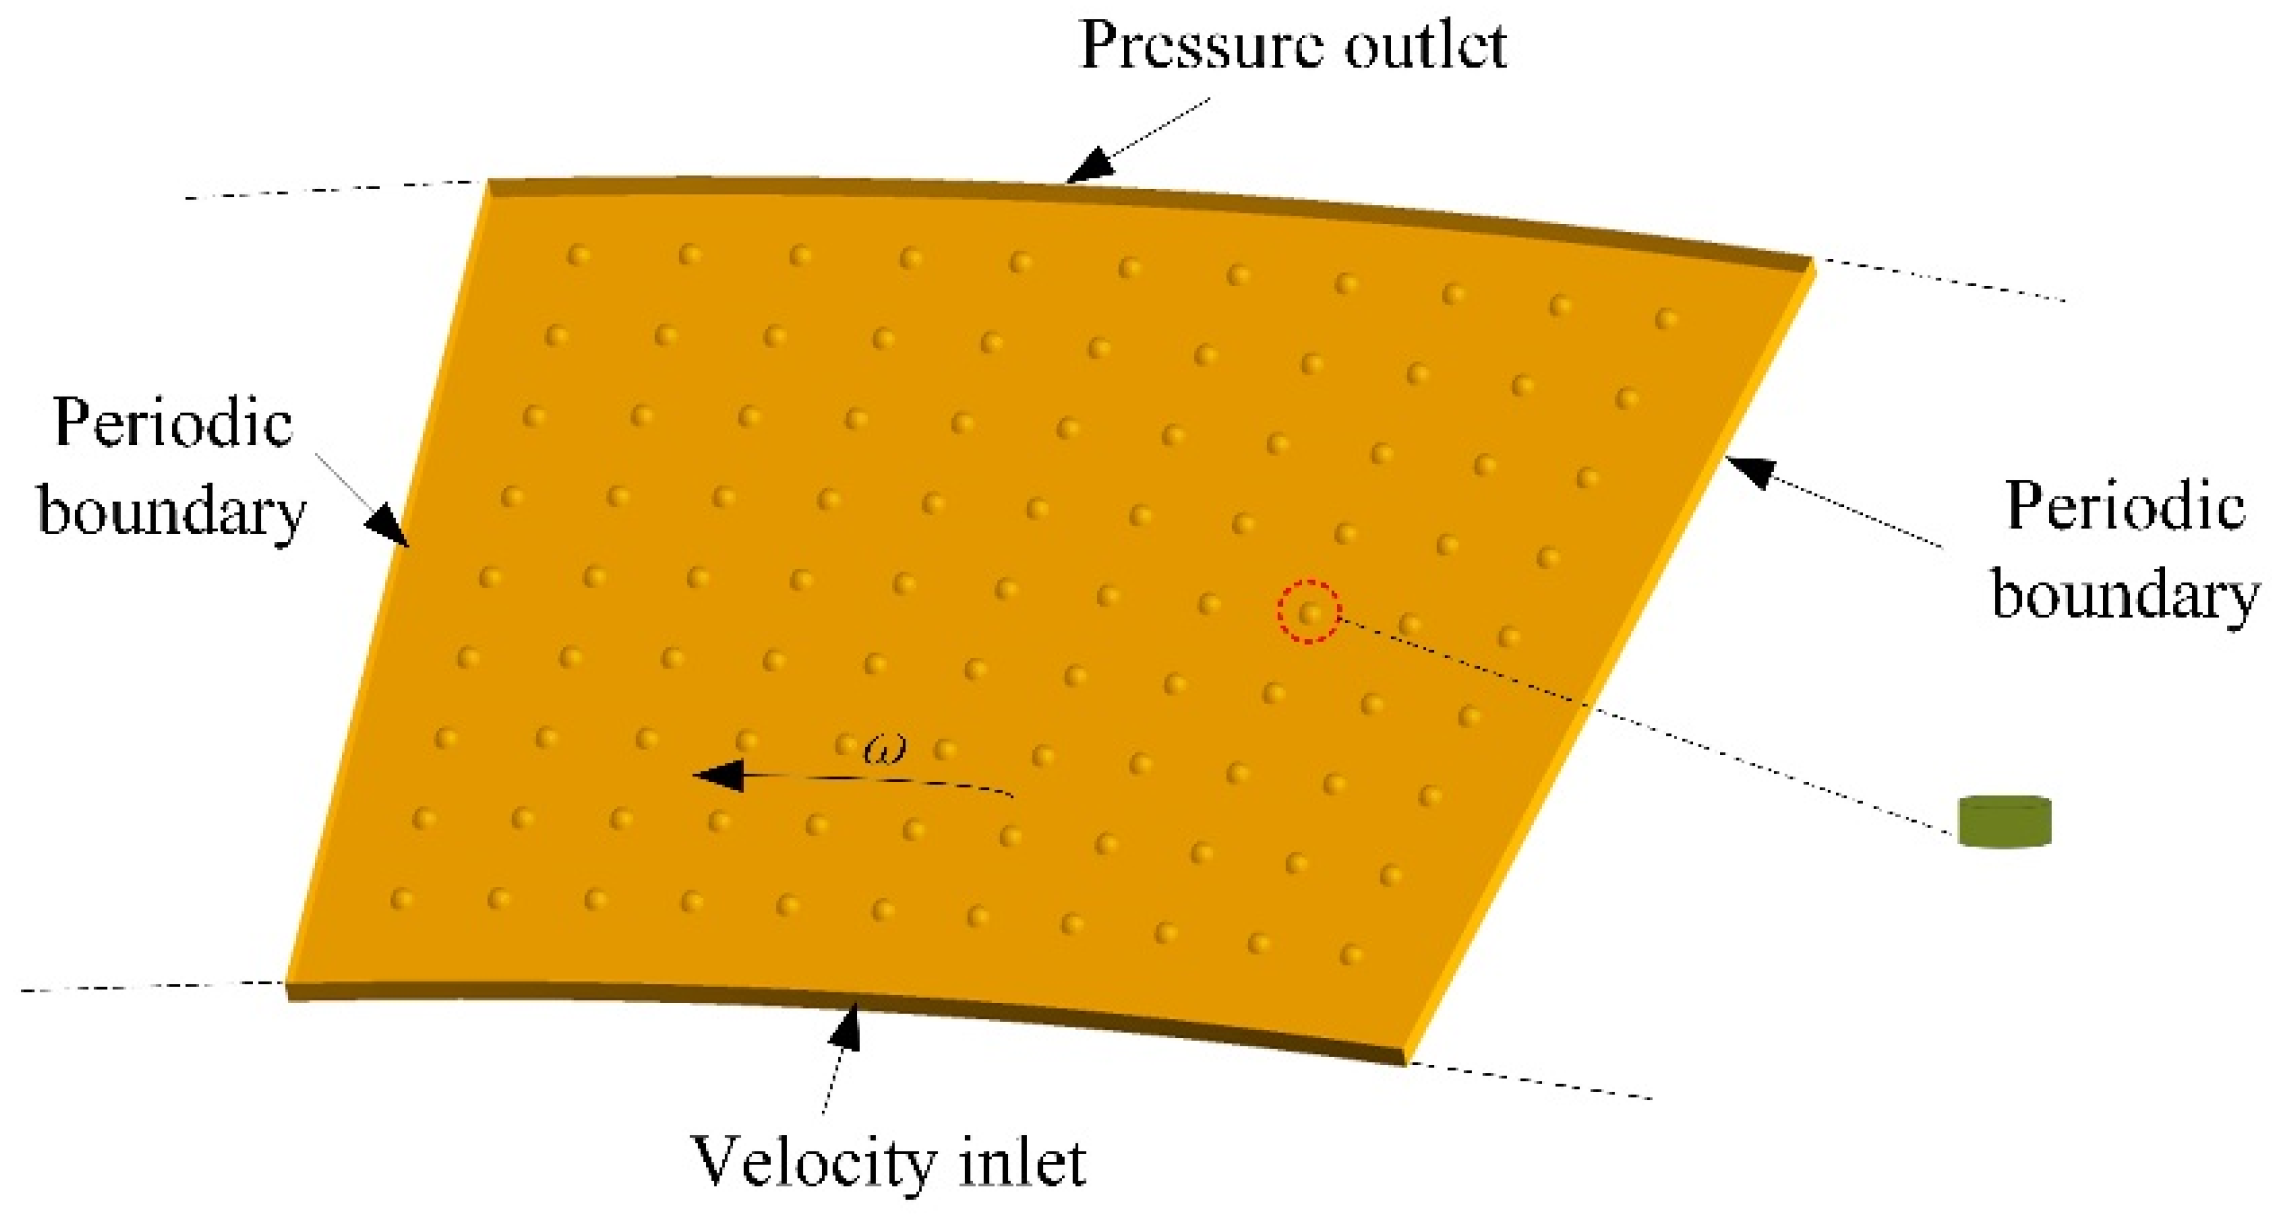
3.2. CFD Model
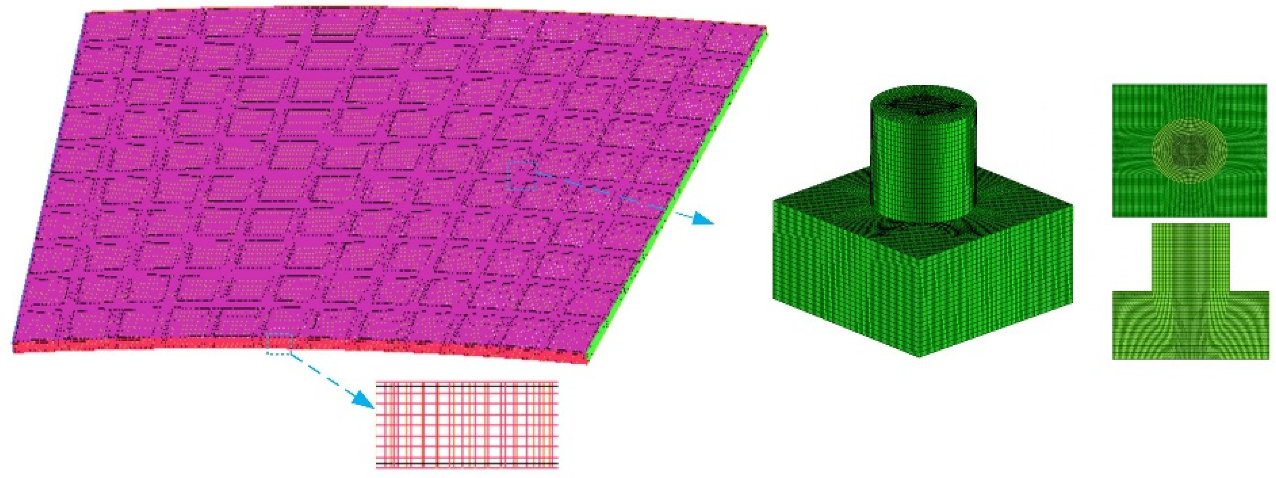
3.3. Mesh Model
3.4. Viscosity–Temperature Relationship
4. Simulation Analysis
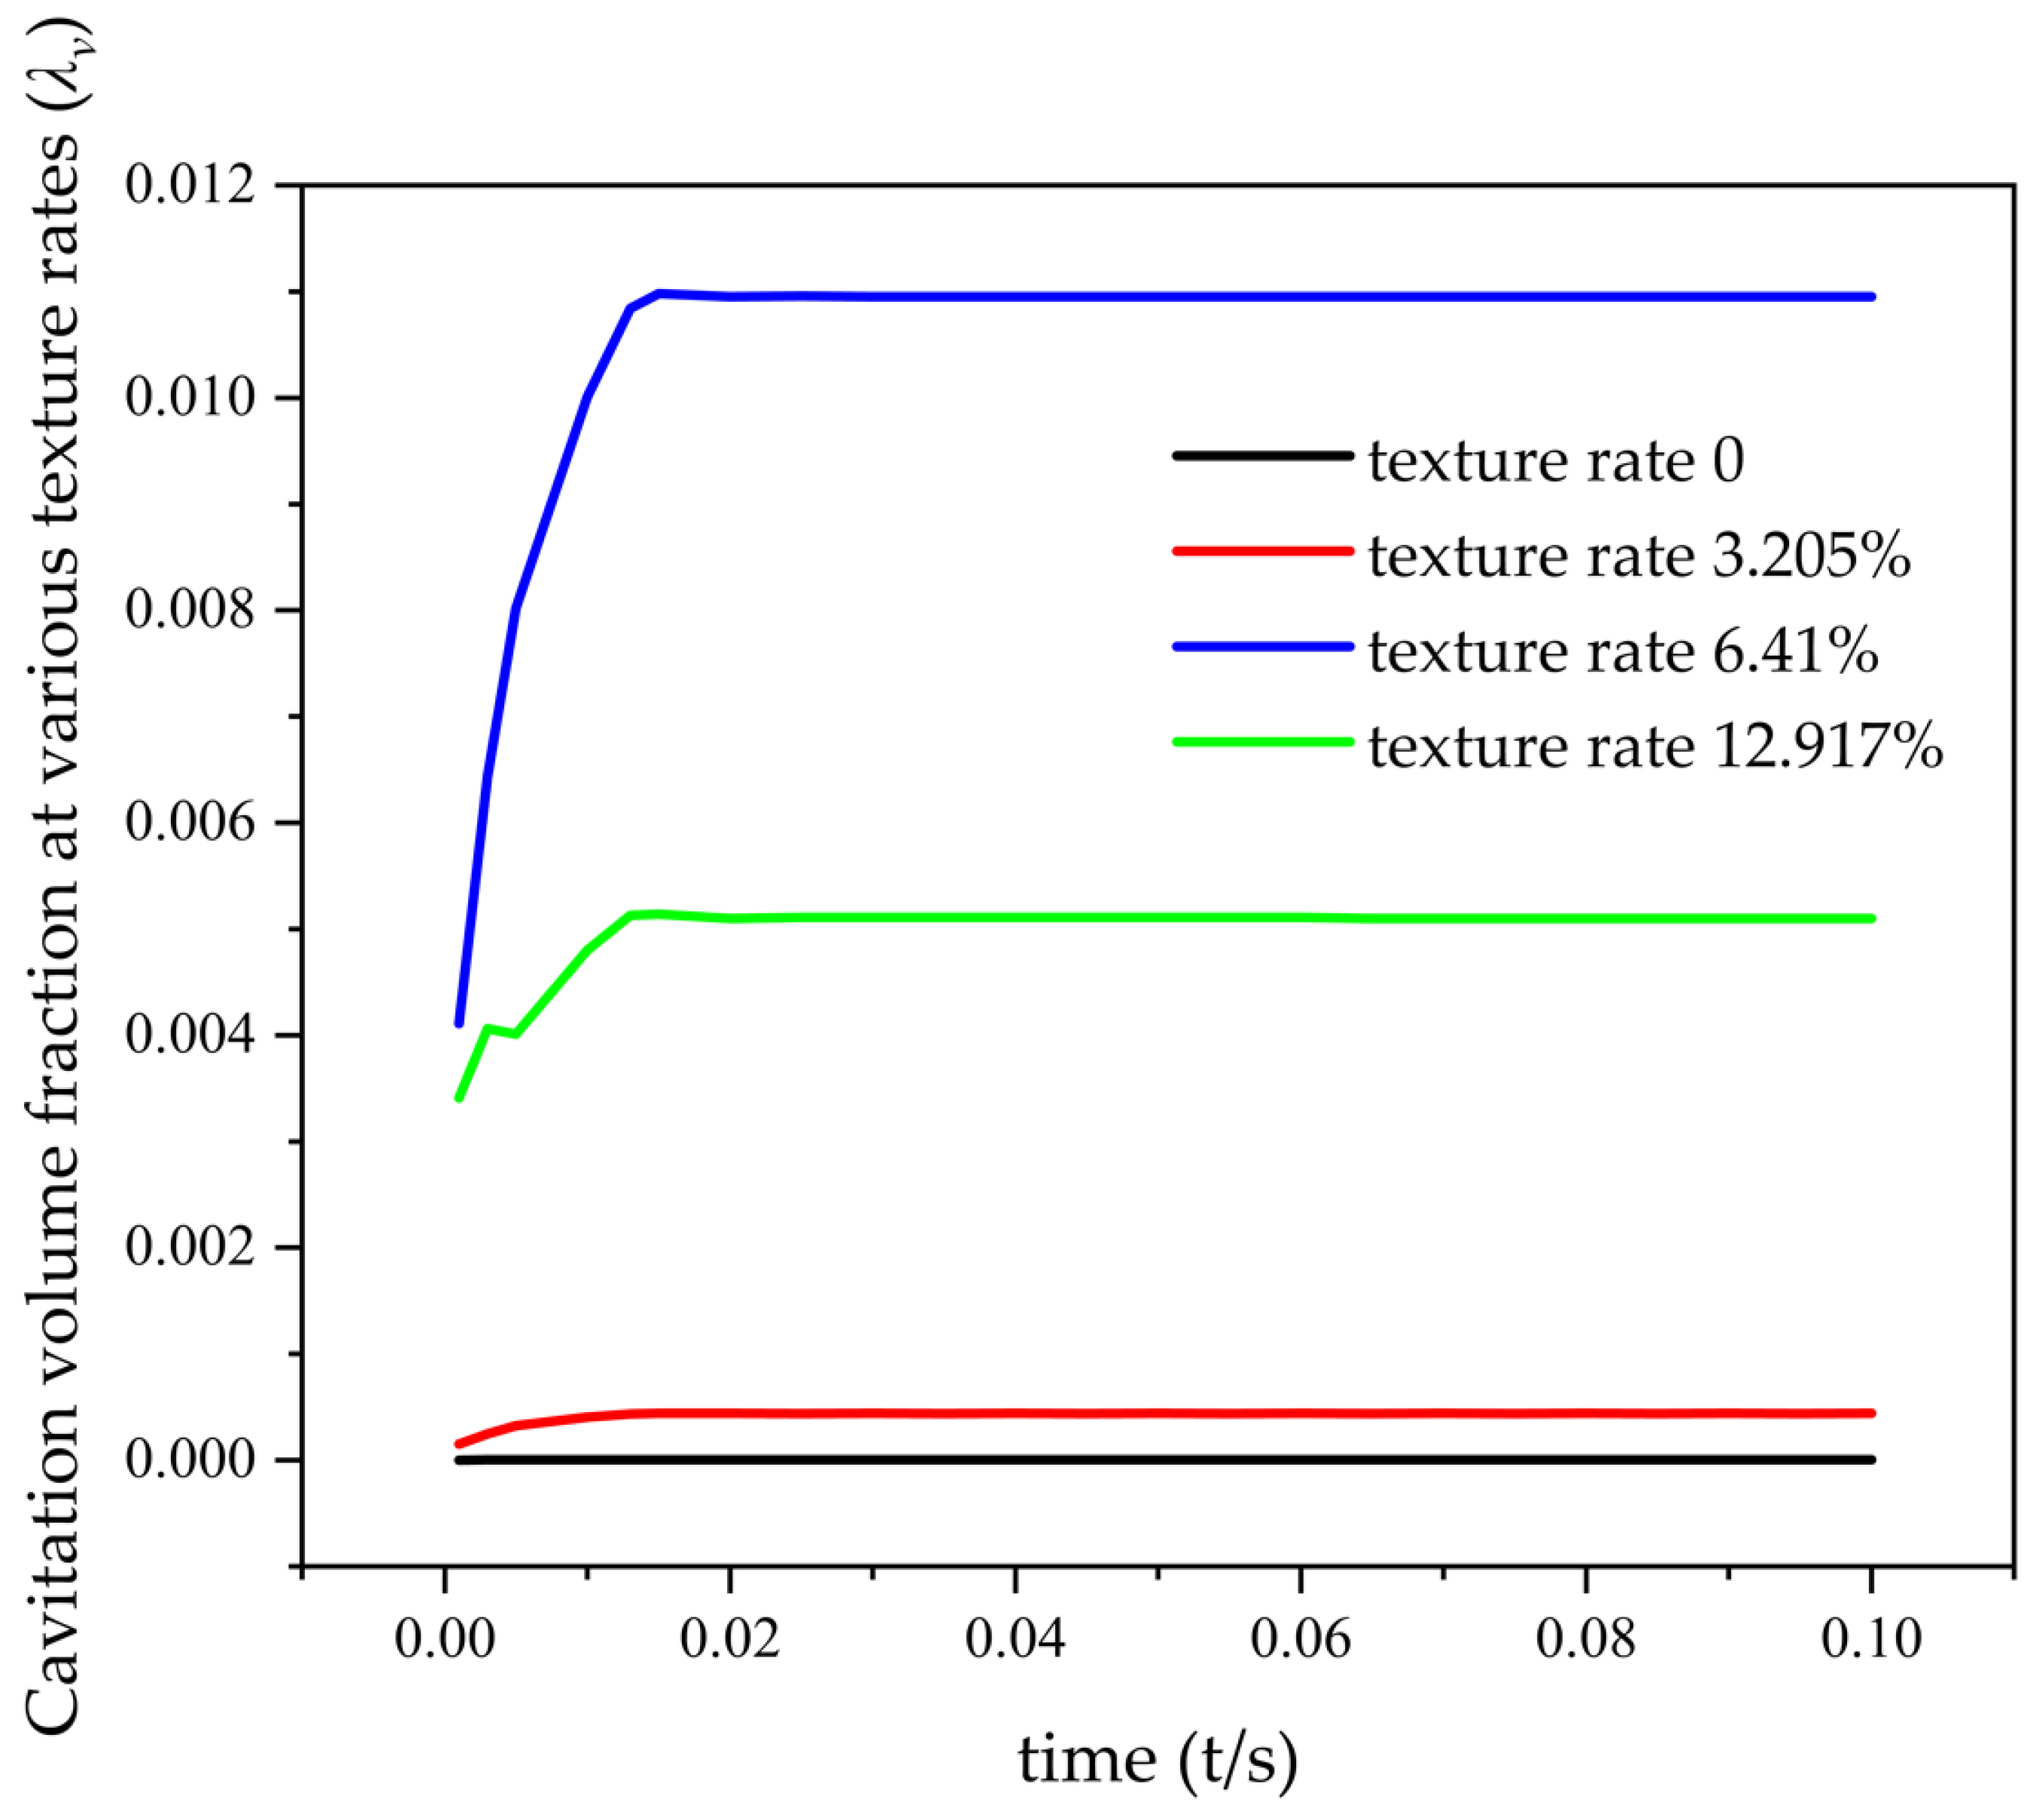
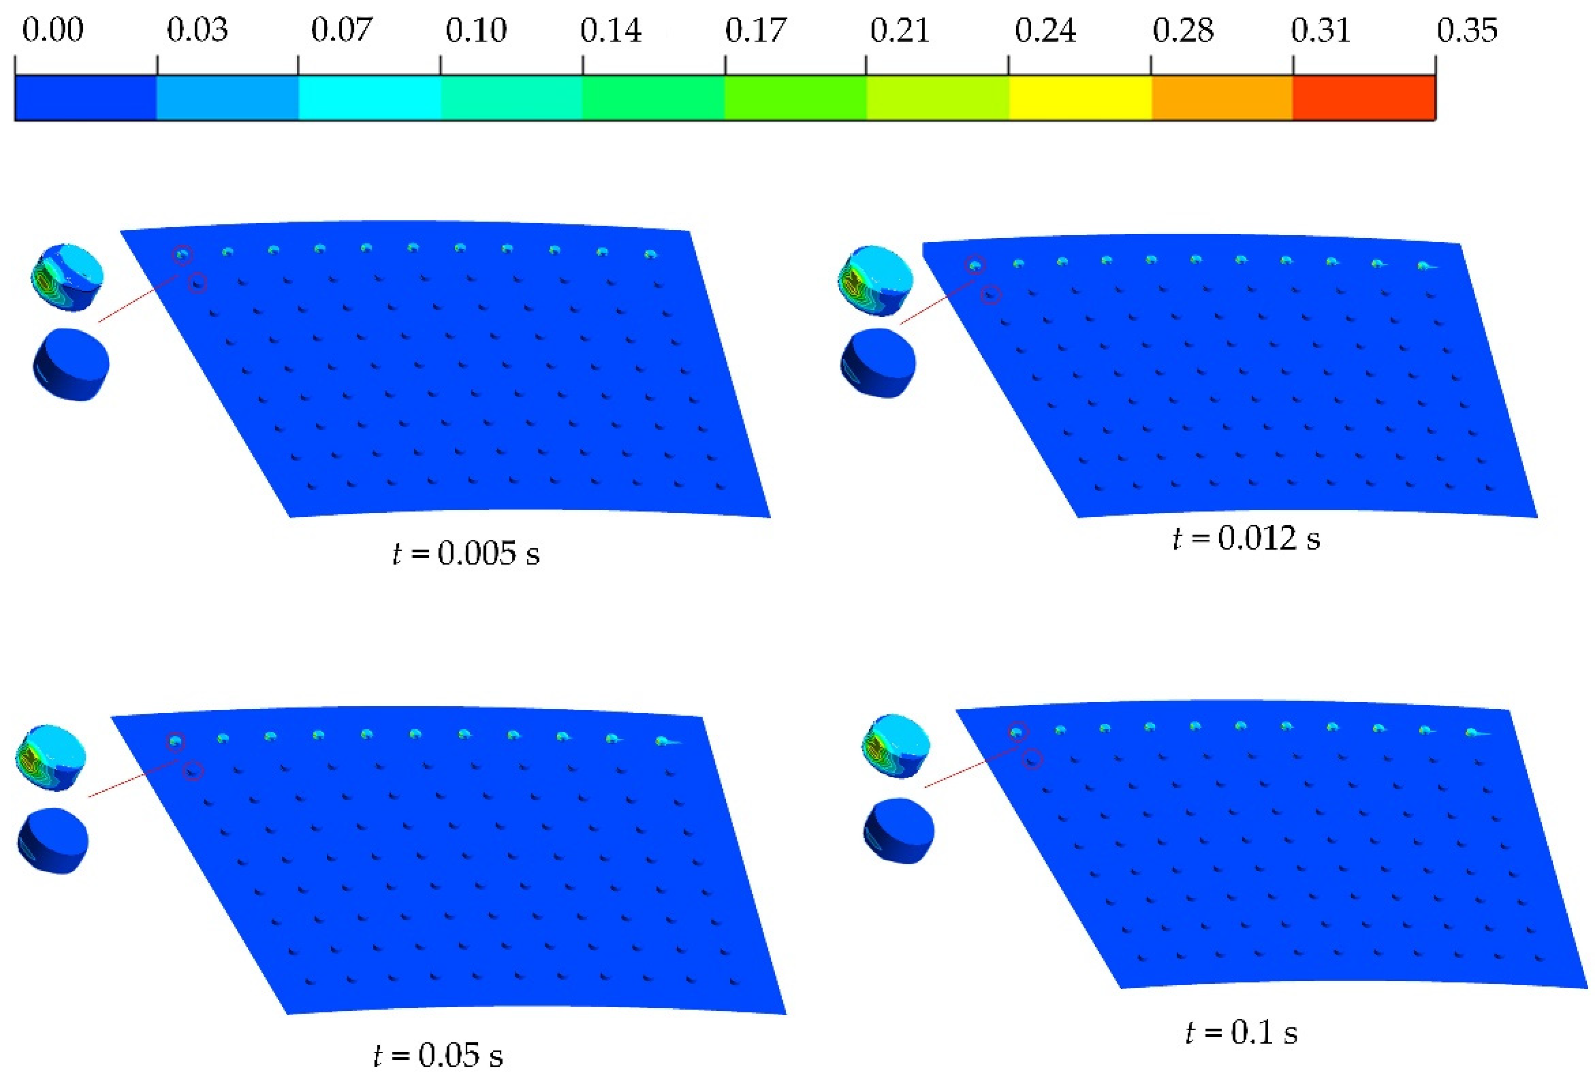
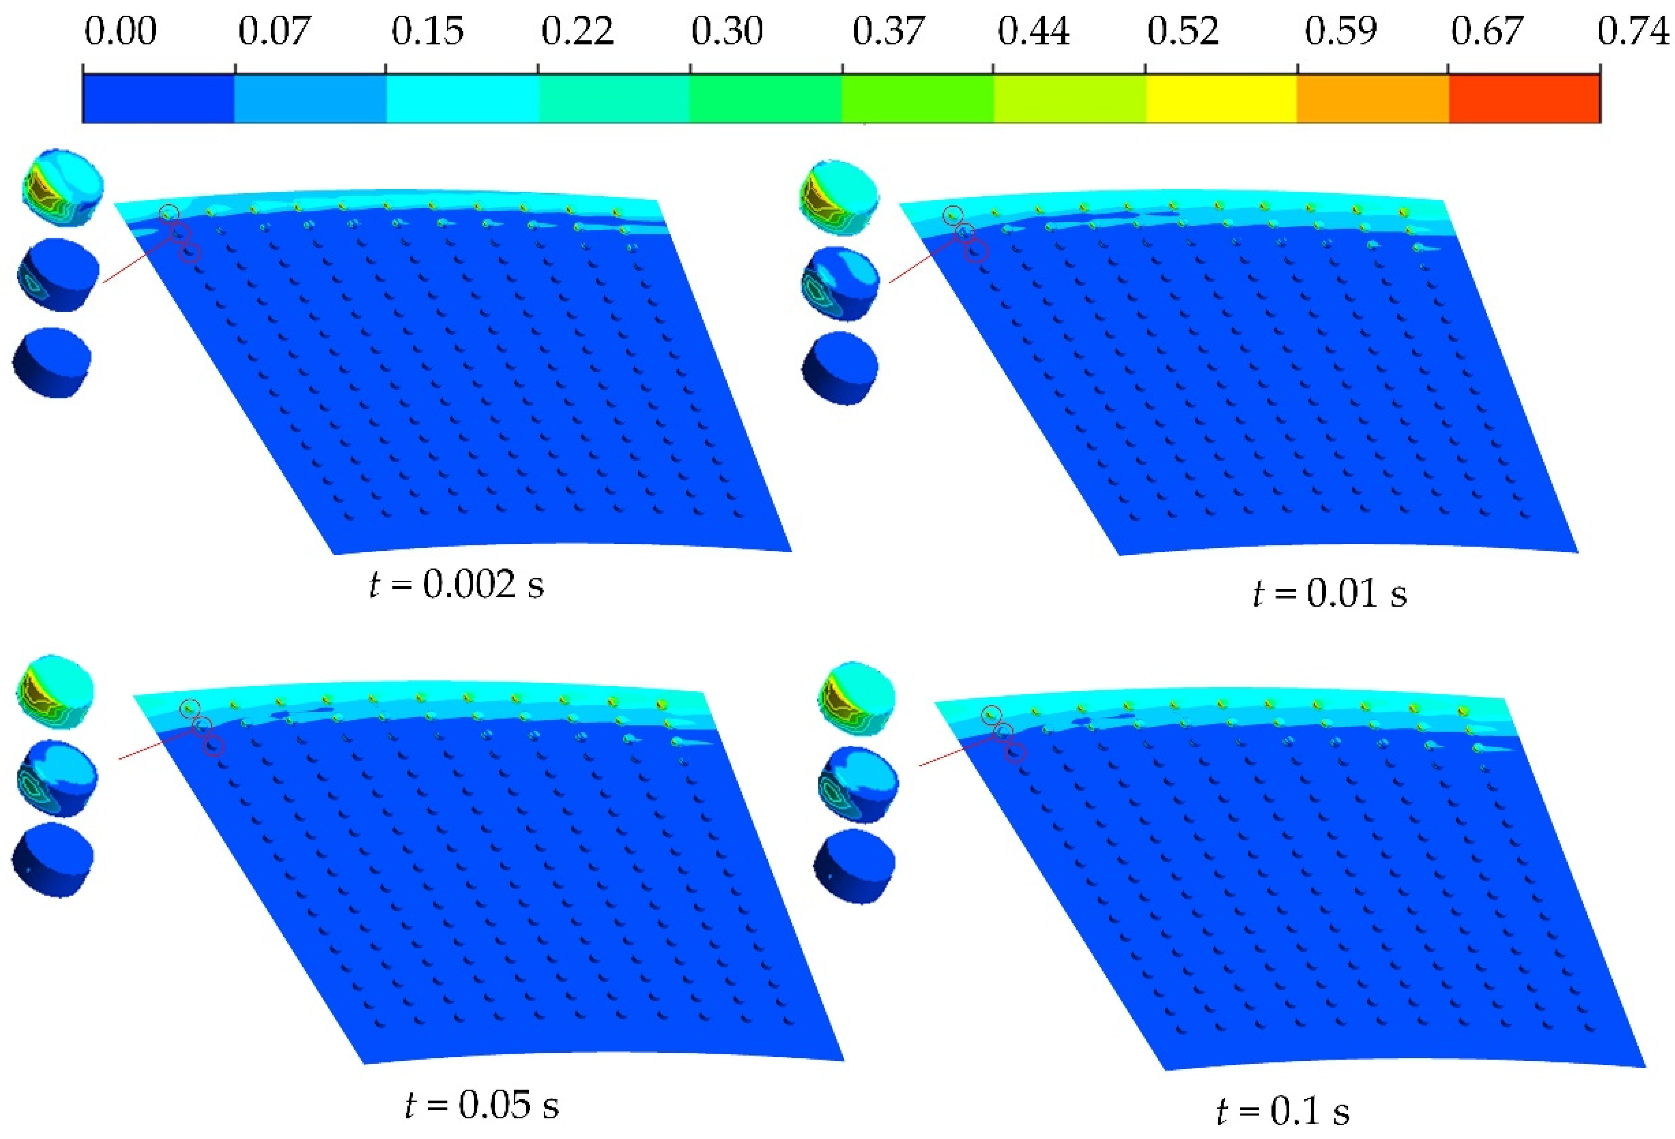
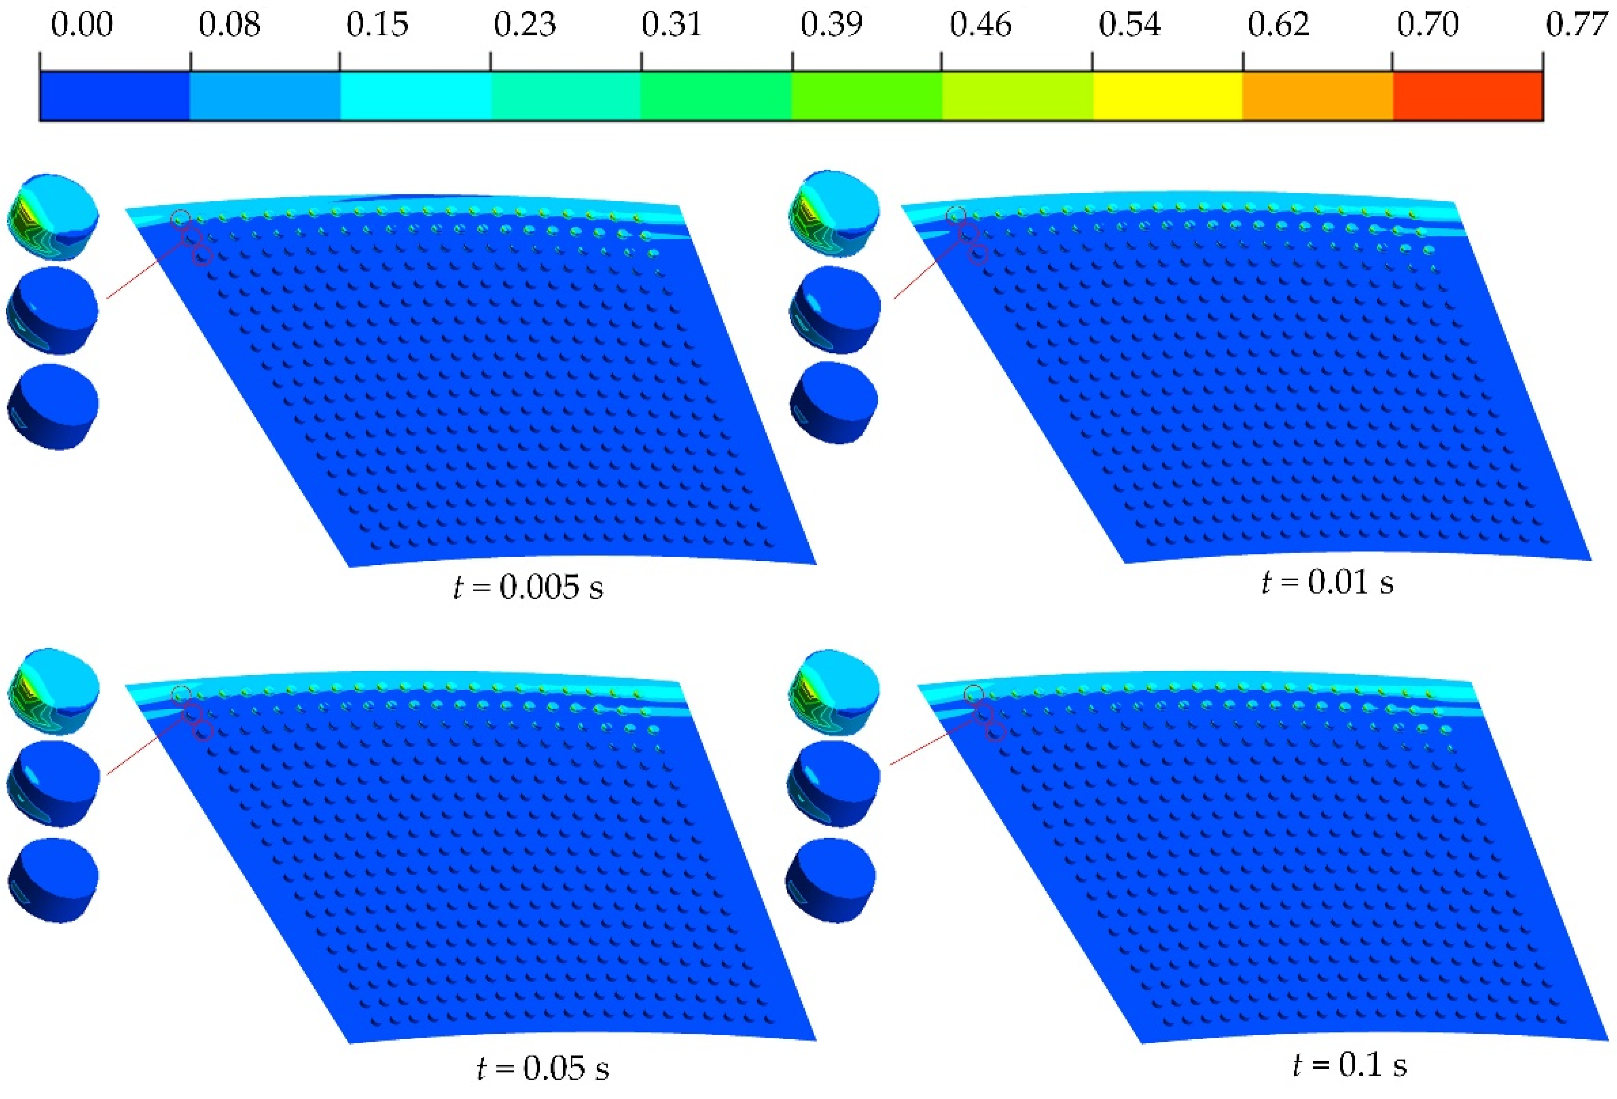
4.1. Cavitation at Different Texture Rates
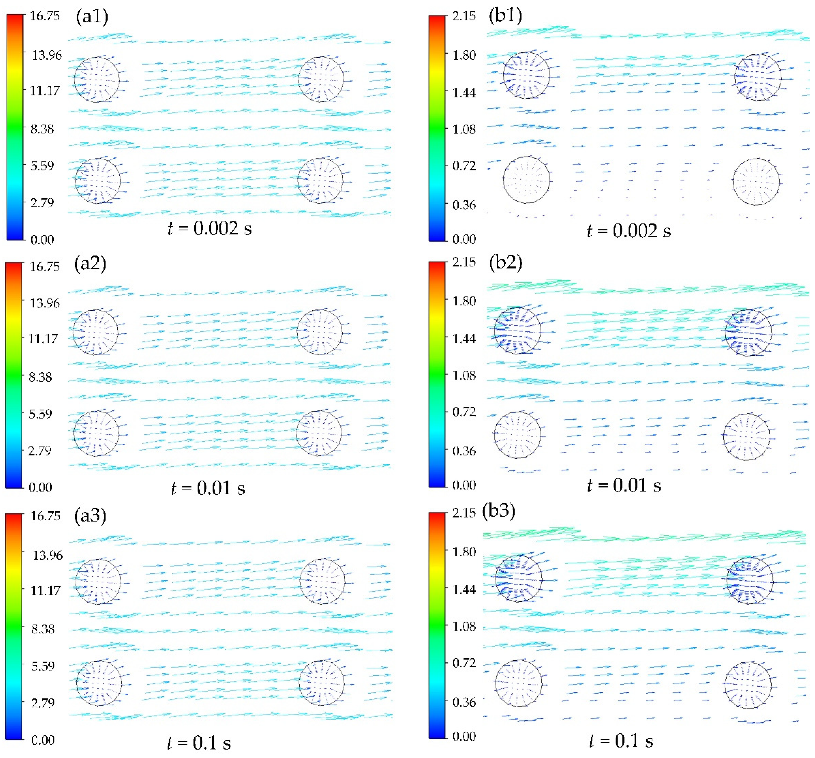
4.2. Cavitation Velocity Field Analysis
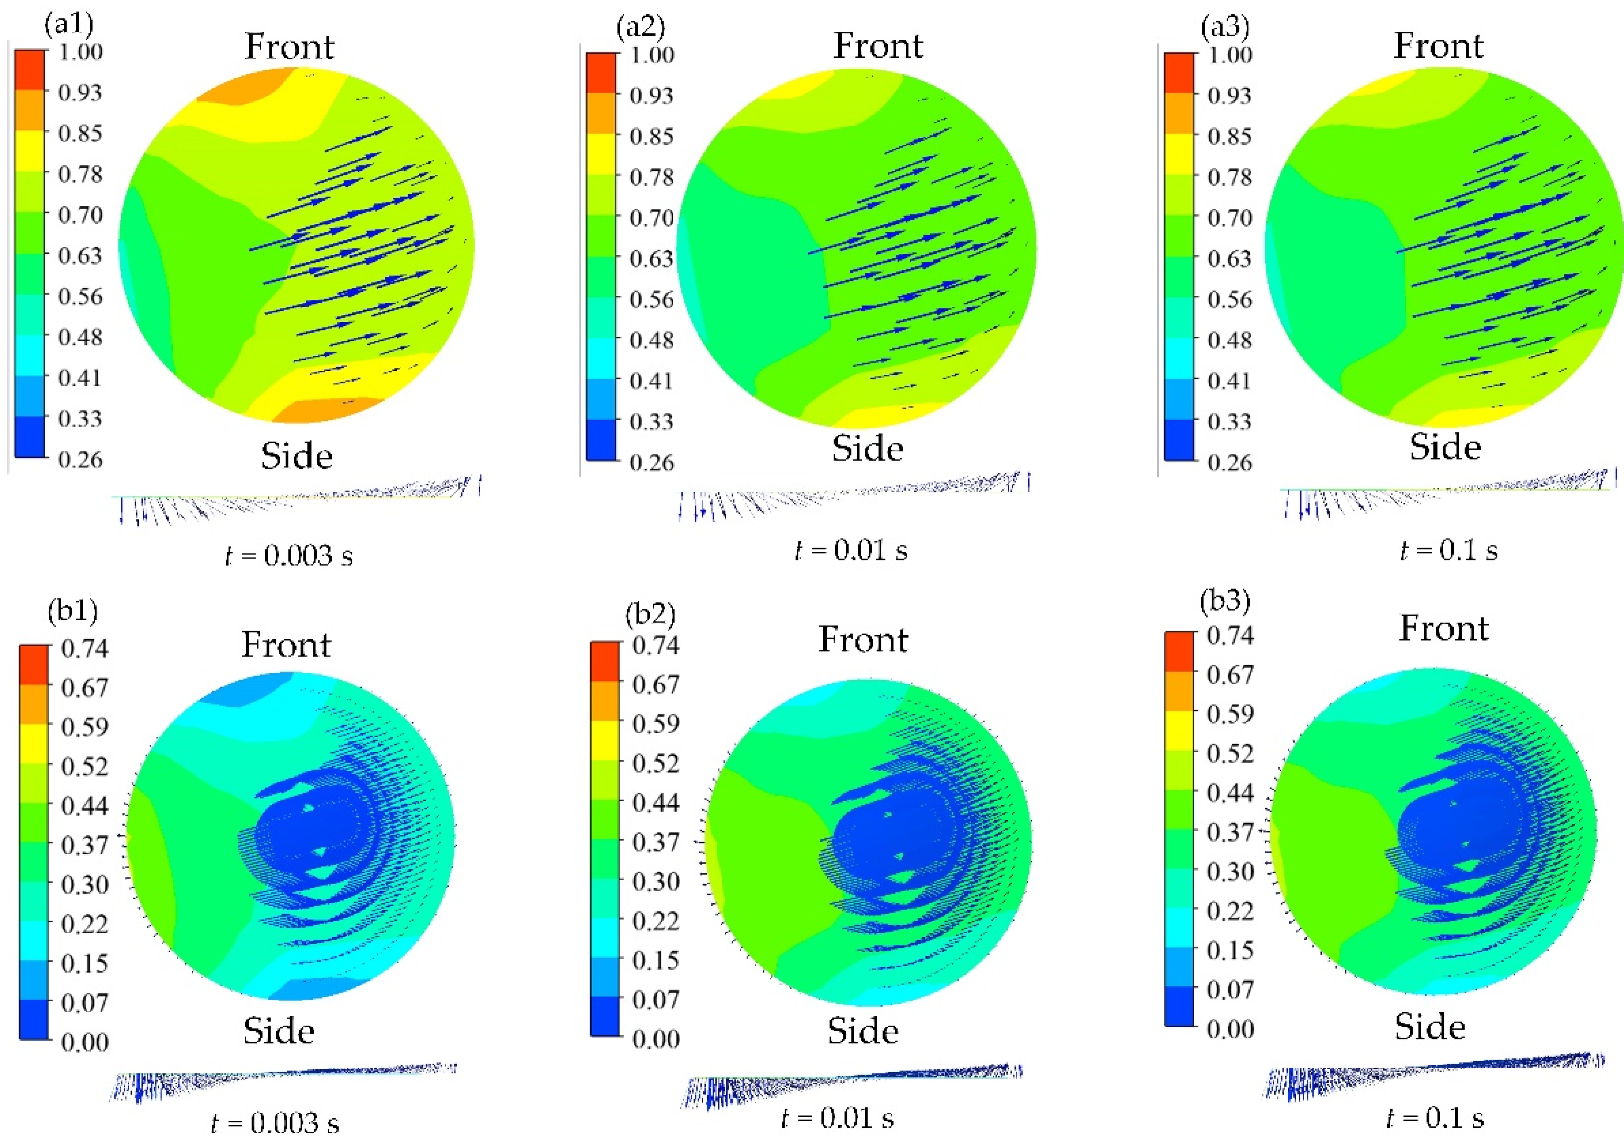
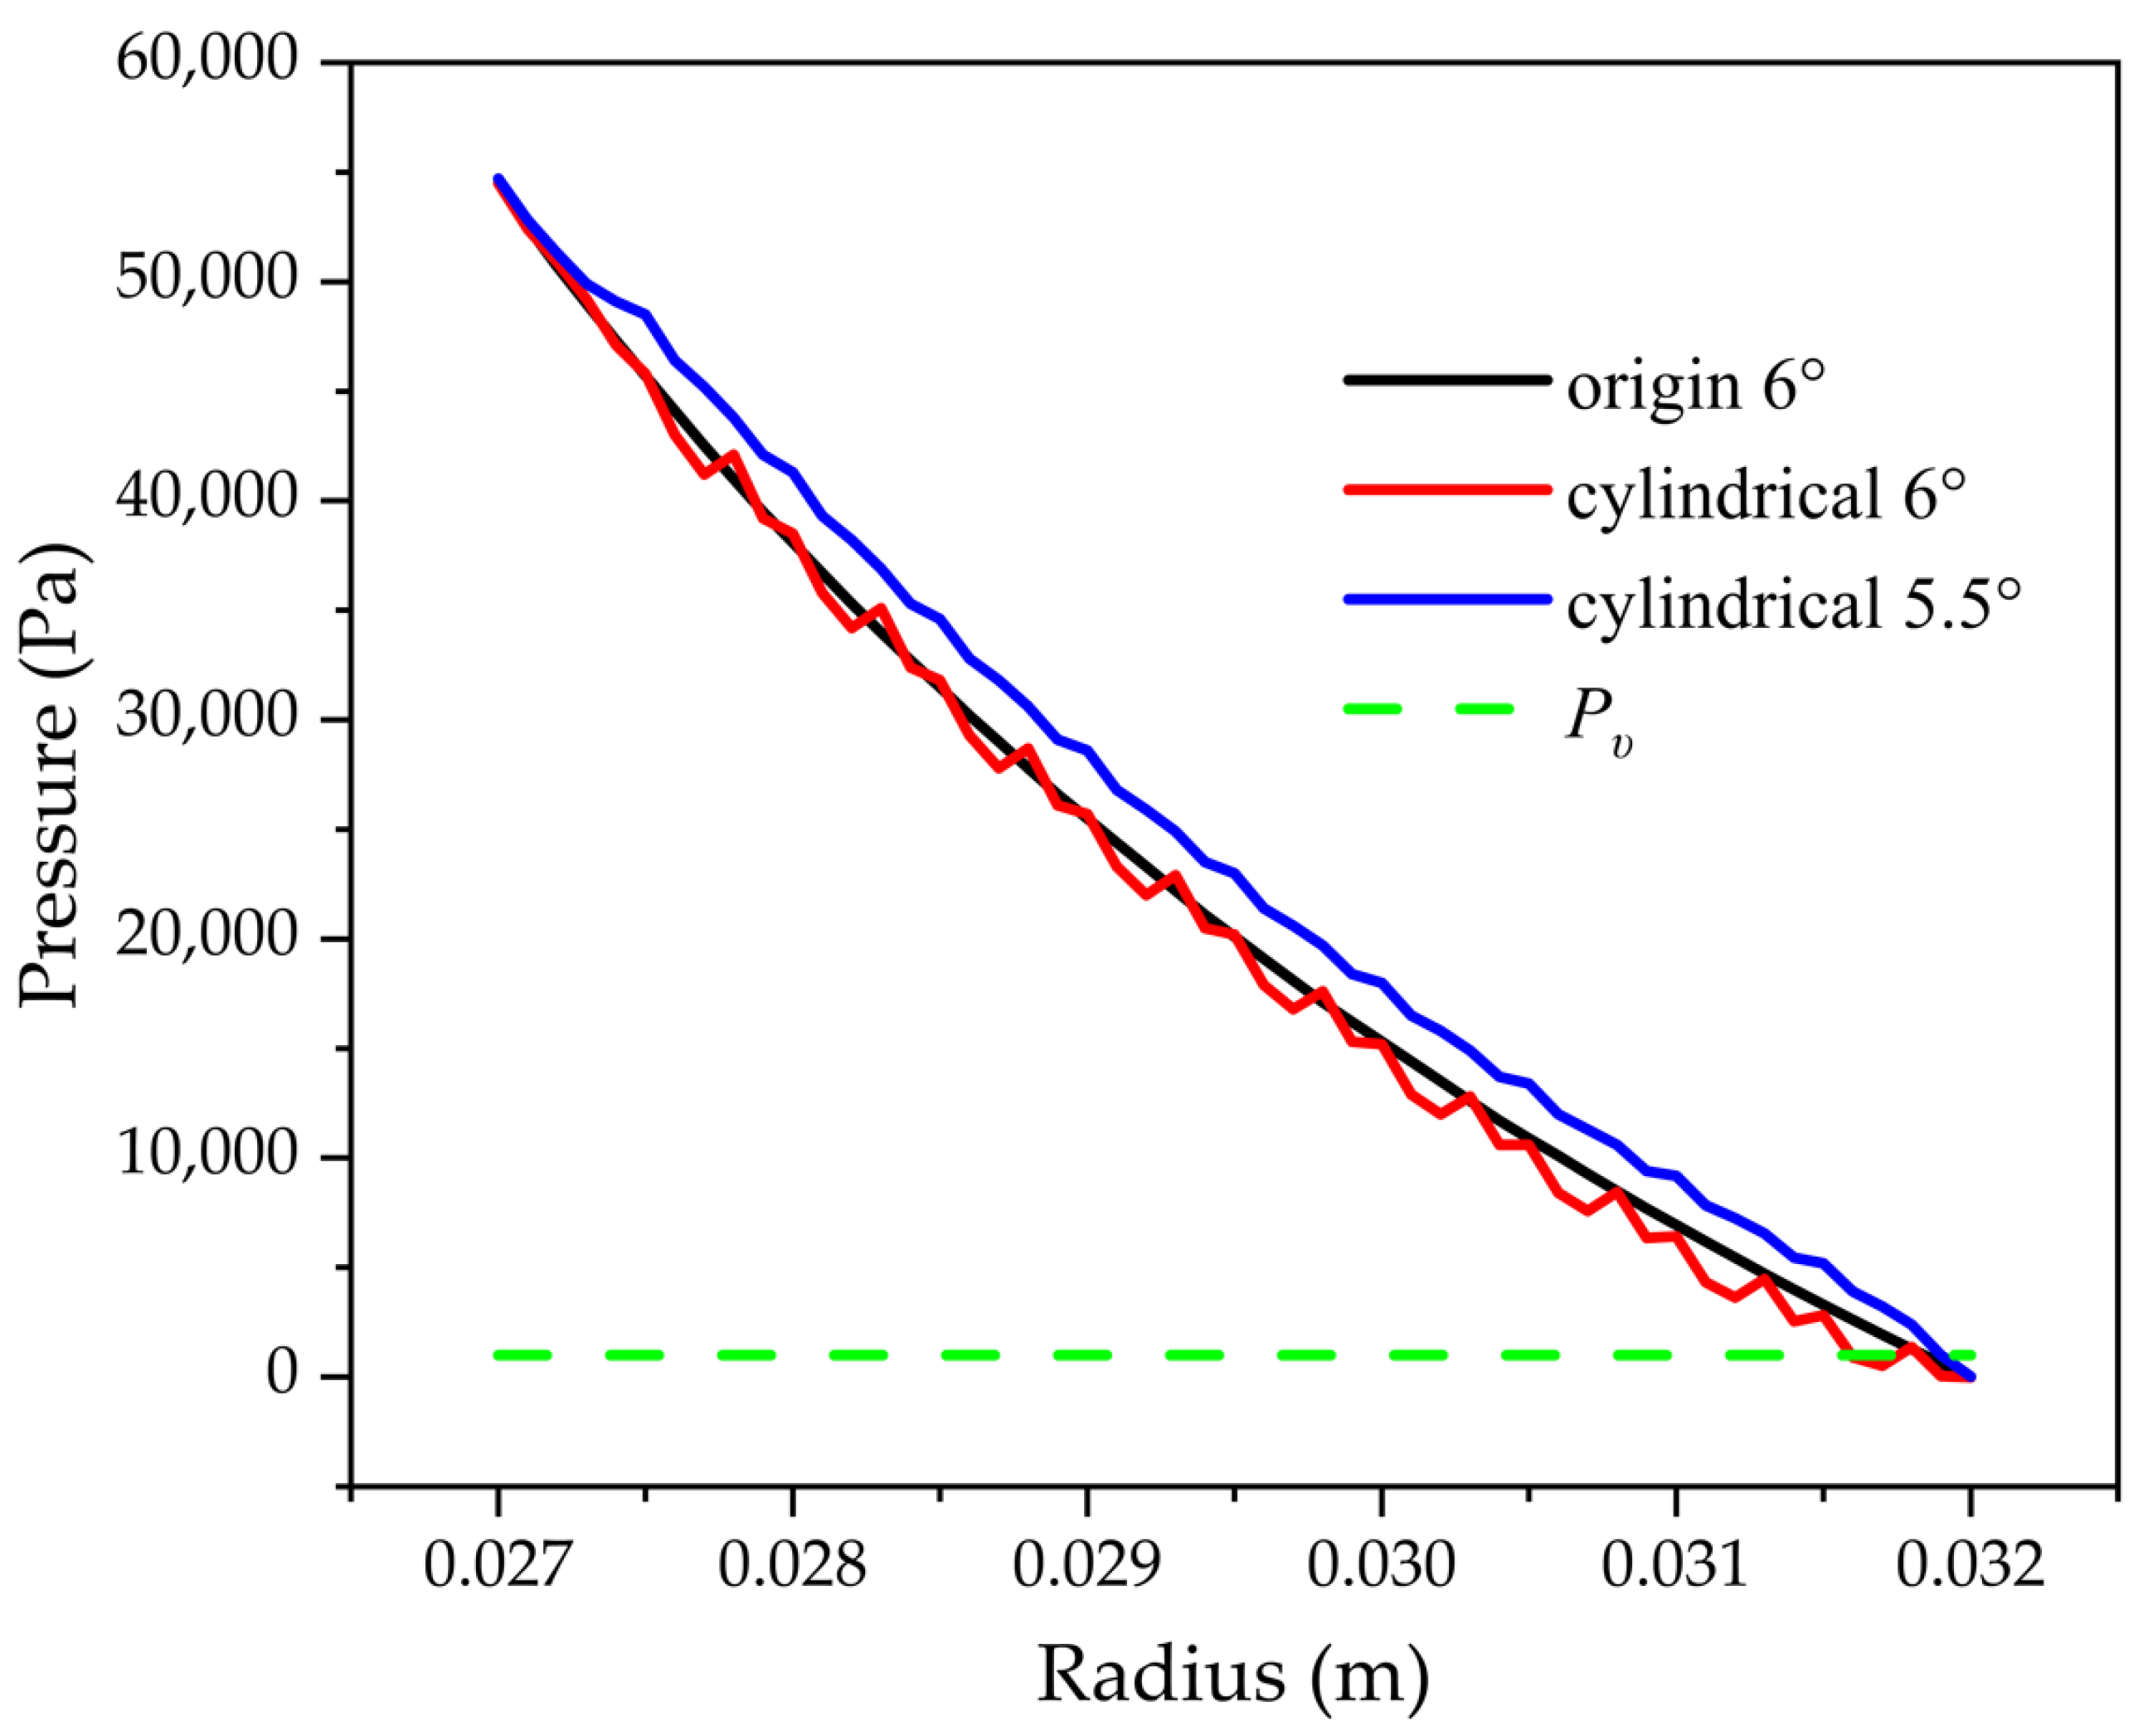
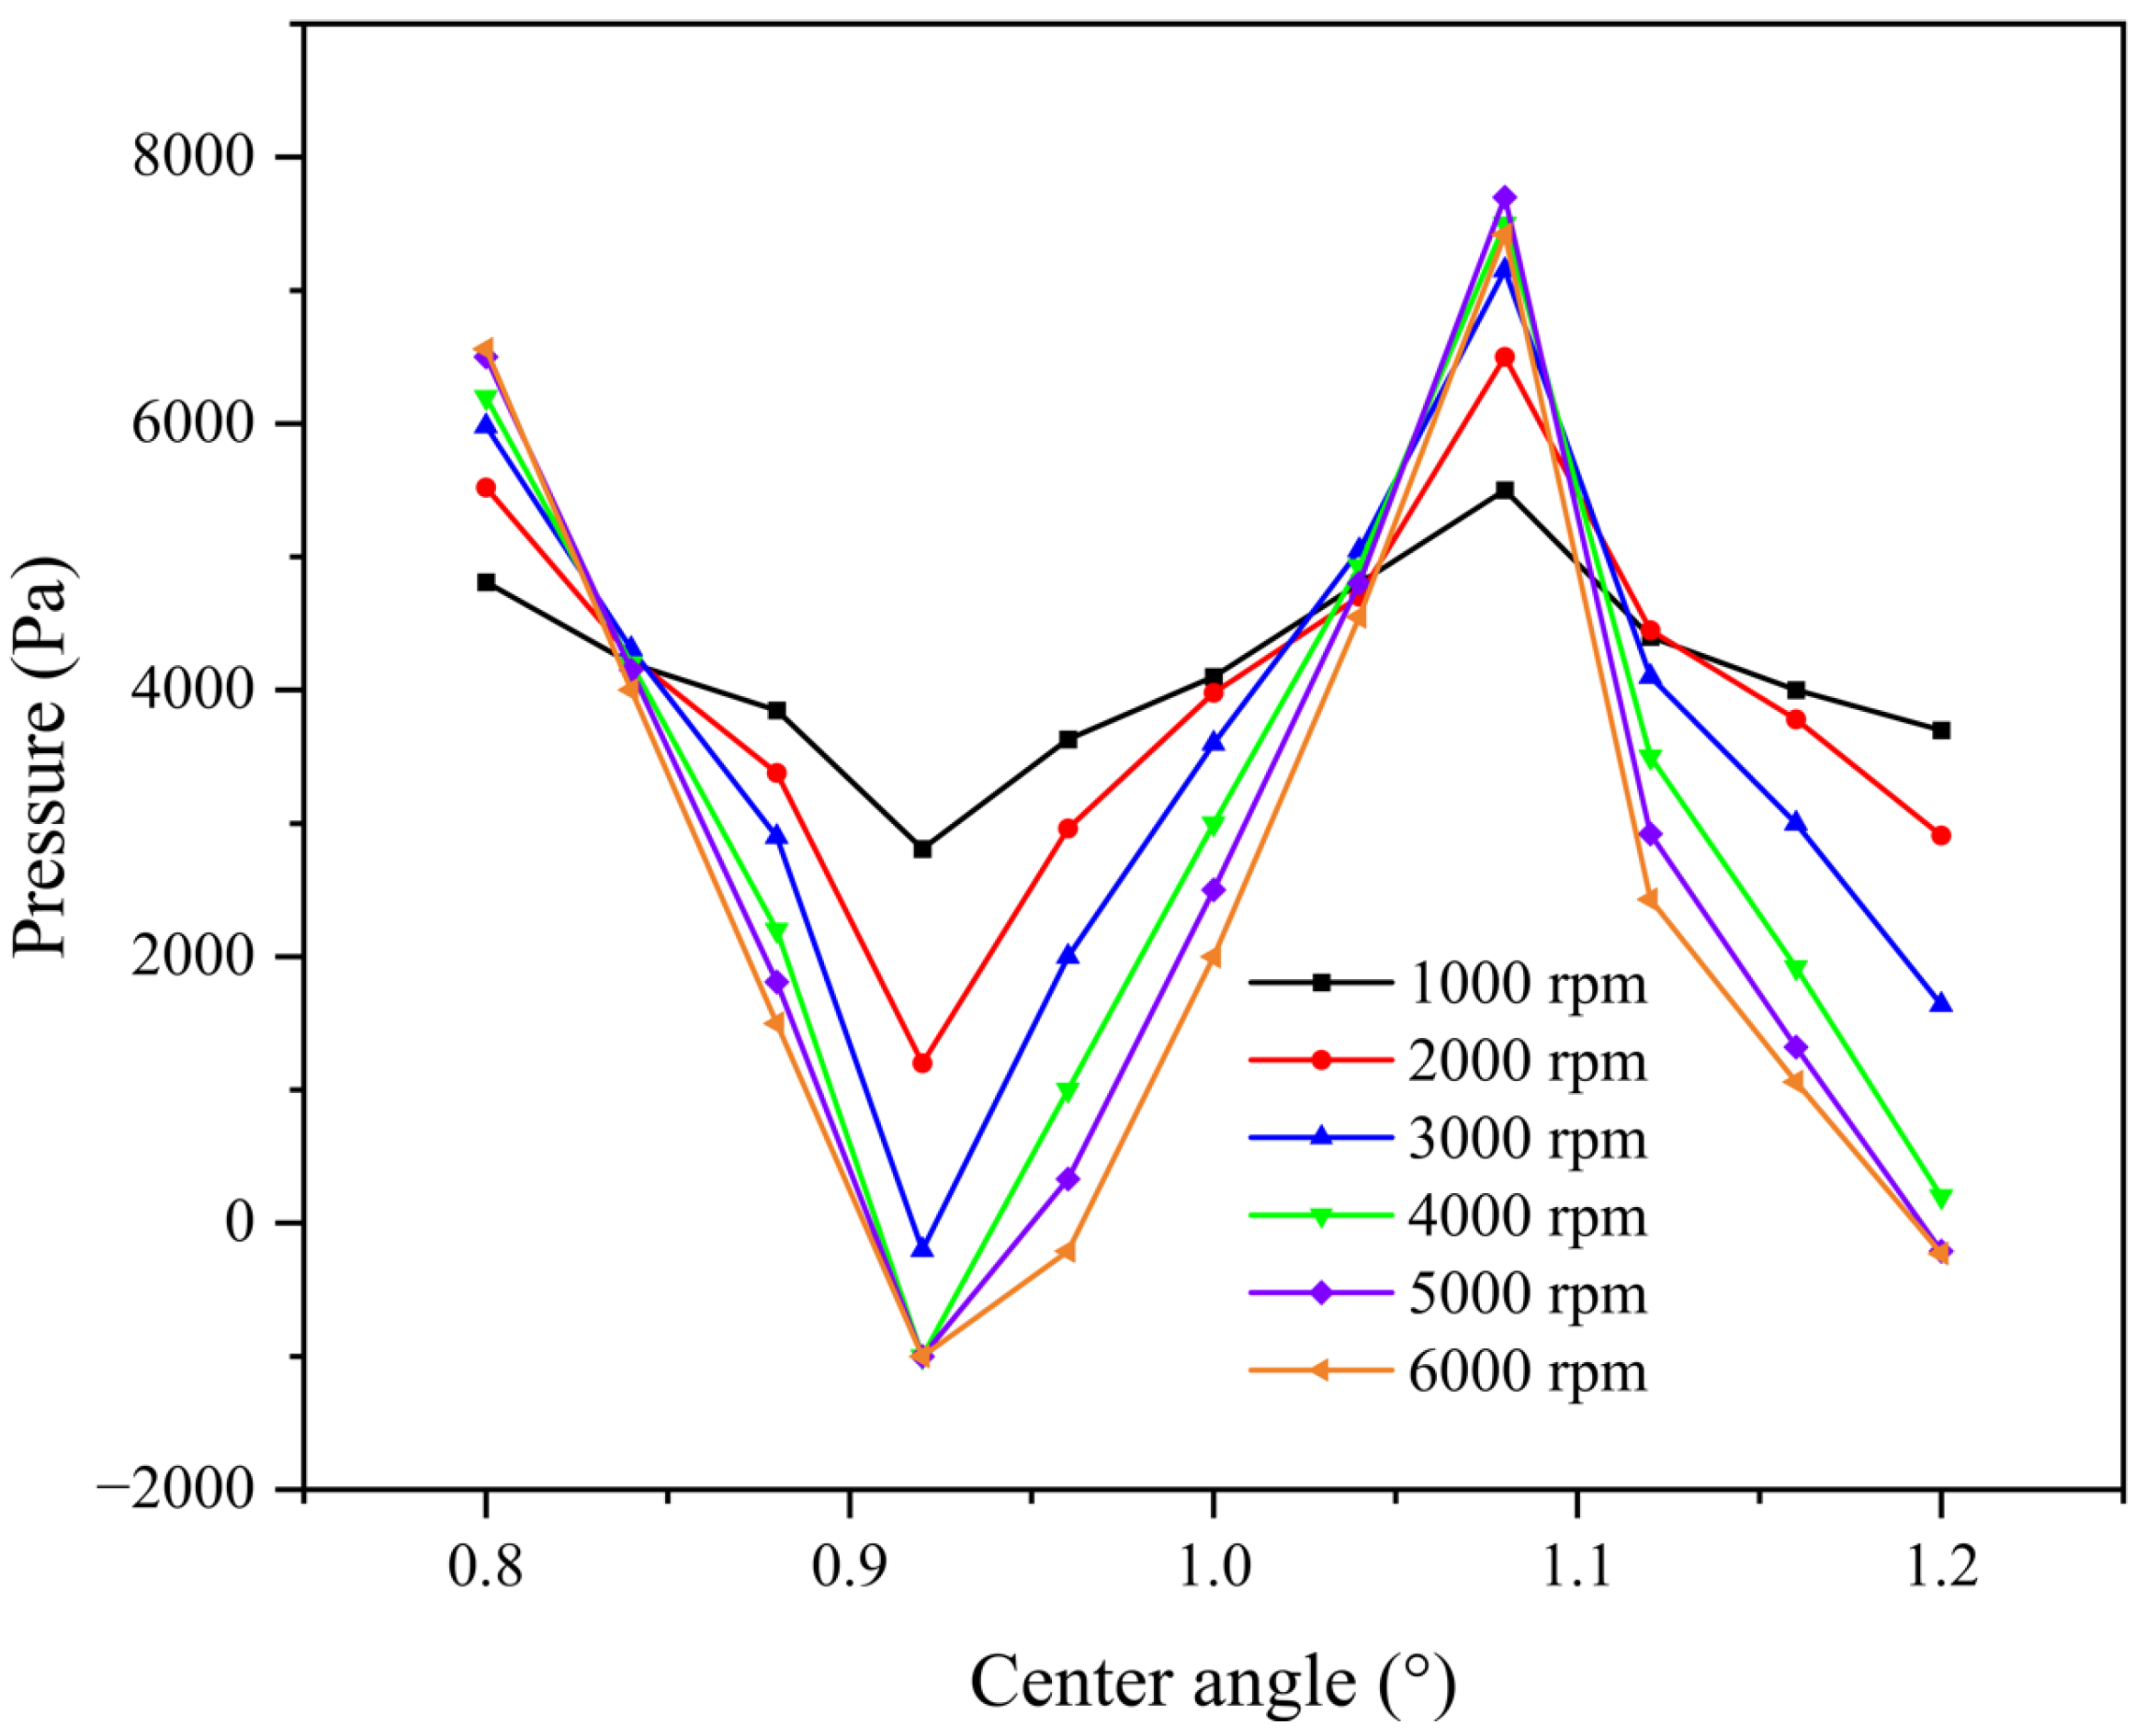
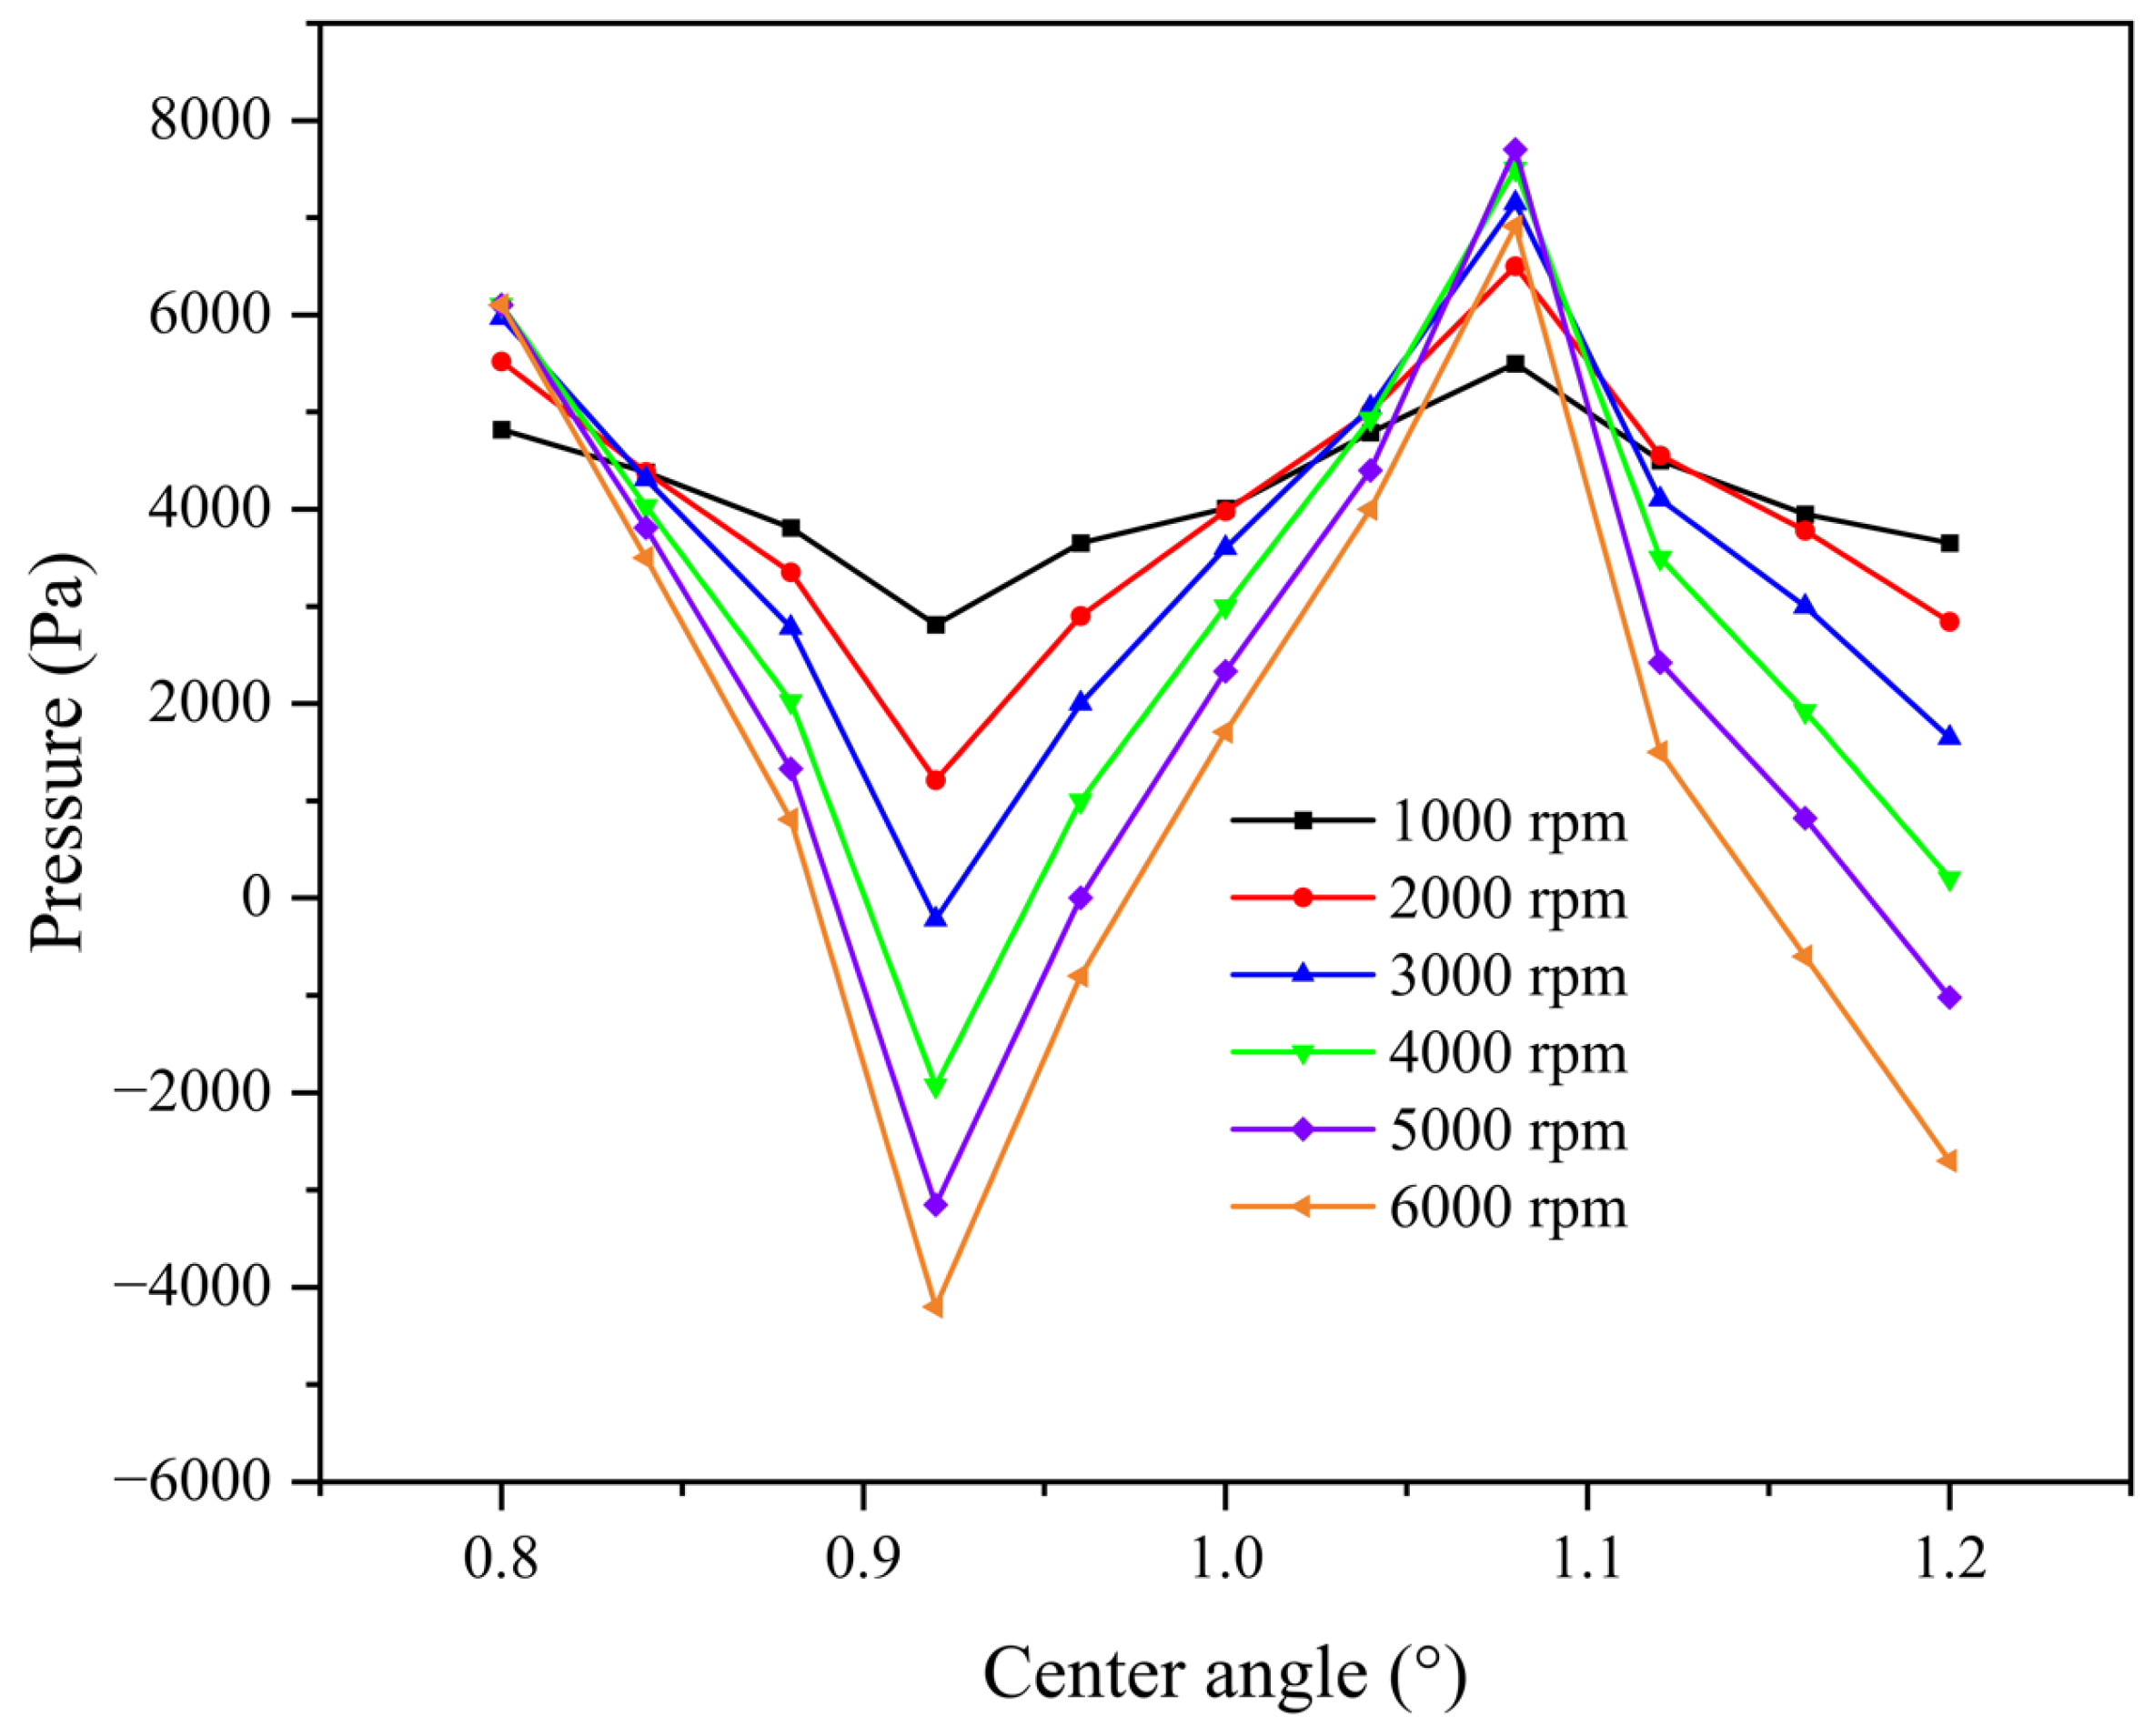
4.3. Cavitation Pressure Field Analysis
4.4. Mass-Transfer Analysis
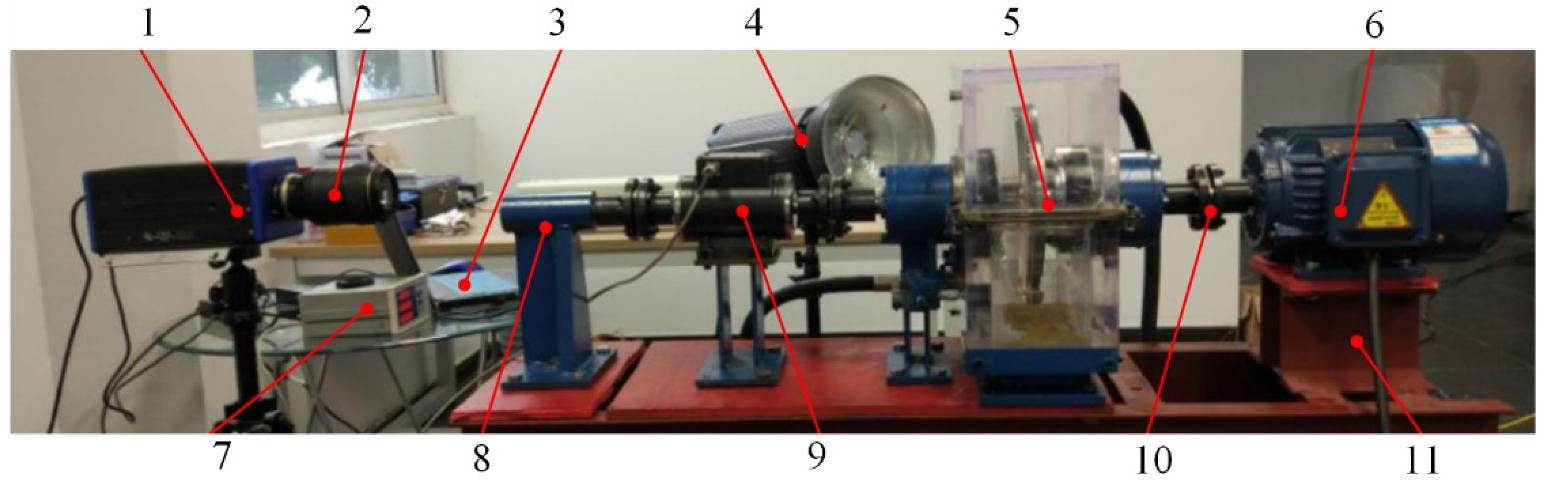
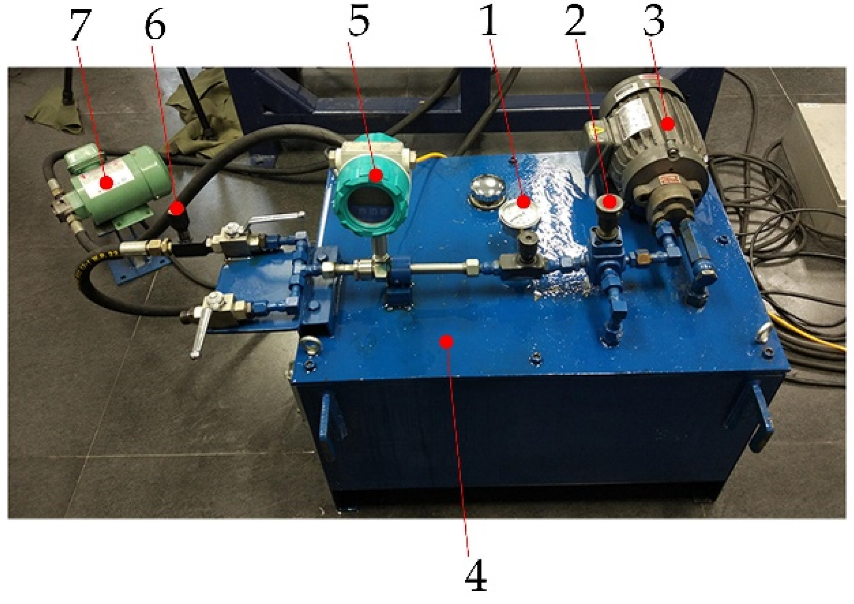
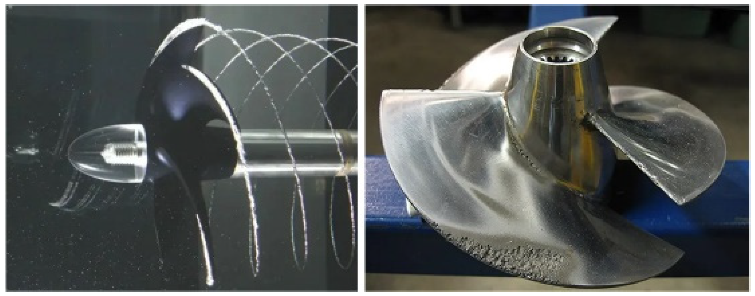
5. Experiment Analysis
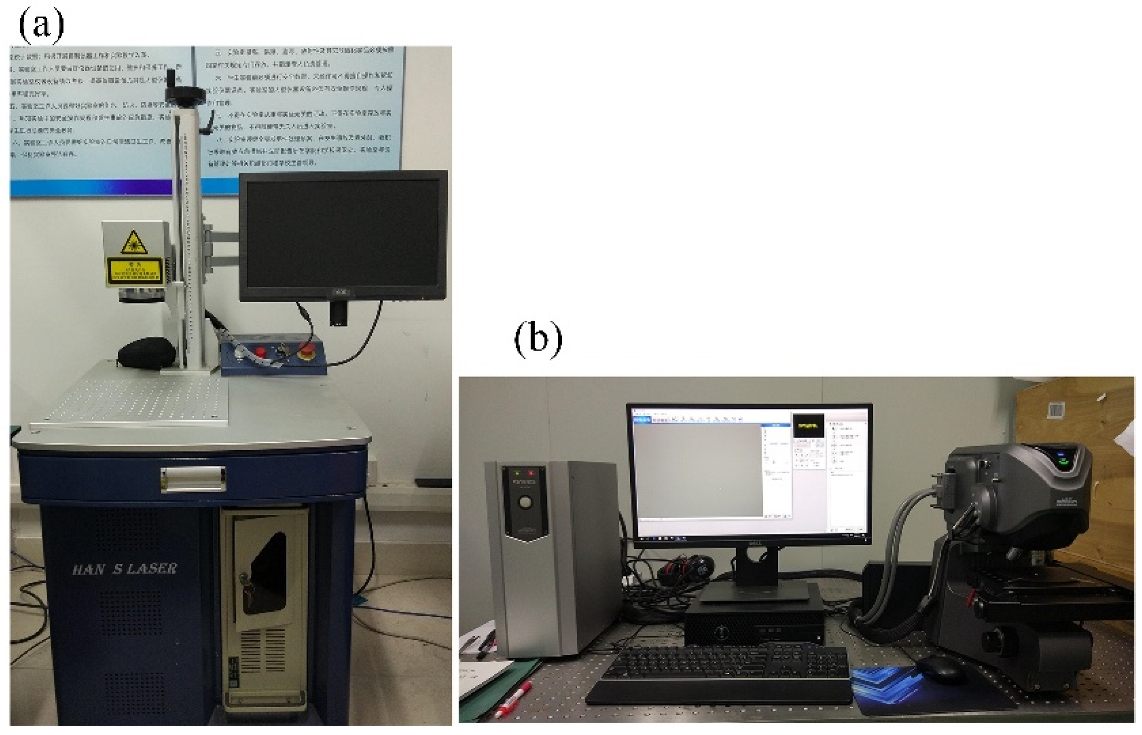
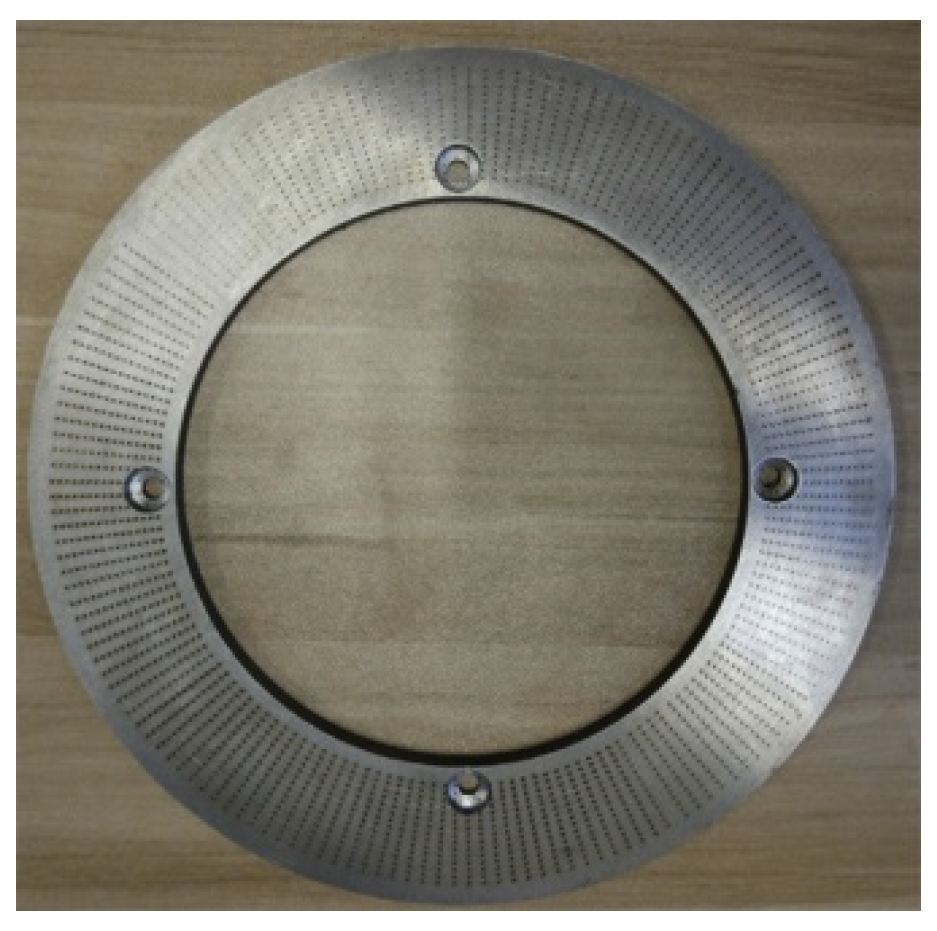
5.1. Experiment Design
5.2. Experiment Results
6. Conclusions
7. Patents
Author Contributions
Funding
Data Availability Statement
Conflicts of Interest
References
- Brennan, C.E. Cavitation and Bubble Dynamics; Oxford University Press: New York, NY, USA, 1995; pp. 122–125. [Google Scholar]
- Suryanarayana, C.; Satyanarayana, B.; Ramji, K. Cavitation studies on axi-symmetric underwater body with pump jet propulsor in cavitation tunnel. Int. J. Nav. Arch. Ocean 2010, 2, 85–194. [Google Scholar]
- Knapp, R.T.; Daily, J.W.; Hammitt, F.G. Cavitation; McGraw-Hill Companies: New York, NY, USA, 1970; p. 50. [Google Scholar]
- Iosif, A.; Sarbu, I. Numerical modeling of cavitation characteristics and sensitivity curves for reversible hydraulic machinery. Eng. Anal. Bound. Elem. 2014, 41, 18–27. [Google Scholar] [CrossRef]
- Tatsuya, Y.; Keita, A. Low-intensity ultrasound induced cavitation and streaming in oxygen-supersaturated water: Role of cavitation bubbles as physical cleaning agents. Ultrason. Sonochem. 2019, 52, 268–279. [Google Scholar]
- Robin, J.; Maria, E.K.; Mark, B.; Morgan, S.; Maria, F.M.; Elisa, E.K. Cavitation-modulated inflammatory response following focused ultrasound blood-brain barrier opening. J. Control. Release 2021, 337, 458–471. [Google Scholar]
- Arijana, F.; Tadeja, L.; Katarina, B.; Maja, R.; Meta, J.; Tamara, K.; Martin, P.; Mojca, Z.; Matevž, D.; Ion, G.A. Hydrodynamic cavitation efficiently inactivates potato virus Y in water. Ultrason. Sonochem. 2022, 82, 105898. [Google Scholar]
- Chunmin, W.; Le, X.; Yonghua, T.; Hui, C.; Kaifu, X. Experimental investigation of thermal effect on cavitation characteristics in a liquid rocket engine turbopump inducer. Chin. J. Aeronaut. 2021, 34, 48–57. [Google Scholar]
- Yogen, U.; Jiongyang, W.; Guoyo, W.; Wei, S. Recent progress in modeling of cryogenic cavitation for liquid rocket propulsion. Prog. Aerosp. Sci. 2005, 41, 558–608. [Google Scholar]
- Liang, T.; Cai, G.; Wang, J.; Gu, X.; Zhuo, L.; Cao, L. A hydrogen peroxide electric pump for throttleable hybrid rocket motor. Acta Astronaut. 2022, 192, 409–417. [Google Scholar] [CrossRef]
- Zhenhua, W.; Yuefeng, W. Cavitation erosion and its effect on corrosion resistance of nuclear-grade Z3CN20–09M stainless steel. Mater. Design 2022, 221, 2–3. [Google Scholar]
- Lee, M.W.; Kim, Y.K.; Oh, Y.M.; Kim, Y.; Lee, S.H.; Hong, H.S. Study on the cavitation erosion behavior of hardfacing alloys for nuclear power industry. Wear 2003, 255, 157–161. [Google Scholar] [CrossRef]
- An, C.; Zhu, R.; Long, Y.; Wang, X.; Lu, Y.; Chen, Y. The cavitation performance analysis of the RCP under LBLOCA at inlet-sciencedirect. Ann. Nucl. Energy 2020, 148, 6–8. [Google Scholar] [CrossRef]
- Qian, P.; Pu, C.; Liu, L.; Li, X.; Zhang, B.; Gu, Z.; Meng, D. Development of a new high-precision friction test platform and experimental study of friction characteristics for pneumatic cylinders. Meas. Sci. Technol. 2022, 33, 2–3. [Google Scholar] [CrossRef]
- Hong, S.; Son, G. Numerical modelling of acoustic cavitation threshold in water with non-condensable bubble nuclei. Ultrason. Sonochem. 2022, 83, 1–12. [Google Scholar] [CrossRef]
- Lee, G.L.; Law, M.C. Numerical modelling of single-bubble acoustic cavitation in water at saturation temperature. Chem. Eng. J. 2022, 430, 1–13. [Google Scholar] [CrossRef]
- Ty, A.; Nn, A.; Dh, A.; Mi, B. Sonoluminescence from ultra-high temperature and pressure cavitation produced by a narrow water jet. Heliyon 2021, 7, 1–20. [Google Scholar]
- Masataka, I.; Naoki, O.; Shun, O.; Takayuki, O.; Shoichi, K.; Yoshimura, T. Characteristics of oxide film formed on cavitation-treated steel surface in water. J. Mater. Res. Technol. 2022, 19, 897–1905. [Google Scholar]
- Pipp, P.; Hoevar, M.; Dular, M. Challenges of numerical simulations of cavitation reactors for water treatment–an example of flow simulation inside a cavitating microchannel. Ultrason. Sonochem. 2021, 77, 1–23. [Google Scholar] [CrossRef] [PubMed]
- Pan, S.S. Physical Mechanism of Cavitation; National Defense Industry Press: Beijing, China, 2013; pp. 6–7. [Google Scholar]
- Kassanos, I.; Anagnostopoulos, I. Cavitation and Bubble Dynamics; Academic Press: Salt Lake City, UT, USA, 2021; pp. 173–209. [Google Scholar]
- Yong, W.; Pan, Z.Y. Cavitation and Bubble Dynamics; Jiangsu University Press: Zhenjiang, China, 2013; pp. 12–13. [Google Scholar]
- Brotchie, A.; Grieser, F.; Ashokkumar, M. Characterization of acoustic cavitation bubbles in different sound fields. J. Phys. Chem. B 2010, 114, 11010–11016. [Google Scholar] [CrossRef]
- Rae, J.; Ashokkumar, M.; Eulaerts, O.; Sonntag, C.V.; Grieser, F. Estimation of ultrasound induced cavitation bubble temperatures in aqueous solutions. Ultrason. Sonochem. 2005, 12, 325–329. [Google Scholar] [CrossRef]
- Sun, X.; Jia, X.; Liu, J.; Wang, G.; Zhao, S.; Ji, L.; Yoon, J.Y.; Chen, S. Investigation on the characteristics of an advanced rotational hydrodynamic cavitation reactor for water treatment—Sciencedirect. Sep. Purif. Technol. 2020, 251, 1–15. [Google Scholar] [CrossRef]
- Lee, H.; Gojani, A.B.; Han, T.H.; Yoh, J.J. Dynamics of laser-induced bubble collapse visualized by time-resolved optical shadowgraph. J. Visual. 2011, 14, 331–337. [Google Scholar] [CrossRef]
- Choi, J.W.; Choi, Y.D.; Kim, C.G.; Lee, Y.H. Flow uniformity in a multi-intake pump sump model. J. Mech. Sci. Technol. 2010, 24, 1389–1400. [Google Scholar] [CrossRef]
- Schouveiler, L.; Le Gal, P.; Chauve, M.P. Stability of a traveling roll system in a rotating disk flow. Phys. Fluids 1998, 10, 2695–2697. [Google Scholar] [CrossRef]
- Soong, C.Y.; Wu, C.C.; Liu, T.P.; Liu, T.P. Flow structure between two co-axial disks rotating independently. Exp. Therm. Fluid Sci. 2003, 27, 295–311. [Google Scholar] [CrossRef]
- Pahlovy, S.A.; Mahmud, S.F.; Masamitsu, K.; Makoto, O.; Norio, T. New development of a gas cavitation model for evaluation of drag torque characteristics in disengaged wet clutches. SAE Int. J. Engines 2016, 9, 1910–1915. [Google Scholar] [CrossRef]
- Shahjada, P.; Faria, M.S.; Masamitsu, K.; Makoto, O.; Norio, T. Multiphase drag modeling for prediction of the drag torque characteristics in disengaged wet clutches. SAE Int. J. Commer. Veh. 2014, 7, 441–447. [Google Scholar]
- Gostia, J.; Irok, B.; Repinc, S.K.; Levstek, M.; Zupanc, M. Performance evaluation of a novel pilot-scale pinned disc rotating generator of hydrodynamic cavitation. Ultrason. Sonochem. 2021, 72, 1–23. [Google Scholar]
- Klingl, S.; Lecheler, S.; Pfitzner, M. Absolute and convective stability of flow between closely spaced co-rotating disks with imposed throughflow. Eur. J. Mech. B Fluid 2022, 91, 226–232. [Google Scholar] [CrossRef]
- Niketh, S.; Samuel, G.L. Surface texturing for tribology enhancement and its application on drill tool for the sustainable machining of titanium alloy. J. Clean. Prod. 2017, 167, 253–270. [Google Scholar] [CrossRef]
- Bei, G.; Ma, C.; Wang, X.; Sun, J.; Ni, X. Study on Tribological Characteristics of Textured Surface under Convergent Oil Film Gap. Lubricants 2022, 10, 183. [Google Scholar] [CrossRef]
- Ran, H.; Dai, P.; Yan, S.; Wang, F.; Yao, X.; Wang, J.; Zuo, G. Flow Mechanisms and Lubrication Performance of Water-Lubricated Thrust Bearings with Herringbone Grooves. Lubricants 2022, 10, 182. [Google Scholar] [CrossRef]
- Giorgi, M.D.; Bello, D.; Ficarella, A. An artifificial neural network approach to investigate cavitating flow regime at different temperatures. Measurement 2014, 47, 971–981. [Google Scholar] [CrossRef]
- Sun, J.; Chen, L.; Zhang, B.; Huang, H.; Qian, P. Cavitation Morphology Study between Hemispherical Textured Rotating Friction Pairs. Lubricants 2022, 10, 249. [Google Scholar] [CrossRef]
- Li, P.F.; Xu, M.Y.; Wang, F.F. Proficient in CFD Engineering Simulation and Case Practice; People’s Posts and Telecommunications Press: Beijing China, 2011; pp. 67–69. [Google Scholar]
- Hu, K.; Li, Z.B. ANSYS ICEM CFD Engineering Examples; People’s Posts and Telecommunications Press: Beijing, China, 2014; pp. 112–113. [Google Scholar]
- Klebanoff, P.S. Characteristics of turbulence in a boundary layer with zero pressure gradient. NACA Tech. 1954, 3178, 23–24. [Google Scholar]
- Taylor, G.I. The transport of vorticity and heat through fluids in turbulent motion. Proc. R. Soc. Lond. 1932, 135, 685–702. [Google Scholar]
- Itoh, M.; Yamada, Y.; Nagata, H. Characteristics of instabilities and transition processes of the flow between a rotating disk and the casing. Trans. Jpn. Soc. Mech. Eng. B 1988, 54, 1236–1243. [Google Scholar] [CrossRef] [Green Version]
- Itoh, M.; Yamada, Y.; Imao, S. Experiments on turbulent flow due to an enclosed rotating disk. Exp. Therm. Fluid Sci. 1992, 5, 359–368. [Google Scholar] [CrossRef]
- Watanabe, T.; Oyama, T. Magnetohydrodynamic boundary layer flow over a rotating disk. ZAMM-Z. Angew. Math. Mech. 1991, 71, 522–524. [Google Scholar] [CrossRef]
- Stewartson, K. On the flow between two rotating coaxial disks. Math. Proc. Camb. 1953, 49, 333–341. [Google Scholar] [CrossRef]
- Menter, F.R. Zonal two-equation k-ω turbulence models for aerodynamic flows. AIAA Pap. 1993. [Google Scholar] [CrossRef]
- Menter, F.R.; Kuntz, M.; Langtry, R. Ten years of industrial experience with the SST turbulence model. Heat Mass Transf. 2003, 4, 1–8. [Google Scholar]
- Jen, T.C.; Daniel, J.N. Thermal analysis of a wet-disk clutch subjected to a constant energy engagement. Int. J. Heat Mass Transf. 2008, 51, 1757–1769. [Google Scholar] [CrossRef]
- Zwart, P.J.; Gerber, A.G.; Belamri, T. A Two-Phase Flow Model for Predicting Cavitation Dynamics. In Proceedings of the International Conference on Multiphase Flow, Jokohama, Japan, 30 May–3 June 2004. [Google Scholar]
- Meng, Q.R.; Hou, Y.F.; Wang, Y. Finite element analysis of oil film pressure field of liquid viscous drive based on Matlab. Min. Mach. 2007, 9, 121–124. [Google Scholar]


| Parameters | Value |
|---|---|
| Inner radius r1 (mm) | 27 |
| Outer radius r2 (mm) | 32 |
| Oil film thickness h0 (mm) | 0.1 |
| Texture depth ht (mm) | 0.0564 |
| Scheme | Radial Layers | Circumferential Layers | O-Grid Layers | Number of Meshes | Volume Fraction of Cavitation λv | |
|---|---|---|---|---|---|---|
| Textured Area | Non-Textured Area | |||||
| 1 | 102 | 33 | 84 | 3 | 145,322 | 0.0004345 |
| 2 | 132 | 66 | 84 | 6 | 335,483 | 0.0003432 |
| 3 | 142 | 77 | 124 | 7 | 391,840 | 0.000467 |
| 4 | 142 | 77 | 124 | 7 | 438,463 | 0.0005012 |
| 5 | 210 | 121 | 160 | 11 | 988,637 | 0.0006212 |
| 6 | 210 | 121 | 124 | 11 | 1,607,374 | 0.0006417 |
| 7 | 210 | 165 | 160 | 15 | 2,017,702 | 0.0006419 |
| Parameter | Oil | Vapor |
|---|---|---|
| Density (kg/m3) | 865 | 0.023 |
| Specific heat capacity (J/kg·K−1) | 2093.5 | 1911.6 |
| Coefficient of heat conduction (m·K) | 0.12 | 0.0185 |
| Dynamic viscosity (Pa·s) | Interpolation function | 9.86 × 10⁻⁶ |
| Saturated vapor pressure (Pa) | 1000 | 1000 [40] |
| Parameters | Value | Parameters | Value |
|---|---|---|---|
| Output power | 70% | Laser wavelength | 1064 ± 5 nm |
| Laser processing speed | 500 mm/s | Processing speed | 1000 mm/s |
| Spot diameter | 0.05 mm | Repetition accuracy | ±0.003 nm |
Publisher’s Note: MDPI stays neutral with regard to jurisdictional claims in published maps and institutional affiliations. |
© 2022 by the authors. Licensee MDPI, Basel, Switzerland. This article is an open access article distributed under the terms and conditions of the Creative Commons Attribution (CC BY) license (https://creativecommons.org/licenses/by/4.0/).
Share and Cite
Sun, J.; Chen, L.; Qian, P.; Zhang, B. Oil Cavitation Morphology Analysis of Textured Cylindrical Rotating Friction Pair on Circular-Disk End Faces. Machines 2022, 10, 1036. https://doi.org/10.3390/machines10111036
Sun J, Chen L, Qian P, Zhang B. Oil Cavitation Morphology Analysis of Textured Cylindrical Rotating Friction Pair on Circular-Disk End Faces. Machines. 2022; 10(11):1036. https://doi.org/10.3390/machines10111036
Chicago/Turabian StyleSun, Junyu, Liyu Chen, Pengfei Qian, and Bing Zhang. 2022. "Oil Cavitation Morphology Analysis of Textured Cylindrical Rotating Friction Pair on Circular-Disk End Faces" Machines 10, no. 11: 1036. https://doi.org/10.3390/machines10111036
APA StyleSun, J., Chen, L., Qian, P., & Zhang, B. (2022). Oil Cavitation Morphology Analysis of Textured Cylindrical Rotating Friction Pair on Circular-Disk End Faces. Machines, 10(11), 1036. https://doi.org/10.3390/machines10111036