Article

Research on Energy Consumption Generation Method of Fuel Cell Vehicles: Based on Naturalistic Driving Data Mining

1
College of Automotive Engineering, Jilin University, Changchun 130012, China
2
State Key Laboratory of Automotive Simulation and Control, Jilin University, Changchun 130012, China
3
FAW-Volkswagen Automotive Co., Ltd., Changchun 130011, China
*
Author to whom correspondence should be addressed.
Machines 2022, 10(11), 1047; https://doi.org/10.3390/machines10111047
Submission received: 14 October 2022 / Revised: 5 November 2022 / Accepted: 7 November 2022 / Published: 9 November 2022
(This article belongs to the Special Issue Emerging Technologies in New Energy Vehicle)

Abstract

:
In this paper, an energy consumption generation method is proposed to accurately calculate the energy consumption of fuel cell vehicles (FCVs). A specific driver drives on a route (from Jilin University to FAW Volkswagen) for 331 working days (1 April 2020 to 28 July 2021) and collects more than 40,000 s of naturalistic driving data by means of a GPS receiver (FRII-D). To accurately calculate the energy consumption data of FCVs under actual driving cycles, naturalistic driving data mining is first studied. The principal component analysis (PCA) algorithm is used to reduce the dimension of the extracted driving cycle characteristic parameters, the K-means algorithm is used for driving cycle clustering, and the LVQ is used for driving cycle identification. Then, the characteristic parameters correlated to energy consumption are obtained based on the FCV model and regression analysis method. In addition, an energy consumption generation method is designed and proposed based on the characteristic parameters and identification results. Furthermore, the proposed energy consumption generation method can accurately calculate the energy consumption of FCVs, which also provides a reference for further research on the efficient energy management of FCVs.

1. Introduction

Energy shortage and environmental pollution are urgent problems that all countries in the world need to face. Energy saving and emission reduction are hot research topics in the field of automobiles. In recent years, the technological progress of hydrogen energy and fuel cells has greatly promoted the performance improvement of fuel cell vehicles (FCVs) [1,2]. Compared with traditional internal combustion engine vehicles (ICEVs), FCVs have the advantages of zero carbon emission, high efficiency, and low noise in driving processes, which is beneficial for reducing emissions [3]. However, as the energy consumption of FCVs is measured in the ideal environment, the test environment is quite different from actual driving conditions [4], and the theoretical driving mileage of FCVs does not meet actual driving demands [5]. Therefore, an accurate estimation of the energy consumption of FCVs based on real driving data can be used as t fundamental research of energy management strategies for FCVs in the future.

1.1. Literature Review

Previous studies have shown that vehicle energy consumption is sensitive to driving cycles [6,7]. In view of this hot topic, we have studied the characteristic relationship between energy consumption and the driving cycles of plug-in hybrid electric vehicles (PHEVs) [8,9]. Chlopek et al., based on the energy consumption test data of battery electric vehicles (BEVs) and conventional ICEVs, analyzed the average speed and the average absolute value of the product of speed and acceleration, which were the best characteristics to describe vehicle energy consumption [10]. Xie et al. obtained the energy consumption of BEVs under different typical driving cycles and indicated that the average vehicle speed, running time, and the frequency distribution of the driving process were the main factors that affect the energy consumption of vehicles [11]. Mamarikas et al. analyzed the energy consumption of BEVs and ICEVs during more than 100 cycles, noting that the BEVs’ consumption is the smallest under low-speed urban cycles, while at high-speed urban cycles, ICEVs have the best energy consumption [12]. More generally, most studies focused on the energy consumption of traditional ICEVs [13,14], BEVs [15,16], and PHEVs [17,18]. There are almost no studies on the energy consumption and driving cycles of FCVs, and almost no studies are based on real driving data.
In terms of naturalistic driving data, this paper defines it as the actual driving data collected by a specific driver driving on a specific route for a long time. Although the driving style is also important in determining energy consumption, the driving style of this specific driver is fixed. In light of this, the influence of driving style on vehicle energy consumption is ignored and not considered in this paper. The rapid development of information and communication technologies (ICTs) provides lots of data and facilitates the collection and mining of data for naturalistic driving [19,20]. In [21], a two-level clustering method to identify the driving modes of electric vehicles (EVs) was proposed. The driving pattern characteristics were extracted from the collected datasets of EVs, and five types of daily driving patterns and four types of multifaceted driving patterns were obtained. The driving pattern data were collected using a hybrid method of an on-board measurement method and chase car method in [22], and the principal component analysis (PCA), hybrid k-means, and support vector machine (SVM) algorithms were adopted in the data processing process to classify the driving segments. Characteristic parameters that characterize vehicle driving cycles, such as average speed, the standard deviation of vehicle speed, and average acceleration, can be obtained by mining the naturalistic driving data [23,24]. However, the extracted characteristic parameters are usually high dimensional [25]. Due to the problems of low computational efficiency and difficult clustering in the subsequent processing and analysis of high-dimensional data, simplifying the multi-dimensional characteristic parameters of the driving cycle data is fundamental and significant work.
Furthermore, some studies have proposed the use of eco-driving to improve vehicle energy consumption [26,27]. Eco-driving is a multidimensional concept that includes the driving style, driving route, driving data, and all other factors related to the vehicles’ fuel consumption [28,29]. Existing studies have evaluated the range of vehicle energy saving under the eco-driving strategy, such as [30] (He et al., about 26%), [31] (Günther et al., about 25%), and [32] (Yang et al., about 13.8%). It is worth noting that the energy saving of different types of vehicles under the eco-driving strategy cannot be generalized. However, the level of energy saving achieved in simulated eco-driving is always higher than that achieved in real-world driving [33]. As mentioned above, this paper mainly focuses on the vehicle energy consumption of a specific driver on a specific driving route, and other factors (e.g., driving style, driving route) are not considered. Xu et al. adopted the speed data from the internet of vehicles to establish a truck energy consumption estimation model [34], and the past trajectory-fuel relationship was used to train the model. Yao et al. extracted the driving behavior data and fuel consumption data based on mobile phone terminals and on-board diagnostic systems installed in taxis and proposed a vehicle fuel consumption prediction method [35].

1.2. Motivations and Contributions

To the best of our knowledge after reviewing the existing literature, there is little study focused on fuel cell vehicle energy consumption, especially research based on real-world driving data and fuel cell vehicle energy consumption. While some eco-driving studies have focused on energy saving, little attention has been paid to the impact of individual drivers and vehicle types on energy saving. This paper mainly focuses on the energy consumption of a specific driver driving on a specific route, and the influence of driving style and driving route on vehicle energy consumption is ignored and not considered. Despite its limitations, this paper develops an energy consumption generation method for fuel cell vehicles based on the real-world driving data of a specific driver.
In order to obtain more accurate energy consumption results of FCVs, the real naturalistic driving data was mined to obtain the characteristic parameters correlated to FCV energy consumption, and the generation method of FCV energy consumption was proposed with the help of a regression analysis model. The main contributions of this paper include: (i) a relatively detailed and comprehensive naturalistic driving data mining work has been completed, including the dimension reduction of driving cycle characteristic parameters, driving cycle clustering, typical driving condition acquisition, and driving cycle identification; and (ii) the characteristic parameters correlated to FCV energy consumption are obtained, and a FCV energy consumption generation method based on the characteristic parameters and identification results is proposed.
This paper is organized as follows. The research method of naturalistic driving data mining and the acquisition of four typical driving cycles of a specific driver is presented in Section 2. In Section 3, an energy consumption generation method based on the vehicle model and energy consumption correlation analysis is proposed, and the results and corresponding analysis of the energy consumption generation method are also presented. Discussions are presented in Section 4. Concluding remarks are given in Section 5.

2. Research Methods

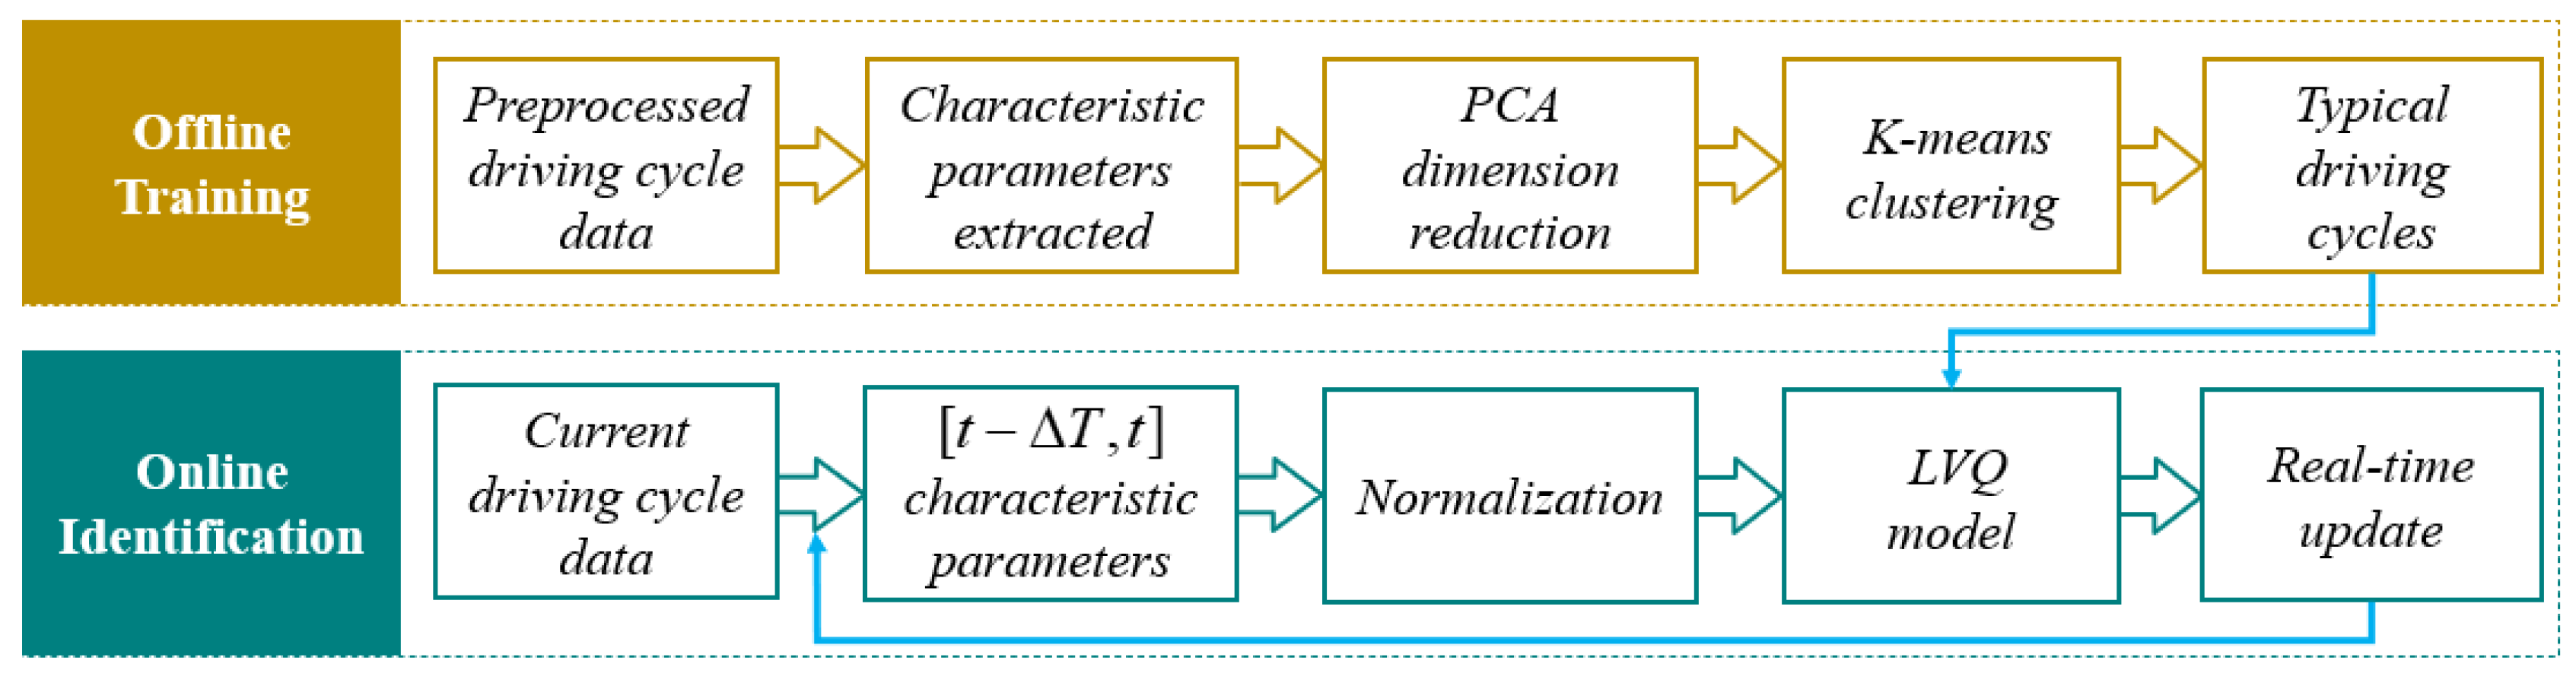
2.1. Methods Description

The main goal of naturalistic driving data mining is to obtain the typical driving cycle information representing driving characteristics. In order to achieve the above goal, it is necessary to collect a large amount of driver’s driving data, process and classify the data, and obtain typical driving cycle information from the classification results. As shown in Figure 1, typical driving cycle information obtained from naturalistic driving data mining is mainly divided into three steps, and the tools used in the three steps are also shown in Figure 1.
Based on the above analysis steps and tools, the following points need to be highlighted.
(1) No specific driving training was given to the driver prior to the collection, where the driver drove naturally.
(2) The driving data was collected by a specific driver driving on a specific route, and the influence of driving style and driving route on vehicle energy consumption was not considered.
(3) The driving data was mainly collected on working days to fully obtain the driving cycles of the specific driver.

2.2. Collecting and Preprocessing of the Naturalistic Driving Data

As mentioned above, naturalistic driving data was collected by a GPS receiver (product model: FRII-D). Concretely, the specific driver drove on the route shown in Figure 2 for 331 working days (1 April 2020 to 28 July 2021) and collected a large amount of naturalistic driving data (more than 40,000 s). However, the collected data often contained bad data, which needed to be preprocessed to obtain driving data consistent with the actual driving cycles of the driver.
The reasons for the occurrence of bad data in the collected naturalistic driving data are mainly as follows: (i) the loss of GPS signal leads to the occurrence of discontinuous bad data; (ii) the GPS receiver continues to collect data when the vehicle is parked for a long time, leading to the occurrence of bad data of long-term parking; (iii) the insufficient accuracy of the GPS receiver leads to abnormal acceleration and deceleration of bad data. For the above bad data, the method proposed in references [36,37,38] can be used to preprocess the bad data, which lays the foundation for the subsequent data mining.

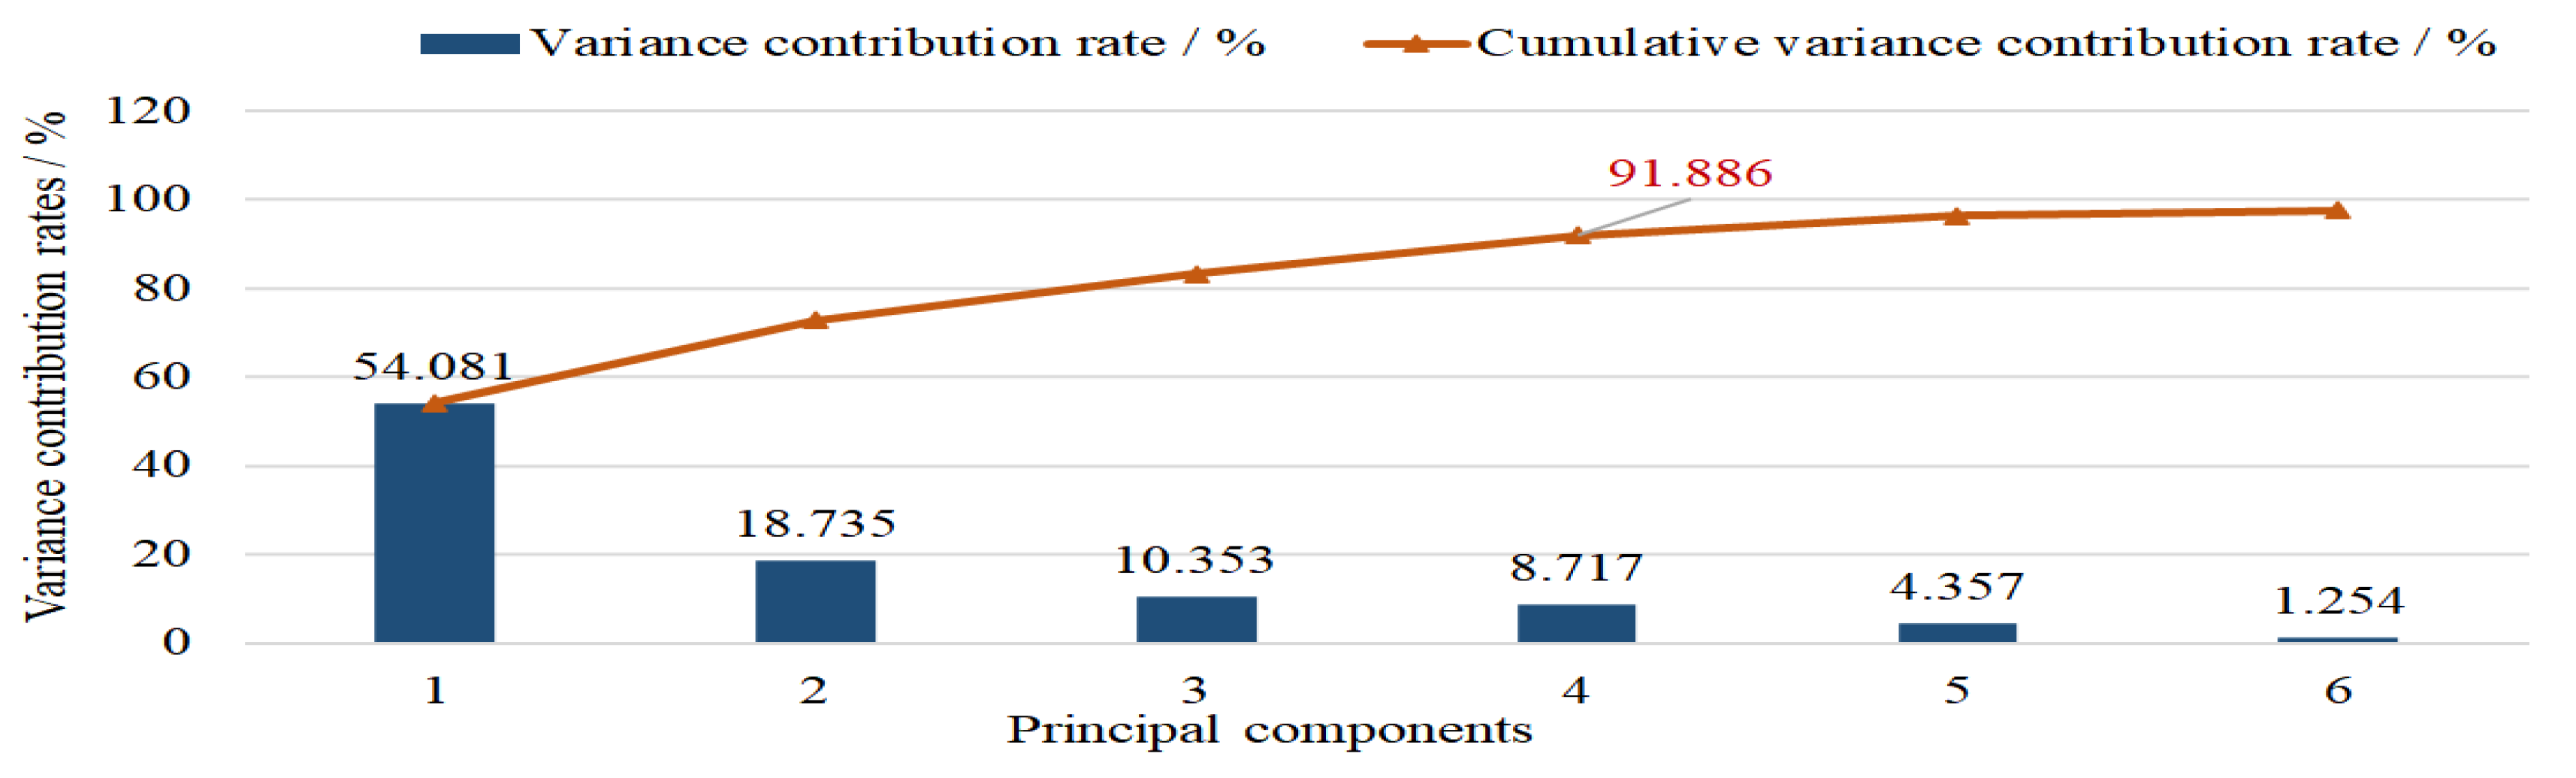
2.3. Analysis and Dimension Reduction of Characteristic Parameters

By dividing the preprocessed naturalistic driving data, a total of 1682 driving cycle segments were obtained. Different driving cycle segments can be characterized by characteristic parameters, such as speed, acceleration, parking time ratio, etc. The 14 characteristic parameters in Table 1 indicated different characterization capabilities for these driving cycles.
The calculation formulas of the characteristic parameters in Table 1 are as follows:
(1) Speed-type parameters
v a v e = i = 1 n v i / n
u a v e = i n u i / n
v max = max { v 1 , v 2 , , v n }
v s t d = 1 n 1 i = 1 n ( v i v a v e ) 2
where v i is the speed at the i th time in the driving cycle segment, n is the total time of the segment, and u i is the driving speed at the i th time in the non-parking state.
(2) Acceleration-type parameters
a a v e = i = 1 h a a i / h , a a i 0.1   m / s 2
a d a v e = i = 1 k a d i / k , a d i 0.1   m / s 2
a max = max { a a 1 , a a 2 , , a a h }
a d max = max { a d 1 , a d 2 , , a d j }
a s t d = 1 h 1 i = 1 h ( a a i a a v e ) 2
a d s t d = 1 k 1 i = 1 k ( a d i a d a v e ) 2
where a a i is the acceleration at the i th time, h is the total time of the acceleration state in the segment, a d i is the deceleration at the i th time, and k is the total time of deceleration state in the segment.
(3) Statistics-type parameters
r p t = T p T t o t a l × 100 %
r a t = T a T t o t a l × 100 %
r d t = T d T t o t a l × 100 %
r c t = 1 r p t r a t r d t
where T P is the total time of parking status in the segment, T a the total time of the acceleration state in the segment, T d is the total time of the deceleration state in the segment, and T t o t a l is the total time of the segment.
With the help of Formulas (1)–(14), the characteristic parameter values a i j of each driving cycle segment can be calculated, and the sample observation matrix A can be constructed.
A = ( a i j ) m × n = [ a 11 a 12 a 1 n a 21 a 22 a 2 n a m 1 a m 2 a m n ]
where i is the index number of the driving cycle segment, m is the total number of 1682 driving cycle segments ( i = 1 , 2 , 3 , , 1682 ), and j is the index number of the characteristic parameter, n is the total number of 14 characteristic parameters ( j = 1 , 2 , 3 , , 14 ).
Due to the large order of the matrix, the direct clustering analysis requires too much calculation, which will affect the classification effect of the clustering algorithm. The principal component analysis (PCA) algorithm is the mainstream technique to reduce the dimension of variables in multivariate statistical analysis. The PCA algorithm is used to analyze multi-dimensional data and determine parameters that can express data characteristics (namely principal components). PCA can comprehensively characterize data with fewer dimensions, which can greatly reduce computational complexity. In this paper, the PCA algorithm was used to reduce the dimension of driving cycle characteristic parameters. In order to eliminate the influence of each characteristic parameter unit on dimension reduction, A is normalized and transformed to obtain matrix X .
X = ( x i j ) m × n = [ x 11 x 12 x 1 n x 21 x 22 x 2 n x m 1 x m 2 x m n ]
{ x i j = a i j a j ¯ s j a j ¯ = 1 n i = 1 m a i j s j 2 = 1 n 1 i = 1 m ( a i j a j ¯ ) 2
The correlation coefficient matrix R = ( r i j ) n × n can be constructed, where r i j is the correlation coefficient between the i th characteristic parameter and the j th characteristic parameter. Then, the eigenvalues of the correlation coefficient matrix R can be obtained by | λ I R | = 0 , λ 1 λ 2 λ n 0 . The eigenvectors corresponding to the eigenvalues can also be obtained, u 1 , u 2 , , u n , and the principal components of each characteristic parameter Y = [ y 1 , y 2 , , y n ] T can be expressed as Formula (18).
{ y 1 = u 11 x 1 + u 12 x 2 + u 1 m x m y 2 = u 21 x 1 + u 22 x 2 + u 2 m x m y n = u n 1 x 1 + u n 2 x 2 + u n m x m
The variance contribution rate of principal component y j is b j , and the cumulative variance contribution rate of principal components y 1 , y 2 , , y p is b p .
{ b j = λ j k = 1 n λ k b p = k = 1 p λ k k = 1 n λ k
In this paper, the above steps of the PCA algorithm were carried out on the characteristic parameters matrix of those 1682 driving cycle segments, and the variance contribution rates of the first few principal components are shown in Figure 3. As the cumulative variance contribution rate of the first four principal components is 91.886% (exceeding 85% [7,22,39]), it can be considered that principal components 1 to 4 contain most of the information elements of the naturalistic driving data after PCA processing. The principal component load is the coefficient used to characterize the correlation between the original driving cycle characteristics and the principal components in PCA, which is also obtained as shown in Figure 4.

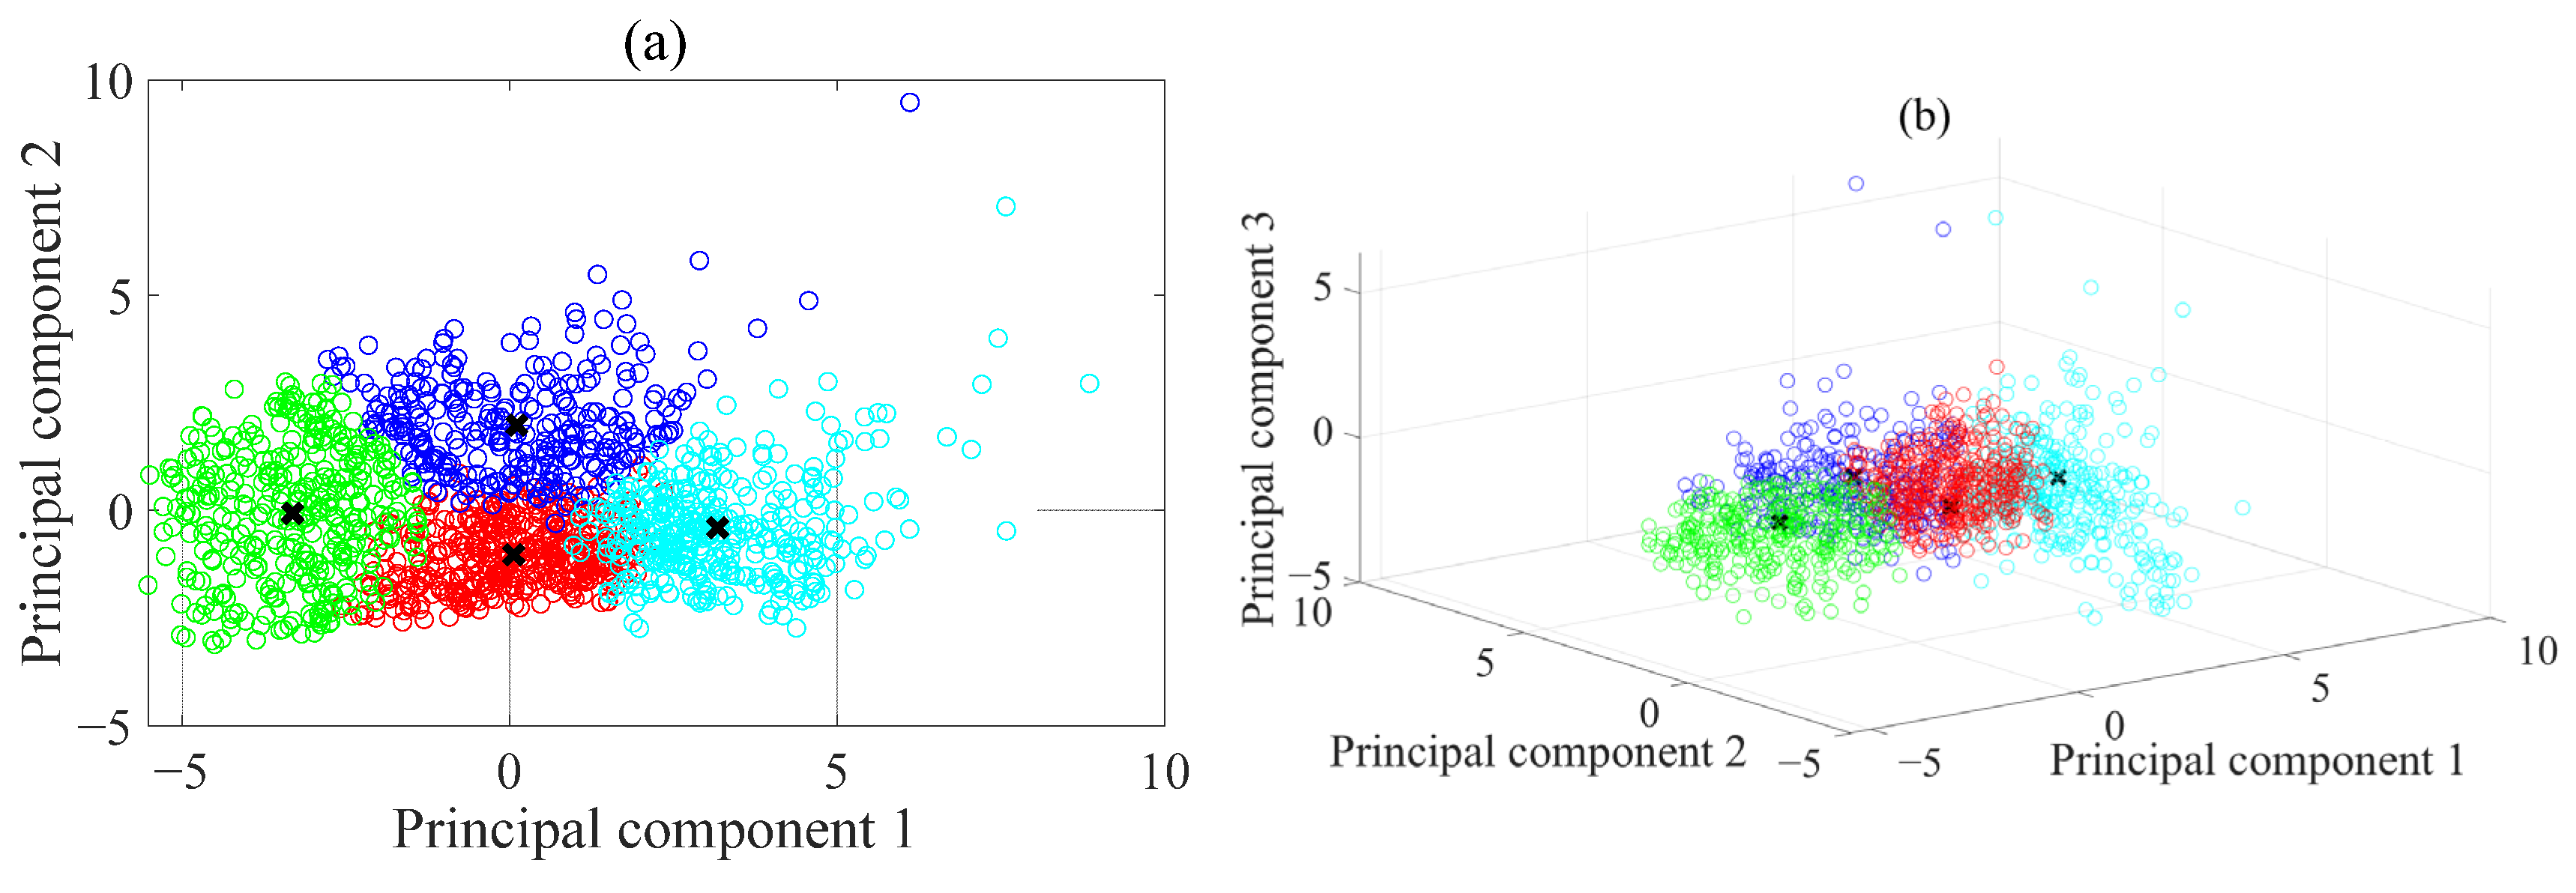
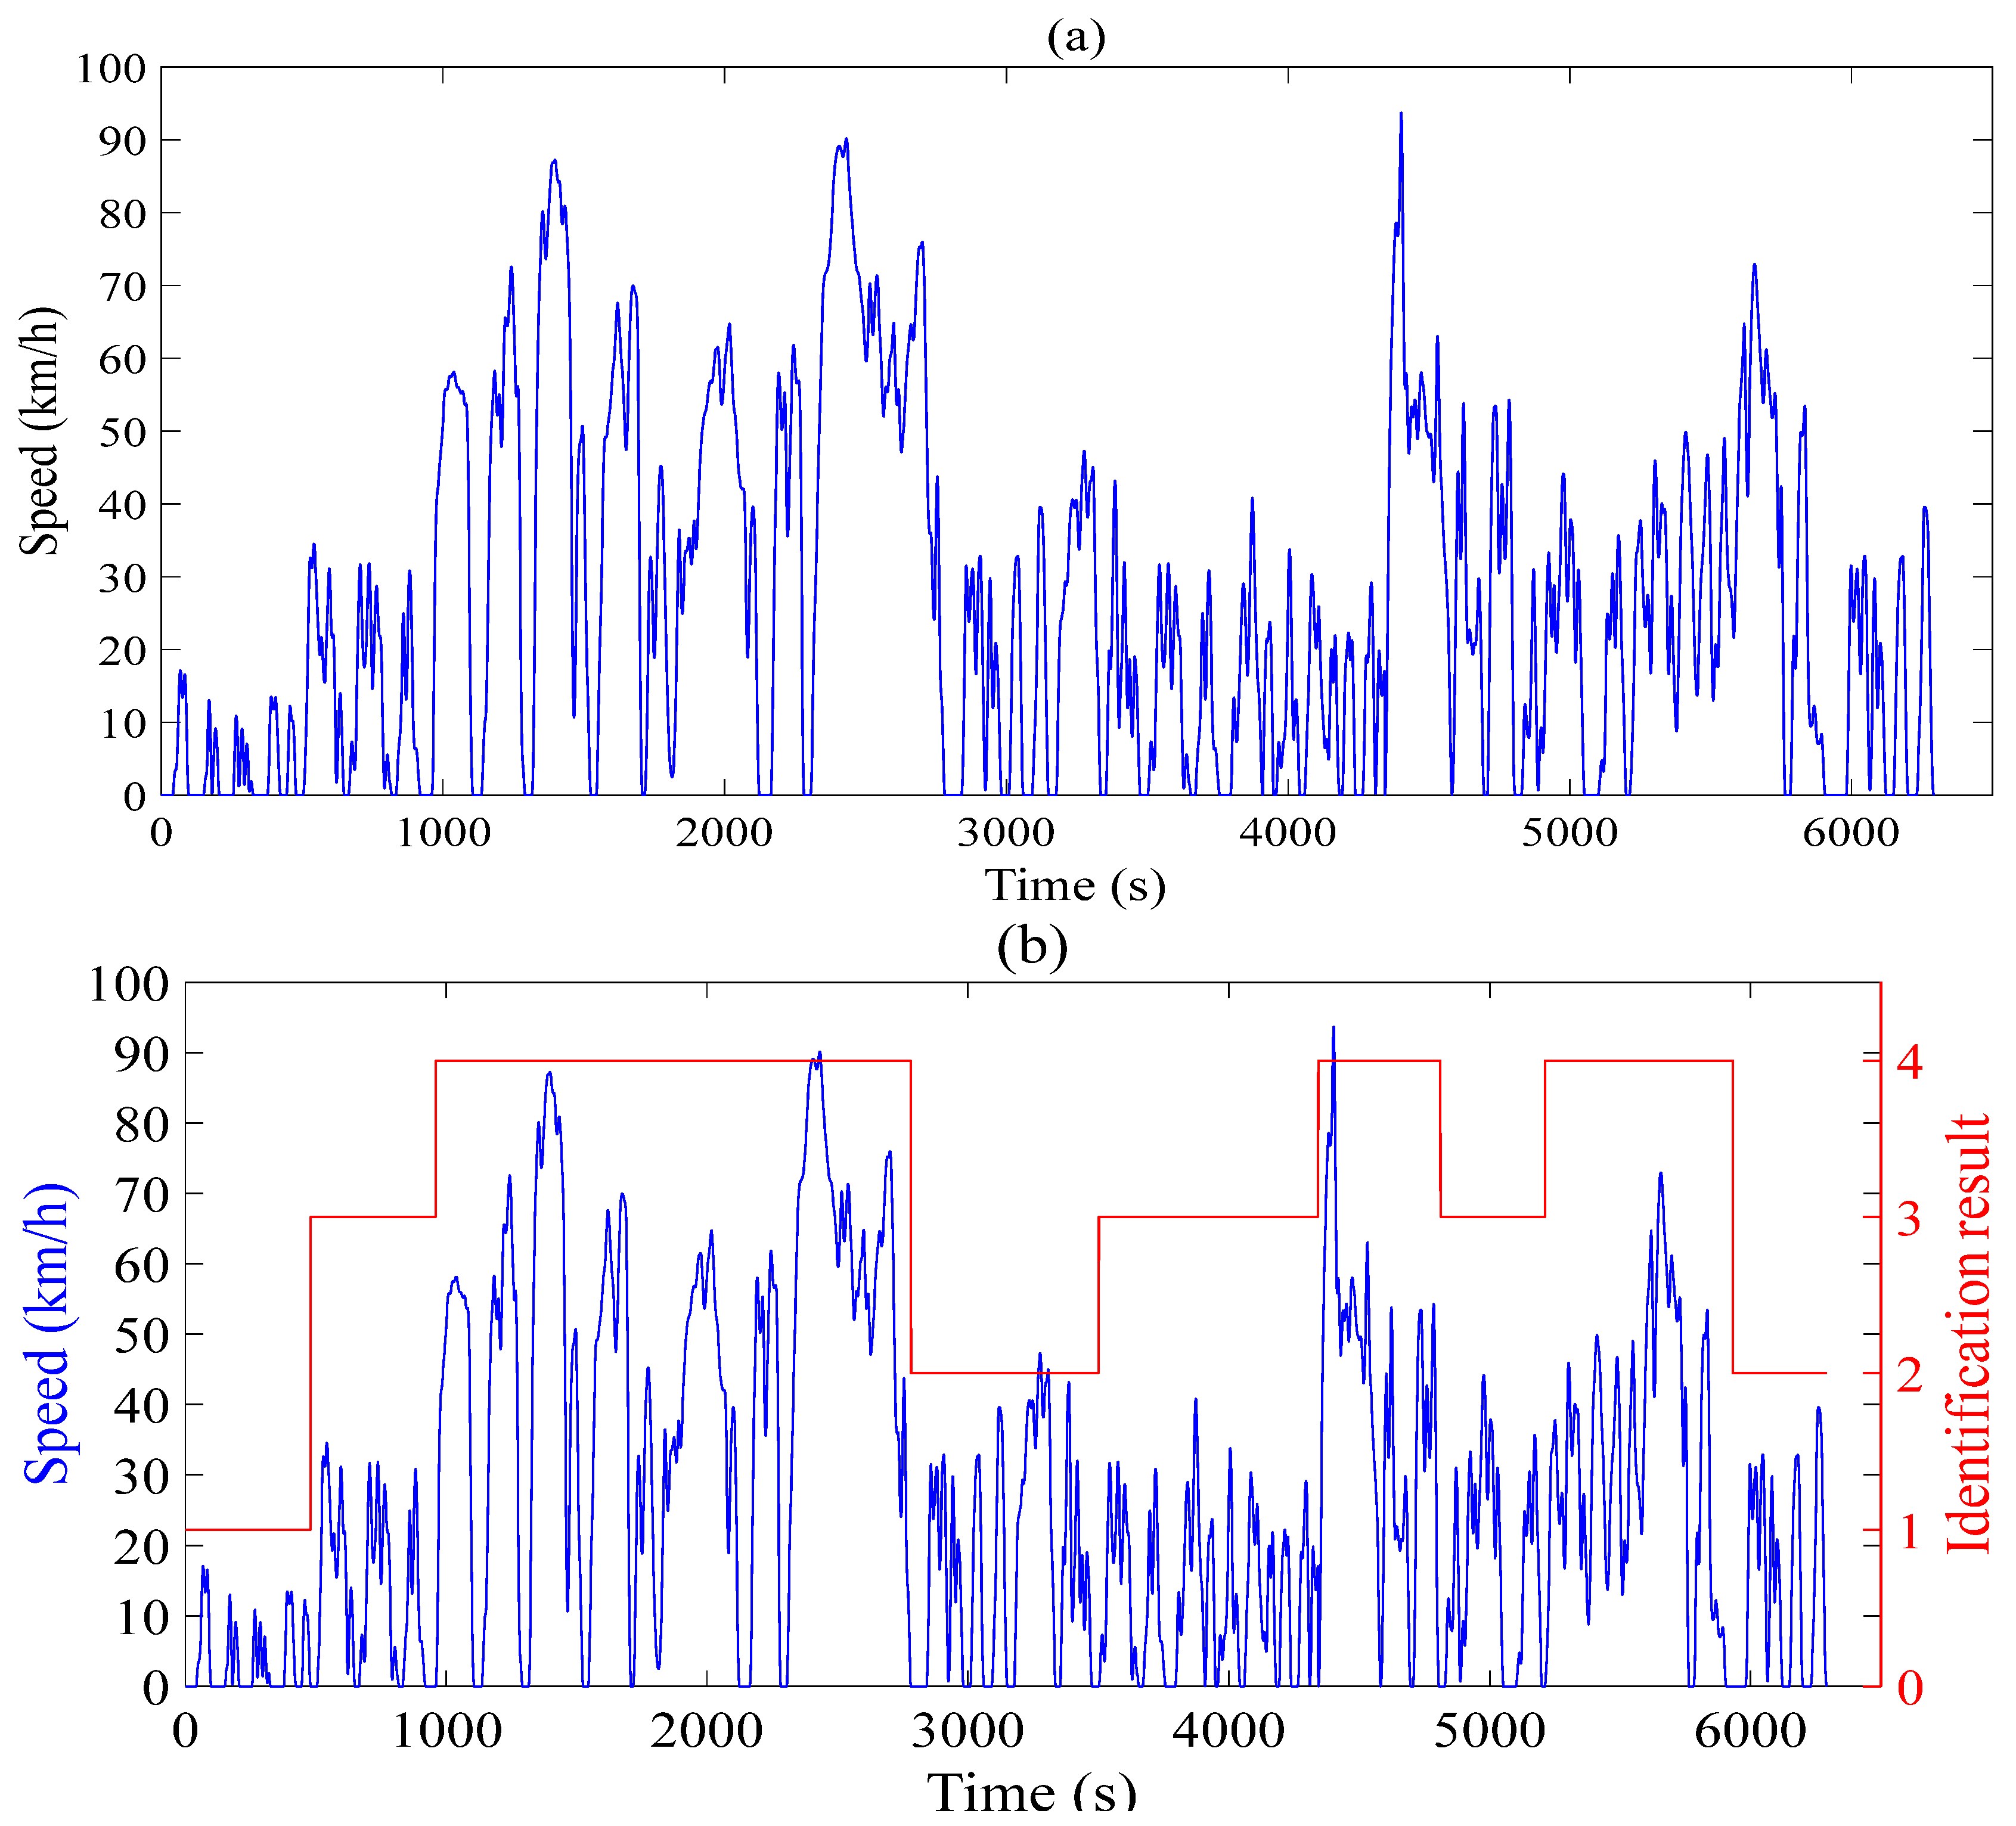
2.4. Acquisition and Identification of Typical Driving Cycles

Due to the K-means clustering algorithm’s strong adaptability, the K-means clustering method was used to classify the driving cycle segments based on the results of the PCA algorithm, and the corresponding typical driving cycle clusters were obtained. All 1682 driving cycle segments were divided into 4 types. To display the clustering results more intuitively, Figure 5a,b represent the two-dimensional and three-dimensional graphs composed of principal component 1, principal component 2, and principal component 3, respectively. The black mark in Figure 6 is the cluster center of each type, indicating that the spacing of each center is basically the same and the classification is relatively uniform.
According to the clustering results, representative driving cycles were selected from each type in this paper (see Figure 6), which respectively represented the congested roads in urban areas, relatively unobstructed roads in urban areas, unobstructed roads, and expressways in urban areas.
Learning Vector Quantization (LVQ) is a neural network identification method, which has strong learning and adaptive capabilities. The LVQ algorithm was adopted to identify the driving cycle in this paper, and the LVQ algorithm could be divided into two parts: offline training and online identification (see Figure 7). The parameters of the cycle identification period Δ T and period update time Δ t in the LVQ algorithm have a great influence on the process and results of cycle identification. Considering the identification accuracy and calculation load comprehensively, the cycle identification period was selected as 120 s, and the period update time was 3 s in this paper. To verify the accuracy of the LVQ algorithm, a long-term (more than 6000 s) random cycle was selected from the preprocessed naturalistic driving database (see Figure 8a), and the trained LVQ algorithm was used to identify the cycle (see Figure 8b).

3. Energy Consumption Generation Method

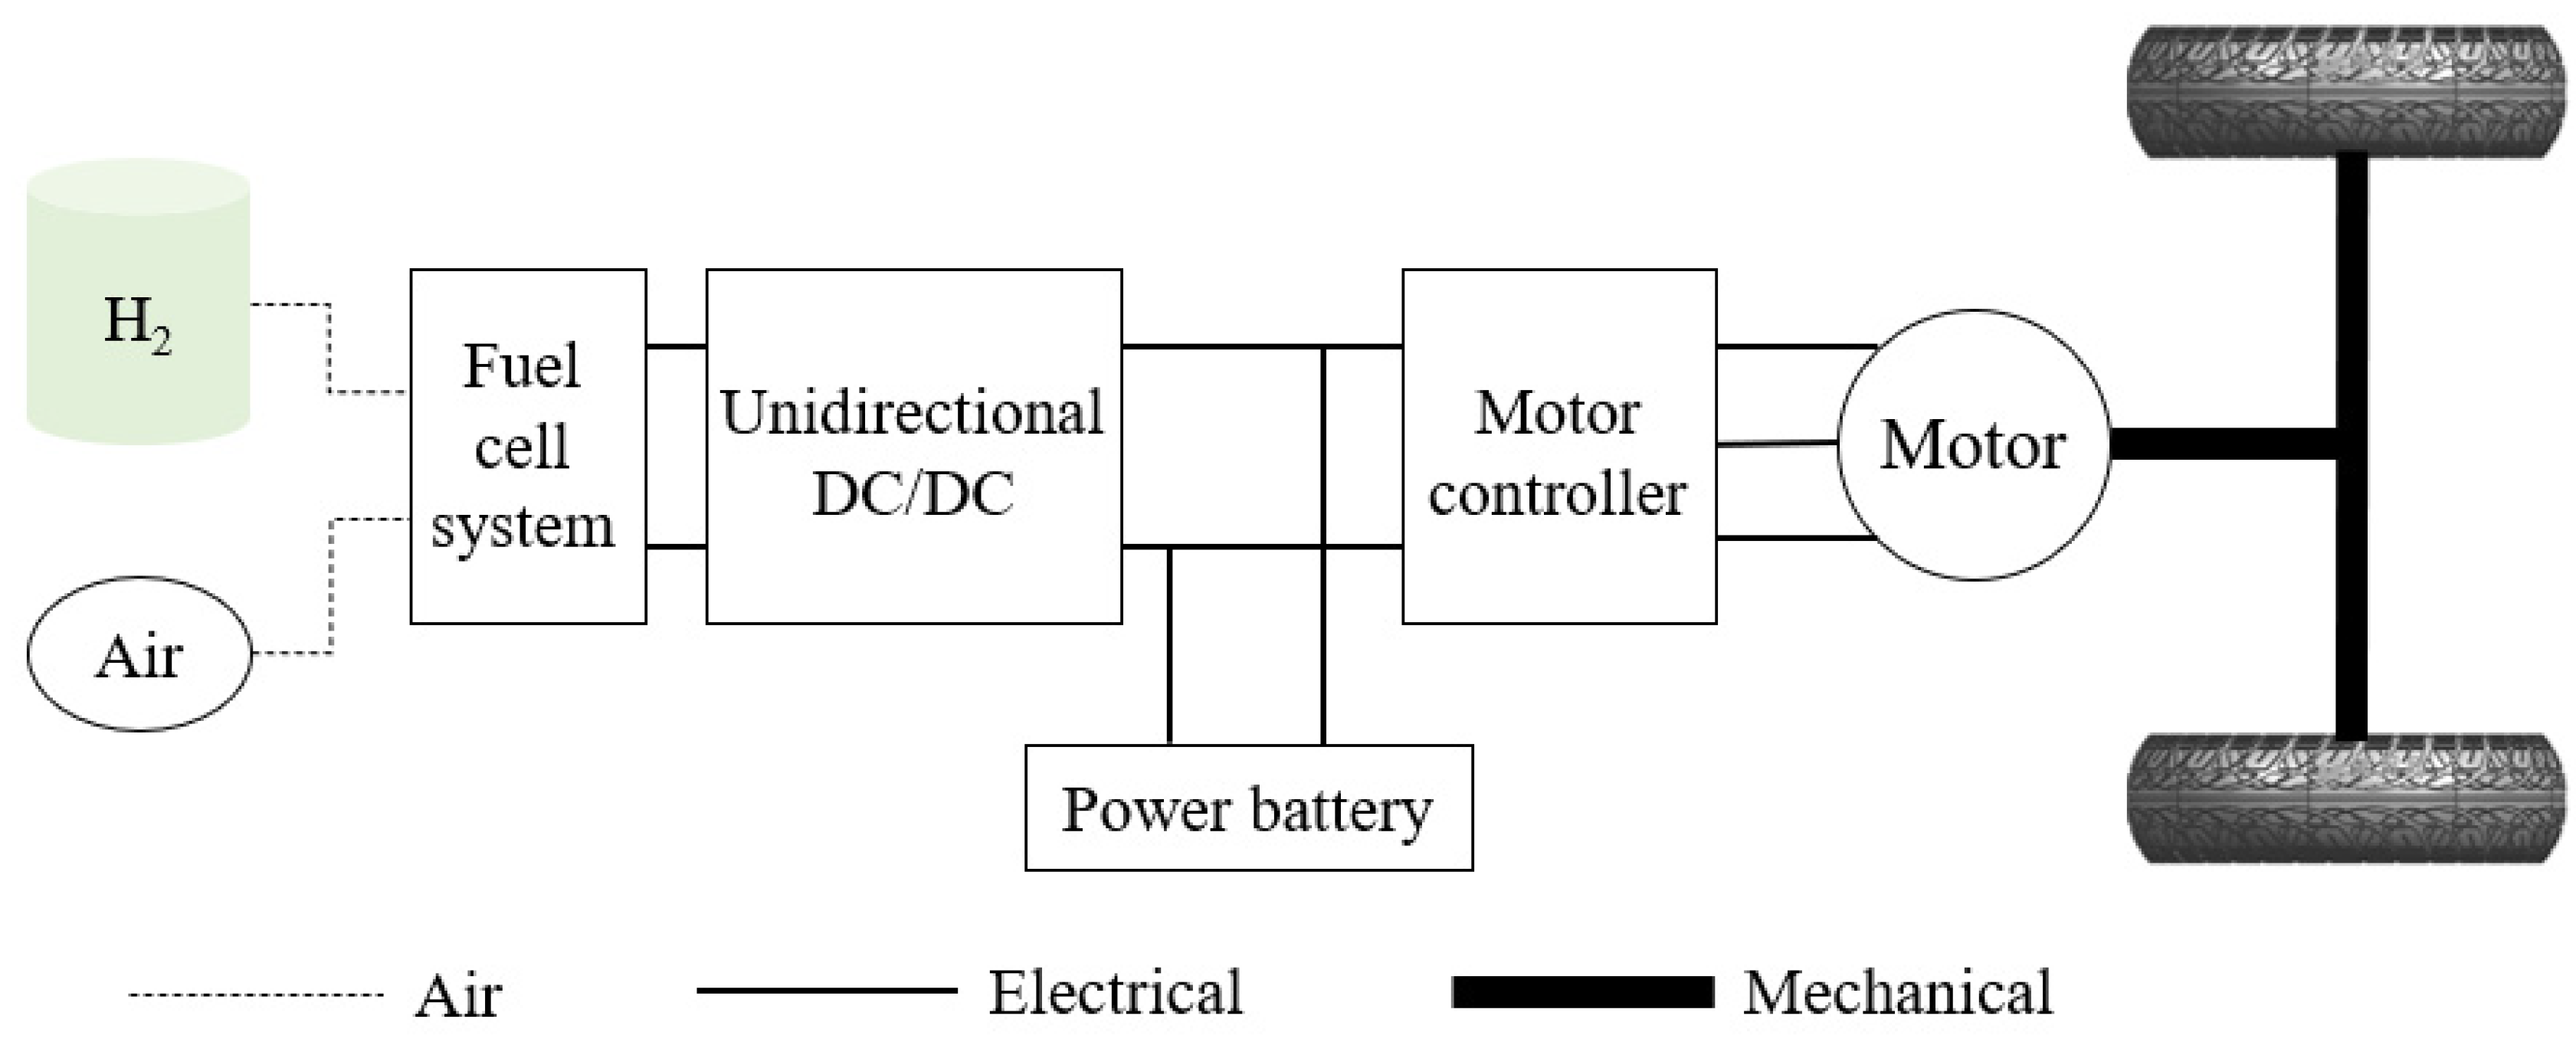
3.1. Vehicle and Powertrain Model

In this paper, a fuel cell vehicle model was used for simulation. The topology of the FCV is shown in Figure 9, and the main parameters of the FCV are also given in Table 2. According to the topic of this paper, this section focuses on the powertrain components, such as the fuel cell, the power battery, and the motor, and the power losses of other components (such as the DC/DC converter, the motor controller, etc.) are not considered [40,41].

3.1.1. Vehicle Dynamics Model

According to the force condition of the vehicle, the vehicle dynamics model is established as shown in Formula (20):
F t = G f cos α + C D A 21.15 u 2 + G sin α + δ m d u d t
where F t is the driving force of the vehicle, G , f , C D , A and m denote the gravity, rolling resistance coefficient, air resistance coefficient, windward area, and mass of the vehicle, respectively, α is the slope of the road, u is the vehicle speed in km/h, and δ is the mass conversion factor. The dynamic model can realize the longitudinal motion control of the FCV.

3.1.2. Motor Model

Based on the test data, a MAP representing the relationship between motor torque, speed and efficiency can be obtained, as shown in Figure 10a. The motor corresponds to the maximum torque T max at different speeds. The current torque T m o t of the motor is the minimum of the demand torque T d e d and the maximum torque T max . The efficiency η m o t of the motor can also be obtained by look-up table according to the current torque T m o t and the current speed n m o t :
{ T m o t = min ( T d e d , T max ) η m o t = f ( T m o t , n m o t )
The motor power can be calculated in driving mode and generating mode as:
P m o t = { T m o t n m o t 9549 η m o t , T m o t 0 T m o t n m o t η m o t 9549 , T m o t < 0
where P m o t is the power of the motor/generator. Particularly, the motor/generator operates as a motor if T m o t is positive, and it operates as a generator if T m o t is negative.

3.1.3. Fuel Cell System Model

The proton exchange membrane fuel cell (PEMFC) is one of the fuel cells widely used in automobiles. The PEMFC system consists of the fuel cell stack and auxiliary subsystems including the air supply subsystem, hydrogen supply subsystem, and cooling subsystem [2]. The fuel cell system net power P f c s can be obtained in Formula (23):
P f c s = N × V c e l l × I f c P a u x
where N is the number of fuel cells, V c e l l is the voltage of the single fuel cell, I f c is the output current of the fuel cell, and P a u x is the power loss of the auxiliary subsystems.
The instantaneous hydrogen consumption rate m f c · and the efficiency η f c s of the fuel cell system can be defined in Formula (24) [42,43], as shown in Figure 10b.
{ m f c · = P f c s η f c s × L H V η f c s = P f c s p f c p
where L H V is the hydrogen lower heating value (120 kJ/g), and P f c p is the peak power of the fuel cell system.

3.1.4. Battery Model

The battery model is simplified as the equivalent circuit model of power source and internal resistance in series in this paper, which can be expressed as:
{ V b a t = V o c I b a t R int P b a t = V b a t I b a t
where V b a t , V o c , I b a t , R int , P b a t are the voltage, open circuit voltage, current, internal resistance, and out power of the battery, respectively. The current of the battery I b a t is hence given by:
I b a t = V o c V o c 2 4 R int P b a t 2 R int
The state of charge (SOC) is calculated using the ampere-hour integral method:
S O C = S O C i n i t 1 Q b a t t 0 t f I b a t ( t ) d t
where S O C i n i t is the state of charge at the initial moment of the battery, and Q b a t is the capacity of the battery.

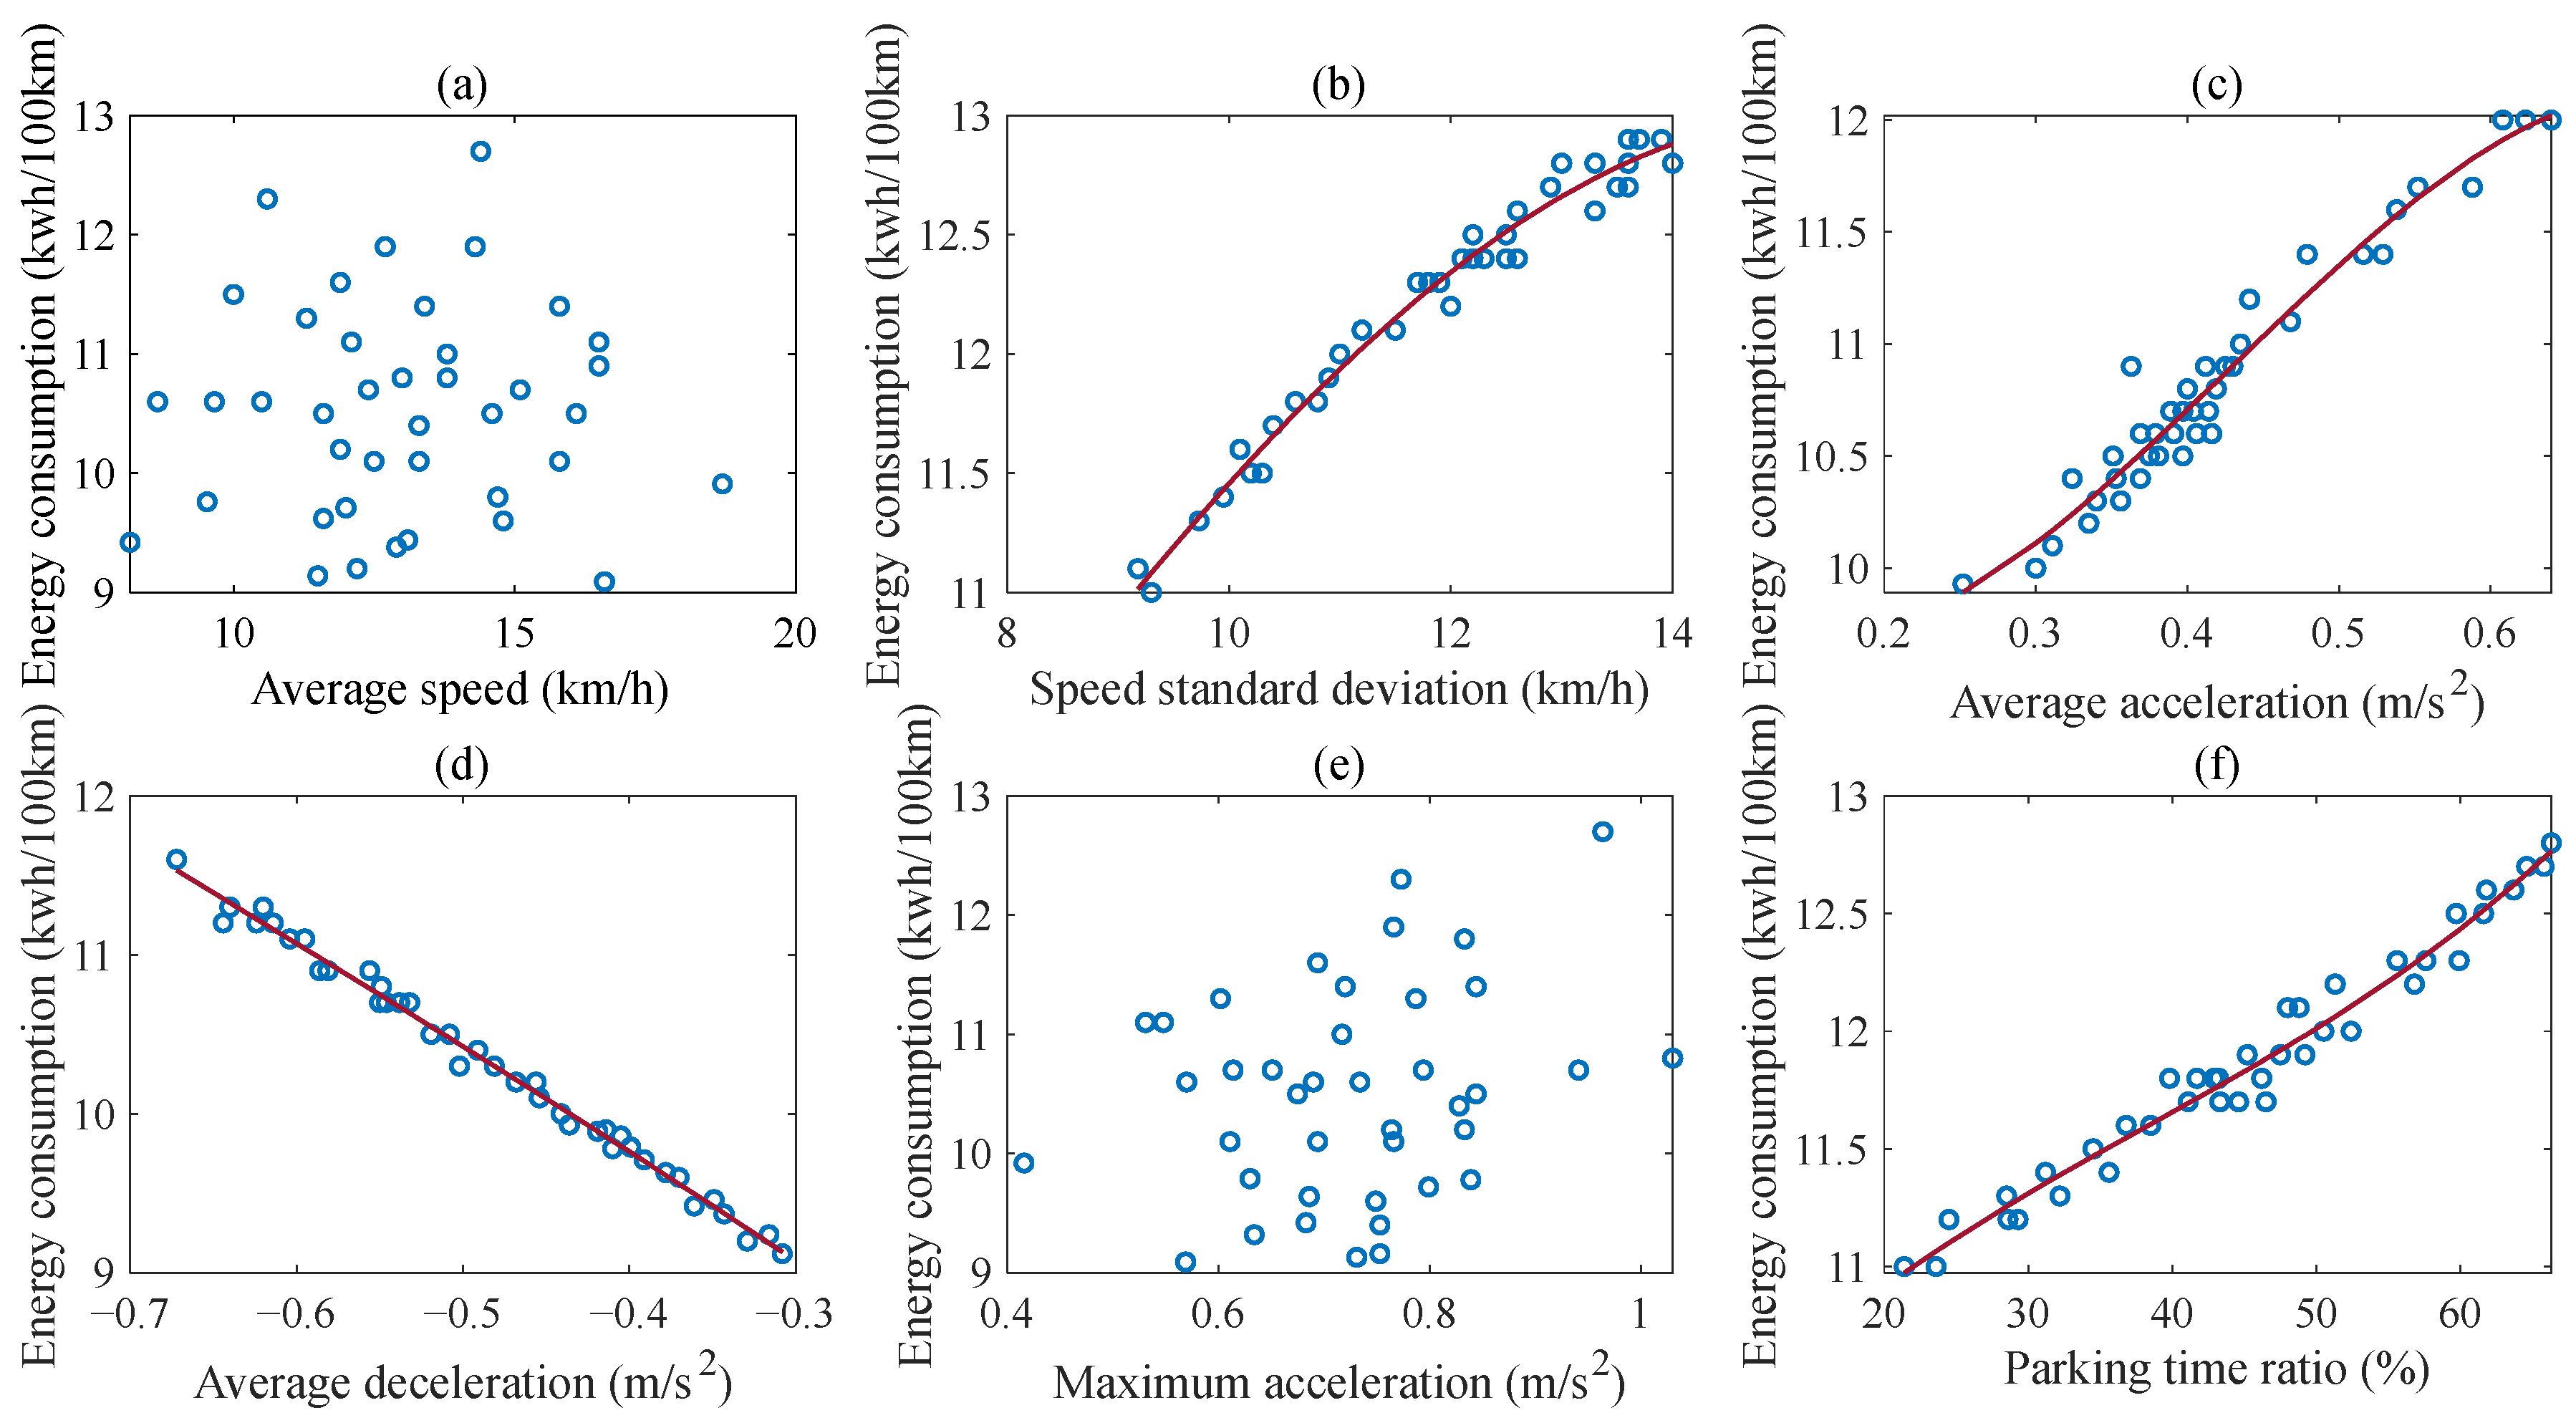
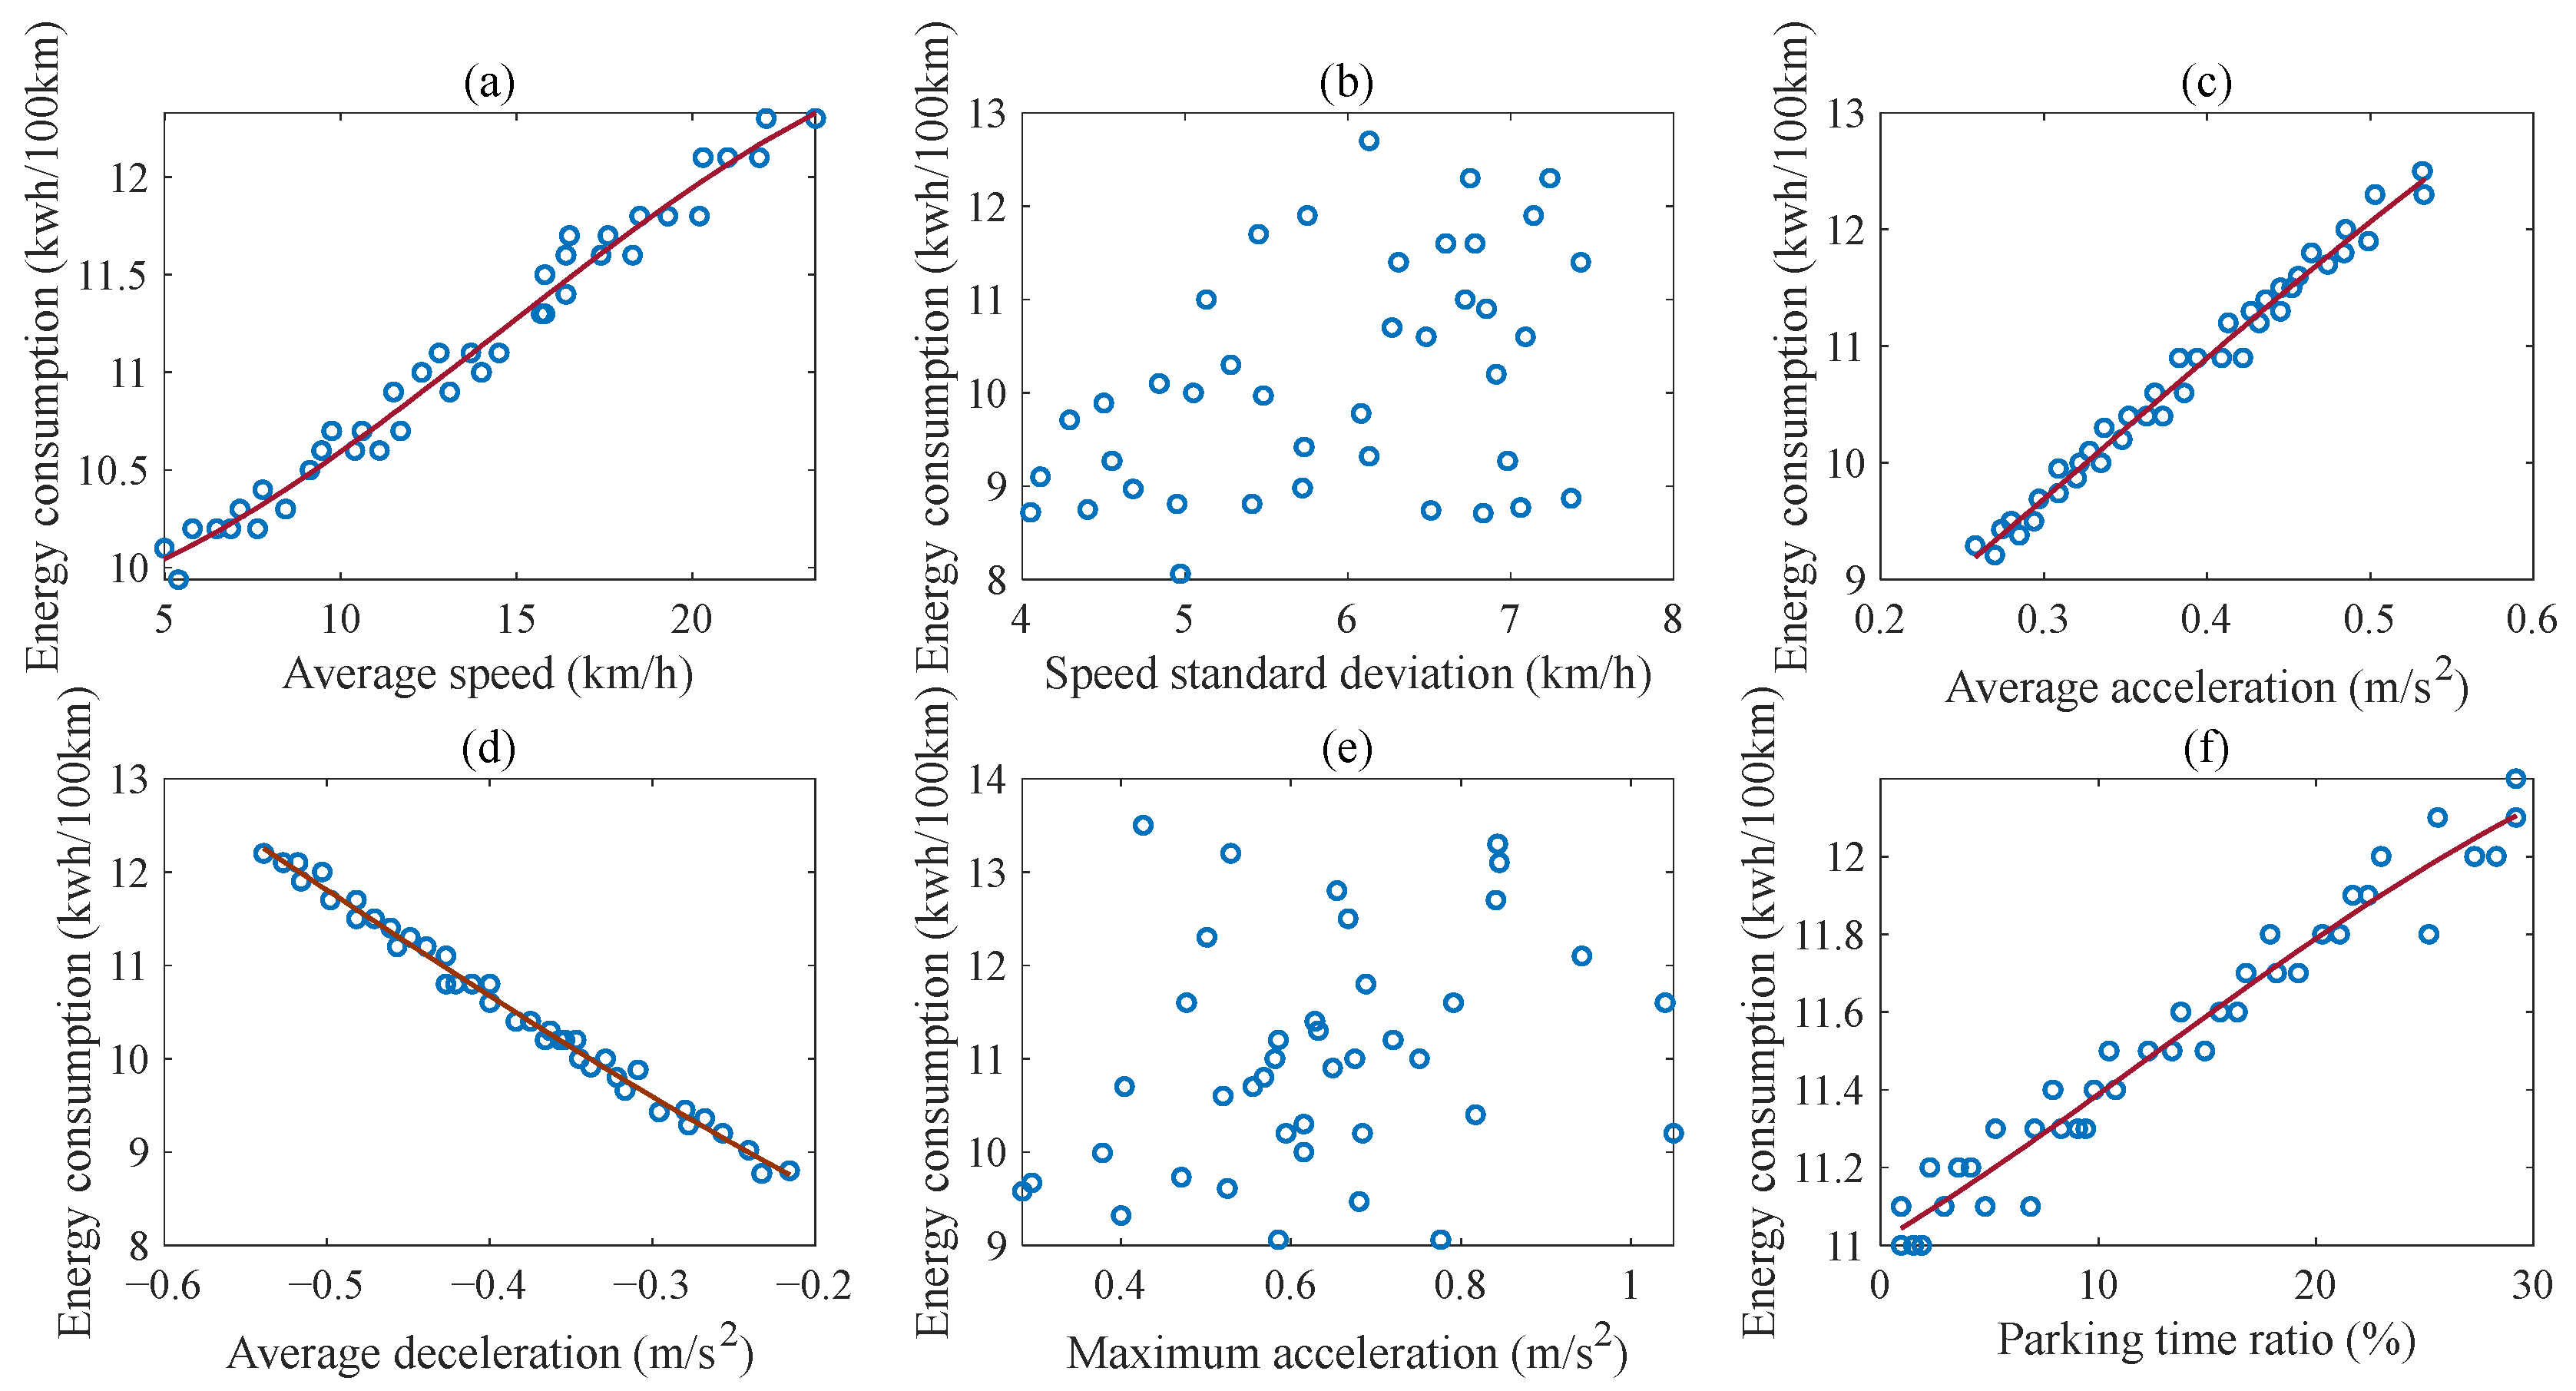
3.2. Energy Consumption Correlation Analysis

As mentioned above, fuel cell vehicle energy consumption is greatly affected by driving cycles, and the driving cycles can be characterized by characteristic parameters. According to the above PCA analysis results and reference [44], the average speed v a v e , the standard deviation of vehicle speed v s t d , average acceleration a a v e , average deceleration a d a v e , maximum acceleration a max , and parking time ratio r p t are selected as the characteristic parameters to be analyzed in this paper. In order to obtain the FCV energy consumption, some segments are selected from the four typical driving cycle libraries as the target driving conditions for simulation. Then, the characteristic parameters and corresponding energy consumption of each segment are drawn into a scatter diagram for correlation study. The simulation results of the relationship between characteristic parameters and energy consumption under typical driving cycle 1 are shown in Figure 11.
As shown in Figure 11a–d the average speed v a v e , the standard deviation of vehicle speed v s t d , average acceleration a a v e , and average deceleration a d a v e have an obvious linear relationship with the energy consumption under typical driving cycle 1. In Figure 11e,f, the distribution of scattered points overall presents a divergent state and fluctuates in a wide range. Based on the above results, the maximum acceleration a max and parking time ratio r p t have no correlation with the energy consumption under typical driving cycle 1. The simulation results of the relationship between characteristic parameters and energy consumption under typical driving cycles 2, 3, and 4 are also shown in Figure 12, Figure 13 and Figure 14, respectively.
According to the above results, the characteristic parameters correlated to FCV energy consumption under four typical driving cycles can be obtained, as shown in Table 3.

3.3. Energy Consumption Generation Method

In order to obtain more accurate energy consumption data of FCVs under different typical driving cycles, a regression analysis model is adopted to obtain the quantitative relationship between characteristic parameters and energy consumption under four typical driving cycles. According to the analysis results of the correlation between the characteristic parameters and energy consumption, the multiple linear regression analysis model is adopted to establish the energy consumption generation equation.
E i = β 0 _ i + β 1 _ i x i 1 + β 2 _ i x i 2 + + β n _ i x i n
where i is the type of typical driving cycles ( i = 1 , 2 , 3 , 4 ), E i is the average energy consumption per hundred kilometers under a typical driving cycle i , β 0 _ i , β 1 _ i , , β n _ i are the coefficients and x i 1 , x i 2 , , x i n are the characteristic parameters correlated to energy consumption under the typical driving cycle i .
(1) Typical driving cycle 1
E 1 = β 0 _ 1 + β 1 _ 1 v a v e + β 2 _ 1 v s t d + β 3 _ 1 a a v e + β 4 _ 1 a d a v e
(2) Typical driving cycle 2
E 2 = β 0 _ 2 + β 1 _ 2 v s t d + β 2 _ 2 a a v e + β 3 _ 2 a d a v e + β 4 _ 2 r p t
(3) Typical driving cycle 3
E 3 = β 0 _ 3 + β 1 _ 3 v a v e + β 2 _ 3 a a v e + β 3 _ 3 a d a v e + β 4 _ 3 r p t
(4) Typical driving cycle 4
E 4 = β 0 _ 4 + β 1 _ 4 v a v e + β 2 _ 4 v s t d + β 3 _ 4 a a v e + β 4 _ 4 a d a v e + β 5 _ 4 r p t
The E i in Formula (20) is the average energy consumption per hundred kilometers under a typical driving cycle, and the corresponding mileage under the typical driving cycle should also be considered when energy consumption is calculated. The FCV energy consumption generation algorithm under a real driving cycle is shown in Table 4.

3.4. Simulation and Results

In order to verify the effectiveness of the proposed FCV energy generation method, another long-term driving cycle (more than 6000 s) was extracted from the preprocessed naturalistic driving database, as shown in Figure 15. The results of the LVQ identification algorithm and energy consumption generation method are shown in Figure 16 and Figure 17.
In Figure 16, the driving cycle in Figure 15 is identified and 11 typical driving cycle segments are obtained. In Figure 17, the energy consumption results under different typical driving cycle segments are also obtained by using the energy consumption generation method. Combined with the driving cycle identification results, the trend of the energy consumption curve is consistent with driving characteristics. For example, under the typical driving cycle 1, the slope of the energy consumption curve obtained is generally relatively small for the driving cycles with low average speeds and long parking times, while under the typical driving cycle 4, the slope of the energy consumption curve obtained is relatively large for the driving cycles with high average speeds and short parking times. Based on the above discussion, it can be concluded that the energy consumption generation method proposed in this paper can accurately calculate the energy consumption data of fuel cell vehicles.

4. Discussion

Due to vehicle energy consumption being sensitive to the driving cycles, this paper mainly focuses on the relationship between driving cycles and energy consumption, and proposes an energy consumption generation method for FCVs. The main findings of the paper are the following:
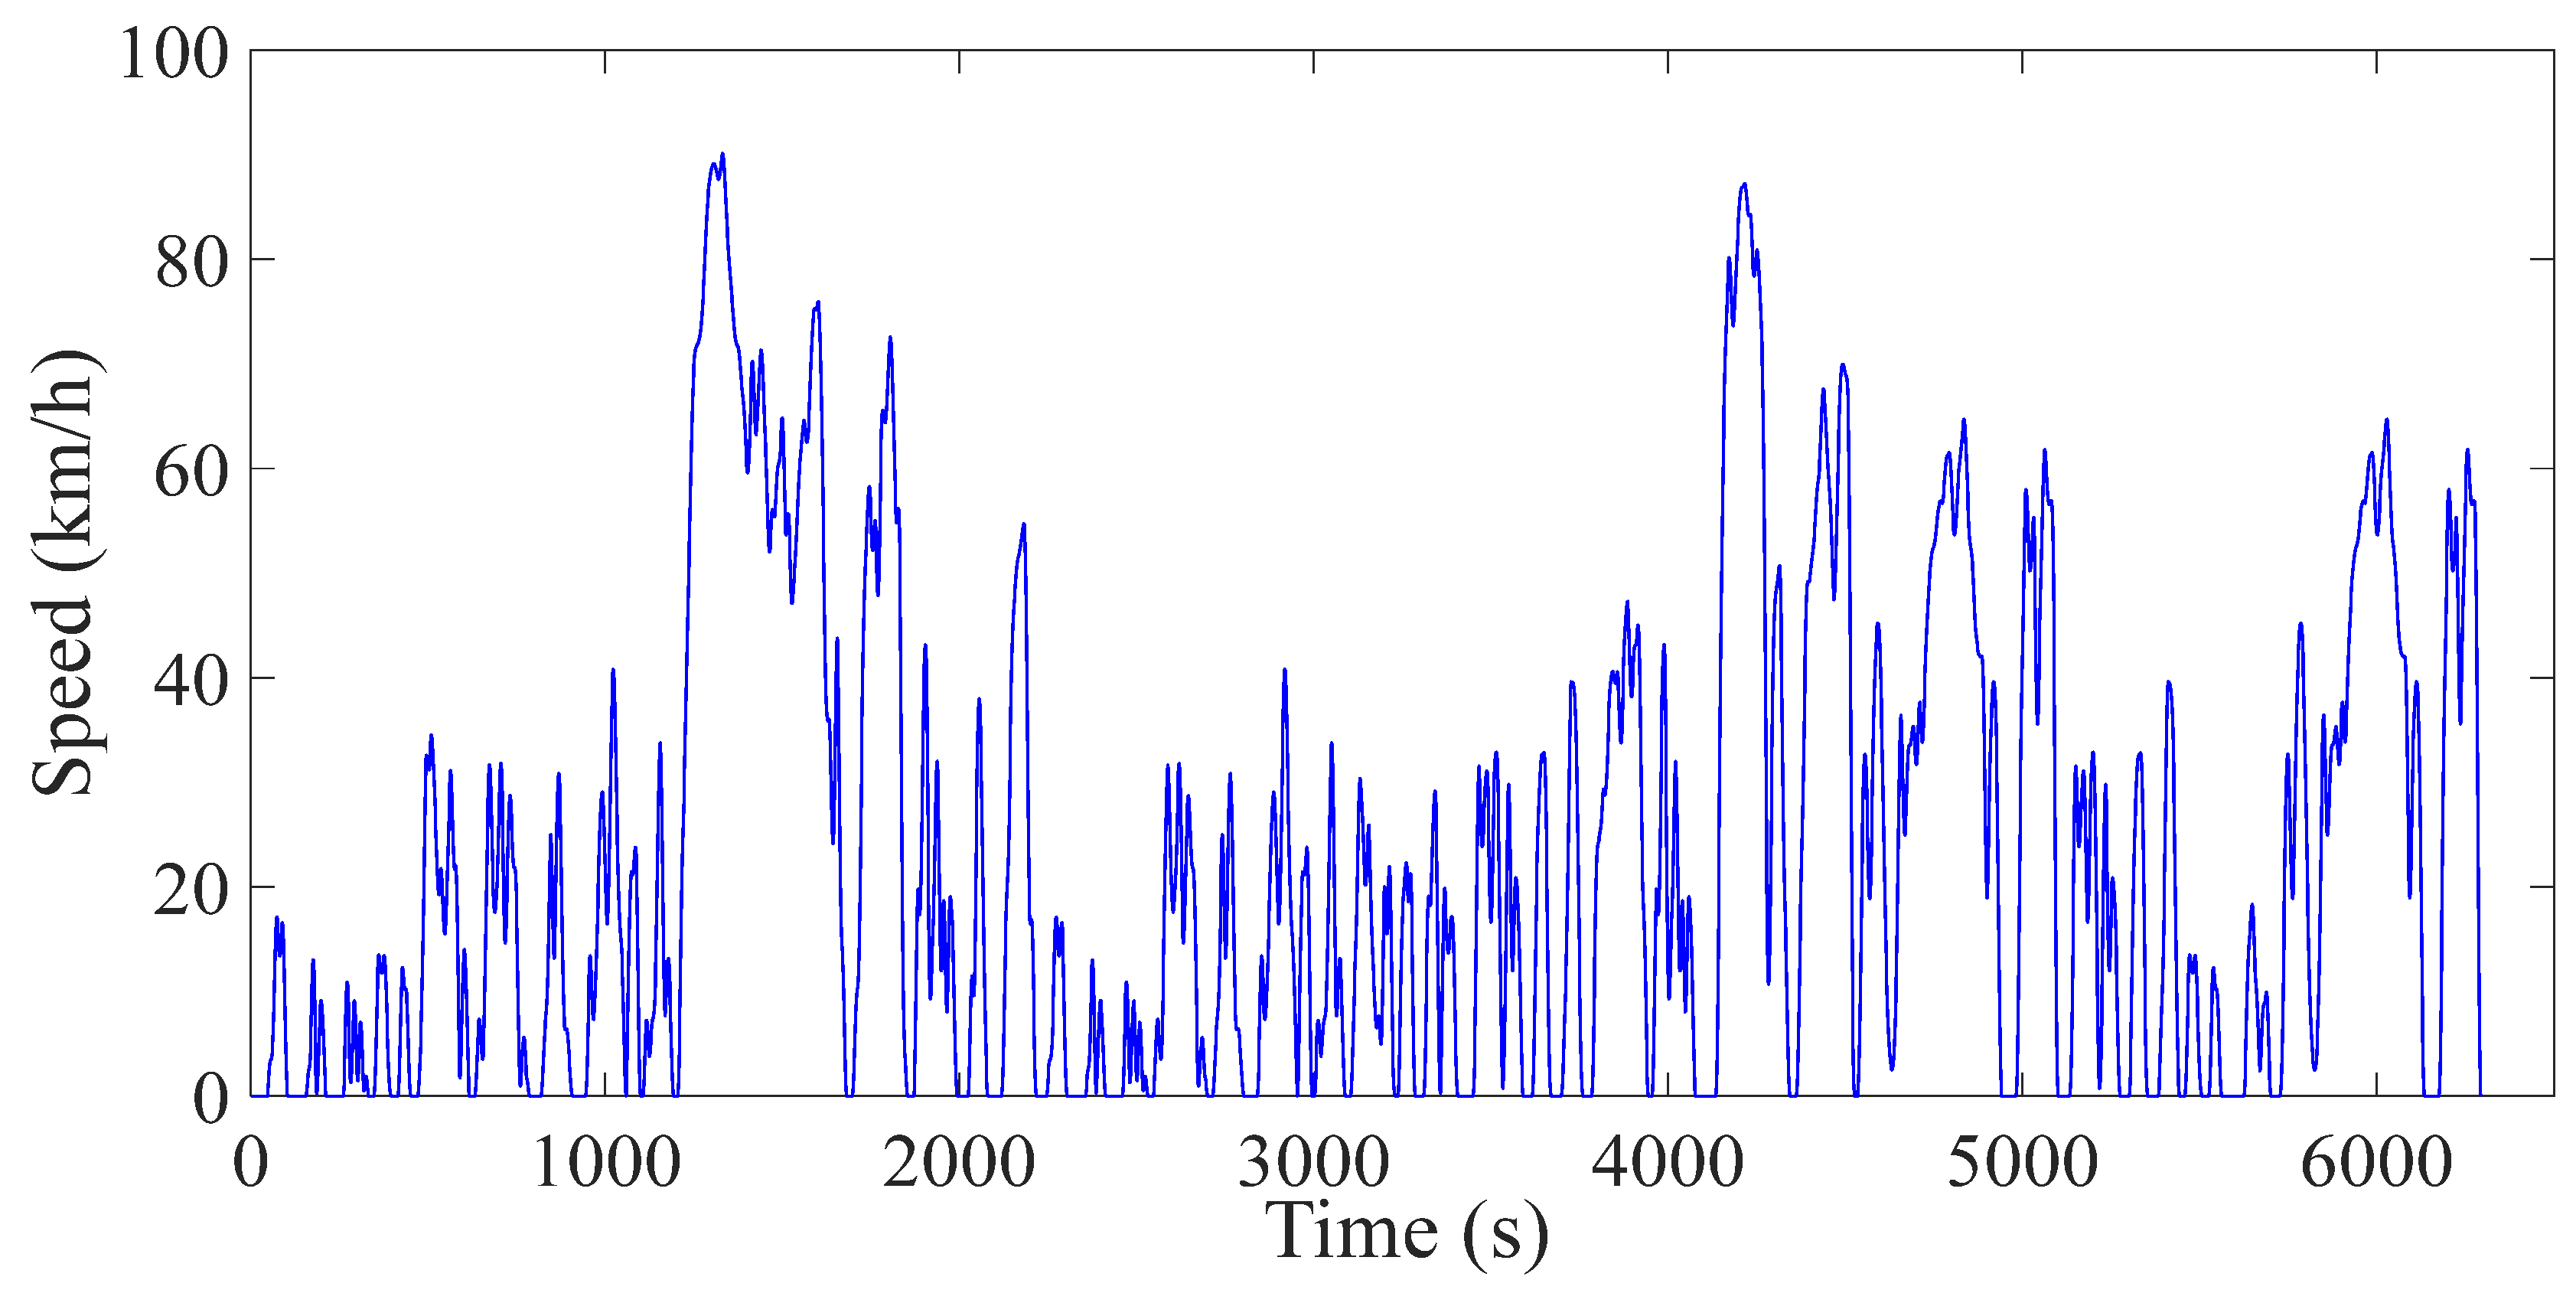
  • We have analyzed the three steps of naturalistic driving data mining (i.e., collecting and preprocessing of the naturalistic driving data, analysis and dimension reduction of characteristic parameters, and acquisition and identification of typical driving cycles), and four typical driving cycles representing driver driving are obtained, which, respectively, represented the congested roads in urban areas, relatively unobstructed roads in urban areas, unobstructed roads in urban areas, and expressways in urban areas.
  • Characteristic parameters of various typical driving cycles are found to be related to the energy consumption of FCVs by means of a regression analysis. The parameter of maximum acceleration is not related to the energy consumption under any typical driving cycles, which is similar in nature to the eco-driving rules stipulated in previous studies [45,46]. Based on the related driving cycle characteristic parameters, an energy consumption generation method is designed and proposed to estimate the energy consumption of FCVs, which can provide a reference for the subsequent design of eco-driving rules.
Besides, this study mainly focuses on the driving behavior of a specific driver, mainly in the collection of naturalistic driving data. However, the designed and proposed natural driving data mining method and energy consumption generation method are universal.

5. Conclusions

In this paper, the specific driver driving method and GPS receiver are used to collect naturalistic driving data, and the bad data are preprocessed to meet the actual driving cycles of the specific driver. In order to reduce the complexity of data mining, PCA is used to reduce the dimension of driving cycle characteristic parameters, and K-means and LVQ algorithms are used to obtain and identify typical driving cycles. An energy consumption generation method is further proposed to calculate the energy consumption data of fuel cell vehicles under actual driving cycles. The energy generation method is developed based on the analysis of energy consumption correlation characteristic parameters and the identification results of typical driving cycles.
One of the main limitations of the current work is limited real-world driving data. Longer driving time spans are still needed to collect more driving data. In addition, other subtle factors that affect vehicle energy consumption, such as road slope and traffic light position, are not considered. Despite these limitations, the proposed energy consumption generation method based on naturalistic driving data mining can accurately calculate the FCV energy consumption data, which can lay a foundation for further energy management research. Concretely, with the help of ITS and GPS, the driving cycles of drivers in the future can be obtained and corrected in real-time, and then the type of future driving cycle can be identified online. The FCV energy management methods can be designed based on the energy consumption level under four typical driving cycles. Furthermore, in future studies, the road slope and traffic light position should be considered to design eco-driving strategies to minimize energy consumption.

Author Contributions

Conceived the structure and research direction of the paper, Y.M. and P.W.; wrote the paper and provided algorithms, P.W., Y.M. and B.L.; writing—review and editing, J.L. and Y.M.; methodology and software, P.W. and B.L.; visualization and validation, Y.M., J.L. and B.L. All authors have read and agreed to the published version of the manuscript.

Funding

The research was supported by the National Key R&D Program of China (grant no. 2021YFB2500700).

Data Availability Statement

Not applicable.

Conflicts of Interest

The authors declare no conflict of interest.

Abbreviations

FCVFuel Cell Vehicle
PHEVPlug-in Hybrid Electric Vehicle
BEVBattery Electric Vehicle
ICEVInternal Combustion Engine Vehicle
GPSGlobal Positioning System
ITSIntelligent transportation system
PCAPrincipal Component Analysis
LVQLearning Vector Quantization
SOCState of Charge

References

  1. Luo, Y.; Wu, Y.H.; Li, B.; Mo, T.D.; Li, Y.; Feng, S.P.; Qu, J.K.; Chu, P.K. Development and application of fuel cells in the automobile industry. J. Energy Storage 2021, 42, 103124. [Google Scholar] [CrossRef]
  2. Wang, P.Y.; Ma, Y.Y.; Li, J.H.; Gao, Y.K.; Zhang, Y.R.; Ma, D.H. A Novel Control Algorithm of the Air Supply Subsystem: Based on Dynamic Modeling of Proton Exchange Membrane Fuel Cell. Processes 2022, 10, 1499. [Google Scholar] [CrossRef]
  3. Bethoux, O. Hydrogen Fuel Cell Road Vehicles: State of the Art and Perspectives. Energies 2020, 13, 5843. [Google Scholar] [CrossRef]
  4. Montero-Sousa, J.A.; Alaiz-Moreton, H.; Quintian, H.; Gonzalez-Ayuso, T.; Novais, P.; Calvo-Rolle, J.L. Hydrogen consumption prediction of a fuel cell based system with a hybrid intelligent approach. Energy 2020, 205, 117986. [Google Scholar] [CrossRef]
  5. Duan, Z.J.; Mei, N.; Hong, J.C.; Feng, L.L.; Yu, S.G.; Jiang, Z.Y.; Chen, D.F.; Xu, X.M. Research on Hydrogen Consumption and Driving Range of Hydrogen Fuel Cell Vehicle under the CLTC-P Condition. World Electr. Veh. J. 2022, 13, 9. [Google Scholar] [CrossRef]
  6. Wang, H.W.; Zhang, X.B.; Ouyang, M.G. Energy consumption of electric vehicles based on real-world driving patterns: A case study of Beijing. Appl. Energy 2015, 157, 710–719. [Google Scholar] [CrossRef]
  7. Xie, H.M.; Tian, G.Y.; Chen, H.X.; Wang, J.; Huang, Y. A distribution density-based methodology for driving data cluster analysis: A case study for an extended-range electric city bus. Pattern Recogn. 2018, 73, 131–143. [Google Scholar] [CrossRef]
  8. Wang, P.Y.; Li, J.K.; Yu, Y.B.; Xiong, X.Y.; Zhao, S.J.; Shen, W.S. Energy management of plug-in hybrid electric vehicle based on trip characteristic prediction. J. Automob. Eng. 2020, 234, 2239–2259. [Google Scholar] [CrossRef]
  9. Ma, Y.Y.; Wang, P.Y.; Sun, T.J. Research on Energy Management Method of Plug-In Hybrid Electric Vehicle Based on Travel Characteristic Prediction. Energies 2021, 14, 6134. [Google Scholar] [CrossRef]
  10. Chlopek, Z.; Lasocki, J.; Wojcik, P.; Badyda, A.J. Experimental investigation and comparison of energy consumption of electric and conventional vehicles due to the driving pattern. Int. J. Green Energy 2018, 15, 773–779. [Google Scholar] [CrossRef]
  11. Xie, Y.K.; Li, Y.Y.; Zhao, Z.C.; Dong, H.; Wang, S.Q.; Liu, J.P.; Guan, J.H.; Duan, X.B. Microsimulation of electric vehicle energy consumption and driving range. Appl. Energy 2020, 267, 115081. [Google Scholar] [CrossRef]
  12. Mamarikas, S.; Doulgeris, S.; Samaras, Z.; Ntziachristos, L. Traffic impacts on energy consumption of electric and conventional vehicles. Transp. Res. Part D Transp. Environ. 2022, 105, 103231. [Google Scholar] [CrossRef]
  13. Fiori, C.; Arcidiacono, V.; Fontaras, G.; Makridis, M.; Mattas, K.; Marzano, V.; Thiel, C.; Ciuffo, B. The effect of electrified mobility on the relationship between traffic conditions and energy consumption. Transp. Res. Part D Transp. Environ. 2019, 67, 275–290. [Google Scholar] [CrossRef]
  14. Grube, T.; Stolten, D. The Impact of Drive Cycles and Auxiliary Power on Passenger Car Fuel Economy. Energies 2018, 11, 1010. [Google Scholar] [CrossRef] [Green Version]
  15. Ye, K.L.; Li, P.Q.; Li, H. Optimization of Hybrid Energy Storage System Control Strategy for Pure Electric Vehicle Based on Typical Driving Cycle. Math. Probl. Eng. 2020, 2020, 1365195. [Google Scholar] [CrossRef]
  16. Wang, L.; Ma, J.; Zhao, X.; Li, X.B. Development of a Typical Urban Driving Cycle for Battery Electric Vehicles Based on Kernel Principal Component Analysis and Random Forest. IEEE Access 2021, 9, 15053–15065. [Google Scholar] [CrossRef]
  17. Liu, H.; Zhao, J.Y.; Qing, T.; Li, X.Y.; Wang, Z.Z. Energy consumption analysis of a parallel PHEV with different configurations based on a typical driving cycle. Energy Rep. 2021, 7, 254–265. [Google Scholar] [CrossRef]
  18. Mamala, J.; Smieja, M.; Praznowski, K. Analysis of the Total Unit Energy Consumption of a Car with a Hybrid Drive System in Real Operating Conditions. Energies 2021, 14, 3966. [Google Scholar] [CrossRef]
  19. Shi, S.M.; Zhang, M.; Lin, N.; Yue, B.J. Low-Cost Reconstruction of Typical Driving Cycles Based on Empirical Information and Low-Frequency Speed Data. IEEE Trans. Veh. Technol. 2020, 69, 8221–8231. [Google Scholar] [CrossRef]
  20. Pei, L.H.; Cao, Y.; Kang, Y.; Xu, Z.Y.; Zhao, Z.Y. UJ-FLAC: Unsupervised Joint Feature Learning and Clustering for Dynamic Driving Cycles Construction. IEEE Trans. Intell. Transp. Syst. 2021, 23, 10970–10982. [Google Scholar] [CrossRef]
  21. Li, X.F.; Zhang, Q.; Peng, Z.L.; Wang, A.N.; Wang, W.Y. A data-driven two-level clustering model for driving pattern analysis of electric vehicles and a case study. J. Clean. Prod. 2018, 206, 827–837. [Google Scholar] [CrossRef]
  22. Zhao, X.; Yu, Q.; Ma, J.; Wu, Y.; Yu, M.; Ye, Y.M. Development of a Representative EV Urban Driving Cycle Based on a k-Means and SVM Hybrid Clustering Algorithm. J. Adv. Transp. 2018, 2018, 1890753. [Google Scholar] [CrossRef]
  23. Peng, Y.H.; Zhuang, Y.; Yang, Y.H. A driving cycle construction methodology combining k-means clustering and Markov model for urban mixed roads. J. Automob. Eng. 2020, 234, 714–724. [Google Scholar] [CrossRef]
  24. Wu, C.Z.; Sun, C.; Chu, D.F.; Huang, Z.; Ma, J.; Li, H.R. Clustering of Several Typical Behavioral Characteristics of Commercial Vehicle Drivers Based on GPS Data Mining Case Study of Highways in China. Transp. Res. Rec. 2016, 2581, 154–163. [Google Scholar] [CrossRef]
  25. Yan, W.; Li, M.J.; Zhong, Y.C.; Qu, C.Y.; Li, G.X. A Novel k-MPSO Clustering Algorithm for the Construction of Typical Driving Cycles. IEEE Access 2020, 8, 64028–64036. [Google Scholar] [CrossRef]
  26. Lois, D.; Wang, Y.; Boggio-Marzet, A.; Monzon, A. Multivariate analysis of fuel consumption related to eco-driving: Interaction of driving patterns and external factors. Transp. Res. Part D Transp. Environ. 2019, 72, 232–242. [Google Scholar] [CrossRef]
  27. Yan, X.D.; Allison, C.; Fleming, J.; Stanton, N.; Lot, R. The Benefit of Assisted and Unassisted Eco-Driving for Electrified Powertrains. IEEE Trans. Hum. -Mach. Syst. 2021, 51, 403–407. [Google Scholar] [CrossRef]
  28. Fafoutellis, P.; Mantouka, E.G.; Vlahogianni, E.I. Eco-Driving and Its Impacts on Fuel Efficiency: An Overview of Technologies and Data-Driven Methods. Sustainability 2021, 13, 226. [Google Scholar] [CrossRef]
  29. Zhou, M.; Jin, H.; Wang, W.S. A review of vehicle fuel consumption models to evaluate eco-driving and eco-routing. Transp. Res. Part D Transp. Environ. 2017, 49, 203–218. [Google Scholar] [CrossRef]
  30. He, H.L.; Liu, D.; Lu, X.Y.; Xu, J.C. ECO Driving Control for Intelligent Electric Vehicle with Real-Time Energy. Electronics 2021, 10, 2613. [Google Scholar] [CrossRef]
  31. Günther, M.; Kacperski, C.; Krems, J.F. Can electric vehicle drivers be persuaded to eco-drive? A field study of feedback, gamification and financial rewards in Germany. Energy Res. Soc. Sci. 2019, 63, 101407. [Google Scholar] [CrossRef]
  32. Yang, H.; Almutairi, F.; Rakha, H. Eco-Driving at Signalized Intersections: A Multiple Signal Optimization Approach. IEEE Trans. Intell. Transp. Syst. 2021, 22, 2943–2945. [Google Scholar] [CrossRef] [Green Version]
  33. Yuan, W.C.; Frey, C.; Wei, T.C. Fuel use and emission rates reduction potential for light-duty gasoline vehicle eco-driving. Transp. Res. Part D Transp. Environ. 2022, 109, 103394. [Google Scholar] [CrossRef]
  34. Xu, Z.G.; Wei, T.; Easa, S.; Zhao, X.M.; Qu, X.B. Modeling Relationship between Truck Fuel Consumption and Driving Behavior Using Data from Internet of Vehicles. Comput. -Aided Civ. Infrastruct. Eng. 2018, 33, 209–219. [Google Scholar] [CrossRef] [Green Version]
  35. Yao, Y.; Zhao, X.H.; Liu, C.; Rong, J.; Zhang, Y.L.; Dong, Z.N.; Su, Y.L. Vehicle fuel consumption prediction method based on driving behavior data collected from smartphones. J. Adv. Transp. 2020, 2020, 9263605. [Google Scholar] [CrossRef]
  36. Tkachenko, R.; Izonin, I.; Kryvinska, N.; Dronyuk, I.; Zub, K. An Approach towards Increasing Prediction Accuracy for the Recovery of Missing IoT Data based on the GRNN-SGTM Ensemble. Sensors 2020, 20, 2625. [Google Scholar] [CrossRef] [PubMed]
  37. Zhao, M.R.; Gao, H.N.; Han, Q.; Ge, J.A.; Wang, W.; Qu, J. Development of a Driving Cycle for Fuzhou Using K-Means and AMPSO. J. Adv. Transport. 2021, 2021, 5430137. [Google Scholar] [CrossRef]
  38. Guo, S.Q.; Wu, K.K.; Zhang, G.Q. Application of PCA-K-means++ combination model to construction of light vehicle driving conditions in intelligent traffic. J. Meas. Eng. 2020, 8, 107–121. [Google Scholar] [CrossRef]
  39. Liu, Y.G.; Wang, J.M.; Zhao, P.; Qin, D.T.; Chen, Z. Research on Classification and Recognition of Driving Styles Based on Feature Engineering. IEEE Access 2019, 7, 89245–89255. [Google Scholar] [CrossRef]
  40. Liu, B.; Sun, C.; Wang, B.; Liang, W.Q.; Ren, Q.; Li, J.Q.; Sun, F.C. Bi-level convex optimization of eco-driving for connected Fuel Cell Hybrid Electric Vehicles through signalized intersections. Energy 2022, 252, 123956. [Google Scholar] [CrossRef]
  41. Wei, X.D.; Leng, J.H.; Sun, C.; Huo, W.W.; Ren, Q.; Sun, F.C. Co-optimization method of speed planning and energy management for fuel cell vehicles through signalized intersections. J. Power Source 2022, 518, 230598. [Google Scholar] [CrossRef]
  42. Du, C.Q.; Huang, S.Y.; Jiang, Y.Y.; Wu, D.M.; Li, Y. Optimization of Energy Management Strategy for Fuel Cell Hybrid Electric Vehicles Based on Dynamic Programming. Energies 2022, 15, 4325. [Google Scholar] [CrossRef]
  43. Zhou, J.M.; Feng, C.X.; Su, Q.Q.; Jiang, S.F.; Fan, Z.X.; Ruan, J.G.; Sun, S.K.; Hu, L.L. The Multi-Objective Optimization of Powertrain Design and Energy Management Strategy for Fuel Cell-Battery Electric Vehicle. Sustainability 2022, 14, 6320. [Google Scholar] [CrossRef]
  44. Zhao, X.; Ma, J.; Wang, S.; Ye, Y.M.; Wu, Y.; Yu, M. Developing an electric vehicle urban driving cycle to study differences in energy consumption. Environ. Sci. Pollut. Res. 2019, 26, 13839–13853. [Google Scholar] [CrossRef]
  45. Chrenko, D. Influence of hybridisation on eco-driving habits using realistic driving cycles. IET Intell. Transp. Syst. 2015, 9, 498–504. [Google Scholar] [CrossRef]
  46. Coloma, J.F.; Garcia, M.; Wang, Y.; Monzon, A. Green Eco-Driving Effects in Non-Congested Cities. Sustainability 2018, 10, 28. [Google Scholar] [CrossRef]
Figure 1. Naturalistic driving data mining steps.
Machines 10 01047 g001
Figure 2. The route for specific driver to collect naturalistic driving data.
Machines 10 01047 g002
Figure 3. Variance contribution rates.
Machines 10 01047 g003
Figure 4. Load coefficient of the first four principal components: (a) The 1st PC; (b) The 2nd PC; (c) The 3rd PC; (d) The 4th PC. PC: principal component.
Machines 10 01047 g004
Figure 5. Clustering results of driving cycle segments: (a) 2-D; (b) 3-D.
Machines 10 01047 g005
Figure 6. Four typical driving cycles: (a) Congested roads; (b) Relatively unobstructed roads; (c) Unobstructed roads; (d) Expressways in urban areas.
Machines 10 01047 g006
Figure 7. LVQ algorithm diagram.
Machines 10 01047 g007
Figure 8. Long-term actual driving cycle and cycle identification: (a) Long-term actual driving cycle; (b) Cycle identification results.
Machines 10 01047 g008
Figure 9. The FCV topology for simulation.
Machines 10 01047 g009
Figure 10. The motor and fuel cell system efficiency: (a) Motor efficiency; (b) Fuel cell system efficiency.
Machines 10 01047 g010
Figure 11. Characteristic parameters and energy consumption under typical driving cycle 1: (a) Average speed and Energy consumption; (b) Standard deviation of vehicle speed and Energy consumption; (c) Average acceleration and Energy consumption; (d) Average deceleration and Energy consumption; (e) Maximum acceleration and Energy consumption; (f) Parking time ratio and Energy consumption.
Machines 10 01047 g011
Figure 12. Characteristic parameters and energy consumption under typical driving cycle 2: (a) Average speed and Energy consumption; (b) Standard deviation of vehicle speed and Energy consumption; (c) Average acceleration and Energy consumption; (d) Average deceleration and Energy consumption; (e) Maximum acceleration and Energy consumption; (f) Parking time ratio and Energy consumption.
Machines 10 01047 g012
Figure 13. Characteristic parameters and energy consumption under typical driving cycle 3: (a) Average speed and Energy consumption; (b) Standard deviation of vehicle speed and Energy consumption; (c) Average acceleration and Energy consumption; (d) Average deceleration and Energy consumption; (e) Maximum acceleration and Energy consumption; (f) Parking time ratio and Energy consumption.
Machines 10 01047 g013
Figure 14. Characteristic parameters and energy consumption under typical driving cycle 4: (a) Average speed and Energy consumption; (b) Standard deviation of vehicle speed and Energy consumption; (c) Average acceleration and Energy consumption; (d) Average deceleration and Energy consumption; (e) Maximum acceleration and Energy consumption; (f) Parking time ratio and Energy consumption.
Machines 10 01047 g014
Figure 15. Driving cycle for energy consumption generation method verification.
Machines 10 01047 g015
Figure 16. Driving cycle identification results.
Machines 10 01047 g016
Figure 17. Energy consumption results.
Machines 10 01047 g017
Table 1. Characteristic parameters of driving cycle segments.
CategoriesNo.Characteristic ParametersSymbolUnit
Speed-type parameters1Average speed v a v e km/h
2Average driving speed u a v e km/h
3Maximum speed v max km/h
4Standard deviation of vehicle speed v s t d km/h
Acceleration-type parameters5Average acceleration a a v e m/s2
6Average deceleration a d a v e m/s2
7Maximum acceleration a max m/s2
8Maximum deceleration a d max m/s2
9Standard deviation of acceleration a s t d m/s2
10Standard deviation of deceleration a d s t d m/s2
Statistics-type parameters11Parking time ratio r p t %
12Acceleration time ratio r a t %
13Deceleration time ratio r d t %
14Constant speed time ratio r c t %
Table 2. Main parameters of FCV.
DescriptionParametersValue
Basic parameters of the vehicleVehicle mass/kg1500
Frontal area/m22.27
Air resistance coefficient0.28
Rolling radius/m0.327
Power batteryCapacity/A·h 40
Rated voltage/V320
Fuel cellPeak output power/kW15
Table 3. Characteristic parameters correlated to FCV energy consumption.
Typical Driving CyclesCharacteristic Parameters
1 v a v e , v s t d , a a v e , a d a v e
2 v s t d , a a v e , a d a v e , r p t
3 v a v e , a a v e , a d a v e , r p t
4 v a v e , v s t d , a a v e , a d a v e , r p t
Table 4. FCV energy consumption generation algorithm under real driving cycle.
FCV Energy Consumption Generation Method under Real Driving Cycle
1Identifying the driving segments belonging to typical driving cycle 1;
Calculating the characteristic parameters v a v e , v s t d , a a v e , a d a v e  and the corresponding mileage S 1 .
2The actual energy consumption of typical driving cycle 1 E r _ 1 can be calculated by:
E r _ 1 = E 1 × S 1 = ( β 0 _ 1 + β 1 _ 1 v a v e + β 2 _ 1 v s t d + β 3 _ 1 a a v e + β 4 _ 1 a d a v e ) × S 1 .
3Identifying the driving segments belonging to typical driving cycle 2;
Calculating the characteristic parameters v s t d , a a v e , a d a v e , r p t   and   the   corresponding   mileage   S 2 .
4The actual energy consumption of typical driving cycle 2 E r _ 2 can be calculated by:
E r _ 2 = E 2 × S 2 = ( β 0 _ 2 + β 1 _ 2 v s t d + β 2 _ 2 a a v e + β 3 _ 2 a d a v e + β 4 _ 2 r p t ) × S 2 .
5Identifying the driving segments belonging to typical driving cycle 3;
Calculating the characteristic parameters v a v e , a a v e , a d a v e , r p t   and   the   corresponding   mileage   S 3 .
6The actual energy consumption of typical driving cycle 3 E r _ 3 can be calculated by:
E r _ 3 = E 3 × S 3 = ( β 0 _ 3 + β 1 _ 3 v a v e + β 2 _ 3 a a v e + β 3 _ 3 a d a v e + β 4 _ 3 r p t ) × S 3 .
7Identifying the driving segments belonging to typical driving cycle 4;
Calculating the characteristic parameters v a v e , v s t d , a a v e , a d a v e , r p t   and   the   corresponding   mileage   S 4 .
8The actual energy consumption of typical driving cycle 4 E r _ 4 can be calculated by:
E r _ 4 = E 4 × S 4 = ( β 0 _ 4 + β 1 _ 4 v a v e + β 2 _ 4 v s t d + β 3 _ 4 a a v e + β 4 _ 4 a d a v e + β 5 _ 4 r p t ) × S 4 .
Publisher’s Note: MDPI stays neutral with regard to jurisdictional claims in published maps and institutional affiliations.

