Abstract
In order to effectively weaken the leakage flow and shock intensity of traditional “swing” type guide vanes in a variable nozzle turbine, a new flow control device named the “split sliding guide vane” (SSGV) is studied in the present work. Steady and unsteady calculations were carried out on both the SSGV and base model at 10%, 40%, and 100% open positions. The shock test was performed to verify the accuracy of the numerical method. The results showed that at 10%, 40%, and 100% open positions, the leakage flow of the SSGV was 43%, 51%, and 40% of that of the base model, respectively. When 10% open, the turbine efficiency increased by 12%, compared with the base model, since the SSGV could effectively inhibit the clearance leakage flow. Due to the increased distance between the rotor and guide vane, the shock intensity of the SSGV was only 52% of that of the base model when 40% was open. The SSGV could reduce the static pressure loss on the guide vane pressure surface, but for the guide vane suction surface, the static pressure distribution appeared in a “W” shape due to the influence of the vane profile. Finally, the flow in the rotor was studied, which showed that the weakening of the shock and reduction of the clearance leakage flow in the guide vane were also beneficial for the strength of downstream rotor blades.
1. Introduction
Variable geometry turbines (VGTs) have been widely used in internal combustion engines to recover exhaust gas energy, thus, improving low-speed automobile performance [1,2,3,4]. One of the most classic VGT types is the variable nozzle turbine (VNT), in which the “swing” type guide vane can be rotated around a pivot to achieve the flow requirements of an engine under different working conditions [5,6]. When the VNT with the “swing” type guide vanes works under the condition of low speed and high expansion ratio, guide vane clearance leakage flow and trailing edge shock could not only cause flow loss and reduce turbine performance but also strongly excites downstream rotor blades, leading to the high-cycle fatigue failure of the turbine rotor, which has become the main disadvantage of using such guide vanes. The study performed by Spence [7] illustrated that the clearance leakage flow would affect the aerodynamic loss inside the nozzle, resulting in a turbine efficiency penalty. Hu’s research [8] showed that with an increase in guide vane clearance, the leakage flow reduces the turbine efficiency by up to 20%. Chen [9] found the existence of shock for VNTs with the “swing” type guide vanes in 2006, confirmed that shock excitations induced high-cycle fatigue failure of rotors, and determined the location of shock generation. Subsequently, Kawakubo [10] clarified the main position of shock acting on the rotor by introducing dense flow distribution parameters. Qi [11] carried out a shock measurement for VNT linear nozzles and applied aerodynamic excitation, indicating that the shock intensity and morphology differed significantly with excitation amplitudes. Yang [12] investigated the “swing” type guide vanes with respect to shock using numerical methods. The results showed that the shock wave acts in the middle of a rotor blade, causing the high-cycle fatigue failure of the rotor.
To date, a great deal of work has been conducted on the “swing” type guide vane with the aim of reducing the clearance leakage flow and shock [13,14,15]. Fukaya [16] proposed the “vane block combination method”, which may be the earliest passive control technology for the guide vane leakage flow, and the method could reduce leakage losses to a certain extent. Vemula [17] published a patent on guide vanes with groove structures at the tip and believed that a groove could change the leakage flow morphology and reduce its flow intensity. Nowadays, guide vanes with groove structures at the tip have also been applied to a variety of VNTs. Moreover, a passive control method for guide vanes using asymmetric clearance began to attract attention. Represented by the literature of Walkingshaw [18] and Ben [19], studies showed that the combination of guide vanes with asymmetric clearance and backswing rotor blades could increase the efficiency of VNTs by 2%. Recently, the inverse design method of guide vanes to achieve leakage flow suppression was also initially studied, including the local rotation method of guide vane proposed by Zhang [20]. Nevertheless, this form of guide vane has compromised flow capacities and has not been applied in practice. The research on VNT shock weakening started relatively late and began to draw attention in recent years. The methods adopted mainly focus on axial flow turbines, such as “suction surface modification”, “guide vane groove”, “trailing edge tilt” and other methods. However, due to the different flow forms, the shock control method for axial flow turbines is not fully applicable to radial or mixed flow turbines. In a paper published in 2018, Chen [21] realized shock weakening by optimizing the profile of a guide vane with a large thickness ratio, indicating that the vane geometry has a certain effect on the shock intensity. Yang [22] studied the shock intensity of two types of guide vanes and demonstrated that adopting a narrow vane shape and adding vane numbers could reduce the degree of acceleration channel expansion and realize the weakening of shock, while the addition of vanes would lead to the increase in boundary layer loss and wake loss. Some scholars tried to migrate the blade slotting method proposed by Sonoda [23] into radial or mixed flow turbines and created grooves on the suction surface at the trailing edge of guide vanes to weaken the shock intensity. They believed that the local area of a special geometric shape excited by a shock would have a crushing effect on its own structure. In 2017, Lei [24] conducted a study on VNT shock with different groove structures on the vane trailing edge and showed that the groove structure changed the shock from single to multiple waves. Subsequently, a study performed by Ben [25] also confirmed that the guide vane groove could change the structure of shock and weaken its strength, but the turbine performance decreased along with it.
To summarise, the shock and leakage flow are the main negative factors in the internal flow of VNTs [26,27,28]. Many scholars have implemented a variety of active and passive control methods for conventional guide vane shocks and leakage flow to mitigate the negative effects of the two, but no feasible solution has been found so far, which has become a challenge in conventional guide vane applications [29,30]. In view of this, a new form of guide vane airflow control method is needed to solve the problem, which inspires the germination of the idea of SSGV. In the present work, an SSGV is proposed and numerically studied, and the performance of the VNT with an SSGV is compared with that of the base model. In addition, the clearance leakage flow and shock intensity, as well as their effects on downstream rotors, are also analyzed. The rotor blade load fluctuation is compared, and the advantages of the application of SSGVs in VNTs are described and detailed. Finally, the shock test is carried out to validate the effectiveness of the numerical analysis method for shock mitigation in this study.
2. Research Model and Numerical Method
2.1. Base and SSGV Models
The base model studied in this work is a VNT applied to a commercial 6.7 L diesel engine. The meridian view and geometry structure of the model are illustrated in Figure 1. The VNT has 9 guide vanes with a large thickness ratio, and each vane has a symmetric clearance on the hub and shroud sides. The rotor is the mixed flow type with 13 blades, and the inlet diameter and tip clearance of the rotor are 58 mm and 0.3 mm, respectively. The geometric parameters of the VNT are shown in Table 1.
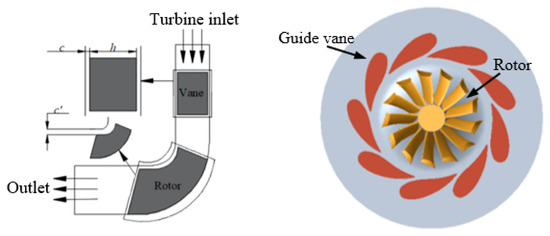
Figure 1.
Meridian and three-dimensional view of the base model.

Table 1.
Parameters of the base model.
In the design, the SSGV was composed of a sliding vane and a fixed vane, as illustrated in Figure 2a, in which the fixed vane had no clearance on both the hub and shroud sides. For the sliding vane, in addition to the hub and shroud clearance, there was also a sliding clearance between the two vanes, and the size of it was the same as the other two clearances, which were 0.15 mm. The sliding vane slides along the suction side of the fixed vane to change the throat areas of the nozzle to meet the desired mass flow of the turbine. Given the reliability of SSGV in actual applications, the trailing edge of the sliding vane and fixed vane adopted the same radius as the base model, and the vane number of the SSGV had no common divisor with that of the rotor to avoid resonance effects.
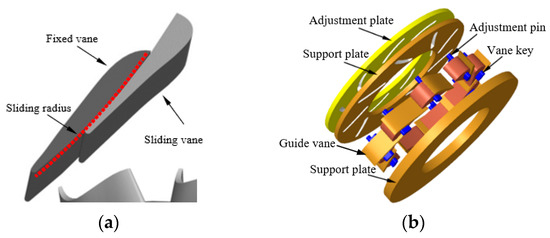
Figure 2.
Geometry of the SSGV: (a) three-dimensional view of the SSGV; (b) actuator of the SSGV.
The schematic diagram of the SSGV actuator is shown in Figure 2b, including the multi-component guide vanes, two support plates, and an adjustment plate. The fixed vane and the lower support plate were designed as an integral structure, while the fixed vane and the upper support plate were closely attached, so there was no gap between them. A guide key was arranged at the bottom end of the sliding vane, and an adjustment pin was added to the guide key at the top end. By rotating the adjustment plate at the top, the support plate and the adjustment plate in the crossed state could slide with each other. Among them, the guide groove of the top support plate was a through hole, while the actuating groove at the top and the guide groove at the bottom were blind holes, which could effectively avoid gas leakage. By rotating the adjustment plate, the pressure could be applied to the adjustment pin, and the sliding vane was driven to move along the arc of the guide groove so that the SSGV could realize the open adjustment. The geometric parameters of the sliding vane and fixed vane at different opening positions are shown in Table 2.
Table 2.
Geometric parameters of the SSGV at different opening positions.
2.2. Numerical Method
The FINETM/Turbo of NUMECA 8.9 software (NUMECA Company, Beijing, China, 2018) was adopted to solve the three-dimensional viscous flow equations in the CFD work. The S-A single equation model was selected as the turbulence model [31,32], and the explicit Runge Kutta method was used as the time term, combined with double time steps and multigrid technology to speed up the calculation convergence. For the steady calculation, the mixed plane method was used to select the R/S interface to ensure the conservation of the gas mass, momentum, and energy. Direct interpolation and the sliding grid method were applied for the interface between the R/S in the unsteady calculation, and the number of physical steps was set to 120. In order to meet the calculation requirements of the viscous boundary layer on the solid turbine wall, it was necessary to control the simulation accuracy of the fluid in the boundary layer; thus, the y+ value of the wall grid near the boundary layer was less than 6 in this work.
For the boundary conditions, the total pressure, total temperature, and inlet air flow angle were given at the turbine inlet, and the average pressure was set as the outlet boundary. The main function of the volute was to encourage the air to flow in a certain direction and evenly distribute the speed in the impeller inlet. If the radial and tangential flow velocity of the airflow were only considered in the volute without considering the friction, according to the conservation of the moment of momentum, the gas flow in the volute is a free vortex motion with the vortex shaft as the axis. The following formula could be obtained by applying the free vortex equation and the continuum equation to the two sections of the volute inlet and the impeller inlet:
In the formula, α is the outlet airflow angle of the volute, and its value is 42°, ρ is the gas density, A and r are the inlet area of the volute and the cross-sectional radius of the volute, in which A1 and A2 represent the volute inlet and outlet, respectively.
2.3. Grid Independence Verification
The structural grid was adopted in both the guide vane and rotor computational domain in this study, which were automatically divided by the IGG/AutoGrid software, and the grid was the O-H type. The topology was divided into five subareas, in which the O-shaped grid was used around the blade, and the H-shaped grid was adopted for the upstream of the leading edge, the downstream of the trailing edge, and the upper and lower mainstream of the guide vane and rotor blade. In particular, the butterfly grid was used at the clearance of the rotor and guide vane to improve the grid quality. Figure 3a,b show the single passage grid of the SSGV and the base model, respectively, in which the total grid number of the base model is 1.1 × 10⁶ and 1.2 × 10⁶ for the SSGV model. The minimum orthogonality of the grid for the two models was greater than 30°, the maximum aspect ratio was less than 500, and the maximum expansion ratio was less than 5.
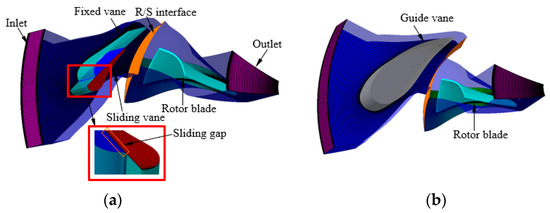
Figure 3.
Single passage computation grid topology of the two models: (a) SSGV single passage calculation grid; (b) base model single passage calculation grid.
Grid independence verification is an important part of numerical calculations since it is necessary to ensure calculation accuracy. In this work, steady numerical analyses were carried out when the two models were fully open. The grid configurations, as well as the variation of isentropic efficiency with the grid numbers for both the base and the SSGV models, are presented in Table 3. It was found that for the base model, the efficiency error was 0.57% for the coarse and medium grids and 0.16% for the fine and medium grids. For the SSGV model, the above error values were 0.61% and 0.14%, respectively. Meanwhile, it was also found that the mass flow errors of the two models could be almost ignored with the change of the grids. In order to capture the details of the flow field more accurately and save the calculation time, the medium grid was chosen for the calculation at last.
Table 3.
Grid independent verification.
2.4. Numerical Verification
In the present work, the aerodynamic performance test of the base model was carried out on a turbocharger flow bench to validate the reliability of the CFD. Figure 4 illustrates the test equipment and instruments of the test bench. In the test, the gas was pressurized to a certain value and heated to a constant temperature with an electric heater to drive the turbine. A compressor coaxial with a turbine acted as a power consumption unit as well as to obtain the shaft power of the turbine. The total temperature and pressure sensors were both installed at the inlet/outlet position of the turbine and compressor to obtain the gas state parameters. The inlet/outlet position sensors of the turbine and compressor, as well as the pipes to and from the sensors, had insulation to reduce heat loss. In addition, the oil that was used for cooling and lubricating the VNT was also measured to calculate the heat loss and thus ensure the test consistency.
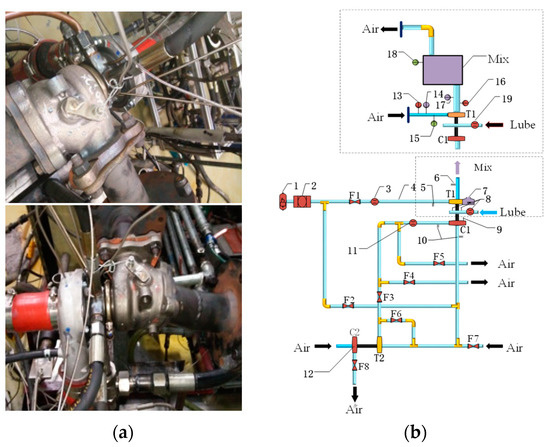
Figure 4.
Schematic of the turbine test: (a) turbine test layout; (b) schematic diagram of the test bench. 1. Air supply; 2. Air cleaner; 3. Flowmeter; 4. Electric heater; 5. Turbine inlet section; 6. Turbine outlet section; 7. Test turbine; 8. Lubricating oil section; 9. Rotational speed meter; 10. Compressor section; 11. Flowmeter; 12. Auxiliary turbocharger; 13. Static pressure sensor; 14. Total pressure sensor; 15.Total temperature sensor; 16. Static pressure sensor; 17. Total pressure sensor; 18. Total temperature sensor; 19. Flowmeter.
The isentropic turbine efficiency can be calculated using the following formula:
where WT0 and WT1 are the isentropic and actual expansion works, respectively, T0 and T2 are the total temperatures at both the turbine inlet and outlet, R is the gas constant, R = 287 J/kg K, cp is the specific heat at constant pressure, P0 is the total pressure of the turbine inlet, P2 is the static pressure of the turbine outlet, π is the expansion ratio, and k is the specific heat ratio, k = 1.4.
As we know, measuring the turbine outlet temperature is always a significant problem in the turbocharger test because of the existence of significant vortex flow at the turbine outlet [20,22]. Therefore, an indirect test method that can avoid measuring the turbine outlet temperature was adopted in this work to obtain the turbine’s actual expansion work, in which the actual compression work of the compressor and the mechanical loss of the bearing are both measured, and WT1 can be calculated using the formulas below:
where WCact is the actual compression work of the compressor, WOil is the mechanical loss of the bearing, mC and mOil are the mass flow rates of the compressor and lubricating oil, respectively, Cp,Air is the specific heat at a constant pressure of air, and Cp,Oil is the specific heat at a constant pressure of lubricating oil.
Figure 5 compares the CFD and test results when the nozzle design is open with a turbine speed of 100 kr/min. It was seen that the CFD results agree well with test data as the change of the expansion ratios. The maximum error for the efficiency between the two is less than 2.5 percent (shown in Figure 5a), and the mass flow error is less than 3 percent (Figure 5b). The difference in the mass flow is mainly because the volute was not included during the simulation; the reduction of the turbine inlet pressure to guide the vane inlet was ignored, thus reducing the turbine flow. The stage efficiency discrepancy is possibly due to the heat and friction loss in the volute that was not captured in the CFD.
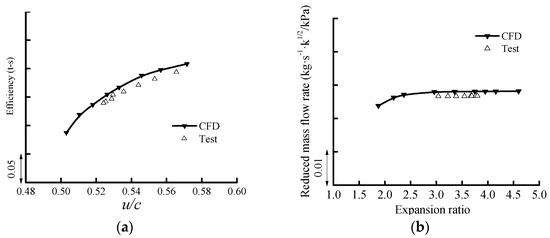
Figure 5.
Result comparison between the CFD and experiment of the base model: (a) turbine efficiency characteristics; (b) turbine mass flow characteristics.
3. Result Analysis
3.1. Performance Comparison
In order to evaluate the overall performance of the base and SSGV model, steady calculations were carried out when the turbine was 10%, 40%, and 100% open. It can be seen from Figure 6a that with an increase in the expansion ratio, the turbine flow increases gradually at each opening. The corresponding flow error of the two models under the same opening was less than 0.3%, and the two curves matched well, indicating that the flow control ability of the SSGV was the same as that of the base model. Figure 6b compares the efficiency of the two models at three opening levels; it can be seen that when 10% open, there was a large efficiency increase for the SSGV at nearly 0.5 u/c compared with that of the base model, and the turbine peak efficiency improvement amplitude reached 12%. In other u/c ranges, the SSGV could also improve the turbine efficiency to varying degrees, showing that the SSGV could effectively reduce turbine flow loss caused by the guide vane clearance leakage flow, especially when the guide vane had small openings. The efficiency improvement when 40% open was lower than that of the 10% opening level, and the peak efficiency increased by 3.7% at a value of 0.55 u/c; when 100% open, there was only an approximate 1% efficiency improvement for the VNT with the SSGV, and the main reason is that the loss caused by the guide vane leakage flow accounted for a small proportion in the total turbine loss at a large opening level of the VNT. Through the above analysis, we can see that the use of an SSGV could improve the turbine efficiency very well, especially when the guide vane has small opening conditions.
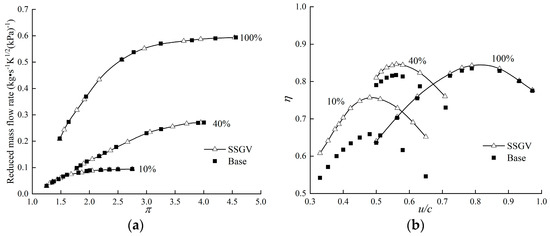
Figure 6.
Performance curves of the two models: (a) turbine mass flow characteristics; (b) turbine efficiency characteristics.
3.2. Leakage Flow Analysis
Considering that the base intention of the SSGV design was to suppress the guide vane clearance leakage flow, it was necessary to further study the leakage in both the guide vane and rotor of the two models. The leakage flow in the guide vane clearance is calculated using the following formula:
where ln and c represent the length and width of the guide vane clearance, respectively, and Vt is the component of the velocity perpendicular to the clearance outlet section.
For the leakage flow in the rotor, Spraker [33] assumed that the velocity in the tip clearance of the rotor blade was of a linear distribution and put forward the following formula:
In the formula above, L is the length of the rotor blade tip clearance, ZB is the number of rotor blades, the coefficient K is measured with a test, and Uc is the average value of the impeller outlet rotating at a linear and gate speed (zero). However, the formula does not consider the influence of the VNT opening and expansion ratio, so the above formula is not accurate for VNTs. Liu [24] revised the above formula for VNTs in the literature, adding the expansion ratio π and the coefficient K1. Therefore, the rotor leakage flow can be calculated with the following revised formula:
where K1 is the correction coefficient, which changes with the VNT opening level. When the turbine is 40% and 10% open, K1 is deduced as 0.25 and 0.18, respectively.
The guide vane and rotor tip leakage flow that correspond to the peak efficiency point of the two models at three opening levels are depicted in Figure 7. It can be clearly found from Figure 7a that the leakage flow of the guide vane of the SSGV model under various opening levels is much lower than that of the base model. In the case when the guide vane is 10% open, the clearance leakage flow of the SSGV is only 43% of the base model, and when the guide vane is 40% open, the value is 51%. When 100% open, the leakage flow is the smallest compared with that of the other two opening levels for the two models (the value of the SSGV is 40% lower than the base model). The above comparisons show that the flow rate of the leakage flow in the SSGV is much lower than that of the base model with the opening level changes. It also indicates that with an increase in guide vane opening, the influence of the clearance leakage on the turbine performance decreases due to the continuous decrease in the flow rate. In terms of the leakage flow in the rotor tip clearance in Figure 7b, the SSGV model is slightly smaller than the base model. When 10%, 40%, and 100% open, the leakage flow of the SSGV is 90%, 92%, and 97% of that of the base model, respectively. Observing the leakage flow trend of the two models, it was found that the leakage flow of the guide vane gradually decreases when increasing the opening, while that of the rotor presents the opposite trend compared with the guide vane. Furthermore, it can also be seen that the leakage flow of the guide vane is much smaller than that in the rotor, showing that the reduction of the leakage flow in the guide vane could improve the rotor leakage, thus, increasing the turbine efficiency.
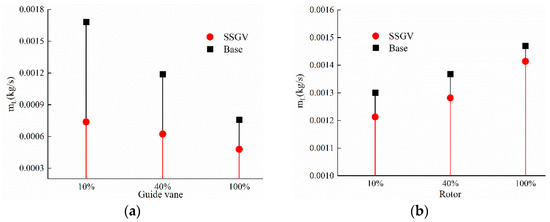
Figure 7.
Comparison of the leakage flow between the two models: (a) guide vane clearance leakage flow; (b) rotor tip clearance leakage flow.
According to Figure 8a, the pressure surface (PS) contour line remains unchanged under different openings for the base model, while for the SSGV model, the pressure line is affected by the relative motion of the sliding and fixed vanes. When 10% open, the fixed vane is located near the volute or away from the rotor, so the static pressure value is unchanged from the vane inlet to approximately 80% of the chord length due to the fact that the flow is not affected by the clearance leakage flow. As the opening increases, the sliding vane gradually moves away from the rotor so that the static pressure on the PS side is affected by the earlier clearance leakage flow. Therefore, when 40% and 10% open, the pressure starts to decrease when the chord lengths are 70% and 60%, respectively. Additionally, because of the interference of the clearance leakage flow under the large opening of the SSGV, the pressure difference on the PS side of the two models gradually shrinks with an increase in the guide vane opening. From line 1 in Figure 8a, it can be seen that the pressure distribution on the suction surface (SS) of the SSGV presents a “W” shape; the static pressure bulge at the position of line 1 is due to the influence of the vane profile at the leading edge of the sliding vane and clearance leakage. The static pressure rises from line 1 and starts to decrease after reaching the position of line 2. The main reason why the static pressure starts to decrease at line 2 is that after the gas flows through the trailing edge of the sliding vane, the fixed vane acts as the SS from this position until its trailing edge. Since the length of the sliding vane is fixed, lines 1 and 2 are nearly parallel. When the guide vane opening increases, the sliding distance of the sliding vane toward the outer diameter increases, therefore the earlier the static pressure protrudes.
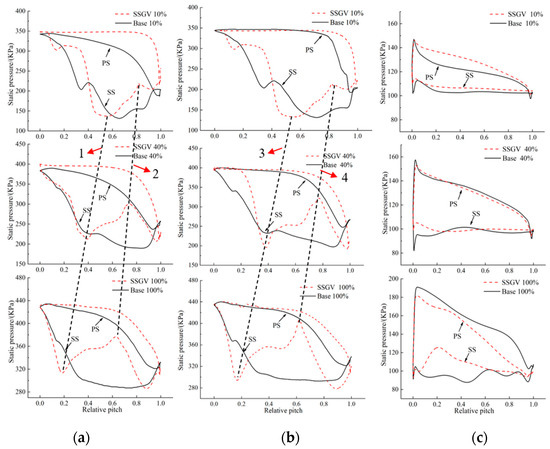
Figure 8.
Pressure distribution of the two models at a 90% and 50% blade height: (a) pressure of the guide vane at a 90% height; (b) pressure of the guide vane at a 50% height; (c) pressure of the rotor blade at a 90% height.
From lines 3 and 4 in Figure 8b, it can be seen that under different guide vane openings, the static pressure distribution of the SSGV model has the same trend as the base model. Since the PS side of the guide vane is not affected by the clearance leakage flow at 50% of the vane height, the static pressure as the chord length declines more slowly compared with that of the 90% vane height for the base model, especially from the leading edge to approximately 50% of the chord length of the guide vane. The PS side of the SSGV model has almost the same static pressure distribution at 90% and 50% vane heights because of the weakening of the clearance leakage. With an increase in the vane opening, the static pressure distribution of the two models at 90% and 50% vane heights is almost the same. For the guide vane’s SS side, the flow loss caused by the guide vane geometry is the same at the 50% and 90% vane height positions, but the pressure of the 50% vane height is greater than the 90% vane height because it is not affected by the clearance leakage flow.
From Figure 8b, it is known that when the guide vane gradually closes, the reaction degree of the turbine decreases; that is, the enthalpy drop of the flow occurs more in the nozzle, leading to the reduction of rotor clearance leakage flow. By comparing the two figures, it can be seen that when 10% open, the static pressure of the rotor blade at the PS side is larger than that of the base model since the nozzle leakage flow of the SSGV is smaller than the base model. When 40% open, the two models have almost the same pressure distribution on the PS side since the influence of the guide vane clearance leakage flow gradually decreases; when 100% open, the guide vane shape loss and angle of attack loss account for the main parts of the total loss, so the PS side pressure of the SSGV is smaller than the base model.
3.3. Flow and Loss in the Rotor
Figure 9 shows the entropy and streamlined distribution of three rotor inlet passages for the base and SSGV model when 40% open, which could qualitatively analyze the flow and loss distribution characteristics. It can be seen that the clearance leakage flow caused by the upstream guide vane on both the hub and shroud sides of the rotor is the dominant factor of the flow loss, and the second is the wake loss. There are dense flow lines on the upper and lower sides, representing the leakage vortex transported downstream with the mainstream. As the leakage flow intensity in the clearance of the SSGV is greatly weakened, the loss caused by the leakage vortex is greatly reduced compared with the base model. From Figure 9a, it can be seen that for the base model, the wake at the rotor inlet interface is squeezed by the leakage flow at both ends, showing an obvious “C” shape, while this phenomenon does not appear in the SSGV model in Figure 9b. This is because the leakage flow of the SSGV is well restrained, and the squeezing effect of the leakage flow on the wake is also weakened. Moreover, with an increase in the R/S distance, the guide vane leakage flow could not effectively affect the wake of the adjacent trailing edge.
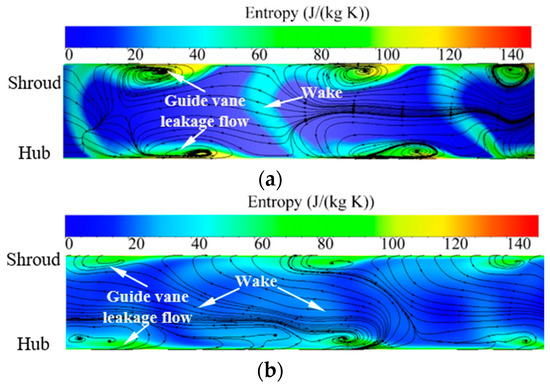
Figure 9.
Streamline and loss distribution diagram at the rotor inlet of the two models: (a) streamline and loss of the base model; (b) streamline and loss of the SSGV model.
The entropy and leakage flow distributions in the rotor passage of the two models at the 40% opening are shown in Figure 10; it can be seen that there are three main reasons for the flow loss in the rotor passage: the flow separation vortex occurring at the leading edge of the rotor marked by red streamlines, the upstream guide vane clearance leakage flow represented by a black streamline, and the rotor tip clearance leakage flow shown with a blue streamline in Figure 10a,b. It was found that the flow separation vortices are generated at the leading edge of the rotor, which formed a significant flow loss in the rotor passage and led to a high entropy region in the rotor passage. Affected by the guide vane shape, the inlet angle of attack of the SSGV was larger than that of the base model; thus, the entropy corresponding to the leading edge suction surface was also slightly higher. Additionally, because of the large guide vane leakage flow at both the vane top and bottom sides, the separation vortex produced greater flow loss along with the downstream direction for the base model and produced an effect similar to a “negative jet”, hindering the amplification of the separation vortex.
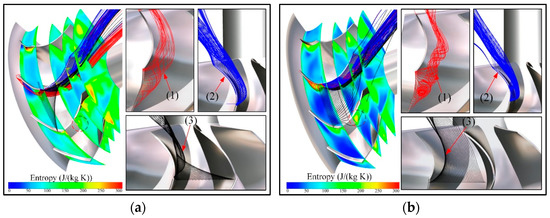
Figure 10.
Flow and loss in the rotor for the two models at a 40% opening: (a) base model; (b) SSGV model. (1) Rotor leading edge vortex; (2) rotor tip leakage flow; (3) guide vane clearance leakage flow.
From the entropy distribution, it was discovered that the loss caused by the angle of attack for the SSGV model was larger than that of the base model. However, the loss induced by the guide vane leakage flow to the downstream rotor, as well as the leakage flow of the rotor tip clearance for the SSGV model, were much smaller than that of the base model. In general, the loss of the SSGV in the rotor passage was much smaller than that of the base model, and the main contribution is still from the weakening of the guide vane leakage flow.
4. Shock and Rotor Blade Load Fluctuations
4.1. Shock Distribution at the Transition Region between the Rotor and Stator
In order to more intuitively analyze the shock morphology and intensity, the circumferential gradient of the static pressure was compared between the rotor and guide vane of the two models. The circumferential gradient of the static pressure was defined as follows:
where p is static pressure and θ is the circumferential angle.
Figure 11 shows the static pressure circumferential gradient distribution of multiple sections of the two models at a 40% opening at the expansion ratio of 3.5, showing the propagation process of the shock at the transition region between the rotor and stator. It was discovered that after the “a” and “b” shocks were generated, their intensity first increased and then decreased as they propagated downstream and reached their maximum in the middle of the transition region between the rotor and stator. By comparing the shocks at the “a” and “b” positions in Figure 11a,b, it was found that the shock at “a” was significantly greater than that at “b”, indicating that in the process of the high-speed rotation of the rotor, when the shock gradually approaches the rotor blade, its intensity also gradually increases; otherwise, it gradually decreases. The two models show that the shock intensity of the SSGV model is much weaker than that of the base model, and the main reason is that the distance between the rotor and stator is widened for the SSGV, thus reducing the acceleration ability of the airflow.
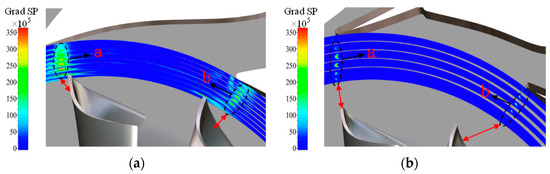
Figure 11.
Variation of the shock propagation process: (a) base model; (b) SSGV model.
Figure 12 shows the trend of the static pressure gradient for the base and SSGV model at a 40% opening at the nozzle trailing edge and rotor leading edge. It can be seen from Figure 12a that the peak value of the shock at the trailing edge of the SSGV is slightly lower than that of the base model. This is because the shock intensity is related to the leakage flow degree of the guide vane clearance. Since the leakage degree of the SSGV at both the hub and shroud clearance is smaller than that of the base model, the intensity of the leakage vortex is also weak; thus, the area occupied by the leakage vortex decreases, and the acceleration effect of its aerodynamic throat is relatively small, which could accordingly reduce the shock intensity at the guide vane trailing edge. From Figure 12b, the static pressure gradient values of the two models change greatly at the leading edge of the rotor, and the maximum value of the SSGV is significantly less than that of the base model. The maximum static pressure gradient of the base model from the guide vane trailing edge to the rotor leading edge decreased by only approximately 1%, while that of the SSGV decreased by approximately 54%. The results indicate that the shock intensity at the rotor leading edge for the SSGV is much lower than the base model, which would improve the reliability of the rotor blades.
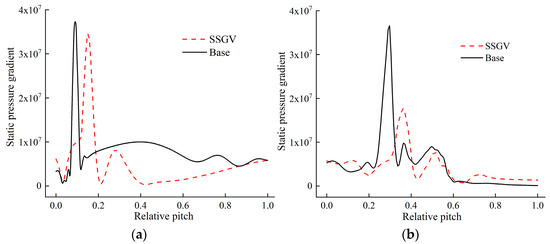
Figure 12.
Shock distribution at the guide vane trailing edge and rotor leading edge of the two models: (a) shock distribution at the guide vane trailing edge; (b) shock distribution at the rotor leading edge.
The periodic interference between the rotor and stator would lead to different shapes and intensities of shock at different times. In order to better observe the change of the shock with time, unsteady studies were carried out in this work. Figure 13 shows the time-space diagram of the shock at the middle vane height of the two models. It was found that the shock of the two models showed obvious periodic fluctuations. When the rotor leading edge was close to the guide vane trailing edge, the strip brightness increased and indicated that the shock intensity increased; conversely, when the leading edge of the rotor blade was far away from the guide vane trailing edge, the shock intensity decreased. By comparing the shock bands of the two models, it was found that the starting position of the shock at the guide vane trailing edge was different. The shock position of the SSGV was significantly earlier than that of the base model, which changed from a 0.6 relative pitch position while that of the base model was 0.73, and the specific reason for this phenomenon is that the location of shock also changed due to the different shapes of the SSGV and base models. Since the distance between the guide vane and rotor was increased, the global and maximum shock intensity for the SSGV was also better attenuated compared to the base model.
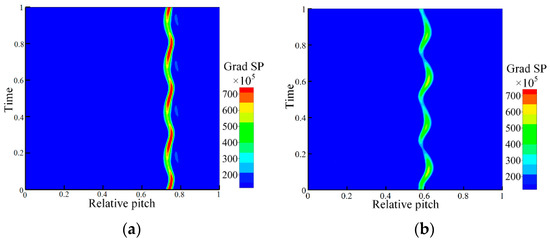
Figure 13.
Time-space diagram of the shock at the middle vane height of the two models: (a) base model; (b) SSGV model.
4.2. Rotor Blade Load Fluctuations
Figure 14 shows the load distribution of the two models at 50% and 95% rotor blade height at a 40% nozzle opening to further study the influence of the guide vane leakage flow and shock on the downstream rotor blade. The load presents the pressure difference between the pressure surface and the suction surface of the rotor blade in this study. It can be seen that the maximum load appears at the leading edge of the blade for the two models, and the blade load fluctuates periodically along the time direction. Since the ratio of the number of rotors and guide vanes of the two models is 4:3, there are three load fluctuations in one time cycle. At the 95% and 50% blade heights, the main influences on the blade loads are the nozzle clearance leakage flow and shock, respectively. At the 50% blade height shown in Figure 14a,b, both the maximum load and load fluctuation amplitude for the base model are higher than that of the SSGV since the shock intensity of it is stronger. At the 95% height, shown in Figure 14c,d, it is worth noting that the loads of the two models show the characteristic “double peaks” at the leading edge of the blade. The influence range of the first peak is small, but the peak is high, and the influence range of the second peak is large, but the peak is small. The first peak is caused by the gas separation at the rotor leading edge. After the separation vortex is generated at the leading edge of the rotor blade’s suction side, it would periodically experience the process of falling off and reappearing over time, and the process of falling off of the separation vortex is different from the cycle of the leakage flow acting on the rotor, which occurs only twice in a cycle. The second peak is caused by the guide vane leakage flow adhering to the suction face downstream for a long time. For the first peak, the flow angle at the guide vane outlet of the base model is larger, so the separation is more serious. Since the leakage flow in the guide vane clearance of the SSGV is much smaller than that of the base model, the second peak is also smaller than that of the base model. In addition, the interference intensity and action of the guide vane trailing edge shock on the rotor blade gradually decreases along the chord length direction, so the load values and load fluctuation amplitude of the two models along the chord length direction also gradually decrease, thus, the reliability of the SSGV is further verified.
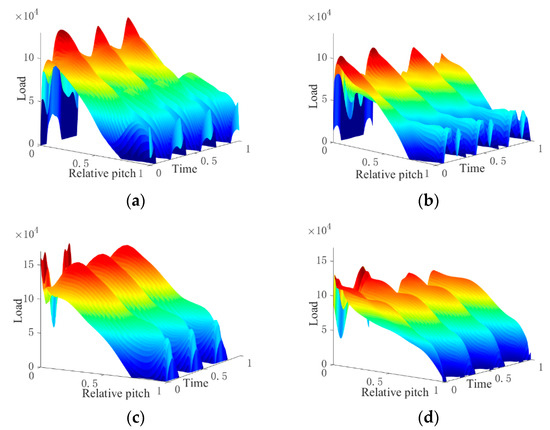
Figure 14.
Rotor blade load fluctuation at the 50% and 95% height of the two models: (a) base model at 50% of the blade height; (b) SSGV model at 50% of the blade height; (c) base model at 95% of the blade height; (d) SSGV model at 95% of the blade height.
4.3. Shock Validation
In the present work, the shock test was performed to validate the numerical method. Due to the high-frequency vibration of the turbocharger when rotating at high speed, the shock wave capture could not be realized. Therefore, the linear nozzle was used, and the impeller was abandoned for the shock test. The shock test bench is composed of an air path and a light path, as shown in Figure 15. The gas is supplied by a screw compressor and heated to a constant temperature with a combustion chamber. The valve and oil gas filter is opened, and the bypass valve is closed. Then, the gas flows through the temperature and pressure sensors arranged at the linear nozzle inlet and enters the visual casing. The diameter of the round hole of the casing can be seen to cover a set of linear nozzles, and a K9 optical glass is set to observe the shock waves. In the optical path system, strong light is generated by the light source, and the strong light is reflected to the parabolic mirror to generate parallel beams, which are captured by the light receiving system for imaging and captured by the high-speed camera, and input into the acquisition system for image processing. During the test, a luminescent system and the light-receiving system are required to be on the same optical axis, which is convenient for image measurement and acquisition. The schlieren experimental system design is shown in Figure 15.
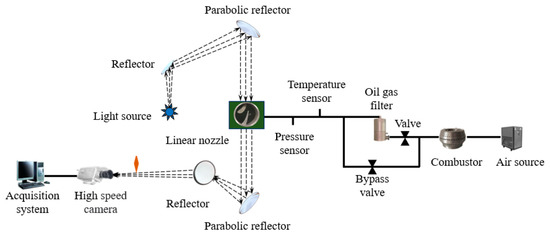
Figure 15.
Schematic of the shock test.
The shock that was obtained with the CFD and experiments are shown in Figure 16a,b at the expansion ratio of 2.0 and 2.2, respectively. Because the oil gas could not be completely removed with the filter, wakes, leakage flows and shocks were all observed during the test. By comparing the two figures, it can be seen that when the expansion ratio is two, obvious shocks, wakes, and leakage flow can be observed, and the positions and shapes of the shock are the same as the CFD calculation results. When the expansion ratio increases to 2.2, the shock begins to move to the trailing edge position since the airflow acceleration is stronger at this time, so the intensity of clearance leakage flow also increases. The comparison between the numerical and experimental results proves the effectiveness of the numerical method adopted in this work.
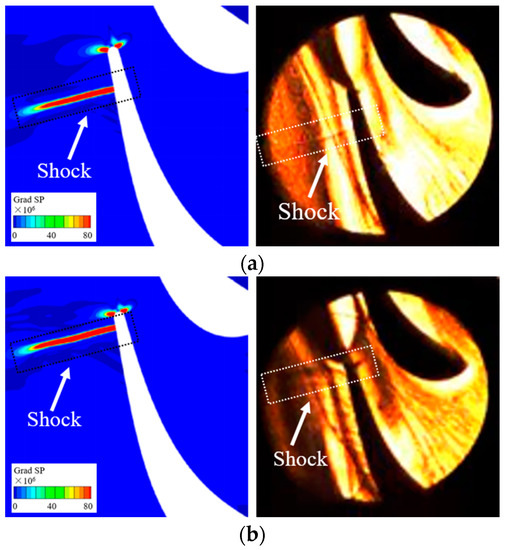
Figure 16.
Shocks of the base model for the CFD and experiment at different expansion ratios: (a) shock at a 2.0 expansion ratio; (b) shock at a 2.2 expansion ratio.
5. Conclusions
In view of the guide vane leakage flow and shock, as well as their influence on downstream rotor blades, the SSGV and base models are analyzed in the present work. The results show that the SSGV could not only improve the global performance of VNTs, but also reduces the shock intensity, thus, improving the reliability of the rotor blade. The main conclusions are as follows:
- (1)
- The SSGV could better inhibit the guide vane and rotor clearance leakage flow, thus improving the global performance of VNTs, especially at small guide vane openings. In this work, the SSGV could increase the VNT performance by 12% at a 10% opening since the guide vane clearance leakage flow was decreased by 57%.
- (2)
- Due to the special vane shape of the SSGV, the angle of attack of the airflow at the rotor leading edge was greater than that of the base model, resulting in strong gas separation vortices and flow loss in the rotor. Therefore, reducing the flow loss caused by its own geometric factors is an important problem to be considered in the design of the SSGV.
- (3)
- In the rotor-stator transition region, when the shock gradually approached the rotor blade, its intensity also gradually increased. Otherwise, it gradually decreased. Since the distance between the rotor and stator was enlarged for the SSGV, its shock intensity was much weaker than that of the base model.
- (4)
- By comparing the load distribution characteristics of the rotor blades of the two models in a rotation period, it was found that since the guide vane leakage flow and shock were weakened, the load amplitude, as well as the degree of load fluctuation, were both reduced to a certain extent for the SSGV model, indicating that using of an SSGV for a VNT could enhance the reliability of the rotor.
Author Contributions
Conceptualization, methodology, software, validation, D.Y. and H.W.; formal analysis, investigation, D.Y. and K.W.; resources, X.L.; data curation, L.H.; writing—original draft preparation, Q.Z.; writing—review and editing, L.H.; visualization, Q.Z.; supervision, X.L.; project administration, D.Y. All authors have read and agreed to the published version of the manuscript.
Funding
This work was financially supported by the National Natural Science Foundation of China grant number 52006027 and the Natural Science Foundation of Hebei Province grant number E2021501028 and the Central University Basic Scientific Research Business Fee Funding Project grant number N2123027.
Institutional Review Board Statement
Not applicable.
Informed Consent Statement
Not applicable.
Data Availability Statement
Not applicable.
Acknowledgments
The authors are grateful to Mingxu Qi of BIT, who provided the shock wave test bench, and the research and innovation center of Ford, who provided the base model of the VNT.
Conflicts of Interest
The authors declare no conflict of interest.
Nomenclature
| VNT | Variable nozzle turbine |
| VGT | Variable geometry turbine |
| S-A | Spalar-Allmaras |
| R/S | Rotor and Stator |
| SSGV | Split sliding guide vane |
| CFD | Computational Fluid Dynamics |
| u/c | Velocity ratio |
| m | Mass flow rate |
| π | Expansion ratio |
| η | Efficiency |
| PS | Pressure surface |
| SS | Suction surface |
| SP | Static pressure |
References
- Kagawa, J. Health effects of diesel exhaust emissions-a mixture of air pollutants of worldwide concern. Toxicology 2002, 181, 349–353. [Google Scholar] [CrossRef]
- Shi, M.; Wang, H.; Yang, C.; Wang, Y.; Niu, X. Experimental Research on the Matching Characteristics of the Compound VGT-STC System with a V-Type Diesel Engine. Machines 2022, 10, 788. [Google Scholar] [CrossRef]
- Effect of Nozzle Vane and Rotor Clearance on Performance of Variable Nozzle Turbine. J. Therm. Sci. 2022, 31, 1745–1758. [CrossRef]
- Zhao, B.; Yang, C.; Hu, L.; Sun, H.; Yi, J.; Eric, C.; Shi, X.; Engeda, A. Understanding of the interaction between tip leakage flow and main passage flow in a VGT turbine. Adv. Mech. Eng. 2015, 7, 652769. [Google Scholar] [CrossRef]
- Viskup, R.; Alberer, D.; Oppenauer, K.; del Re, L. Measurement of Transient PM Emissions in Diesel Engine; SAE Technical Paper; SAE: Detroit, MI, USA, 2011. [Google Scholar]
- Ishii, M.; Shimokawa, K.; Machida, K.; Nakajima, H. A Study on Improving Fuel Consumption of Heavy-Duty Diesel Engine Specifically Designed for Long-Haul Trucks on Highway; SAE 2015 World Congress and Exhibition; SAE: Detroit, MI, USA, 2015. [Google Scholar]
- Spence, S.W.T.; O’neill, J.W.; Cunningham, G. An investigation of the flowfield through a variable geometry turbine stator with vane endwall clearance. Proc. IMechE Part A J. Power Energy 2006, 220, 899–910. [Google Scholar] [CrossRef]
- Hu, L.; Sun, H.; Yi, J.; Curtis, E.; Zhang, J. Investigation of Nozzle Clearance Effects on a Radial Turbine: Aerodynamic Performance and Forced Response; SAE Technical Paper; SAE: Detroit, MI, USA, 2013. [Google Scholar]
- Chen, H. Turbine wheel design for Garrett advancd variable geometry turbines for commercial vehicle applications. In Proceedings of the 8th ICTT, London, UK, 17–18 May 2006; pp. 317–327. [Google Scholar]
- Kawakubo, T. Unsteady Rotor-Stator Interaction of a Radial-Inflow Turbine with Variable Nozzle Vanes. In Proceedings of the ASME Turbo Expo 2010: Power for Land, Sea, and Air, Glasgow, UK, 14–18 June 2010; paper GT2010-23677; ASME: New York, NY, USA, 2010. [Google Scholar]
- Qi, M.; Lei, X.; Wang, Z.; Ma, C. Investigation on the flow characteristics of a VNT turbine under pulsating flow conditions. Proc. IMechE Part D J. Automob. Eng. 2018, 233, 396–412. [Google Scholar] [CrossRef]
- Yang, D.; Yang, C.; Lao, D.; Zeng, T. A detailed investigation of a variable nozzle turbine with novel forepart rotation guide vane. Proc. IMechE Part D J. Automob. Eng. 2019, 233, 994–1007. [Google Scholar] [CrossRef]
- Taghavi-Zenouz, R.; Behbahani MH, A. Improvement of aerodynamic performance of a low speed axial compressor rotor blade row through air injection. Aerosp. Sci. Technol. 2018, 72, 409–417. [Google Scholar] [CrossRef]
- Künzelmann, M.; Urban, R.; Mailach, R. Active flow control at a 1.5-stage low-speed research compressor with varying rotor tip clearance. Proc. Inst. Mech. Eng. Part A J. Power Energy 2011, 225, 886–896. [Google Scholar] [CrossRef]
- Bindon, J.P. The Measurement and formation of tip clearance loss. J. Turbomach. 1989, 111, 257–263. [Google Scholar] [CrossRef]
- Masashi, F.; Masatoshi, W.; Tetsuo, U. Compressible Turlent Flow Analysis on Variable Nozzle Vane and Spacer in Turbocharger Turbine; SAE Paper; SAE: Detroit, MI, USA, 2000. [Google Scholar]
- Vemula, R. Turbocharger with Variable Turbine Geometry Having Grooved Guide Vanes. U.S. US10138744B2, 14 February 2018. [Google Scholar]
- Walkingshaw, J.; Spence, S.; Ehrhard, J.; Thornhill, D. An experimental assessment of the effects of stator vane tip clearance location and back swept blading on an automotive variable geometry turbocharger. J. Turbomach. 2014, 136, 927–937. [Google Scholar] [CrossRef]
- Ben ZH, A.O.; Leilei WA, N.G.; Hongjun HO, U. Numerical analysis for impacts of nozzle end-clearances on aerodynamic performance and forced response in a VNT turbine. Chin. J. Aeronaut. 2018, 31, 168–178. [Google Scholar]
- Zhang, H.; Lao, D.; Yang, C.; Yang, D.; Hou, X.; Wang, X. Internal flow characteristics of a variable mixed flow turbine with partially-rotating vane nozzle. J. Mech. Sci. Technol. 2017, 31, 4977–4987. [Google Scholar] [CrossRef]
- Chen, H.; Huang, L. Variable Geometry Turbine Nozzle Design for High Expansio Ratios. In Proceedings of the ASME Turbo Expo 2018: Power for Land, Sea, and Air, Oslo, Norway, 11–15 June 2018; paper GT2018-57013; ASME: New York, NY, USA, 2018. [Google Scholar]
- Yang, D.; Lao, D.; Yang, C.; Hu, L.; Sun, H. Investigations on the Generation and Weakening of Shock Wave in a Radial Turbine with Variable Guide Vanes. In Proceedings of the ASME Turbo Expo 2016: Power for Land, Sea, and Air, Seoul, South Korea, 13–17 June 2016; paper GT2016-57047; ASME: New York, NY, USA, 2016. [Google Scholar]
- Sonoda, T.; Arima, T.; Olhofer, M.; Sendhoff, B.; Kost, F.T.; Giess, P.A. A Study of Advanced High Loaded Transonic Turbine Airfoils. In Proceedings of the ASME Turbo Expo 2004: Power for Land, Sea, and Air, Vienna, Austria, 14–17 June 2004; paper GT2004-53773; ASME: New York, NY, USA, 2004. [Google Scholar]
- Lei, X.; Qi, M.; Sun, H.; Hu, L. Investigation on the shock control using grooved surface in a linear turbine nozzle. J. Turbomach. 2017, 139, 121008. [Google Scholar] [CrossRef]
- Zhao, B.; Sun, H.; Shi, X.; Qi, M.; Guo, S. Investigation of using multi-shockwave system instead of single normal shock for improving radial inflow turbine reliability. Int. J. Heat Fluid Flow 2018, 71, 170–178. [Google Scholar] [CrossRef]
- Liu, Y.; Lao, D.; Liu, Y.; Yang, C.; Qi, M. Investigation on the Effects of Nozzle Openings for a Radial Turbine with Variable Nozzle; SAE International: Detroit, MI, USA, 2014; No. 14PFL-0879. [Google Scholar]
- Denton, J.D.; Xu, L. The trailing edge loss of transonic turbine blades. J. Turbomach. 1990, 112, 277. [Google Scholar] [CrossRef]
- Liu, Y.; Yang, C.; Qi, M.; Zhang, H.; Zhao, B. Shock, Leakage Flow and Wake Interactions in a Radial Turbine with Variable Guide Vanes. In Proceedings of the ASME Turbo Expo 2014: Power for Land, Sea, and Air, Düsseldorf, Germany, 16–20 June 2014; paper GT2014-25888; ASME: New York, NY, USA, 2014. [Google Scholar]
- Stephen, S.M.; Seiler, M.; Schaefer, O. Blade excitation in pulse-charged mixed-flow turbocharger turbines. J. Turbomach. 2011, 133, 021012. [Google Scholar]
- Kulkarni, A.; Tisserant, D.; Hosny, D.; Liang, E.; Krishnaraja, N. Turbine Wheel High Cycle Fatigue Reliability Prediction; ASME Paper; SAE: Detroit, MI, USA, 2010; pp. 171–181. [Google Scholar]
- Galindo, J.; Fajardo, P.; Navarro, R.; García-Cuevas, L.M. Characterization of a radial turbocharger turbine in pulsating flow by means of CFD and its application to engine modeling. Appl. Energy 2013, 103, 116–127. [Google Scholar] [CrossRef]
- Zhang, J.; Zhuge, W.; Hu, L.; Li, S. Design of Turbocharger Variable Nozzle. In Proceedings of the ASME Turbo Expo 2007: Power for Land, Sea, and Air, Montreal, QC, Canada, 14–17 May 2007; paper GT2007-27562. ASME: New York, NY, USA, 2007. [Google Scholar]
- Spraker, N. Contour Clearance Losses in Radial Inflow Turbines for Turbochargers; ASME Paper, No. 87-ICE-52; ASME: New York, NY, USA, 1987. [Google Scholar]


Publisher’s Note: MDPI stays neutral with regard to jurisdictional claims in published maps and institutional affiliations. |
© 2022 by the authors. Licensee MDPI, Basel, Switzerland. This article is an open access article distributed under the terms and conditions of the Creative Commons Attribution (CC BY) license (https://creativecommons.org/licenses/by/4.0/).