Article

Hydrodynamics Simulations and Analyses of a Fluid Lubricated Screw-Nut Pair

1
School of Mechanical Engineering, Shandong University, Jinan 250061, China
2
Key Laboratory of High Efficiency and Clean Mechanical Manufacture of Ministry of Education, Jinan 250061, China
*
Author to whom correspondence should be addressed.
Machines 2022, 10(11), 970; https://doi.org/10.3390/machines10110970
Submission received: 12 September 2022 / Revised: 18 October 2022 / Accepted: 20 October 2022 / Published: 24 October 2022
(This article belongs to the Section Advanced Manufacturing)

Abstract

:
A new method is proposed to solve the hydrodynamics performances of a fluid lubricated screw-nut pair using FLUENT. Before the simulations, the Computational Fluid Dynamics (CFD) model of the gap flow field is built, based on some approximation rules. During the simulations, the dynamic mesh technology is employed to realize the real-time update of the grids of the computational domain. For a given velocity perturbation, the stiffness and damping coefficients of the system are solved using the finite difference method, and the influences of the perturbations on the system are compared among different ranges. With the fluid–solid interaction and the real-time restriction of the restrictors considered, the system is solved under different loading conditions. A more accurate solution method for the dynamic stiffness and damping coefficients is provided, and the dynamics characteristics of the system after loading are analyzed. On this basis, a qualitative and quantitative comparison is carried out between the method based on the simplified Reynolds equation and the proposed method in this paper, showing the latter superiorities in illustrating the field. A general understanding of the dynamics properties under different loading conditions of the system is obtained through this research, providing a basis for the precision control of the system in the future research.

1. Introduction

The screw-nut pair is a kind of mechanical linear actuator that converts a rotational motion into a linear motion, and it is widely used in various types of industrial equipment, such as machine tools, presses, and jacks [1,2,3]. With the development of precision manufacturing technology, the requirements for the precision of machine tools are becoming higher and higher. As an important transmission mechanism in machine tools, the screw-nut pair is taken as the key to improving the transmission accuracy of the system. In the precision manufacturing and processing fields, the fluid lubricated screw-nut pair is often used to replace the ball screw-nut pair, because of its excellent lubrication and damping of vibrations. In order to control the accuracy of the system more effectively, it is necessary to study its transmission mechanism and hydrodynamics characteristics. A series of numerical simulations are usually carried out to increase the understanding of a physical process in many engineering applications. When some problems that do not meet expectations occur, the system can be modified and improved in a timely way, enhancing the reliability of the system and shortening the developing period and cost.
Numerical modeling is the basis of numerical simulation. Scholars usually simplify the hydrostatic and aerostatic leadscrews into the series connections of various thrust bearings, using diverse approaches. For example, the helical gap flow field was simplified as multiple annular flow fields through the axial projection, by such scholars as Matataro and Akira [4], Satomi and Yamamoto [5], Shen [6], Luo and Zhao [7], Zhong [8], and Xin [9]. With the lead angle and thread angle considered, El-Sayed and Khataan [10,11,12] expanded the intermeshing helicoids within a pitch into a pair of annular-sector planes, according to some approximate rules. On this basis, the pressure distribution of the gap flow field of an aerostatic lead screw within a pitch was obtained by Susumu [13], and simulation analyses of the hydrostatic lead screws under different driving modes were performed in MATLAB by Zhang [14,15,16,17], Lu [18] and Liu [19].
In the above research into fluid lubricated nut-screw pairs, the judgment of the flow regime was not carried out, and the flows were almost assumed as laminar for the sake of simplicity. A parameter named the Reynolds number was proposed by Osborne Reynolds to predict the flow regime of the pipe flow, and its critical value was then put forward [20]. On this basis, the methods for calculating Reynolds numbers and the critical values were developed to judge the flow regimes in computational domains with different geometric shapes. For example, the flow between two plane parallel surfaces in [21] was regarded as a flow in a wide duct, and therefore the way in which the flow regime was judged was consistent with that in the rectangular duct cases. At present, the mature applications, in which the Reynolds number is used to judge the flow regime, focus on various pipe flows and their extensions. In this research, apart from the pipe flow in the restrictor, there is not only a shear flow, but also Poiseuille flow, due to diffusion from the recess. And besides, there are also flows in the direction of the oil film thickness when the system is loaded. For such flow involved in this research, currently there are few convincing researches in which the formulas for Reynolds numbers and the critical values were put forward to judge the flow regimes. If the flow regime in the recesses and sealing surfaces in this research is judged according to the methods applicable to the pipe flows, in order to calculate the Reynolds number, the flow in the gap flow field would be assumed to be unidirectional, as with the pipe flows, to obtain a mean velocity, and the motions of boundaries of the computational domain would also be ignored.
The velocity and displacement of the table in the axial direction are the focus of the research into the fluid lubricated nut-screw pairs, and any factor associated with the thickness of the gap fluid may play a role in their variations. Especially in a high-precision system, due to the narrow gap between the screw and the nut, a small change of any parameter may produce a considerable influence on the motion accuracy of the table. If the flow regime in this research is judged according to the methods applicable to the pipe flows, the mean velocity would be obtained at the expense of the motions in the other two directions. Although the velocity in the shear flow is much larger than those in the other two directions, this research comes from a precision manufacturing and processing project, which aims at improving the accuracy of the motion in the direction of the oil film thickness. Therefore, apart from the flow in the restrictor, the flows in the recesses and sealing surfaces cannot be considered as simple pipe flows in this research, and such an operation, in which the flow regime is judged through a mean velocity, is obviously not suitable for this research.
Therefore, the qualitative judgment method was employed to judge the flow regime in this research, according to the definitions of the laminar and turbulent flows. The fluid in the laminar flow tends to flow without lateral mixing, and there are no cross-currents perpendicular to the direction of flow. However, in contrast to a laminar flow, the turbulent flow is irregular and very complex [22]. Most flows occurring in nature or created in engineering applications are turbulent. According to the above analyses, the flow in this research is obviously complex, owing to the irregular mixing of multiple flows. Therefore, the flow was considered as turbulent in this research.
The time-averaged method is usually employed to solve the turbulent field, and any flow variable of the fluid particle is considered to be the composition of a time-averaged component and a fluctuation component [23]. The Reynolds-averaged Navier–Stokes equation is then deduced from the Navier–Stokes equation, according to the thought. The generation of Reynolds stress in the process leads to some auxiliary equations being required to enclose the flow equations, which is usually realized using some turbulent models in the Computational Fluid Dynamics (CFD) software at the present time. However, the new variables were neglected for convenience in the above numerical research, when the Reynolds equations were deduced from the Navier–Stokes equations using the averaging method. That is, the influence of the turbulent fluctuation on the average flow was neglected, and the flow in the field was regarded as laminar. Meanwhile, for the sake of simplicity, not only were the inertia term and the viscous force term ignored or greatly simplified, but also the momentum equation in the direction of the gap thickness was neglected, due to the narrow size of the clearance.
As mentioned above, the core of this research lies in the dynamic characteristics in the direction of the oil film thickness. When the Reynolds stress is ignored, the effect of the turbulent fluctuation on the average flow would be not considered, which would heavily affect the fluid pressure applied to the screw and nut, and reduce the accuracy of the simulation. Hence, the flow cannot be assumed as laminar directly for the sake of simplicity, like the flows in some fluid lubricated bearings. Furthermore, the neglect or simplification of the inertia force and the viscous force would result in the variation of the fluid pressure acting on the screw and nut as well, impacting on the axial motion of the table. In addition, the neglect of the pressure and velocity gradients in the direction of the gap thickness is also inadvisable in a system whose accuracy is of a high standard.
A comparison based on the dynamic coefficients of sliding bearings was made between the method based on the simplified Reynolds Equation and the CFD method by Troy and Minel [24], and it was found that the dynamic coefficients of the bearings with the complex geometric features and physics were very difficult, or even impossible to be described by the simplified Reynolds Equation. It was proved by Sahlin, Mori, Tucker, et al. [25,26,27] that the CFD method was superior to the simplified Reynolds equation in illustrating the complex flows.
Moreover, in the previous numerical research into the lubricated screw-nut pairs, an active mode, in which the solution process started from a given displacement fluctuation, was adopted, when the dynamics characteristics of the loaded system were solved. Ignoring the interaction between fluid and solid, the field was solved on the basis of the conditions set in advance, and then, within each unit angle the solution was iteratively modified, according to the kinetic equilibrium theory. Hence the variation of the clearance was a constant under a constant external load and angular velocity of the screw, when the geometric and manufacturing errors were not taken into consideration. However, the fluctuations of the velocity and the displacement vary with the dynamics state of the system, and cannot be given in advance in practical industries. Furthermore, an absolute dynamic equilibrium is absent, due to the turbulent fluctuation and the interaction between the fluid and the solid. Consequently, there is a non-ignorable deviation between the results based on the previous method and the actual flow field.
With the development of computational fluid dynamics, professional software such as FLUENT is widely used in various computational fluid researches [28,29,30]. Apart from a wide range of applications, there are a variety of solution models and methods in FLUENT which have been confirmed by the projects, resulting in the CFD model being solved with the most ideal solution of speed and accuracy. Furthermore, a friendly user interface is provided in FLUENT, and the flow condition at any time can be visualized.
In view of the disadvantages of the existing method, with the physical model simplified using the approximation approaches proposed by El-Sayed and Khataan [10,11,12], it was proposed that the turbulent models in FLUENT were employed to solve the Reynolds stress created in the time-averaged process. In addition, the dynamics characteristics of the system were solved in a passive mode, using the dynamic mesh technology in FLUENT, realizing the fluid–solid coupling. With such operations, the simulation results can be closer to the actual flow conditions than those based on the previous method.

2. Materials and Methods

2.1. CFD Modelling for the Gap Flow Field of a Fluid Lubricated Screw-Nut Pair

2.1.1. Simplification for the Fluid Domain

According to [10,11,12], as shown in Figure 1, the green helical surface within a pitch is developed into an annulus-sector plane in yellow, and there are the following relationships between the surfaces before and after the unfolding:
θ sec _ m = 2 π K
r sec _ i = r h _ i K i
r sec _ o = r h _ o K o
r sec = r h + e
K = cos α ( 1 r h _ i r h _ o ) ( sec λ o ( r h _ i 2 r h _ o 2 + ta n 2 λ o ) 1 2 )
K i = 1 Kcos λ i
K o = 1 Kcos λ o
e = r h _ o cos α ( r h _ o r h _ i r h _ o r h _ i cos λ o cos λ i 1 )
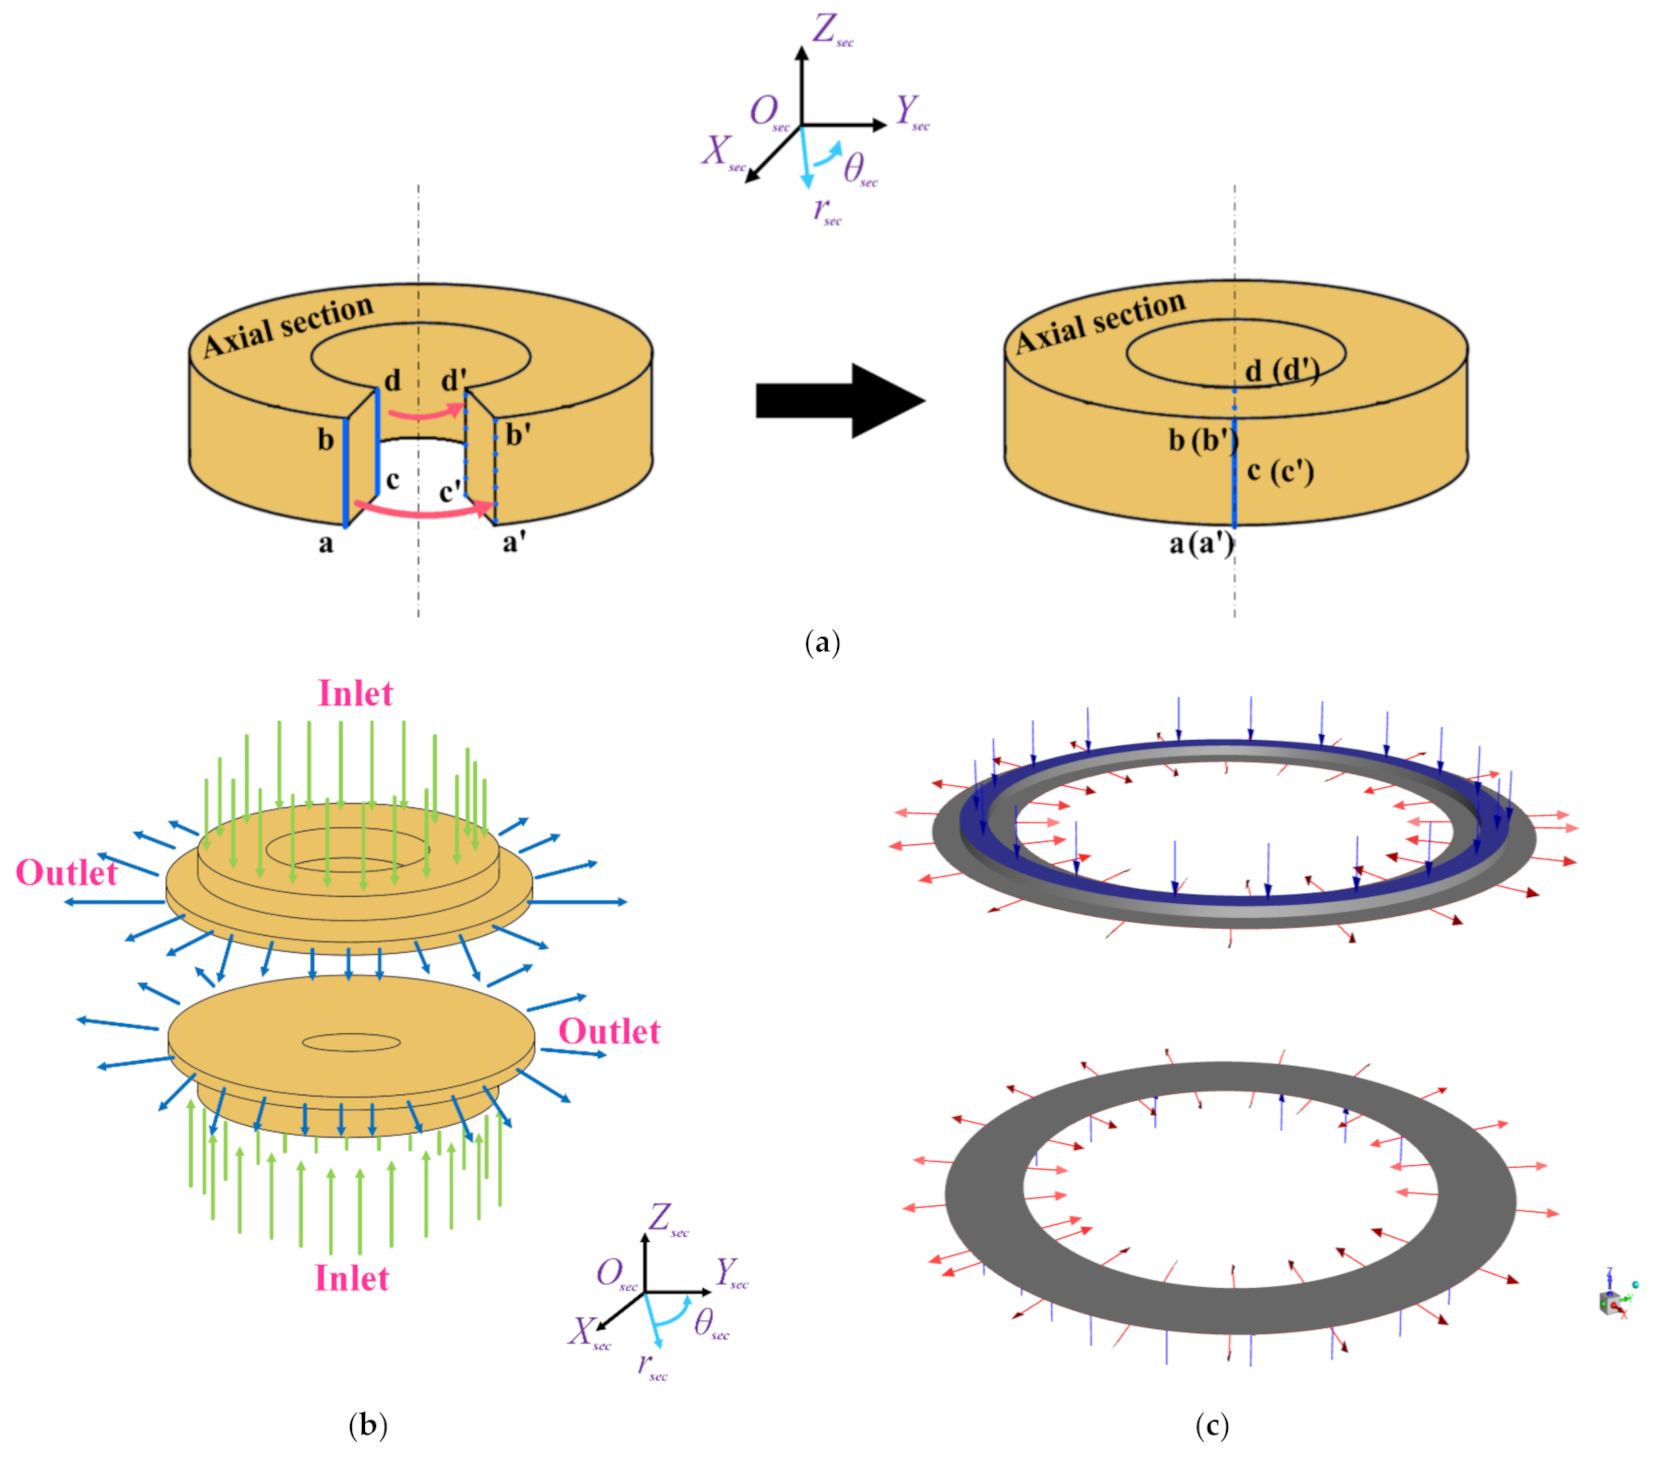
Based on the relationships in Equations (1)–(8), an annulus-sector cylinder corresponding to the gap fluid within a pitch was obtained. As shown in Figure 2a, the two generatrixes named “ a b ” and “ c d ” on the section of the cylinder are rotated along the circumferential direction of the axial section until they coincide with those named “ a b ” and “ c d ” on the other side, and then a concentric annulus cylinder is obtained as the Computational Fluid Dynamics (CFD) model of the fluid domain. With something similar applied to the nut and screw, the dynamics problems of the screw-nut pair were converted into those of the thrust bearings.
In this paper, a fluid lubricated screw-nut pair, in which the screw performed a two-degree-of-freedom motion about the rotating axis, was selected as a research object. In the system, the nut is static, and the screw is rotated clockwise, together with a translation along the rotating axis. According to the rules in Equations (1)–(8) and the transformation method in Figure 2a there exists the following relationship between the converted thrust bearing and the screw-nut pair within a pitch: the screw is rotated by 2 π θ sec _ m turn correspondingly, when the bearing is rotated by 1 turn. The computational domain of the system is shown in Figure 2b,c.
When the CFD model was solved, the angular velocity of the screw also needed to be transformed, as seen in Equation (9).
Ω b = θ sec _ m 2 π Ω
Here, Ω is the angular velocity of the screw. Ω b is the angular velocity of the thrust bearing transformed from the screw, according to the approximation rules.
For convenience, the side with a larger coordinate on the Z sec -axis was named as the upside of the screw, and the converse was the downside. Similarly, the same was applied to the nut and the gap oil film.

2.1.2. Meshing

While using the dynamic mesh technology and the unstructured grids [31,32,33,34], a cell with a negative volume or poor quality may be detected. To avoid such conditions, the computational domain in this paper was divided into 1.728 × 10 6 structured grids in ICEM CFD, obtaining a grid quality of 0.999669 , and there were ten elements in the direction of the clearance thickness. Part of the grids are displayed in Figure 3.

2.1.3. Governing Equations

An isothermal, incompressible and constant viscosity turbulent flow was supposed to occur in the gap between the screw and nut, and the body force was neglected. The transient Navier–Stokes equation and continuity equation of the flow field are shown in Equations (10) and (11), respectively [35].
u u X s e c + v u Y s e c + w u Z s e c = 1 ρ p X s e c + η ρ 2 u X s e c 2 + 2 u Y s e c 2 + 2 u Z s e c 2 u v X s e c + v v Y s e c + w v Z s e c = 1 ρ p Y s e c + η ρ 2 v X s e c 2 + 2 v Y s e c 2 + 2 v Z s e c 2 u w X s e c + v w Y s e c + w w Z s e c = 1 ρ p Z s e c + η ρ 2 w X s e c 2 + 2 w Y s e c 2 + 2 w Z s e c 2
u X sec + v Y sec + w Z sec = 0
where u , v and w represent the velocity components of any particle in the X sec , Y sec and Z sec -axis direction, respectively.
The flow equations were decomposed using the time-averaged method. The realizable k ε turbulent model in FLUENT was adopted to enclose the time-averaged equations. A pressure-based transient solver was selected, and the SIMPLEC algorithm was used for the coupling of the pressure and velocity. In the iterating process of each time step, the calculation was considered to be converged when the residual value of each physical quantity was less than 1 × 10 6 .

2.1.4. Boundary Conditions

The boundary conditions of the fluid domain are displayed in Figure 2b,c. The types of inlet and outlet were selected as pressure-inlet and pressure-outlet, respectively. In addition, the inlet pressure varied with the real-time regulation and compensation from the restrictors. A real-time motion control of the screw was realized, using the dynamic mesh technology in FLUENT.

2.2. Restrictor Setting

The capillary restrictor was adopted to regulate the inlet pressure [16,36] in this paper. The resistance is:
R c = 128 η l c π d c 4
Here, η is the viscosity of the oil, l c and d c are the length and the diameter of the capillary restrictor, respectively. The restrictor factor C sc is the reciprocal of R c .
The resistance of the continuous recess of the thrust bearing is expressed as follows [37]:
R b _ r = 6 η π h 3 ln r sec _ ri r sec _ i ln r sec _ o r sec _ ro ln r sec _ ri r sec _ i r sec _ o r sec _ ro
h is the thickness of the gap oil film. r sec _ i and r sec _ o are the inner and outer radiance of the transformed bearing, respectively. r sec _ ri and r sec _ ro are, respectively, the inner and outer radiances of the recess after being converted.
In line with the flux conservation law, Equation (14) was employed to compute the recess pressure of either side of the nut [16,36]:
P rT / B = P s 1 + R c R b _ r = P s Q C sc
P s is the oil supply pressure, Q is the flux in and out of the recess, P rT and P rB are the upper and lower recess pressures, respectively.

3. Results and Discussion

3.1. The Computation of the Stiffness and Damping Coefficients

3.1.1. Solution Method

The stiffness and damping coefficients are commonly solved to study the stability of the system, and the finite difference method and the partial derivative method are the most frequently used methods [38,39]. In this paper, it was proposed that the flow field be solved based on the Reynolds-averaged Navier–Stokes equation and the turbulent model in FLUENT. On this basis, the finite difference method was employed to solve these coefficients.
The oil film force acting on the screw changes when it suffers a perturbation at the equilibrium position, in which the oil film thicknesses and the pressures of both sides of the screw are the same. When a small perturbation occurs in any direction, the variation of the oil film force can be linearized according to the perturbation theory, and meets the following relationship with the displacement and velocity perturbations [40]:
Δ F p = S Δ ξ + C Δ ξ .
Here, Δ F p is the variation of the oil film force caused by the perturbations. S and C are the stiffness and damping coefficients, respectively. Δ ξ and Δ ξ . represent the displacement and velocity perturbations, respectively.
It could be drawn from [14,15,16,17] that the normal component accounted for a much larger portion of the axial force than the others. Therefore, dynamics performances in the normal direction were employed to evaluate the axial performances of the system in this paper.

3.1.2. Calculation Case

For a non-loaded system, different velocity perturbations in the Z sec -axis direction were applied to the screw at the dynamic equilibrium position, and then the variations of the oil film force and the displacement caused by the perturbations were analyzed. The velocity perturbations were set as 3   μ m / s , 30   μ m / s and 300   μ m / s , respectively. The oil supply pressure was 5   M P a , and the angular velocity of the screw was taken as 3000   r p m . The other parameters of the system are displayed in Table 1.
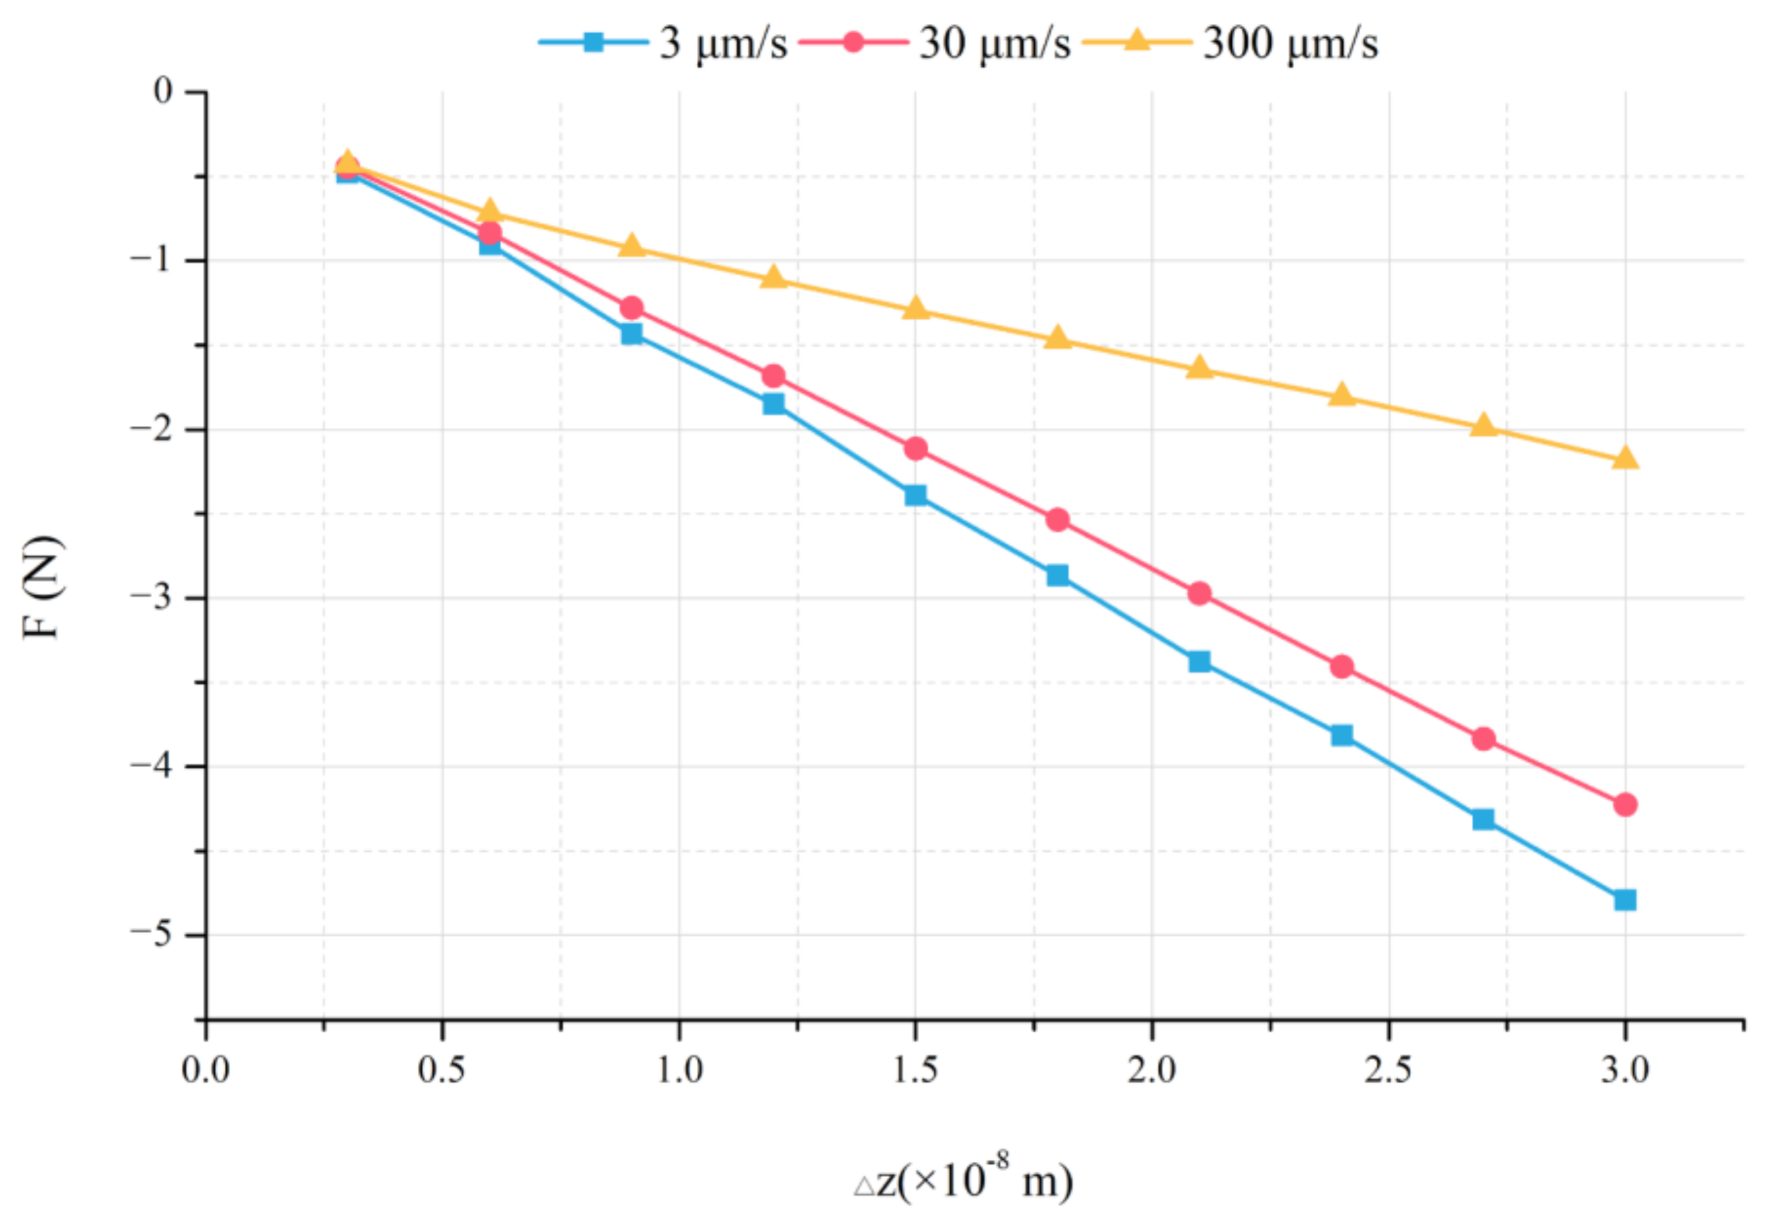
As shown in Figure 4, the displacement of the screw from the equilibrium position in the Z sec -axis direction is represented by Δ z , which is also the variation of the thickness of the gap oil film. In addition, F on the vertical axis represents the total oil film force acting on the screw in the Z sec -axis direction. The simulation results under the velocity perturbations of 3   μ m / s , 30   μ m / s and 300   μ m / s are displayed by the curves in blue, red, and yellow, respectively.
It can be seen that there is an approximate linear relation between Δ z and F in a short time for a given velocity perturbation. With the same Δ z acquired, the larger the velocity perturbation, the smaller the variation of the oil film force. The reason is that it takes a shorter time under a large velocity perturbation to obtain the same displacement, leaving a shorter reaction time for the restrictors. Therefore, compared with the other two curves, a lesser role is played by the restrictors in the yellow curve, to produce the least variation in the oil film force, to prevent the growth of Δ z .
When Δ z is very small, the three curves in Figure 4 are very near to each other. However, the distances from on to the other increase gradually with the growth of Δ z . It can be found that the red curve is closer to the blue curve, compared with the yellow one. As previously mentioned, owing to the short reaction time for the restrictors, the sensitivity of the oil film force to Δ z is almost the same under all cases, when the screw initially suffers a small perturbation. Hence, the distances between the random two curves are initially very narrow. Subsequently, Δ z increases gradually, due to the velocity perturbation. As shown in the blue and red curves, it takes more time than the yellow one to obtain the same Δ z . Therefore, the restrictors have a greater impact on the flow field under the two cases, followed by the phenomenon in Figure 4.
According to Equation (15), it takes 0.002   s to obtain the stiffness and damping coefficients of 1.393 × 10 8   N / m and 2.787 × 10 5   N   s / m , respectively, when the axial velocity perturbation is 30   μ m / s . The average stiffness coefficients corresponding to a Δ z of 3 × 10 8   m are 1.6 × 10 8   N / m , 1.41 × 10 8   N / m and 7.28 × 10 7   N / m , respectively, when the velocity perturbations are 3   μ m / s , 30   μ m / s and 300   μ m / s . It is thus clear that the stiffness of the system decreases with the growth of the velocity perturbation in the situation of the same Δ z . Through the above analyses, a rough knowledge of the influences of the perturbations in different ranges on the system was acquired, which could provide a reference for defining the acceptable scope of the perturbations according to different requirements.

3.2. Dynamics Analyses of a Fluid Lubricated Screw-Nut Pair Based on the Fluid–Solid Interaction

As mentioned in Section 2.1 and Section 3.1, a fluid lubricated screw-nut pair, in which the rotation of the screw was transformed into its translation, was selected as a research object in this paper. The pitch and yaw of the screw were not considered. Only the dynamics properties in the Z sec -axis direction were studied in this paper, in order to provide a basis for improving the axial accuracy of the system in the future research.

3.2.1. Translational Motion in the Z sec -Axis Direction

According to the theory of rigid body dynamics, with the forces acting on the screw analyzed, the axial motion of the screw can be solved by numerically integrating Equation (16):
F pT + F pB + F ex = ma
where F pT and F pB are the fluid pressures applied to the two sides of the screw, F ex is the external load applied to the screw; m is the mass of the thrust bearing corresponding to the screw within 2 π θ sec _ m pitch, and a is the translational acceleration in the Z sec -axis direction.
When a = 0 , the thickness of the gap oil film is invariant. When a     0 , a translational motion around the equilibrium position is carried out by the screw with a variable speed in the Z sec -axis direction.

3.2.2. Fluid–Solid Interaction

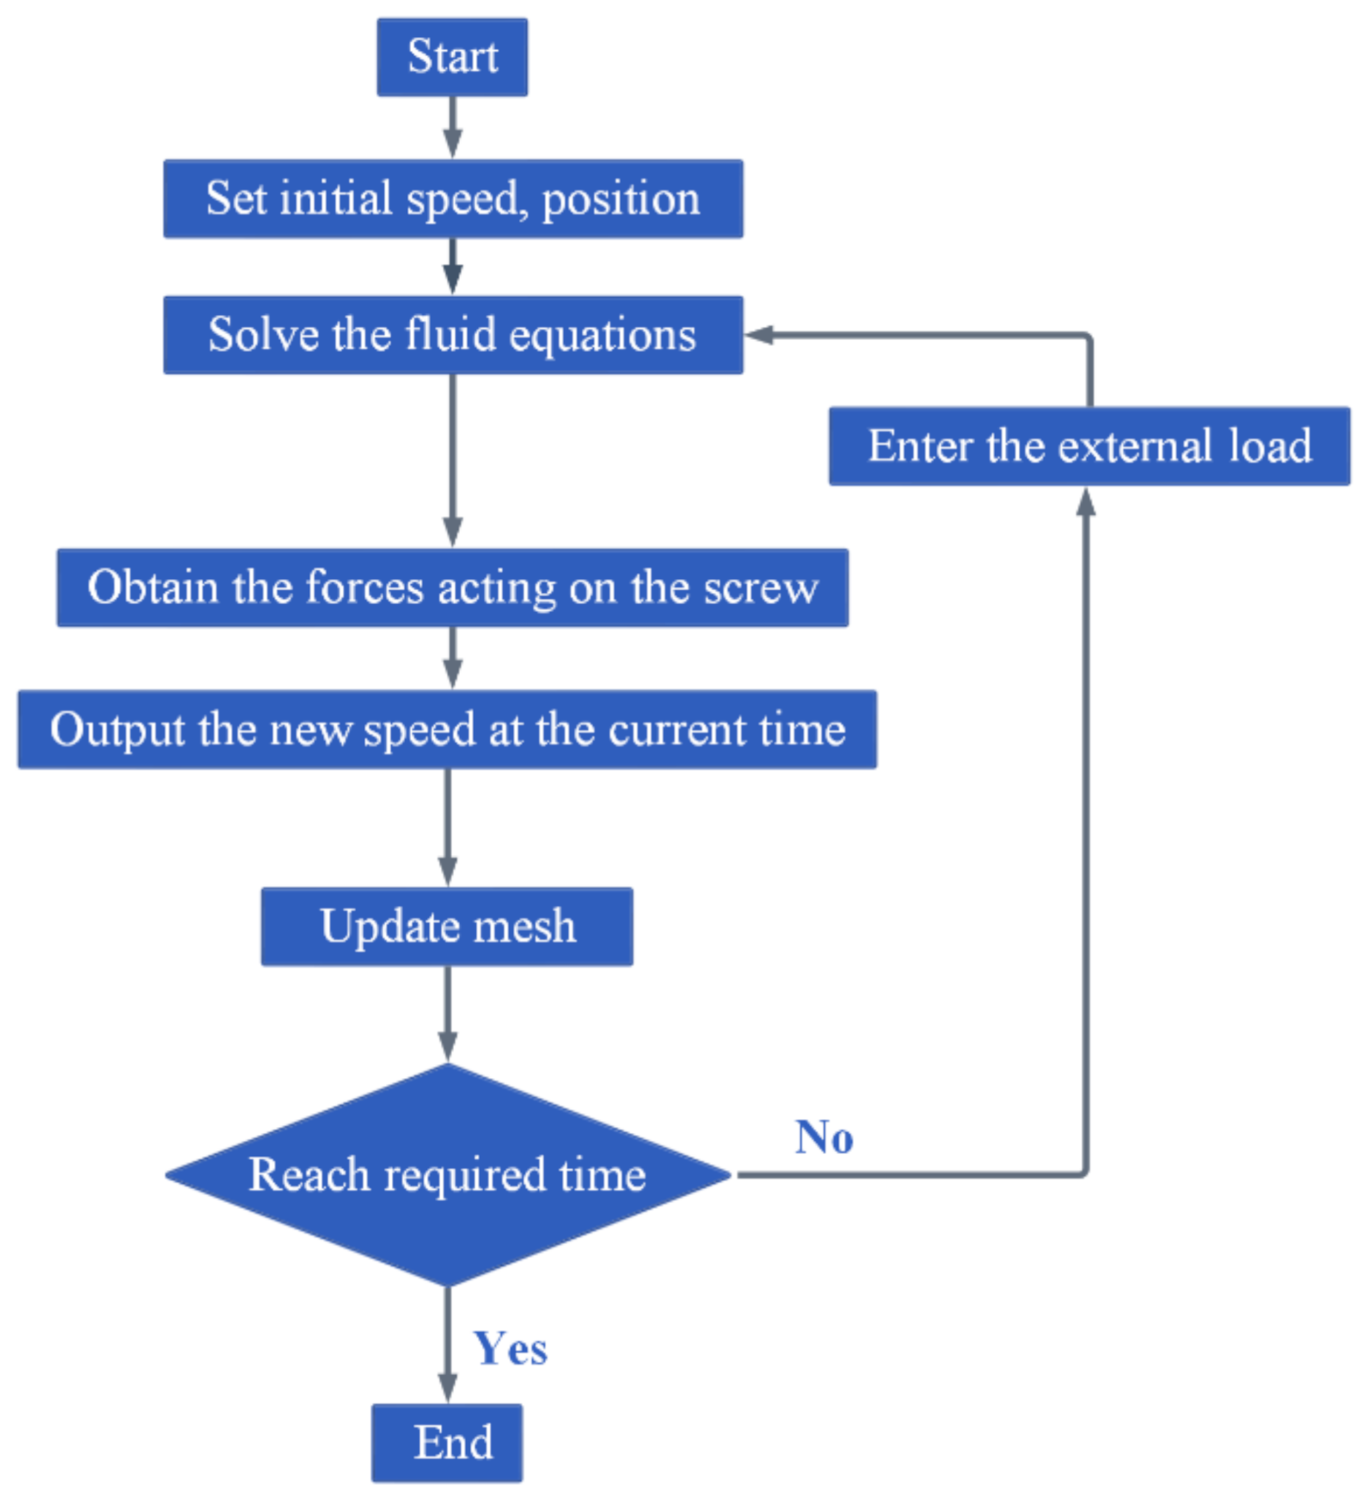
The solving process of dynamics characteristics based on the fluid–solid interaction is shown in Figure 5.
Differently from the previous method based on the kinetic equilibrium principle, Equation (16) was solved using the motion solver in FLUENT, realizing the loading of the system and the dynamics solution of the screw, and then the translational motion of the screw around the equilibrium position was updated. In the meanwhile, such dynamic mesh methods as remeshing, smoothing and layering in FLUENT were employed to update the volume mesh in the deforming regions, which were subject to the motions defined at the boundaries of the computational domain. The updated flow field was then solved to obtain a new hydrodynamics state of the system. The process was repeated until a given time.

3.2.3. Dynamics Properties under an External Load

The dynamics properties of the system were solved and analyzed under such parameters as displayed in Table 1 and Table 2.
Initially, the external load and oil supply pressure ranges were roughly estimated according to the workers’ experiences, and the threshold values calibrated on the existing similar products. The ranges of estimated values were then corrected, according to the variation of oil film thickness obtained in the simulations. It was found that when the system was subject to an external load of 1000   N , a phenomenon in which Δ z   >   h 0 arose, which was not allowed. Therefore, with the current parameters in Table 1 and Table 2, only within the loading range of 1   ~   100   N were the dynamics behaviors of the system solved and analyzed in this paper.
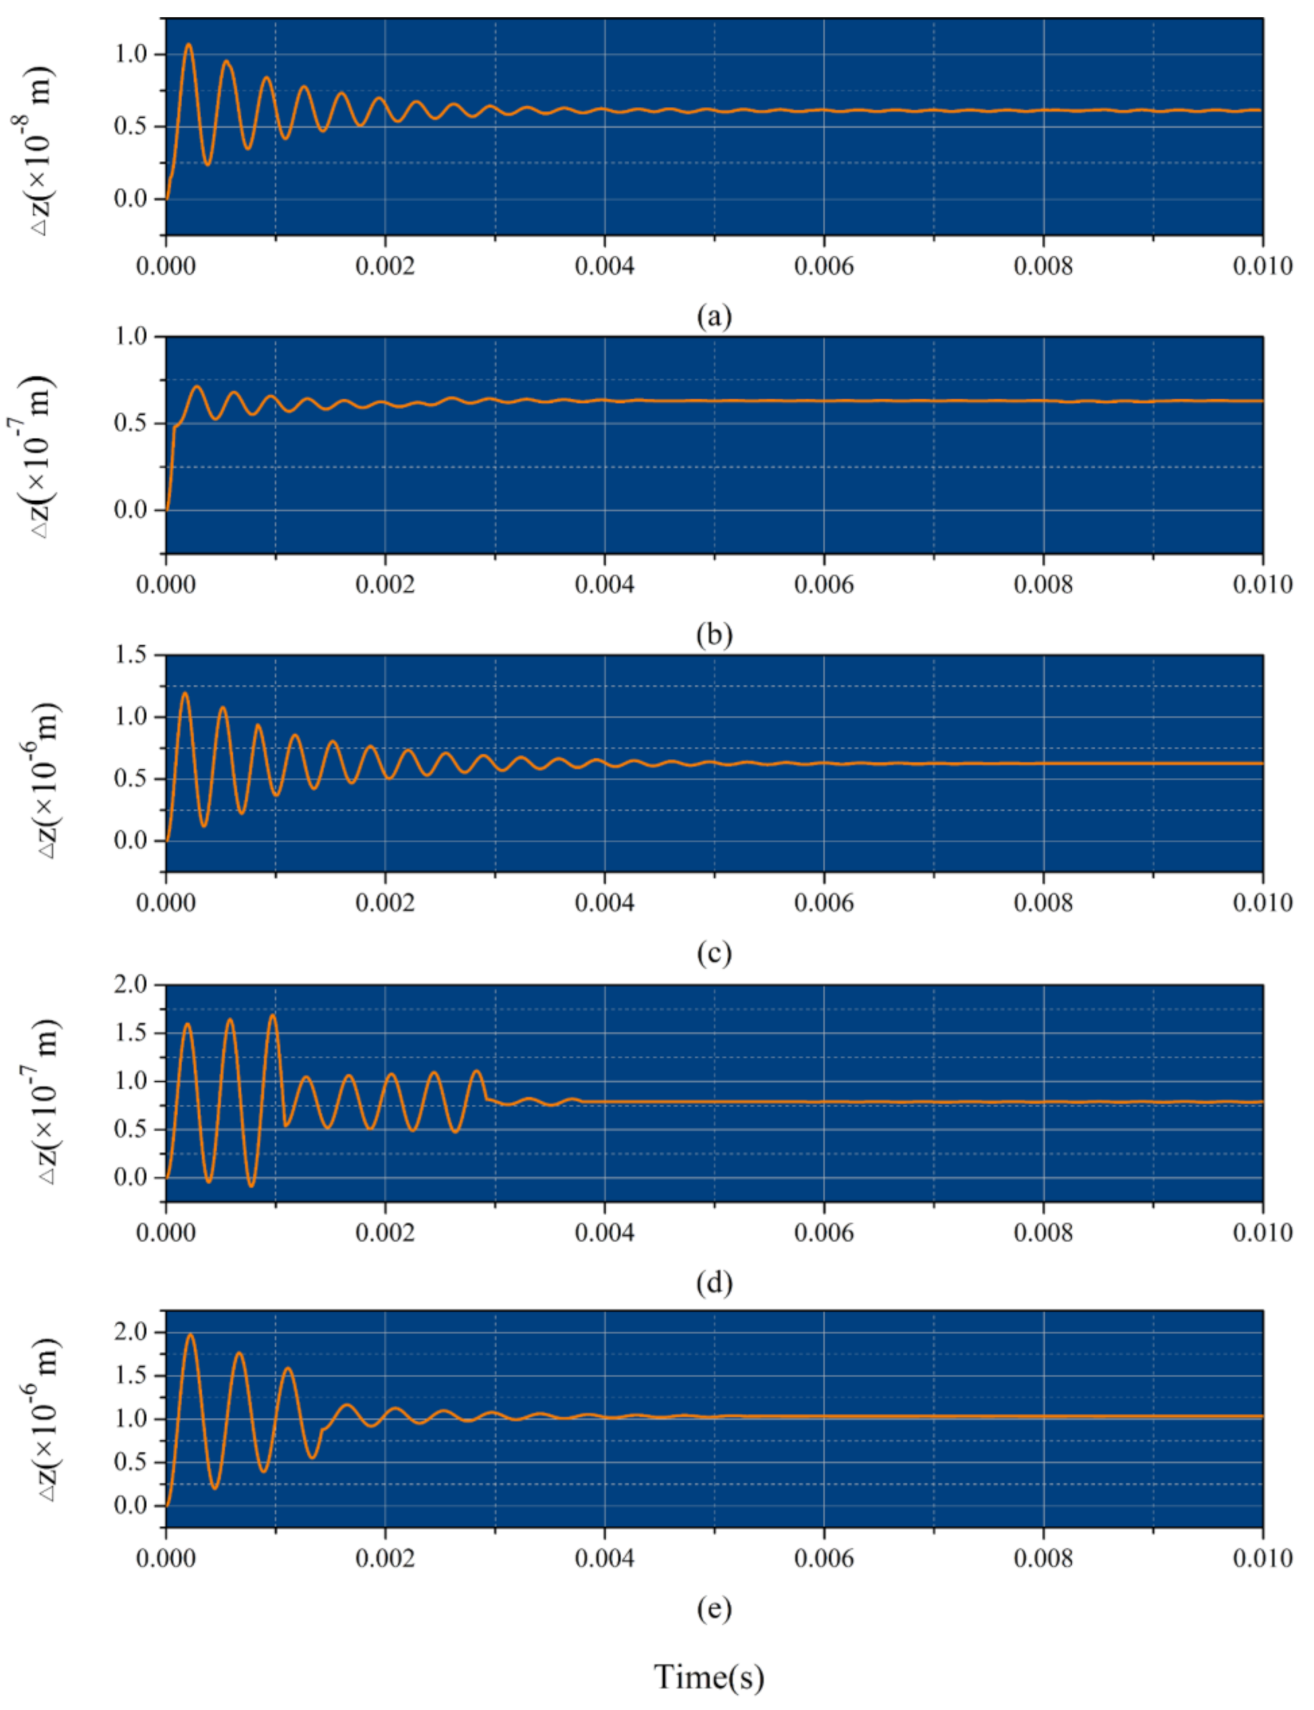
While the screw suffers different external loads within 1   ~   100   N , how Δ z   varies is displayed in Figure 6. Taking Figure 6a as an example, “ 5   MPa , 3000   rpm , 1   N ” means that the oil supply pressure is 5   MPa , the angular velocity of the screw is 3000   rpm , and the external load is 1   N .
As shown in Figure 6a–e, there is a sharp rise in Δ z   of the screw after loading, and then a downward trend is shown by Δ z   in the form of a cyclical fluctuation around some value. It can be seen that when the system is loaded for approximately 0.01   s in the simulations, the fluctuation in each case becomes very small, and the value of Δ z   can be roughly determined and distinguished from the others. As a result of the irregular turbulent fluctuation of the fluid particle, the screw cannot reach an absolutely steady state from the perspective of rigid body dynamics. Therefore, the fluctuation does not disappear, even if it gets smaller and smaller. That is to say, the loaded system reaches a relatively steady state over time, in which Δ z   shows a dynamic fluctuation around a value within a tiny range. It was found in the simulations that the shorter the update interval of the grids was, and the longer the flow time was, consequently, the closer to the actual condition the simulation result was; however, the calculation cost was higher. Compared with the result in which the variation of the thickness of the oil film was a constant after loading in the previous researches, it is obvious that such a fluctuation in this paper can reflect the actual condition of the flow field more accurately.
The oil supply pressures and the angular velocities of the screw are the same in Figure 6a–c, and the external load increases in an orderly way from (a), (b) to (c). According to the results from 0.008 to 0.01   s , it can be deduced that Δ z   in the dynamic steady state goes up as the external load increases. A similar conclusion can also be drawn through a comparison between (d) and (e).
While comparing Figure 6b,d, or c,e, it can be deduced that, with the same angular velocity of the screw and external load, there is a negative correlation between the oil supply pressure and Δ z   in the relatively steady state.
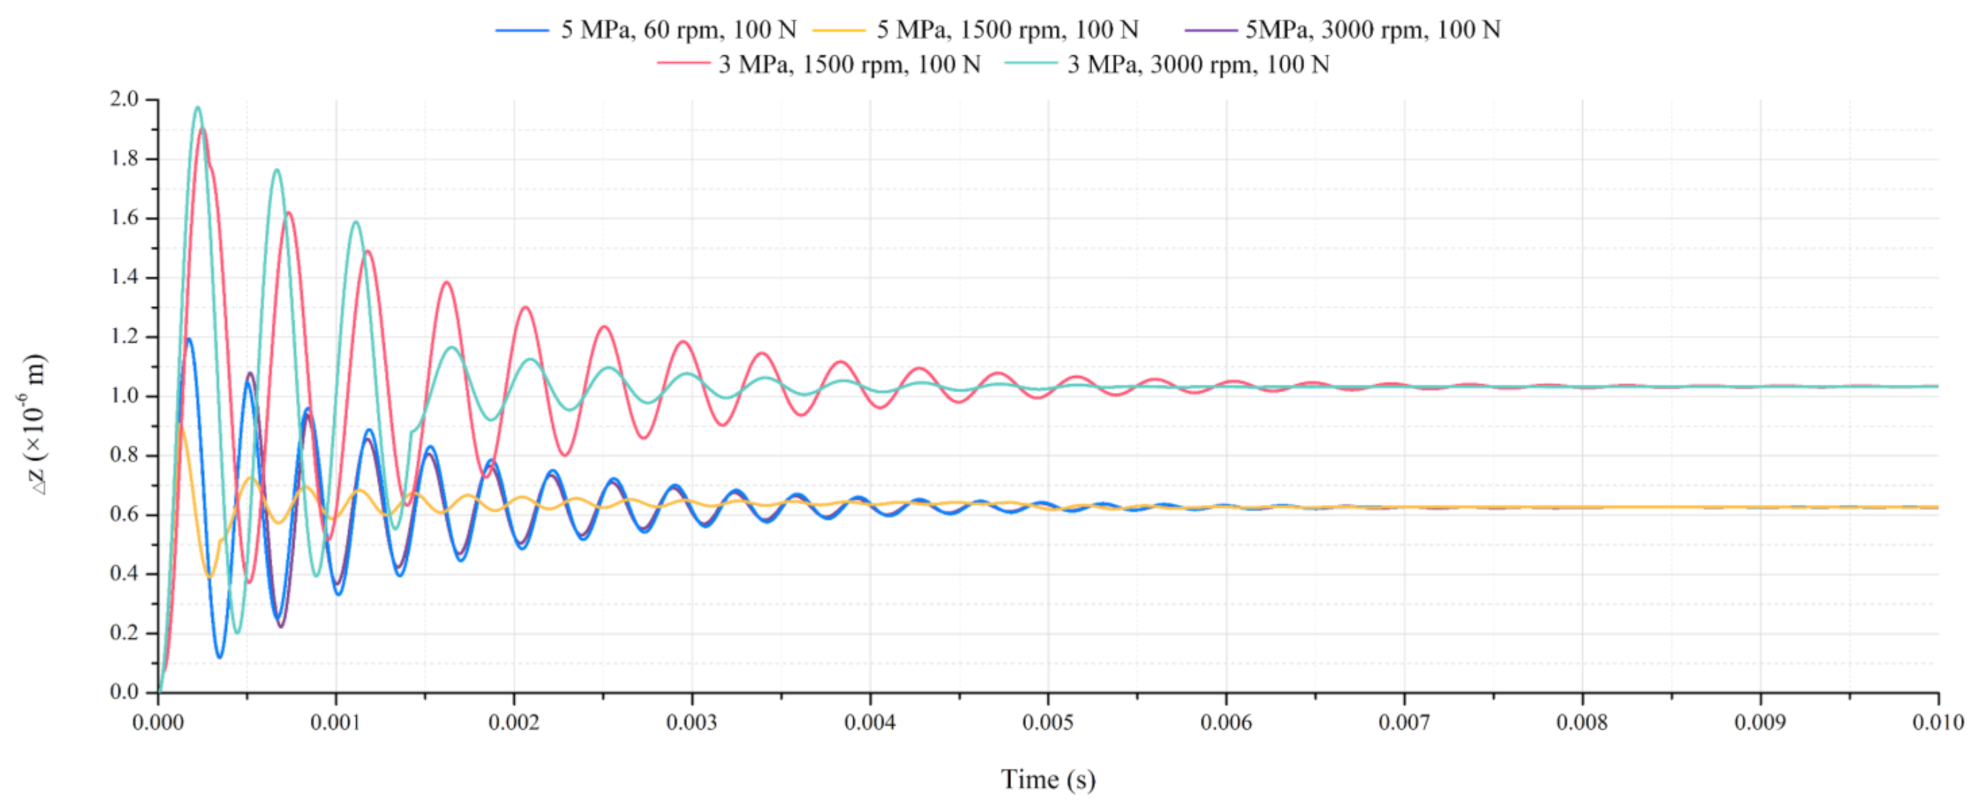
The screw subject to an external load of 100   N was driven under different angular velocities. The way in which Δ z   varies within 0   ~   0.01   s after loading is displayed in Figure 7.
The simulation results under the conditions of “ 5   MPa , 60   rpm , 100   N ”, “ 5   MPa , 1500   rpm , 100   N ”, “ 5   MPa , 3000   rpm , 100   N ”, “ 3   MPa , 1500   rpm , 100   N ” and “ 3   MPa , 3000   rpm , 100   N ” are represented by the curves in blue, yellow, purple, red and green, respectively. The meanings of the descriptions of the conditions have been explained in Figure 6. In almost every situation, it can be seen that Δ z   is becoming steady when the system is loaded for about 0.01   s .
Judging from the relative positions of the data at about 0.01   s , the higher the oil supply pressure is, the smaller Δ z   is, that is, the stronger the disturbance resistibility of the system is.
As shown in Figure 7, the data in blue have the same oil supply pressure and external load as the yellow and purple data. The differences of Δ z   among them are all very tiny, when the system is loaded for approximately 0.01   s . A similar situation occurs when comparing the data in red with the data in green. Therefore, it can be deduced that Δ z   in the dynamic steady state is little affected by the angular velocity of the screw.
In order to acquire a greater depth of understanding of the dynamics performances of the system, the dynamic parameters other than Δ z   were solved. A CFD model containing 6.048 × 10 4 structured grids was employed to examine the grid independence of the numerical solutions. Taking the case of “ 5   MPa , 60   rpm , 100   N ” for example, a comprehensive analysis of the simulation results within 0   ~   0.05   s was carried out in this section.
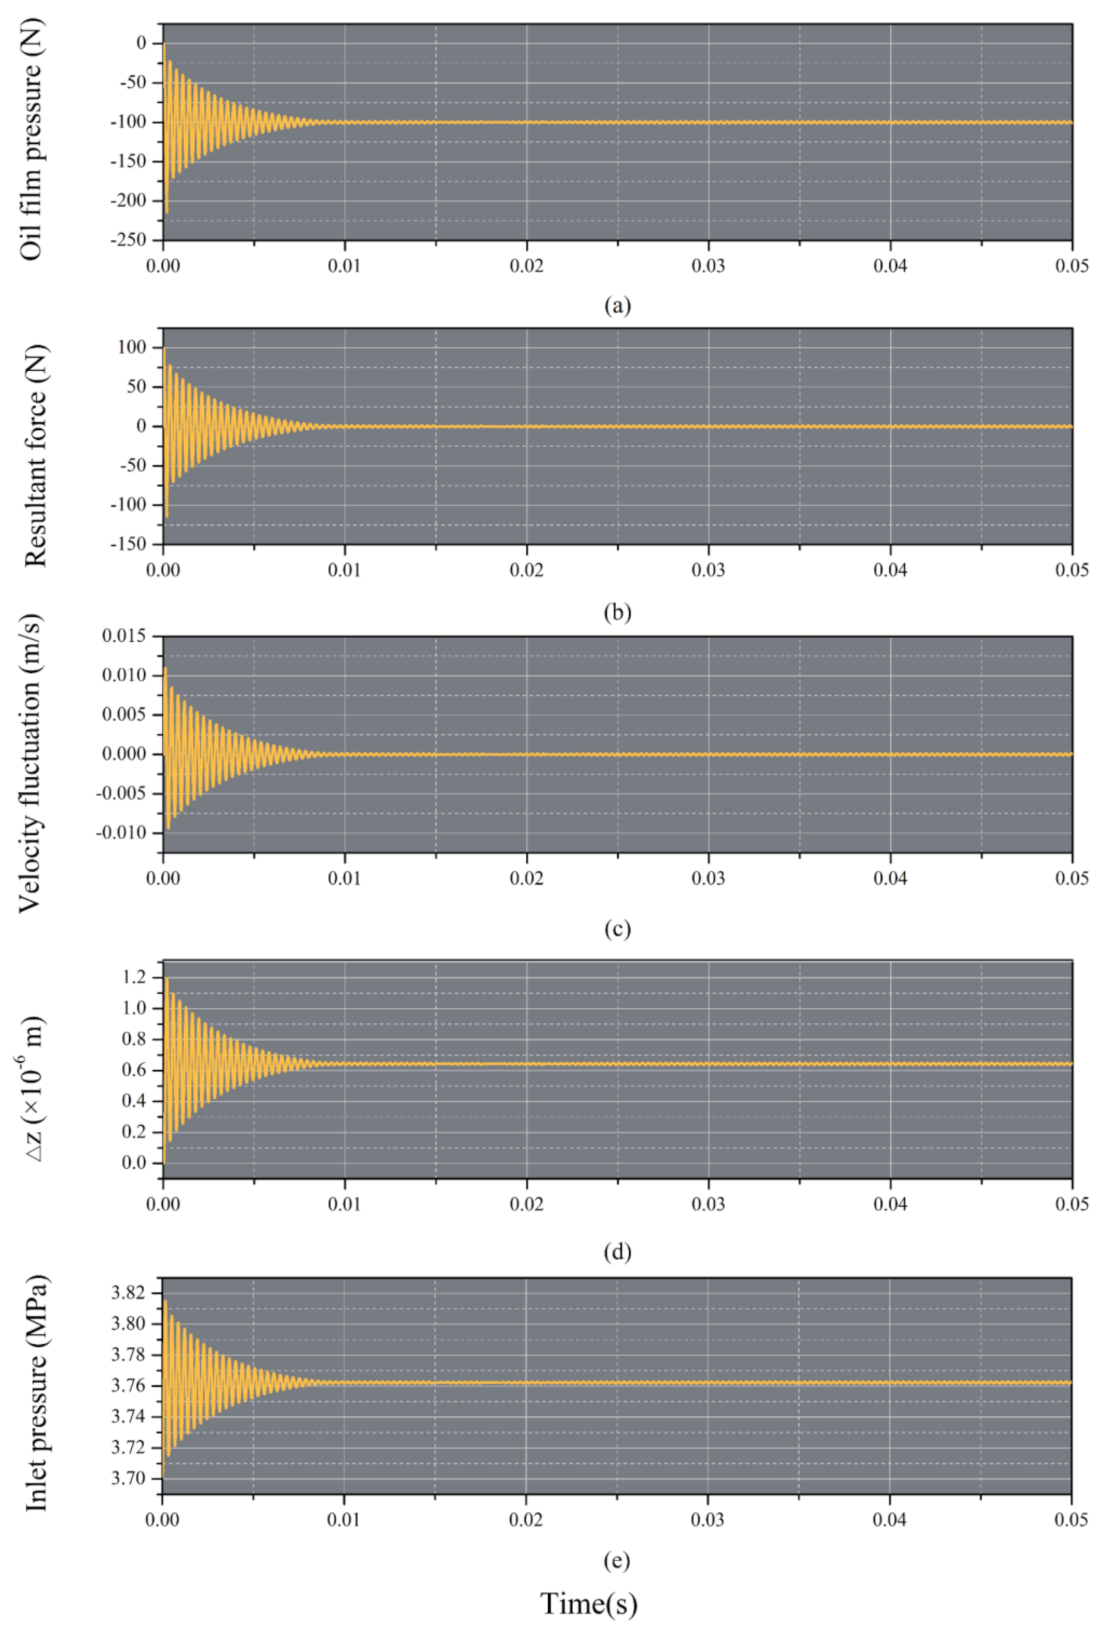
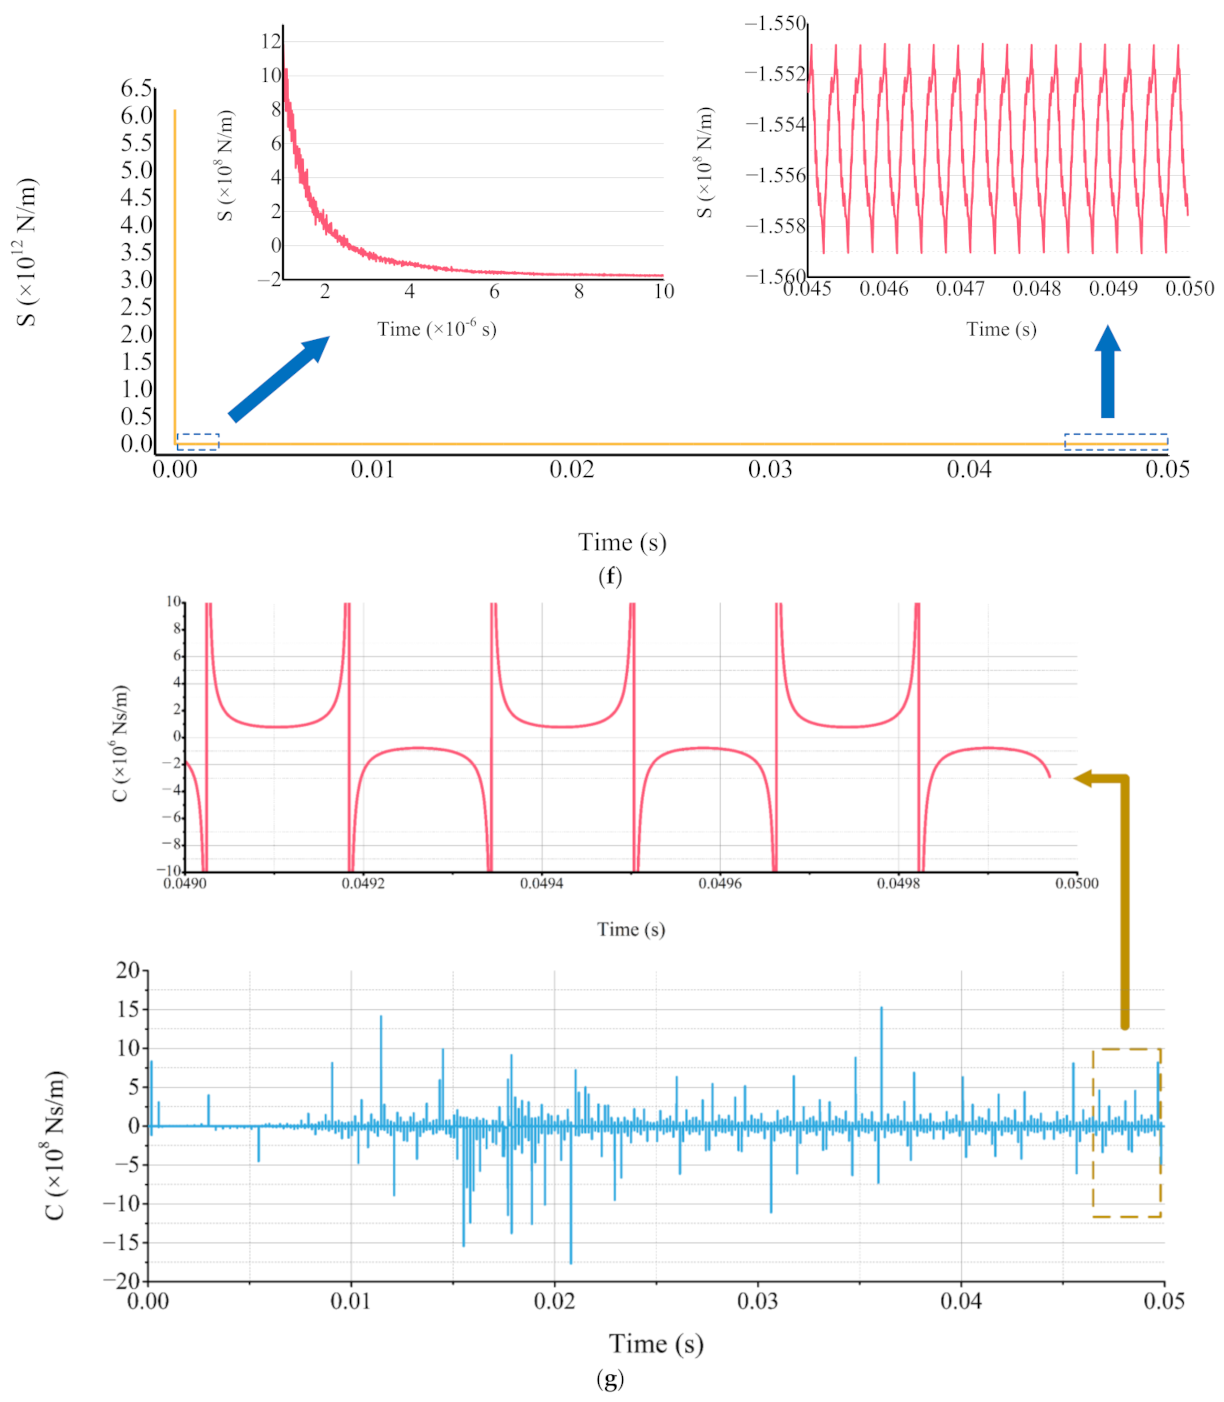
As shown in Figure 8, how the oil film pressure and the resultant force applied to the screw change over time are displayed in (a) and (b), respectively. The velocity fluctuation in the Z sec -axis direction and the variation of Δ z   during loading are shown in (c) and (d). With the inlet pressures of the recesses on both sides of the nut monitored, the variation of the inlet pressure of the upper recess is presented in (e). (f) and (g) illustrate the variations of the dynamic stiffness and damping coefficients of the system in the loading process, respectively, and the content of the two figures are partially enlarged, to obtain a clearer understanding of the results.
As shown in Figure 8a–e, as time goes by, almost every parameter reaches a dynamic steady state, in which a dynamic fluctuation around a value is shown by the parameter. In addition, it can be seen that there is little difference between the results at approximately 0.01   s and those after 0.01   s , proving the availability of data range in Figure 6 and Figure 7.
When the system is loaded for approximately 0.05   s , the values of the oil film pressure and the resultant force acting on the screw fluctuate around 99   ~   101   N and 1   ~   1   N , respectively, and the ranges of the fluctuations can be reduced by shortening the update interval of the grids. The velocity fluctuation of the screw in the Z sec -axis direction finally changes back and forth around 0   m / s . In Figure 8d, Δ z   eventually varies around 6 × 10 7   m , which is approximately 2   % of the initial oil film thickness. When compared with Δ z   in the same case in Figure 7, it was found that there was a tiny difference between the results based on the two groups of grids, showing the grid independence of the solutions. Through the adjustment of the restrictors, the inlet pressure of either side of the nut also gradually reaches a relatively steady state, with a dynamic fluctuation around a value. As in Figure 8e, the inlet pressure of recess on the upside of the nut fluctuates around 3.76   MPa at approximately 0.05   s .
In Figure 8f, a small Δ z   initially brings about a large stiffness coefficient, s , for the loaded system. However, the sharp rise in Δ z   caused by the external load soon leads to a sharp decline in the stiffness coefficient, and then the decline becomes gentle when the stiffness coefficient is near to some value. Owing to the large range of the stiffness coefficient, a clear knowledge of it could not be acquired, which was solved by two enlarged partial views. As is shown in the left-hand enlarged partial view, it can be seen that the decline is slower and slower after the sign of the stiffness coefficient becomes negative. The sign is related to the direction of the resultant oil film force. The stiffness coefficient becomes stable when the system is loaded for approximately 8 × 10 6   s , and then it also reaches a relatively steady state, along with the oil film pressure and Δ z   . As shown in the right-hand detailed view, the stiffness coefficient eventually shows a cyclical fluctuation around 1.555 × 10 8   N / m .
As shown in Figure 8g, the damping coefficient C of the system exhibits a series of irregular fluctuations around 0   N   s / m almost throughout the recording time. The curve is partially detailed within 0.49   ~   0.05   s to be analyzed more accurately. It can be found that the damping coefficient in the red curve also shows a dynamic variation around 0   N   s / m , when the other parameters reach the relatively steady state. The alternatively positive and negative variations displayed in the sign of the damping coefficient, result from the reciprocating change of the direction of the velocity fluctuation.
As a result of the fluid–solid interaction, it could be seen in the above analyses that these dynamic parameters were influenced by each other, and varied synchronously. Eventually, the system reached a dynamic steady state rather than an absolutely steady state, owing to the turbulent fluctuation. However, the Reynolds stress was neglected in the previous method based on the simplified Reynolds equation, leading to the fact that the influence of the turbulent fluctuation on the average flow could not be reflected in the results. Furthermore, without considering the fluid–solid interaction in the previous method, the flow equations were solved based on a series of predefined motions according to the kinetic equilibrium theory. Therefore, such dynamics characteristics analyzed in this section could not be reflected in the results which were based on the previous method.
Moreover, as shown in Figure 8f,g, the stiffness and damping coefficients are solved based on the varying velocity and displacement, rather than given velocity perturbations in Figure 4, which can obviously reflect the real-time flow field more accurately.

3.3. Comparison with the Previous Method

As mentioned in Section 1 and Section 3.2, in the previous research into the fluid lubricated screw-nut pairs, the flow fields were solved based on the simplified Reynolds equation in MATLAB. When the Reynolds-averaged Navier–Stokes equation was deduced from the Navier–Stokes equation, the Reynolds stress was neglected, for convenience. Meanwhile, the inertia term and the viscous force term were ignored or greatly simplified. Furthermore, the momentum equation in the direction of the gap thickness were also neglected, due to the narrow size of the clearance.
In addition, the solving pattern of the flow equations in the previous method is opposite to that in the new method. The field was solved based on the predefined motions according to the kinetic equilibrium theory. Meanwhile, the influences of the screw and nut on the field were not considered.
A qualitative comparison between the method proposed in this paper and the previous method was made in Section 1 and Section 3.2. In order to show the drawbacks in the previous method more intuitively, a quantitative contrastive analysis was carried out in this section.
In line with the simplification operations described above, the simplified flow equations of the system in this paper are given in Equations (17) and (18).
p r sec θ sec = η 2 v θ sec Z sec 2 p r sec = η 2 v r sec Z sec 2
v r sec r sec + v θ sec r sec θ sec + v Z sec Z sec + v r sec r sec = 0
Under different loading conditions, the fluid domain built in Section 2 was solved based on Equations (17) and (18) in MATLAB. The angular velocity of the screw Ω was set as 3000   r p m , and the oil supply pressure P s was 5   MPa .
As shown in Table 3 and Table 4, the simulation results using the previous method are compared with those based on the new method under different loading conditions. Method “a” and “b” represent the newly proposed method in this paper and the previous method based on the simplified Reynolds equation in MATLAB, respectively. F e x is the external load, Δ z   is the variation of the oil film thickness. P rT and P rB are the upper and lower recess pressures, respectively.
In Table 3, Δ z   is nearly 0 in both Method “a” and “b”, when a non-loaded system is solved. In Method “a”, Δ z   fluctuates dynamically around 0 , and the recess pressure also fluctuates around a value, rather differently from P s due to the restriction from the restrictor. However, while using Method “b”, an absolutely non-loaded state is obtained based on Δ z   = 0 , and the recess pressures are very close to P s , resulting in the fact that the restriction from the restrictors are almost not reflected. The simplification of the flow equations in Method “b” is responsible for such a phenomenon, and the flux out of the recess obtained using Method “b” is far less than that in the actual condition. Therefore, a higher recess pressure is obviously brought about by less flux, when the field is still solved according to the flow conservation. Correspondingly, the pressures of the whole field are also larger than those in the actual condition.
It is noteworthy that in Method “a” the approximately equal signs before the pressures and Δ z   do not mean that the values are constant, but represent that the fact that the pressures and Δ z   fluctuate around those values. However, in Method “b”, the approximately equal signs before the pressures mean the rounding of the constant values.
The simulation results using the two methods under loading conditions are shown in Table 4. Considering the difference of the solution methods, the simulation results at 0.01 s under Case “1” were selected to be compared with the eventual results under Case “2” and “3” in this section. The meanings of the approximately equal signs in the two methods are similar to those in Table 3.
As shown in Table 4, P rT , P rB , and Δ z under Case “1” fluctuate around some values eventually, when an external load of 100   N is applied to the system for approximately 0.01   s using Method “a”. However, for the same Δ z   , there is only a very small external load applied to the system, according to the results obtained using Method “b” under Case “2”. And the external load obtained using Method “b” is a constant. As mentioned above, the approximately equal sign before the load value means that the calculation result has been rounded. Furthermore, the difference between P rT and P rB obtained is very tiny, and they are still very close to P s . That is to say, a much larger external load is needed in Method “a” to obtain the same Δ z   as Method “b”, which can be accounted for by the minor restriction from the restrictors in Method “b”. As mentioned in Table 3, a lesser role is played in Method “b” by the restrictors, owing to the significantly reduced flux, which is a result of the simplification of the flow equations. Correspondingly, in Method “b”, the upper and lower oil film pressures obtained based on a given Δ z   are both larger than the actual pressures, hence the variations of the pressures are smaller, especially when Δ z   is very tiny. Therefore, in Table 4, compared with Case “1”, there is a lesser difference between the upper and lower oil film pressures under Case “2”.
Judging from Table 4, when an external load of approximately 100   N is applied to the system, the variations of the recess pressures obtained using Method “a” under Case “1” are much larger than those under Case “3”. However, a larger Δ z   is produced using Method “b” under Case “3”. As mentioned above, the restrictor has a minor effect on the flow in Method “b”, leading to small variations of the oil film pressures, hence the immunity of the system against the external load is lower than that in Method “a”.
In order to show the differences between the two methods more intuitively, the pressure fields under Case “1”−“3” were compared in the circumferential direction and the direction of the oil film thickness. The pressure contours of the lower surface of the screw under Case “1”−“3” are displayed in Figure 9. The pressure field obtained in FLUENT using Method “a” is shown in (a), and the pressure distributions obtained in MATLAB using Method “b” under Case “2” and “3” are shown in (b) and (c), respectively.
The differences of pressure distributions and pressure values between Figure 9b,c is too slight to be distinguished in the figures, the reason for which has been explained in Table 4. The overall trend of the pressure distribution in Figure 9a is similar to those in Figure 9b,c. Apart from the difference of pressure value, it can be found that the pressure distribution on the inner side of the recess in Figure 9a is slightly different from that on the outside, unlike the symmetric distribution around the recess in Figure 9b,c. Although the diffusions to the edges are promoted by the pressure gradients, the influence of the central force on the diffusion on the outside of the recess is opposite to that on the inner side. Hence, the pressures of the outside of the recess decrease faster than those of the inner side in Figure 9a. However, the difference is not reflected in the results obtained using Method “b”.
As mentioned above, the pressure and velocity gradients in the Z sec -axis direction were neglected, due to the narrow gap while using Method “b”. In order to display the shortcomings brought about by such an operation more clearly, the oil film pressures obtained using the two methods were compared in the direction of the oil film thickness.
The fluid particles, which had the same angular and radial coordinates at some time, were selected as the research objects. That is to say, they were on the same normal line of the screw surface. As the length scale in the direction of the oil film thickness was very small, the differences among the pressures of different particles were also very small when compared with the pressure values. In order to show the variation of the pressures in this direction more obviously, a normal line going through the lower recess was selected, owing to its larger range of the flow field covered than those in the sealing surfaces. The line on which the fluid particle had a position of “ r sec , θ sec , Z sec = 0.029   m , 0 , < 0   m ”, was taken as an example. The oil film pressures acting on the particles were then compared between the two methods.
Owing to the neglect of the pressure gradient in the direction of the oil film thickness, the pressures were equal in this direction while using Method “b”. That is to say, the pressures of all the particles on the selected line were equal. Moreover, the pressures of all the particles in the recess were also the same in Method “b”. As mentioned in Table 4, the recess pressures under Case “2” and “3” were constants close to the oil supply pressure, and it was found in the simulation that the differences between the upper and lower recess pressures were very tiny, due to the poor influence of the restrictors in Method “b”. However, while using Method “a”, the pressures acting on the particles on the line were different and variable. Therefore, the relation curve between the pressure and the position of the fluid particle on the line is shown in Figure 10, in order to show the variation of the pressures in the direction of the oil film thickness in Method “a”.
Taking the lower surface of the screw as a reference, the distance from any particle with a position of “ r sec , θ sec , Z sec = 0.029   m , 0 , < 0   m ” in the gap to the surface was set as the independent variable. And the way in which the pressures acting on the particles vary with distance is displayed in Figure 10. An irregular variation is shown by the pressures. And it was found in the simulations that the curve varied irregularly over time due to the turbulent fluctuation. The density of data points is related to the distribution of the grid nodes; therefore, the data points are more densely distributed near the narrow gap than the recess. Compared with the constant pressures in the Z sec -axis direction in Method “b”, the variation of the pressures in Method “a” can reflect the flow field more accurately.
Through the above analyses, the method proposed in this paper was obviously superior to the previous method in illustrating the field.

3.4. Feasibility Evaluation

In order to evaluate the feasibility of the solution method proposed in this paper, the simulation results based on the new method were compared with the previous theoretical results in [10].
The working parameters of the system are shown in Table 5. The oil film forces applied to both sides of the screw were solved under a non-loaded condition. It was then found that the difference in the oil film forces between the upside and downside of the screw was less than 0.001   N when the system reached a dynamic steady state. Consequently, the flow field on the upside of the screw was taken as an example in this section, and the resultant oil film force acquired using the new method was compared with the previous data in the literature.
As shown in Figure 11, the horizontal axis represents the oil supply pressure, and the vertical axis represents the total oil film force acting on the upside of the screw within a pitch, that is, the axial-bearing capacity of the upside of the screw. The data in red represent the simulation results based on the method proposed in this paper, the data in blue represent the results in [10], and the curves are obtained by data fitting.
Judging from the relative positions of the simulation results and the reference data, there was good consistency between them. Consequently, it was proved to be feasible to solve the flow field using the newly proposed method in this paper.

4. Conclusions

In order to avoid the shortcomings of the existing methods and reflect the flow field more accurately, a new numerical method was proposed to solve the fluid lubricated screw-nut pairs in this paper. The fluid domain of a fluid lubricated screw-nut pair was simplified into a pair of annular flow fields according to some rules, transforming the research into the fluid lubricated screw-nut pairs into the lubrication problems of a pair of thrust bearings. The computational domain was solved using the dynamic mesh technology in FLUENT. And the CFD model was meshed into hexahedral grids in ICEM, to avoid the negative cell volume and the undesired cell skewness.
Differently from the previous method, in which iterative corrections based on the kinetic equilibrium theory followed an approximate solution based on the simplified Reynolds equation, with the real-time adjustment of the restrictors considered in this paper, the dynamics performances of the loaded system were solved based on the fluid–solid interaction. According to the results, when loaded for a period of time, the system entered into a dynamic steady status, in which a dynamic fluctuation around some value was displayed by the dynamic parameter, reflecting the influence of the turbulent fluctuation on the average flow.
From a quantitative perspective, the simulation results under different loading conditions were compared between the new method and the previous method. It was found that the immunity of the system against the external load was weakened in the previous method. It took an external load of only approximately 1 % of that in the new method, to obtain the same variation of oil film thickness. However, when the system was subjected to the same external load, the variation of oil film thickness in the previous method was approximately 30 times that of the new method. The simplification of the flow equations and the limitations brought about by the solution mode in the previous method were responsible for these differences. And the defects of the simplified Reynolds equation were demonstrated more intuitively through the comparison of the pressure fields. If such simulation results were employed to guide the operation, unexpected damage might be caused to the system.
Two methods for solving the stiffness and damping coefficients of the system were given in this paper. For a given velocity perturbation, the stiffness and damping coefficients were solved in different ranges. And it was found that there was a negative correlation between the velocity perturbation and the stiffness coefficient under the same displacement fluctuation. In the other method, the velocity and displacement fluctuations were caused by a given external load, and the stiffness and damping coefficients varied, depending on the dynamics state of the system. While using the first method, it could take less time to acquire a rough knowledge of the influences of the perturbations in different ranges on the system, but the results based on the second method were more accurate than those based on the first one. Therefore, a suitable solution method can be selected, according to different requirements.
In order to evaluate the feasibility of the method proposed in this paper, the oil film forces acting on both sides of the screw were solved under different oil supply pressures. The simulation results were found to agree well with the theoretical results in the literature, verifying the validity of the new method.
The research into the dynamics performances in this paper can provide a good basis and reference for better controlling the systems and improving the transmission and manufacturing accuracies in future research.

Author Contributions

Conceptualization, Z.S.; methodology, Z.S.; software, Z.S.; validation, Z.S.; formal analysis, Z.S.; original draft, Z.S.; review and editing, Z.S. and X.F.; writing—checking, H.L., Y.L. and Z.L.; project administration, X.F. and H.L.; funding acquisition, X.F. and H.L. All authors have read and agreed to the published version of the manuscript.

Funding

This research is funded by the National Natural Science Foundation of China, grant number 51875325, and the Natural Science Foundation of Shandong Province, China, grant number ZR2019MEE003.

Data Availability Statement

Not applicable.

Acknowledgments

The authors wish to thank the support of the National Natural Science Foundation of China (grant number 51375266).

Conflicts of Interest

The authors declare no conflict of interest.

Nomenclature

O hel X hel Y hel Z hel Rectangular coordinate system on the screw-nut pair
O sec X sec Y sec Z sec Rectangular coordinate system on the Computational Fluid Dynamics (CFD) model
O sec r sec θ sec Z sec Cylindrical coordinate system corresponding to O sec X sec Y sec Z sec
P Pitch ( m )
r h Radius of any point on the helicoid ( m )
r h _ i Inner radius of the nut ( m )
r h _ ri Inner radius of the recess of the screw-nut pair ( m )
r h _ ro Outer radius of the recess of the screw-nut pair ( m )
r h _ o Outer radius of the screw ( m )
λ o Lead angle at r h _ o ( r a d )
λ i Lead angle at r h _ i ( r a d )
α Half of thread angle ( r a d )
Ω Angular velocity of the screw ( r p m )
Ω b Angular velocity of the thrust bearing transformed from the screw ( r p m )
u / v / w Velocity component of any point in the X sec / Y sec / Z sec -axis direction ( m / s )
θ sec _ m Angle contained by two sides of the annular-sector plane ( r a d )
θ sec Angular position in O sec r sec θ sec Z sec ( r a d )
r sec Radius of any particle in the CFD model ( m )
r sec _ i Inner radius of the CFD model ( m )
r sec _ ri Inner radius of the recess of the CFD model ( m )
r sec _ ro Outer radius of the recess of the CFD model ( m )
r sec _ o Outer radius of the CFD model ( m )
ρ Oil density ( kg / m 3 )
η Oil viscosity ( Pa   s )
P s Oil supply pressure ( P a )
R c Resistance of the capillary restrictor ( N s / m 5 )
C sc Restrictor factor ( m 5 / N s )
l c Length and the diameter of the capillary restrictor ( m )
d c Diameter of the capillary restrictor ( m )
R b _ r Resistance of the recess of the transformed thrust bearing ( N s / m 5 )
h 0 Initial clearance ( m )
Δ z Displacement of the screw from equilibrium position ( m )
P rT / P rB Upper/lower recess pressure ( P a )
Δ F p Variation of the oil film force caused by the perturbations ( N )
S Stiffness coefficient ( N / m )
C Damping coefficient ( Ns / m )
F Resultant oil film force acting on the screw in the Z sec -axis direction ( N )
F pT / F pB Fluid pressure applied to the upside/downside of the screw ( N )
F ex External load applied to the screw ( N )
m Mass of the thrust bearing corresponding to the screw within 2 π θ sec _ m pitch ( k g )
a Translational acceleration along the Z sec -axis direction ( m / s 2 )

References

  1. Brecher, C.; Utsch, P.; Klar, R.; Wenzel, C. Compact design for high precision machine tools. Int. J. Mach. Tools Manuf. 2010, 50, 328–334. [Google Scholar] [CrossRef]
  2. Sun, T.; Wang, M.; Gao, X.; Zhao, Y. Non-hertzian elastohydrodynamic contact stress calculation of high-speed ball screws. Appl. Sci. 2021, 11, 12081. [Google Scholar] [CrossRef]
  3. Barewar, A.M.; Padole, A.A.; Nagpure, Y.D.; Gaupale, P.S.; Nagmote, S.B.; Ram, C.K.; Raut, R.S. Fabrication of automatic screw jack. Int. J. Adv. Res. Dev. 2018, 3, 64–67. [Google Scholar]
  4. Matataro, T.; Akira, Y. A study on hydrostatic lead screws (1st Report). J. Jpn. Soc. Precis. Eng. 1981, 47, 1504–1509. [Google Scholar]
  5. Satomi, T.; Yamamoto, A. Studies on the aerostatic lead screws (1st Report). J. Jpn. Soc. Precis. Eng. 1984, 50, 975–980. [Google Scholar] [CrossRef] [Green Version]
  6. Shen, T. Research on Aerostatic Leading Screw. Master’s Thesis, Harbin Institute of Technology, Harbin, China, 2008. [Google Scholar]
  7. Luo, S.; Zhao, S. Liquid nut for high speed transmission system. Mach. Tool Hydraul. 2008, 36, 327–328. [Google Scholar] [CrossRef]
  8. Zhong, W. Performance Research on Hydrostatic Lead Screws with Spool-Type Restrictors. Master’s Thesis, Shandong University, Jinan, China, 2017. [Google Scholar]
  9. Xin, Z. Design and Dynamic Analysis of Full Static Pressure Double Drive Screw Transmission System. Master’s Thesis, Shandong University, Jinan, China, 2020. [Google Scholar]
  10. Elsayed, H.R.; Khatan, H. A suggested new profile for externally pressurized power screws. Wear 1976, 30, 237–247. [Google Scholar] [CrossRef]
  11. Elsayed, H.R.; Khatan, H. The exact performance of externally pressurized power screws. Wear 1976, 39, 285–306. [Google Scholar] [CrossRef]
  12. Elsayed, H.R.; Khatan, H. The running performance of externally pressurized power screws. Wear 1975, 31, 141–156. [Google Scholar] [CrossRef]
  13. Susumu, O. A prototype production of aerostatic lead screw with resin molded bearing surfaces and performance evaluation. J. Jpn. Soc. Precis. Eng. 2015, 81, 570–575. [Google Scholar]
  14. Zhang, Y.; Lu, C.; Ma, J. Research on two methods for improving the axial static and dynamic characteristics of hydrostatic lead screws. Tribol. Int. 2017, 109, 152–164. [Google Scholar] [CrossRef]
  15. Zhang, Y.; Chen, S.; Lu, C.; Liu, Z. Performance analysis of capillary-compensated hydrostatic lead screws with discontinuous helical recesses including influence of pitch errors in nut. Tribol. T. 2017, 60, 974–987. [Google Scholar] [CrossRef]
  16. Zhang, Y.; Lu, C.; Liu, Y. Averaging effect on pitch errors in hydrostatic lead screws considering helical recess layout and nut misalignment. Proc. Inst. Mech. Eng. Part J. 2018, 232, 1181–1192. [Google Scholar] [CrossRef]
  17. Zhang, Y. Research on Pitch Error Mechanism and Motion Characteristics of Hydrostatic Lead Screws. Ph.D. Thesis, Shandong University, Jinan, China, 2017. [Google Scholar]
  18. Lu, J.; Feng, X.; Su, Z.; Liu, Y.; Wang, D. Modeling and analysis for the transmission characteristics of a proposed dual-drive hydrostatic lead screw system. J. Tribol. 2022, 144, 071202. [Google Scholar] [CrossRef]
  19. Liu, Y.; Feng, X.; Li, Y.; Lu, J.; Su, Z. Research on boundary slip of hydrostatic lead screw under different driving modes. Sci. Rep. 2021, 11, 22307. [Google Scholar] [CrossRef]
  20. Sommerfield, A. Ein Beitrag zur hydrodynamischen Erkläerung der turbulenten Flüssigkeitsbewegüngen (A Contribution to Hydrodynamic Explanation of Turbulent Fluid Motions). In Proceedings of the 4th International Congress of Mathematicians, Roma, Italy, 6–11 April 1908; 3, pp. 116–124. [Google Scholar]
  21. Seshadri, K.; Williams, F.A. Laminar flow between parallel plates with injection of a reactant at high reynolds number. Int. J. Heat Mass Transfer 1978, 21, 251–253. [Google Scholar] [CrossRef]
  22. Streeter, V.L. Fluid Mechanics, 4th ed.; Tata McGraw-Hill Education: New York, NY, USA, 1966. [Google Scholar]
  23. Alfonsi, G. Reynolds-averaged Navier–Stokes equations for turbulence modeling. Appl. Mech. Rev. 2009, 62, 040802. [Google Scholar] [CrossRef]
  24. Snyder, T.; Braun, M. Comparison of perturbed Reynolds equation and CFD models for the prediction of dynamic coefficients of sliding bearings. Lubricants 2018, 6, 5. [Google Scholar] [CrossRef] [Green Version]
  25. Sahlin, F.; Glavatskih, S.B.; Almqvist, T.R.; Larsson, R. 2D CFD-Analysis of Micro-Patterned Surfaces in Hydrodynamic Lubrication. In Proceedings of the ASME/STLE 2004 International Joint Tribology Conference, Long Beach, CA, USA, 24–27 October 2004; pp. 1657–1665. [Google Scholar]
  26. Mori, A.; Makino, T.; Mori, H. Entry flow and pressure jump in submerged multi-pad bearings and grooved bearings. J. Tribol. 1992, 114, 370–377. [Google Scholar] [CrossRef]
  27. Tucker, P.G.; Keogh, P.S. On the dynamic thermal state in a hydrodynamic bearing with a whirling journal using CFD techniques. Int. J. Multiphas. Flow. 1997, 23, 118. [Google Scholar] [CrossRef]
  28. Yang, S.; Ai, Z.; Zhang, C.; Dong, S.; Ouyang, X.; Liu, R.; Zhang, P. Study on optimization of tunnel ventilation flow field in long tunnel based on CFD computer simulation technology. Sustainability 2022, 14, 11486. [Google Scholar] [CrossRef]
  29. Ni, J.; Dong, J.; Ullah, I.; Mao, H. CFD simulation of sucrose flow field in the stem of greenhouse tomato seedling. Int. J. Agric. Biol. Eng. 2022, 15, 111–115. [Google Scholar] [CrossRef]
  30. Park, J.; Lee, S.; Park, J.Y. Review of computational fluid dynamics modeling of iron sintering process. Int. J. Eng. Sci. Technol. 2022, 36, 4501–4508. [Google Scholar] [CrossRef]
  31. Wang, X.; Li, Y. Research on Aerodynamic Characteristics of Non-Circular Cross-Section Missile Based on Fluent. In Proceedings of the IEEE International Conference on Unmanned Systems (ICUS), Harbin, China, 27–28 November 2020; pp. 1224–1229. [Google Scholar]
  32. Zhu, Q.; Zhang, Y.; Zhu, D. Study on dynamic characteristics of the bladder fluid pulsation attenuator based on dynamic mesh technology. J. Mech. Sci. Technol. 2019, 33, 1159–1168. [Google Scholar] [CrossRef]
  33. Corvaglia, A.; Altare, G.; Finesso, R.; Rundo, M. Computational Fluid Dynamics Modelling of a Load Sensing Proportional Valve. In Proceedings of the ASME-JSME-KSME 2019 Joint Fluids Engineering Conference, San Francisco, CA, USA, 28 July–1 August 2019. [Google Scholar]
  34. Nishikawa, H. Uses of Zero and Negative Volume Elements for Node-Centered Edge-Based Discretization. In Proceedings of the 23rd AIAA Computational Fluid Dynamics Conference, Denver, CO, USA, 5–9 June 2017. [Google Scholar]
  35. Graebel, W. Advanced Fluid Mechanics; Academic Press: Cambridge, MA, USA, 2007; pp. 11–15. [Google Scholar]
  36. Zhang, Y.; Yu, S.; Lu, C.; Zhao, H.; Liang, P. An improved lumped parameter method for calculating static characteristics of multi-recess hydrostatic journal bearings. Proc. Inst. Mech. Eng. Part J. 2020, 234, 301–310. [Google Scholar] [CrossRef]
  37. Wang, D. Lubrication Technical Manual, 1st ed.; China Machine Press: Beijing, China, 1999; pp. 28–29. [Google Scholar]
  38. Dhakad, R.; Pradhan, B.K.; Kumar, J.; Behera, S.K. Prediction of Stiffness and Damping of Gas Foil Journal Bearing for High-Speed Rotor. In Proceedings of the TRIBOINDIA-2018 An International Conference on Tribology, Mumbai, India, 13–15 December 2018. [Google Scholar]
  39. Yang, L.; Li, H.; Yu, L. Dynamic stiffness and damping coefficients of aerodynamic tilting-pad journal bearings. Tribol. Int. 2007, 40, 1399–1410. [Google Scholar]
  40. Peng, J.; Carpino, M. Calculation of stiffness and damping coefficients for elastically supported gas foil bearings. J. Tribol. 1993, 115, 20–27. [Google Scholar] [CrossRef]
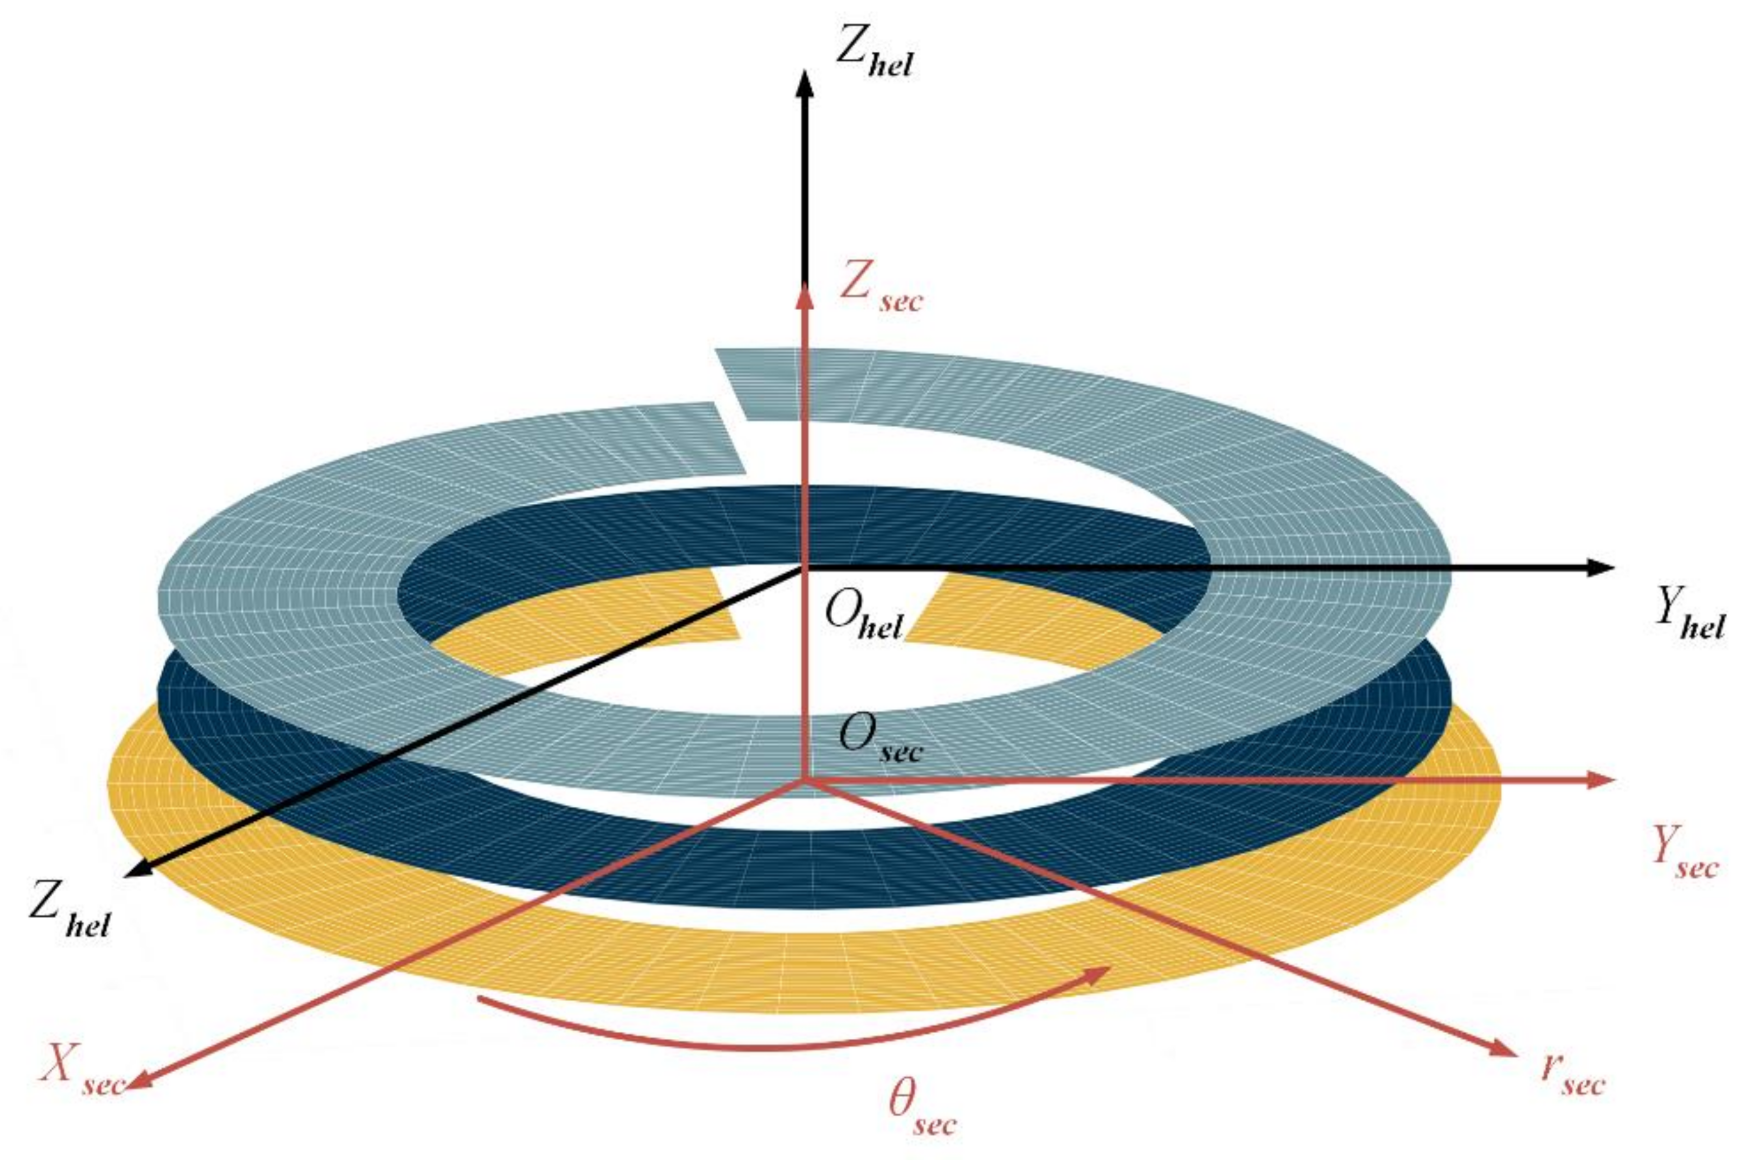
Figure 1. Diagrammatic diagram of the equivalent relation between the helicoid in a pitch and the annulus-sector plane.
Machines 10 00970 g001
Figure 2. Fluid domain of a fluid lubricated screw-nut pair. (a) Establishment method of CFD model. (b) Schematic diagram of computational domain. (c) CFD model in FLUENT.
Machines 10 00970 g002
Figure 3. Structured grids of the computational domain.
Machines 10 00970 g003
Figure 4. Variations of oil film forces with displacement and velocity perturbations.
Machines 10 00970 g004
Figure 5. Solving process of dynamics characteristics using the dynamic mesh technology.
Machines 10 00970 g005
Figure 6. Variations of Δ z   under different external loads and oil supply pressures. (a) “ 5   MPa , 3000   rpm , 1   N ”; (b) “ 5   MPa , 3000   rpm , 10   N ”; (c) “ 5   MPa , 3000   rpm , 100   N ”; (d) “ 3   MPa , 3000   rpm , 10   N ”; (e) “ 3   MPa , 3000   rpm , 100   N ”.
Machines 10 00970 g006
Figure 7. Variation of Δ z   under different angular velocities and oil supply pressures.
Machines 10 00970 g007
Figure 8. Variations of the dynamic parameters of the system under “ 5   MPa , 60   rpm , 100   N ”. (a) Oil film pressure. (b) Resultant force. (c) Velocity fluctuation. (d) Δ z   . (e) Inlet pressure. (f) S . (g) C .
Machines 10 00970 g008aMachines 10 00970 g008b
Figure 9. Pressure distributions obtained using Method “a” and “b”.
Machines 10 00970 g009
Figure 10. Variation of the pressures acting on the fluid particles in the Z sec -axis direction.
Machines 10 00970 g010
Figure 11. Comparison between the simulation results based on the proposed method and the previous data [10].
Machines 10 00970 g011
Table 1. Main parameters of the system.
ParameterSymbolUnitsValue
Inner radiance of the nut r h _ i m 0.0235
Inner radiance of the recess r h _ ri m 0.0265
Outer radiance of the recess r h _ ro m 0.0295
Outer radiance of the screw r h _ o m 0.0325
Thread angle α r a d π 9
Pitch P m 0.025
Initial clearance h 0 m 3 × 1 0 5
Oil density ρ kg / m 3 875
Oil viscosity η Pa   s 0.0193
Restrictor factor C sc m 5 / ( N   s ) 0.04
Table 2. Working parameters of the system.
ParametersValue
P s ( MPa ) 3
5
Ω ( rpm ) 60
1500
3000
F ex ( N ) 1
10
100
Table 3. Simulation results under non-loading conditions.
P rT ( MPa ) P rB ( MPa ) F e x ( N ) Δ z   ( m ) Method
3.70 3.70 0 0 a
5.00 5.00 0 0 b
Table 4. Simulation results under loading conditions.
Case P rT ( MPa ) P rB ( MPa ) P rT P rB ( Pa ) F e x ( N ) Δ z   ( m )Method
1 3.76 3.64 1.2 × 10 5 100 6 × 10 7 a
2 5.00 5.00 64 1.42 6 × 10 7 b
3 5.00 5.00 2100 101.10 1.8 × 10 5
Table 5. Working parameters of the system.
ParametersValue
P s ( MPa ) 3
4
5
6
7
8
9
10
Ω ( rpm ) 1500
3000
Publisher’s Note: MDPI stays neutral with regard to jurisdictional claims in published maps and institutional affiliations.