Article

Tilting Pad Journal Bearing Ball and Socket Pivots: Experimental Determination of Stiffness

1
Department of Civil and Industrial Engineering, University of Pisa, 56122 Pisa, Italy
2
Baker Hughes, 50127 Florence, Italy
*
Author to whom correspondence should be addressed.
Machines 2022, 10(2), 81; https://doi.org/10.3390/machines10020081
Submission received: 21 December 2021 / Revised: 15 January 2022 / Accepted: 21 January 2022 / Published: 23 January 2022
(This article belongs to the Special Issue Tilting Pad Journal Bearings: State of the Art)

Abstract

:
Tilting pad journal bearings (TPJB) are used in turbomachinery for their stability at high speeds. For design purposes, it is necessary to preliminarily investigate the turbomachine rotor dynamic behavior by simulation. The dynamic characteristics of all components must be known as precisely as possible and experimental validation of each single model is required. While a lot of work has been carried out on bearings, the ball-and-socket stiffness is still estimated by means of Hertzian formulas. Recently, some authors have used the finite element method, but it seems that nothing has been done experimentally to date. This paper describes the test rig designed to determine the stiffness of a TPJB ball-and-socket pivot by equipping the grippers of a tensile universal testing machine with specifically designed interfaces. A methodology for evaluating the stiffness from the experimental results is reported. Preliminary compression results are presented and compared with the analytical ones obtained using Hertz’s formula showing significant differences for the ball-and-socket conformal contact.

1. Introduction

For a predictive rotordynamic characterization of a turbomachine, it is essential to know the stiffness of all its components, including tilting pad journal bearings (TPJBs) and consequently their pivots, typically rocker-back or ball-and-socket. The latter consists of a conformal contact joint made of a spherical cap and a spherical seat (Figure 1).
The effect of pivot stiffness has proven to play an important role on the bearing dynamic behavior whenever it is of the same order of magnitude of the oil film stiffness [1,2,3]. The most common approach in evaluating the stiffness of the pivot is that based on Hertzian formulas, with all the approximations that this entails: absence of friction, small contact area, and bodies equivalent to half-spaces. A review of Hertzian equations is presented in [4], and formulas for pivot stiffness necessary for inclusion in tilting pad bearing computer programs are proposed. Similar formulas are proposed in [5]. Some of them are summarized in the following section.
Advances have been made especially in analytical and numerical approaches for non-conformal and soft contact problems to overcome the limits of Hertz’s theory related to its assumptions, and many researchers have addressed these issues even in recent years. In [6], the attention is focused on non-conformal and almost conformal contact of ball and ball-socket and the Finite Element (FE) results and solutions of Hertz’s contact theory are compared. A new universal approximate model for frictionless conformal and non-conformal spherical contacts, obtained by combining analytical and numerical methods, is proposed in [7] and adopted in [8], focusing on the free-edge effect in spherical plain bearings, and in [9] to investigate the effects of external load, radius clearance values, and material parameter on the contact mechanics of spherical fixed ring roller cone drill bits journal bearings. The effects of normal loads and friction coefficients on the distribution of both axial and circumferential contact stress in spherical plain bearings are studied, adopting both theoretical methods and FE simulations, in [10]. A generic contact mechanics analytical approach for the determination of sub-surface stresses, which is applicable to both highly conforming as well as concentrated counter-forming contacts, is presented in [11]. Robust, mathematically closed-form contact models, easy-to-implement for non-Hertzian soft and conformal contacts, using a set of independent Kelvin–Voigt elements spread all over the contact surfaces, are proposed in [12] and validated through FE analysis. The effects of conformity on local contact related quantities at the wheel–rail interface are investigated by means of FE models, and also with an adapted Kalker’s rolling contact theory approach in [13]. Analytical and numerical contact models for dry and lubricated clearance joints are reviewed in [14]. Moreover, the validity of the Hertz theory for spherical indentation on soft elastic solids undergoing large deformations using nanoindentation tests and finite element method is investigated in [15], showing significant theoretical under- and overestimations of the contact radius and maximum contact pressure. Even the effect of roughness has been studied. In [16], rough contacts are investigated, showing that accounting for roughness in a rough contact yields more accurate solutions and that comparisons between atomistic contacts and Hertz’s theory can be improved by a Gaussian filtering method.
Indeed, a Finite Element calculation, though time-consuming, can provide an accurate evaluation of contact characteristics when non-ideal geometrical shapes and features are concerned. Nonetheless, even these complex approaches involve approximations related to modeling the contact and constraint conditions that need an experimental validation. In [17], for example, optical techniques are applied to investigate the mechanical response of a spherical plain bearing comparing the experimental results to the FE solutions, studying the effects of boundary conditions.
Contact stiffness of conformal surface (flat) specimens has been evaluated by impact in [18] and by applying a static load focusing on the effect of roughness in [19]. The experimental data of normal force and deformation are fitted using nonlinear contact laws.
To date, TPJB pivot stiffness has been determined loading a single pad of the bearing mounted on the bearing test rig by pressing together the bearing and the shaft in dry conditions and measuring the relative axes displacement [20,21]. The estimated stiffness was used in TPJB computer programs and rotordynamic predictions improved compared to the ones obtained using Hertzian formulas.
The purpose of this paper is to present an experimental equipment and a procedure for determining the stiffness of a single TPJB ball-and-socket pivot, set up and tuned by means of a series of tests. The experimental results are reported and compared to the theoretical ones obtained with Hertzian formulas. As there is lack of experimental analysis in this field compared to the number of publications on analytical and numerical studies of spherical conformal contacts, the proposed original approach can be a useful contribution for further progress.

Relevant Hertzian Formulas for Deformation and Stiffness in Point Contacts

A review of the main formulas that can be found in the literature specifically addressed to pivot stiffness is reported in the following paragraphs.
According to the Hertzian theory [22], by considering two spheres with radii R1 and R2 pressed together with a force W, the relative displacement δ of the spheres at the centre of the contact can be evaluated with the formula:
δ = ( 3 2 ) 2 / 3 ( W 2 E 2 R ) 1 / 3 = 1.310 ( W 2 E 2 R ) 1 / 3
where R and E are the equivalent radius and elasticity modulus, respectively:
1 R = 1 R 2 ± 1 R 1 ,   1 E = 1 2 [ 1 ν 1 2 E 1 + 1 ν 1 2 E 1 ]
where ν is the Poisson ratio and the subscripts 1 and 2 refer to the two bodies. The positive sign has to be chosen in the first of Equation (2) if the centres of curvature of the two spheres are in opposite half-spaces with respect to the plane tangent to the spheres at their theoretical contact point, while the negative sign has to be used for the other case, corresponding to a sphere in a spherical seat.
By manipulating the above formulas, load and stiffness can be easily obtained:
W = 2 3 δ 3 / 2 R 1 / 2 E = 2 3 ( δ 3 R E 2 ) 1 / 2
K = W δ = ( 3 2 ) 1 / 3 ( W R E 2 ) 1 / 3 = 1.145 ( W R E 2 ) 1 / 3
It is worth mentioning that, as also reported in [4], the stiffness evaluated by the above formula is a tangent spring rate that gives the local slope of the load vs. deflection curve, corresponding to tanβ in Figure 2. This is the most significant value of stiffness under dynamic conditions when a dynamic load, smaller than the static one, is applied.
Some authors use the ratio of the total applied load and deformation that is a secant stiffness, Ks, corresponding to tanα in Figure 2. By dividing load by displacement, given, respectively, by Equations (1) and (3), we obtain:
K s = W δ = ( 2 3 ) 2 / 3 ( W R E 2 ) 1 / 3 = 0.763 ( W R E 2 ) 1 / 3
As it is also evident from the figure, and by comparison of Equations (4) and (5), Ks < K and their ratio is Ks = 2/3 K. Some authors use the formula for Ks instead of the one for K for the evaluation of the pivot stiffness [3,21].
It must be remarked that different notations can be found in the literature. The ones reported above are commonly used in many books, for instance [23,24,25]. In fact, sometimes slightly different formulas are used for the equivalent radius and elasticity modulus by including or not including the numerical coefficient 1/2 in Equation (2). Obviously, the other formulas are varied accordingly.
Different notations are often employed for TPJB pivots. Kirk and Reedy’s [4], based on the formulas reported in [26], are commonly used. They are reported in Appendix A for completeness.
In the Results section, the experimental results will be compared with the ones obtained with some of the above formulas.

2. Materials and Methods

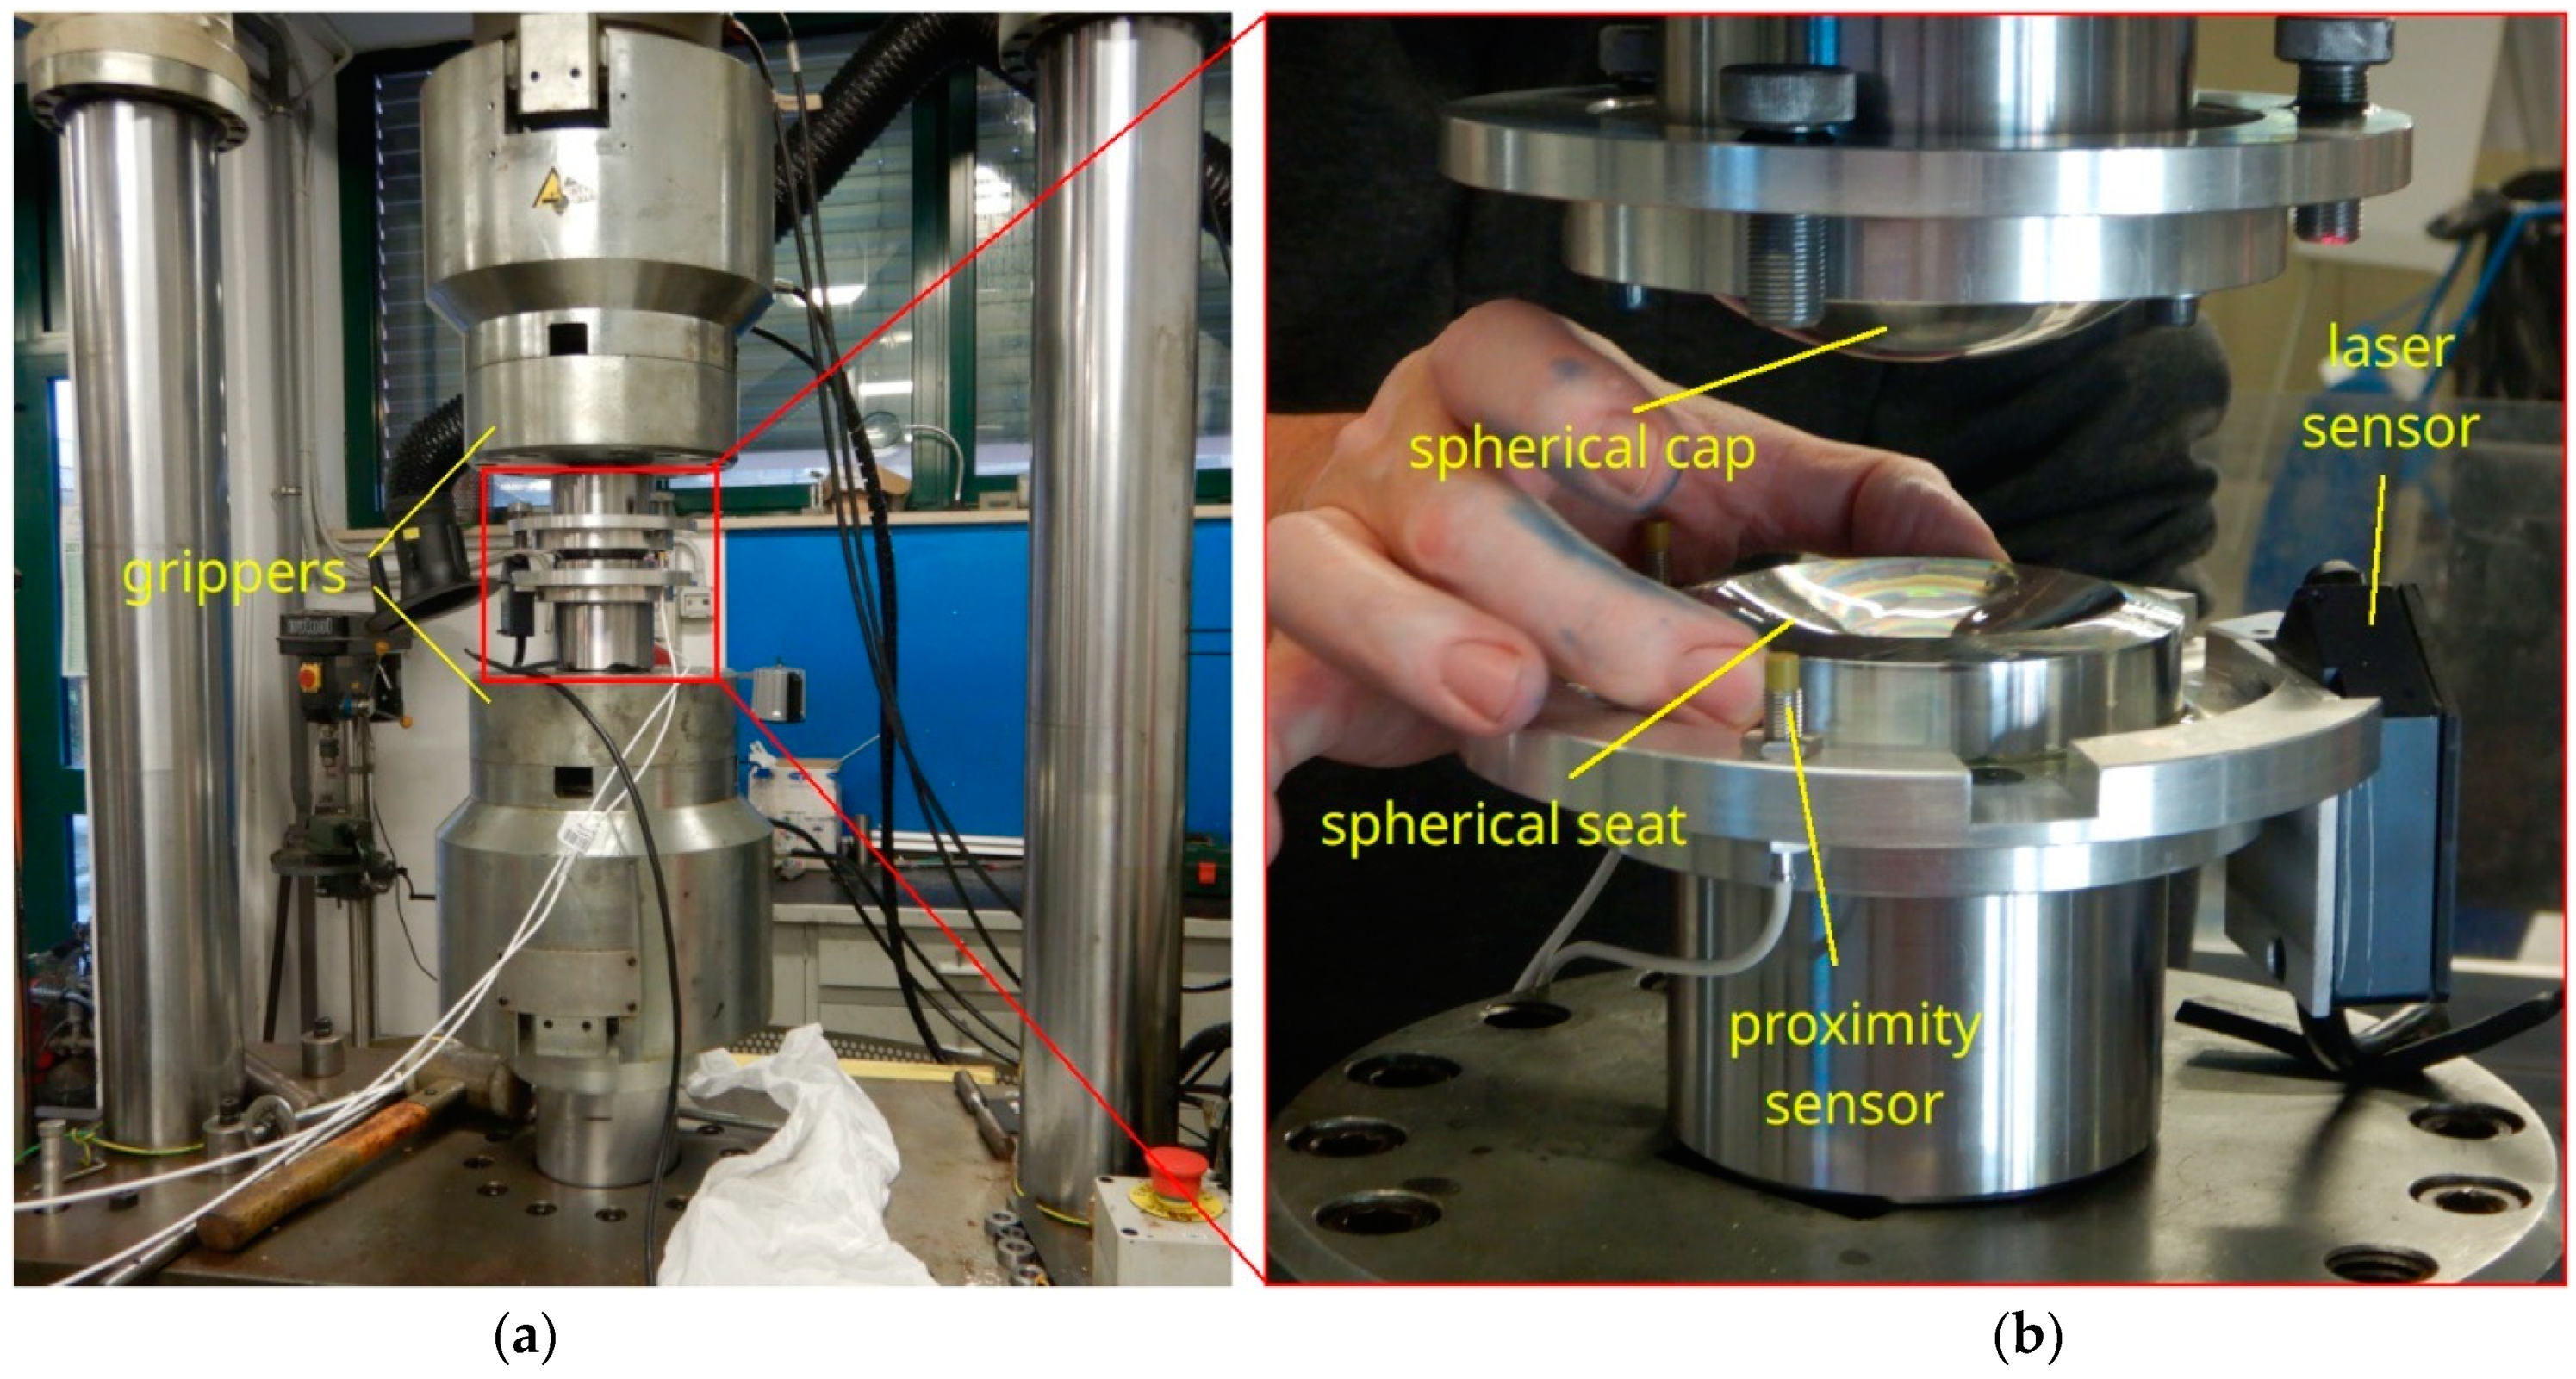
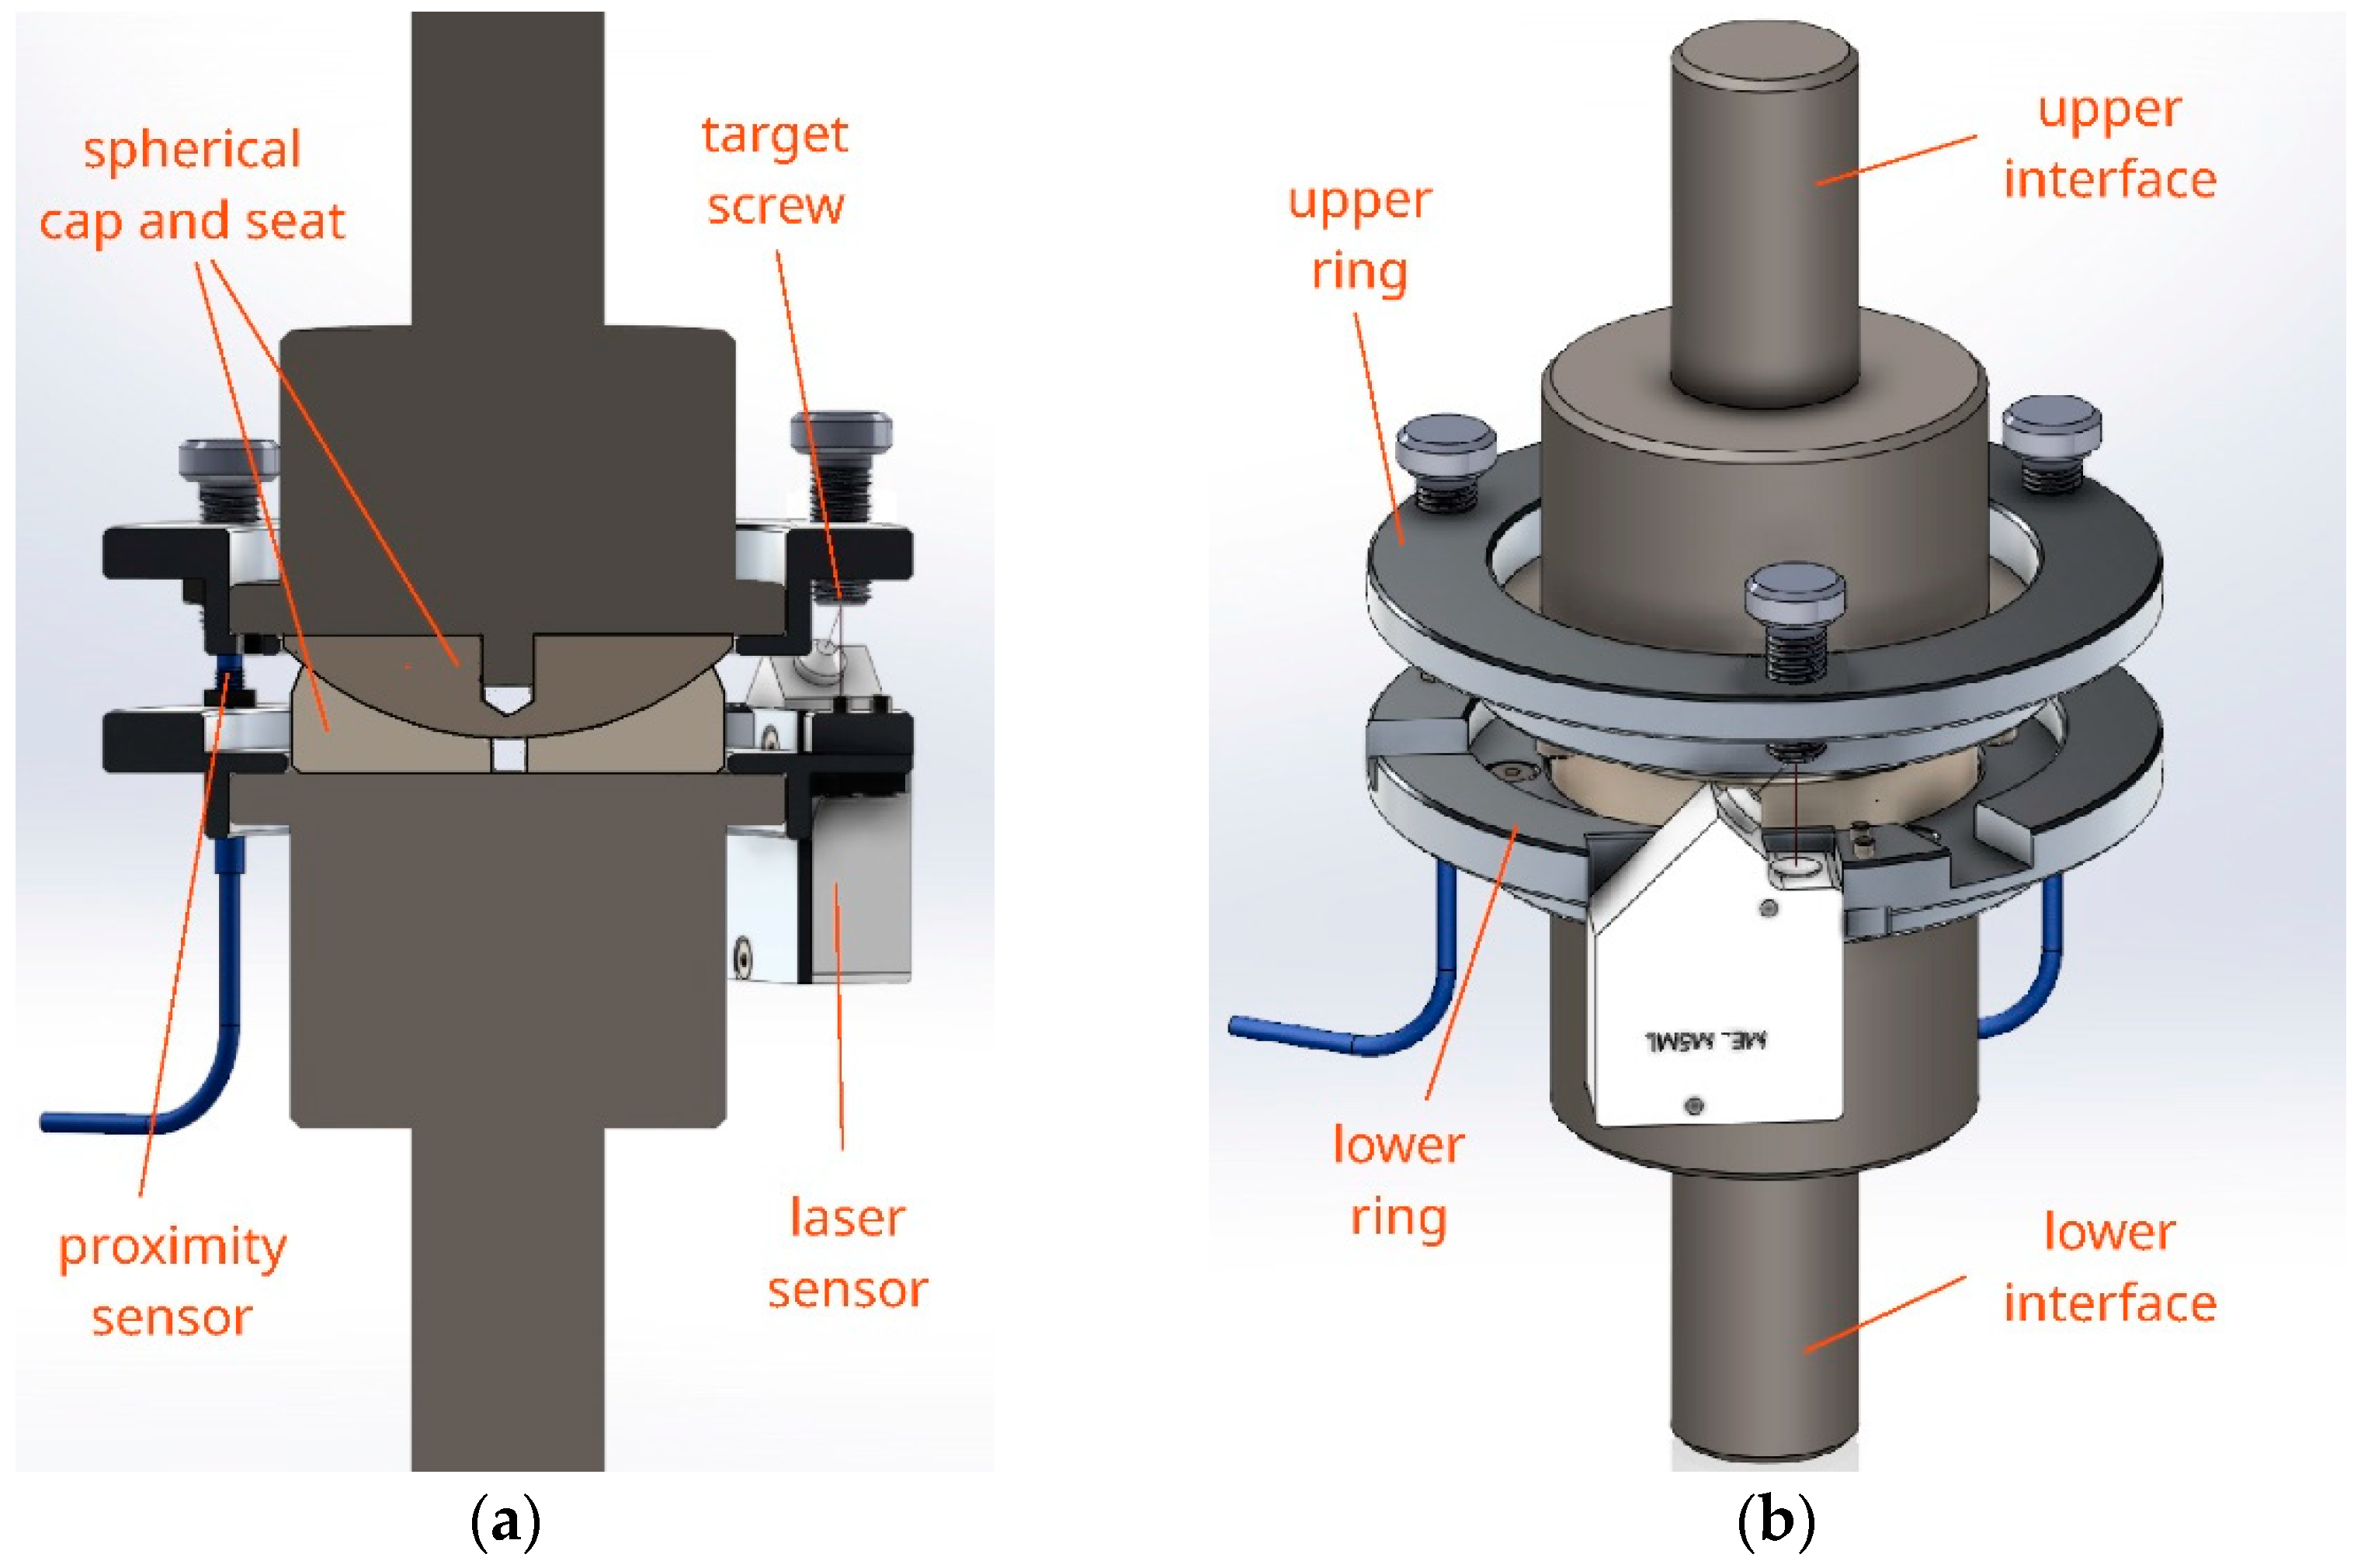
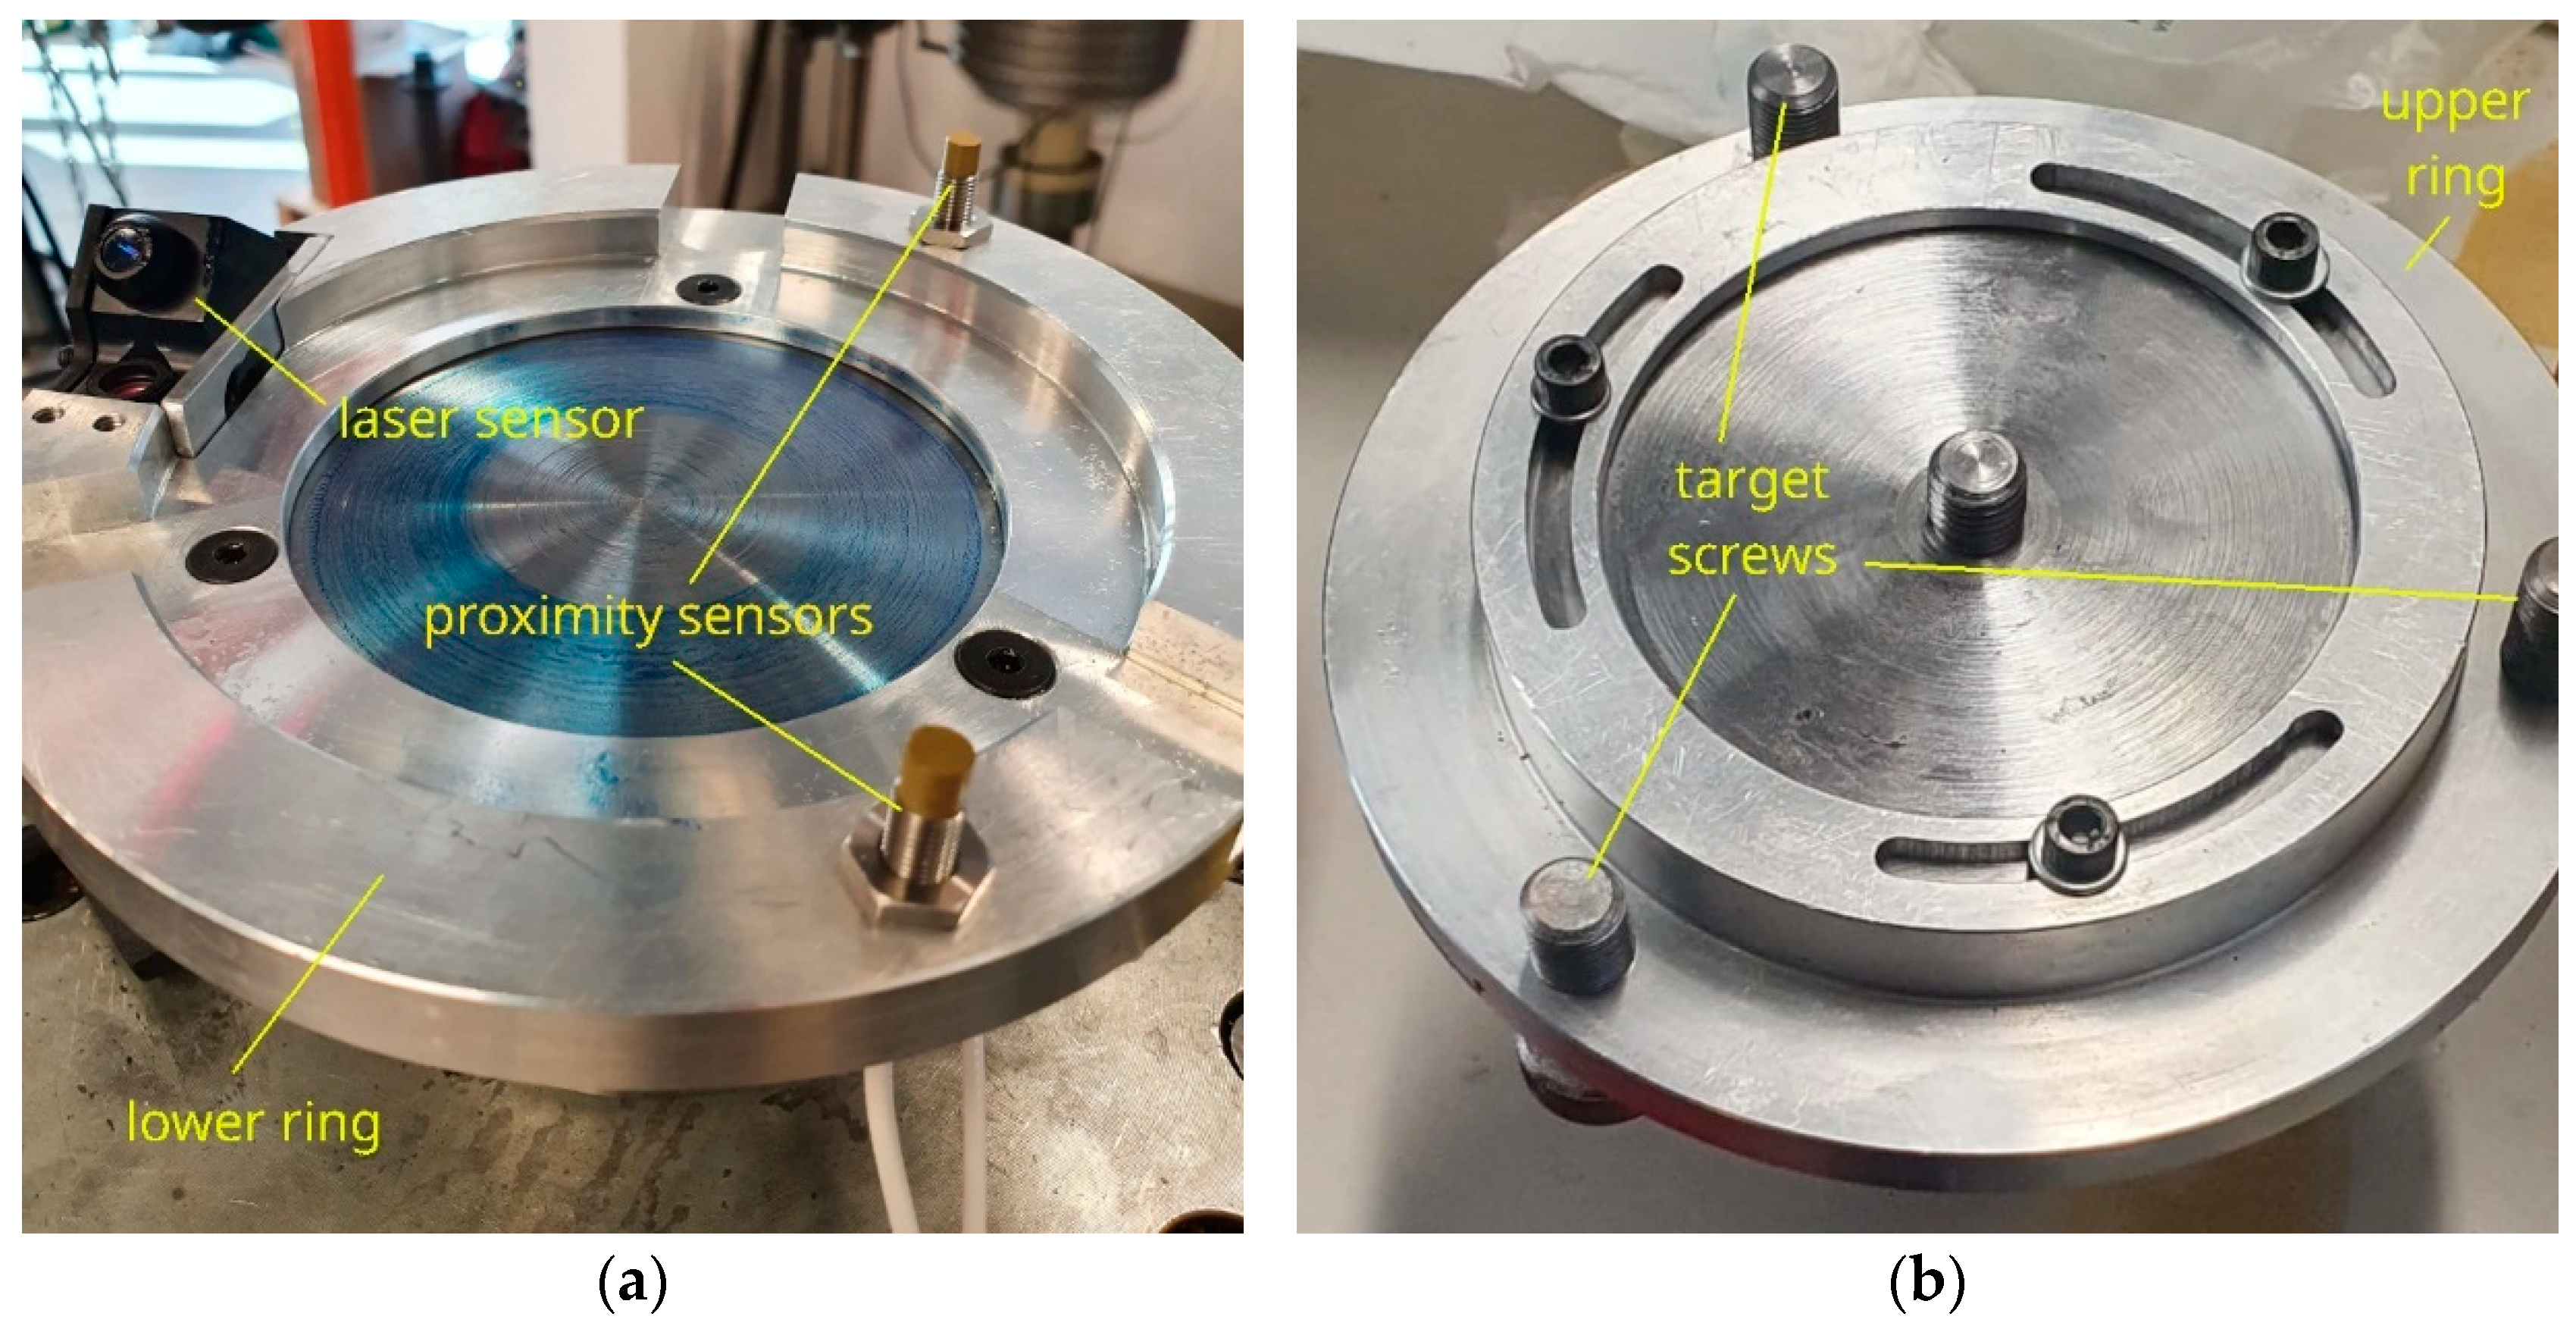
2.1. The Experimental Apparatus

The test rig consists of a Schenck uniaxial testing machine (load capacity 250 kN, maximum frequency about 10–20 Hz) with grippers equipped with specifically designed interfaces (Figure 3 and Figure 4).
The upper and lower interfaces are, for some aspects, similar, in the sense that they both have a cylindrical end to be inserted into the grippers of the machine, a larger cylindrical central part in contact with the gripper plane surface, and finally a flanged end with 3 threaded holes at 120° to which the upper or lower ring, respectively, is fixed by screws (Figure 5). They differ for the specimen fixing system. The upper interface flange has a central threaded pin that fixes the spherical cap specimen. The lower interface flange has just a plane surface, and the seat specimen is free to adjust its position with respect to the cap, centered by its spherical surface. There is a 1 mm radial clearance between the specimens and the rings.
Two proximity sensors are screwed on the lower ring along with a laser sensor, fixed by means of a suitable bracket (Figure 5a). The sensors are located at radial distance of 70.5 mm from the ring center and at a mutual angular distance of 120°. On the upper ring, three screws act as targets to the three displacement sensors (Figure 5b). The upper ring has also three slotted holes arranged at 120° through which the screws pass, fixing it to the upper interface. This allows us to adjust the upper ring angular position with respect to the lower one for target–sensor alignment.
The proximity sensors are eddy current sensors with a measurement range of 0.2–2.2 mm, rated output of 126.50 μm/V and 124.38 μm/V, respectively, and a linearity error of 0.1–1.5%. The laser sensor has a measuring range of ±0.25 mm and a rated output of 26.66 μm/V. The sensors average measurement repeatability is about 3 μm. Due to the axial symmetry of the specimens and of the sensors location, the displacement measures acquired simultaneously from the three sensors should provide, in ideal conditions, the same value. The apparently redundant measuring system makes it possible to check eventual load misalignment and sensor malfunctioning.

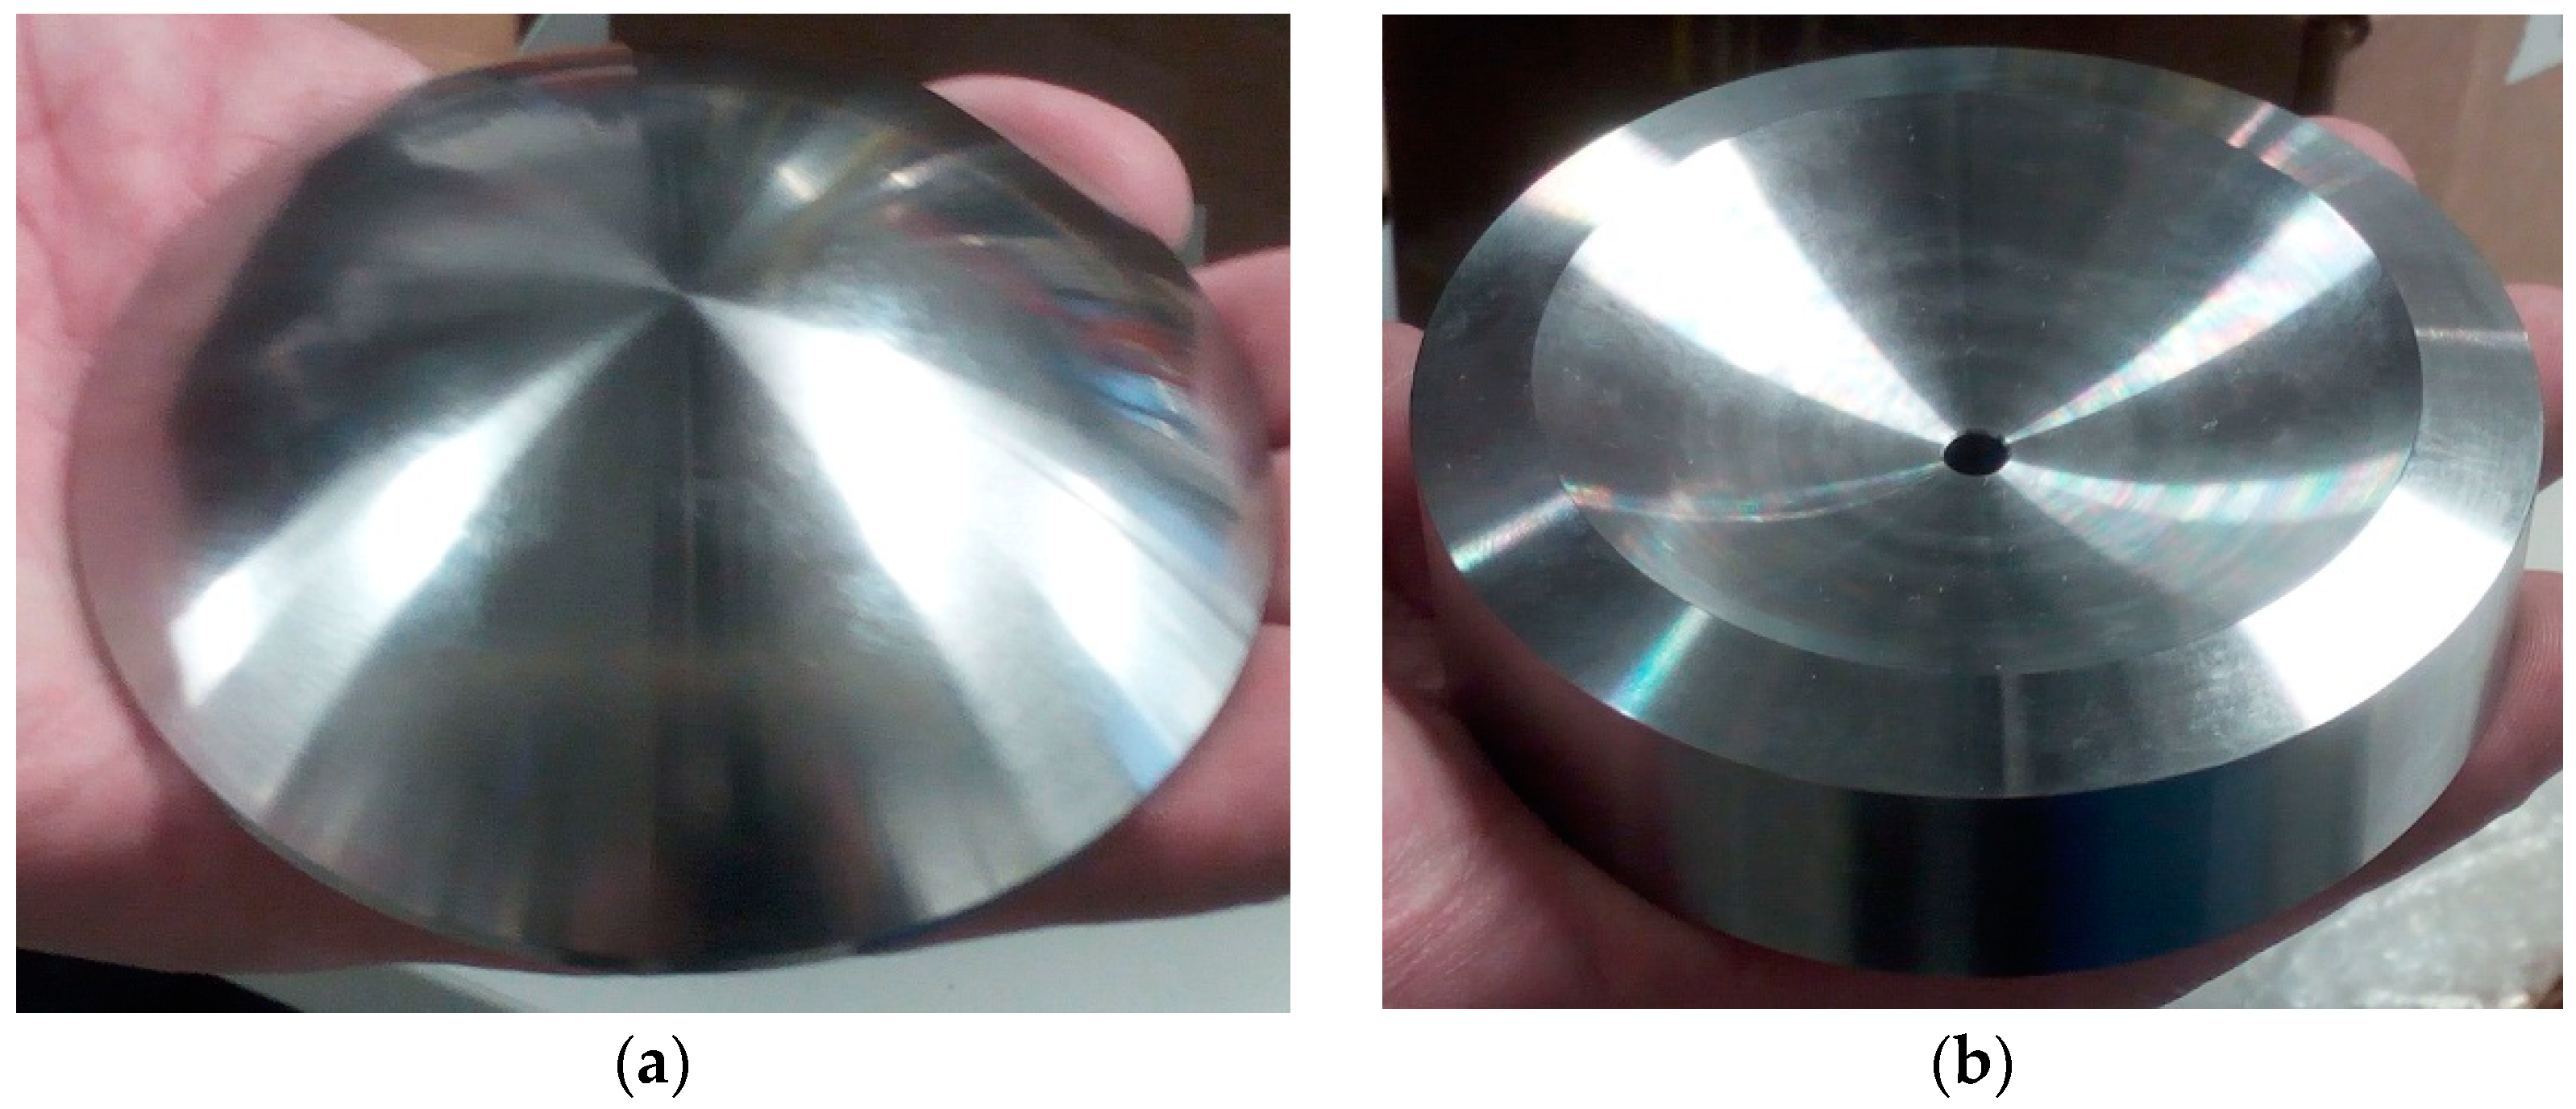
2.2. The Test Articles

The test articles are the components of a 280 mm diameter TPJB pad pivot. They consist in a spherical cap and a spherical seat (Figure 6) made of steel with nominal sphere diameter of 127 mm with a μm tolerance on sphericity and a smooth surface with roughness Ra below 1 μm. The cap has a circular base of 88.9 mm diameter and a height of 20.3 mm. It has a central axial threaded blind hole. The seat is a cylinder of 88.8 mm diameter, 23.5 mm high, with a spherical segment convex top. On the seat top, there is a spherical cup of 34.64 mm base radius, 10.28 mm deep, with a central thru axial hole of 5 mm diameter. The diametral clearance between cap and seat ranges from 0.046 to 0.104 mm.

2.3. The Test Procedure

The tests consisted of compression load ramps applied to the ball-and-socket specimens on the uniaxial testing machine. The machine lower gripper slowly approaches the upper one, under force control, until the two specimens come in contact. The load is increased linearly from 5 kN up to 150 kN and then decreased to 5 kN at a rate of 1 kN/s. Due to the machine control capability, 5 kN was chosen as the zero point for the sensors and as the starting point for the load ramp and measurement recording. A sampling frequency of 10 Hz was used. Each test comprised two consecutive ramps and was repeated 5 times.
Tests with consecutive ramps at various frequencies (0.5, 5, and 10 Hz) were also performed and followed by single ramps to check for eventual response changes.
Tests were performed at ambient temperature, in dry and boundary lubricated contact conditions between the cap and the seat and also between the specimens and the fixture interfaces.

2.4. Stiffness Evaluation

The approximate evaluation of the stiffness Ki done by simply using the incremental ratio for each single value of the load Wi,
K i = W i + 1 W i 1 δ i + 1 δ i 1
where δi is the corresponding displacement, was not possible due to some local fluctuation of the recorded values of load and displacement. Therefore, some tests were performed with the curve fitting (nonlinear least square) method. Matlab® and spreadsheets were indifferently used. Two formulas were used for optimization, one with two and one with four constants:
δ = c 1 W c 2
δ = c 1 + c 2 W c 3 e c 4 W
and the corresponding stiffnesses were simply obtained by differentiation:
K = [ c 1 c 2 W ( c 2 1 ) ] 1 ,
K = [ c 2 e c 4 W ( c 3 W ( c 3 1 ) c 4 W c 3 ) ] 1

3. Results

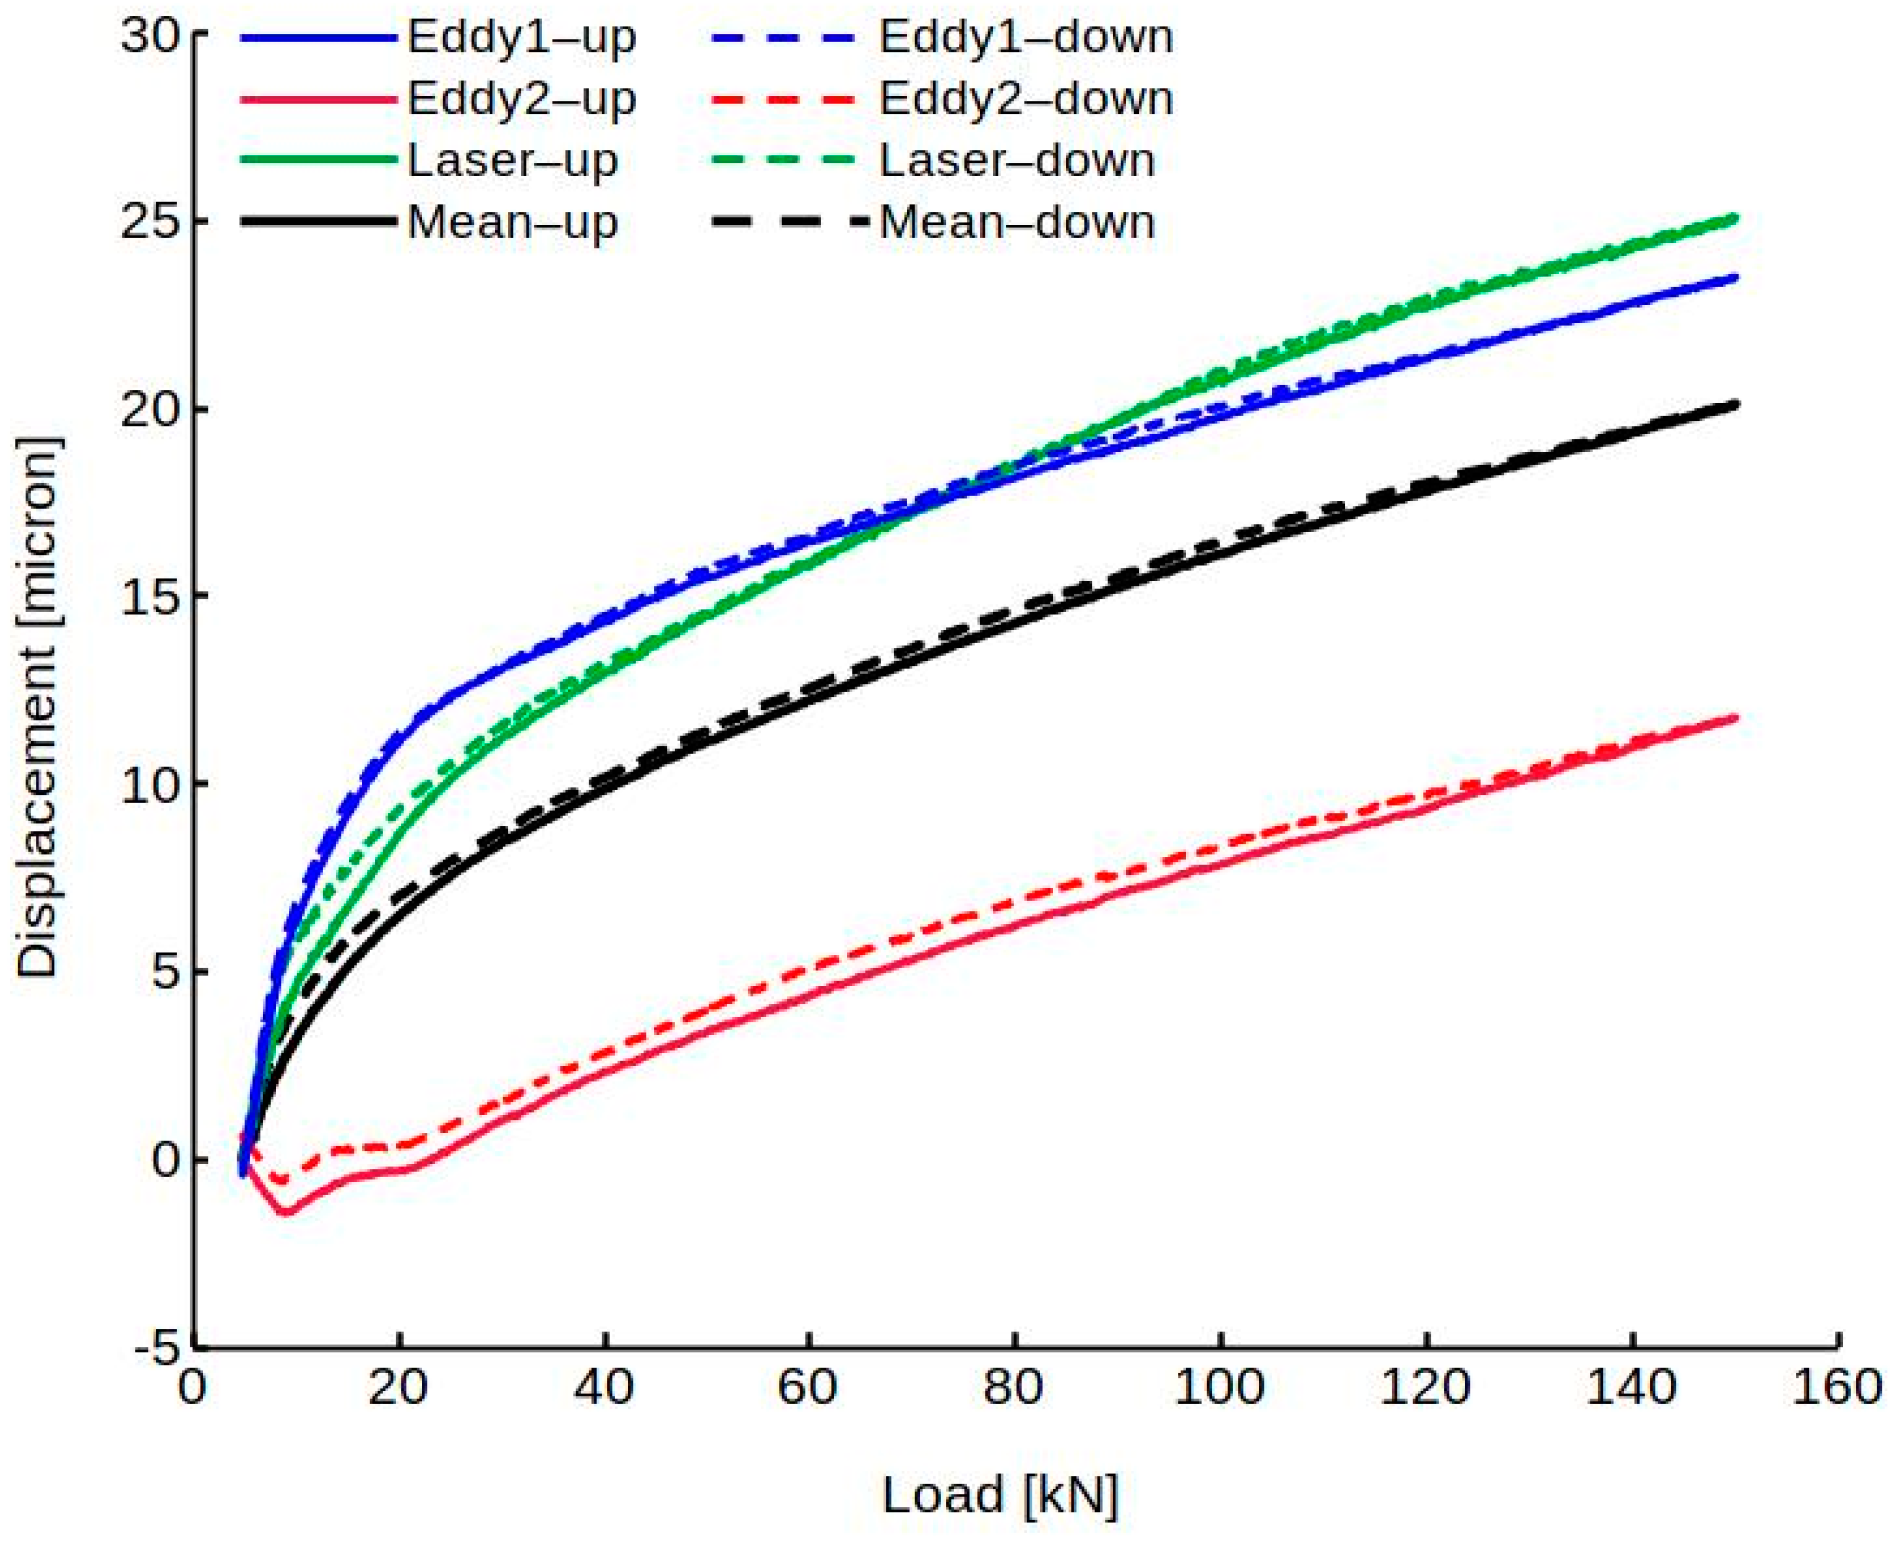
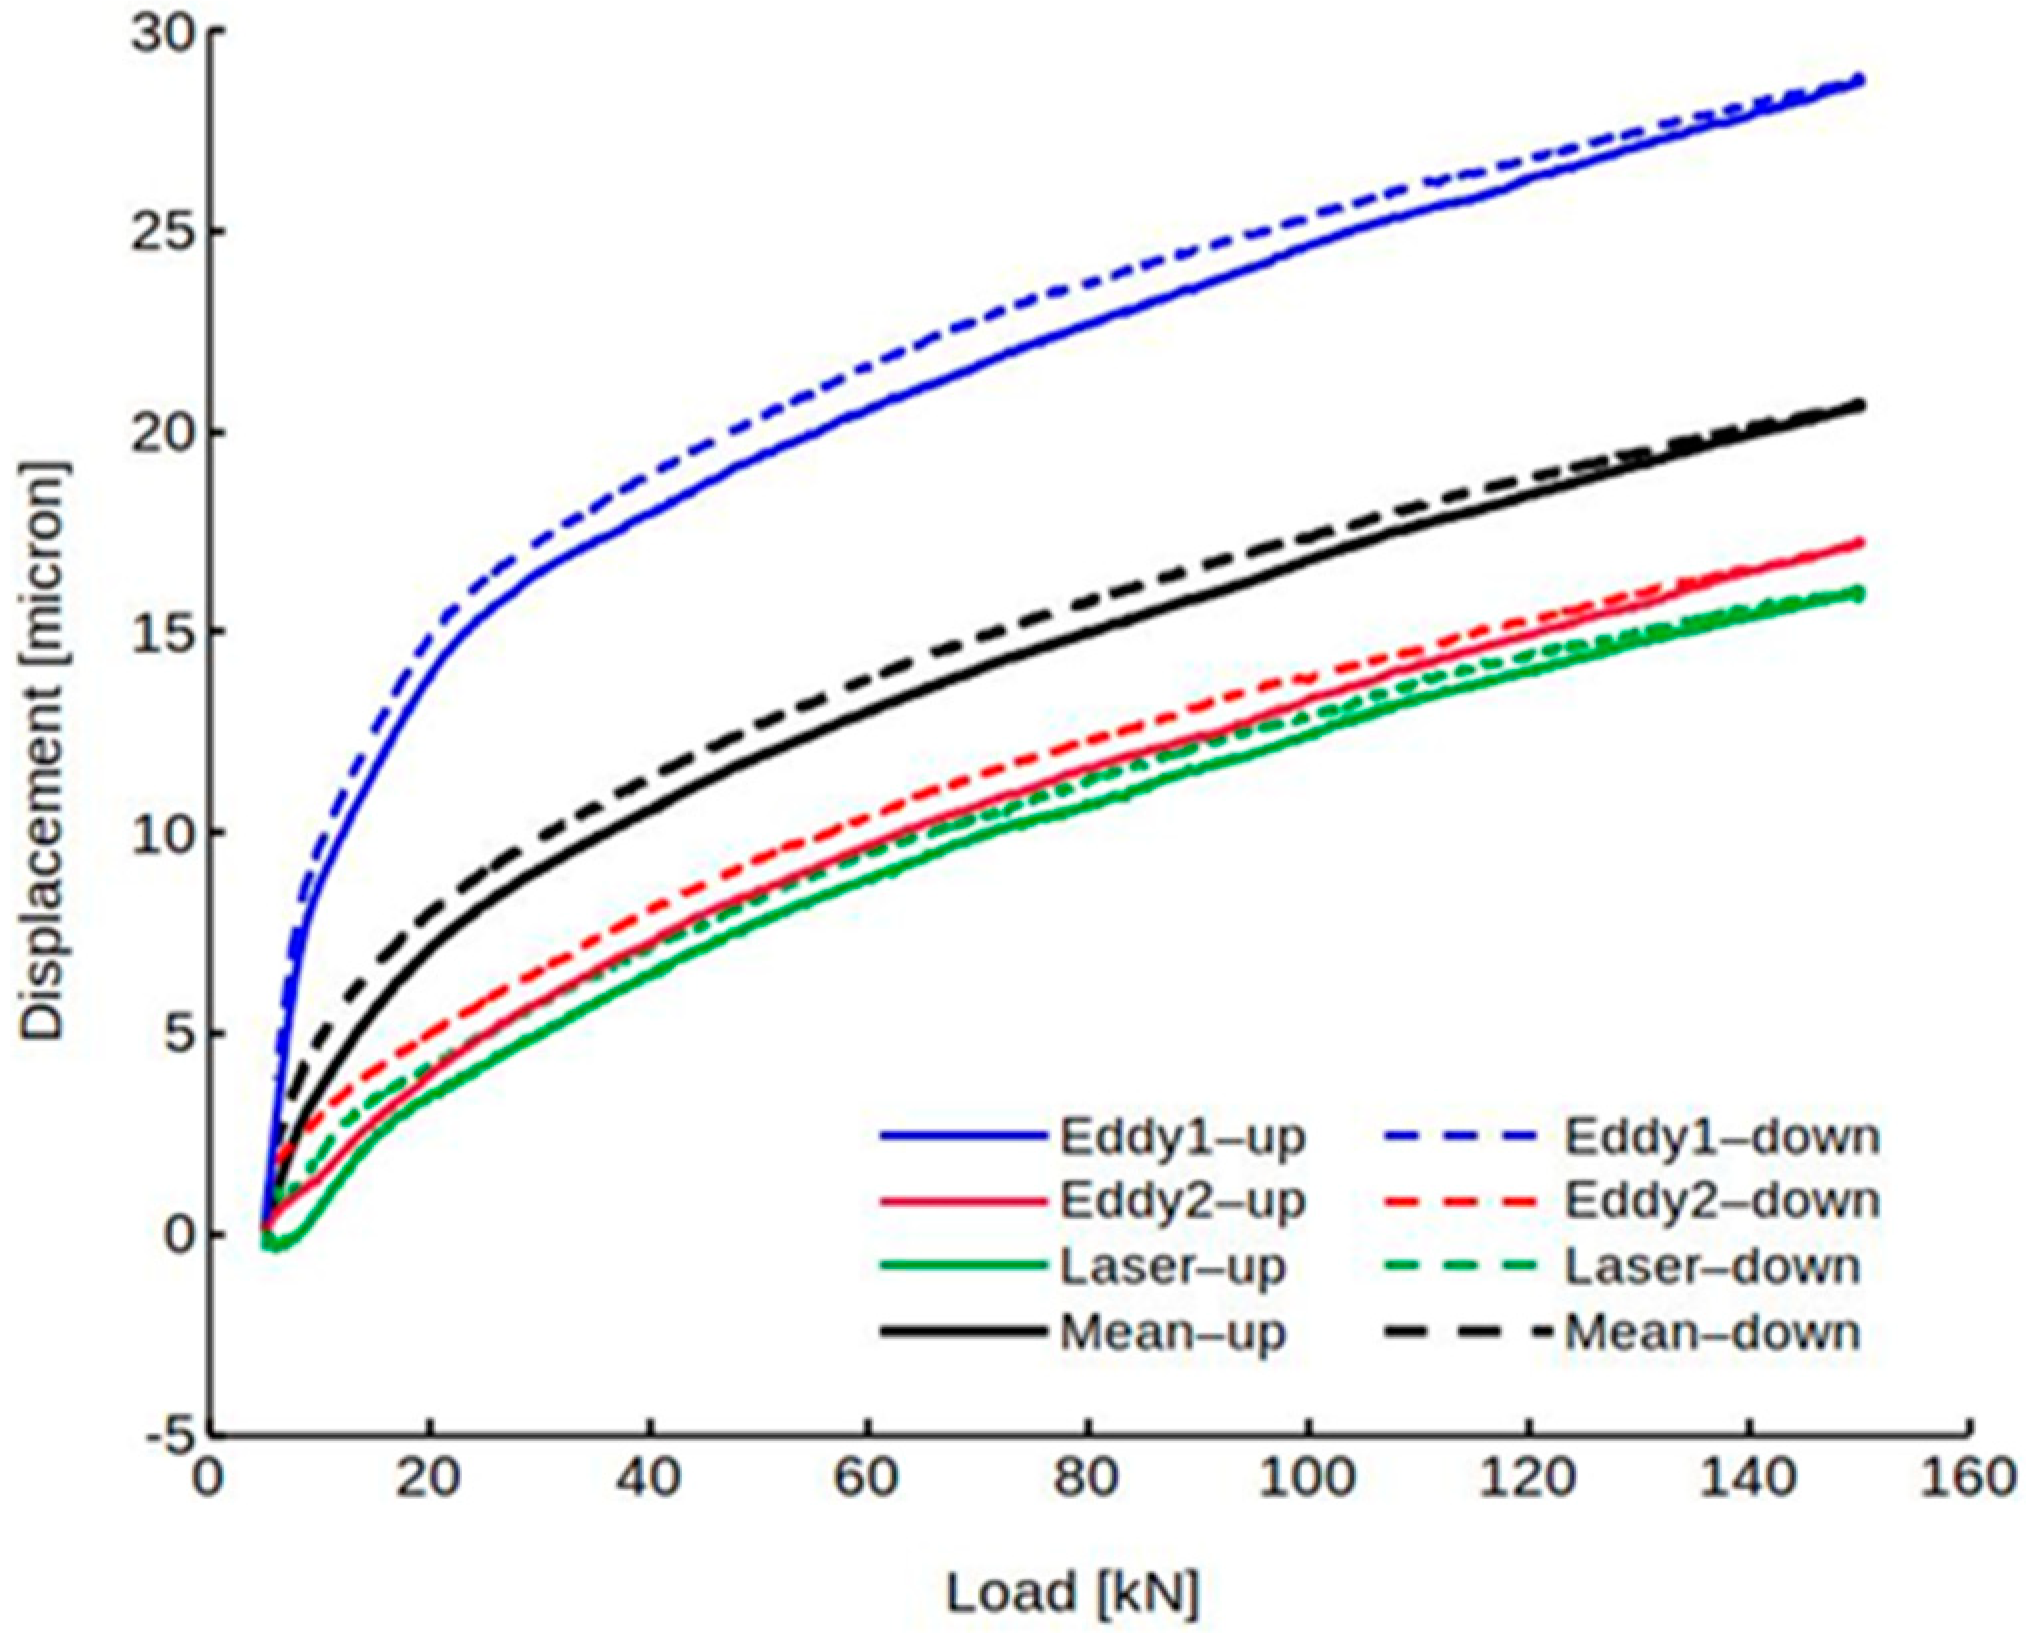
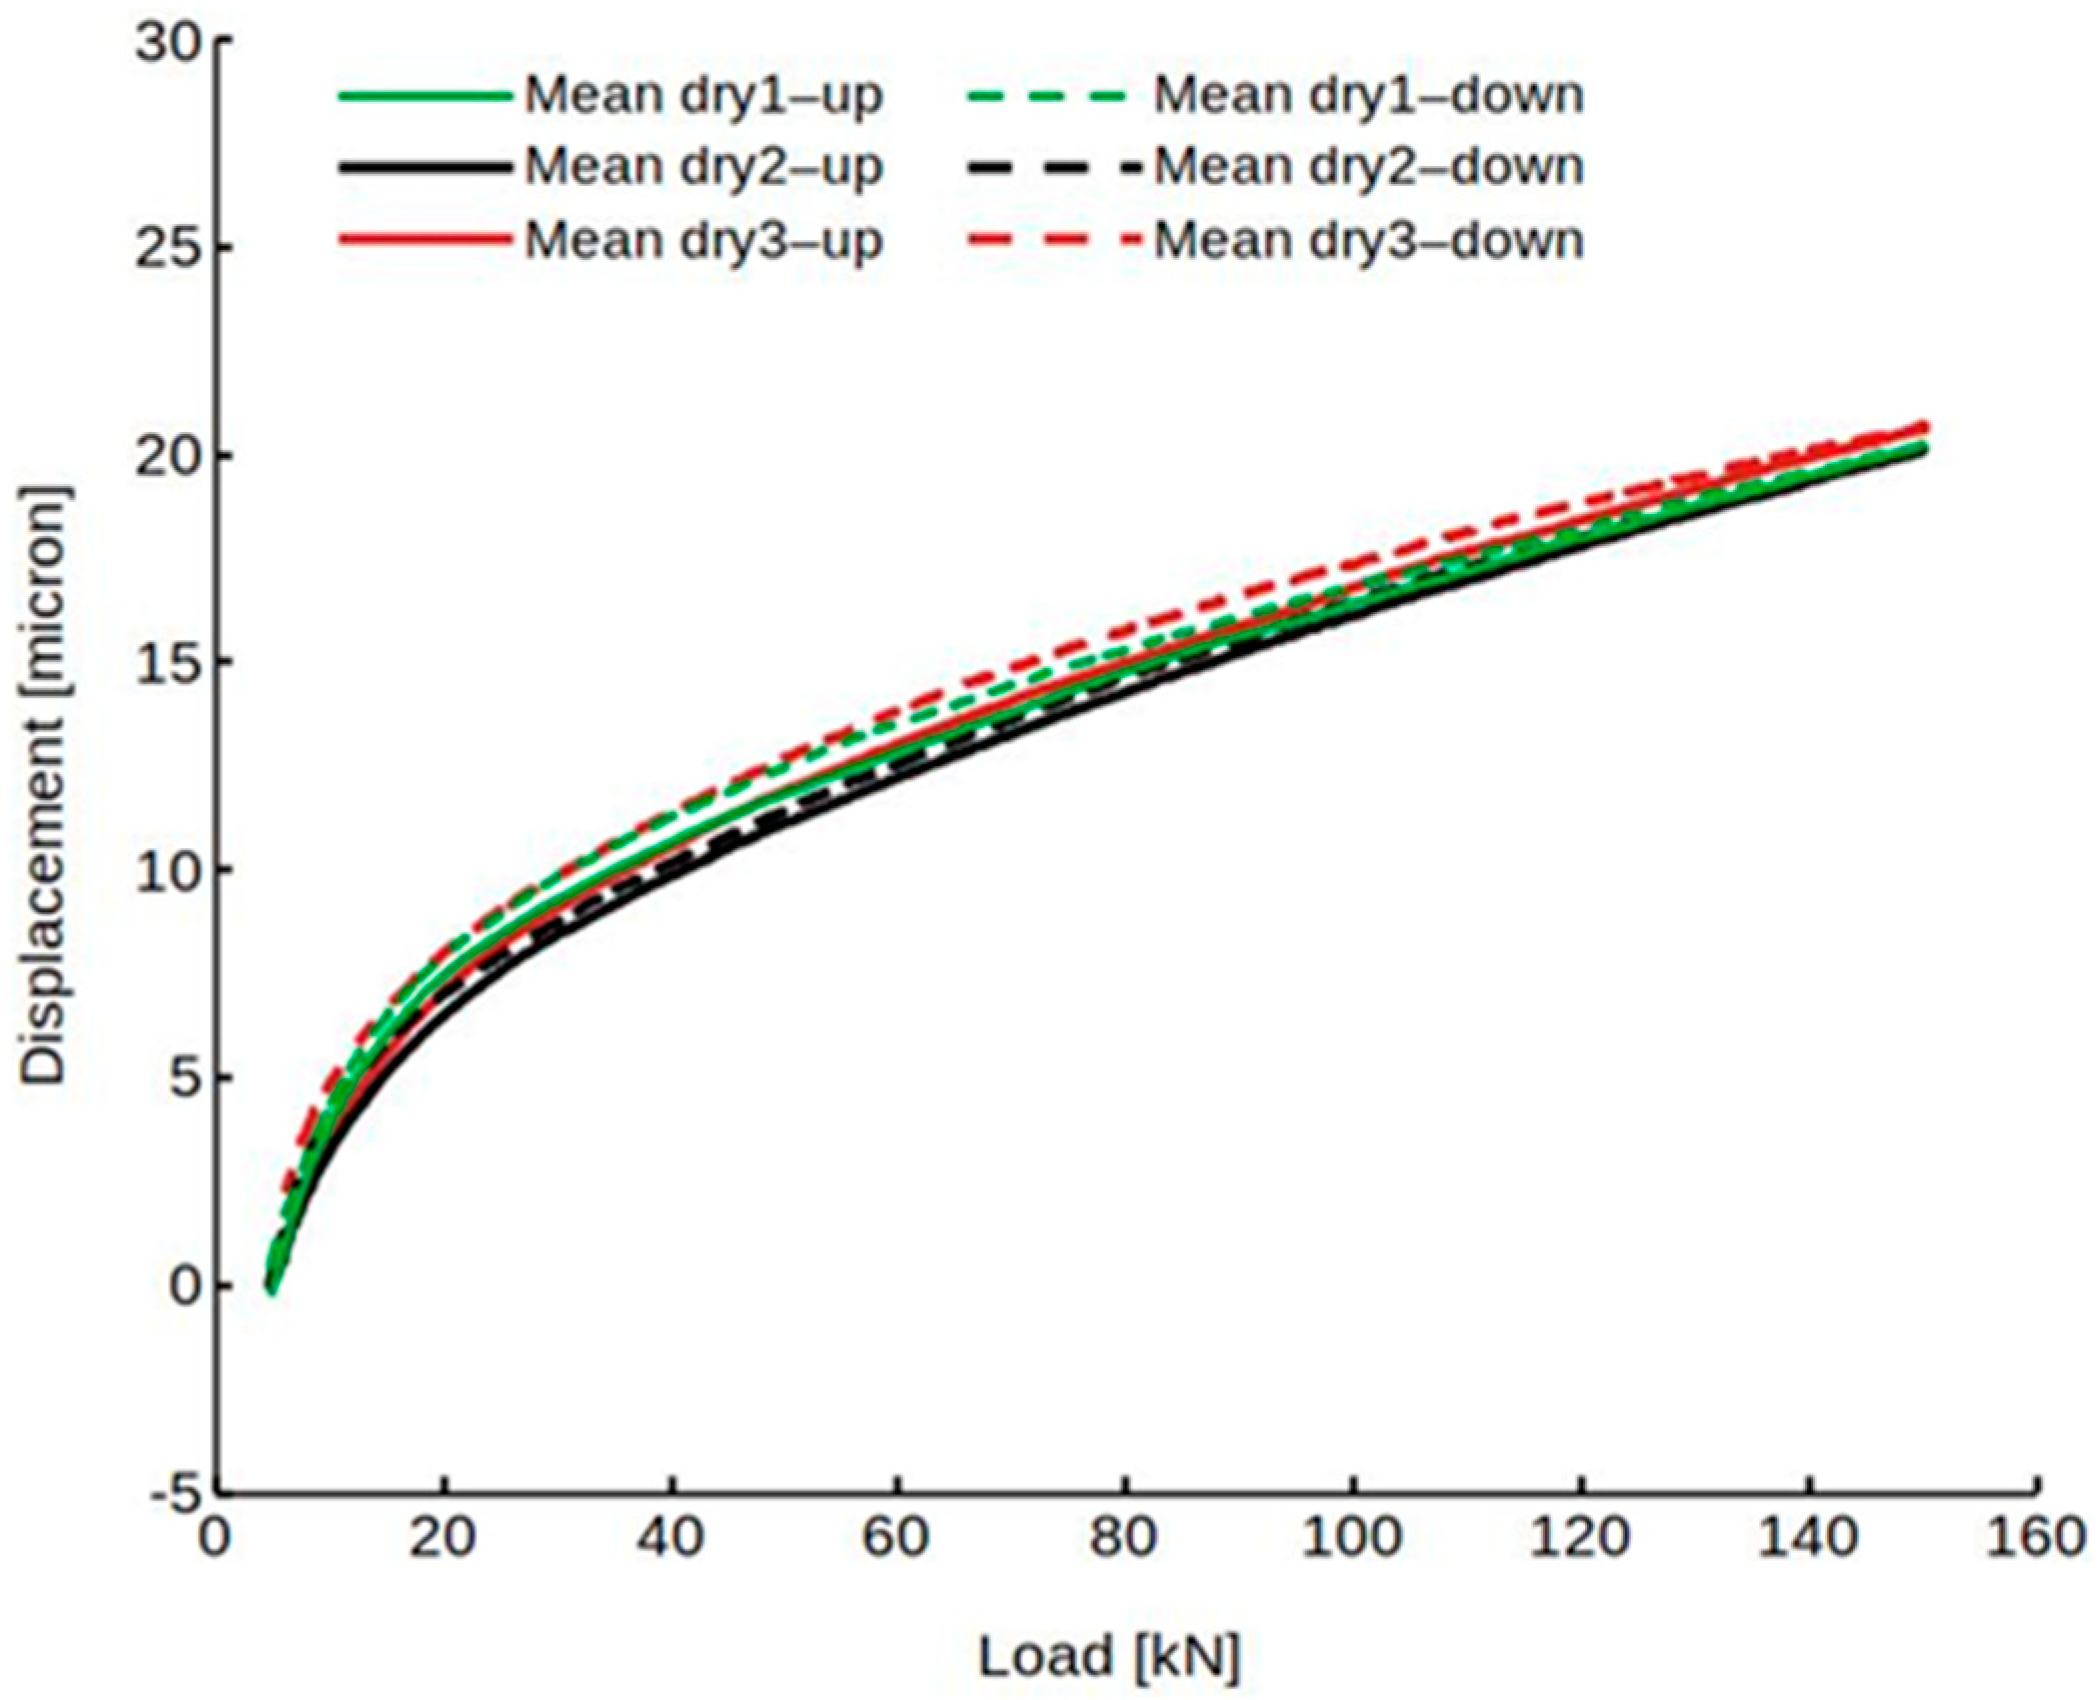
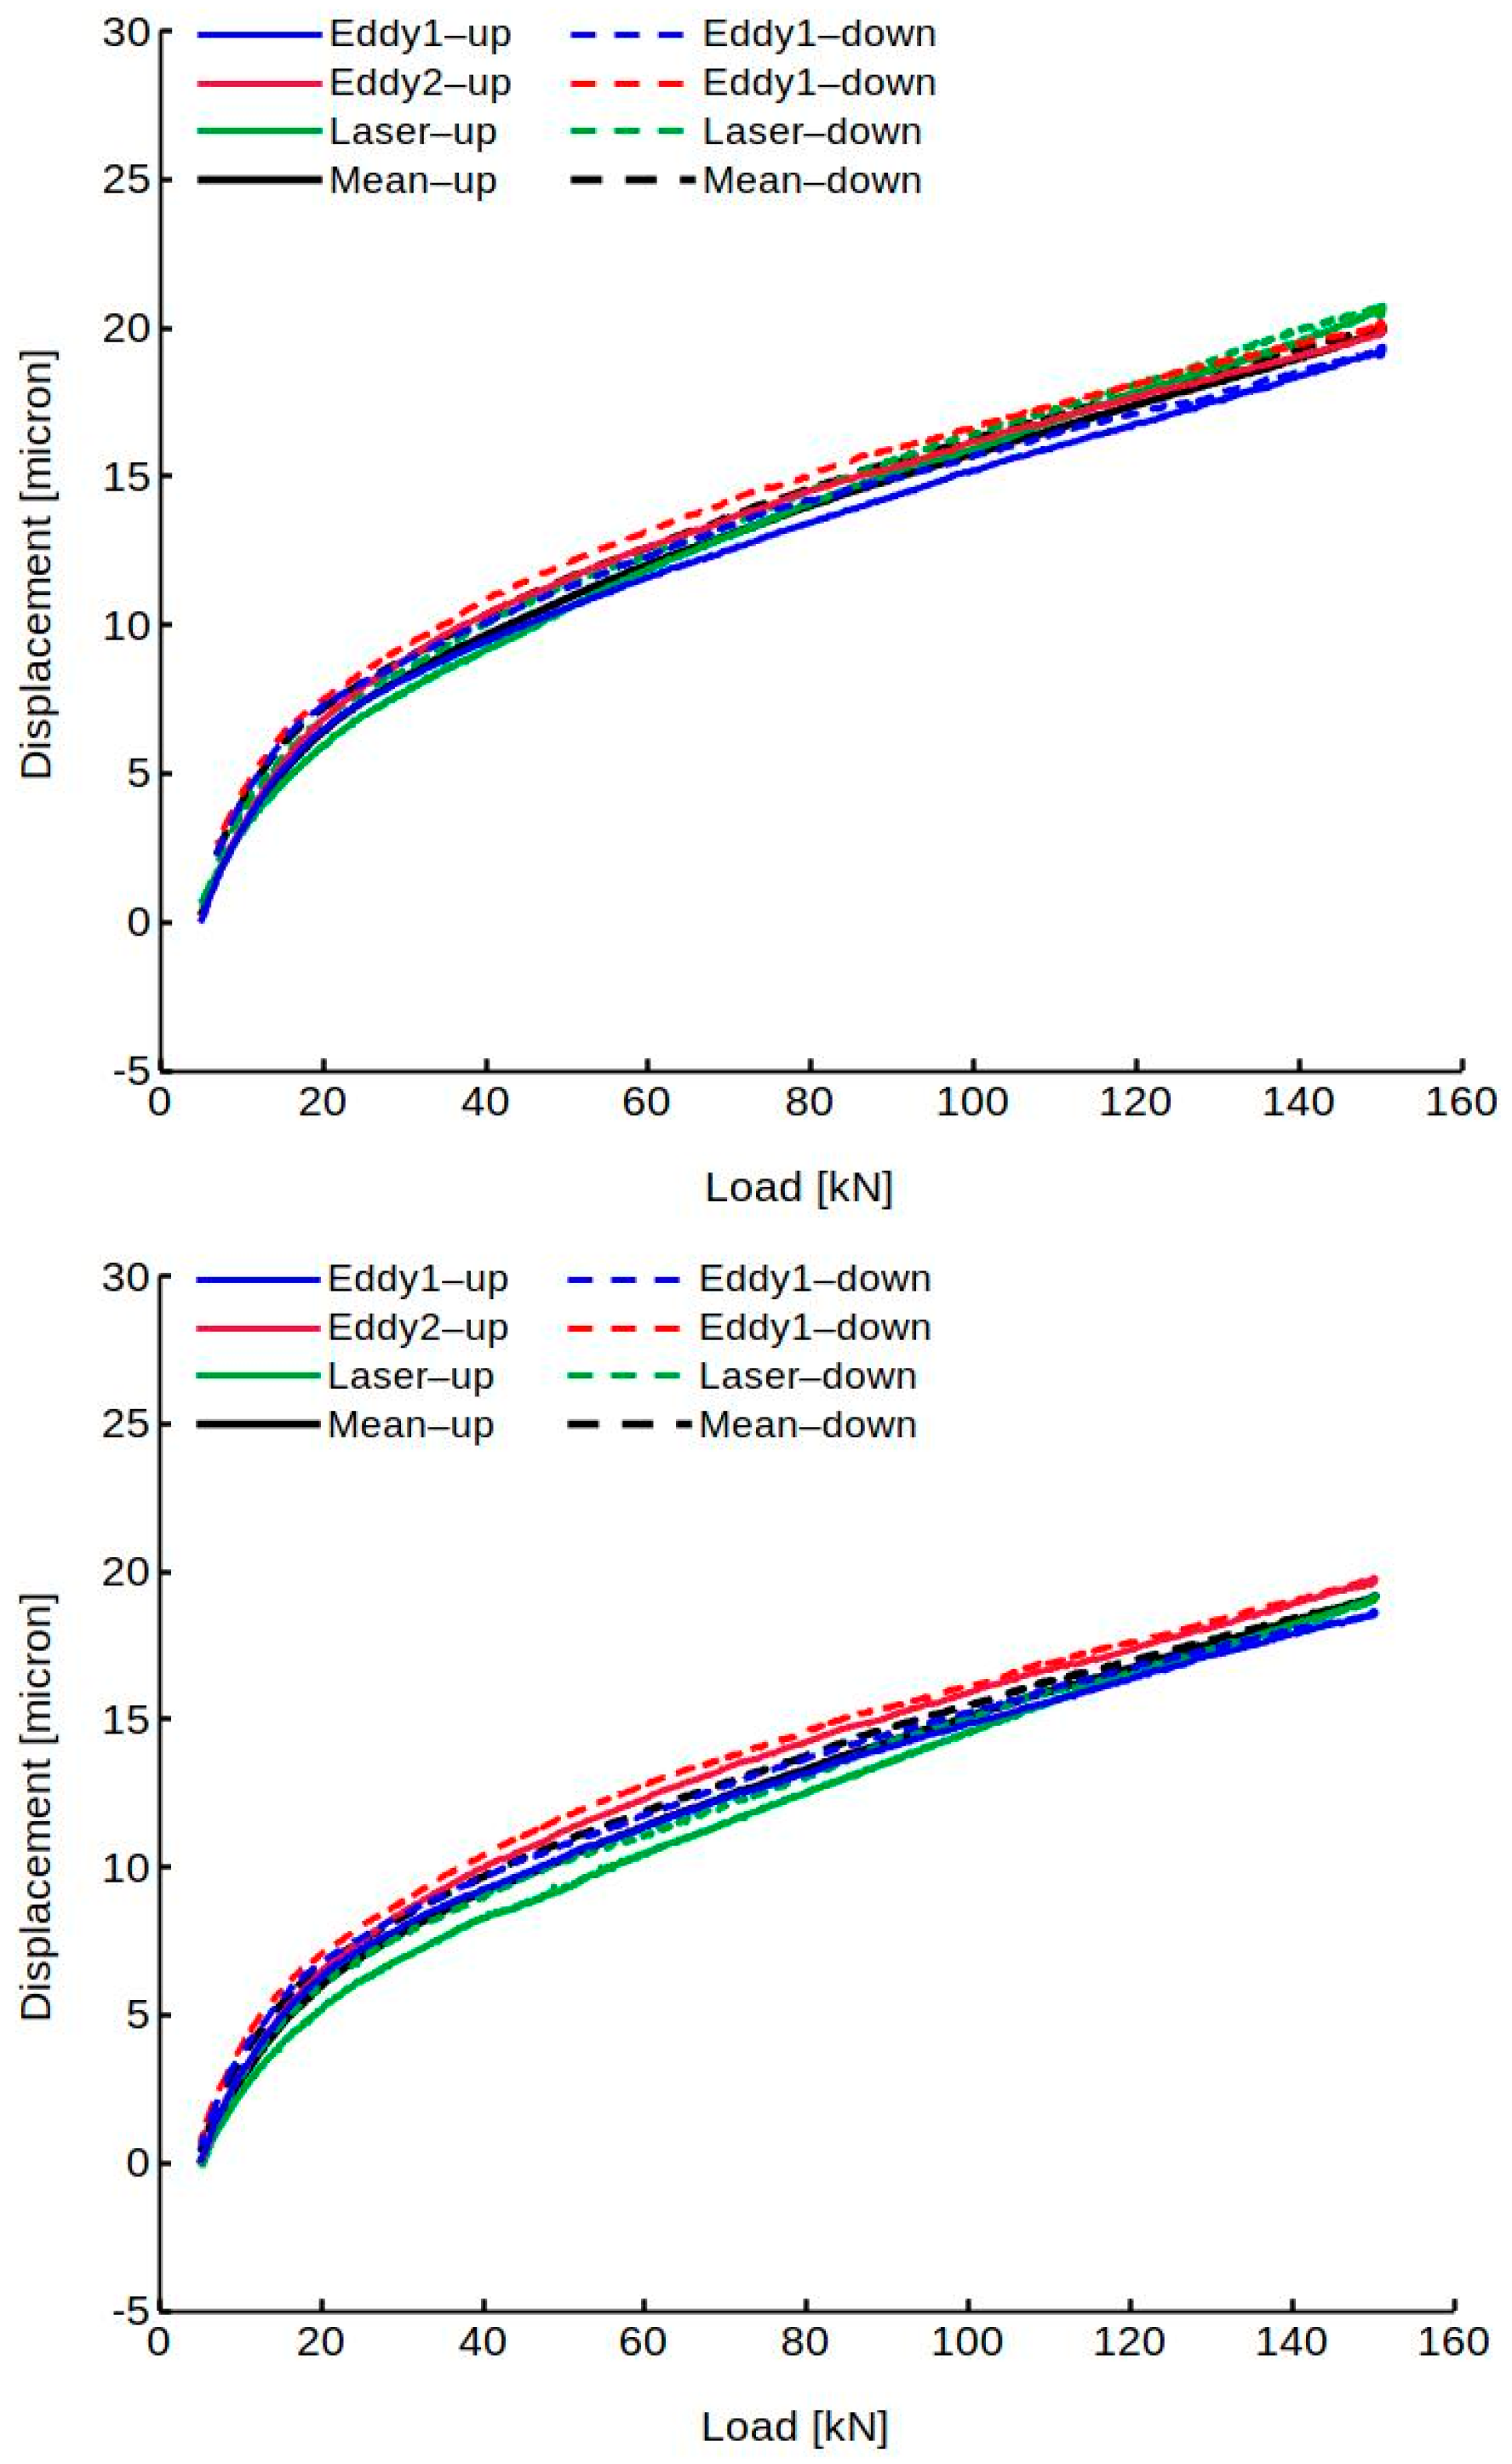
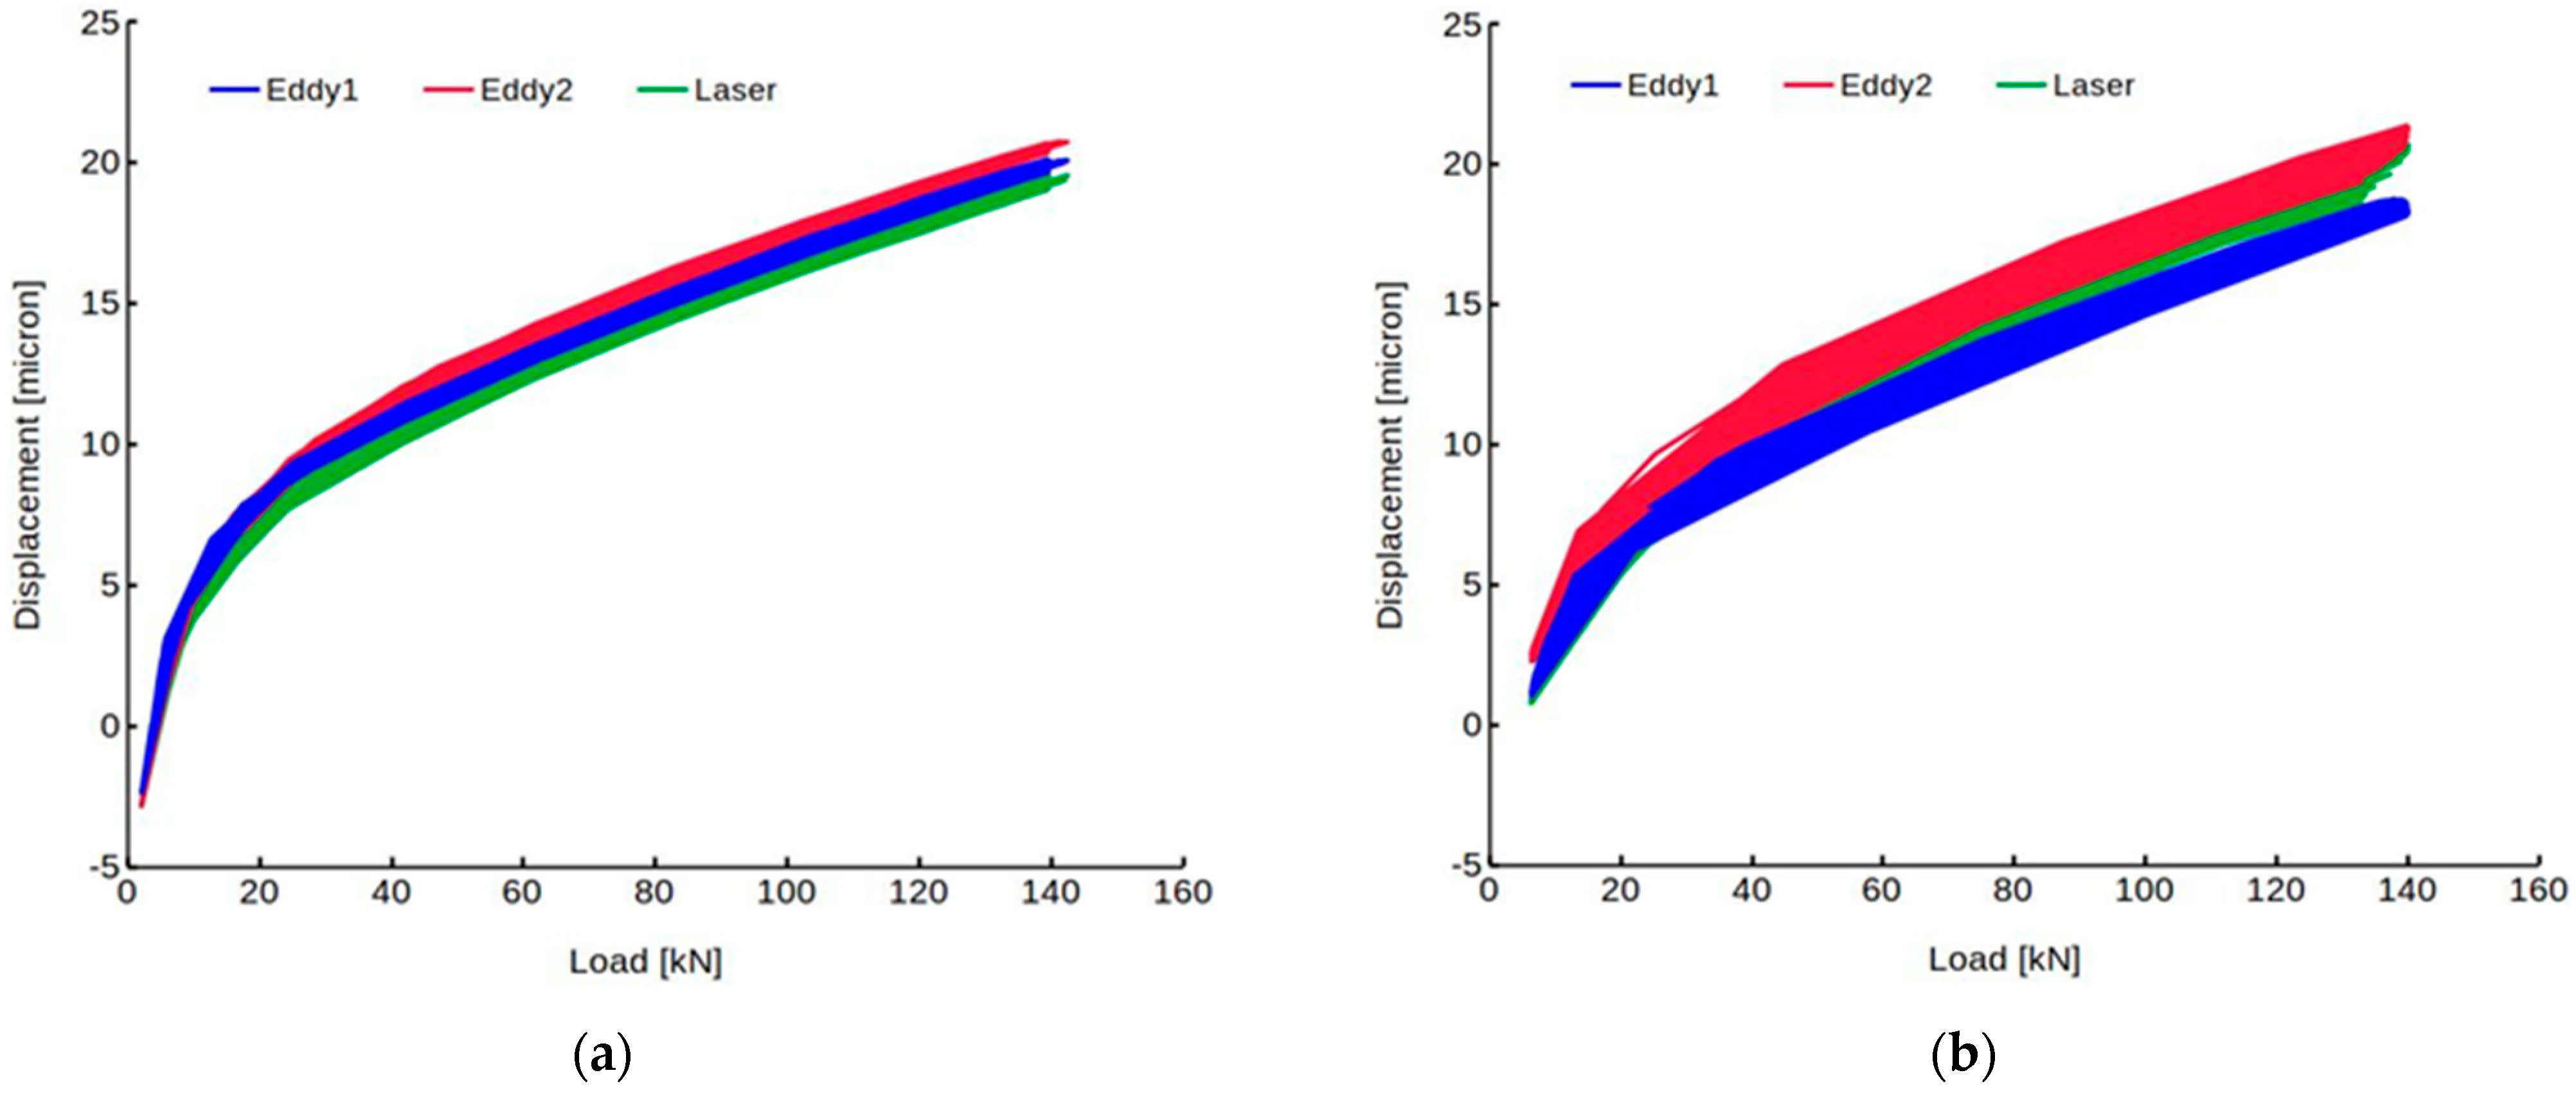
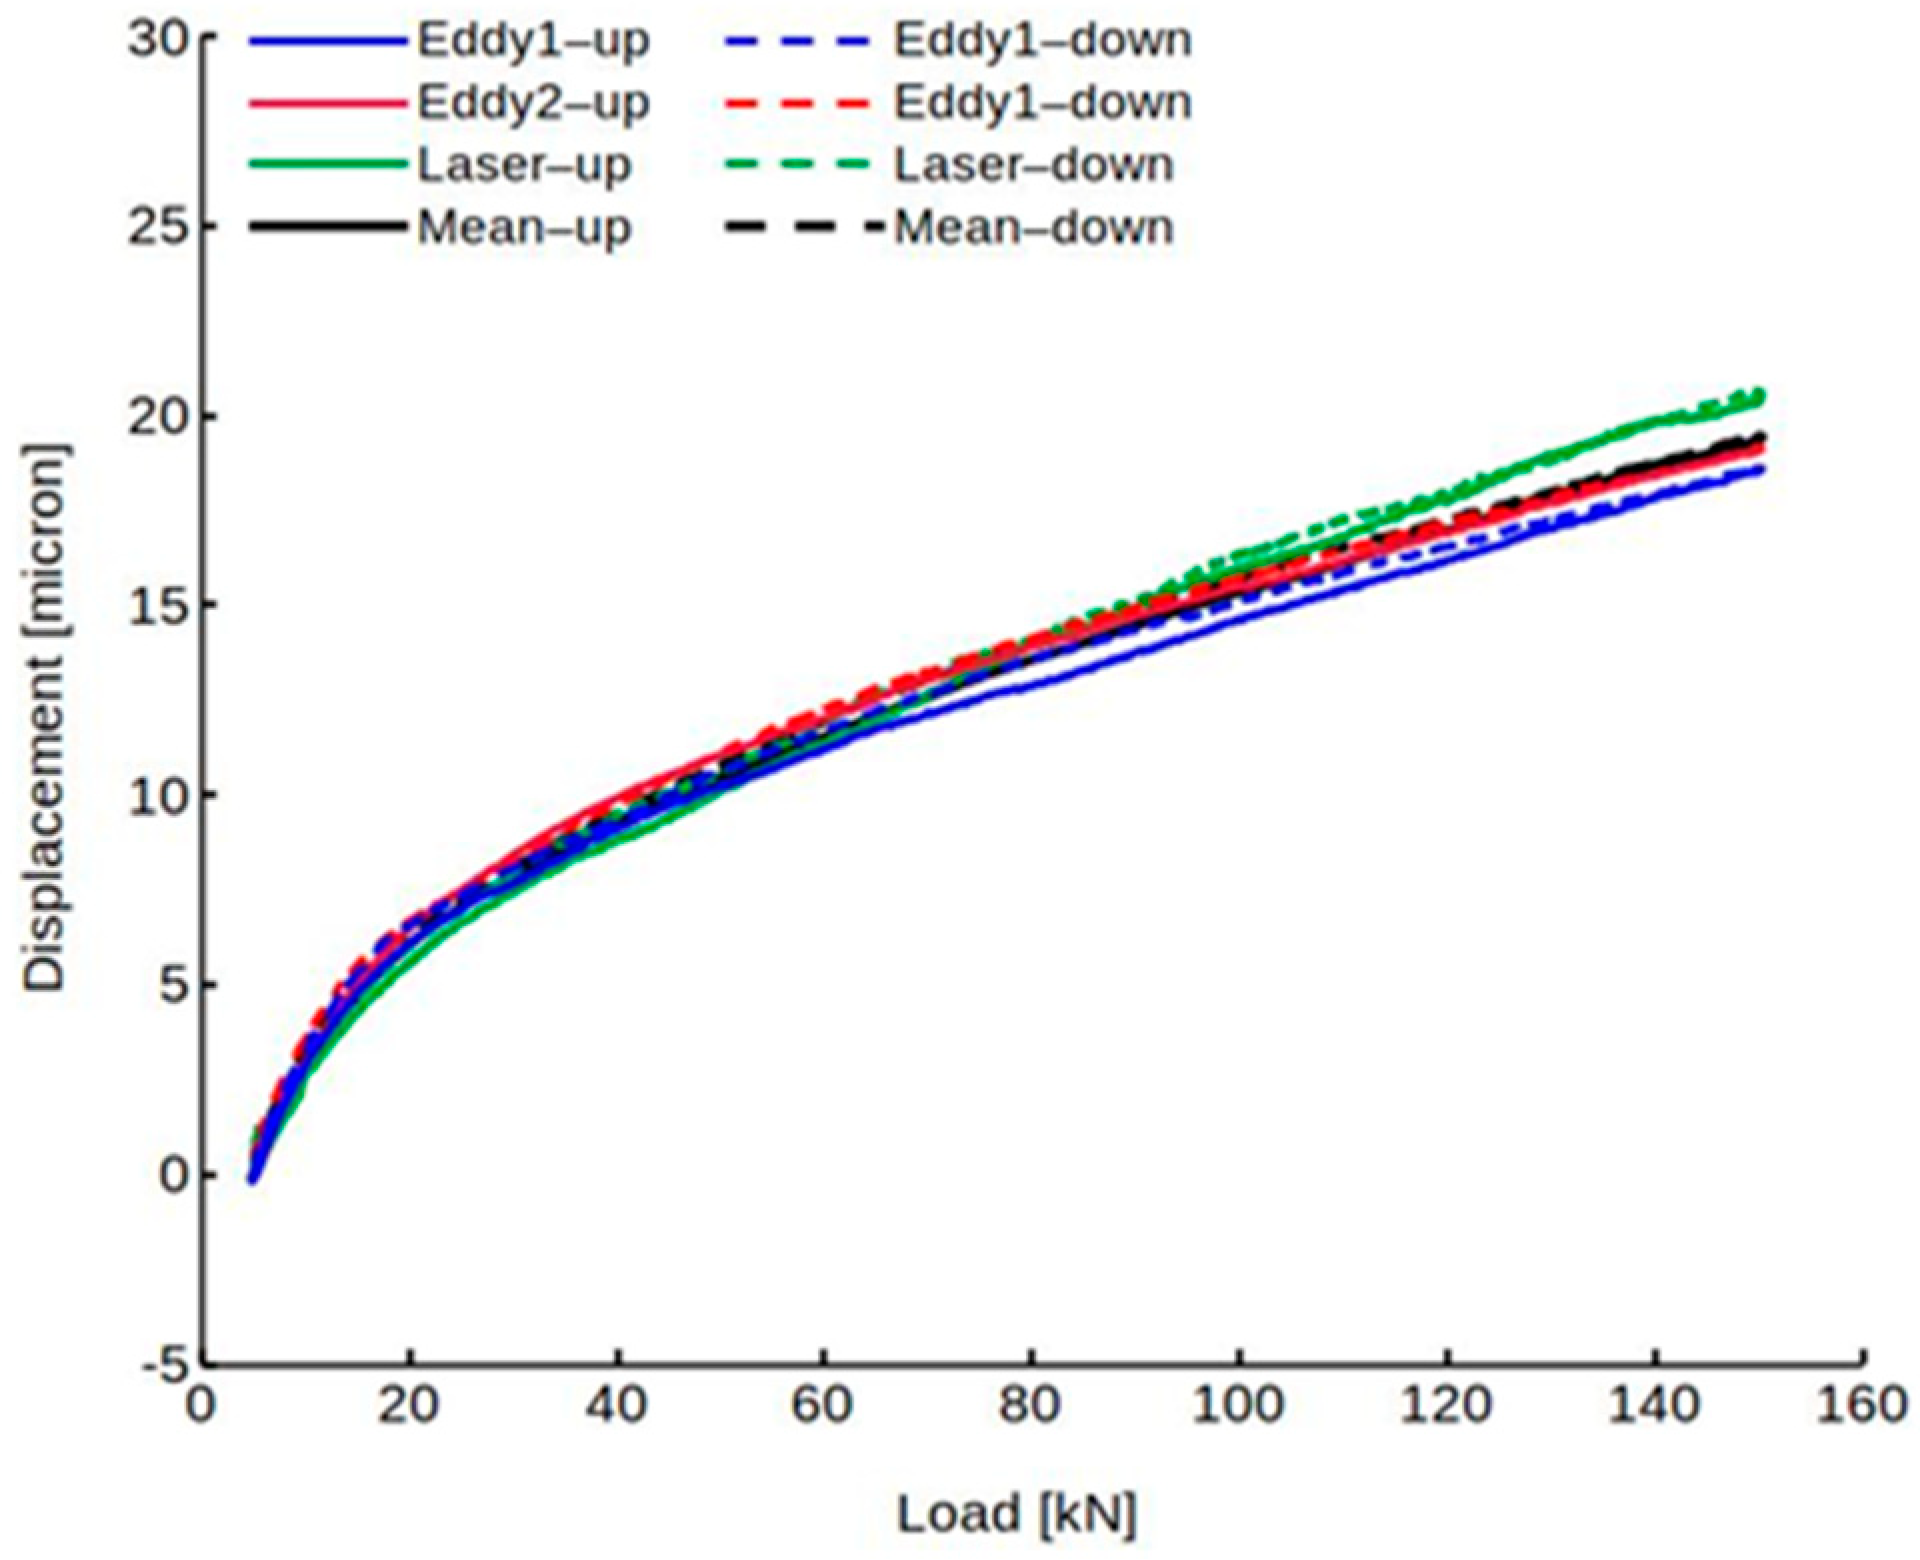
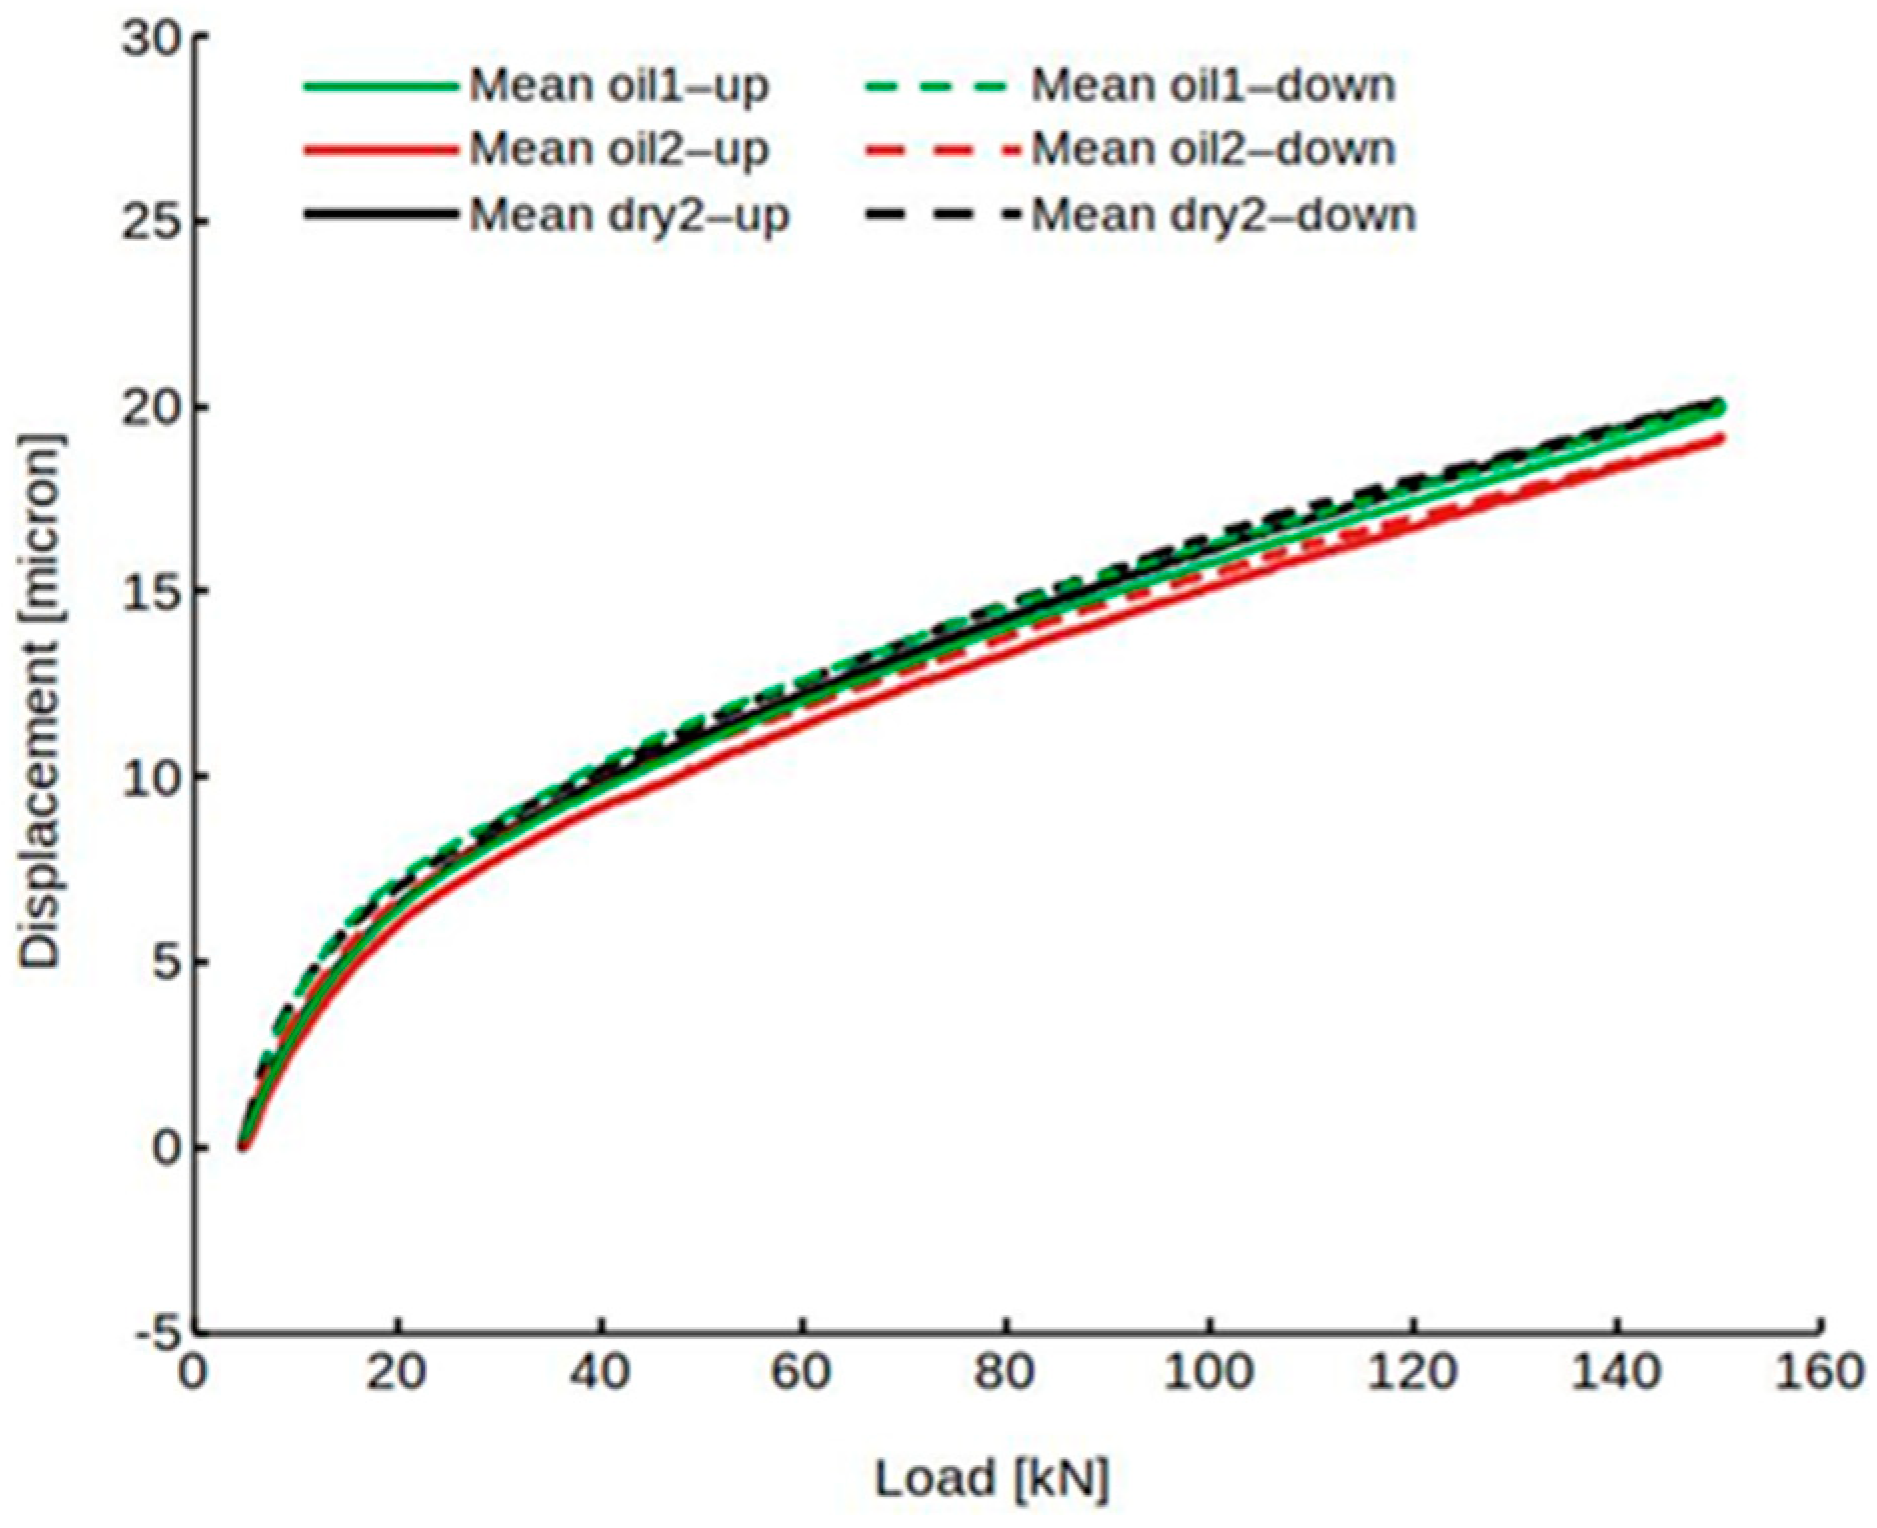
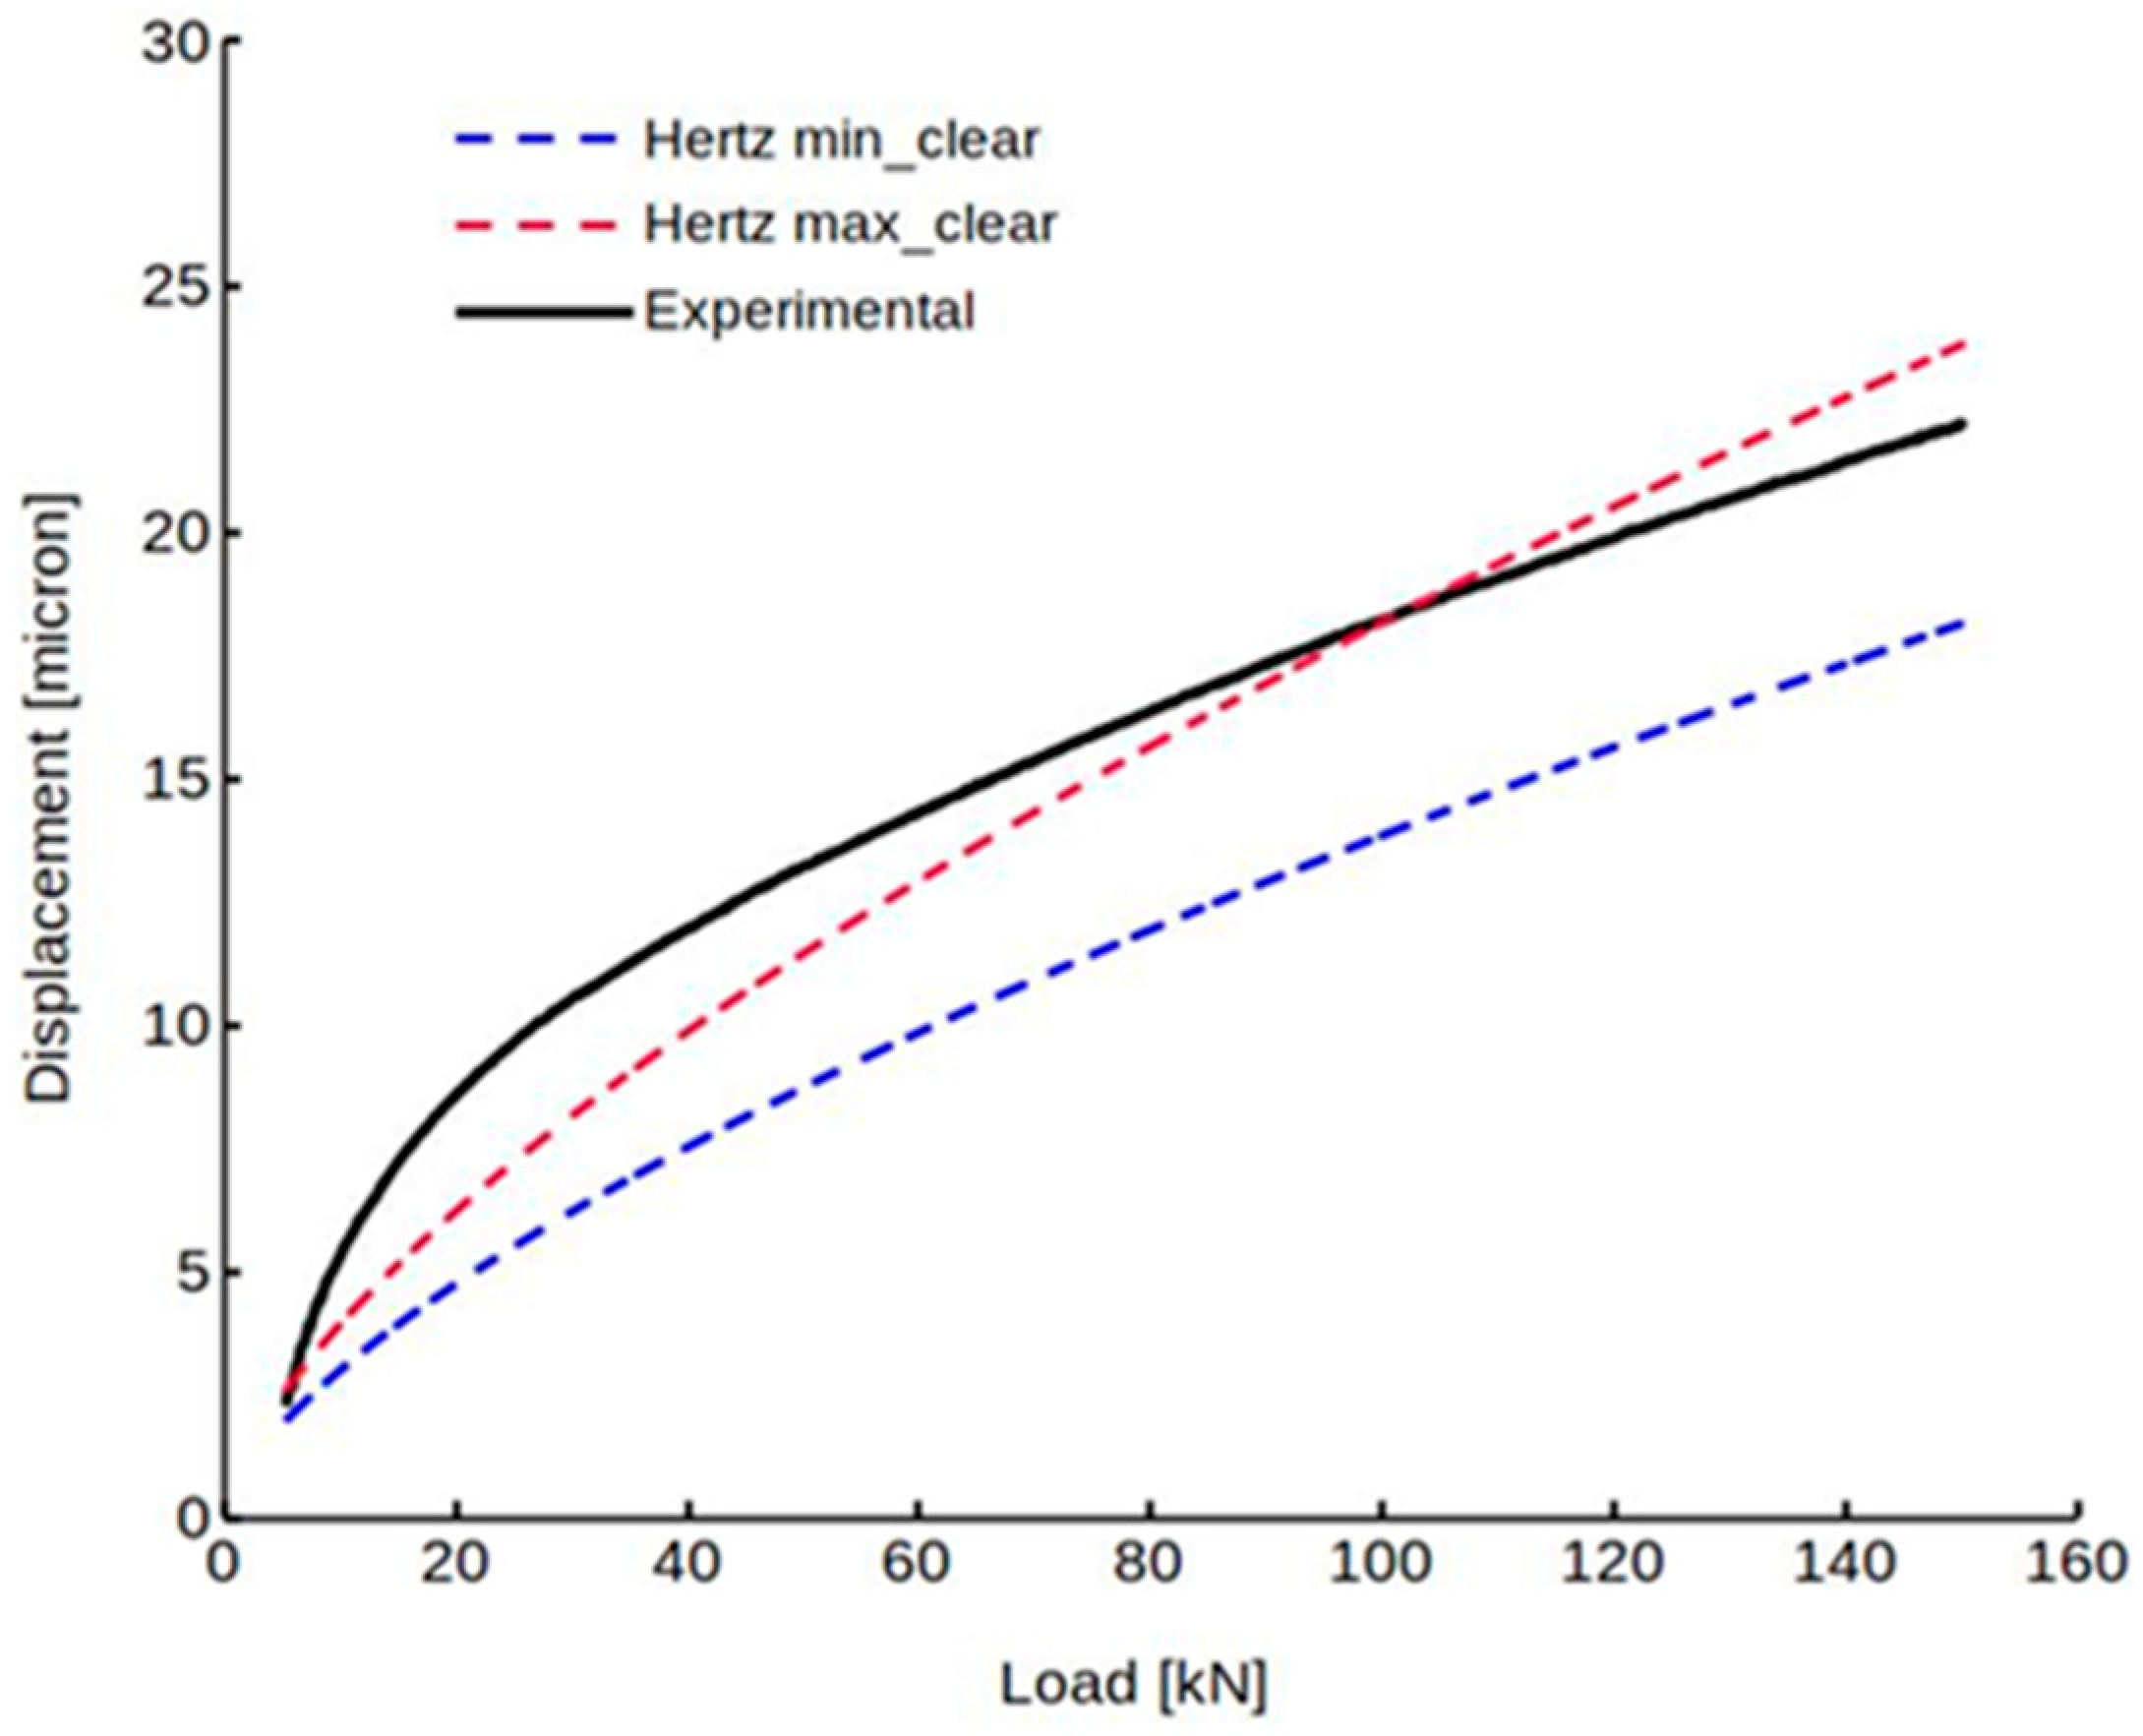
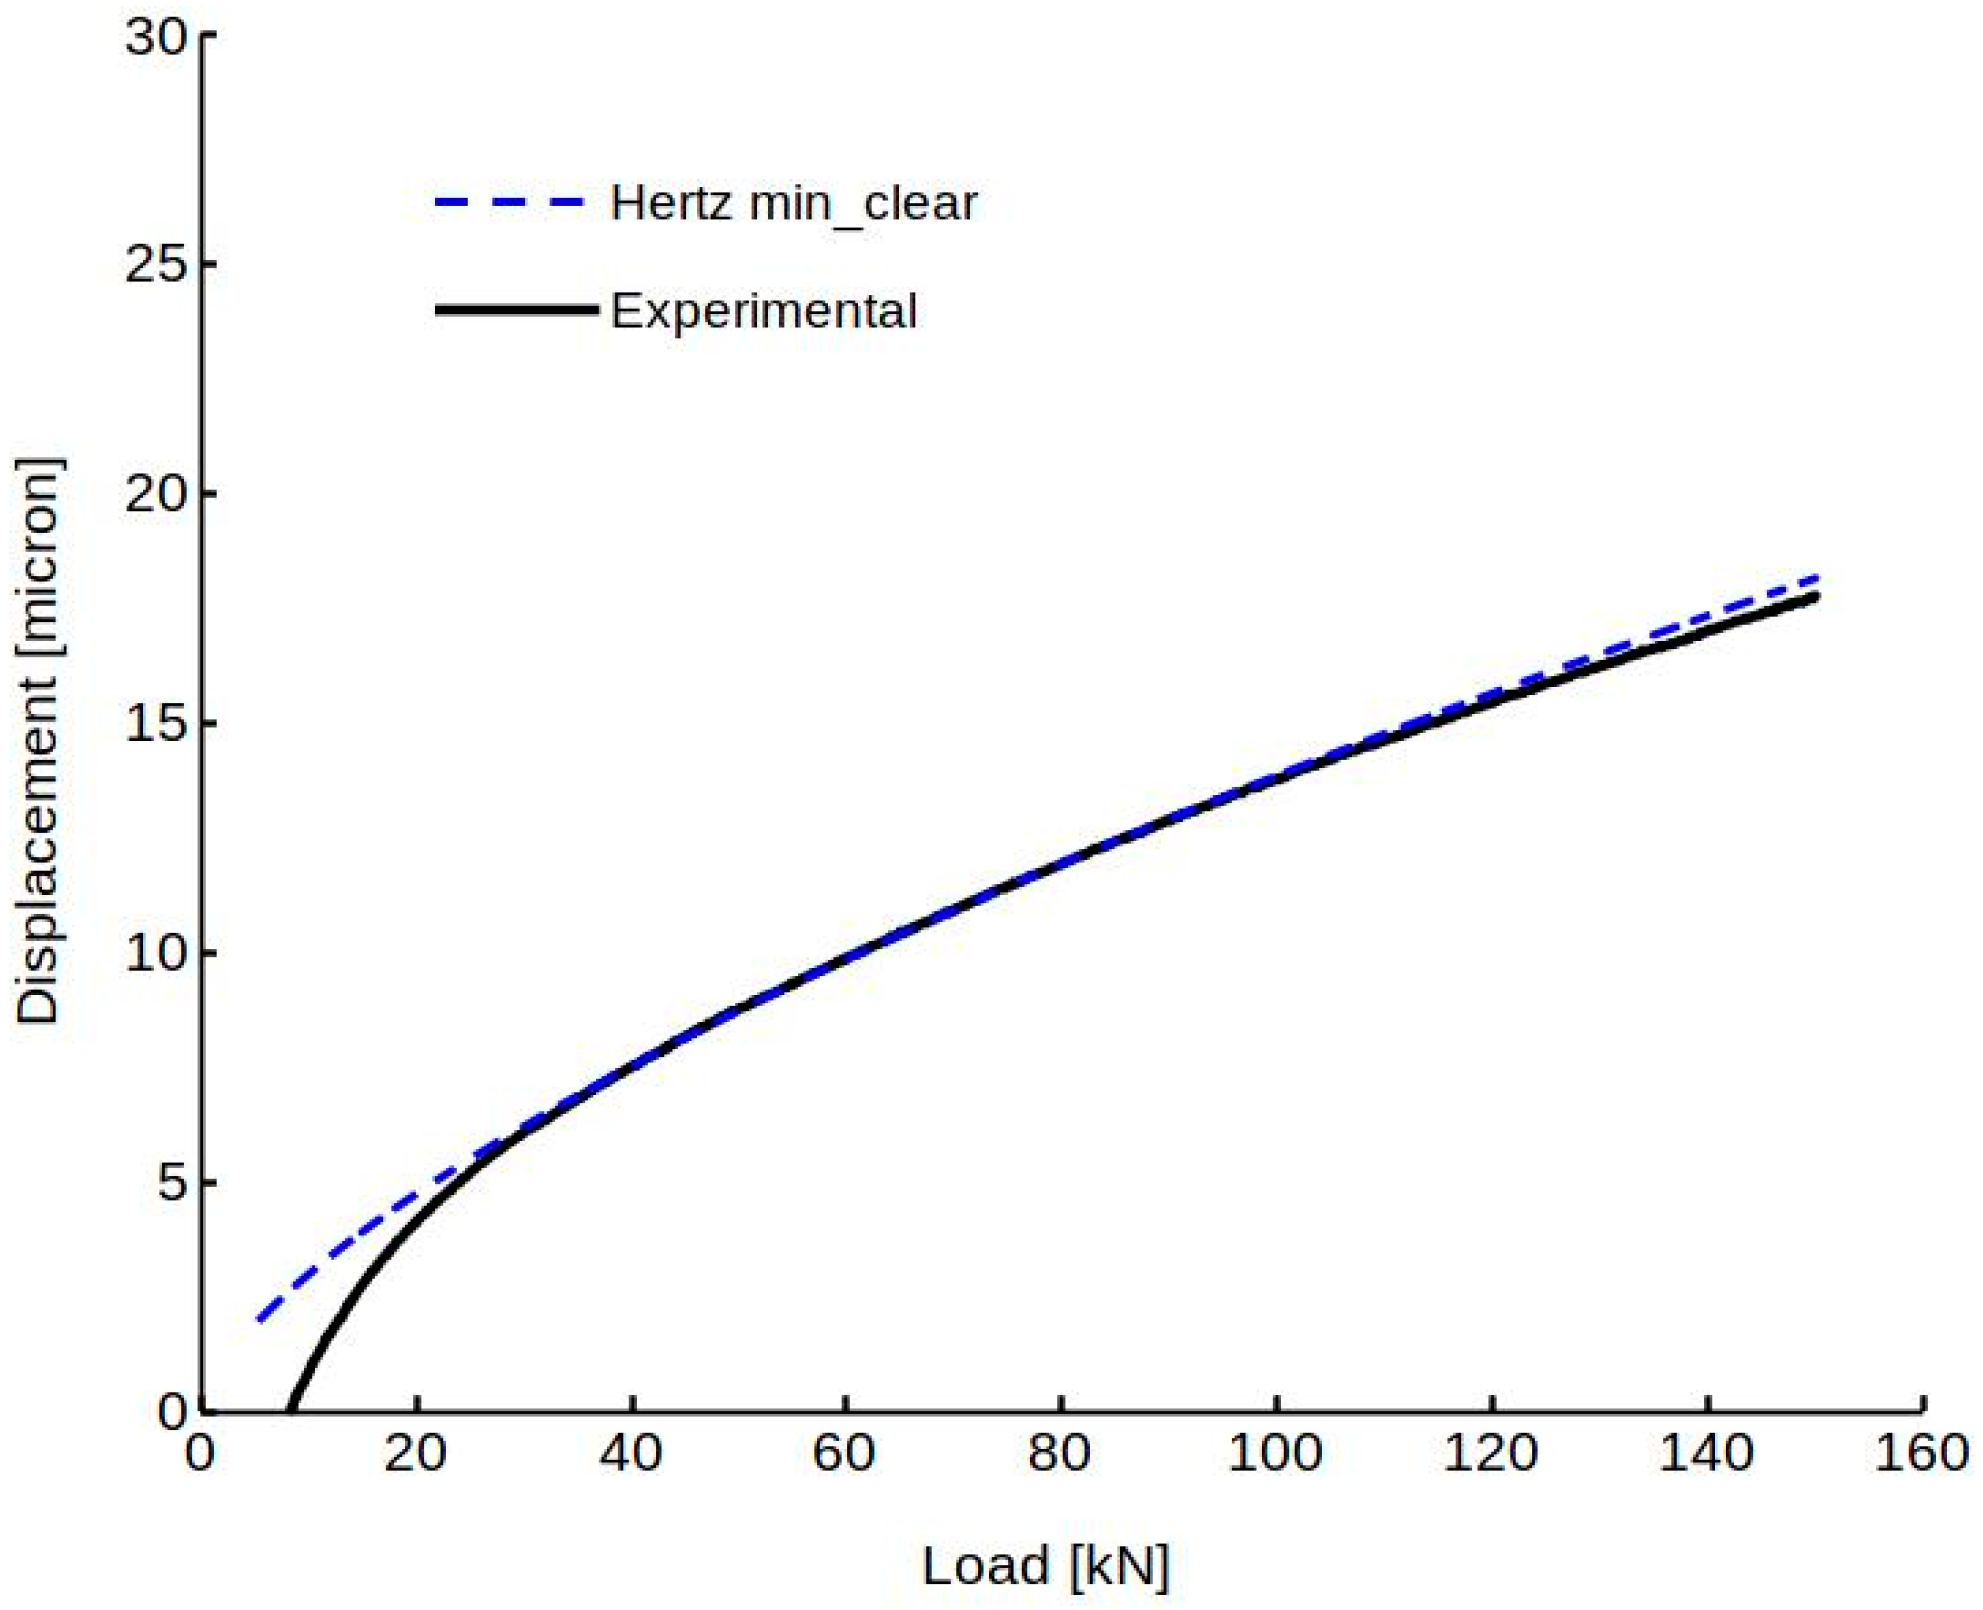
3.1. Displacement Measurements

Sample results of the tests performed in dry conditions are reported in Figure 7, as plots of displacement measured by the three sensors in the up and down load ramp, for two consecutive tests. Negligible differences can be observed in the results of the up and down load ramps. One proximity measures a quite lower displacement with respect to the other sensors, while the second proximity gives a rather different response in the first test with respect to the other.
Some tests with cycles at higher frequencies were also performed. Examples of test results obtained at 0.5 Hz and 5 Hz are reported in Figure 8 (the sampling rates were 10 and 50 Hz, respectively). In these cases, the differences between the sensors responses are reduced compared to those of the quasi-static test, probably due to an adjustment of the specimens position during cycling.
Additional repetitions of single up and down load ramps show different values recorded by the single sensors (Figure 9) but the trends of the mean values are very similar before and after load cycling, as evident from Figure 10, where a comparison among the mean values of the three cases is made.
Lubrication of the surfaces in contact was found to noticeably reduce the differences between the measurements of the three sensors. The reason is to be found in the constraining effect of friction on the samples in dry conditions that prevents a good self-centering of the seat with respect to the cap made possible by lubrication. Two examples of results obtained from static tests with boundary lubricated surfaces are presented in Figure 11.
Examples of cyclic tests at 0.5 and 5 Hertz are reported in Figure 12. Additionally, in these cases the curves of the different sensors overlap, and even if the band of the cyclic curves widens with increasing frequency, there seems to be no effect of frequency on the mean values. These results obtained in boundary lubricated conditions, compared to the corresponding ones of Figure 8, obtained in dry conditions, confirm the influence of lubrication observed above.
The results of an additional repetition of a single up and down ramp after load cycling is reported in Figure 13 showing no significant difference among the values recorded by the single sensors and with respect to the previous tests.
Finally, comparing the mean values of some dry tests with the ones with lubricant (Figure 14), no significant differences can be detected, considering the zeroing made in a quite arbitrary manner at the start of each test.

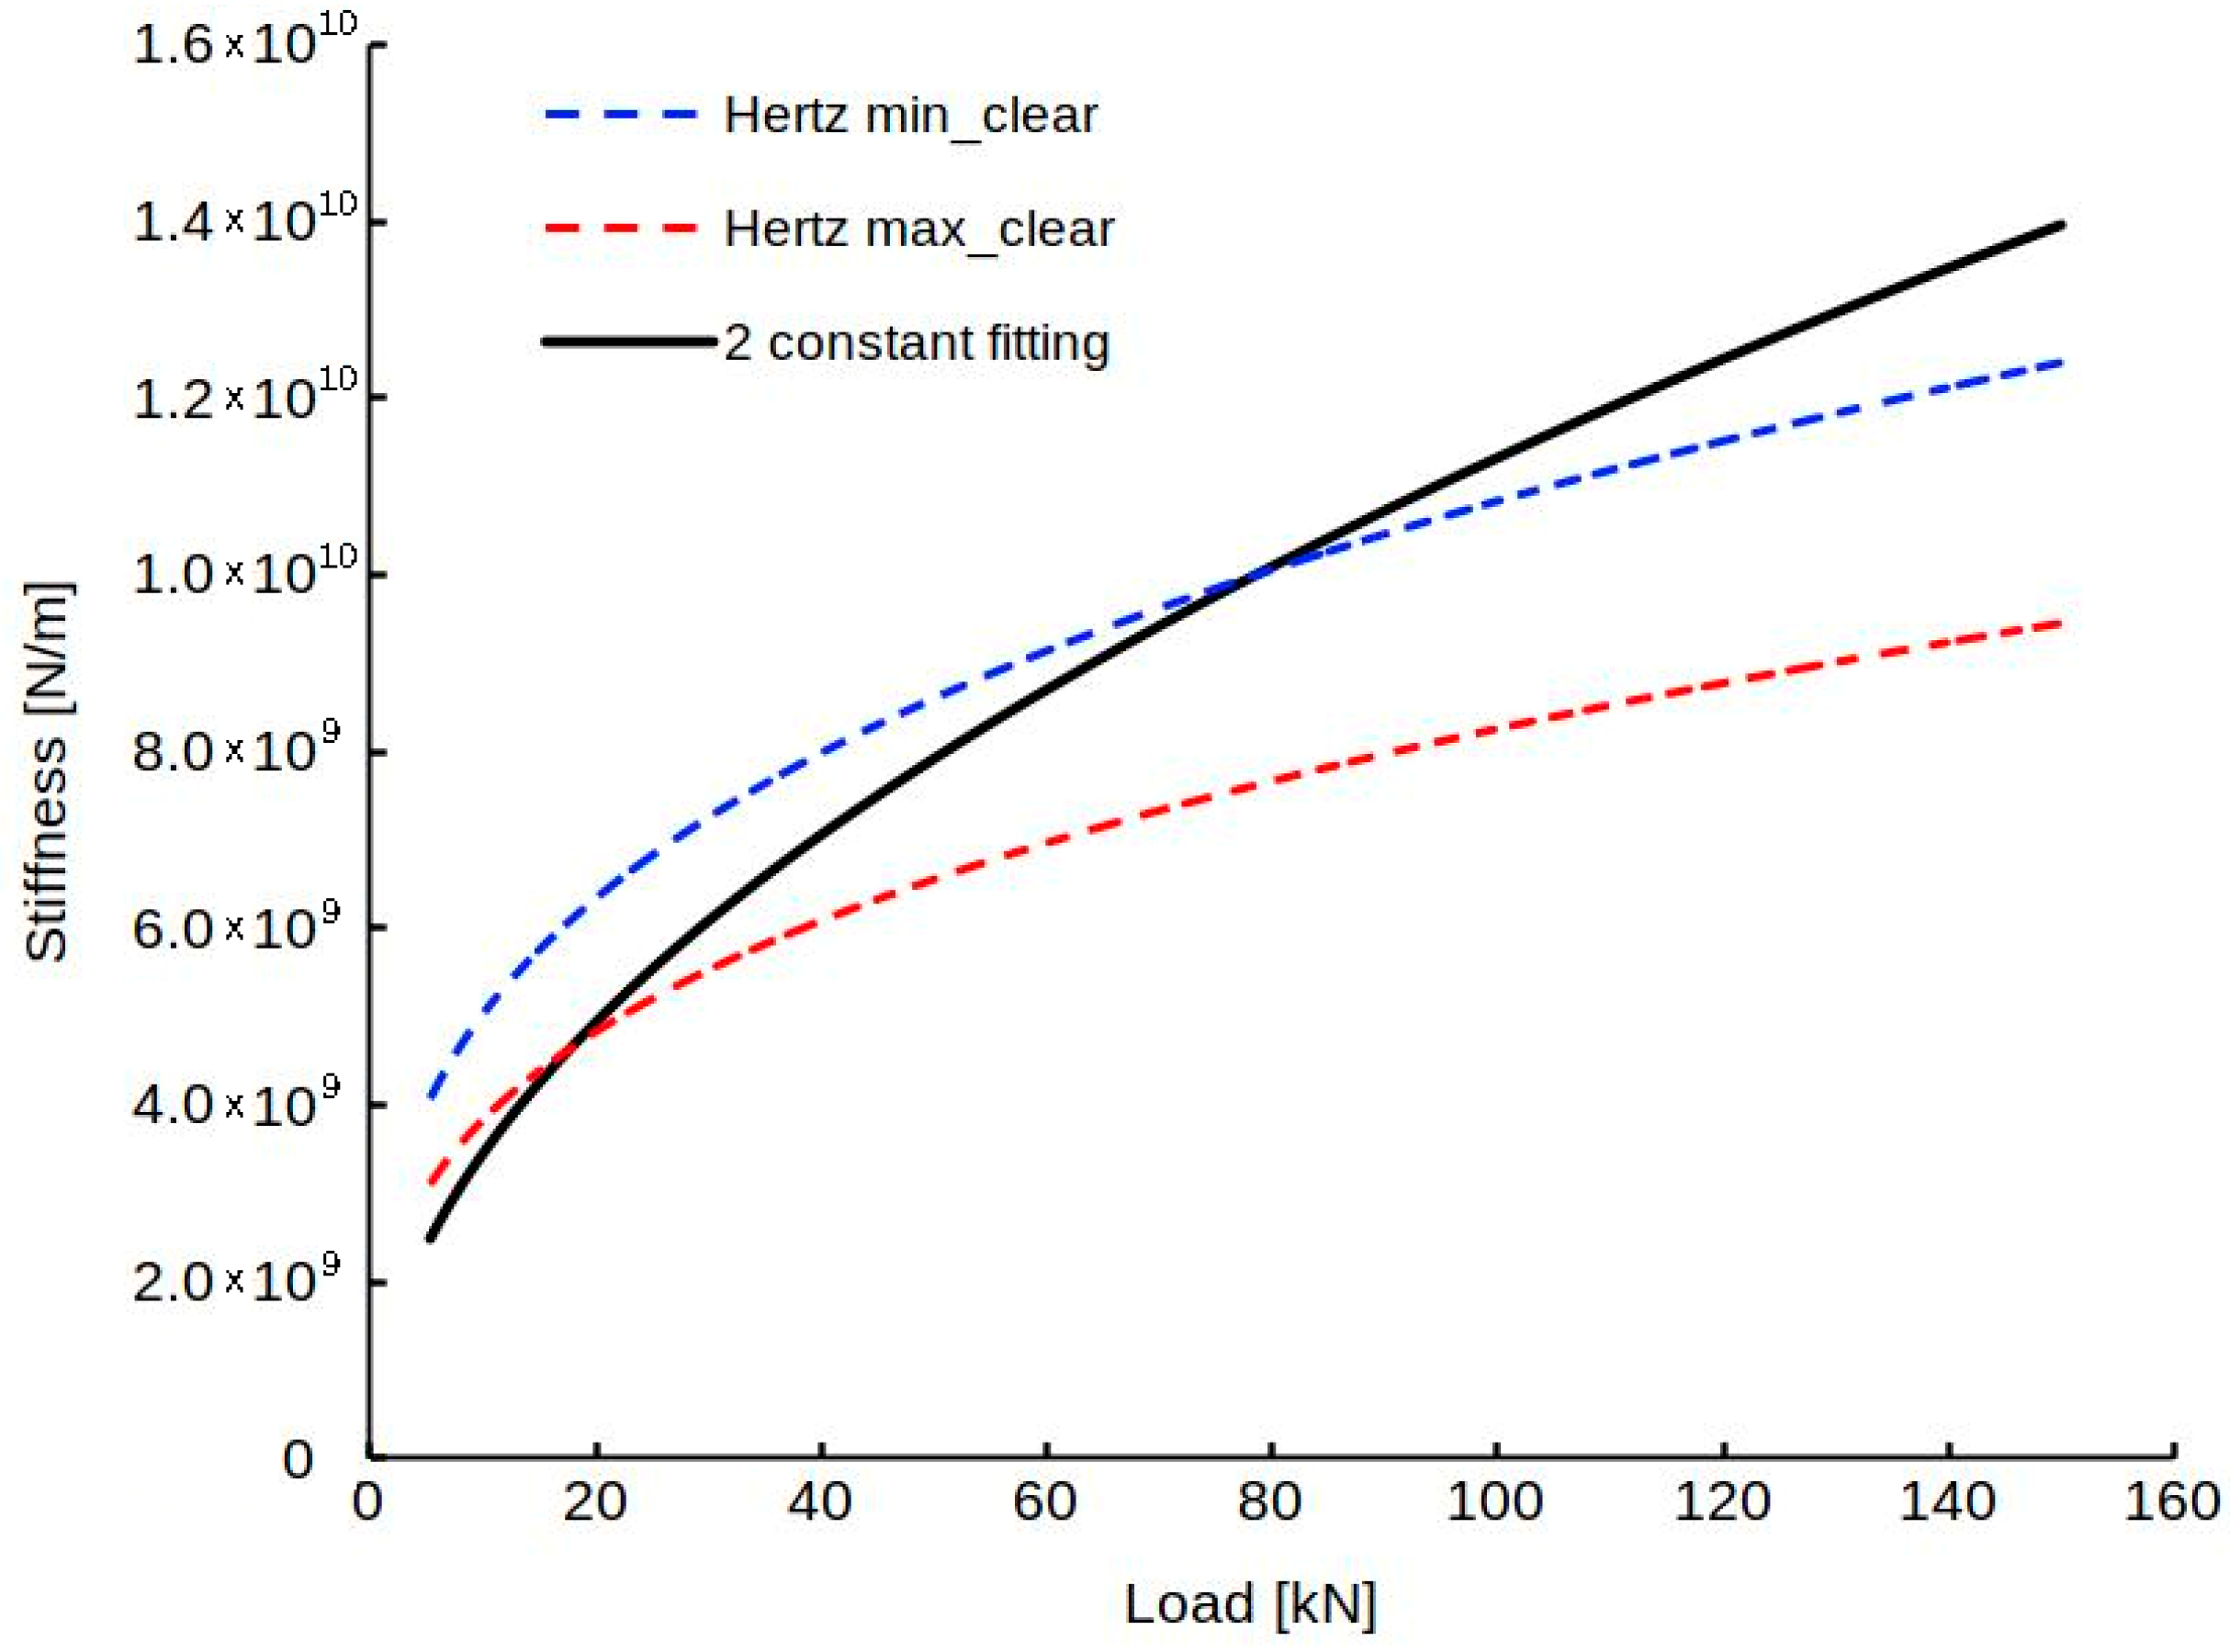
3.2. Evaluated Stiffness

Regarding stiffness, as explained in the Methods section, it was derived from best-fit displacement expressed by the two and four constants formulas reported in Section 2.4. Figure 15 shows an example of the displacement curves obtained by the optimization process. The following optimized constant values were obtained in this case: for the 2-constant formula, c1 = 1.9671, c2 = 0.4838, for the 4-constant formula, c1 = −242.56, c2 = 239.02, c3 = 0.015, c4 = −0.00018. Optimization can be pushed to higher levels and very different values of the constants can be found that give similar results. To give an idea of how the results can be different, using only the values of displacement for loads greater than 40 kN, the following constants were obtained (green dotted curve of Figure 15): c1 = 4.1607, c2 = 0.6649, c3 = 0.6732, and c4 = 0.0005.
Although the displacement curves appear very similar, even small differences produce quite significant differences in the stiffness trend (Figure 16).

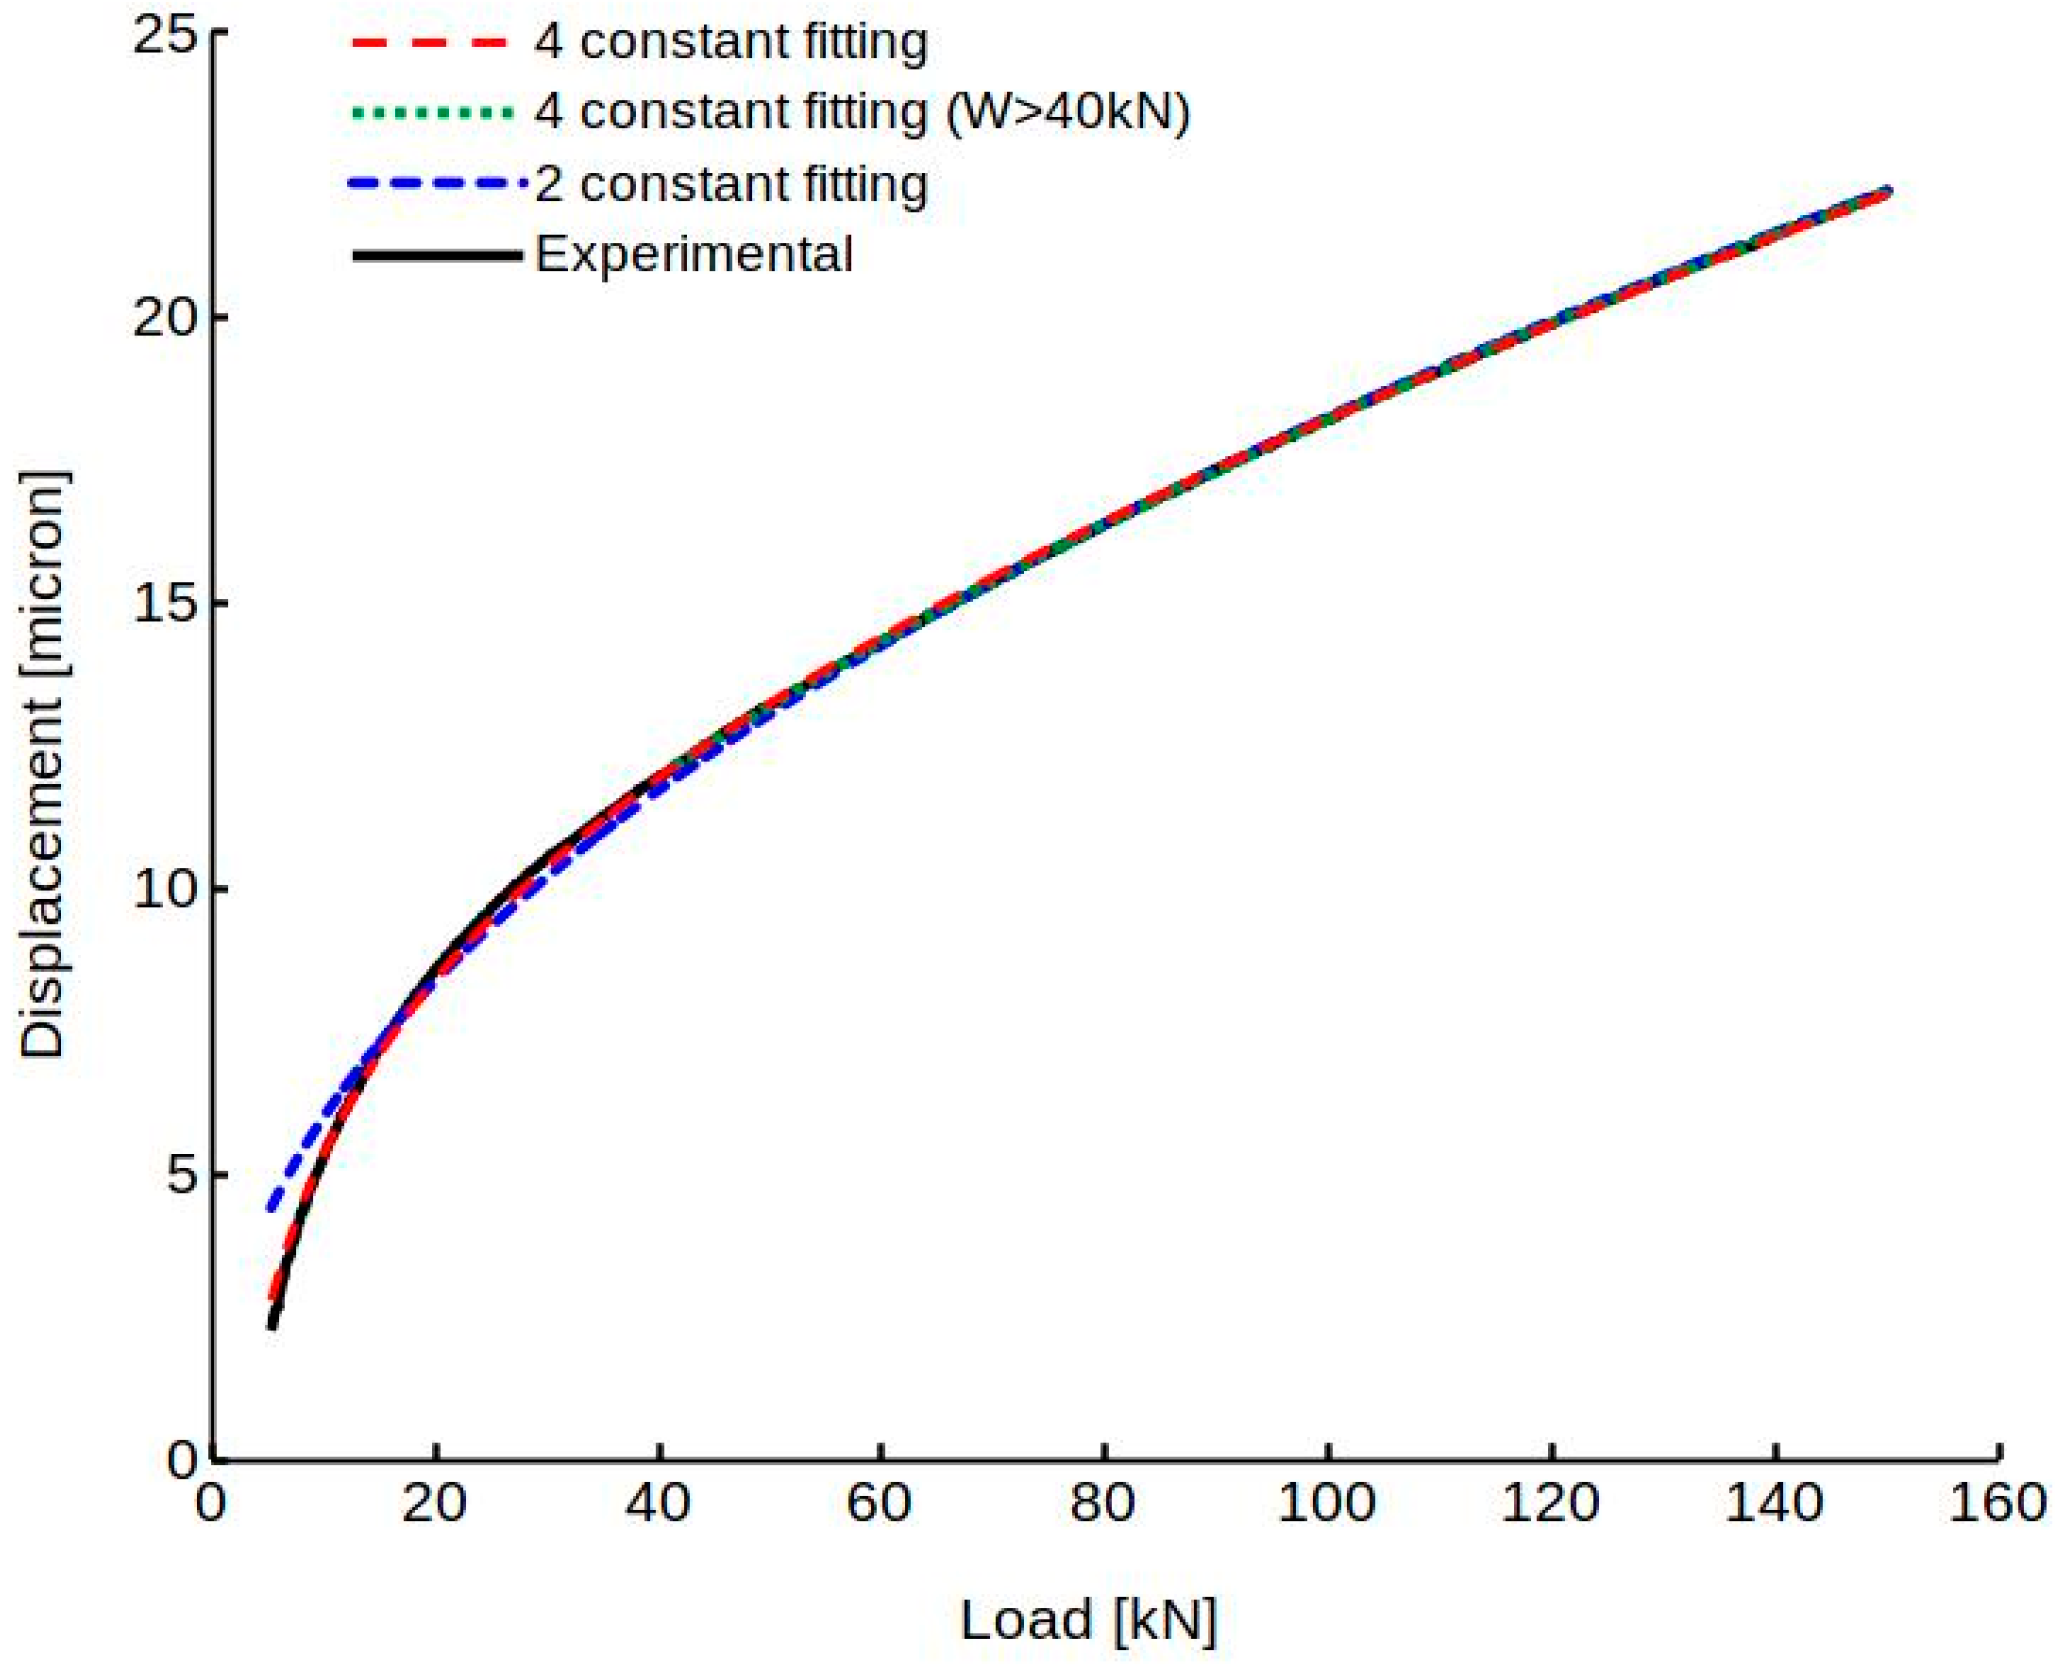
3.3. Comparison with Results of Hertzian Formulas

Displacement and stiffness were also calculated by means of Hertzian formulas considering Young’s modulus E = 2 × 10¹¹ N/m2 and Poisson’s ratio ν = 0.3 for both bodies. As Hertzian deformations are greatly influenced by the clearance between the spherical cap and seat, the maximum and minimum gap provided by the manufacturer for the tested pair were considered. The mean values obtained in one of the tests, namely the second average up load ramp in dry conditions, were used for comparison with the Hertzian results (Figure 17). The displacement zero of the experimental curve was shifted in order to fit the mean of the calculated values for the maximum and minimum clearance at the starting measured load.
The differences between the experimental and Hertzian displacement trends produce the differences in stiffness shown in Figure 18. These results will be discussed in the following section, where an explanation of this apparent incongruity will be provided.

4. Discussion and Conclusions

Despite the apparent dispersion of the results obtained in these preliminary tests, the mean measured displacement values are always comparable, even in dry conditions. In boundary lubricated conditions, that is, more realistic ones, the results are practically overlapping, showing the good repeatability of the tests.
The outlined method for contact stiffness evaluation, based on best fitting of experimental results, appears of simple application and valid even though similar solutions can be obtained with quite different constants. The 4-constant fitting of the experimental curves shows to be the best over the entire load range, while the simpler 2-constant one is quite satisfactory at higher loads.
Even if it is questionable to use of the Hertzian formulas for contacts with a high level of conformity, there is another aspect that can explain the differences evidenced by the trends in Figure 17: the presence of the central hole in the spherical seat. That means that the zero-load condition corresponds to a single contact point of conformal surfaces for the Hertzian model and to a circular line contact of non-conformal surfaces in the real case (Figure 19). The effect is exaggerated in the figure, because the hole actually has a diameter of 5 mm compared to the 127 mm diameter of the sphere, and the spherical seat has been schematically represented as a plane surface.
The deformed contact zones are evidently quite different, particularly for the lower loads. In the real case, due to the initial contact between non-conformal surfaces (the ball and the hole edge), the contact stiffness is lower. By increasing the load, the two cases become more similar. It can also be noted from the trends of Figure 17 that the experimental deformation rate becomes closer to the calculated one for the minimum clearance at sufficiently high loads, about 40 kN for the present results. This is better evidenced in Figure 20, where the experimental curve has been shifted in order to have the same displacement of the Hertzian calculated ones with minimum clearance at 40 kN.
In conclusion, this paper proposed a test rig realized by adapting a uniaxial testing machine and a methodology based on best fitting of experimental compression results to determine the stiffness of a TPJB ball-and-socket pivot. The experimental setup and procedure showed their validity in terms of repeatability in a load range of 5 to 150 kN in boundary lubricated conditions while in dry conditions particular care had to be taken in data processing averaging the measurements of the different sensors. The preliminary compression results compared with the analytical ones obtained using Hertz’s formula displayed non-negligible differences, especially at low loads, that have been ascribed to the presence of a hole in the spherical seat. Additional tests and finite element analysis of this kind of contact will be performed in order to better verify the applicability of the Hertzian formulas, so widely used for tilting pad bearing ball-and-socket pivots, focusing on the actual bearing operating load range and geometrical characteristics.

Author Contributions

Conceptualization, E.C., P.F. and D.P.; formal analysis, E.C. and P.F.; investigation, R.M.; resources, F.A.; data curation, R.M.; writing—original draft preparation, E.C. and P.F.; writing—review and editing, E.C., P.F. and D.P.; visualization, E.C. and R.M.; supervision, E.C.; and project administration, E.C. All authors have read and agreed to the published version of the manuscript.

Funding

This research was funded by Baker Hughes Company through a contract with the University of Pisa.

Institutional Review Board Statement

Not applicable.

Informed Consent Statement

Not applicable.

Data Availability Statement

Restrictions apply to the availability of these data. Data belong to Baker Hughes and are available from the authors with the permission of Baker Hughes.

Conflicts of Interest

The authors declare no conflict of interest.

Appendix A

The formulas proposed by Kirk and Reedy [4], based on the formulas reported in [26], are commonly used for evaluation of deformation and stiffness of TPJB pivots. For the spherical pivot in [5], we can find for deflection and stiffness, respectively:
δ = 1.040 ( W 2 C 2 2 C 1 ) 1 / 3
K = 1.442 ( W C 1 C 2 2 ) 1 / 3
where
C 1 = D H D P D H D P
C 2 = 1 ν P 2 E P + 1 ν H 2 E H
with D diameter and subscripts H and P referring to the housing (or spherical seat) and to the pivot, respectively. Note that the difference DHDP is the diametral clearance.
It is easy to verify that Formulas (A1) and (A2) coincide with Formulas (1) and (4) being C1 = 2R and C2 = 2/E.
For the ball-and-socket, the equivalent radius can be also expressed as a function of the radial clearance c:
R = R H R P c
Actually, Kirk and Reedy used slightly different notations, with CE instead of C2 and CD instead of C1, and provided a formula for the stiffness of a sphere in a spherical seat made with the same material with E H P = E H = E P and ν H = ν P = 0.3 :
K = 0.968 ( W C 1 E H P 2 ) 1 / 3
It is easy to verify that Equation (A2) gives the same result by using C 2 = 2 ( 1 0.3 2 ) / E H P = 1.82 / E H P . It must be remarked that, in some papers, the coefficient 0.968 is incorrectly used instead of 1.442 in Formula (A2).
For the secant stiffness, Equation (5), the following formula is often used for ball-and-socket pivot:
K s = K 2 3 = 0.961 ( W C 1 C 2 2 ) 1 / 3 = 1 1.040 ( W C 1 C 2 2 ) 1 / 3

References

  1. Dmochowski, W. Dynamic properties of tilting-pad journal bearings: Experimental and theoretical investigation of frequency effects due to pivot flexibility. J. Eng. Gas Turbines Power 2006, 129, 865–869. [Google Scholar] [CrossRef]
  2. San Andres, L.; Tao, Y. The role of pivot stiffness on the dynamic force coefficients of tilting pad journal bearings. J. Eng. Gas Turbines Power 2013, 135, 112505. [Google Scholar] [CrossRef]
  3. Mehdi, S.M.; Jang, K.E.; Kim, T.H. Effects of pivot design on performance of tilting pad journal bearings. Tribol. Int. 2018, 119, 175–189. [Google Scholar] [CrossRef]
  4. Kirk, R.G.; Reedy, S.W. Evaluation of Pivot Stiffness for Typical Tilting-Pad Journal Bearing Designs. J. Vib. Acoust. Stress 1988, 110, 165–171. [Google Scholar] [CrossRef]
  5. Nicholas, J.C.; Wygant, K.D. Tilting pad journal bearing pivot design for high load applications. In Proceedings of the 24th Turbomachinery Symposium; Texas A&M: College Station, TX, USA, 1995; pp. 33–48. [Google Scholar] [CrossRef]
  6. Sun, Z.; Hao, C. Conformal Contact Problems of Ball-socket and Ball. Phys. Procedia 2012, 25, 209–214. [Google Scholar] [CrossRef] [Green Version]
  7. Fang, X.; Zhang, C.; Chen, X.; Wang, Y.; Tan, Y. A new universal approximate model for conformal contact and non-conformal contact of spherical surfaces. Acta Mech. 2014, 226, 1657–1672. [Google Scholar] [CrossRef]
  8. Fang, X.; Zhang, C.; Chen, X.; Wang, Y.; Tan, Y. Newly developed theoretical solution and numerical model for conformal contact pressure distribution and free-edge effect in spherical plain bearings. Tribol. Int. 2015, 84, 48–60. [Google Scholar] [CrossRef]
  9. He, W.; Chen, Y.; He, J.; Xiong, W.; Tang, T.; OuYang, H. Spherical contact mechanical analysis of roller cone drill bits journal bearing. Petroleum 2016, 2, 208–214. [Google Scholar] [CrossRef] [Green Version]
  10. Yuan, L.; Bao, H.; Yao, X.; Lu, J.; Liu, J. Distribution of conformal contact pressure in spherical plain bearings considering friction and free-edge effects. Proc. Inst. Mech. Eng. Part J J. Eng. Tribol. 2021, 235, 1851–1867. [Google Scholar] [CrossRef]
  11. Johns-Rahnejat, P.M.; Dolatabadi, N.; Rahnejat, H. Analytical elastostatic contact mechanics of highly-loaded contacts of varying conformity. Lubricants 2020, 8, 89. [Google Scholar] [CrossRef]
  12. Askari, E. Mathematical models for characterizing non-Hertzian contacts. Appl. Math. Model. 2021, 90, 432–447. [Google Scholar] [CrossRef]
  13. Blanco-Lorenzo, J.; Santamaria, J.; Vadillo, E.G.; Correa, N. On the influence of conformity on wheel–rail rolling contact mechanics. Tribol. Int. 2016, 103, 647–667. [Google Scholar] [CrossRef] [Green Version]
  14. Tian, Q.; Flores, P.; Lankarani, H.M. A comprehensive survey of the analytical, numerical and experimental methodologies for dynamics of multibody mechanical systems with clearance or imperfect joints. Mech. Mach. Theory 2018, 122, 1–57. [Google Scholar] [CrossRef]
  15. Wu, C.-E.; Lin, K.-H.; Juang, J.-Y. Hertzian load-displacement relation holds for spherical indentation on soft elastic solids undergoing large deformations. Tribol. Int. 2016, 97, 71–76. [Google Scholar] [CrossRef]
  16. Solhjoo, S.; Müser, M.H.; Vakis, A.I. Nanocontacts and Gaussian Filters: Insights into the Idea of Filtering Contact Stress Fields for Removing the Effects of Surface Roughness at the Atomic Scale. Tribol. Lett. 2019, 67, 94. [Google Scholar] [CrossRef] [Green Version]
  17. Germaneau, A.; Peyruseigt, F.; Mistou, S.; Doumalin, P.; Dupré, J.-C. A 3D mechanical analysis of aeronautical plain bearings: Validation of a finite element model from measurement of displacement fields by digital volume correlation and optical scanning tomography. Opt. Lasers Eng. 2010, 48, 676–683. [Google Scholar] [CrossRef] [Green Version]
  18. Nouira, D.; Tonazzi, D.; Meziane, A.; Baillet, L.; Massi, F. Numerical and Experimental Analysis of Nonlinear Vibrational Response due to Pressure-Dependent Interface Stiffness. Lubricants 2020, 8, 73. [Google Scholar] [CrossRef]
  19. Zhu, L.; Chen, J.; Zhang, Z.; Hong, J. Normal contact stiffness model considering 3D surface topography and actual contact status. Mech. Sci. 2021, 12, 41–50. [Google Scholar] [CrossRef]
  20. Childs, D.W.; Harris, J.M. Static performance characteristics and rotordynamic coefficients for a four-pad ball-in-socket tilting pad journal bearing. J. Eng. Gas Turbines Power 2009, 131, 062502. [Google Scholar] [CrossRef]
  21. Dang, P.V.; Chatterton, S.; Pennacchi, P. The Effect of Pivot Stiffness on the Performances of Five-Pad Tilting Pad Bearings. Lubricants 2019, 7, 61. [Google Scholar] [CrossRef] [Green Version]
  22. Hertz, H. On the contact of rigid elastic solids and on hardness. In Miscellaneous Papers; Jones, D.E.; Schott, G.A., Translators; Macmillan: London, UK, 1896; Chapter VI; pp. 163–183. [Google Scholar]
  23. Hamrock, B.J. Fundamental of Fluid Film Lubrication; McGraw-Hill: New York, NY, USA, 1994. [Google Scholar]
  24. Bhushan, B. Principles and Applications of Tribology; John Wiley & Sons: New York, NY, USA, 1999. [Google Scholar]
  25. Khonsari, M.M.; Booser, E.R. Applied Tribology, 2nd ed.; John Wiley & Sons: Chicester, UK, 2008. [Google Scholar]
  26. Young, W.C.; Budynas, R.G. Roark’s Formulas for Stress and Strain, 7th ed.; McGraw-Hill: New York, NY, USA, 2002. [Google Scholar]
Figure 1. Tilting pad journal bearing with ball-and-socket pivots.
Machines 10 00081 g001
Figure 2. Diagram of displacement as a function of load.
Machines 10 00081 g002
Figure 3. Picture of the uniaxial testing machine (a) and zoom on the specimen test fixture (open) (b).
Machines 10 00081 g003
Figure 4. Section (a) and view of the solid model (b) of the experimental equipment.
Machines 10 00081 g004
Figure 5. Lower (a) and upper (upside down) (b) interfaces and rings.
Machines 10 00081 g005
Figure 6. Cap (a) and seat (b).
Machines 10 00081 g006
Figure 7. Measured displacement vs. applied load in two tests in dry conditions.
Machines 10 00081 g007aMachines 10 00081 g007b
Figure 8. Measured displacement vs. applied load in a dynamic test at 0.5 Hz (a) and 5 Hz (b) in dry conditions.
Machines 10 00081 g008
Figure 9. Measured displacement vs. applied load, after cycling, in dry conditions.
Machines 10 00081 g009
Figure 10. Average measured displacement vs. applied load in two tests before cycling (1 and 2) and in one test after cycling (3) in dry conditions.
Machines 10 00081 g010
Figure 11. Measured displacement vs. applied load in two tests in boundary lubricated conditions.
Machines 10 00081 g011
Figure 12. Measured displacement vs. applied load in dynamic test at 0.5 Hz (a) and 5 Hz (b) in boundary lubricated conditions.
Machines 10 00081 g012
Figure 13. Measured displacement vs. applied load, after cycling, in boundary lubricated conditions.
Machines 10 00081 g013
Figure 14. Average measured displacement vs. applied load in boundary lubricated conditions.
Machines 10 00081 g014
Figure 15. Measured and best-fit displacements vs. applied load.
Machines 10 00081 g015
Figure 16. Stiffness obtained from different best-fit displacements vs. applied load.
Machines 10 00081 g016
Figure 17. Experimental displacement vs. applied load compared with minimum and maximum clearance Hertzian displacement.
Machines 10 00081 g017
Figure 18. Experimental stiffness vs. applied load compared with the ones evaluated with Hertzian formulas with minimum and maximum clearance.
Machines 10 00081 g018
Figure 19. Schematic picture of the contact between the spherical cap and the seat hole edge.
Machines 10 00081 g019
Figure 20. Hertzian displacement compared with the experimental displacement (shifted in order to have the same displacement value at 40 kN) vs. applied load.
Machines 10 00081 g020
Publisher’s Note: MDPI stays neutral with regard to jurisdictional claims in published maps and institutional affiliations.

