
Parameter Matching Methods for Li Battery–Supercapacitor Hybrid Energy Storage Systems in Electric Buses

Abstract
:1. Introduction
2. Theories and Analysis of Parameter Matching
3. Theories and Analysis of Parameter Matching
3.1. Composite Energy Storage Device
3.1.1. Technical Indicators of Typical Battery
3.1.2. Parameters of Typical Supercapacitors
3.2. HESS Constraints
3.2.1. Technical Indexes of Typical Batteries
3.2.2. Constraint of Mileage
3.2.3. Constraint of Maximum Power of Motor
3.2.4. Constraint of Supercapacitor Capacitance
4. Linear Programming Parameter Optimization Method
4.1. Establishment of Optimized Objective Function
4.2. Parameter Optimization of Linear Programming
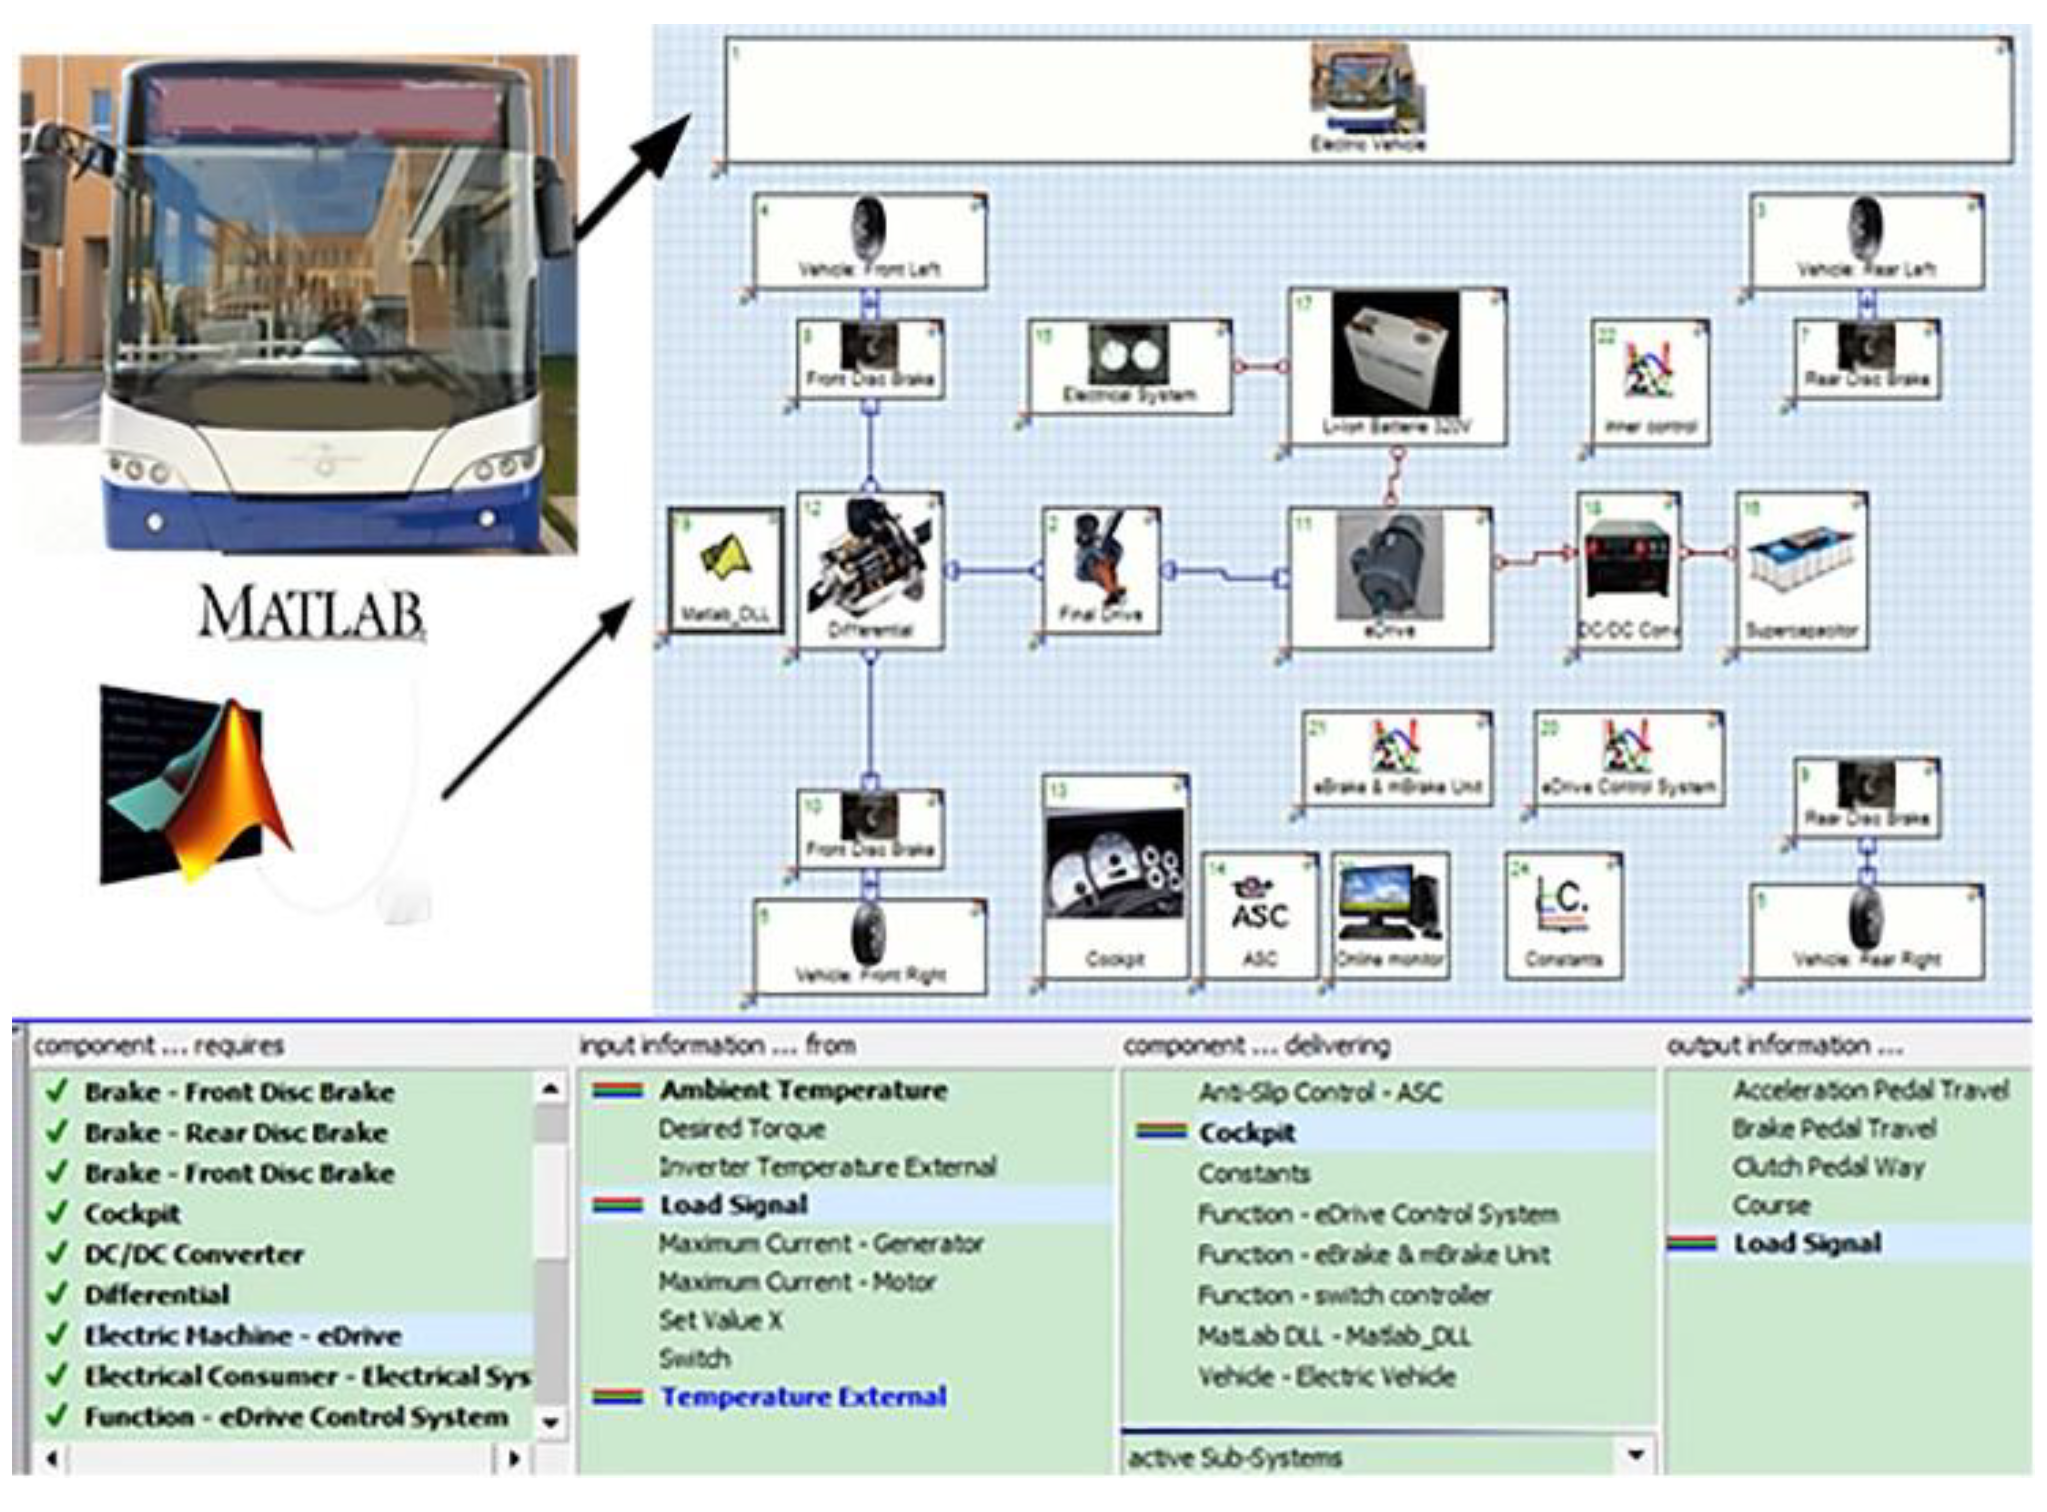
5. Modeling and Experimental Verification of Electric Buses
5.1. Simulations of Consumption under Cycle Conditions
5.2. Experimental Analysis
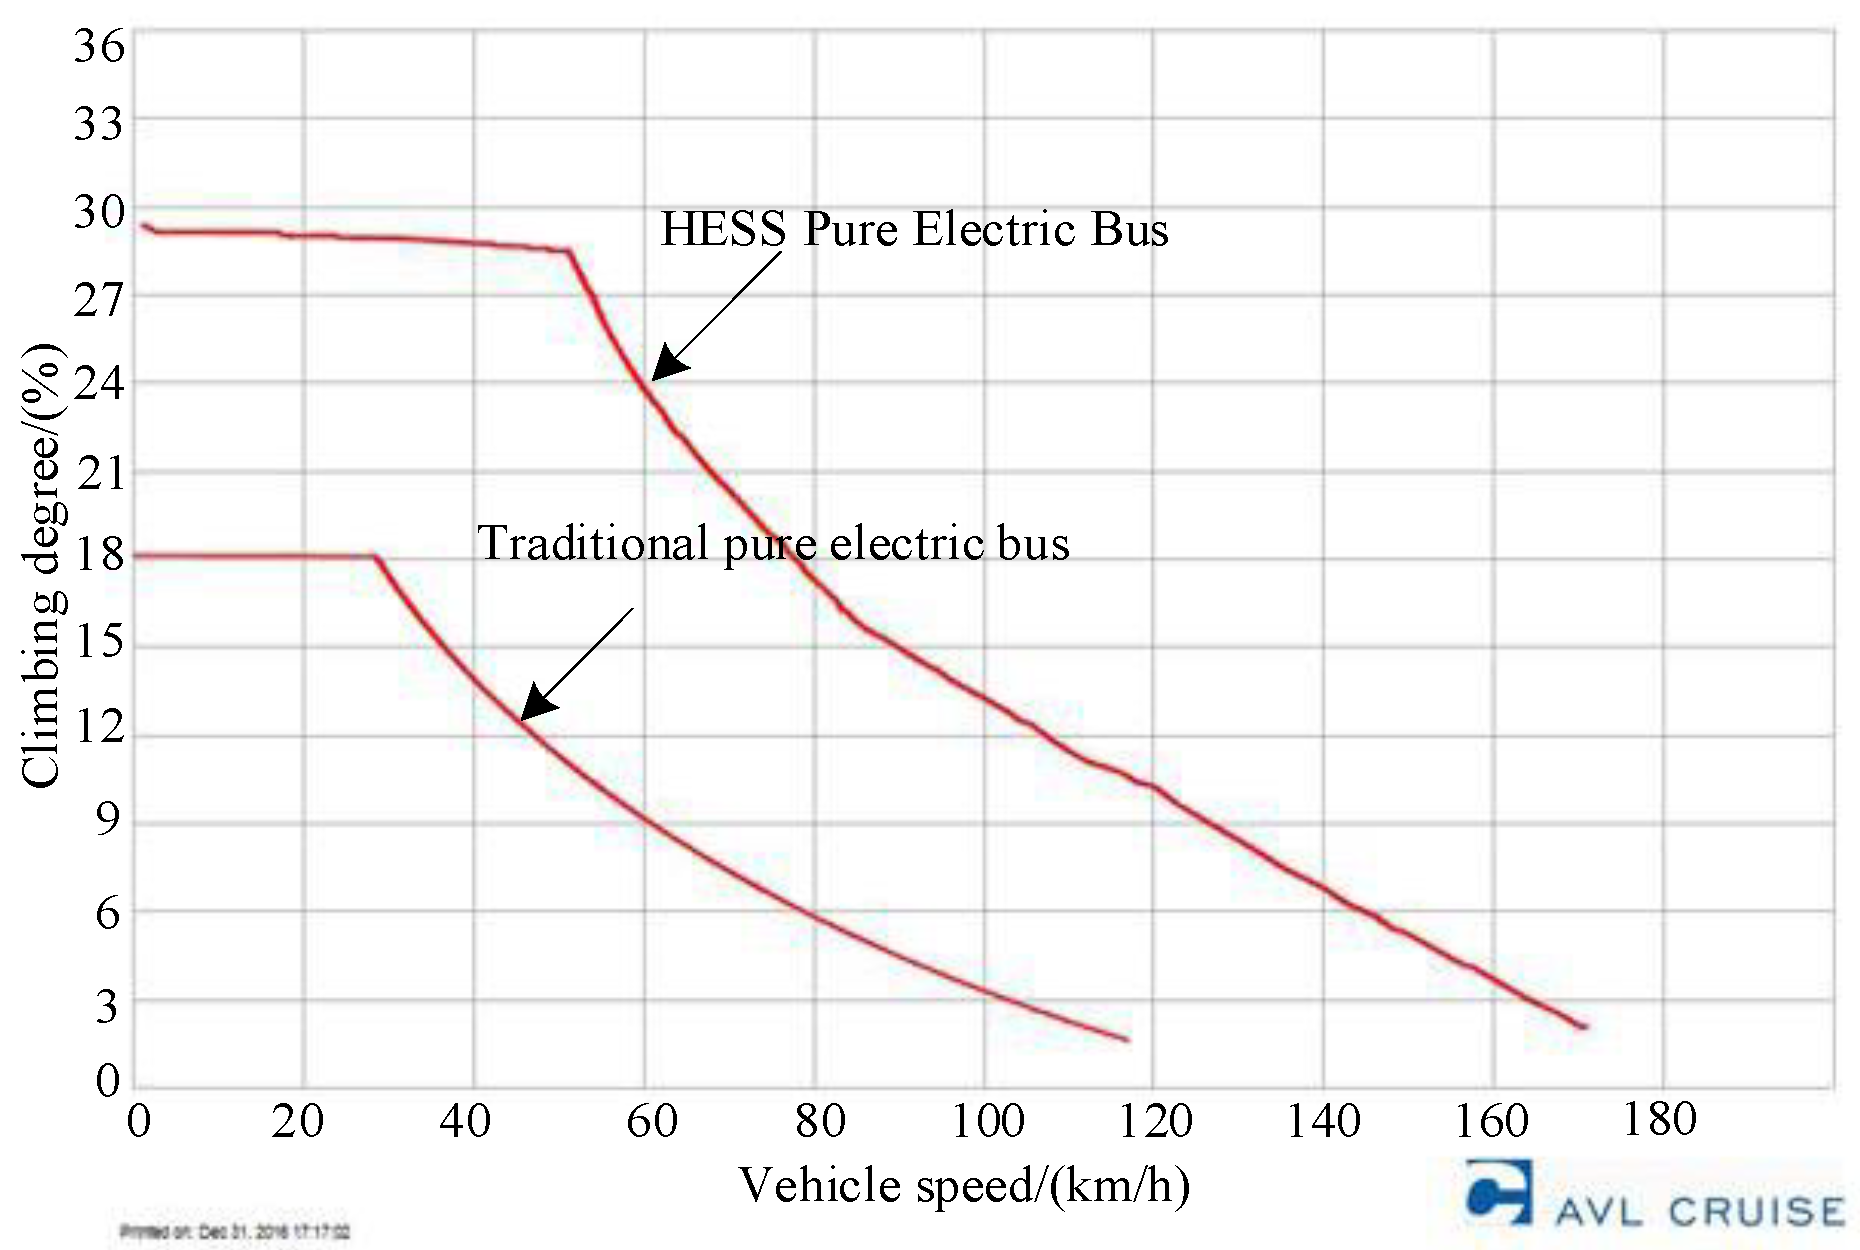
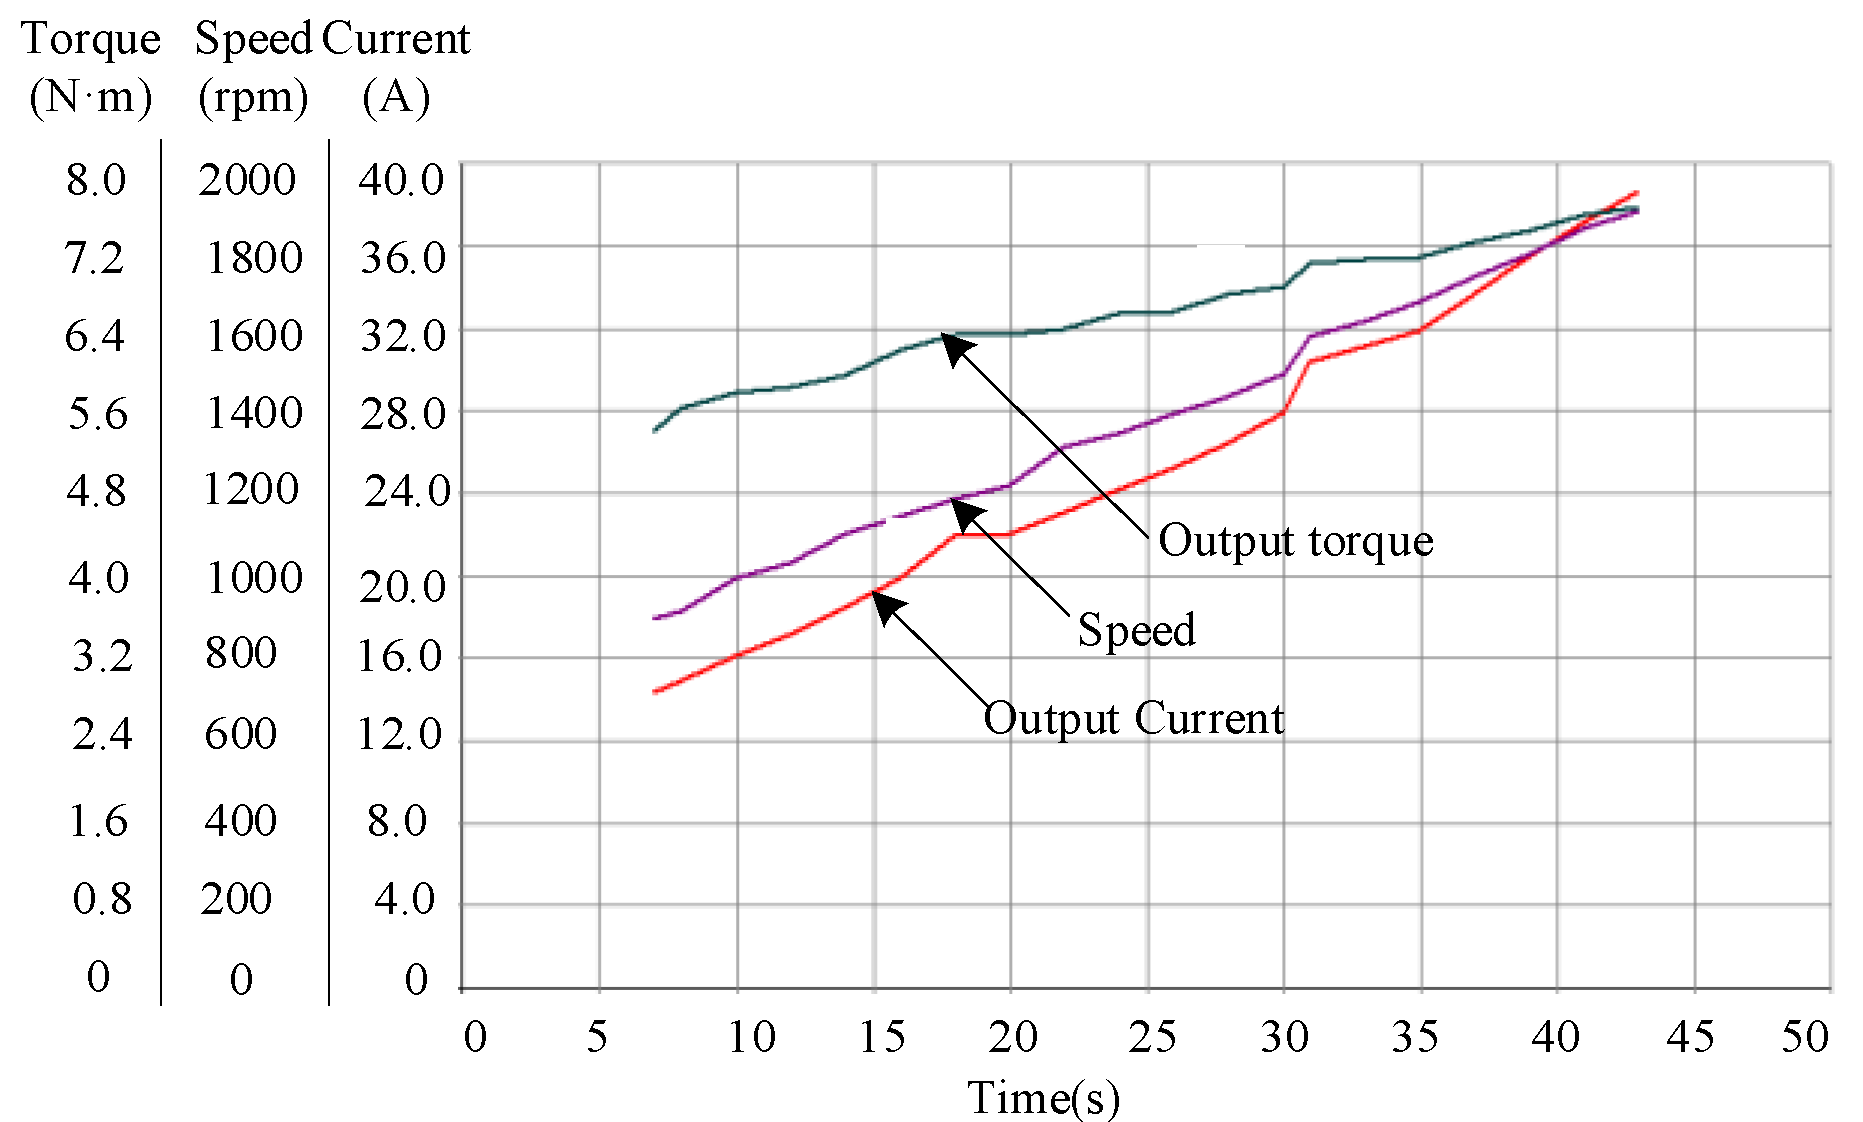
5.2.1. Constant-Speed Climbing Performance
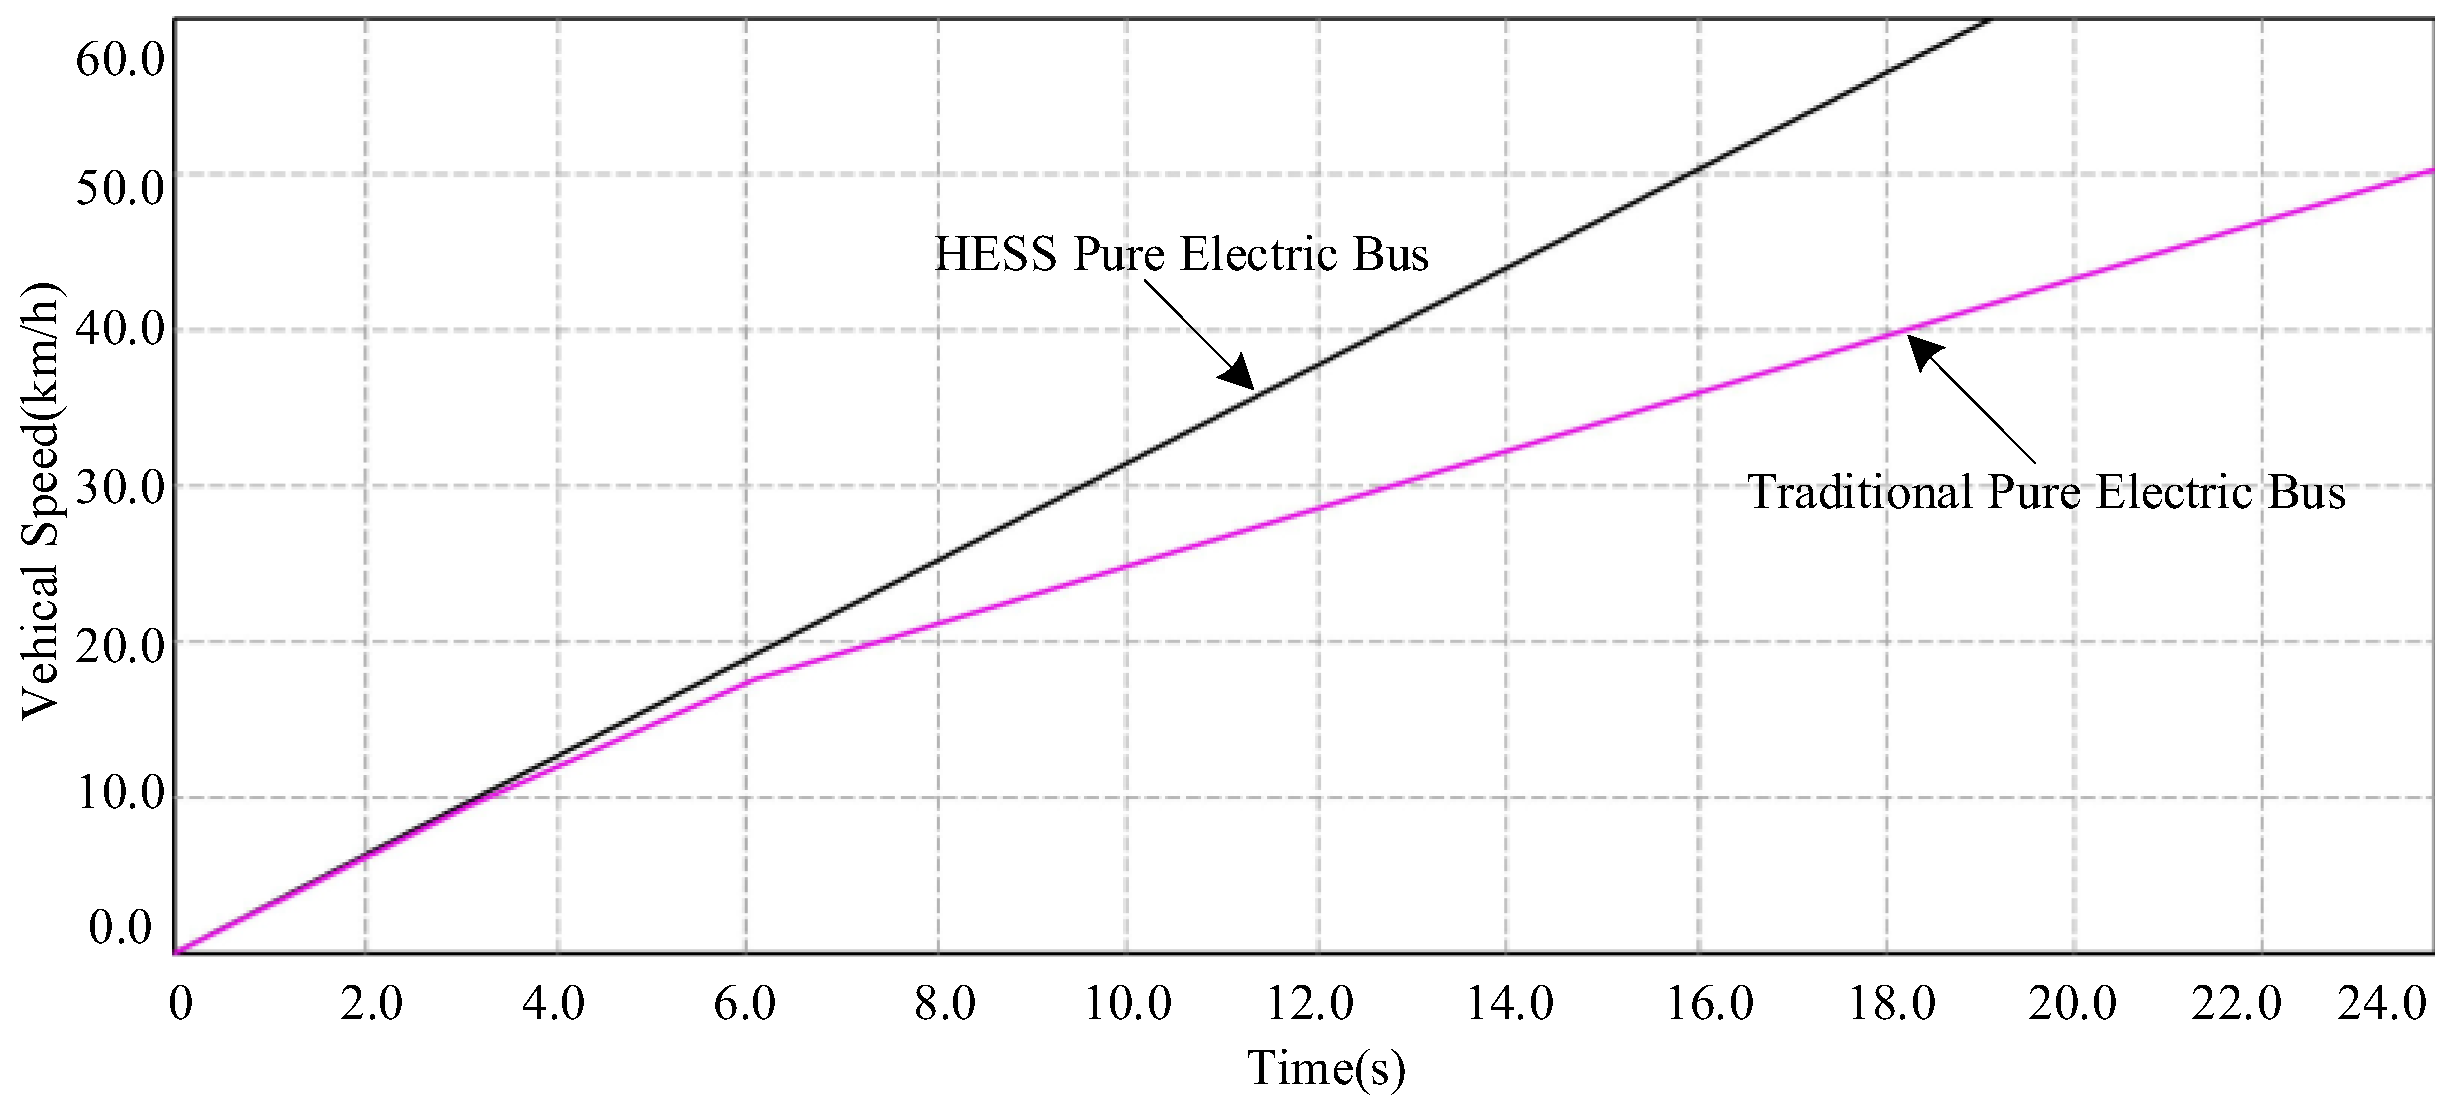
5.2.2. Accelerating Capability
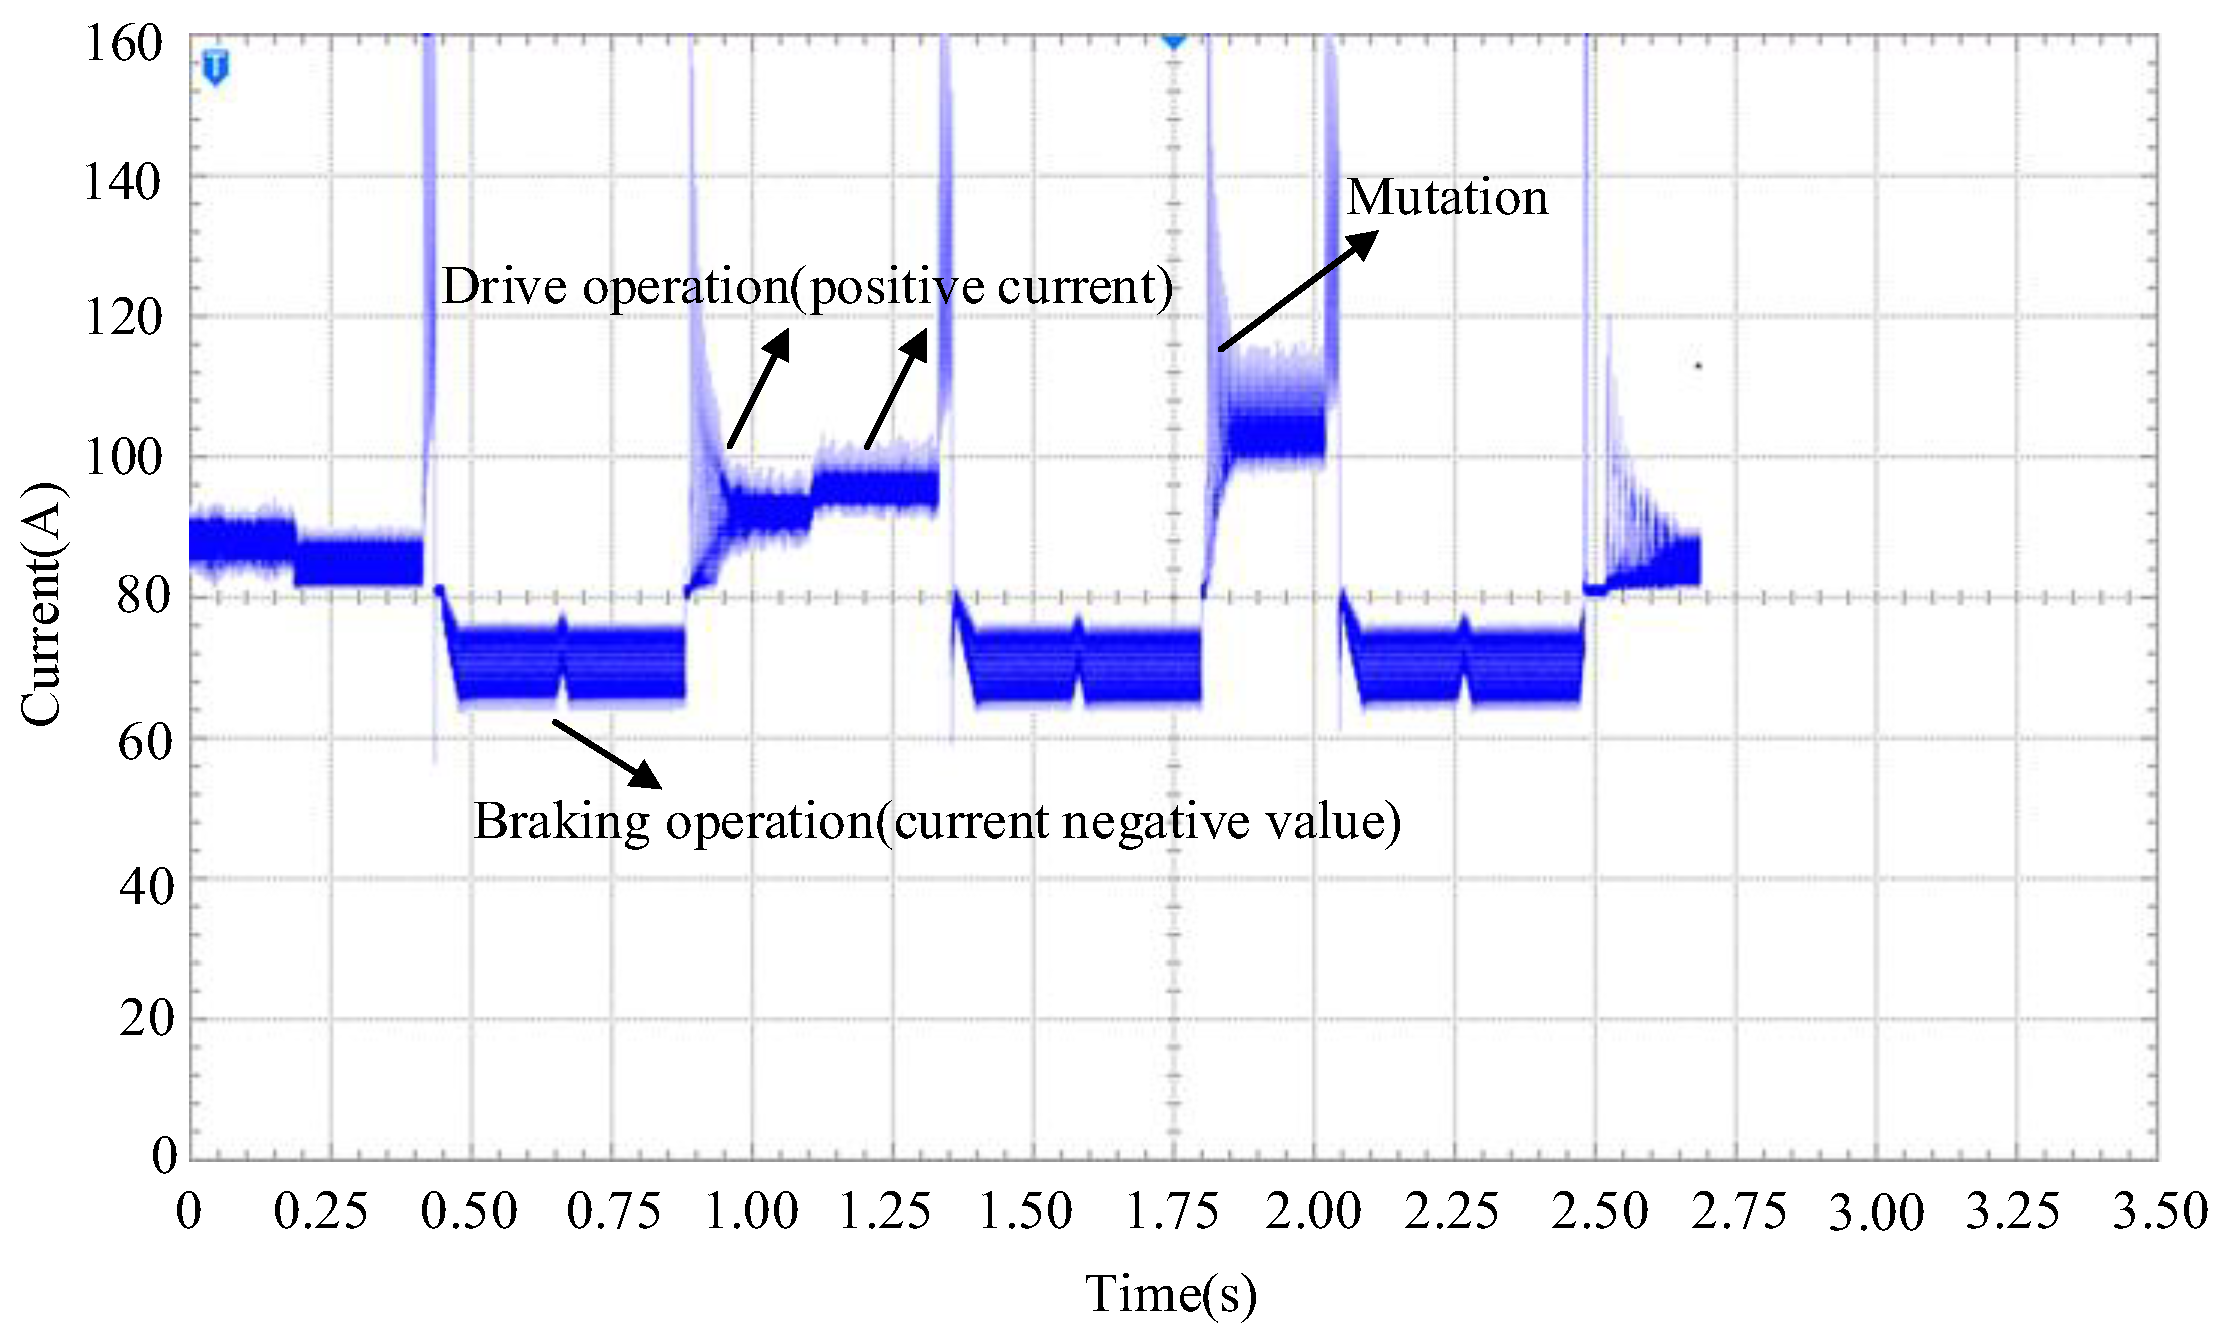
5.2.3. Regenerative Braking Feedback of Electric Vehicles
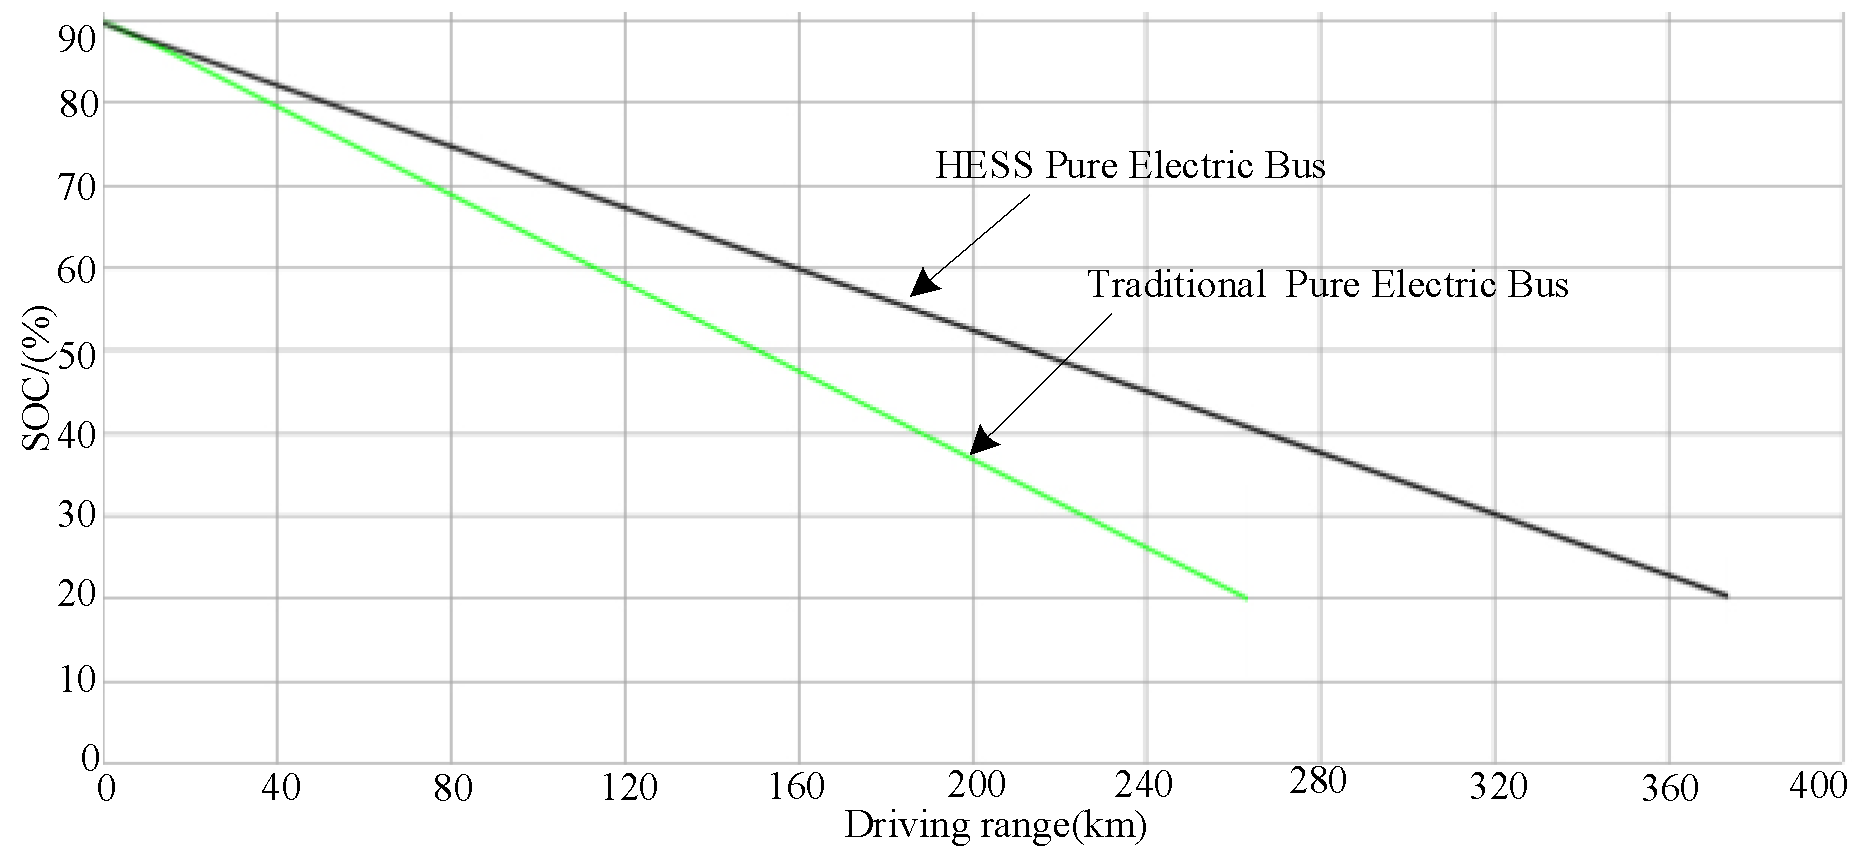
5.2.4. Continuous Road Condition Simulation
6. Conclusions
Author Contributions
Funding
Institutional Review Board Statement
Informed Consent Statement
Data Availability Statement
Conflicts of Interest
Appendix A. Simulation System Parameters
- (1)
- When the vehicle travels at a speed of v on a road with a slope of α, the power required by this vehicle at this moment is , the power consumed by the energy storage system is and the power consumed by other parts is :where is the power demand of the entire vehicle except the energy storage device, is the power demand of the composite energy storage device, m is the vehicle mass, is the mass of the composite energy storage device, is the mass of DC/DC, is the mass of the Li battery, is the mass of the supercapacitor and is the mass of other components.
- (2)
- The matched HESS energy/power ratio is defined as:In the formula, and are the total energy and total power of the vehicle during the traveling process.
- (3)
- That is, and ; therefore, .
- (4)
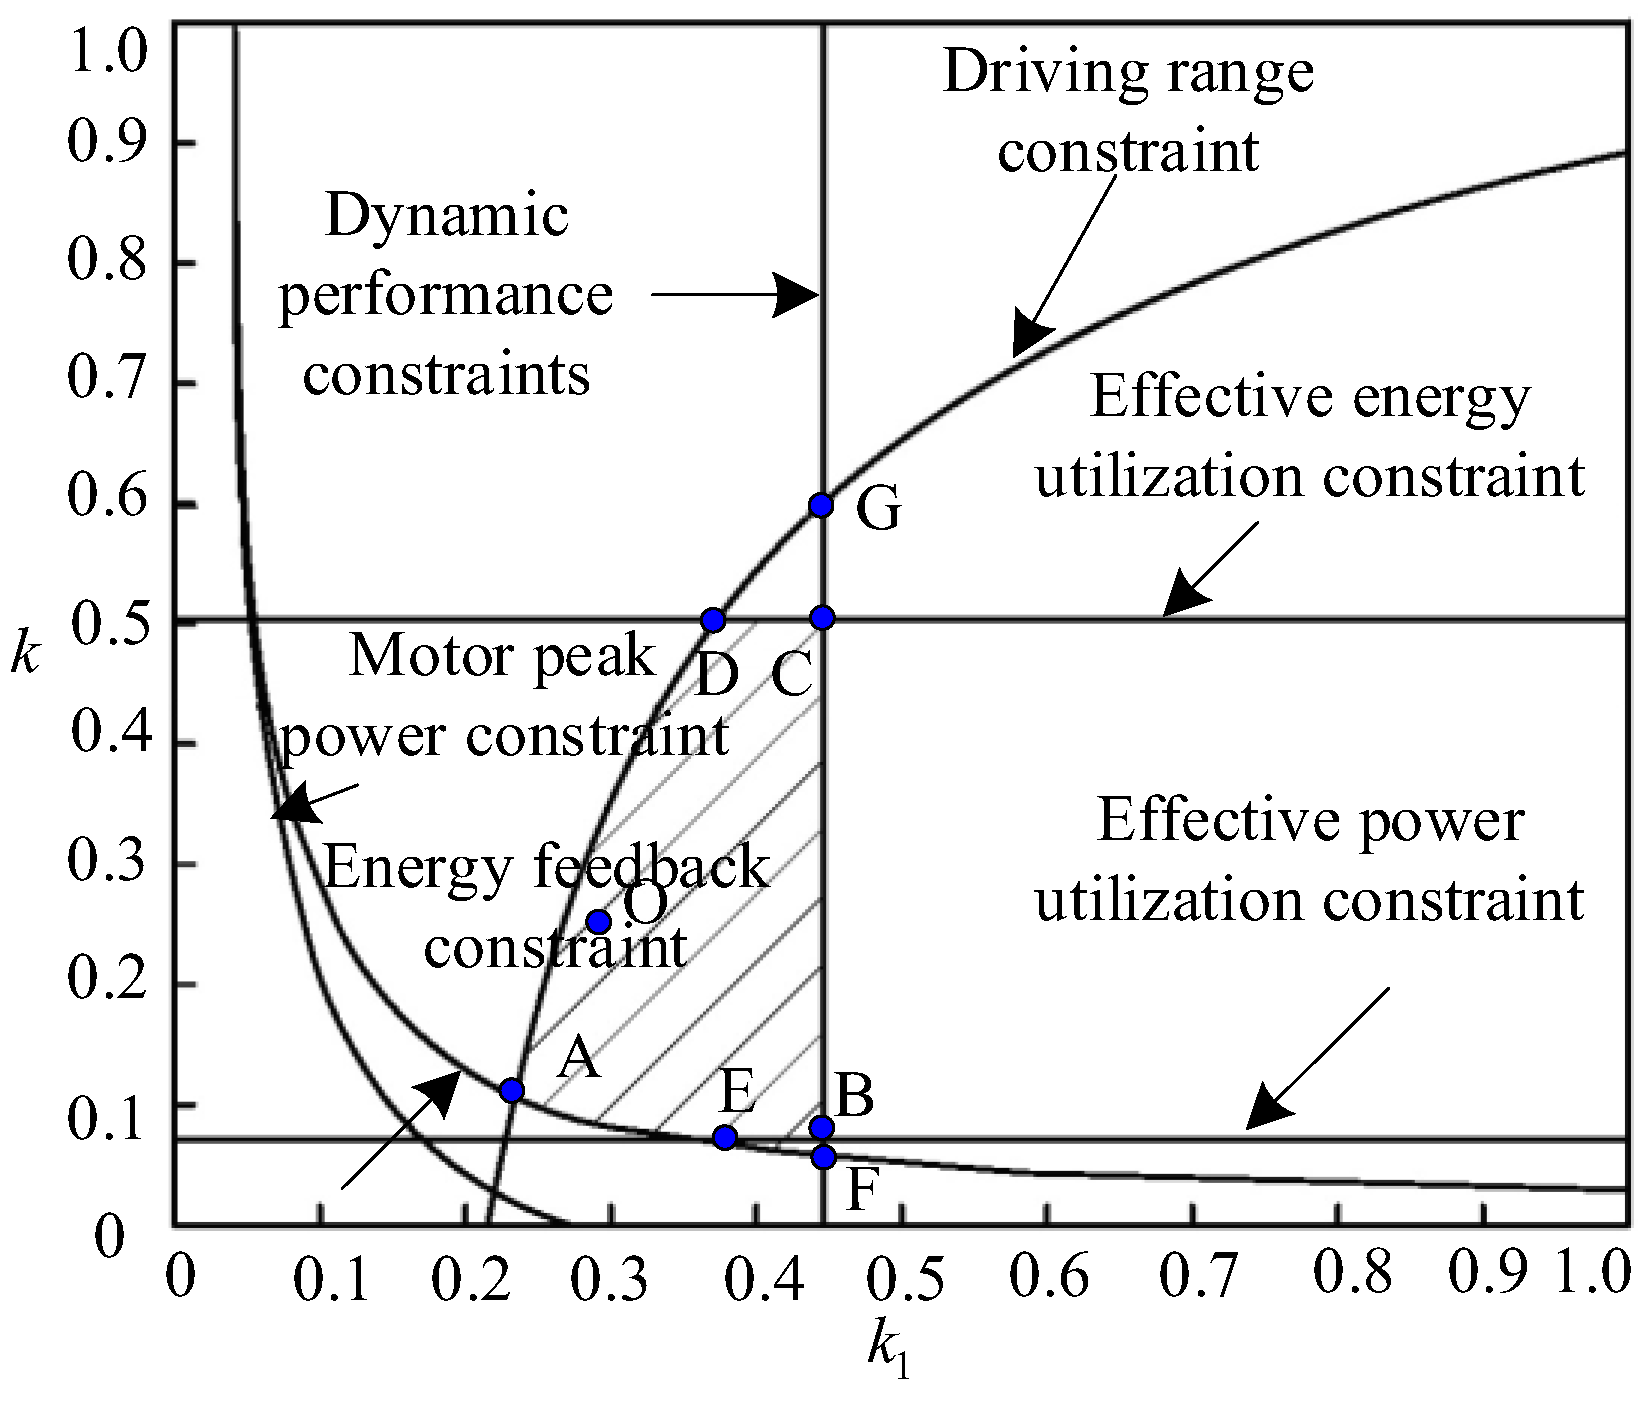
- From this, .According to the formula, the power coefficient is determined by the rolling friction coefficient, the slope angle and the vehicle speed. In the case of a certain slope angle, the higher the speed, the greater the corresponding power coefficient; the longer the distance traveled, the higher the corresponding energy coefficient.
- (5)
- The mass ratio is the percentage of the total mass of the supercapacitor in the HESS, and the mixing ratio is the ratio of the total mass of the HESS to the remaining mass of the vehicle.
References
- Masih-Tehrani, M.; Ha’Iri-Yazdi, M.R.; Esfahanian, V.; Safaei, A. Optimum sizing and optimum energy management of a hybrid energy storage system for lithium battery life improvement. J. Power Sources 2013, 244, 2–10. [Google Scholar] [CrossRef]
- Masih-Tehrani, M.; Dahmardeh, M. A Novel Power Distribution System Employing State of Available Power Estimation for a Hybrid Energy Storage System. IEEE Trans. Ind. Electron. 2018, 65, 6676–6685. [Google Scholar] [CrossRef]
- Li, M.; Wang, L.; Wang, Y.; Wang, Y.J.; Chen, Z.H. Sizing Optimization and Energy Management Strategy for Hybrid Energy Storage System Using Multiobjective Optimization and Random Forests. IEEE Trans. Power Electron. 2021, 36, 11421–11430. [Google Scholar] [CrossRef]
- Tostado-Veliz, M.; Arevalo, P.; Jurado, F. An optimization framework for planning wayside and on-board hybrid storage systems for tramway applications. J. Energy Storage 2021, 43, 103207. [Google Scholar] [CrossRef]
- Li, Q.; Chen, W.R.; Li, Y.K.; Liu, S.K.; Huang, J. Energy management strategy for fuel cell/battery/ultracapacitor hybrid vehicle based on fuzzy logic. Int. J. Electr. Power Energy Syst. 2012, 43, 514–525. [Google Scholar] [CrossRef]
- Li, Q.; Wang, T.X.; Li, S.H.; Chen, W.R.; Liu, H.; Breaz, E.; Gao, F. Online Extremum Seeking-based Optimized Energy Management Strategy for Hybrid Electric Tram Considering Fuel Cell Degradation. Appl. Energy 2021, 285, 116505. [Google Scholar] [CrossRef]
- Yu, Y.; Li, Q.; Huang, W.Q.; Chen, W.E. Operation Optimization and Control Method Based on Optimal Energy and Hydrogen Consumption for the Fuel Cell/Supercapacitor Hybrid Tram. IEEE Trans. Ind. Electron. 2021, 68, 1342–1352. [Google Scholar]
- Giannoutsos, S.V.; Manias, S.N. A Data-Driven Process Controller for Energy-Efficient Variable-Speed Pump Operation in the Central Cooling Water System of Marine Vessels. IEEE Trans. Ind. Electron. 2015, 62, 587–598. [Google Scholar] [CrossRef]
- Song, F.Z.; Liu, Y.; Xu, J.X.; Yang, X.F.; Zhu, Q. Data-Driven iterative feedforward tuning for a wafer stage: A high-order approach based on instrumental variables. IEEE Trans. Ind. Electron. 2019, 66, 3106–3116. [Google Scholar] [CrossRef]
- Montazeri-Gh, M.; Mahmoodi-K, M. Optimized predictive energy management of plug-in hybrid electric vehicle based on traffic condition. J. Clean. Prod. 2016, 139, 935–948. [Google Scholar] [CrossRef]
- Guo, L.X.; Zhang, X.D.; Zou, Y.; Guo, N.Y.; Li, J.W.; Du, G.D. Cost-optimal energy management strategy for plug-in hybrid electric vehicles with variable horizon speed prediction and adaptive state-of-charge reference. Energy 2021, 232, 120993. [Google Scholar] [CrossRef]
- Cao, J.; Emadi, A. A New Battery/UltraCapacitor Hybrid Energy Storage System for Electric, Hybrid, and Plug-In Hybrid Electric vehicles. IEEE Trans. Power Electron. 2012, 27, 122–132. [Google Scholar]
- Bayati, M.; Abedi, M.; Farahmandrad, M.; Gharehpetian, G.B.; Tehrani, K. Important Technical Considerations in Design of Battery Chargers of Electric Vehicles. Energies 2021, 14, 5878. [Google Scholar] [CrossRef]
- Shen, J.Y.; Dusmez, S.; Khaligh, A. Optimization of Sizing and Battery Cycle Life in Battery/Ultracapacitor Hybrid Energy Storage Systems for Electric Vehicle Applications. IEEE Trans. Ind. Inform. 2014, 10, 2112–2121. [Google Scholar] [CrossRef]
- Prasanthi, A.; Shareef, H.; Asna, M.; Ibrahim, A.A.; Errouissi, R. Optimization of hybrid energy systems and adaptive energy management for hybrid electric vehicles. Energy Conv. Manag. 2021, 243, 114357. [Google Scholar] [CrossRef]
- Hu, X.S.; Murgovski, N.; Johannesson, J.M.; Egardt, B. Comparison of three electrochemical energy buffers applied to a hybrid bus powertrain with simultaneous optimal sizing and energy management. IEEE Trans. Intell. Transp. Syst. 2014, 15, 1193–1205. [Google Scholar] [CrossRef]
- Li, Y.P.; Tang, X.L.; Lin, X.K.; Grzesiak, L.; Hu, X.S. The role and application of convex modeling and optimization in electrified vehicles. Renew. Sustain. Energ. Rev. 2022, 153, 111796. [Google Scholar] [CrossRef]
- Ravey, A.; Watrin, N.; Blunier, B.; Bouquain, D.; Miraoui, A. Energy-Source-Sizing Methodology for Hybrid Fuel Cell Vehicles Based on Statistical Description of Driving Cycles. IEEE Trans. Veh. Technol. 2011, 60, 4164–4174. [Google Scholar] [CrossRef]
- Kadyk, T.; Schenkendorf, R.; Hawner, S.; Yildiz, B.; Romer, U. Design of Fuel Cell Systems for Aviation: Representative Mission Profiles and Sensitivity Analyses. Front. Energy Res. 2019, 7, 35. [Google Scholar] [CrossRef] [Green Version]
- Gao, F.Y.; Zhang, H.R.; Wang, W.X. Energy Saving Operation Optimization of Hybrid Energy Storage System for Hydrogen Fuel Cell Tram. Trans. China Electrotech. Soc. 2020, 1, 293–299. [Google Scholar]
- Du, X.W.; Shen, Y.X.; Li, J. Energy management strategy of DC microgrid hybrid energy storage based on model predictive control. Power Syst. Prot. Control. 2020, 48, 69–75. [Google Scholar]
- Zhou, M.L.; Feng, J.F.; Zhang, Y. Composite energy storage system and its energy control strategy for electric vehicles. Electr. Mach. Control. 2019, 23, 51–59. [Google Scholar]
- Hu, J.J.; Xiao, J.; Yan, J.J. Control strategy and parameter optimization of hybrid energy storage device for electric vehicles. J. Chongqing Univ. 2016, 39, 1–11. [Google Scholar]
- Zhou, M.L.; Feng, J.F.; Zhang, Y. Research on power allocation control strategy for compound electric energy storage system of pure electric bus. Trans. China Electrotech. Soc. 2019, 34, 5001–5013. [Google Scholar]
- Lu, X.Y.; Wang, H.Y. Optimal Sizing and Energy Management for Cost-Effective PEV Hybrid Energy Storage Systems. IEEE Trans. Ind. Inform. 2020, 16, 3407–3416. [Google Scholar] [CrossRef]
- Wang, Y.X.; Su, J.; Hu, J.G. Research on on-board charging system for electric vehicle. J. Electr. Technol. 2019, 7, 62–66. [Google Scholar]


| System Parameters | Value | |
|---|---|---|
| Overall vehicle performance requirements | Maximum speed (km/h) | ≥80 |
| Maximum climbing degree (%) | ≥16 | |
| Acceleration time (s) | ≤25 (0~50 km/h) | |
| Driving range (km) | ≥250 km (40 km/h uniform speed) | |
| Overall vehicle parameters | Size (mm) | 12,000 × 2530 × 3080 |
| Unladen mass (kg) | 12,000 | |
| Full load mass (kg) | 17,800 | |
| Air resistance coefficient Cd | 0.65 | |
| Rolling resistance coefficient ff | 0.0165 | |
| Rolling mass conversion factor | 1.08 | |
| Windward area A (m2) | 6.385 | |
| Wheel radius (m) | 0.469 |
| Battery Type | Specific Energy (W·h/kg) | Specific Power (W/kg) | Cycle Life (Times) | Price (USD/kW·h) |
|---|---|---|---|---|
| Pb–acid | 20~100 | 50~400 | 500~2000 | 120~150 |
| Ni–Cd | 40~60 | 80~350 | 600~3000 | 250~350 |
| Ni–Fe | 50~60 | 80~150 | 1500~2000 | 200~400 |
| Ni–Zn | 55~75 | 150~300 | 600~1200 | 100~300 |
| Ni–metal hydride | 70~95 | 200~300 | 750~1200 | 200~350 |
| Al–air | 200~300 | 160 | -- | -- |
| Fe–air | 80~120 | 90 | 500+ | 50 |
| Zi–air | 100~220 | 30~80 | 600+ | 90~120 |
| Li-ion | 100~130 | 150~250 | 1000+ | About 200 |
| Brand Name | Rated Voltage (V) | Rated Capacitance (F) | Series Equivalent Resistance (mΩ) | Energy Density (W·h/kg) | Power Density (W/kg) | Weight (kg) |
|---|---|---|---|---|---|---|
| Maxwell | 2.7 | 3000 | 0.29 | 5.52 | 5400 | 0.55 |
| Nesscap | 2.7 | 5000 | 0.25 | 5.44 | 5063 | 0.93 |
| Panasonic | 2.5 | 2500 | 0.43 | 3.70 | 1035 | 0.395 |
| EPCOS | 2.7 | 3400 | 0.45 | 4.3 | 760 | 0.60 |
| ESMA | 1.7 | 80,000 | 0.5 | 13.38 | 583 | 2.4 |
| Spscap | 2.7 | 9500 | 0.28 | 7.40 | 5010 | 1.3 |
| BMOD0115 | 42 | 145 | 10 | 2.22 | 2900 | 16 |
| BMOD0117 | 14 | 435 | 4 | 1.82 | 1900 | 6.5 |
| BCAP0010 | 2.5 | 2600 | 0.7 | 4.3 | 4300 | 0.525 |
| Company A | 1.6 | 140,000 | 0.3 | 12.0 | 205 | 5.0 |
| Company B | 2.7 | 20 | 49 | 9.88 | 1000 | 0.116 |
| Company C | 2.7 | 100 | 15 | 4.9 | 1677 | 0.021 |
| Company D | 2.7 | 3000 | 0.4 | 3.85 | 1020 | 0.41 |
| Company E | 1.2 | 1500 | 2.4 | 3.3 | 3800 | 0.36 |
| Output Voltage (V) | Output Current (A) | Input Torque (N·m) | Input Power (W) | Output Power (W) | Efficiency (%) |
|---|---|---|---|---|---|
| 53.39 | −26.994 | −6.634 | 1860.56 | −1441.42 | 77.47 |
| 53.62 | −26.856 | −6.613 | 1866.72 | −1440.23 | 77.15 |
| 53.77 | −26.235 | −6.587 | 1857.65 | −1410.85 | 75.95 |
| 53.87 | −26.172 | −6.576 | 1838.85 | −1409.88 | 76.67 |
| 53.93 | −25.784 | −6.565 | 1823.40 | −1390.71 | 76.27 |
| 54.99 | −25.744 | −6.559 | 1811.09 | −1390.08 | 76.75 |
| 54.03 | −25.496 | −6.549 | 1800.30 | −1377.77 | 76.53 |
| 54.08 | −24.907 | −6.527 | 1746.41 | −1347.17 | 77.14 |
| 54.12 | −24.893 | −6.524 | 1748.61 | −1347.22 | 77.05 |
| 54.12 | −24.404 | −6.516 | 1736.84 | −1320.76 | 76.04 |
| 54.14 | −24.380 | −6.512 | 1720.43 | −1320.04 | 76.73 |
| 54.16 | −24.187 | −6.503 | 1709.27 | −1309.97 | 76.64 |
| 54.18 | −24.194 | −6.505 | 1704.14 | −1310.94 | 76.93 |
| 54.15 | −23.273 | −6.484 | 1654.57 | −1260.36 | 76.17 |
| 54.17 | −23.284 | −6.482 | 1644.83 | −1261.37 | 76.69 |
| 54.10 | −21.677 | −6.450 | 1541.27 | −1172.73 | 76.09 |
| 54.11 | −21.682 | −6.449 | 1534.07 | −1173.21 | 76.48 |
Publisher’s Note: MDPI stays neutral with regard to jurisdictional claims in published maps and institutional affiliations. |
© 2022 by the authors. Licensee MDPI, Basel, Switzerland. This article is an open access article distributed under the terms and conditions of the Creative Commons Attribution (CC BY) license (https://creativecommons.org/licenses/by/4.0/).
Share and Cite
Zhang, Y.; Liu, J.; Cui, S.; Zhou, M. Parameter Matching Methods for Li Battery–Supercapacitor Hybrid Energy Storage Systems in Electric Buses. Machines 2022, 10, 85. https://doi.org/10.3390/machines10020085
Zhang Y, Liu J, Cui S, Zhou M. Parameter Matching Methods for Li Battery–Supercapacitor Hybrid Energy Storage Systems in Electric Buses. Machines. 2022; 10(2):85. https://doi.org/10.3390/machines10020085
Chicago/Turabian StyleZhang, Yu, Jiahong Liu, Shumei Cui, and Meilan Zhou. 2022. "Parameter Matching Methods for Li Battery–Supercapacitor Hybrid Energy Storage Systems in Electric Buses" Machines 10, no. 2: 85. https://doi.org/10.3390/machines10020085
APA StyleZhang, Y., Liu, J., Cui, S., & Zhou, M. (2022). Parameter Matching Methods for Li Battery–Supercapacitor Hybrid Energy Storage Systems in Electric Buses. Machines, 10(2), 85. https://doi.org/10.3390/machines10020085