Article

The LESGIRgram: A New Method to Select the Optimal Demodulation Frequency Band for Rolling Bearing Faults

School of Energy, Power and Mechanical Engineering, North China Electric Power University, Baoding 071000, China
*
Author to whom correspondence should be addressed.
Machines 2023, 11(12), 1052; https://doi.org/10.3390/machines11121052
Submission received: 17 October 2023 / Revised: 15 November 2023 / Accepted: 21 November 2023 / Published: 27 November 2023
(This article belongs to the Section Machines Testing and Maintenance)

Abstract

:
Resonance demodulation of vibration signals is a common method for extracting fault information from rolling bearings. Nonetheless, demodulation quality is dependent on frequency band location. Established methods such as the Fast Kurtogram, Autogram, SKRgram, etc. have achieved satisfactory results in some cases, but the results are not good in the presence of strong white Gaussian noise and random impulses. To solve these issues, an algorithm that selects the optimal demodulation frequency band (ODFB) based on the ratio of the logarithmic envelope spectrum Gini coefficient (LESGIRgram) is proposed. The core idea of this paper is to capture the difference between the LESGIgrams of health and fault signals and accordingly locate the frequency bands that contain the most fault information. Initially, the baseline is constructed by calculating the logarithmic envelope spectrum Gini coefficient matrix of the health bearing (LESGIbaseline). Next, the LESGI matrix of the fault bearing (LESGImeasured) is computed. The ratio of LESGImeasured to LESGIbaseline is calculated, and the ODFB can be selected with the maximum LESGIR. The fault signal is then filtered using this derived ODFB, and envelope analysis is performed to extract fault features. The proposed algorithm for detecting rolling bearing faults has been verified for accuracy and effectiveness through simulation and experimental data.

1. Introduction

Rolling bearings are crucial elements of rotating machinery and find widespread applications in various industrial equipment. These essential components can be vulnerable to sudden failures due to the influence of complex environmental noise and structural deformation [1]. In the event of rolling bearing failure, shock vibrations occur at the point of damage and lead to the emergence of an impulse response at a specific frequency, known as the failure characteristic frequency (FCF) [2]. Therefore, extracting information about rolling bearing failure has become a pressing concern to prevent severe accidents and economic damages.
Resonance demodulation is the most commonly used method for fault information extraction and has been widely used for early fault diagnosis of rolling bearings. Spectral kurtosis (SK) was originally introduced by Dwyer [3] as a statistical tool to indicate not only the non-Gaussian components of a signal but also their position in the frequency domain. However, the spectral kurtosis algorithm is computationally inefficient since it calculates the kurtosis value at each frequency line. Antoni [4,5] proposed a short-time Fourier transform-based SK estimator, known as the Kurtogram, which calculates the kurtosis of the signal envelope for all window lengths Nw. The Fast Kurtogram [6] utilizes a 1/3-binary tree structure to partition the frequency bands, filtering the best bands with kurtosis, and filtering the signals with a multi rate filter bank. Considering that the wavelet packet transform can filter out the noise and accurately match the fault characteristics of the noisy signal, Lei [7] proposed to improve the FK algorithm with a filter based on the wavelet packet transform. Wang [8] proposed an improved Kurtogram algorithm based on wavelet packet decomposition, which calculates the crag value based on the power spectra of the signal envelope extracted from the wavelet packet nodes of different depths, and proposes to use autoregressive filtering to eliminate the discrete frequency noise. The Protrugram, proposed by Barszcz and Jablonskis [9], employs the kurtosis of the envelope spectrum of a narrowband filtered signal as a criterion for the identification of resonant bands, and replaces the variable-width bands in the Fast Kurtogram with narrow bands of fixed bandwidth. The method is more robust with non-Gaussian noise compared to the Fast Kurtogram. However, the bandwidth of the method needs to be predefined. Moshrefzadeh and Fasana [10] proposed the Autogram method, which divides the frequency bands based on the Maximum Overlapping Discrete Wavelet Packet Transform (MODWPT) and then selects the optimal demodulation frequency bands using the unbiased autocorrelation kurtosis.
Since kurtosis is sensitive to a single pulse, when the signal contains random pulses, the kurtosis-guided-gram, which uses kurtosis as a criterion, suffers from the interference of random pulses, which affects its ability to select the optimal demodulation frequency bands associated with faults. In order to solve this problem, a series of methods with new criterions (as a breakthrough for improvement) have emerged. Antoni [11] proposed the Infogram based on the criterion of the negative entropy of the square envelope of the signal and the negative entropy of the square envelope spectrum and their mean values. The algorithm synthesizes the time and frequency domain characteristics of the signal. The Fast Entrogram [12] uses frequency slice wavelet transform as the band segmentation principle and correlation spectral negentropy as the band screening criterion. The method optimizes the boundary segmentation method and feature screening index of the Fast Kurtogram. Wang [13] proposed power spectrum screening combination-gram, which is based on the autoregressive power spectrum for band segmentation and uses the negative entropy as the band screening criterion. This method solves the problem with the band delineation model of the existing methods being susceptible to receive the influence of background noise and irrelevant components. In order to improve the sparsity measurement ability of band screening metrics, Yang [14] proposed a fast nonlinear Hoyergram, which uses Hoyer metrics instead of crag as band screening metrics. Liang [15] proposed an improved Autogram method based on the Gini periodicity measure, which accurately identifies periodic pulses using a sequence feature evaluation method based on a low-coefficient periodicity measure and maximally sparse pulse evaluation.
For the diagnosis of planetary bearings, Wang [16] proposed a creative model based on the spectral kurtosis ratio of normal and faulty signals, known as the SKRgram, to eliminate strong and complex gear meshing interruptions with good results. Miao [17] proposed to replace the kurtosis selection criterion in the SKRgram with Gini coefficients to improve the sparsity of the selection criterion. However, the Gini coefficient value of a single pulse is higher than that of a periodic pulse, and the sparsity of Gini coefficients is affected under the influence of strong noise. To solve this problem, this paper proposes to utilize the Gini coefficient of the logarithmic envelope spectrum as a band screening metric in the improved SKRgram algorithm. First, the LESGI-based FK of the health signal is calculated. Second, the LESGI-based FK of the fault signal is calculated. Then, the ratio of these two matrices is calculated, which is the criteria of LESGIRgram. Finally, the fault signal is filtered and demodulated using the obtained optimal demodulation frequency band, and the fault features are extracted with envelope analysis.
The rest of this paper is summarized as follows. Section 2 reviews the Fast Kurtogram, Autogram, and SKRgram, and introduces the theory of the LESGIRgram. In Section 3, the effectiveness of the LESGIRgram method is verified with bearing simulation signals. In Section 4, the superiority of the LESGIRgram is verified with the real vibration signals from Jiangnan University and the NASA IMS bearing dataset. Section 5 outlines conclusions.

2. Theoretical Background

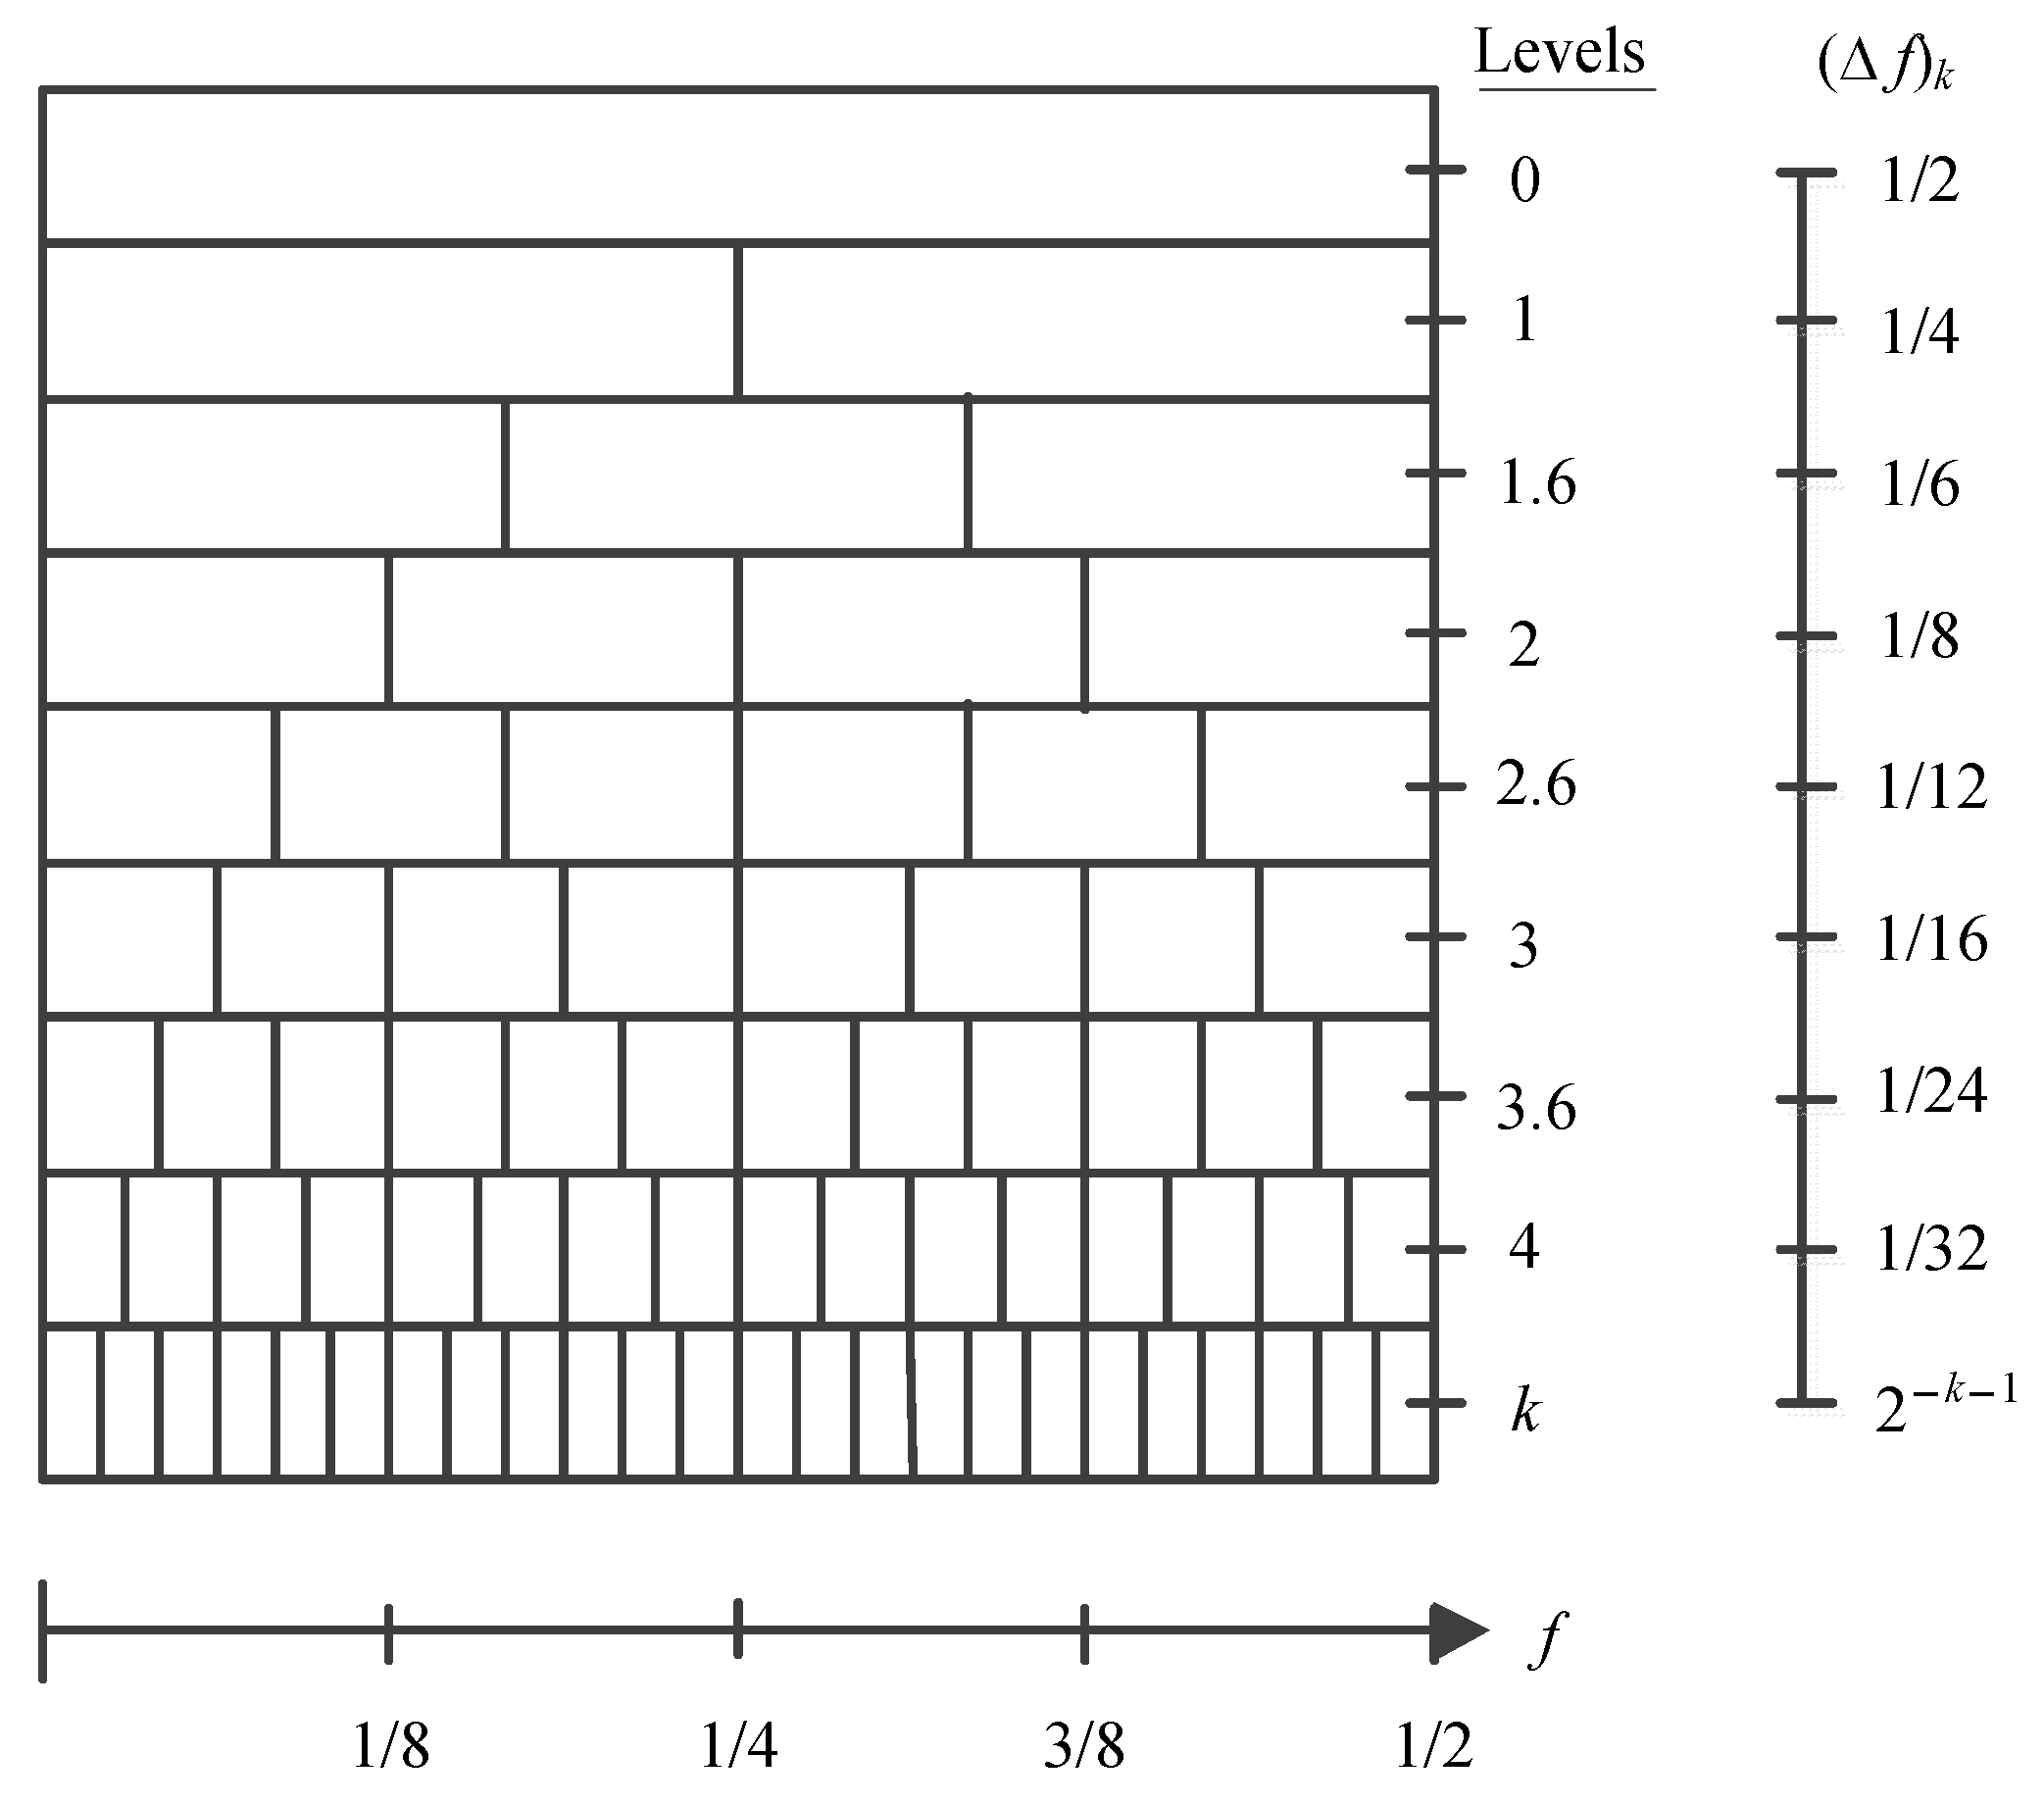
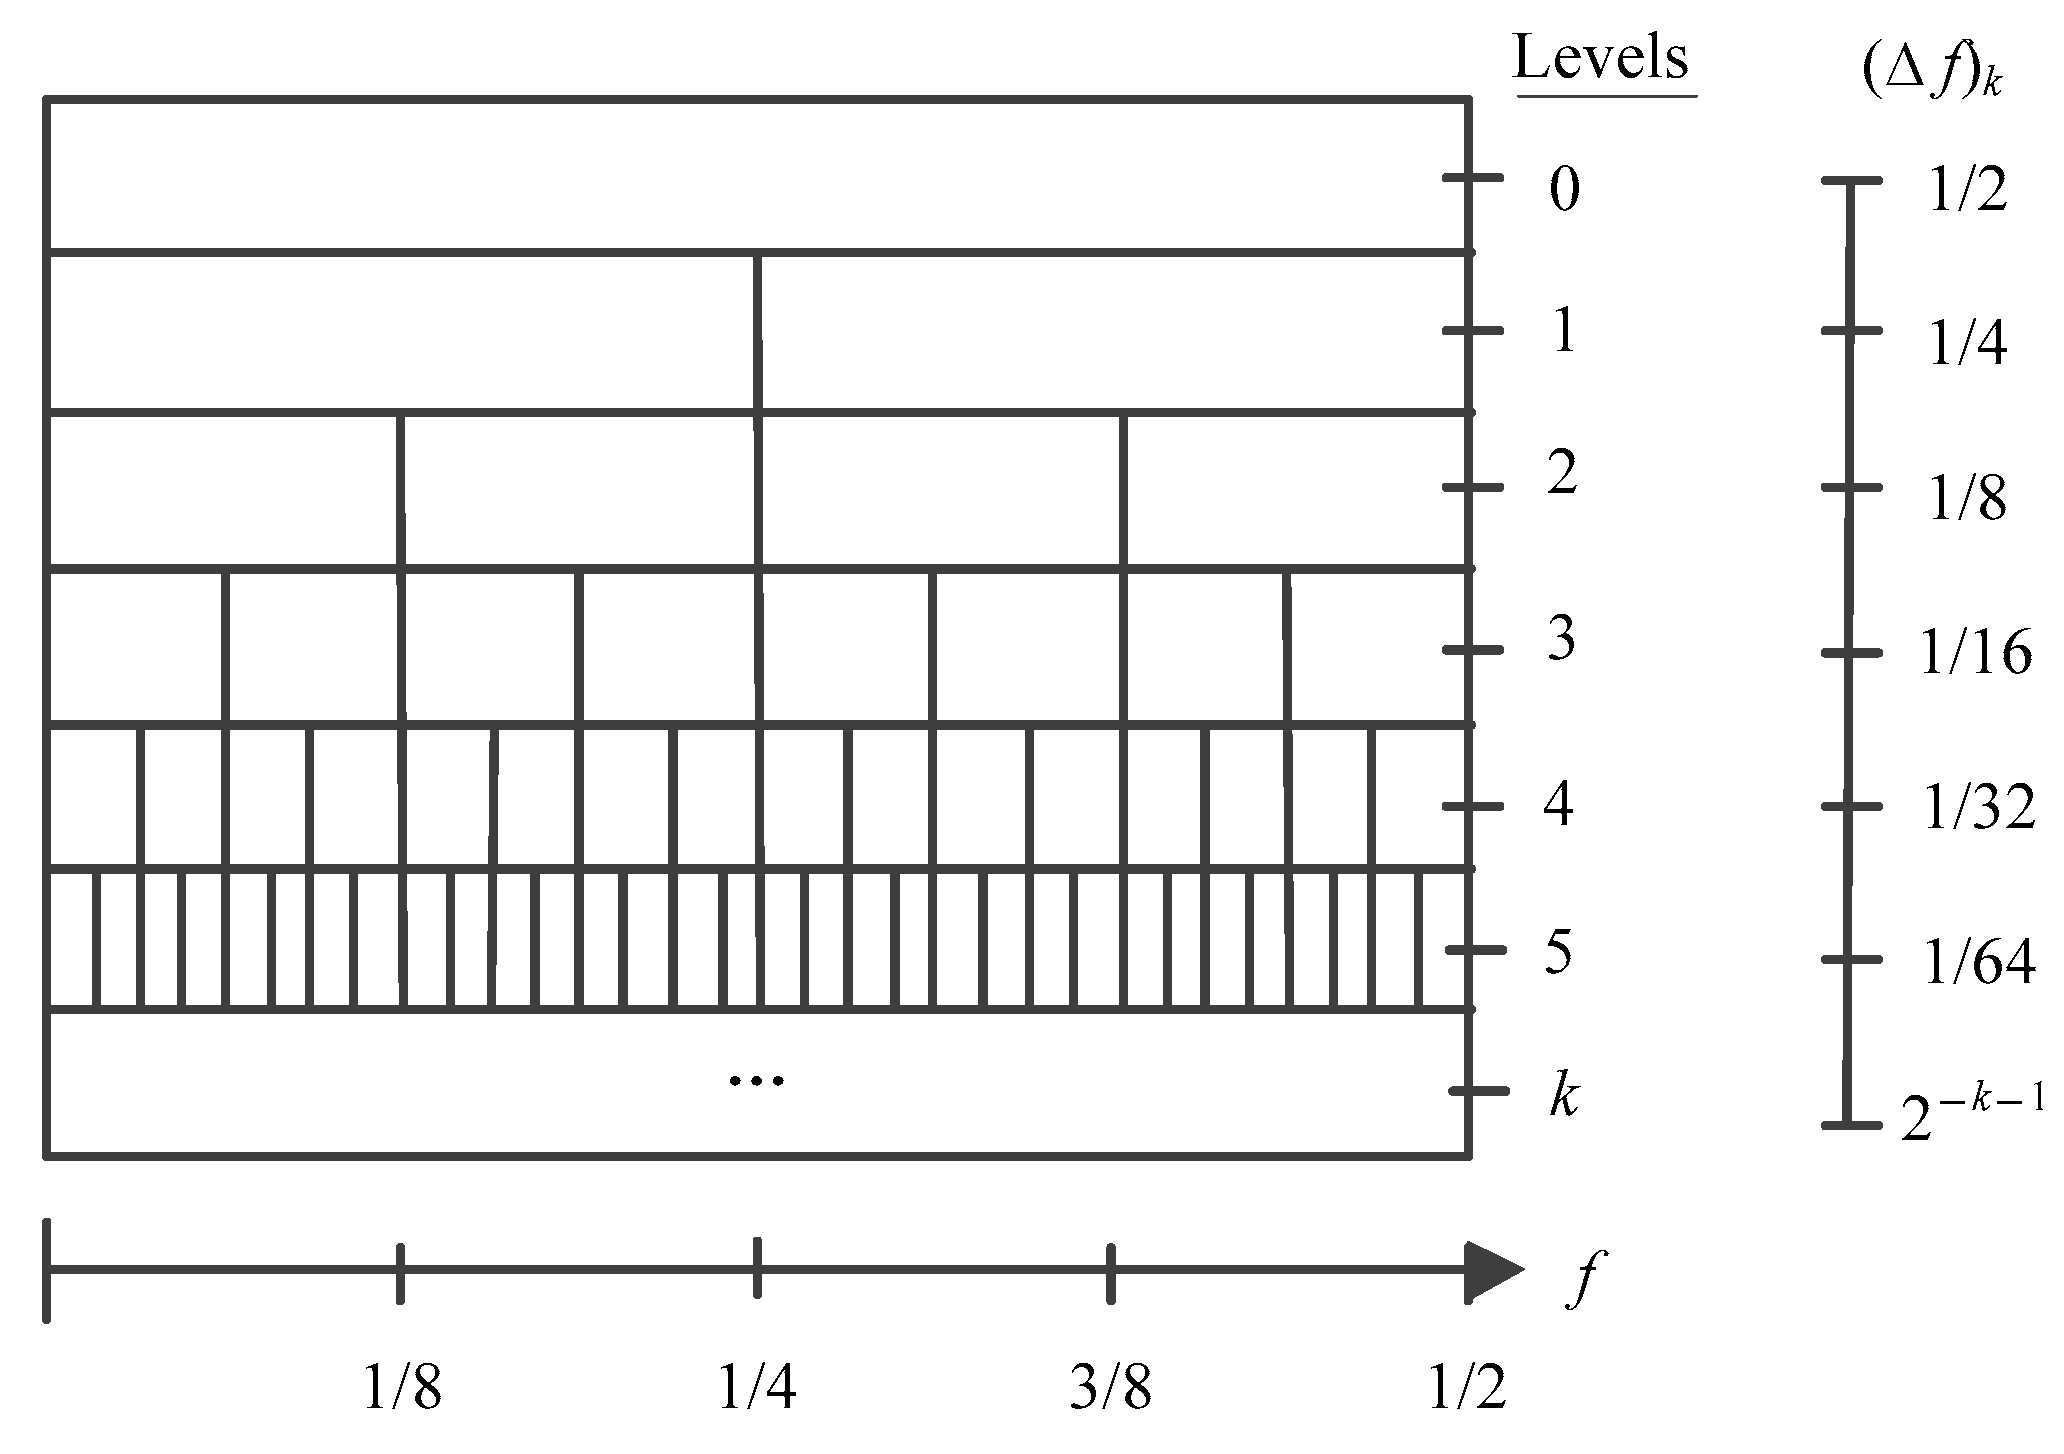
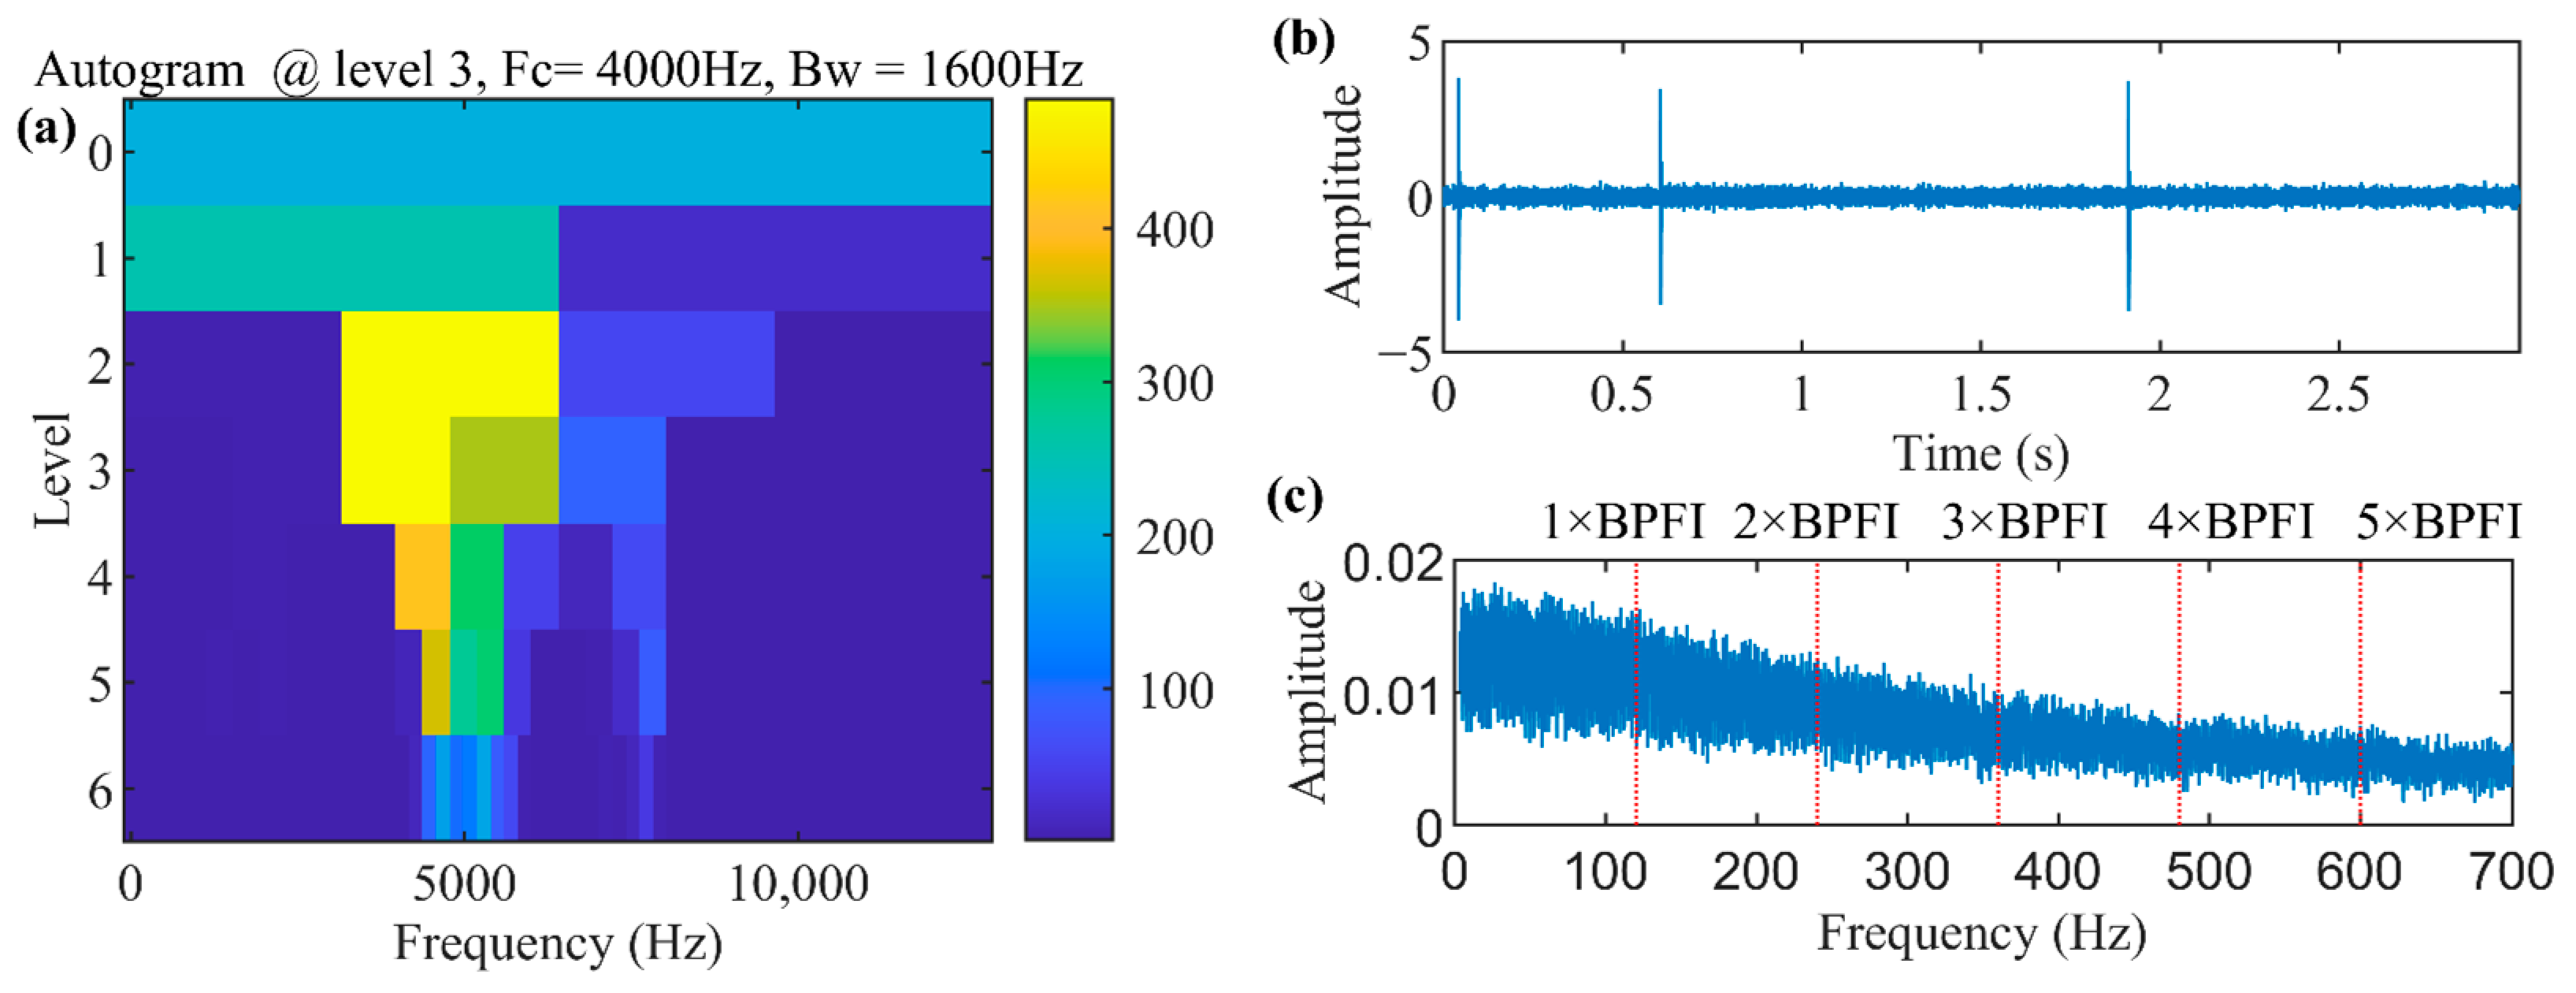
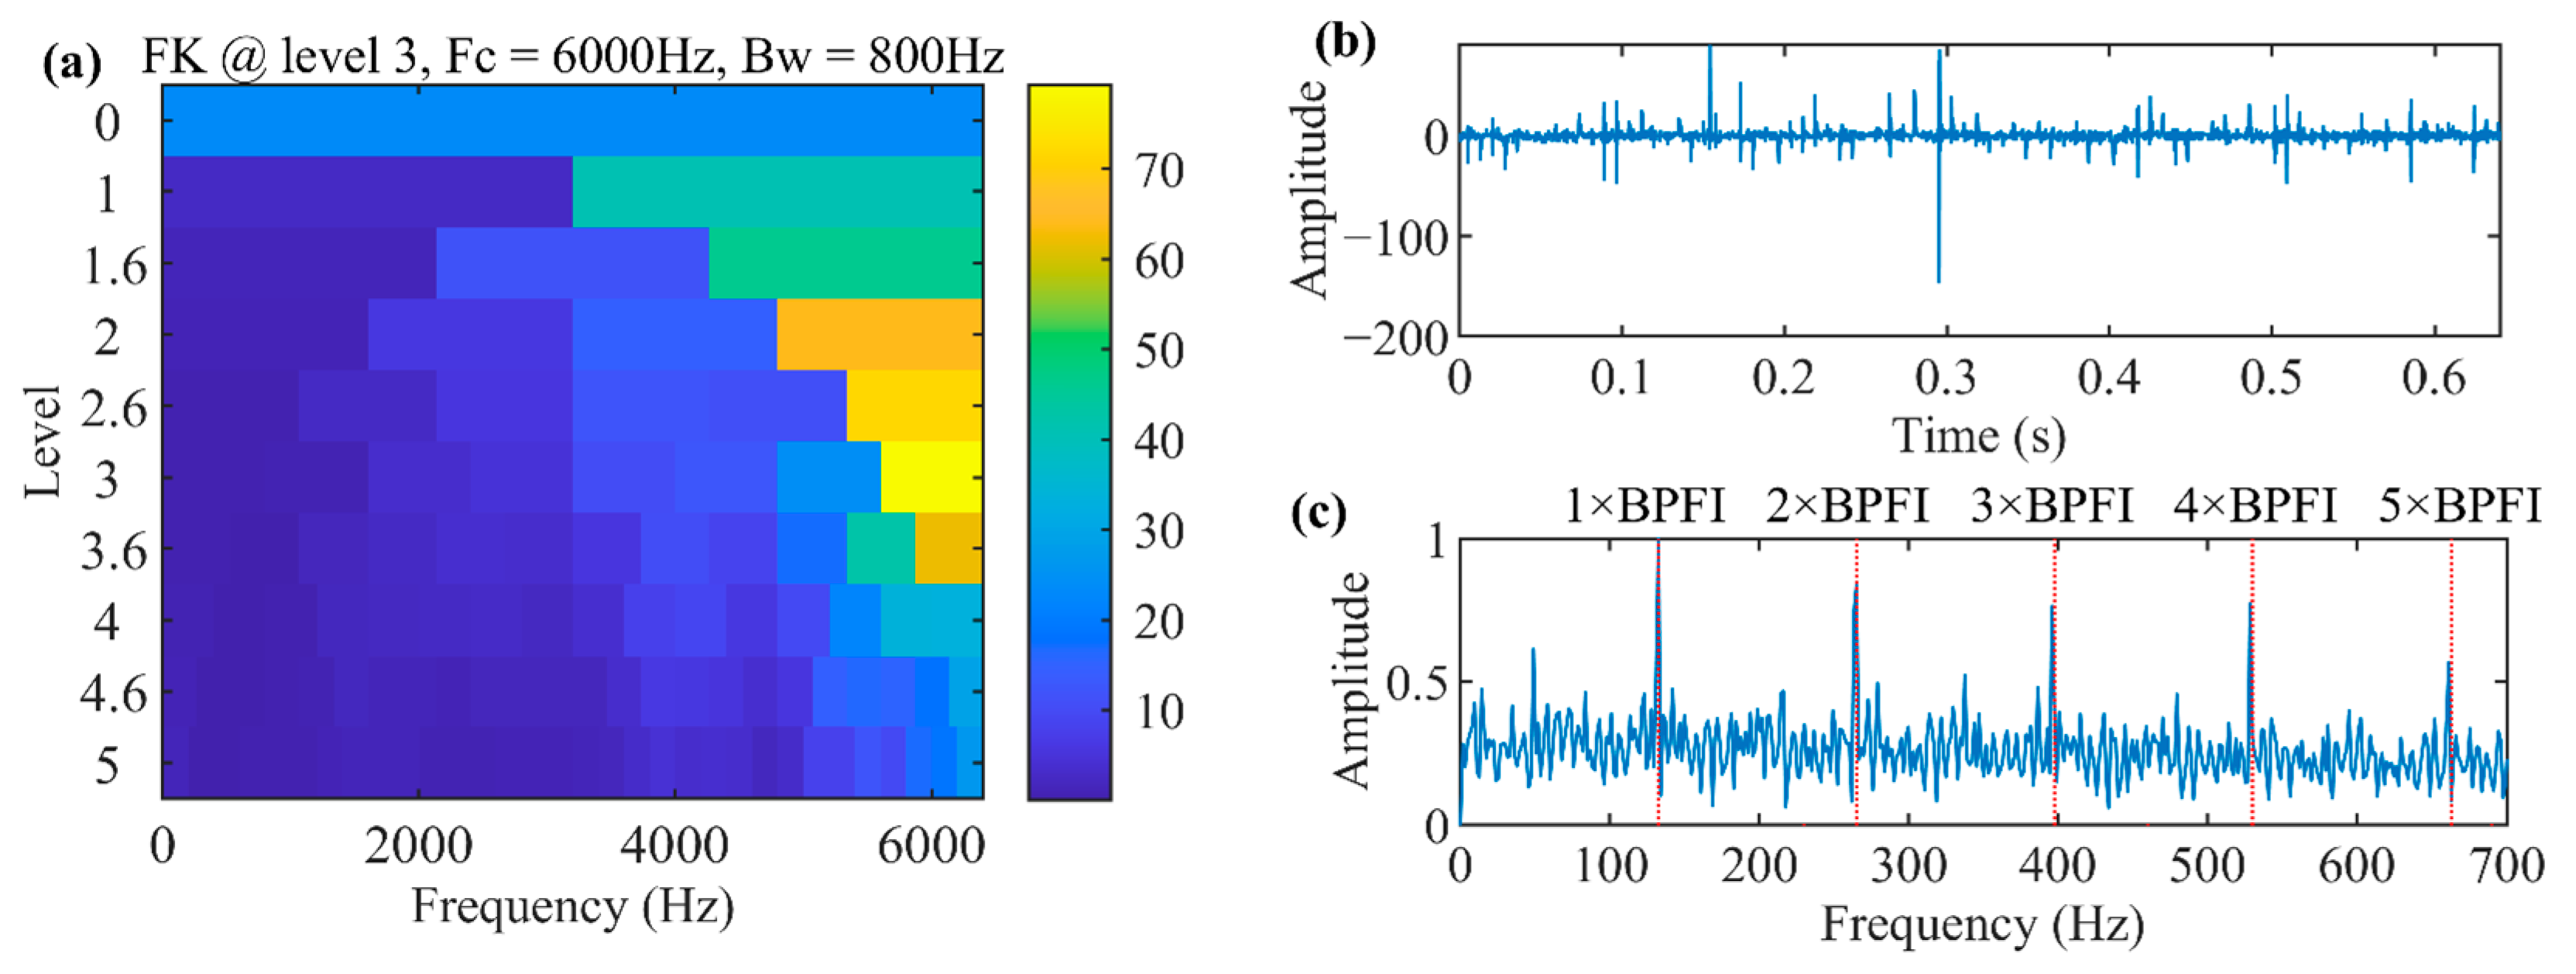
2.1. Fast Kurtogram and Autogram
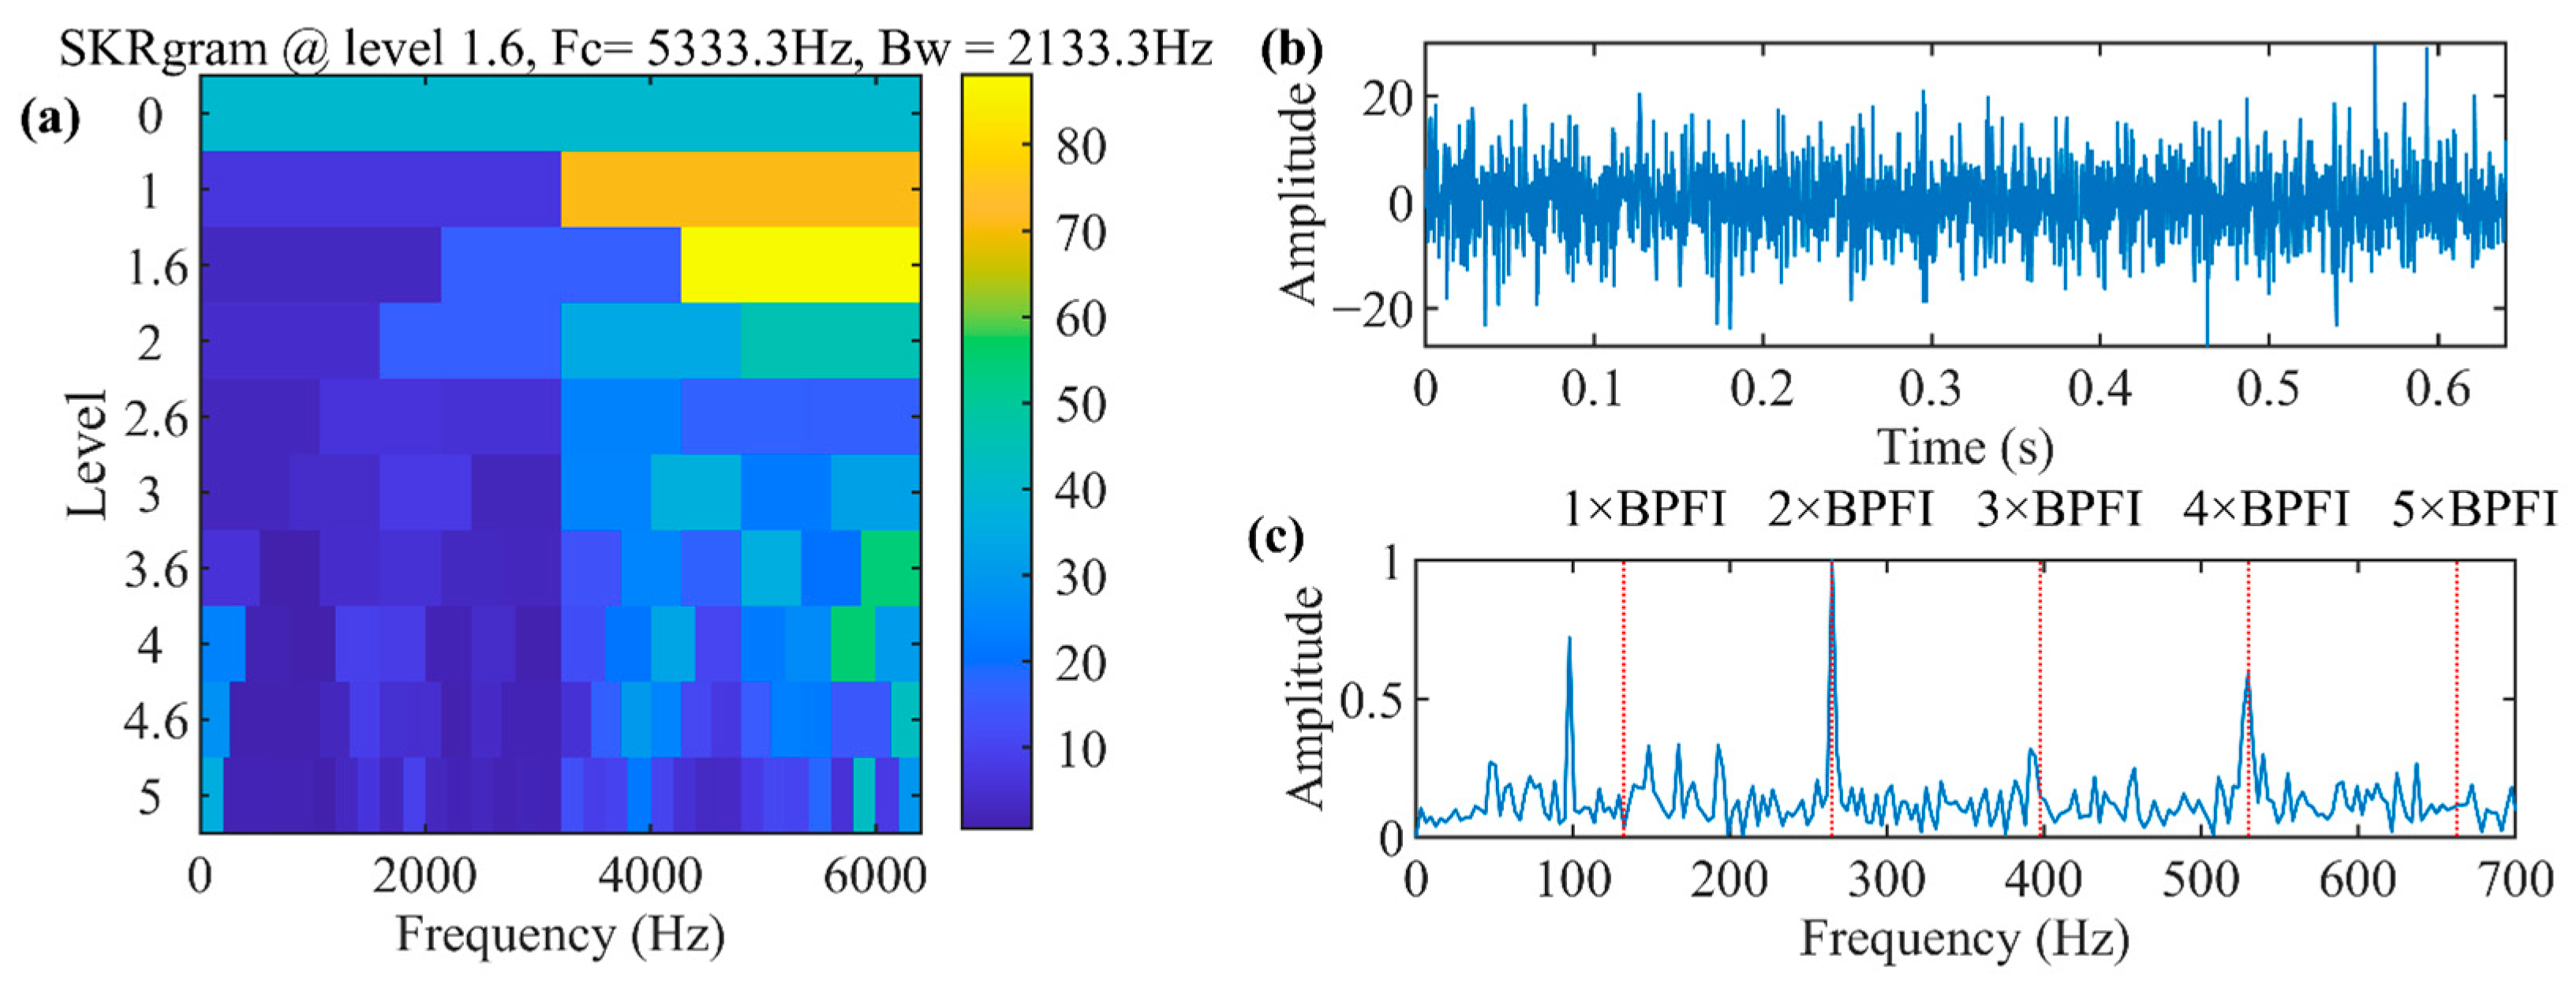
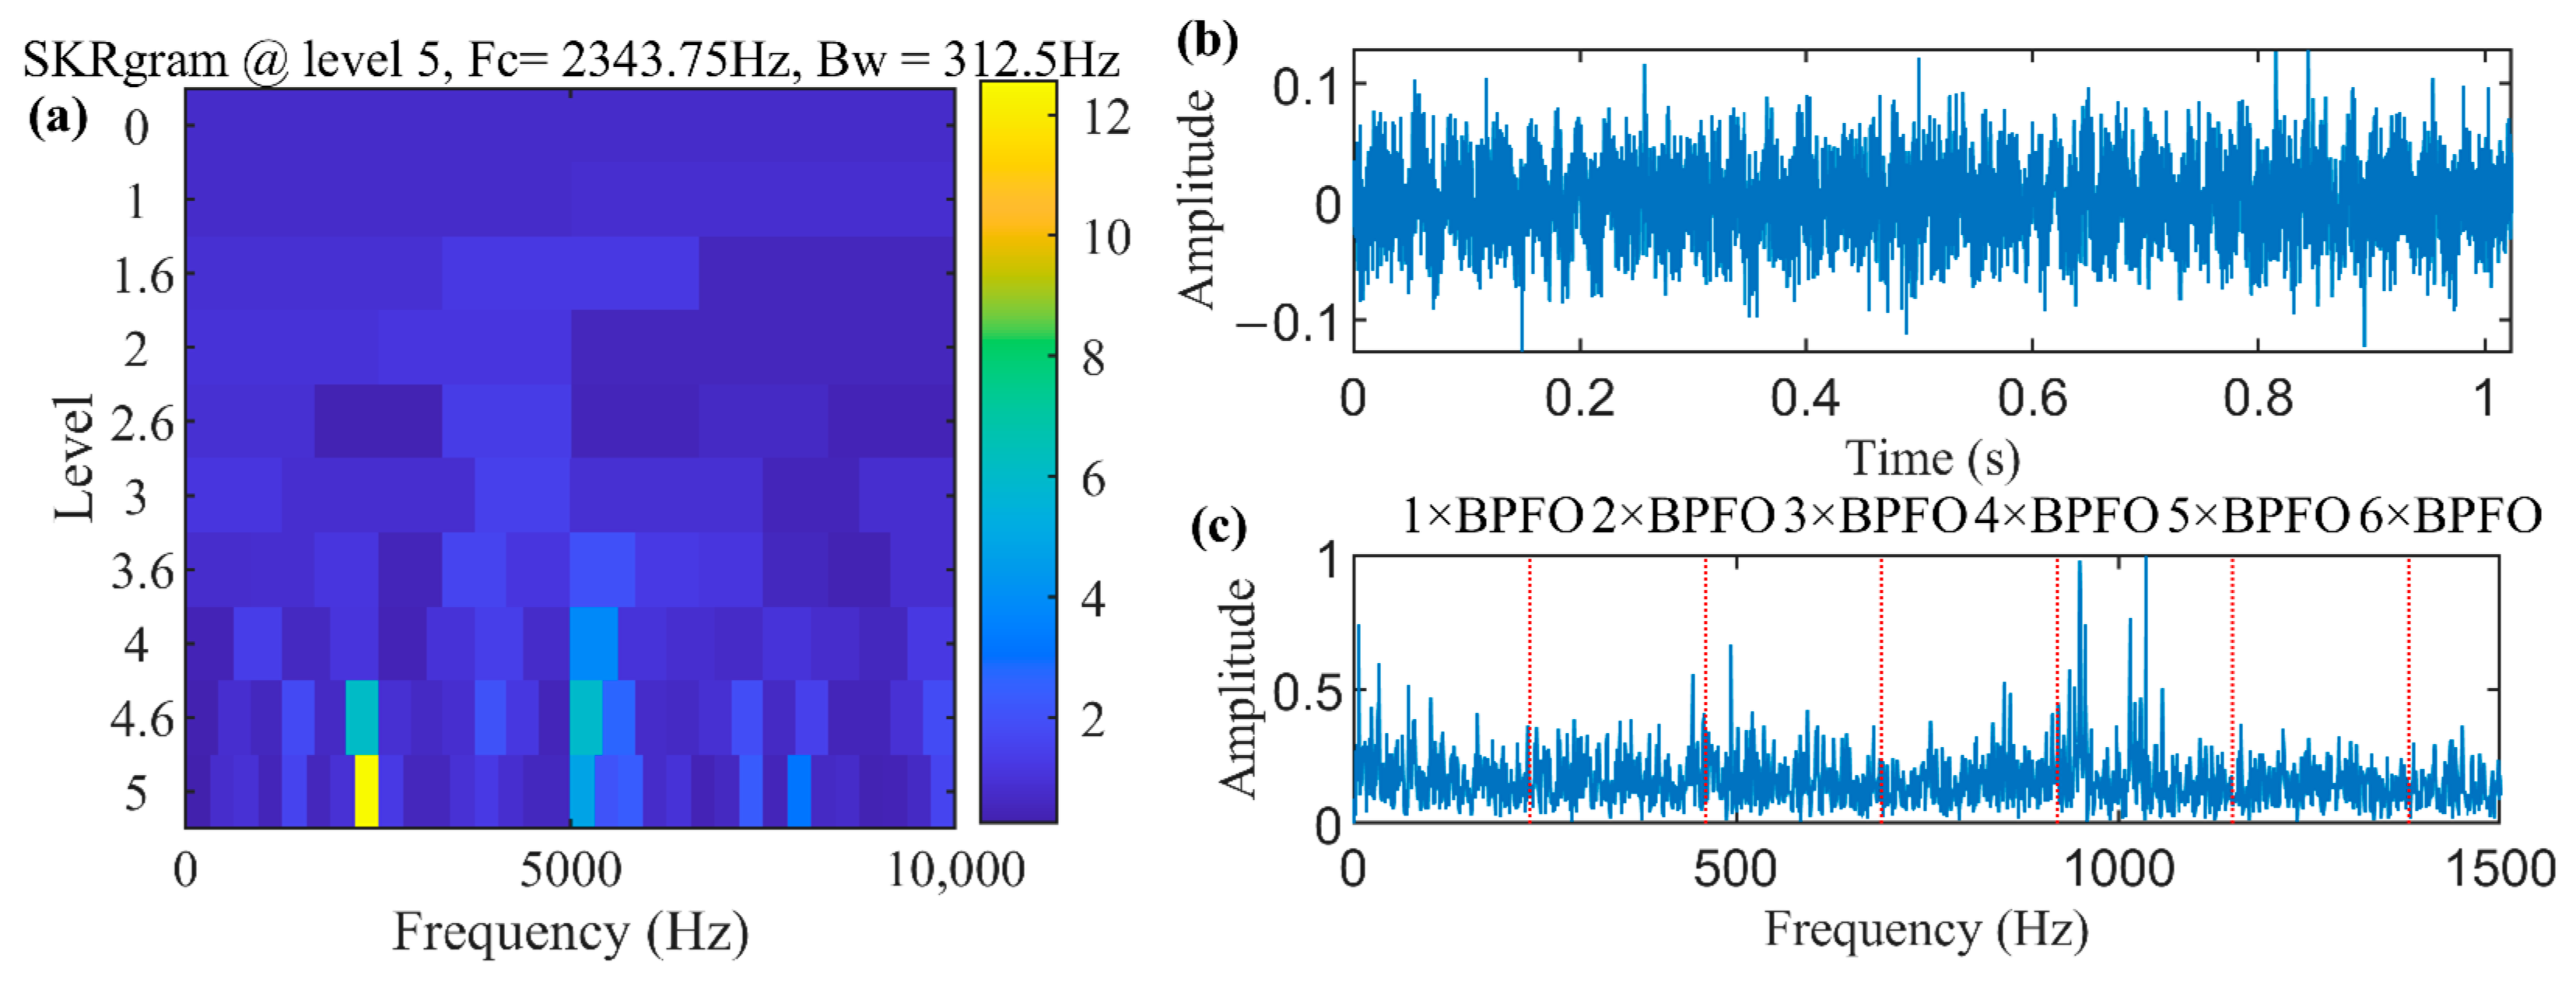
The spectral kurtosis (SK) of signal x(n) is developed based on the short-time Fourier transform of the signal [4]. The map formed with the STFT-based SK as a function of frequency f and STFT window length Nw is called a Kurtogram. To improve the computational efficiency of the Kurtogram, the Fast Kurtogram (FK) [6] introduces a 1/3-binary tree filter bank structure, where the whole frequency band can be effectively divided into ‘2, 3, 4, 6, 8, ..., 2k + 1’ equal parts, as shown in Figure 1. Let c k i n represent the complex envelope of the ith frequency band of the kth level of the signal x(n) and then the corresponding center frequency fi is
f i = i + 2 1 2 k 1 ,
The corresponding bandwidth equation is as follows:
Δ f k = 2 k 1 ,
The Kurtogram is finally estimated by computing the kurtosis of all sequences c k i n as follows:
K k i = c k i n 4 c k i n 2 2 2 ,
The frequency band with the largest kurtosis value is considered to be the optimal demodulation frequency band (ODFB) that contains the most fault information. A more detailed explanation of the Fast Kurtogram can be found in [6].
The Autogram was proposed by Moshrefzadeh [10]. As shown in Figure 2, the frequency bands are divided according to the binary tree structure using the maximal overlap discrete wavelet packet transform (MODWPT). The frequency band of the signal containing fault information is selected by calculating the kurtosis of the unbiased autocorrelation signal of the squared envelope of the demodulated signal. The unbiased autocorrelation is calculated based on the square envelope of the signal with the following equation:
R ^ X X τ = 1 N q i = 1 N q X t i X t i + τ ,
where X is the squared envelope of the signal, N is the total length of the original signal, q = 0, 1, …, N − 1.
In order to quantify the signal pulse in the frequency band, the Autogram method modifies the traditional kurtosis equation as shown in the following formula:
K X = i = 2 N 2 R ^ X X i min R ^ X X τ 4 i = 2 N 2 R ^ X X i min R ^ X X τ 2 2 ,

2.2. SKRgram

The SKRgram is a resonance demodulation algorithm proposed by Wang [16] to solve the problem that the resonance bands of planetary bearings are easily interfered by the resonance bands caused by meshing gears. The algorithm achieves feature extraction of faulty planetary bearings by capturing the difference between the Kurtograms of faulty and healthy planetary gearboxes.
The steps of the algorithm are as follows:
  • Obtain the SK matrix of the health planetary gearbox as a baseline by using FK, named SKbaseline.
  • Calculate the SK matrix of the measured signal using FK to obtain an SK matrix of the same size as the SKbaseline, labeled SKmeasured.
  • Divide each value in the SKmeasured matrix by the corresponding value of SKbaseline to obtain the spectral kurtosis ratio matrix SKR.
    S K R = S K m e a s u r e d / S K b a s e l i n e ,
  • Represent the SKR matrix as a Kurtogram. In the SKRgram, the concentrated area with higher SKR values is the part where the planet bearing failure is prominent.
  • Select the three most concentrated regions from the SKRgram, and then regard the corresponding regions in the Kurtogram of the measured signals as potential filtering regions.

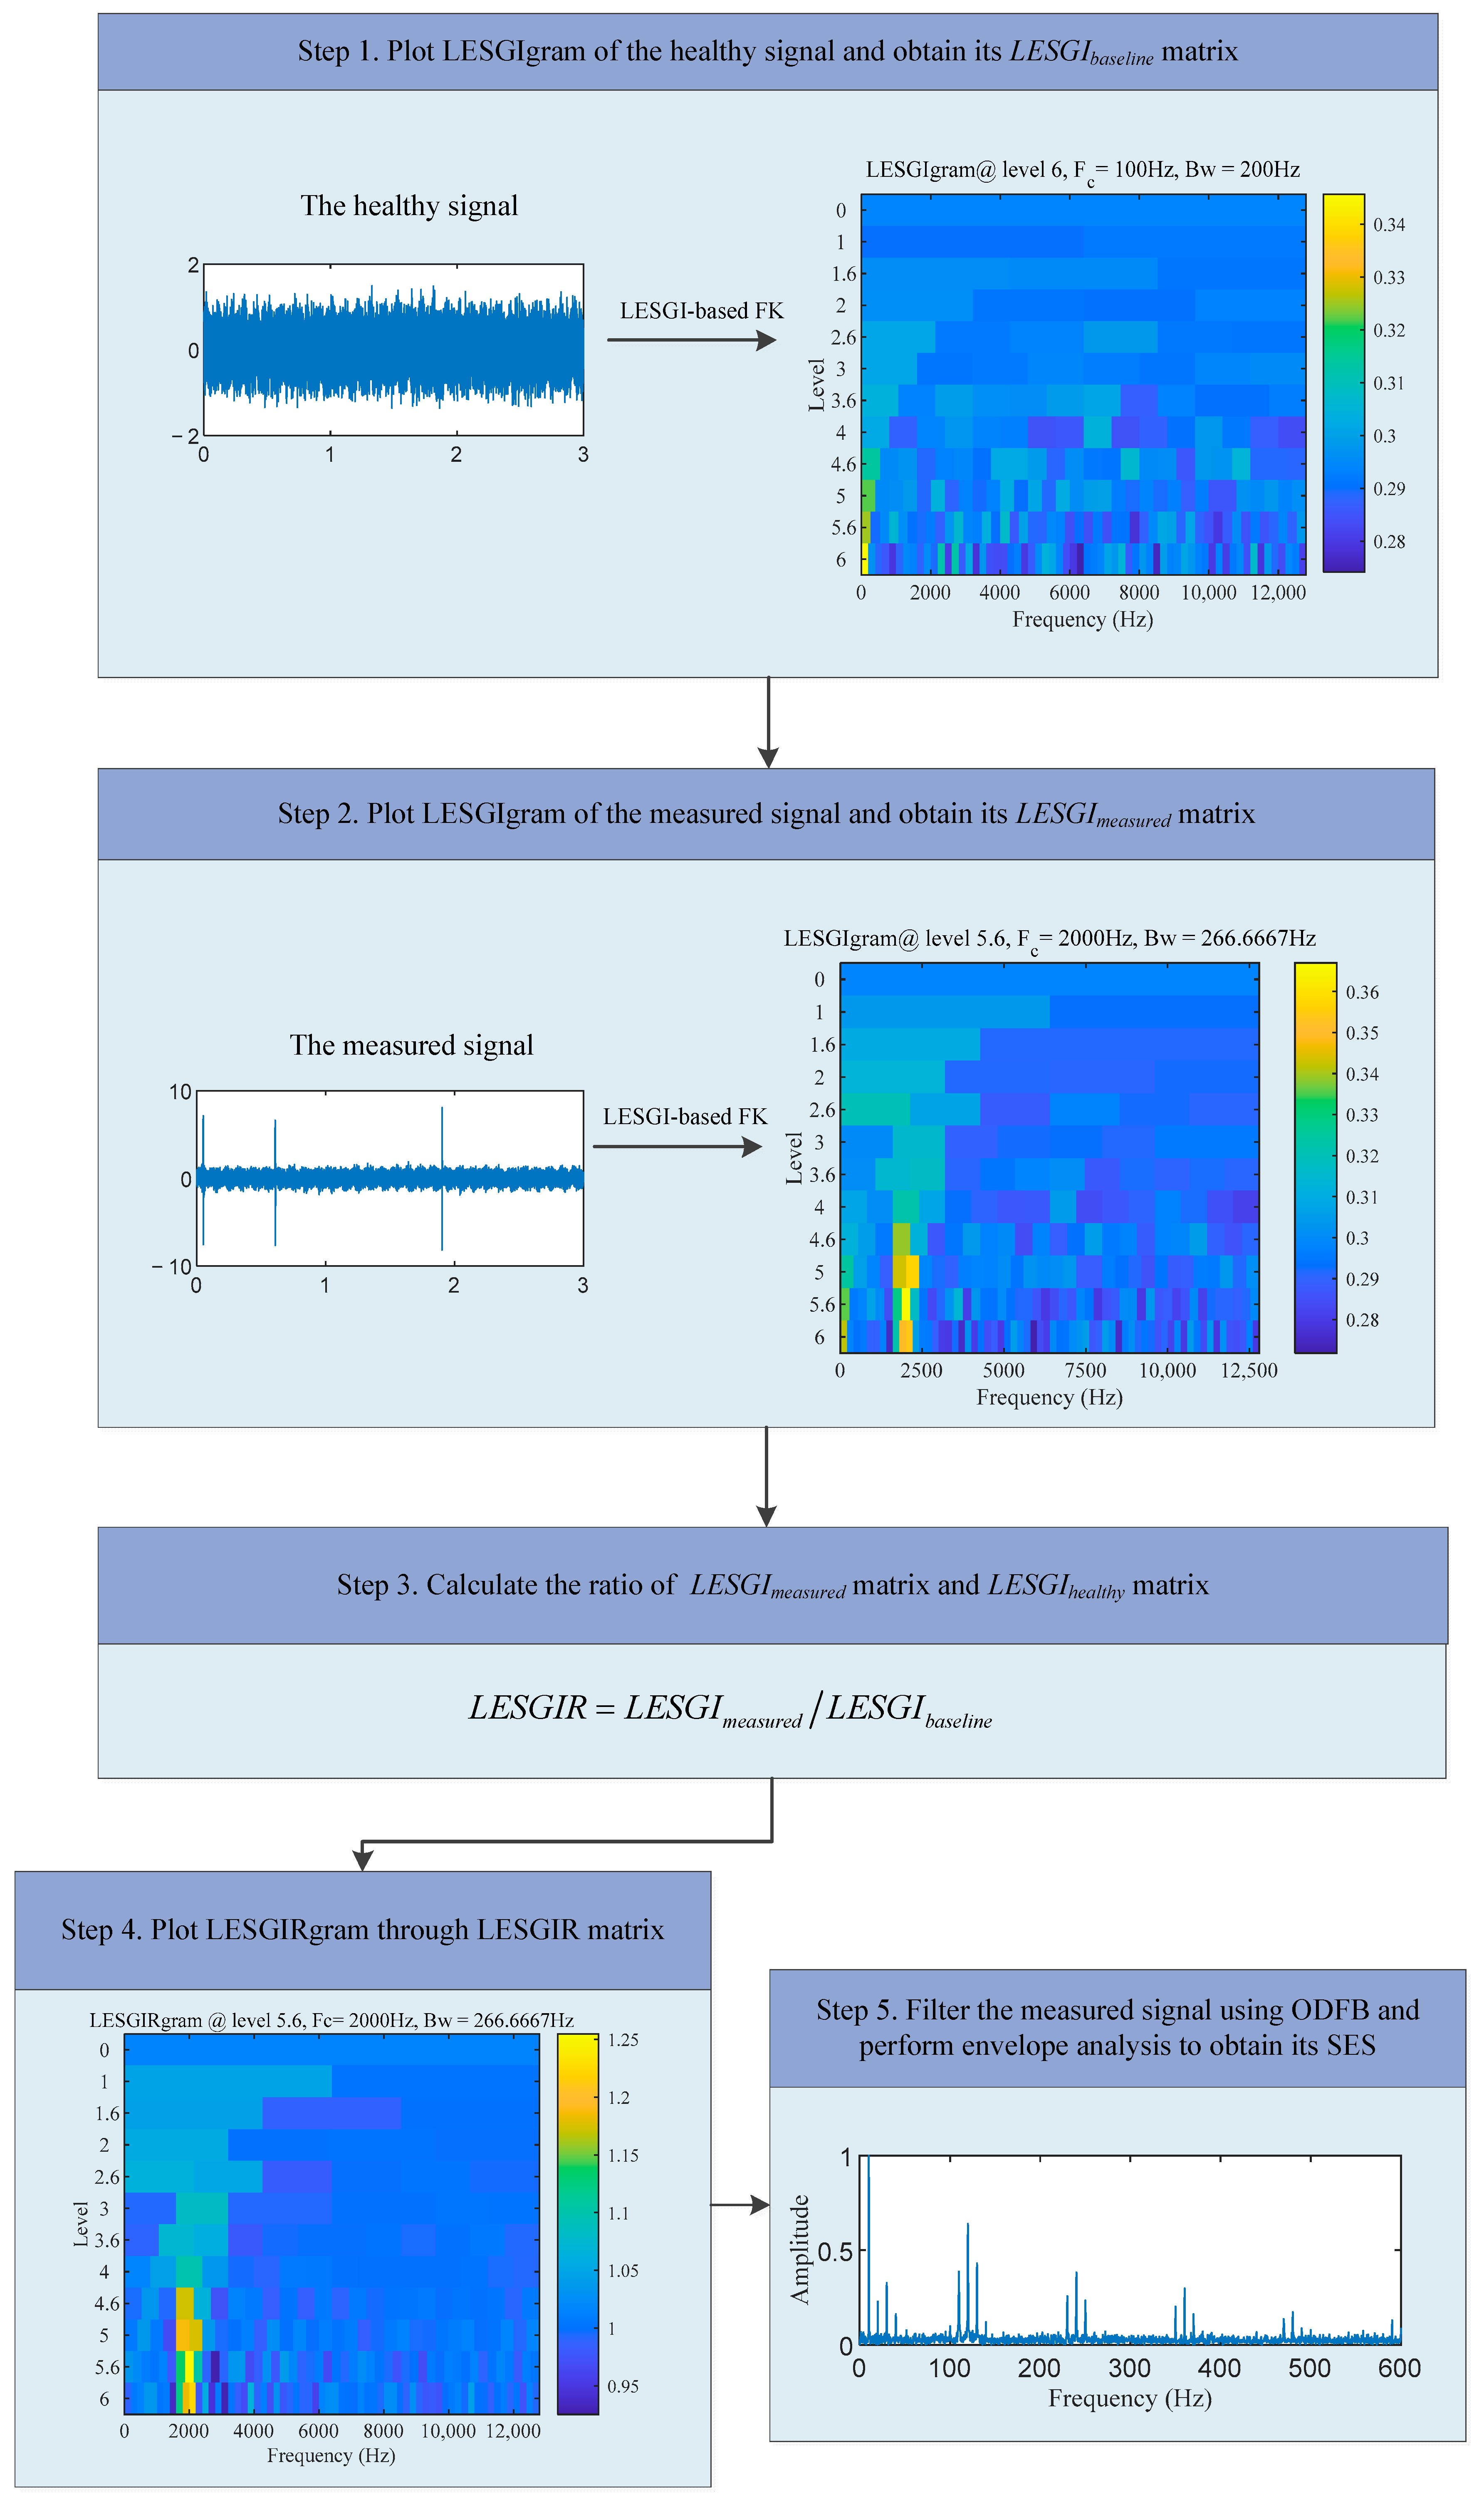
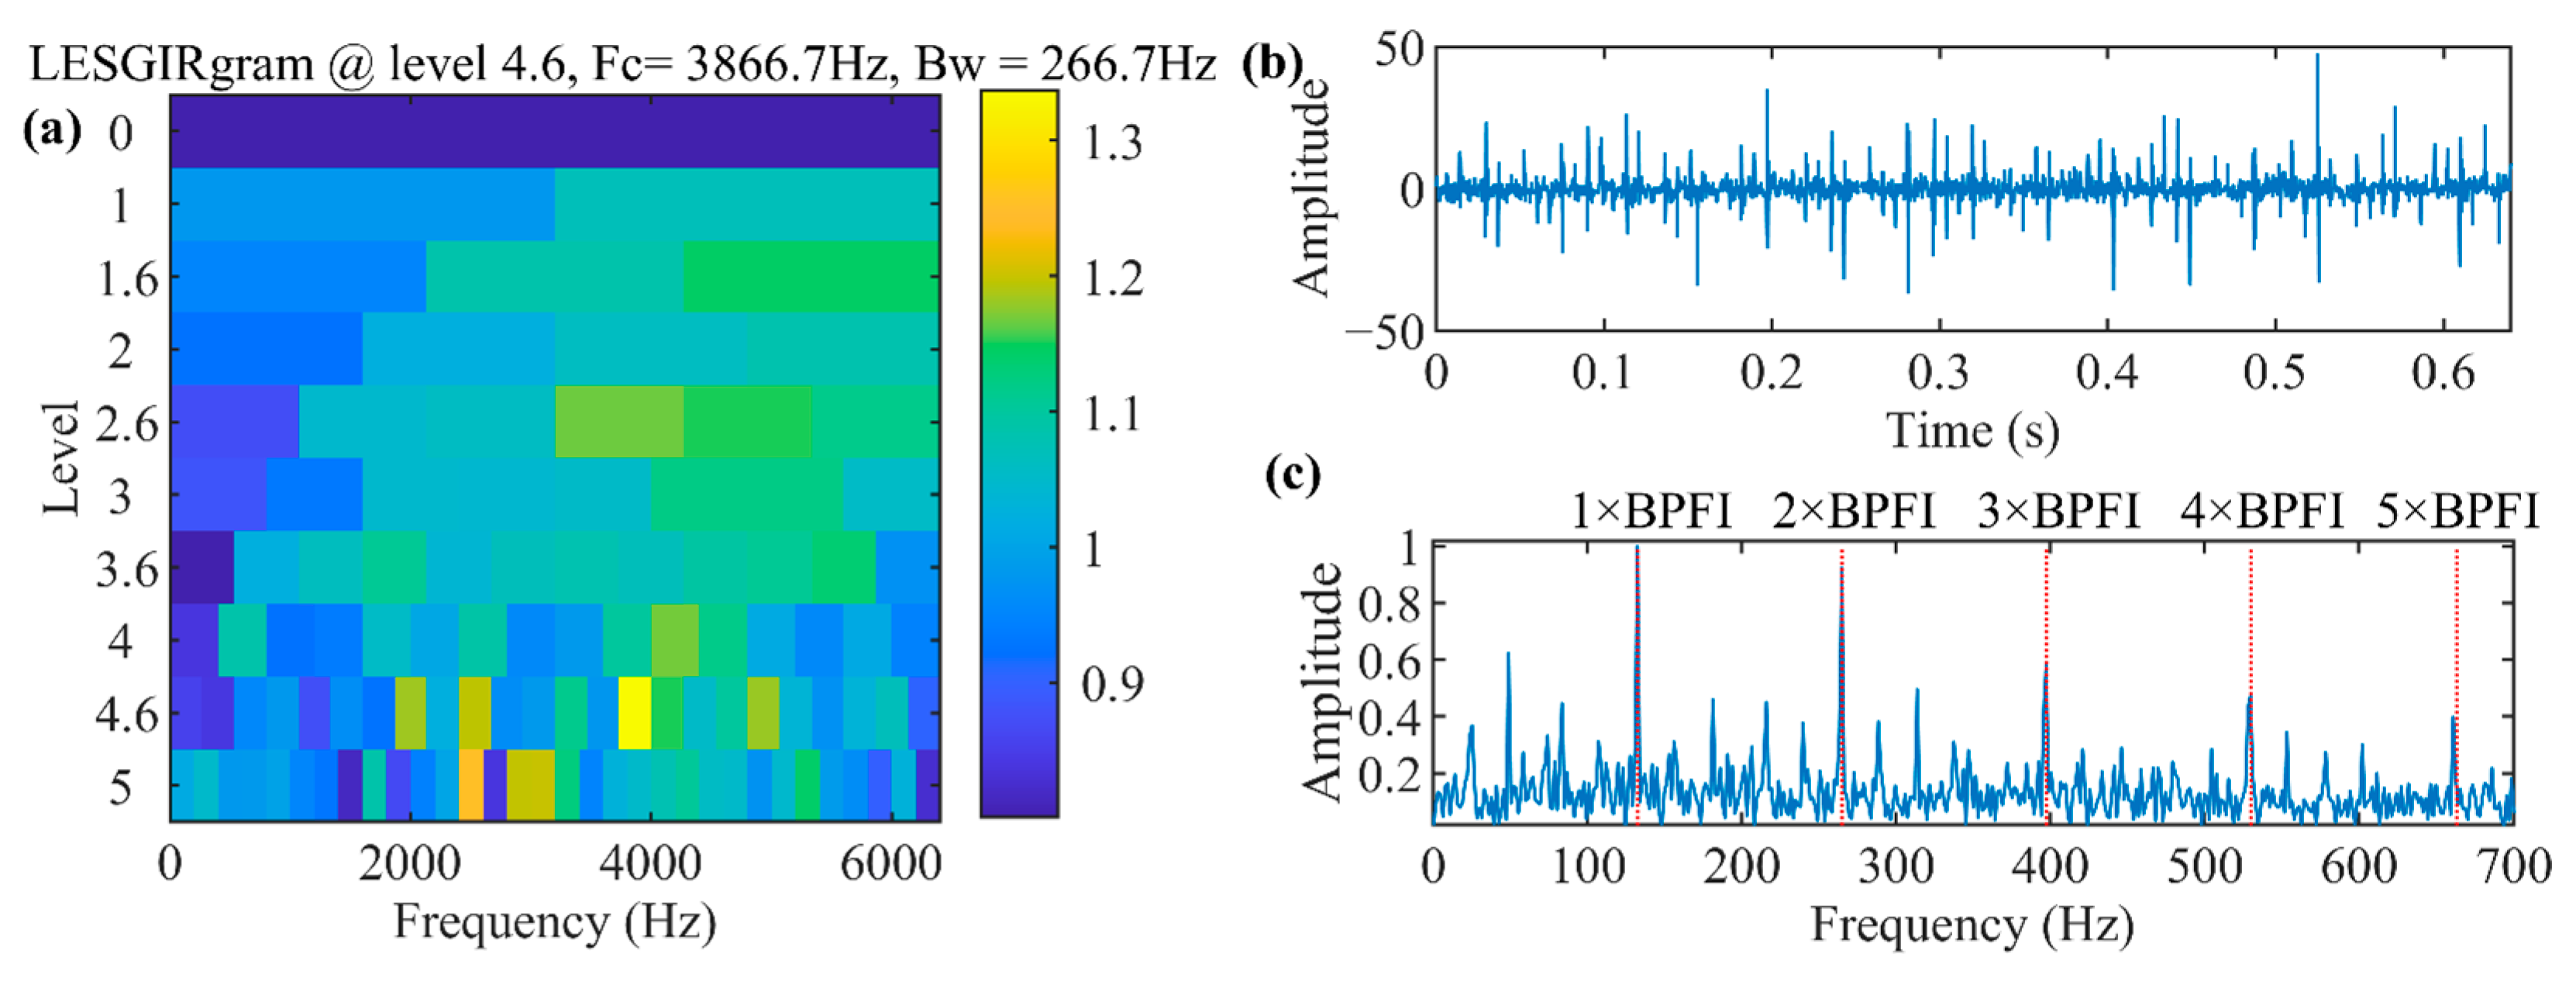
2.3. The Proposed Method: LESGIRgram

Harmonic disturbances and random pulse disturbances are often present in bearing fault signals, and fault characteristics may even be masked in strong noise. Inspired by the SKRgram, an improved SKRgram algorithm based on the Gini coefficients of the logarithmic envelope spectrum is proposed.
The squared envelope is obtained by taking the Hilbert transform of the signal x(t) and squaring it.
S E x t = x f t + j H i l b e r t x f t 2 ,
where xf means the bandpass filtered signal and j is the imaginary unit.
The squared absolute value of the squared Fourier transform of a square envelope signal is the square envelope spectrum, as follows:
S E S x t = D F T S E x t 2 ,
Then, the log-squared envelope spectrum can be defined as
L E S x t = log S E S x ( t ) ,
Through simulation experiments, Borghesani [18] demonstrated that the LES is almost unaffected in the presence of high amplitude random impulse noise, while the SES results are completely affected. As mentioned in [19], LES is robust to both strong non-fault characterized cyclic components and strong impulse components. The Gini coefficients satisfy the six sparsity criteria in [20], which shows that the Gini coefficients are superior to kurtosis in terms of sparsity measures. The effectiveness of the Gini coefficients for characterizing repetitive transients caused by bearing defects was experimentally demonstrated in [17]. In this paper, combine the advantages of the log-envelope spectrum and Gini coefficients and propose a new index, named Gini coefficients of the log-envelope spectrum (LESGI).
L E S G I = 1 2 n = 1 N L E S x t n L E S x t 1 N n + 1 2 N ,
where the vector L E S x t = L E S x t 1 L E S x t 2 L E S x t 3 is the ascending order of the LESx(t) and 1 means the l1 norm.
The basic idea of LESGI is to use Gini coefficients to quantize analytic bearing fault signals constructed with bandpass filtering, the Hilbert transform, and the logarithmic transform. LESGI is used as a selected criterion to improve the frequency bands in the LESGIgram, where the LESGIgram is a LESGI-based FK. The specific process of the LESGIRgram is described as follows:
Step 1. Obtain the LESGI matrix as the baseline through the LESGIgram of the health signal, labeled as LESGIbaseline.
Step 2. Obtain the LESGImeasured with the same dimensions as the LESGIbaseline with the LESGIgram of the measured signal.
Step 3. Divide each element in the LESGImeasured matrix by the corresponding element in the LESGIbaseline matrix to obtain the ratio matrix of the LESGImeasured matrix and the LESGIbaseline matrix, named LESGIR. The LESGIR effectively captures the LESGI difference between the LESGIgram of the faulty bearing and that of the healthy bearing.
L E S G I R = L E S G I m e a s u r e d / L E S G I b a s e l i n e ,
Step 4. Plane the LESGIR matrix as an FK. The frequency band corresponding to the maximum value in the LESGIR matrix is the optimal demodulation frequency band.
Step 5. Filter the measured signal using the ODFB and perform envelope analysis to obtain its squared envelope spectrum (SES).
The flowchart of the LESGIRgram is shown in Figure 3.

3. Simulation Evaluation

3.1. Simulation Model of Bearing Failure Data

The proposed method was validated by establishing a simulated bearing inner fault model, as described in [21].
x t = p t + n n G t + n G t ,
To simulate the repetitive impulse features induced by local defects on bearing components (referred to as part p(t)), an oscillating attenuation function is employed [22]. The bearing inner fault impulse component can be mathematically represented as follows:
p t = i = 1 M 1 1 cos 2 π f r t / 2 e 2 π ξ 1 f n 1 t i / f m δ i sin 2 π 1 ξ 1 2 f n 1 t i / f m δ i ,
where M1 denotes the total number of impulses occurring within the sampling length with a repetition frequency of fm. The parameters fr, fn1 and ξ1 are the shaft rotation frequency, resonance frequency, and damping ratio of bearing fault impulses, respectively. Additionally, δi represents the tiny fluctuation in the occurrence time of the ith fault impulse due to roller sliding and is generated from a uniform distribution U(1/fm, 2/fm)/100.
The second part, nnG(t), indicates the non-Gaussian interference noise, such as the harmonic interference associated with the rotation frequency of rotating machinery and the meshing frequency of gears, as well as random pulse noise caused by external shocks.
The equation of harmonic interference h(t) is as follows:
h t =   j = 1 M 2 B j sin 2 π f j t + φ j ,
where M2 denotes the total number of interference harmonics; parameters Bj, fj and φj mean the amplitude, frequency, and initial phase of the jth harmonic interference, respectively.
The random impulses induced by the external impacts are also simulated using the oscillating attenuation function, which is described as follows:
r t = k = 1 M 3 C k e 2 π ξ 2 f n 2 t τ k sin 2 π 1 ξ 2 2 f n 2 t τ k ,
where M3 represents the number of interference impulses. The magnitude Ck and excitation time of the kth random impulse τk are determined with a normal distribution N(8, 1) and a uniform distribution U(0, 3), respectively; parameters fn2 and ξ2 denote the resonance frequency and damping ratio of random impulses.
The third part, denoted as nG(t), represents the Gaussian white noise caused by the operating environment.
The sampling frequency and duration are assumed to be 25.6 kHz and 3 s, respectively [22].
It should be noted that the actual engineering fault bearing signals are more complex and contain more other interference components. In this paper, the simulation of the simulated signals only considers the interference of random impulses, harmonic noise, and Gaussian white noise.

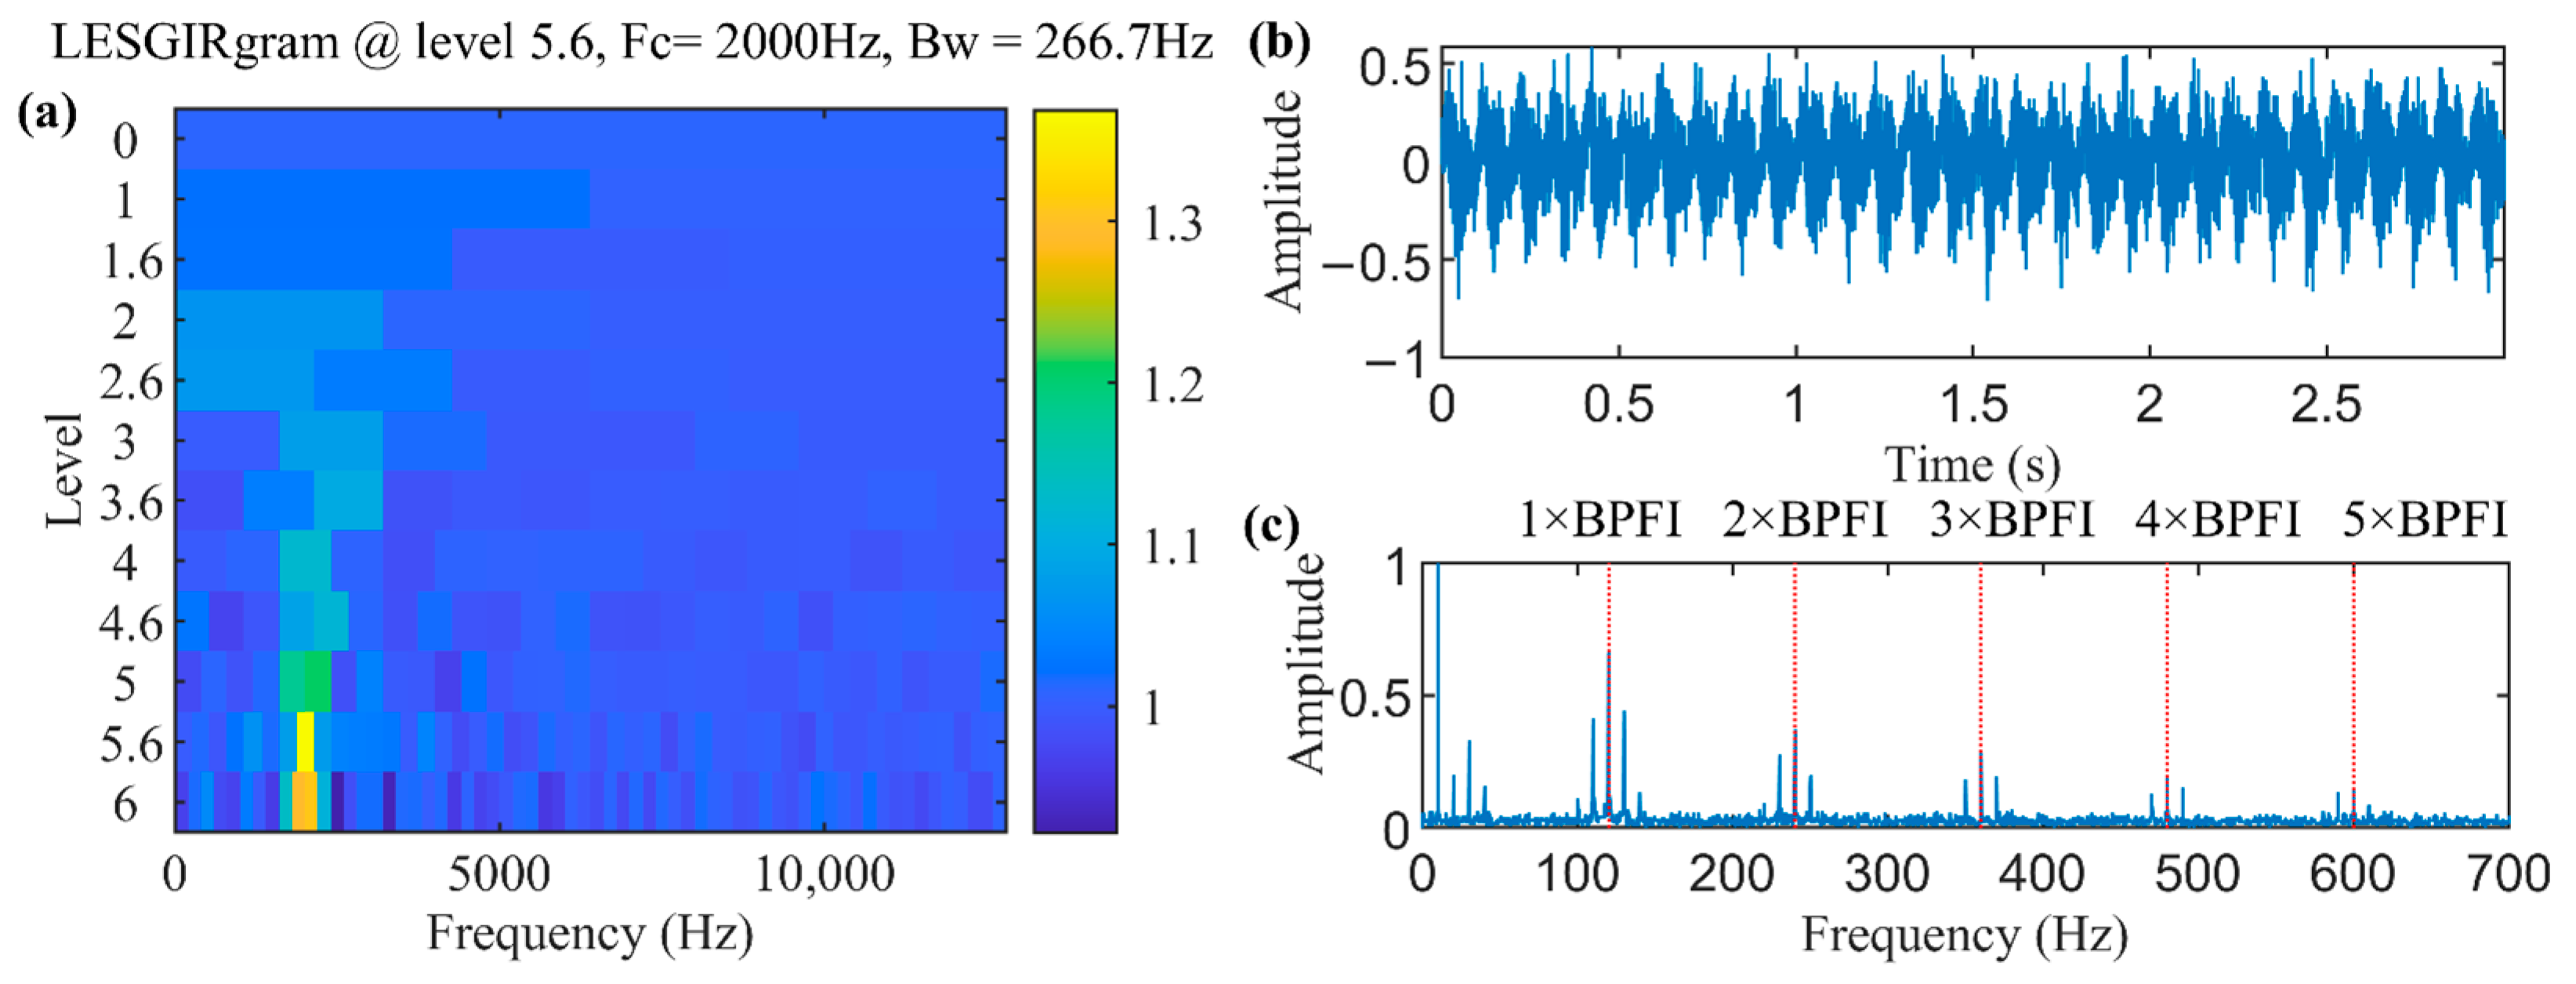
3.2. Results on Simulated Bearing Inner Fault Signal

In this section, the effectiveness of the method proposed in this paper is verified by simulating the bearing inner ring fault signal. Table 1 provides all the parameters in the model. Figure 4a–d show the simulated bearing signal components. As shown in Figure 4e, the repetitive impulse features are drowned in noise interference. Figure 4f shows the frequency domain plot of the mixed signal.
After applying the FK, Autogram, SKRgram, and LESGIRgram methods, the optimal demodulation band is selected. It should be noted that in the comparison with the SKRgram, similarly to the FK, only the frequency bands corresponding to the largest SKR values are selected. These demodulation bands are then used to provide detailed diagnostic results using the square envelope spectrum, with the findings presented in Figure 5, Figure 6, Figure 7 and Figure 8. The demodulation bands selected with the FK, Autogram, SKRgram, and LESGIRgram are (4800 Hz, 5200 Hz), (3200 Hz, 4800 Hz), (6400 Hz, 9600 Hz), and (1866.67 Hz, 2133.33 Hz), respectively. Only the demodulation band suggested with the LESGIRgram contains the resonance frequency of the periodically repeated pulse (fn1 = 2000 Hz). Due to its criterion of kurtosis for band selection, the FK selects the resonant frequency of random pulses (fn2 = 5000 Hz) as it is more sensitive to individual pulses. Consequently, as depicted in Figure 5b, the filtered time domain waveform still prominently exhibits random pulses, while in Figure 5c, the identification of BPFI and its harmonics is unattainable. Similarly, due to the fact that the Autogram selects the frequency band where random pulses are present, the desired outcomes were not achieved in Figure 6b,c. The SKRgram, not having selected the frequency band of periodic pulses, also yielded less favorable results in Figure 7b,c. In contrast, the LESGIRgram, by simultaneously considering pulse-like and periodic characteristics, selects the frequency band where periodic pulse signals are present. As depicted in Figure 8b, the filtered signal prominently exhibits periodic pulses with no interference from random pulses. In the envelope spectrum shown in Figure 8c, BPFI, 2 × BPFI, 3 × BPFI, 4 × BPFI, and 5 × BPFI are identifiable. Based on the above findings, it can be concluded that the LESGIRgram method, along with the corresponding demodulation band, provides better fault diagnosis capabilities, especially when dealing with interference.

3.3. Results on Simulated Bearing Inner Fault Signals under Various Conditions

To assess the efficacy of the proposed method, a comprehensive evaluation was conducted, comparing the performance of the FK, Autogram, SKRgram, and the proposed method under various conditions, including the influence of Gaussian white noise intensity, amplitude of harmonic interference, amplitude of random impulse, and the number of random impulses.

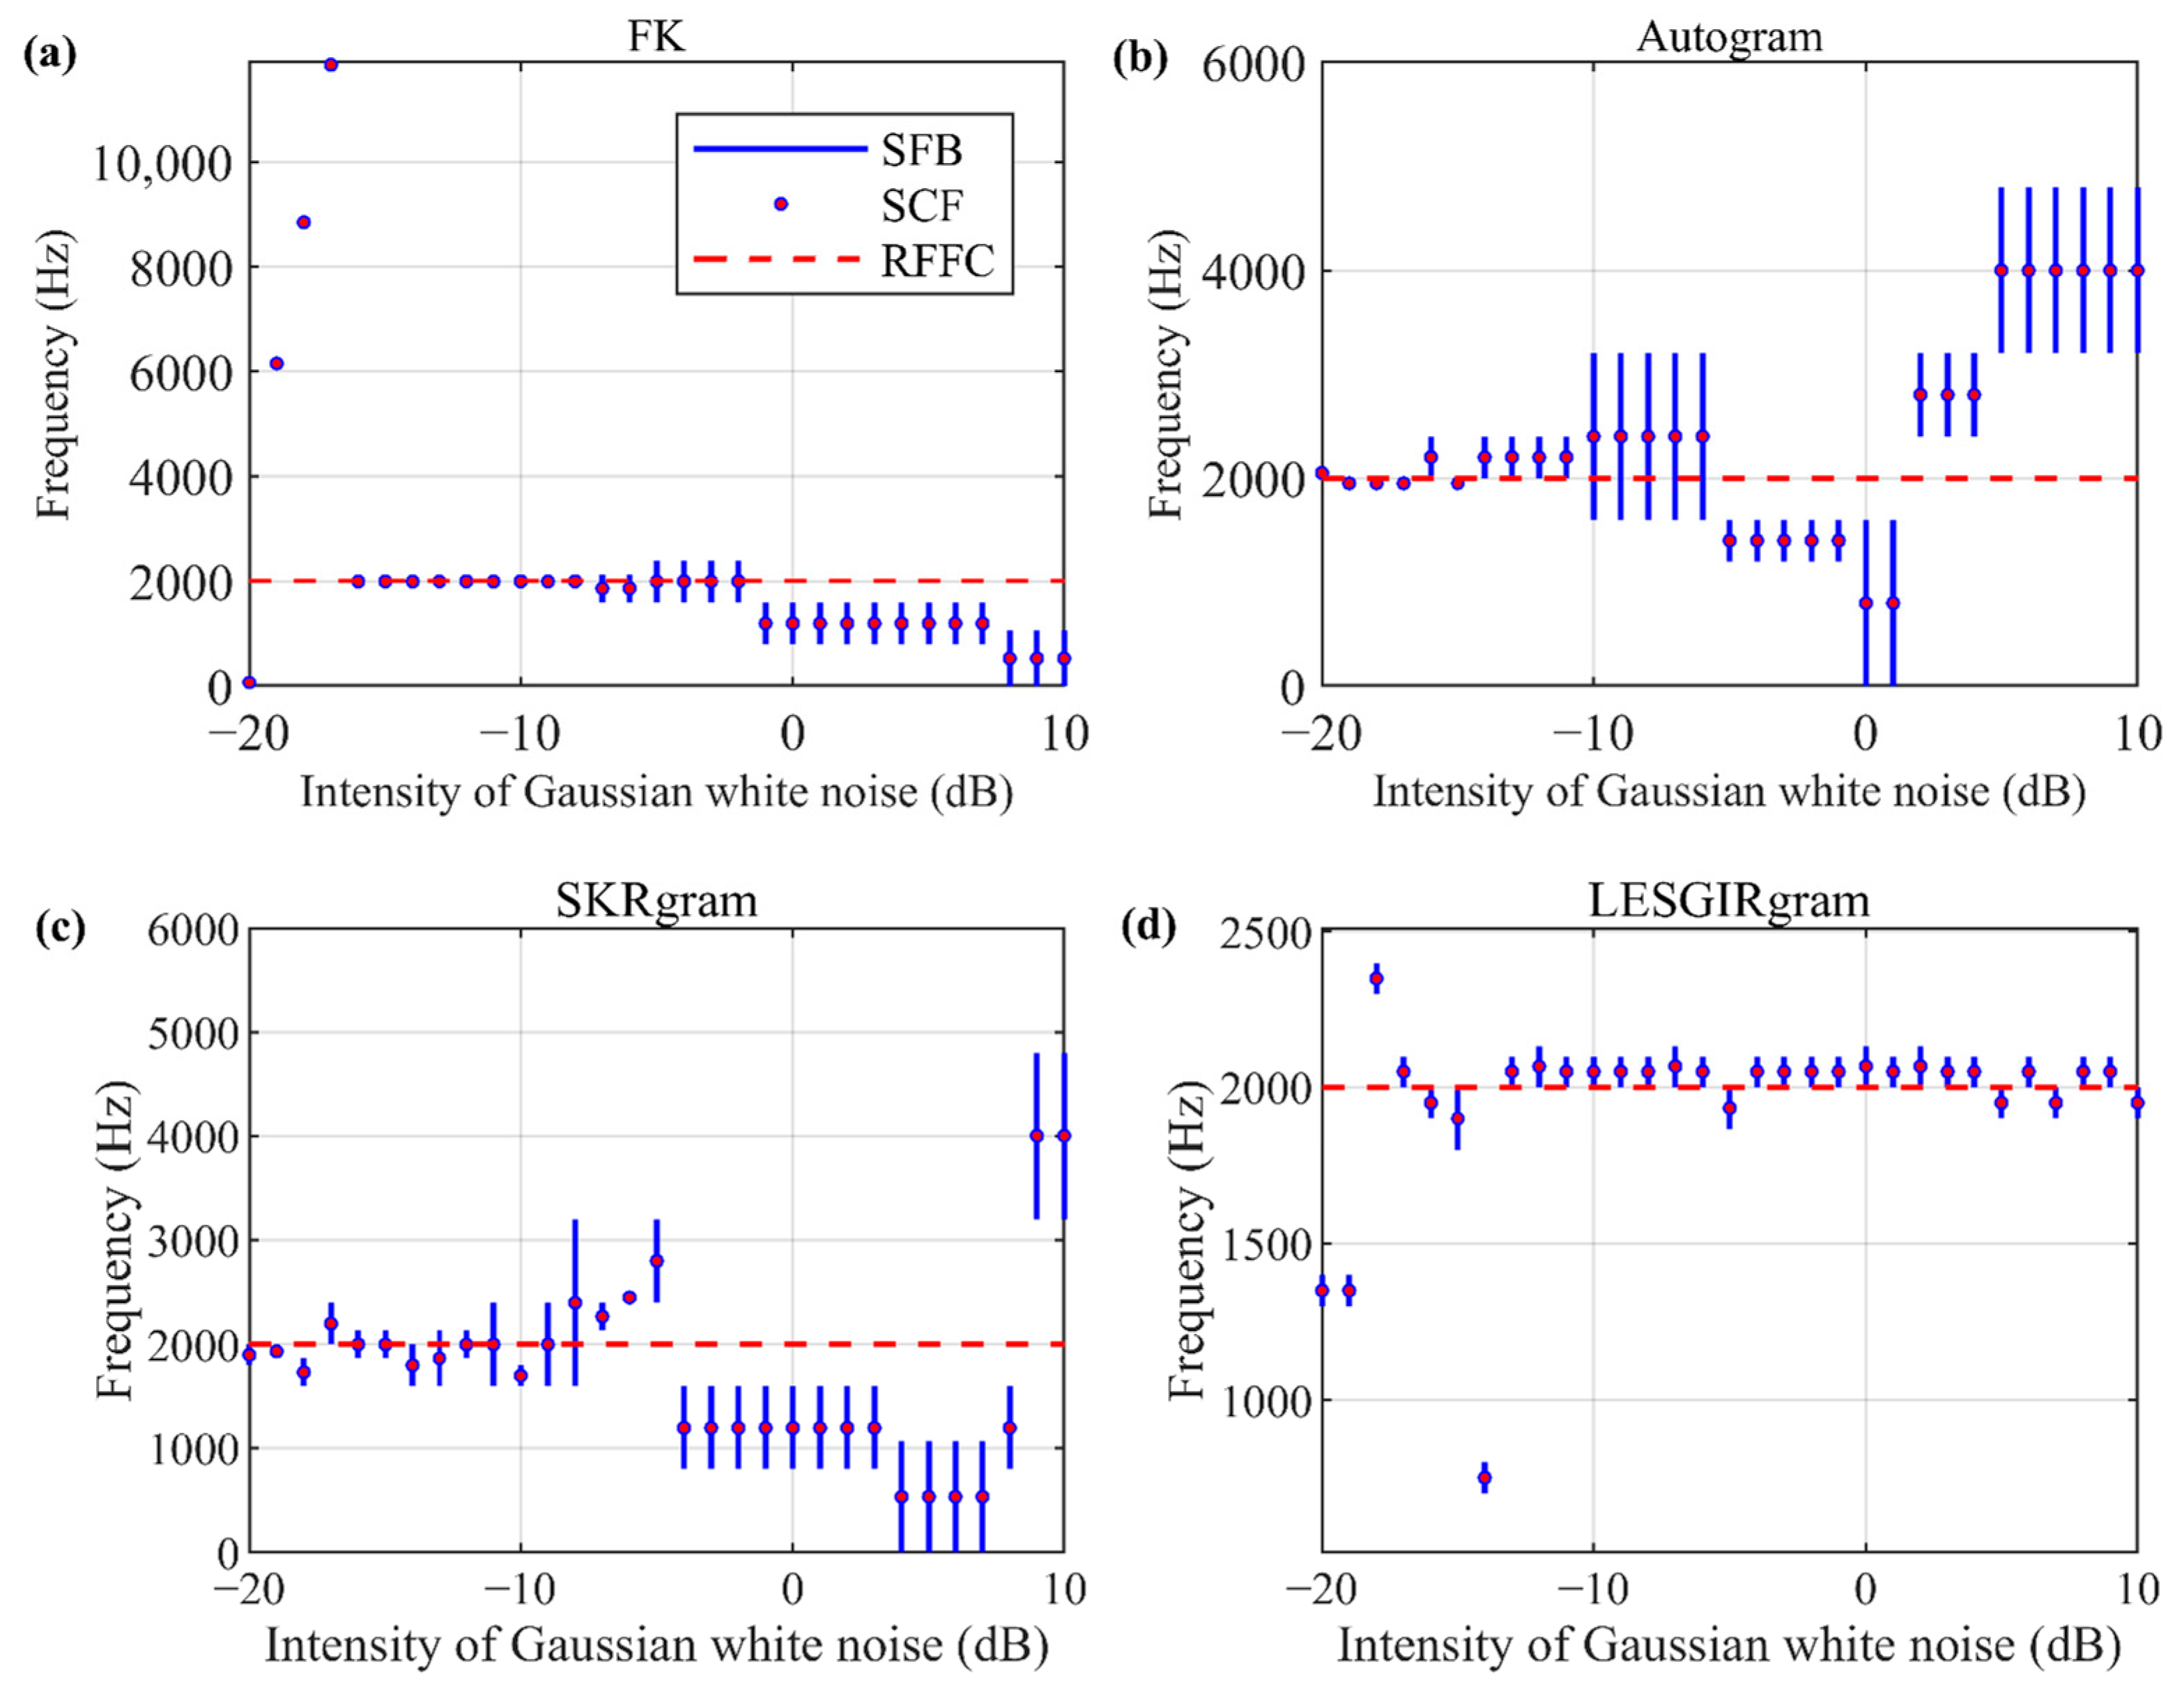
3.3.1. Results on Bearing Inner Fault Signals with Different GAUSSIAN White Noise Levels

The effect of Gaussian white noise intensity on the optimal band selection was discussed. In this case, the bearing inner fault impulse component was only contaminated by Gaussian white noise. The ODFBs selected using the FK, Autogram, SKRgram, and LESGIRgram applied to each bearing fault simulation signal at different Gaussian white noise levels are shown in Figure 9, respectively. As shown in Figure 9, the level of Gaussian white noise is adjusted in 1 dB increments, ranging from −20 dB to 10 dB. In the range of −16 dB to −2 dB SNR, the ODFB selected with the FK method encompasses the resonant frequencies associated with failure, while the bands selected with other noise intensity levels do not include the Resonant Failure Frequency Components (RFFCs). At SNR levels below −6 dB, the Autogram method successfully captures the RFFCs within the chosen bands. However, when the SNR exceeds or equals −6 dB, accurate differentiation of the ODFBs of the simulated bearing failure components becomes challenging. The SKRgram method selects a frequency band containing RFFCs when SNR = −8, −9, −11, −12, −13, −14, −16, −17, −19, and −20 dB, whereas for noise intensities exceeding −7 dB, the selected frequency band is far from the resonant frequency of the simulated bearing failure component. The ODFBs selected with the LESGIRgram contain RFFCs for all Gaussian white noise levels except SNR = −14, −18, −19, −20 dB. The findings demonstrate the superior performance of the proposed method compared to the other three algorithms in terms of accurate frequency band selection under the influence of Gaussian white noise interference. (It should be noted that, as can be seen from Figure 9, when SNR = −9 dB, all four methods can select the desired frequency band. In order to harmonize the variables, the SNR is set to −9 dB in the last three simulations.)

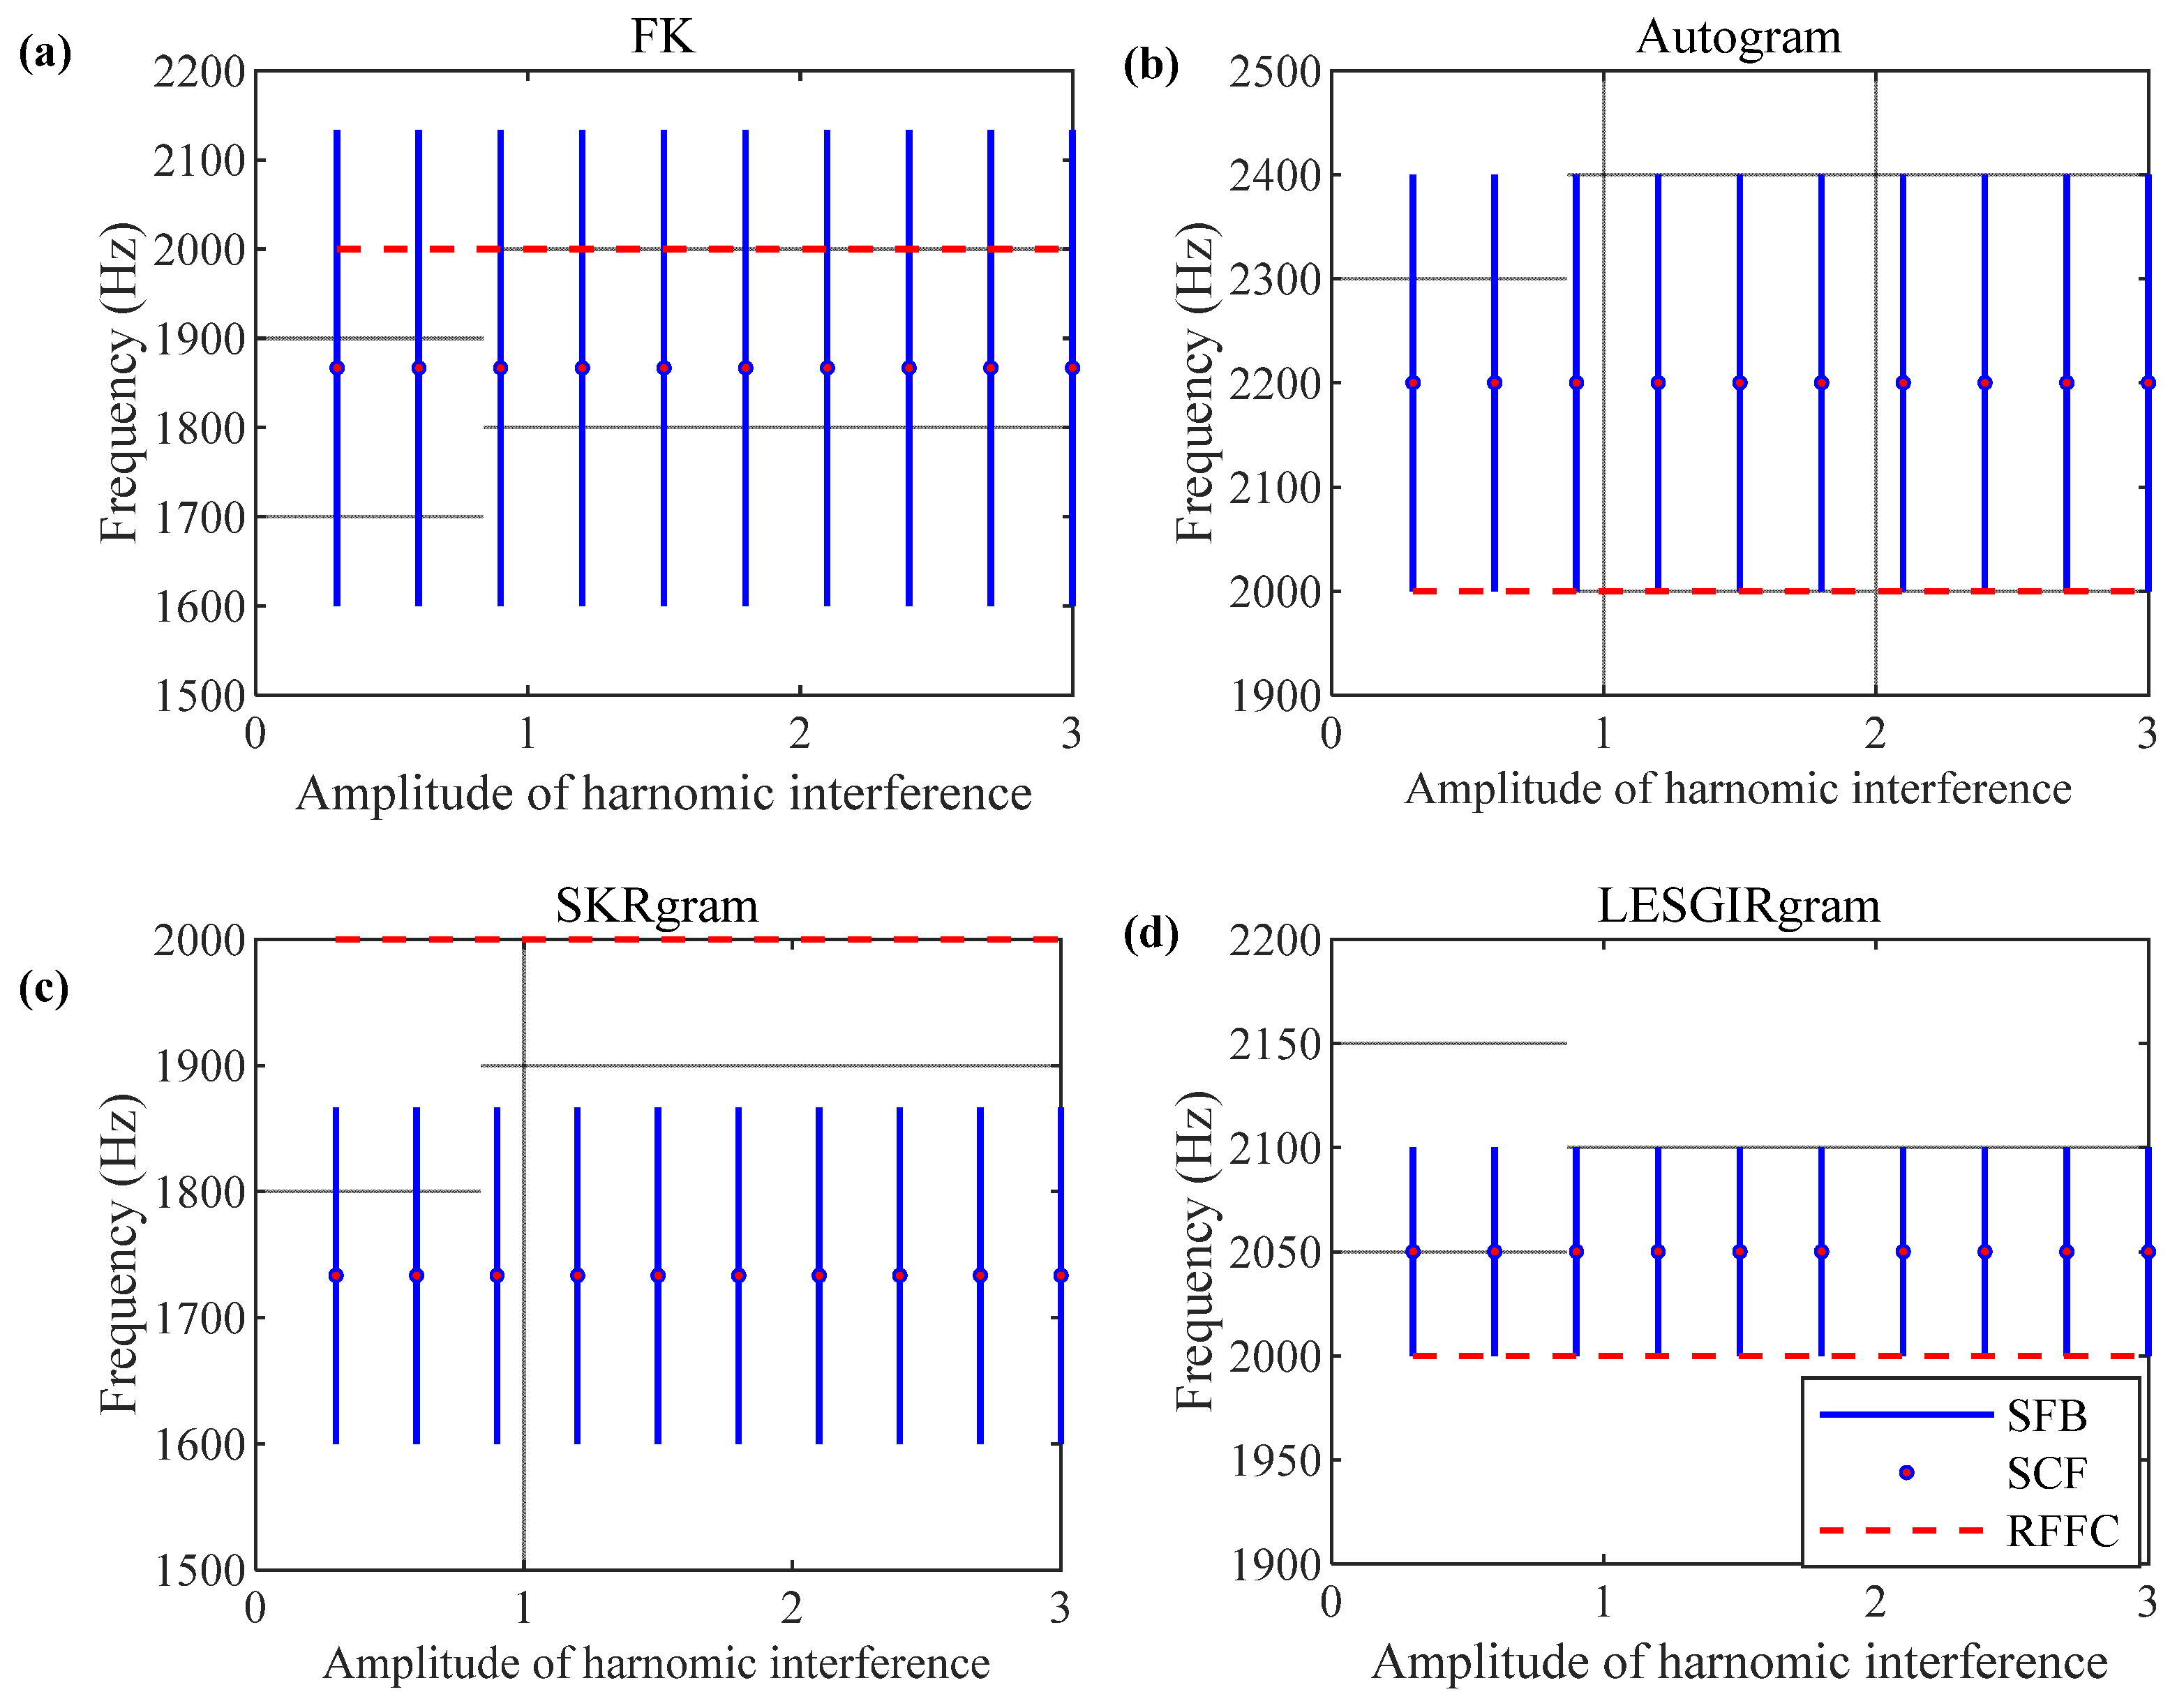
3.3.2. Results on Bearing Inner Fault Signals with Different Amplitude of Harmonic Interference

The aim of this section is to explore the performance of the proposed LESGIRgram with interference from harmonic interference components. In this case, the bearing inner fault impulse component was contaminated by harmonic interference and Gaussian white noise, with an SNR of −9 dB. The frequency bands selected using the FK, Autogram, SKRgram, and LESGIRgram and applied to each bearing fault simulation signal at different amplitude of harmonic interference are shown in Figure 10, respectively. As depicted in Figure 10, the amplitude of harmonic interference is adjusted from 0.3 to 3 in increments of 0.3. Through a comparison of the frequency bands selected with the four methods, it can be seen that the SKRgram fails to select the correct frequency band in the presence of strong harmonic interference, while the FK, Autogram, and LESGIRgram are not affected by harmonic interference. In summary, the results demonstrate that while the SKRgram struggles to overcome strong harmonic interference, the FK, Autogram, and LESGIRgram exhibit robustness and can effectively select the appropriate frequency band.

3.3.3. Results on Bearing Inner Fault Signals with Different Amplitude of Random Impulse

In this section, the white Gaussian noise has an SNR of −9 dB, the number of random impulses is 1, and the amplitude of random impulsive was adjusted from 1 to 10 in increments of 1. Figure 11 displays the ODFB results of the FK, Autogram, SKRgram, and LESGIRgram, respectively. The FK screens to the desired frequency band only when the random pulse amplitude is 1, i.e., when the random pulse amplitude is equal to the periodic pulse amplitude. When the random pulse amplitude is greater than 1, the FK fails to select to the desired frequency band. Irrespective of the amplitude of the random pulse, the Autogram and SKRgram fail to select the correct frequency band. While the LESGIRgram selects bands that encompass the resonant frequency of the fault component (RFFC).

3.3.4. Results on Bearing Inner Fault Signals with Different Number of Random Impulses

In this section, the white Gaussian noise has an SNR of −9 dB, the amplitude of random impulsive is 8, and the number of random impulses was adjusted from 1 to 10 in increments of 1. As can be seen in Figure 12, the FK, Autogram and SKRgram are all susceptible to high random pulses. Only the LESGIRgram selects the frequency band containing RFFCs regardless of the number and amplitude of random pulses.

3.4. Summary of Comparison Results on Simulated Signals

(1) Based on the comparison conducted in Section 3.3, it becomes evident that the LESGIRgram exhibits superior robustness compared to the FK, Autogram, and SKRgram in the presence of all three common noise disturbances.
(2) When considering the LESGIRgram, it is observed that Gaussian white noise is the primary factor that tends to hinder its ability to accurately select the frequency band containing RFFCs.

4. Experimental Evaluation

4.1. Rolling Bearing Inner Race Defect Detection of QPZZ Test Bench Bearing Dataset

In this section, the vibration data of rolling bearings performed on the QPZZ test bench [23] are tested and analyzed to verify the effectiveness of the proposed method. To provide an overview of the test bench’s structure, Figure 13 illustrates its components. Notably, the motor serves as the power source, driving the shaft’s rotation via a belt drive mechanism. In our experimental setup, the faulty bearing is positioned at the extreme right end of the shaft, as depicted in Figure 13. In the axial and radial position of the bearing housing at the faulty end, vibration acceleration sensors are adhered to collect bearing fault signals. The inner race defect, outer race defect, and rolling element defect were simulated separately. In order to reduce the error, the fault dimensions were measured several times. Furthermore, the fault signals were collected three times for each type of fault. In this paper, the inner race fault signal was selected for analysis. Table 2 provides detailed information on the experimental bearing’s parameters, along with the bearing pass frequency of the inner race (BPFI). Signal measurements were sampled at 12,800 Hz, with data collected for both healthy and inner ring fault signals while operating at a rotational speed of 1470 rpm.
Figure 14a,b show the time domain and frequency domain plots of the healthy signal, and Figure 14c,d show the time domain and frequency domain plots of the faulty signal, respectively. As can be seen in Figure 14c, the time domain plot contains distinct random pulses. Figure 15, Figure 16, Figure 17 and Figure 18 show the results of processing the same bearing vibration signature using the FK, Autogram, SKRgram, and LESGIRgram, respectively. Figure 15 shows the processing results of the FK algorithm. A clear random pulse can be seen in Figure 15b, and the BPFI and its harmonics can be recognized from the envelope spectrum shown in Figure 15c. Similar to the results of the FK, there are obvious random pulses in the time domain plot of the filtered signal of the Autogram. The BPFI and its harmonics can be recognized in its envelope spectrum, but the fault characteristics are not as obvious as those of the FK. Although there is no obvious random pulse in the time domain graph of the filtered signal of the SKRgram, only 2 × BPFI and 4 × BPFI can be recognized in its envelope spectrum, and 1 × BPFI, 3 × BPFI and 5 × BPFI cannot be recognized. As shown in Figure 18, there is no obvious random pulse in the time domain graph of the filtered signal of the LESGIRgram, and BPFI and its harmonics can be clearly recognized in the envelope spectrum obtained. The results of this dataset show that the LESGIRgram is robust to random pulses.

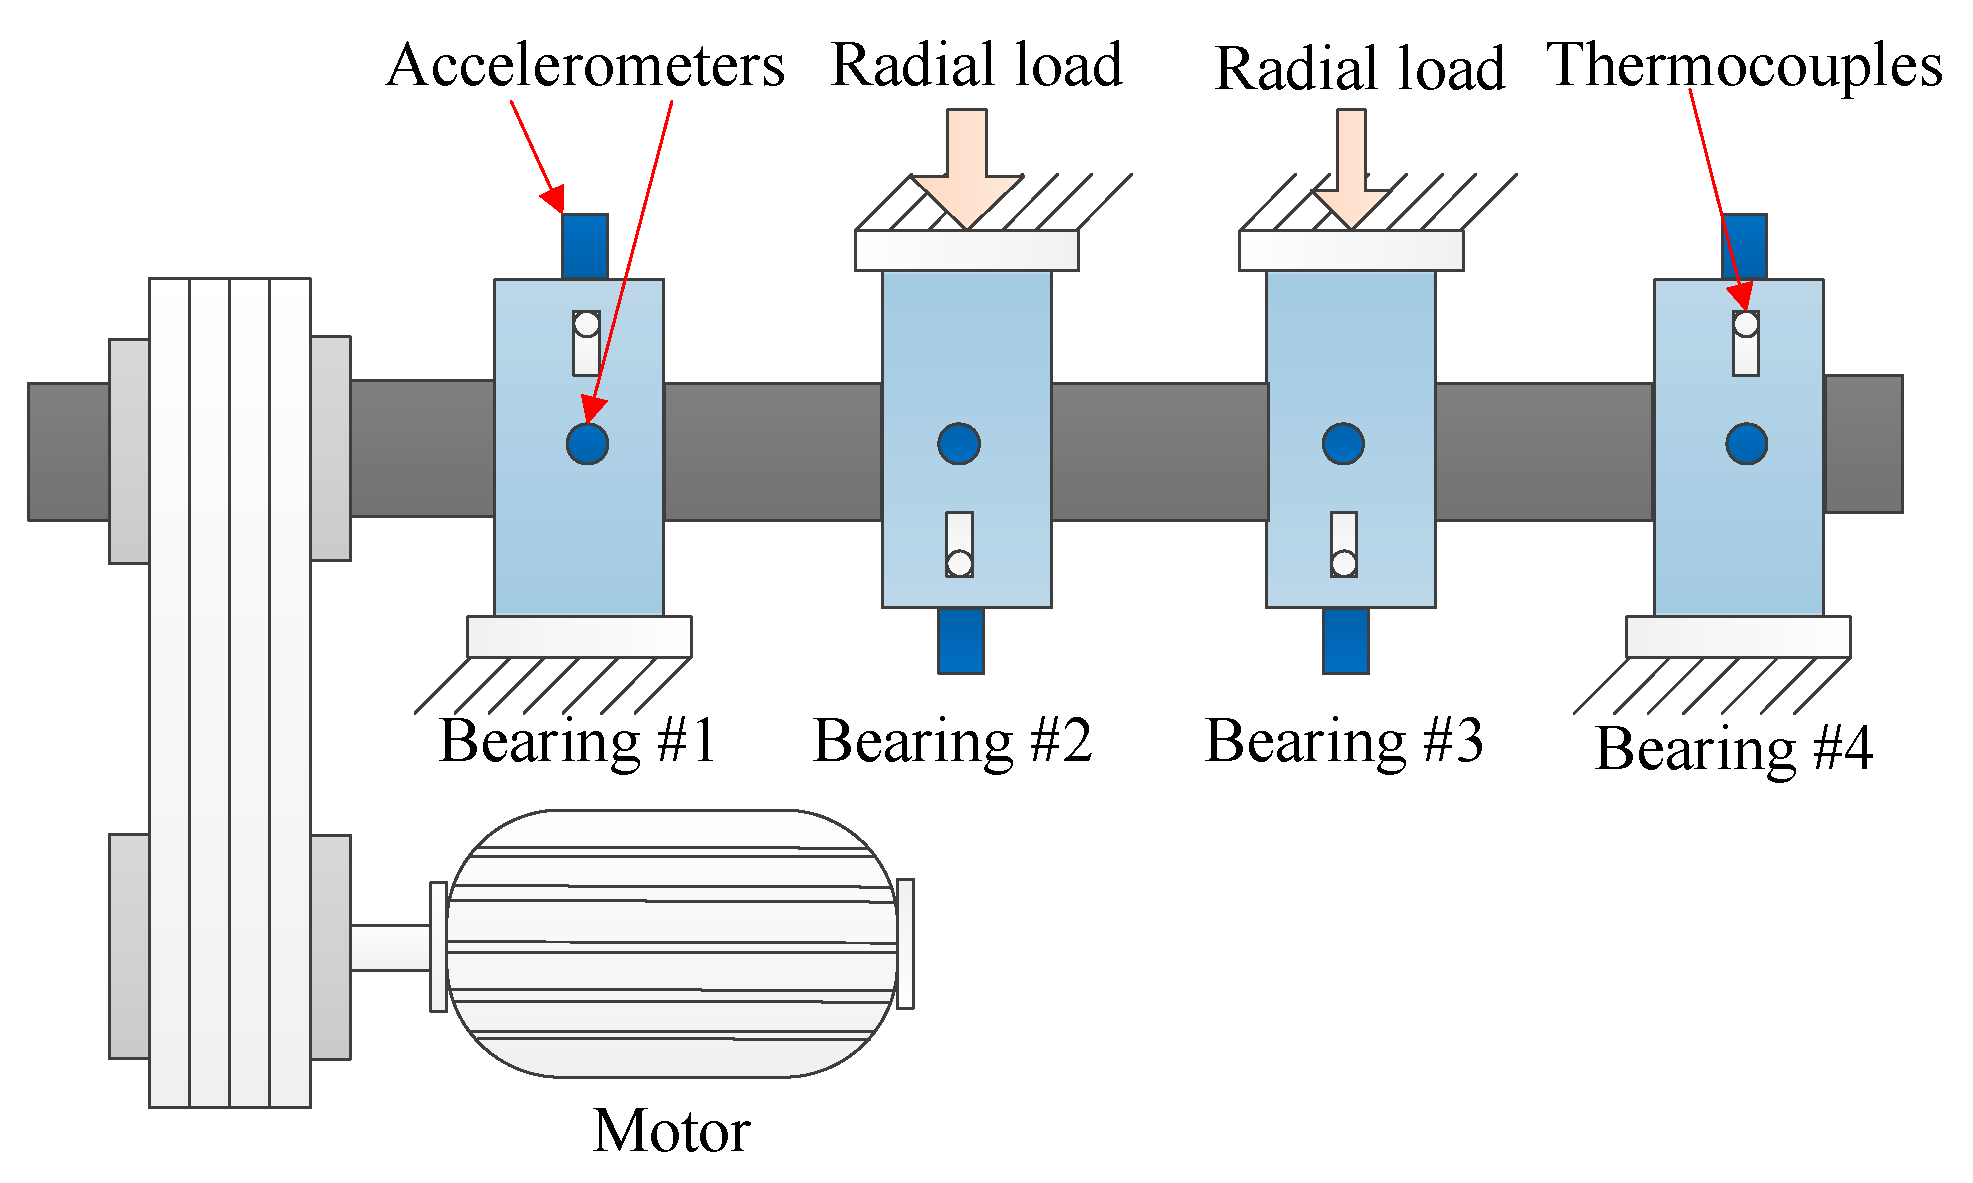
4.2. Rolling Bearing Outer Race Defect Detection from IMS Bearing Dataset

The efficiency of the proposed method in extracting fault features was further evaluated using the NASA IMS-bearing dataset, which is publicly available in the Acoustics and Vibration Database [24]. This dataset encompasses the entire lifespan of the bearings, ranging from healthy to failure states. Figure 19 illustrates the test setup utilized to conduct the bearing run-to-failure experiment. The setup comprises a motor, a belt drive unit, and a shaft supported by four Rexnord ZA-2115 double-row bearings (designated as #1–4). Throughout the experiment, the motor was operated at a constant speed of 2000 rpm. Two accelerometers were mounted on the bearing housing of each bearing to measure vertical and horizontal vibration signals, with data recorded at 10 min intervals. The experiment spanned a total duration of 164 h, resulting in the collection of 984 sets of data samples. The sampling frequency was set at 20,000 Hz. During the experiment, an outer ring defect was induced on bearing #1, with the fault severity worsening over time. The bearing pass frequency of the outer race (BPFO) was 236.4 Hz. Previous research [25] has identified the occurrence of an initial fault in file 533. The signal recorded in file 10 was utilized as a healthy signal for the calculation of the SKRgram and LESGIRgram, while the signal recorded in file 560 was used as a faulty signal for analysis and comparison.
Figure 20a,b show the time domain and frequency domain plots of the healthy signal, and Figure 20c,d show the time domain and frequency domain plots of the faulty signal, respectively. Figure 21 shows the result of the FK algorithm processing. The FK-based method selects a band center frequency of approximately 2343.75 Hz; the BPFO and its harmonics are not recognized from the envelope spectrum shown in Figure 21c. The center frequency of the best band selected with the Autogram is 4375 Hz, which is close to the frequency band shown in Figure 20d. Figure 22c shows the envelope spectrum after Autogram filtering, where 1 × BPFO, 2 × BPFO, 3 × BPFO, and 4 × BPFO are recognized in the envelope spectrograms. The center frequency selected with the SKRgram is 2343.75 Hz, which is far from the ODFBs shown in Figure 20d. Figure 23 shows the processing results of the SKRgram, which is similar to the FK results and fails to extract fault features. As shown in Figure 24, the ODFBs selected with the LESGIRgram are consistent with the resonance bands in Figure 20d, and the envelope spectrum in Figure 24c identifies 1 × BPFO, 2 × BPFO, 3 × BPFO, 4 × BPFO, 5 × BPFO, and 6 × BPFO.

5. Conclusions

In this paper, a useful frequency band selection tool similar to the SKRgram for detecting bearing faults is proposed, named as the LESGIRgram. The logarithmic envelope spectrum Gini coefficient is proposed as the frequency band screening criterion, which solves the problem of fault characteristics being interfered by random pulses and harmonic noise. Inspired by the SKRgram, the interference of random pulses and harmonics is weakened, and fault characterization information is highlighted by locating the difference between the LESGIgrams of healthy and faulty bearings. In the Simulation Evaluation section, the ability of the FK, Autogram, SKRgram, and LESGIRgram to select the optimal demodulation frequency band in the presence of Gaussian white noise, harmonic interference, and random impulse interference is compared. The results show that the LESGIRgram and FK have better robustness than the Autogram and SKRgram under the interference of strong Gaussian white noise. Under the interference of discrete harmonics, the LESGIRgram, FK, and Autogram have better performance than the SKRgram. The LESGIRgram has the best performance under random pulse disturbances. The two sets of actual experimental data used in this paper also verify the superiority of the LESGIRgram in bearing fault feature extraction.
The methodology proposed in this paper has some limitations. The health signal is required as a baseline to derive the LESGIR index. In addition, only fault feature extraction for fixed-speed bearing fault signals was considered. In future works, we will aim to investigate a new metric that does not require the health signal as a baseline and use this metric in the feature extraction of variable-speed bearing faults.

Author Contributions

Methodology, T.T.; software, T.T.; validation, G.T. and X.W.; writing—original draft preparation, T.T.; writing—review and editing, T.T.; visualization, T.T.; supervision, G.T. and X.W.; project administration, G.T.; funding acquisition, X.W. All authors have read and agreed to the published version of the manuscript.

Funding

This research was funded by the National Natural Science Foundation of China (grant no. 52005180) and the Natural Science Foundation of Hebei Province, China (grant no. E2022502003).

Data Availability Statement

The data presented in this study are available on request from the corresponding author.

Conflicts of Interest

The authors declare no conflict of interest.

References

  1. Yang, J.; Huang, D.; Zhou, D.; Liu, H. Optimal IMF Selection and Unknown Fault Feature Extraction for Rolling Bearings with Different Defect Modes. Measurement 2020, 157, 107660. [Google Scholar] [CrossRef]
  2. Jiang, Z.; Zhang, K.; Xiang, L.; Xu, Y. Differential Spectral Amplitude Modulation and Its Applications in Rolling Bearing Fault Diagnosis. Measurement 2022, 201, 111755. [Google Scholar] [CrossRef]
  3. Dwyer, R.F. A Technique for Improving Detection and Estimation of Signals Contaminated by under Ice Noise. J. Acoust. Soc.Am. 1983, 74, 124–130. [Google Scholar] [CrossRef]
  4. Antoni, J. The Spectral Kurtosis: A Useful Tool for Characterising Non-Stationary Signals. Mech. Syst. Signal Process. 2006, 20, 282–307. [Google Scholar] [CrossRef]
  5. Antoni, J.; Randall, R.B. The Spectral Kurtosis: Application to the Vibratory Surveillance and Diagnostics of Rotating Machines. Mech. Syst. Signal Process. 2006, 20, 308–331. [Google Scholar] [CrossRef]
  6. Antoni, J. Fast Computation of the Kurtogram for the Detection of Transient Faults. Mech. Syst. Signal Process. 2007, 21, 108–124. [Google Scholar] [CrossRef]
  7. Lei, Y.; Lin, J.; He, Z.; Zi, Y. Application of an Improved Kurtogram Method for Fault Diagnosis of Rolling Element Bearings. Mech. Syst. Signal Process. 2011, 25, 1738–1749. [Google Scholar] [CrossRef]
  8. Wang, D.; Tse, P.W.; Tsui, K.L. An Enhanced Kurtogram Method for Fault Diagnosis of Rolling Element Bearings. Mech. Syst. Signal Process. 2013, 35, 176–199. [Google Scholar] [CrossRef]
  9. Barszcz, T.; JabŁoński, A. A Novel Method for the Optimal Band Selection for Vibration Signal Demodulation and Comparison with the Kurtogram. Mech. Syst. Signal Process. 2011, 25, 431–451. [Google Scholar] [CrossRef]
  10. Moshrefzadeh, A.; Fasana, A. The Autogram: An Effective Approach for Selecting the Optimal Demodulation Band in Rolling Element Bearings Diagnosis. Mech. Syst. Signal Process. 2018, 105, 294–318. [Google Scholar] [CrossRef]
  11. Antoni, J. The Infogram: Entropic Evidence of the Signature of Repetitive Transients. Mech. Syst. Signal Process. 2016, 74, 73–94. [Google Scholar] [CrossRef]
  12. Zhang, K.; Xu, Y.; Liao, Z.; Song, L.; Chen, P. A Novel Fast Entrogram and Its Applications in Rolling Bearing Fault Diagnosis. Mech. Syst. Signal Process. 2021, 154, 107582. [Google Scholar] [CrossRef]
  13. Wang, X.; Zheng, J.; Zhang, J. A Novel Optimal Demodulation Frequency Band Extraction Method of Fault Bearing Based on Power Spectrum Screening Combination-Gram. Mech. Syst. Signal Process. 2022, 174, 109104. [Google Scholar] [CrossRef]
  14. Yang, Z.; Zhang, Z.; Wang, J.; Han, B.; Bao, H.; Liu, Z.; Li, S. Fast Nonlinear Hoyergram for Bearings Fault Diagnosis under Random Impact Interference. Meas. Sci. Technol. 2022, 33, 075112. [Google Scholar] [CrossRef]
  15. Liang, L.; Liu, C.; Wang, J. Periodicity Measure of Cyclo-Stationary Impulses Based on Low Sparsity of Gini Index and Its Application to Bearing Diagnosis. ISA Trans. 2023, 138, 611–627. [Google Scholar] [CrossRef]
  16. Wang, T.; Han, Q.; Chu, F.; Feng, Z. A New SKRgram Based Demodulation Technique for Planet Bearing Fault Detection. J. Sound Vib. 2016, 385, 330–349. [Google Scholar] [CrossRef]
  17. Miao, Y.; Zhao, M.; Lin, J. Improvement of Kurtosis-Guided-Grams via Gini Index for Bearing Fault Feature Identification. Meas. Sci. Technol. 2017, 28, 125001. [Google Scholar] [CrossRef]
  18. Borghesani, P.; Antoni, J. CS2 Analysis in Presence of Non-Gaussian Background Noise—Effect on Traditional Estimators and Resilience of Log-Envelope Indicators. Mech. Syst. Signal Process. 2017, 90, 378–398. [Google Scholar] [CrossRef]
  19. Smith, W.A.; Borghesani, P.; Ni, Q.; Wang, K.; Peng, Z. Optimal Demodulation-Band Selection for Envelope-Based Diagnostics: A Comparative Study of Traditional and Novel Tools. Mech. Syst. Signal Process. 2019, 134, 106303. [Google Scholar] [CrossRef]
  20. Hurley, N.; Rickard, S. Comparing Measures of Sparsity. IEEE Trans. Inform. Theory 2009, 55, 4723–4741. [Google Scholar] [CrossRef]
  21. Chen, B.; Zhang, W.; Gu, J.X.; Song, D.; Cheng, Y.; Zhou, Z.; Gu, F.; Ball, A.D. Product Envelope Spectrum Optimization-Gram: An Enhanced Envelope Analysis for Rolling Bearing Fault Diagnosis. Mech. Syst. Signal Process. 2023, 193, 110270. [Google Scholar] [CrossRef]
  22. Chen, B.; Cheng, Y.; Zhang, W.; Gu, F. Enhanced Bearing Fault Diagnosis Using Integral Envelope Spectrum from Spectral Coherence Normalized with Feature Energy. Measurement 2022, 189, 110448. [Google Scholar] [CrossRef]
  23. Su, H.; Xiang, L.; Hu, A.; Xu, Y.; Yang, X. A Novel Method Based on Meta-Learning for Bearing Fault Diagnosis with Small Sample Learning under Different Working Conditions. Mech. Syst. Signal Process. 2022, 169, 108765. [Google Scholar] [CrossRef]
  24. Qiu, H.; Lee, J.; Lin, J.; Yu, G. Wavelet Filter-Based Weak Signature Detection Method and Its Application on Rolling Element Bearing Prognostics. J. Sound Vib. 2006, 289, 1066–1090. [Google Scholar] [CrossRef]
  25. Hou, B.; Wang, D.; Wang, Y.; Yan, T.; Peng, Z.; Tsui, K.-L. Adaptive Weighted Signal Preprocessing Technique for Machine Health Monitoring. IEEE Trans. Instrum. Meas. 2021, 70, 3504411. [Google Scholar] [CrossRef]
Figure 1. Paving of the plane in the 1/3−binary tree.
Machines 11 01052 g001
Figure 2. Paving of the plane in the binary tree.
Machines 11 01052 g002
Figure 3. Framework of the LESGIRgram method.
Machines 11 01052 g003
Figure 4. Components of bearing vibration signals: (a) impulsive fault component; (b) harmonic interference; (c) random impulses; (d) Gaussian white noise (SNR = −5 dB); (e) mixed signal; and (f) frequency domain spectrogram of (e).
Machines 11 01052 g004
Figure 5. (a) Fast Kurtogram; (b) bandpass filtered signal with FK and (c) square envelope spectrum of (b).
Machines 11 01052 g005
Figure 6. (a) Autogram; (b) bandpass filtered signal with Autogram and (c) square envelope spectrum of (b).
Machines 11 01052 g006
Figure 7. (a) SKRgram; (b) bandpass filtered signal with SKRgram and (c) square envelope spectrum of (b).
Machines 11 01052 g007
Figure 8. (a) LESGIRgram; (b) bandpass filtered signal with LESGIRgram and (c) square envelope spectrum of (b).
Machines 11 01052 g008
Figure 9. Frequency bands selected under different Gaussian white noise levels with (a) FK, (b) Autogram, (c) SKRgram, and (d) LESGIRgram.
Machines 11 01052 g009
Figure 10. Frequency bands selected under different amplitude of harmonic interference with (a) FK, (b) Autogram, (c) SKRgram, and (d) LESGIRgram.
Machines 11 01052 g010
Figure 11. Frequency bands selected under different amplitude of random impulse with (a) FK; (b) Autogram; (c) SKRgram, and (d) LESGIRgram.
Machines 11 01052 g011
Figure 12. Frequency bands selected under different number of random impulses with (a) FK; (b) Autogram; (c) SKRgram; and (d) LESGIRgram.
Machines 11 01052 g012
Figure 13. Experimental setup for the bearing fault diagnosis.
Machines 11 01052 g013
Figure 14. (a) Healthy signal with speed of 1470 rpm; (b) the spectrum of (a); (c) outer race faulty signal with speed of 1470 rpm; and (d) the spectrum of (c).
Machines 11 01052 g014
Figure 15. (a) Fast Kurtogram; (b) bandpass filtered signal with FK; and (c) square envelope spectrum of (b).
Machines 11 01052 g015
Figure 16. (a) Autogram; (b) bandpass filtered signal with Autogram; and (c) square envelope spectrum of (b).
Machines 11 01052 g016
Figure 17. (a) SKRgram; (b) bandpass filtered signal with SKRgram; and (c) square envelope spectrum of (b).
Machines 11 01052 g017
Figure 18. (a) LESGIRgram; (b) bandpass filtered signal with LESGIRgram; and (c) square envelope spectrum of (b).
Machines 11 01052 g018
Figure 19. Bearing run-to-failure experiment bench.
Machines 11 01052 g019
Figure 20. (a) Signal in file 10; (b) the spectrum of (a); (c) signal in file 560; and (d) the spectrum of (c).
Machines 11 01052 g020
Figure 21. (a) Fast Kurtogram; (b) bandpass filtered signal with FK; and (c) square envelope spectrum of (b).
Machines 11 01052 g021
Figure 22. (a) Autogram; (b) bandpass filtered signal with Autogram; and (c) square envelope spectrum of (b).
Machines 11 01052 g022
Figure 23. (a) SKRgram; (b) bandpass filtered signal with SKRgram; and (c) square envelope spectrum of (b).
Machines 11 01052 g023
Figure 24. (a) LESGIRgram; (b) bandpass filtered signal with LESGIRgram; and (c) square envelope spectrum of (b).
Machines 11 01052 g024
Table 1. Parameters of simulated bearing inner fault signals.
ParametersValueParametersValue
Sampling frequency fs25.6 kHzf110 Hz
duration3 sφ1π/6
M1360B20.1
fm120 Hzf220 Hz
fr10 Hzφ2−π/3
fn12000 HzM33
ξ10.02fn25000 Hz
M22ξ20.02
B10.1SNR−5 dB
Table 2. Parameters of LYC6205E bearing.
ParametersLYC6205E
Pitch diameter38.5 mm
Bearing width15 mm
Bearing roller diameter7.94 mm
The number of the roller9
Contact angle0 rad
Inter-race defect1.5 × 0.2 mm
BPFI132.55 Hz
Disclaimer/Publisher’s Note: The statements, opinions and data contained in all publications are solely those of the individual author(s) and contributor(s) and not of MDPI and/or the editor(s). MDPI and/or the editor(s) disclaim responsibility for any injury to people or property resulting from any ideas, methods, instructions or products referred to in the content.

