Article

Combined Use of sEMG and Inertial Sensing to Evaluate Biomechanical Overload in Manufacturing: An On-the-Field Experience †

by
Maria Grazia Lourdes Monaco
1,
Lorenzo Fiori
2,3,‡,
Agnese Marchesi
4,‡,
Mariarosaria Muoio
5,
Elpidio Maria Garzillo
6,*,
Francesco Caputo
7,
Nadia Miraglia
5,
Monica Lamberti
5,
Alessio Silvetti
8 and
Francesco Draicchio
8
1
Occupational Medicine Unit, University Hospital of Verona, 37134 Verona, Italy
2
Department of Physiology and Pharmacology, PhD Program in Behavioral Neuroscience, Sapienza University of Rome, Viale dell’Università, 30, 00185 Rome, Italy
3
Department of Occupational and Environmental Medicine, Epidemiology and Hygiene, Italian Workers’ Compensation Authority (INAIL), Monte Porzio Catone, 00078 Rome, Italy
4
Microsoft Italia, Viale Pasubio, 21, 20154 Milano, Italy
5
Department of Experimental Medicine, University of Campania Luigi Vanvitelli, Via Santa Maria di Costantinopoli, 16, 80138 Naples, Italy
6
Department of Prevention, Abruzzo Local Health Authority, 67100 L’Aquila, Italy
7
Department of Engineering, University of Campania Luigi Vanvitelli, Via Roma, 29, 81031 Aversa, Italy
8
INAIL Research Center, Via di Fontana Candida, 1, Monte Porzio Catone, 00078 Rome, Italy
*
Author to whom correspondence should be addressed.
This paper is an extended version of our paper published in Monaco, M.G.L.; Fiori, L.; Marchesi, A.; Greco, A., Ghibaudo, L.; Spada, S.; Caputo, F., Miraglia, N., Silvetti, A., Draicchio, F. Biomechanical Overload Evaluation in Manufacturing: A Novel Approach with sEMG and Inertial Motion Capture Integration. In: Bagnara, S., Tartaglia, R., Albolino, S., Alexander, T., Fujita, Y. 2019 (eds) Proceedings of the 20th Congress of the International Ergonomics Association (IEA 2018). IEA 2018. Advances in Intelligent Systems and Computing, vol 818. Springer, Cham. https://doi.org/10.1007/978-3-319-96098-2_88.
These authors contributed equally to this work.
Machines 2023, 11(4), 417; https://doi.org/10.3390/machines11040417
Submission received: 19 February 2023 / Revised: 11 March 2023 / Accepted: 21 March 2023 / Published: 24 March 2023
(This article belongs to the Special Issue Recent Advances in Smart Design and Manufacturing Technology)

Abstract

:
Biomechanical overload is considered a significant occupational risk in manufacturing and a potential cause of musculoskeletal disorders. This research aims to introduce new methodologies for the quantitative risk evaluation of biomechanical risk by combining surface electromyography with a motion acquisition system based on inertial measurement units. Due to the lack of experimental data in the literature acquired in a real industrial environment during the working shift, an on-the-field study regarding an automotive assembly line workstation has been carried out in collaboration with Fiat Chrysler Automobiles Italy S.p.A. Data related to the trunk flexion forward and the erector spinae muscle activity have been acquired for several consecutive working cycles by considering three different workers. Data analyses indicated kinematic and muscular activity patterns consistent with those expected and that the proposed wearable technologies can be integrated and used simultaneously during work activities. Furthermore, the results demonstrated data repeatability, strengthening the feasibility and usefulness of the combined use of kinematic and electromyography technologies to assess biomechanical overload in production lines. This study could lay the bases for the future definition of a method for assessing biomechanical overload due to awkward postures.

1. Introduction

Musculoskeletal disorders (MSDs) are the most frequent occupational disorders in the European Union: they affect workers in all sectors and occupations, and they are the most important causes of long-term sickness absences with effects and costs not only on workers themselves but also on the society as a whole [1]. Several reasons have been identified as follows, and even if the work-related biomechanical load is not the only causative factor, it is likely to constitute a significant part of it: posture, repetitive movements, heavy lifting, awkward postures, exposure to cold temperature and insufficient recovery time, as well as psychosocial risk factors [2,3]. All those factors must be considered to estimate exposure [4].
The prevention of MSDs, a cornerstone of ergonomics and a challenge in industrial settings, must be integrated with correctly evaluating and managing biomechanical overload. Two risk assessment approaches allow for analysing the amount of discomfort and postural stress: observational and instrument-based techniques [5,6].
Traditionally, working postures and movements have been assessed using various observational protocols and checklists, such as the Ovako Working Postures Assessment System (OWAS) [7,8], the Rapid Upper Limb Assessment (RULA) [9], and the Rapid Entire Body Assessment (REBA) [10]. In some occupational contexts, e.g., the automotive industry, specific working methods have been developed, such as the Ergonomic Assessment Worksheet (EAWS) [11]. These assessment tools use on-the-job observation or video recordings to classify the ranges within which each body segment falls, with obvious limitations in characterising physical exposure: subjectivity, observer bias, low accuracy, long analysis periods, and the need for highly trained observers. Their internal and external validity has also been questioned. Many observational tools for biomechanical risk assessment have been developed; these tools only require a little equipment, other than an evaluation sheet and pencil, and moderately agree with technical measurements [5,12]. These methods are also vulnerable to errors: the most significant discrepancies arise in estimating the applied forces and the posture, and their inter-rater reliability might vary a lot [13].
In the Industry 4.0 era, several research groups have been interested in the application of new technologies in the field of ergonomics, also through the combination of different methods to allow for the use of quantitative biomechanical measures, which are more precise and reliable, and to obtain detailed and accurate values for jobs with varying tasks of work [13,14,15,16,17,18,19]. In recent years, wearable sensors have been used for quantitative instrumental-based biomechanical risk assessments to prevent work-related musculoskeletal disorders (WMSDs) [20]. Surface electromyography (sEMG) is considered an important and helpful tool for the quantitative evaluation of biomechanical overload and offers the possibility of obtaining ‘inline’ information, highly relevant from several ergonomic points of view [21,22]; sEMG is a non-invasive method and, for this reason, it can be used during the execution of a work task [23]. Several methods evaluate the range of motion during professional activities, for instance real-time measurement could be conducted using sensors attached to the worker’s body. For industrial applications, motion capture systems record workers’ gestures to assess ergonomic risk and improve working conditions objectively. Motion capture systems consisting of Inertial Measurement Units (IMU) represent the best solution for ergonomic applications in a real occupational setting since they do not hinder working activities and they are not bulky like vision systems, even if data could be less accurate than those ones. Several researchers have introduced IMU devices to measure workers’ body motion [14,17,24,25]. However, the equipment mentioned above suffers from possible electromagnetic interference, which occurs widely in industrial environments [17].
Acquiring the real working condition data may allow us to evaluate the dynamic postural aspects of the single worker’s activities, which observational pencil and paper methodologies would not provide. This feature can allow us to identify the real contribution to each occupational task’s biomechanical overload and assess the effectiveness of any preventive and corrective interventions through pre- and post-measurements. Moreover, a combined approach throughout assessing muscle activity and a kinematic evaluation could lead to a comprehensive assessment of the dynamic effects of the workers’ postures/activities. In the literature, some approaches integrate multiple technologies (sEMG, IMUs, and videotaping) to objectify the different factors of biomechanical overload [15,16,18]. These approaches are innovative, and there needs to be evidence of analyses of data collected in the manufacturing environment during the normal production processes. An interesting experiment was conducted, in the laboratory, by Poitras et al. [26], who studied the validity of using wearable sensors at the shoulder joint, combining EMG and IMU sensors. Although they highlighted the suitability of the combined use of the sensors during a work task simulation, the authors emphasised the need to validate their use in the workplace, in real work situations. Merino et al. evaluated the shoulder biomechanical overload in three workers performing banana processing tasks using inertial sensor motion capture (Xsens) and EMGs [27]. The methods used in the evaluation provided useful data on the possible relationship between awkward posture and the occurrence of fatigue and musculoskeletal disorders. This study also supports the need to obtain on-field data.
This on-the-field study is within the framework of a 2019 PhD project focused on the role of sEMG in biomechanical overload assessment in the automotive manufacturing setting. Some data were only preliminarily presented in the 2019 IEA publication [28]. This study aims to illustrate a methodological approach for quantitatively assessing biomechanical overload risk based on the combined use of sEMG and an IMU-based wearable motion capture system for collecting experimental data during work activity in automotive manufacturing production lines.

2. Materials and Methods

2.1. Setting and Subjects

The study was conducted in collaboration with Fiat Chrysler Automobiles Italy S.p.A., at the assembly shop of the plant located in Melfi, according to a protocol previously described [26]. Three male workers were enrolled (mean age 36 ± 12 years (SD); mean mass 79 (±14) kg (SD); height 173.7 ± 5.1 cm; working seniority 14.7 ± 11.0 years (SD)). They reported no prior cases of low back pain or surgeries. The research was performed following the ethical standards laid down in the 1964 Declaration of Helsinki and its later amendments. Ethical approval is not necessary because the workers’ measurements were performed within the mandatory risk assessment process and according to Italian laws concerning the protection of workers exposed to occupational risks (Italian Decree no.81/2008).

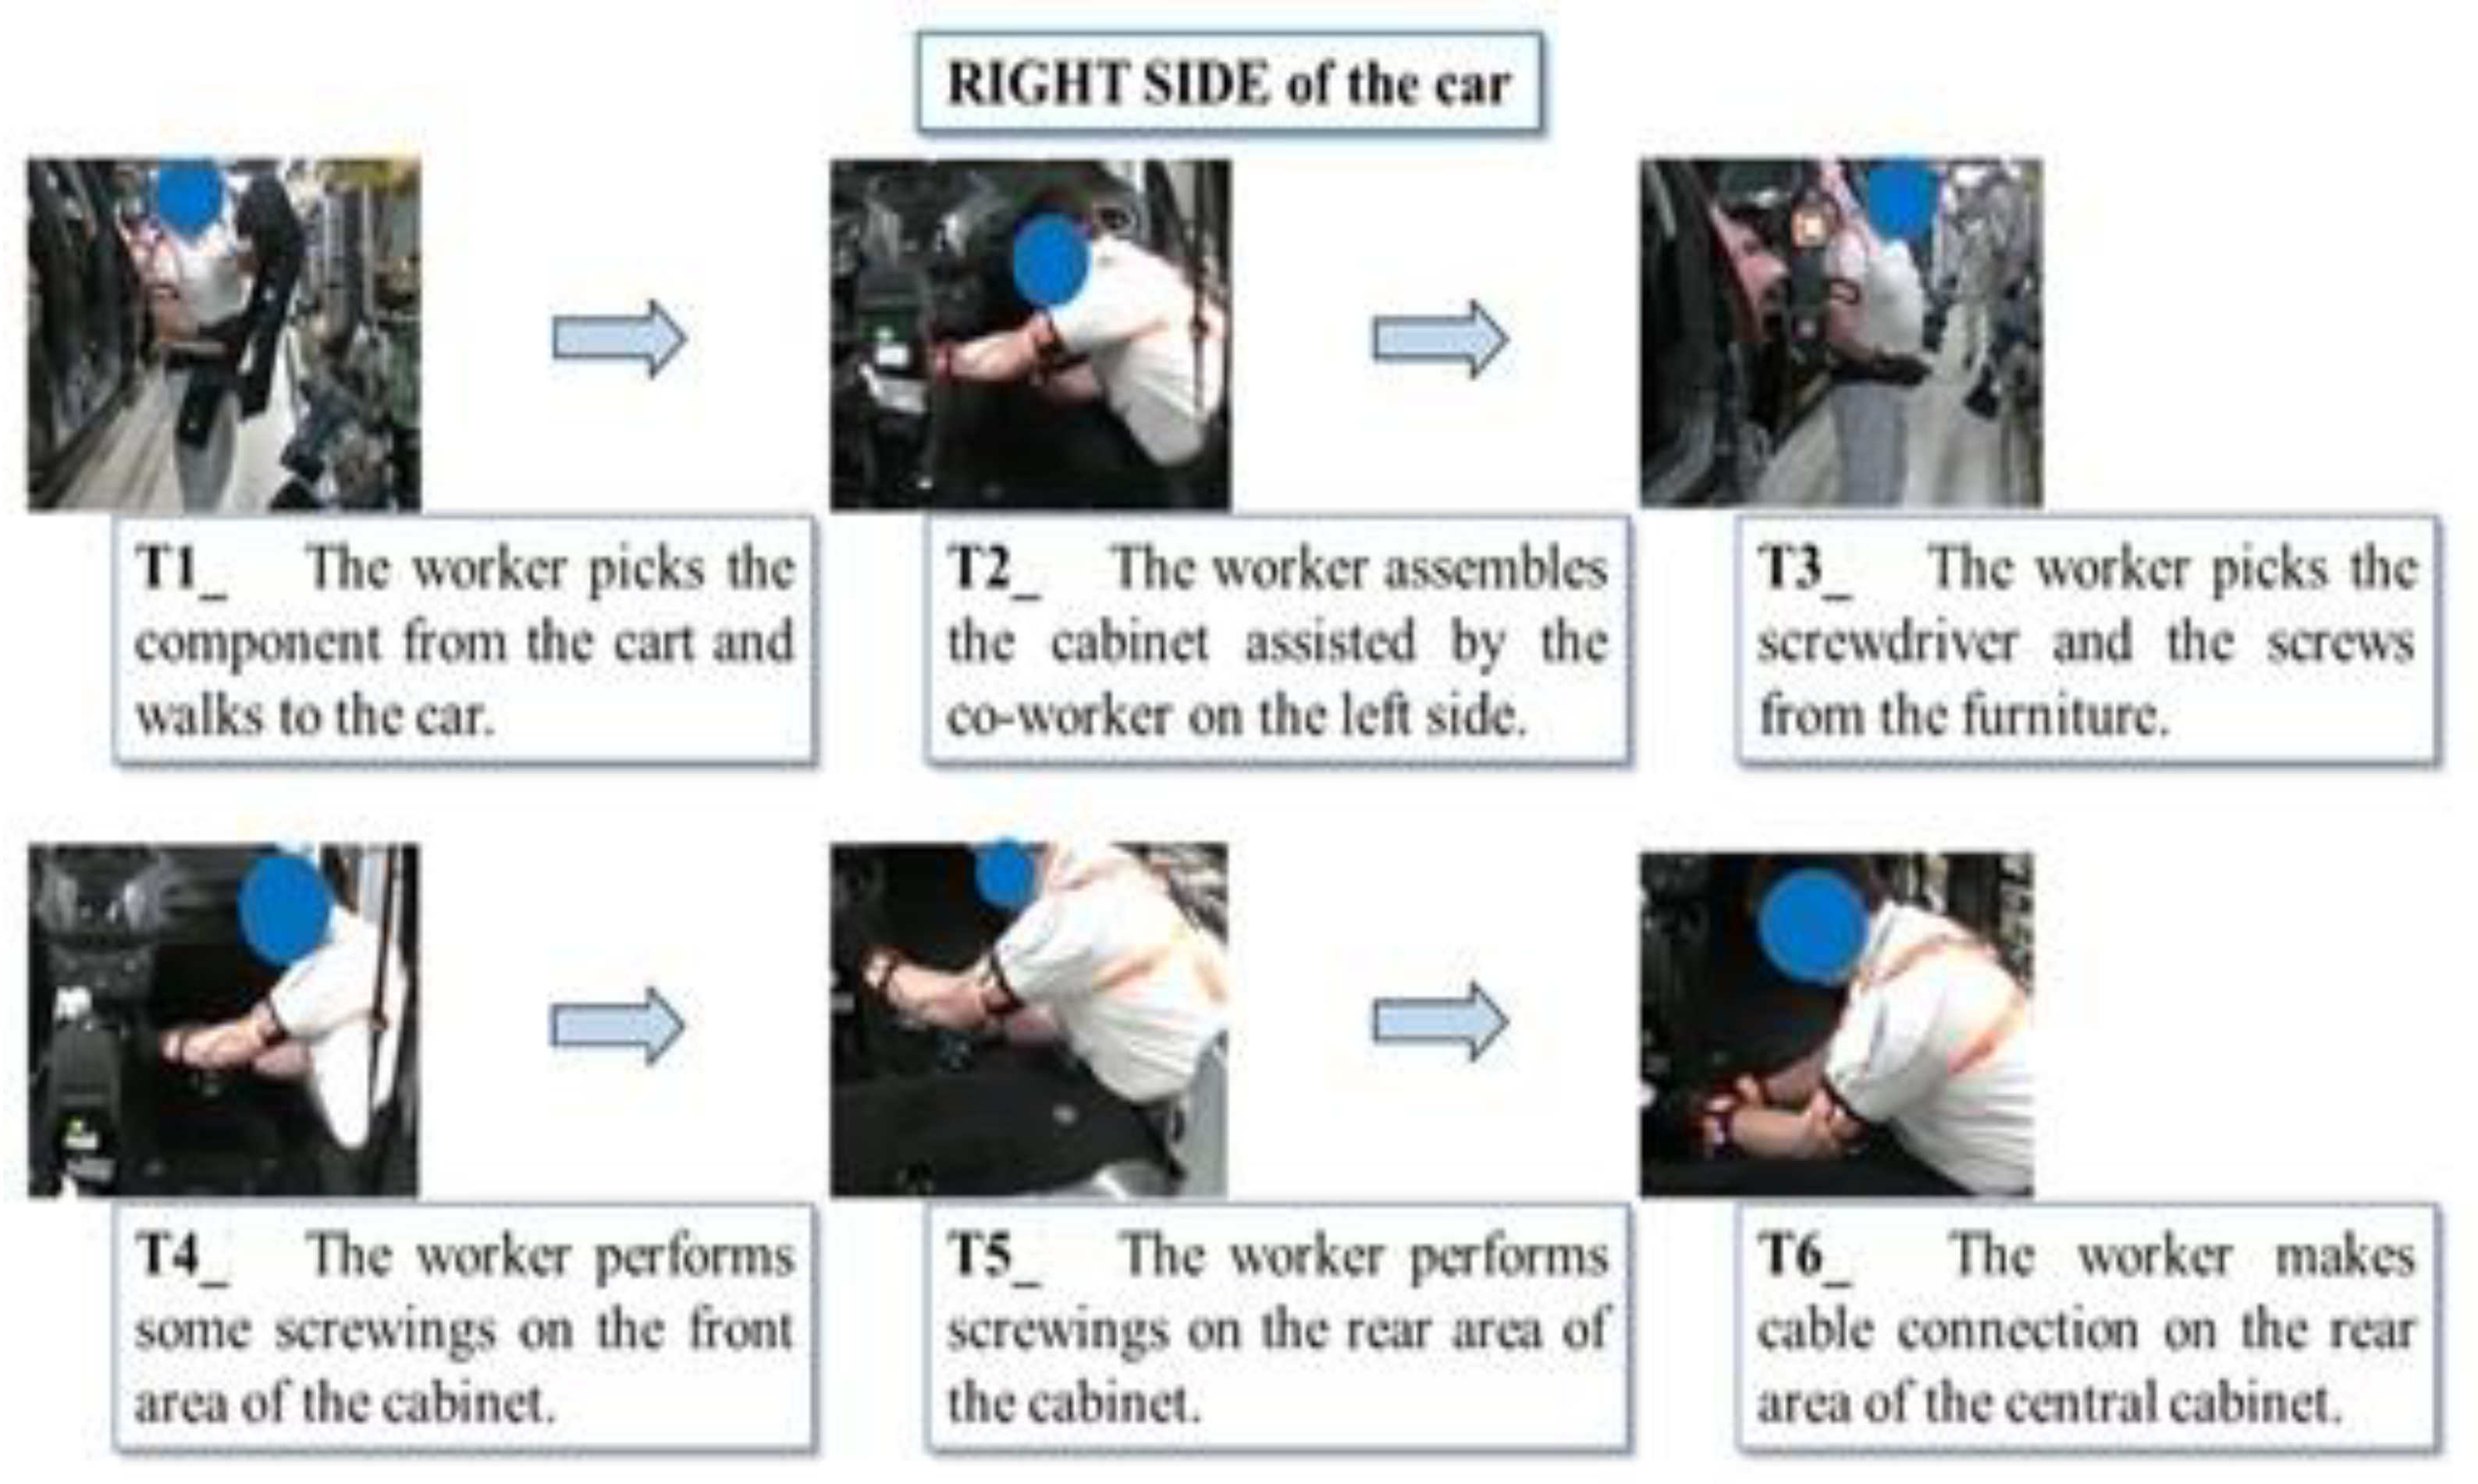
2.2. Working Activity Description

The following figures show a phase of the activity carried out by a worker on the right side (Figure 1) and on the left side (Figure 2) of the workstation, where the central cabinet is assembled inside the cabin using screws, dowels, and cables. The cycle duration is approximately one minute (58 s). Experimental data have been acquired for about forty consecutive working cycles per worker. The activity was studied by analysing the Standard Operating Procedure (SOP) and with the support of the videos recorded by three different cameras: two cameras are located behind and to the worker’s side, and another one is located on the worker’s goggles. This last camera is integrated and synchronised with the motion capture system.
The kinematic and electromyographic analyses focused only on the trunk in this study. The choice to investigate this region is due to the preliminary observational investigations of the working task that suggested the lumbar spine district was most overloaded.

2.3. Instrumentation, Procedure, and Data Acquisition

2.3.1. Acquisition and Processing of sEMG Signals

A six-probe electromyography device (FreeEMG, BTS SpA, Milan, Italy) was used to record the electrical activity of the muscles. Each of them has a 100 dB CMRR instrumentation amplifier, a Hamming band-pass filter, a sampling frequency of 1 kHz, an analog-to-digital conversion system, and a wireless data transfer system (Wi-Fi). According to the recommendations of the Atlas of Muscle Innervation Zones [29], the probes were placed over the muscles engaged in the research using pre-gelled Ag/AgCl electrodes (H124SG, Kendall ARBO, Donau, Germany). Specifically, electrical activity was collected bilaterally from the paravertebral muscles: Erector Spinae Thoracic (EST), Erector Spinae Lumbar (ESL), and Multifidus (M), of which the landmarks for electromyographic measurements were identified, positioning the electrodes following the indications of the innervation zone atlas as given in the literature [29] (Figure 3).
The muscles’ maximum voluntary contractions (MVCs), recorded before the work activity began, were used to calculate the peak amount of muscle activation that would serve as a benchmark during the signal processing stage. The patient extended his back for 15 s while lying on the abdomen with all his strength (Figure 4). After a three-minute break between each trial, each MVCs assignment was repeated three times, and the average value was calculated [21,30].
An algorithm created in MATLAB software (verses 9.3.0, MathWorks, Natick, MA, USA) was used to analyse the collected sEMG signals [29]. To lessen motion artefacts (electrode skin) and other high-frequency noise components, the electromyography signals were first filtered with an a%th-order Butterworth IIR digital pass filter in the study’s target frequency range (30–450 Hz). The muscular activity profile was then extracted using an adaptive sEMG envelope extraction algorithm. [31]. Finally, the sEMG signal envelope was expressed as a percentage of the MVCs of each muscle and time-normalized from 0 to 100% of the work cycle. The root mean square (RMS) index was calculated to obtain an overall index of muscle activity:
R M S = 1 N i = 1 N x i 2
where N is the total number of samples and xi is the i-th sample value.

2.3.2. Body Motion Study

An inertial motion capture wearable system has been used to study the body’s mobility. The system was created at the Luigi Vanvitelli Engineering Department of the University of Campania and comprised several micro–Inertial Measurement Units (IMUs) [25]. The upper-body configuration in this study required the development of a system made up of two independent modules. Four IMUs make up each module, placed on the pelvis, boot, arm, and forearm, respectively (Figure 5). A Raspberry Pi that is powered by a battery records and pre-processes data.
The attitude estimation is based on a Kinematic Extended Kalman Filter [25] and provides both attitude data (in terms of quaternions and Euler angles), per each IMU, and posture angles trends over time: rigid pelvis rotation; flexion forward, lateral flexion and torsion of the trunk; elevation, lateral flexion and rotation of the arm; flexion and rotation of the forearm. The alignment of axes between IMUs and body segments is assured at the initial time by a software reset with the acquisition of the initial conditions from inertial sensors. The system’s accuracy was tested and verified during experimental tests in a laboratory. Posture angles data were compared with those provided by the optical motion capture system SMART-DX by BTS Engineering®.
To make the estimation less subject to possible electromagnetic interferences, typical of industrial environments, the on-board Kalman filter was augmented with an adaptive virtual magnetometer reset when a significant difference in the magnitude of the magnetic vector was sensed. To match the postures data and the electromyographic data, only the flexion forward angle of the trunk has been considered in this study.

2.4. Results Analysis Methodology

The analysis of experimental data included the evaluation of the normality of the distributions and then applying comparison tests between averages/mediums. The Shapiro–Wilk test was used to evaluate the normality distribution of the data (due to a sample size of less than 30). In normal distributions, parametric comparison tests (t-test or ANOVA) were used; for non-normal distributions, non-parametric tests were used (Mann–Whitney for comparing two distributions, Kruskal–Wallis test for the comparison of more than two distributions). A p-value of <0.05 was considered statistically significant, and post hoc analyses were performed using a paired t-test with Bonferroni’s corrections when significant differences were observed in the ANOVA. The statistical analysis was performed using MATLAB software (verses 9.3.0, MathWorks, Natick, MA, USA).

3. Results

3.1. Electromyographic Signal Analysis

The raw signals, recorded by each electromyographic electrode placed on the enrolled workers, were acquired and processed to obtain the sEMG envelope. Figure 6 shows EMG signals envelopes for the working task at the right and left side of the workstation, respectively.
Table 1 reported the comparisons between the average values (±SD—standard deviation) of each enrolled worker’s muscle activity (left and right paravertebral complex) while performing activities on the left and right side of the workstation.
Figure 7 compares the mean values (±SD) of the muscle activity (right and left paravertebral complex) of all enrolled workers during the work performance on the right and left side of the workstation.
On the right side of the workstation, a significant statistical asymmetry (difference in values between right and left paravertebral muscles) of the muscular activity between the two paravertebral muscle groups EST (p = 0.002) and ESL (p = 0.03) was reported, but not between muscles group M. In particular, the right-side muscles (16.8 ± 5.8% EST and 17.6 ± 5.3% ESL) show increased activity compared to those on the left side (10.4 ± 5% EST and 12.9 ± 3.4%). This asymmetry is not observed on the workstation’s left side. However, on the left-side workstation, in the left paravertebral complex, the muscle M (13.1 ± 4.6%) shows significantly less activity than ESL (17.6 ± 5%) (p = 0.02). There are two other significant differences in the results, i.e., between the right and left side of workstations on two left paravertebral complexes EST (p = 0.008) and ESL (p = 0.04). The EST (14.7 ± 4.9%) and ESL (17.6 ± 5%) muscles on the left side of the workstation present a higher activity than the EST (10.4 ± 5%) and ESL (12.9 ± 3.4%) on the right one.
Finally, from Figure 7, it is possible to observe an expected behaviour, both on the paravertebral complexes of the left and right sides muscles and on both sides of the workstation, i.e., an ever-higher activity of the ESL muscles.

3.2. Kinematic Analysis

The kinematic signals related to trunk flexion forward angle (Figure 8 and Figure 9) were acquired and processed to obtain data shown in Table 2.
From both Figure 8 and Figure 9, it is possible to identify bending peaks of greater or lesser duration linked to specific operations (installation of the cabinet—single arrow—and assembly and wiring operations—double arrow).
Table 2 shows data on kinematic signal processing and refers only to static postures (postures held for at least 4 s consecutively) by considering the angle values within the range 20–60° and higher than 60°, according to ISO 11226. For this reason, postures below 20 degrees are not shown.
The average values (±SD) of the static trunk flexion posture angles recorded during working activities were 43 (±10.1) degrees for the left side and 44 (±6) degrees for the right side during the whole recorded working activity, showing no statistical difference (p > 0.05). The average values (±SD) of the total time in the static trunk flexion forward fixed posture recorded during the whole work activity were 21.8 (±4.8) s for the left side of the workstation and 20 (±3.9) s for the right side of the workstation. No statistical difference was found (p > 0.05). It is possible to state that the working activities on both sides are well balanced regarding the postural load of the trunk.

4. Discussion

The purpose of this study was to evaluate a combined methodological approach based on the concurrent use of sEMG and a set of inertial sensors for the quantitative risk assessment of biomechanical overload. Three automotive industry workers were enrolled to evaluate the biomechanical effort during the working activity in the assembly line.
The sEMG results suggest a significant involvement of trunk muscles in the studied working task. Indeed, the mean muscle activation values were between 10% and 20% of MVCs, particularly the Erector Spinae Lumbar Region and the Multifidus. According to kinematic data, these values refer to a quite relevant effort of trunk muscles and show a significant biomechanical load at the spine level. Moreover, these muscles have been studied because they have an independent function for stabilisation and are crucial for the stability and mobility of the lumbar spine, determining a main aetiological action for low back pain. The extent of alterations in the structure and muscle function of the paraspinal muscles could be related to the recurrence or chronicisation of low back pain [32]. Therefore, the results suggest that it is important to analyse this kind of work task in the real work environment to gain quantitative measurements to propose and verify ergonomic solutions and changes in work organisation for low back pain and musculoskeletal disorders prevention.
Moreover, sEMG RMS data show a significant difference between the muscle activity of the two body sides, identifying an asymmetry. These results relate to inherent trunk torsional components during dynamic movements when workers follow moving cars in their assembly activity. It is worth underlining that this muscular behaviour agreed with the preliminary observations of the working tasks before the experimental sessions. Further sEMG and kinematic studies will allow a better understanding of how trunk flexion and torsion are combined during tasks. This is important information considering the pathogenetic role of trunk bending and twisting.
About the kinematic motion analysis, the contribution to the biomechanical overload due to the static working posture of the trunk is made mainly by the flexion forward.
We decided to study trunk flexion for several reasons. The main risk factor for the emergence of low back diseases is non-neutral trunk postures, especially those requiring flexion [33]. Yet, over the past three decades, several quantitative techniques—such as electro-goniometers and inclinometers—have been created to obtain precise measurements of trunk postures in real working environments. Unfortunately, some of them require the application of additional external structures to the subject’s skin, which is uncomfortable and makes them unsuitable for long-term measurements [34]. In our opinion, sEMG appears to overcome all of these constraints, although additional field study is required to assess the overload of the arms specifically.
Both electromyographic and kinematic analysis results highlight a muscular effort in the various phases of the work cycle. Just comparing the signals (Figure 6 with Figure 8 and Figure 9) shows a higher muscle effort with a concomitant higher value of trunk flexion, from 20 to 40% of the cycle time and from 60 to 90% of the cycle time.
Another important aspect is the non-invasiveness of the methods applied. Furthermore, these techniques were well tolerated by the workers, and they did not interfere with their performance either. Beyond the company’s production needs, this aspect is essential for studying the muscles in real working conditions: the working gesture must not be altered by the possible encumbrance of the probes that the worker must minimally perceive. Moreover, it is necessary to verify that there are no physical interferences between the instruments and the working environment, specifically electromagnetic interference. To overcome this issue, in this research, a commercial system of sEMG probes was used; it communicates wirelessly with a device connected to a notebook that acquires and processes the signal. This is a closed system that, in this study, did not show interferences with the instrumentation on the production line, and no systematic signal distortions were observed in the kinematic data processing. Therefore, for this test, the two systems (sEMG and inertial sensors suites) were found to be simultaneously usable, both in terms of wearability and in the absence of interference in the reception of signals.
The results of this study confirm what has emerged from research in the literature, i.e., the contribution of information about the biomechanical overload, which the wearable sensor technology can provide. Another possible advantage could be integrating this information with current risk assessment methods to obtain a risk evaluation [16]. Concerning other research, this study provides data acquired in a working environment during real production. However, the research carried out needs to be improved.
Due to specific technical difficulties that arose during the execution of the surveys and that affected the suite of inertial sensors, it was not possible to focus attention on the movement’s lateral bending and torsional components. These technical difficulties have allowed improvements to be made to the software component of the suite.
Another limit is the sample number. The results of the electromyographic and kinematic data refer to only three subjects considered adequate for the type of study conducted (pilot study) but are limited in generalising the data. However, the study’s outcome was the applicability of the two methods under real working conditions: the obtained data highlighted the main aspects to be considered when applying a protocol that integrates sEMG and kinematics. Future research must necessarily lead to a study with a more significant number of subjects.
The electromyographic analysis then focused on studying amplitude parameters for quick information about muscle activation. Further studies for developing a validated risk assessment method will have to consider the analysis of fatigue and frequency parameters using specific validated protocols presented in the literature (EVA, JASA) [21].

5. Conclusions

This work presents a wearable wireless system that collects data to assess the biomechanical overload, characterised by the combined use of surface electromyography electrodes and a wearable inertial motion capture system. This approach proved that both methods give helpful information about parameters that can be used to evaluate the biomechanical load due to working postures. Future developments will include studies with a larger sample, further analysis of electromyographic signals, and possible integration with specific observational working methods (such as EAWS for the automotive sector).

Author Contributions

Conceptualization, M.G.L.M., F.D., F.C. and N.M.; methodology, M.G.L.M., F.D., and F.C.; formal analysis, L.F., A.M., A.S. and F.C.; investigation, M.G.L.M., A.M. and L.F.; data curation, M.G.L.M., A.M., L.F., E.M.G. and F.D.; writing—original draft preparation, M.G.L.M., A.M., E.M.G., L.F. and F.D.; writing—review and editing, M.G.L.M., A.M., L.F., F.D., A.S., F.C., M.M., E.M.G., N.M. and M.L.; supervision, M.G.L.M., N.M., F.C. and F.D. All authors have read and agreed to the published version of the manuscript.

Funding

This research received no external funding.

Data Availability Statement

The data presented in this study are available on reasonable request from the first author.

Acknowledgments

The authors acknowledge FCA S.p.A. for its availability for us to access the plant and carry out experimental sessions.

Conflicts of Interest

The authors declare no conflict of interest.

References

  1. Schneider, E.; Irastorzav, X. OSH in Figures: Work-Related Musculoskeletal Disorders in the EU—Facts and Figures. European Agency for Safety and Health at Work (EU-OSHA). 2010. Available online: https://osha.europa.eu/en/tools-and-publications/publications/reports/TERO09009ENC (accessed on 31 January 2023).
  2. Da Costa, B.R.; Vieira, E.R. Risk factors for work-related musculoskeletal disorders: A systematic review of recent longitudinal studies. Am. J. Ind. Med. 2010, 53, 285–323. [Google Scholar] [CrossRef]
  3. Punnett, L. Musculoskeletal disorders and occupational exposures: How should we judge the evidence concerning the causal association? Scand. J. Public. Health 2014, 42 (Suppl. S13), 49–58. [Google Scholar] [CrossRef] [Green Version]
  4. Bernard, P.B. Musculoskeletal Disorders and Workplace Factors: A Critical Review of Epidemiologic Evidence for Work-Related Musculoskeletal Disorders of Neck, Upper Extremity, and Low Back; National Institute for Occupational Safety and Health: Cincinnati, OH, USA, 1997. Available online: https://www.cdc.gov/niosh/docs/97-141/default.html (accessed on 31 January 2023).
  5. Takala, E.P.; Pehkonen, I.; Forsman, M.; Hansson, G.Å.; Mathiassen, S.E. Systematic evaluation of observational methods assessing biomechanical exposures at work. Scand. J. Work. Environ. Health 2010, 36, 3–24. [Google Scholar] [CrossRef] [PubMed] [Green Version]
  6. Kee, D.; Karwowski, W. A comparison of three observational techniques for assessing postural loads in industry. Int. J. Occup. Saf. Ergon. 2007, 13, 3–14. [Google Scholar] [CrossRef] [PubMed] [Green Version]
  7. Karhu, O.; Kansi, P.; Kuorinka, I. Correcting working postures in industry: A practical method for analysis. Appl. Ergon. 1977, 8, 199–201. [Google Scholar] [CrossRef] [PubMed]
  8. Brandl, C.; Mertens, A.; Schlick, C.M. Ergonomic analysis of working postures using OWAS in semi-trailer assembly, applying an individual sampling strategy. Int. J. Occup. Saf. Ergon. 2017, 23, 110–117. [Google Scholar] [CrossRef] [PubMed]
  9. McAttamney, L.; Corlett, E.N. RULA: A survey method for the investigation of work-related upper limb disorders. Appl. Ergon. 1993, 24, 91–99. [Google Scholar] [CrossRef] [PubMed]
  10. Hignett, S.; McAtamney, L. Rapid entire body assessment (REBA). Appl. Ergon. 2000, 31, 201–205. [Google Scholar] [CrossRef]
  11. Schaub, K.; Caragnano, G.; Britzke, B.; Bruder, R. The European Assembly Worksheet. Theor. Issues Ergon. Sci. 2013, 14, 616–639. [Google Scholar] [CrossRef]
  12. Vieira, E.R.; Kumar, S. Working postures: A literature review. J. Occup. Rehabil. 2004, 14, 143–159. [Google Scholar] [CrossRef]
  13. Blab, F.; Avci, O.; Daub, U.; Schneider, U. New approaches for analysis in ergonomics: From paper and pencil methods to biomechanical simulation. In 16. Internationales Stuttgarter Symposium; Bargende, M., Reuss, H.C., Wiedemann, J., Eds.; Springer: Wiesbaden, Germany, 2016. [Google Scholar] [CrossRef]
  14. Battini, D.; Persona, A.; Sgarbossa, F. Innovative real-time system to integrate ergonomic evaluations into warehouse design and management. Comput. Ind. Eng. 2014, 77, 1–10. [Google Scholar] [CrossRef]
  15. Ferguson, S.A.; Allread, G.W.; Le, P.; Rose, J.; Marras, W.S. Shoulder Muscle Fatigue During Repetetive Tasks as Measured by Electromyography and Near-Infrared Spectroscopy. Hum. Factors 2013, 55, 1077–1087. [Google Scholar] [CrossRef] [PubMed] [Green Version]
  16. Peppoloni, L.; Filippeschi, A.; Ruffaldi, E.; Avizzano, C.A. (WMSDs issue) A novel wearable system for the online assessment of risk for biomechanical load in repetitive efforts. Int. J. Ind. Ergon. 2015, 37, 563–571. [Google Scholar] [CrossRef]
  17. Vignais, N.; Miezal, M.; Bleser, G.; Mura, K.; Gorecky, D.; Marin, F. Innovative system for real-time ergonomic feedback in industrial manufacturing. Appl. Ergon. 2013, 44, 566–574. [Google Scholar] [CrossRef] [PubMed]
  18. Vignais, N.; Bernard, F.; Touvenot, G.; Sagot, J.C. Physical risk factors identification based on body sensor network combined to videotaping. Appl. Ergon. 2017, 65, 410–417. [Google Scholar] [CrossRef] [PubMed]
  19. Ghasemzadeh, H.; Jafari, R.; Prabhakaran, B. A Body Sensor Network with Electromyogram and Inertial Sensors: Multi-Modal Interpretation of Muscular Activities. IEEE Trans. Inf. Technol. Biomed. 2010, 14, 198–206. [Google Scholar] [CrossRef]
  20. Ranavolo, A.; Draicchio, F.; Varrecchia, T.; Silvetti, A.; Iavicoli, S. Wearable Monitoring Devices for Biomechanical Risk Assessment at Work.: Current Status and Future Challenges—A Systematic Review. Int. J. Environ. Res. Public Health 2018, 15, 2001. [Google Scholar] [CrossRef] [Green Version]
  21. Merletti, R.; Farina, D. Surface Electromyography: Physiology, Engineering and Applications; IEEE Press/J Wiley: Hoboken, NJ, USA, 2016. [Google Scholar] [CrossRef]
  22. Pigini, L.; Colombini, D.; Rabuffetti, M.; Ferrarin, M. Tecniche di acquisizione ed analisi del segnale elettromiografico per lo studio del sovraccarico biomeccanico occupazionale. Med. Lav. 2010, 101, 118–133. [Google Scholar]
  23. Draicchio, F.; Silvetti, A.; Ranavolo, A. Il contributo dell’elettromiografia di superficie (sEMG) alla valutazione del rischio biomeccanico nelle attività industriali. G. Ital. Med. Lav. Erg. 2011, 33, 226–229. [Google Scholar]
  24. Filippeschi, A.; Schmitz, N.; Miezal, M.; Bleser, G.; Ruffaldi, E.; Stricker, D. Survey of Motion Tracking Methods Based on Inertial Sensors: A Focus on Upper Limb Human Motion. Sensors 2017, 17, 1257. [Google Scholar] [CrossRef] [Green Version]
  25. Caputo, F.; Greco, A.; D’Amato, E.; Notaro, I.; Lo Sardo, M.; Spada, S.; Ghibaudo, L. A Human Postures Inertial Tracking System for Ergonomic Assessments (Conference Paper). In Proceedings of the 20th Congress of the International Ergonomics Association (IEA 2018), Florence, Italy, 26–30 August 2018; Bagnara, S., Tartaglia, R., Albolino, S., Alexander, T., Fujita, Y., Eds.; Advances in Intelligent Systems and Computing; Springer: Cham, Switzerland, 2018; Volume 825. [Google Scholar] [CrossRef]
  26. Poitras, I.; Bielmann, M.; Campeau-Lecours, A.; Mercier, C.; Bouyer, L.J.; Roy, J.-S. Validity of Wearable Sensors at the Shoulder Joint: Combining Wireless Electromyography Sensors and Inertial Measurement Units to Perform Physical Workplace Assessments. Sensors 2019, 19, 1885. [Google Scholar] [CrossRef] [PubMed] [Green Version]
  27. Merino, G.; da Silva, L.; Mattos, D.; Guimarães, B.; Merino, E. Ergonomic evaluation of the musculoskeletal risks in a banana harvesting activity through qualitative and quantitative measures, with emphasis on motion capture (Xsens) and EMG. Int. J. Ind. Ergon. 2019, 69, 80–89. [Google Scholar] [CrossRef]
  28. Monaco, M.G.L.; Fiori, L.; Marchesi, A.; Greco, A.; Ghibaudo, L.; Spada, S.; Caputo, F.; Miraglia, N.; Draicchio, F. Biomechanical overload evaluation in manufacturing: A novel approach with sEMG and inertial motion capture integration(Conference Paper). In Proceedings of the 20th Congress of the International Ergonomics Association (IEA 2018), Florence, Italy, 26–30 August 2018; Bagnara, S., Tartaglia, R., Albolino, S., Alexander, T., Fujita, Y., Eds.; Advances in Intelligent Systems and Computing; Springer: Cham, Switzerland, 2018. [Google Scholar] [CrossRef]
  29. Barbero, M.; Merletti, R.; Rainoldi, A. Atlas of Muscle Innervation Zones: Understanding Surface Electromyography and Its Applications; Springer: Milan, Italy, 2012. [Google Scholar] [CrossRef]
  30. Varrecchia, T.; De Marchis, C.; Rinaldi, M.; Draicchio, F.; Serrao, M.; Schmid, M.; Conforto, S.; Ranavolo, A. Lifting activity assessment using surface electromyographic features and neural networks. Int. J. Ind. Ergon. 2018, 66, 1–9. [Google Scholar] [CrossRef]
  31. Ranaldi, S.; De Marchis, C.; Conforto, S. An automatic, adaptive, information-based algorithm for the extraction of the sEMG envelope. J. Electromyogr. Kinesiol. 2018, 42, 1–9. [Google Scholar] [CrossRef]
  32. Goubert, D.; De Pauw, R.; Meeus, M.; Willems, T.; Cagnie, B.; Schouppe, S.; Van Oosterwijck, J.; Dhondt, E.; Danneels, L. Lumbar muscle structure and function in chronic versus recurrent low back pain: A cross-sectional study. Spine J. 2017, 17, 1285–1296. [Google Scholar] [CrossRef]
  33. Wai, E.K.; Roffey, D.M.; Bishop, P.; Kwon, B.K.; Dagenais, S. Causal assessment of occupational bending or twisting and low back pain: Results of a systematic review. Spine J. 2010, 10, 76–88. [Google Scholar] [CrossRef]
  34. Porta, M.; Pau, M.; Orrù, P.F.; Nussbaum, M.A. Trunk Flexion Monitoring among Warehouse Workers Using a Single Inertial Sensor and the Influence of Different Sampling Durations. Int. J. Environ. Res. Public Health 2020, 17, 7117. [Google Scholar] [CrossRef]
Figure 1. Working activity on the right side of the workstation.
Machines 11 00417 g001
Figure 2. Working activity on the left side of the workstation.
Machines 11 00417 g002
Figure 3. Example of the correct positioning of the electrode for EST assessment (a) and its placement on the operator’s back (b).
Machines 11 00417 g003
Figure 4. Isometric contraction test (maximum voluntary contraction) for the Erector Spinal muscles. The figure shows the prone position of the worker who performed a back extension involving the whole paravertebral musculature.
Machines 11 00417 g004
Figure 5. Wearable motion capture system, in upper-body configuration: (a) scheme; (b) equipped by the worker.
Machines 11 00417 g005
Figure 6. Average values (solid black line) and standard error of the mean (SEM) (light and dark grey coloured areas, left and right sides muscles, respectively) of the muscle activity of paravertebral muscles (Erector Spinae Thoracic (EST), Erector Spinae Lumbar (ESL), and Multifidus (M)) from three workers (W1, W2, and W3) at the left and right workstations, respectively.
Machines 11 00417 g006
Figure 7. Muscle activity average values of overall paravertebral muscles (M—Multifidus; EST—Erector Spinae Thoracic region; ESL—Erector Spinae Lumbar region). The comparison between the right and left side of the workstation (BLUE stars across the two sides of the workstation) and between the right and left muscles of the same side of the workstation (YELLOW stars on the same side of the workstation) show a statistical difference in the activation among the different muscle groups (* p value).
Machines 11 00417 g007
Figure 8. Kinematic signal of trunk flexion forward in one working cycle (right side of the workstation).
Machines 11 00417 g008
Figure 9. Kinematic signal of trunk flexion forward in one working cycle (left side of the workstation).
Machines 11 00417 g009
Table 1. The mean values (±SD) of the muscle activity are expressed as a percentage of MVCs.
W1W2W3
Trunk Muscle SideTrunk Muscle SideTrunk Muscle Side
Right side of the workstationLeftRightLeftRightLeftRight
EST6.7 ± 1.916.9 ± 2.78.9 ± 2.410.5 ± 2.215.7 ± 523 ± 3
ESL10.4 ± 1.714.2 ± 3.614.6 ± 3.822 ± 613.7 ± 3.216.5 ± 2.8
M10.1 ± 215.5 ± 2.712.9 ± 49.9 ± 2.214 ± 1.418.2 ± 2.8
Left side of the workstationLeftRightLeftRightLeftRight
EST9.5 ± 1.6Left17.2 ± 5.311.7 ± 2.317.2 ± 1.623.4 ± 4
ESL18.5 ± 5.712.9 ± 2.820.6 ± 4.125.2 ± 7.413.6 ± 2.415.7 ± 2.7
M14 ± 6.913.8 ± 4.311.2 ± 2.214.6 ± 6.714.2 ± 3.417.8 ± 4.4
W—worker; EST—Erector Spinae Thoracic region; ESL—Erector Spinae Lumbar region; M—Multifidus.
Table 2. Trunk flexion forward static posture data analysis: mean and peak flexion forward angle and duration values.
Reference Ranges20–60°>60°
W1W2W3W1W2W3
Right side of the workstationMean value (±SD) [°]40.63 ± 6.2539.32 ± 11.3546.40 ± 4.29-77.90 ± 8.23-
Peak value [°]50.71 ± 4.9654.41 ± 3.7456.55 ± 2.97-86.52 ± 8.60-
Mean value (±SD) of posture duration [t]19.54 ± 2.5812.00 ± 6.6922.18 ± 1.71010.82 ± 1.650
Posture duration in % of working cycle [%]3421380190
Left side of the workstationMean value (±SD) [°]38.83 ± 5.6137.26 ± 5.2843.15 ± 6.00-82.77 ± 4.9965.29 ± 1.42
Peak value [°]49.84 ± 7.8650 ± 6.6156.52 ± 3.52-94.06 ± 6.4771.01 ± 0.87
Mean value (±SD) of posture duration [t]17.32 ± 5.7511.83 ± 3.4016.85 ± 3.84017.89 ± 7.156.37 ± 2.72
Posture duration in % of working cycle [%]30202903111
Disclaimer/Publisher’s Note: The statements, opinions and data contained in all publications are solely those of the individual author(s) and contributor(s) and not of MDPI and/or the editor(s). MDPI and/or the editor(s) disclaim responsibility for any injury to people or property resulting from any ideas, methods, instructions or products referred to in the content.

