Article

Parameter Identification of Switched Reluctance Motor SRM Using Exponential Swept-Sine Signal

1
SECNDCM Team, ENSAM AEEE Department L2MC Laboratory, Meknes 50050, Morocco
2
Department of Mechatronics ESIX, University of Caen Normandie, Campus 2, Building Sciences 2 Office S2, 14032 Caen, France
3
Electrical Department, College of Engineering, Princess Nourah Bint Abdulrahman University, Riyadh 11671, Saudi Arabia
4
Department of Physics, College of Sciences, Princess Nourah Bint Abdulrahman University, Riyadh 11671, Saudi Arabia
5
Electrical Engineering Department, Faculty of Engineering, Damietta University, Damietta 34511, Egypt
6
Electrical & Electronics Engineering Technology Department, Yanbu Industrial College (YIC), Royal Commission Yanbu Colleges & Institutes, Yanbu 46452, Saudi Arabia
*
Author to whom correspondence should be addressed.
Machines 2023, 11(6), 625; https://doi.org/10.3390/machines11060625
Submission received: 4 May 2023 / Revised: 26 May 2023 / Accepted: 30 May 2023 / Published: 5 June 2023
(This article belongs to the Section Electrical Machines and Drives)

Abstract

:
Switched reluctance motors (SRMs) received major interest in several domains, e.g., in electric vehicles. This interest is due to the many advantages of SRMs, including operation at a wide range of speeds, high performances, low cost, robustness to run under degraded conditions, and controllability. One of the major aspects in the design and implementation of controllers for SRMs is the estimation of the motor parameters. An accurate estimate of these parameters is a challenge due to the highly nonlinear behavior of SRMs in addition to their magnetic saturated operating mode to maximize the energy transfer. This paper aims at estimating the parameters of SRM by developing a new SRM model using an analytical technique. The proposed technique is based on a parallel connection of several Hammerstein models that have polynomial nonlinearity. The model is driven by a swept-sine signal, and then finite element method analysis is performed to estimate the SRM parameters. The effectiveness of the proposed method is highlighted by numerical simulation. All these simulations were performed using MATLAB/SIMULINK.

1. Introduction

The rising levels of greenhouse gas emissions and other issues associated with the use of fossil fuels have caused a surge in the use of renewable energy sources and electric vehicles (EVs) [1]. One of the essential components of EVs is the electric motor, and the Switching Reluctance Motor (SRM) is becoming increasingly popular as a candidate for EVs due to its simplicity, affordability, convenience, and robust build. The majority of losses in SRM occur in the stator since there is no rotor winding, permanent magnet, or brushes [2]. Additionally, because each phase is electrically and magnetically independent of the other phases, SRM has a strong and resilient ability to operate under failure conditions. These features make this machine find many applications, not only as a motor but also as a generator in wind energy applications, switched reluctance generators (SRGs) [3]. The key constraint to taking advantage of these benefits is the extremely nonlinear electromechanical behavior of SRMs, which means that the output torque is highly dependent on pole geometry due to saliency. Furthermore, this torque is dependent on stator currents and rotor positions. As a result, having an accurate motor model that specifies the torque is critical for achieving high-dynamic performance in either torque or speed control applications [4,5]. The main key to the proper design of any controller for any motors as well as SRMs is the accurate estimation of the machine parameters. What increases the difficulty and complexity of the estimation process of any machine parameters and makes it challenging is the model nonlinearity. SRMs have a double-salient structure and magnetic saturation that make the model of this motor of high nonlinearity [6].
Numerous efforts have been made in the literature to estimate the parameters of the switched reluctance motor (SRM), based on a proposed model for SRMs. These SRM models can be classified as either basic or analytical methods. It is noteworthy that the most of previous work on SRM modeling is based on the basic method, and only a handful of studies have explored the analytical model.
Various techniques have been suggested to model and determine the SRMs parameters. In [7], a method is proposed to identify the physical properties of the motor. This method can perform well under specific conditions such as high signal-to-noise ratios and no variations in the system being examined over time. In [4], a geometric identification method is proposed to obtain the SRM magnetization characteristics, but this approach requires multiple experiments at different frequencies [8,9]. As the conditions used to estimate SRM parameters are altered, the accuracy of the estimation process cannot be guaranteed. This drawback has given rise to the use of analytical methods for SRM parameter estimation.
The most used nonlinear models are the black-box structures.
Among the well-known block-oriented nonlinear models:
-
The Hammerstein model, which is constituted by a nonlinear block flowed by a linear block. In [10], the authors present an identification method using an input excitation, designed to decouple the linear subsystem from the nonlinear element. Therefore, the system parameter identification is coped using a least squares estimator enjoying the consistency property.
-
Wiener model is a linear block followed by a nonlinear block. In [11] the authors present an identification method without requiring any prior knowledge of the nonlinearity. Using sine excitations and getting benefit from model plurality, the initial identification problem is made equivalent to two tractable (though still nonlinear) prediction-error problems.
-
Hammerstein-Wiener model is constituted by a linear block surrounded by two nonlinearities. In [12], the authors suggested a system identification approach. The input nonlinearity is considered the backlash type.
-
Wiener-Hammerstein model is obtained when two linear blocks surround a nonlinear block. In [13], a technique, based on random-phase multi-sine, for identifying Wiener and Hammerstein models is developed [8]. Then, identification techniques, based on frequency methods, have been proposed in the literature for Hammerstein models [14]. The review about the SRM identification is summarized in Table 1.
This work proposes an analytical nonlinear model of SRM to overcome the shortcomings of experimental tests. The parameters of SRM can be easily and efficiently determined. Furthermore, this method provides accuracy in terms of flux-linkage characteristics. Then, this solution is fast, simple, and enables easy identification of the SRM model parameters.
This paper suggests a validation of the current approach by conducting a study on the mean squared error (MSE). Moreover, the study includes a comparison with relevant literature. One key advantage of the approach is the development of an analytical nonlinear model for the SRM. The parameters of this nonlinear model can vary according to the rotor position (0°, 15°, and 30°), which permits the identification of its parameters through input and output data alone. A previous work [18] discussed a parametric identification technique for only one rotor position of the SRM (blocked rotor).
Unlike in [18], the phase resistor is not neglected. In the solution proposed in [18], the authors have not dealt with the estimation of the inductance parameters. However, in the present paper, the inductance profile has been established.
In [17] the model of the switched reluctance motor (SRM) has only been performed at a standstill test, which is a limited way to evaluate its performance. Accordingly, the authors have not discussed the error problem and other performances (e.g., MSE,…).
The contribution of the paper can be summarized as:
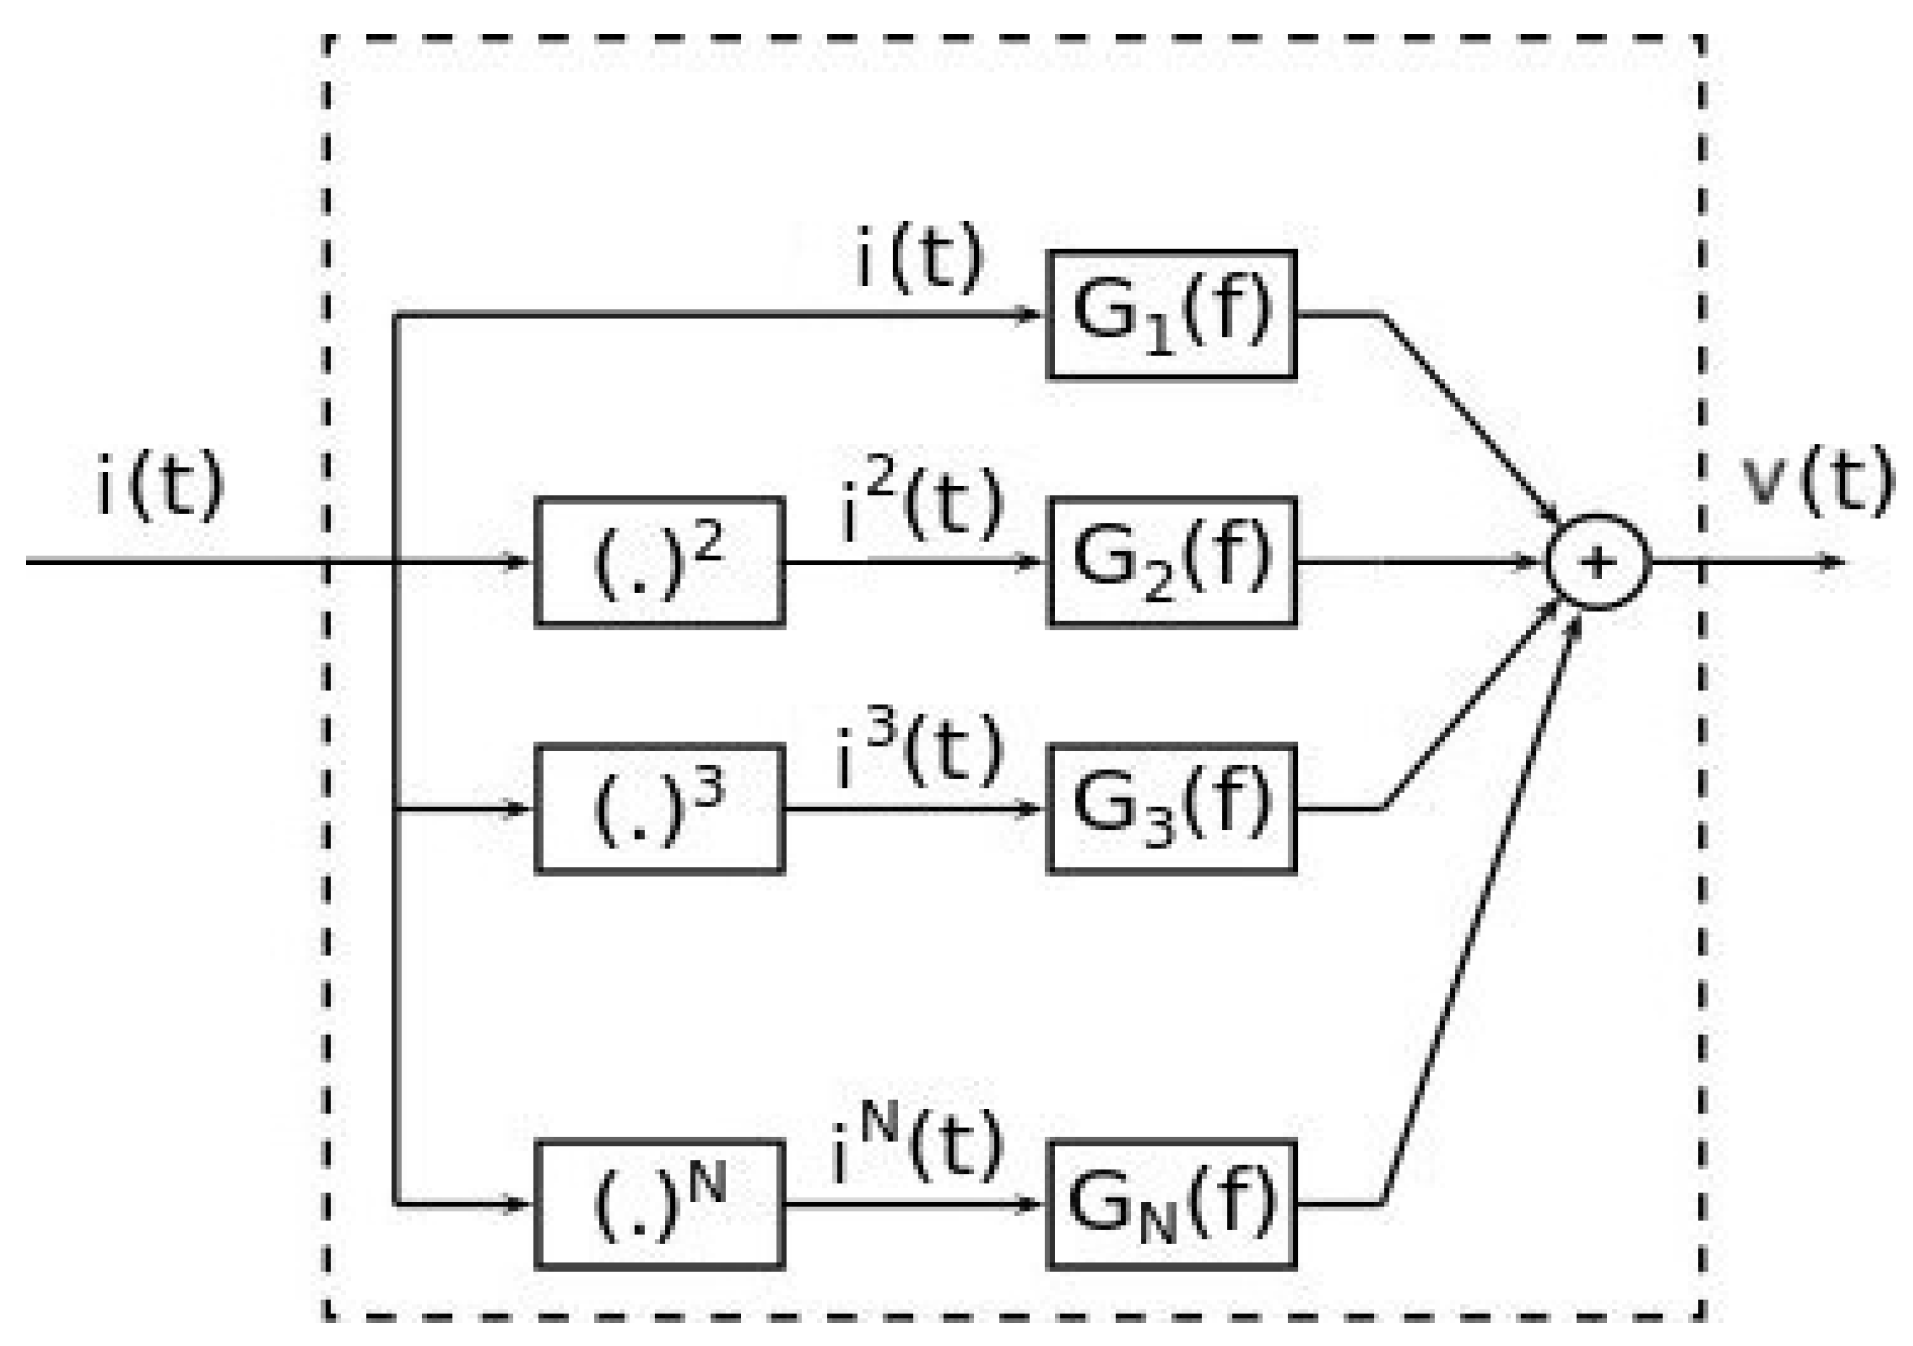
  • A generalized Hammerstein model (GHM), describing the nonlinear behavior of SRM, is developed.
  • The SRMs model can be simplified to a set of cascading nonlinear and linear blocks, called GHM.
  • It is shown that the linear parts of the model can be identified using only the input and output signals.
  • An analytical model describing accurately the switched reluctance machine is developed. Then, an identification method is proposed allowing us to determine the model parameters.
  • Using the identified parameters, the inductance, and the flux linkage characteristics can be obtained.
The paper is divided into five sections. Section 2 outlines the identification problem, Section 3 delves into the equations and modeling of the machine’s SRM behavior, the results of this method are checked through examples of simulations in Section 4, and in Section 5 we provide the specifics of parameter identification.

2. Switched Reluctance Motor Modeling

2.1. Electrical Model

The SRM generates a reluctance torque by having a greater number of stator teeth than rotor teeth, particularly when a rotor pole aligns with an exciting phase. The winding inductance L of the SRM is affected by both the current i and the position of the rotor θ , owing to its dual saliency [16]. As a result, it is feasible to articulate the voltage of the phase winding for any phase “m” within the SRM [19,20]. The voltage has the following expression:
V = R i + d φ d t = R i + d L θ , i i d t
An applied voltage V across phase m , along with winding resistance R , φ is the total flux-linkage of the coil, and inductance L ( θ , i ) associated with the phase, are all factors in play.
Expanding the final term in Equation (1) yields the following result without delay [18]:
V = R i + L θ , i d i d t + i L θ , i θ ω + L θ , i i d i d t
where the induced back-electromotive force emf is given as follows [20,21,22]:
e m f = i L θ , i θ ω
The e m f is a voltage that opposes the applied voltage and is induced due to the motion of the rotor in the magnetic field. The e m f depends on various factors, including the speed of the rotor, the magnetic flux linkage, and the characteristics of the motor’s windings. Considering that the simulations are performed under stationary conditions, the electromagnetic force (emf) becomes zero [23,24,25,26]. Typically, the resistive voltage drop across the windings of the synchronous reluctance generator (SRG) is minimal and is commonly ignored [27]. As a result, the voltage across phase resistor ( R i ) in the SRG windings is generally of negligible value and can be disregarded [27,28]. Therefore, the equation for the phase winding voltage (2a) can be expressed as [23]:
V = L θ , i d i d t + i L θ , i i d i d t
It should be noted that some previous studies have utilized a polynomial approximation for the phase inductance (i.e., L θ , i = k = 0 n i k j = 0 m α j , k θ j ) without providing a justification, as seen in [24,25,26]. However, it is important to highlight that the phase inductance curve with respect to current (i) is a continuous function, as shown in [27]. Therefore, the inductance for a specific position ( θ ) can be represented by a polynomial function, as stated in [18]:
L θ , i = k = 0 n α k i k
The degree of the polynomial function that describes L ( θ , i ) , as well as its parameters, are uncertain and may vary according to the interval of i . Using the Equations (3) and (4), the voltage across the phase winding can be expressed as [18]:
V = k = 0 n α k ( k + 1 ) i k d i d t
This expression can be written as:
V = α 0 d i d t + α 1 d i 2 d t + + α n d i n d t
This expression can be generalized as:
V = k = 0 n α k d i k + 1 d t
It is important to highlight that, using (5c), the phase winding voltage V can be accurately obtained using a polynomial GHM [18] (as illustrated by Figure 1), where its input is the phase current i . In this model, all linear blocks are described by a derivative action. Specifically, the transfer functions of the linear part are given as G s = α k s for k = 0 n . Additionally, the only unknown parameters in this structure G k s are the coefficient α k for k = 0 n .
It is noted that the polynomial approximations have been suggested, e.g., in most of these studies, the polynomial degree was arbitrarily chosen without any justification.

2.2. Mechanical Modeling of SRM

The mathematical expression below illustrates the torque produced by a single phase, where the symbol used to represent co-energy is denoted by:
T m = d W d θ
The symbol W is used to represent the co-energy. By summing up the torques produced by each phase, the total instantaneous torque can be obtained. This leads to the following expression for the mechanical equation, as mentioned in [6,28,29]:
d Ω d t = 1 J T m T L f Ω
where J   i s   t h e   i n e r t i a   m o m e n t   o f   t h e   r o t o r , T L is the load torque and f is the friction coefficient.

3. Swept Sine Identification Method for GHM
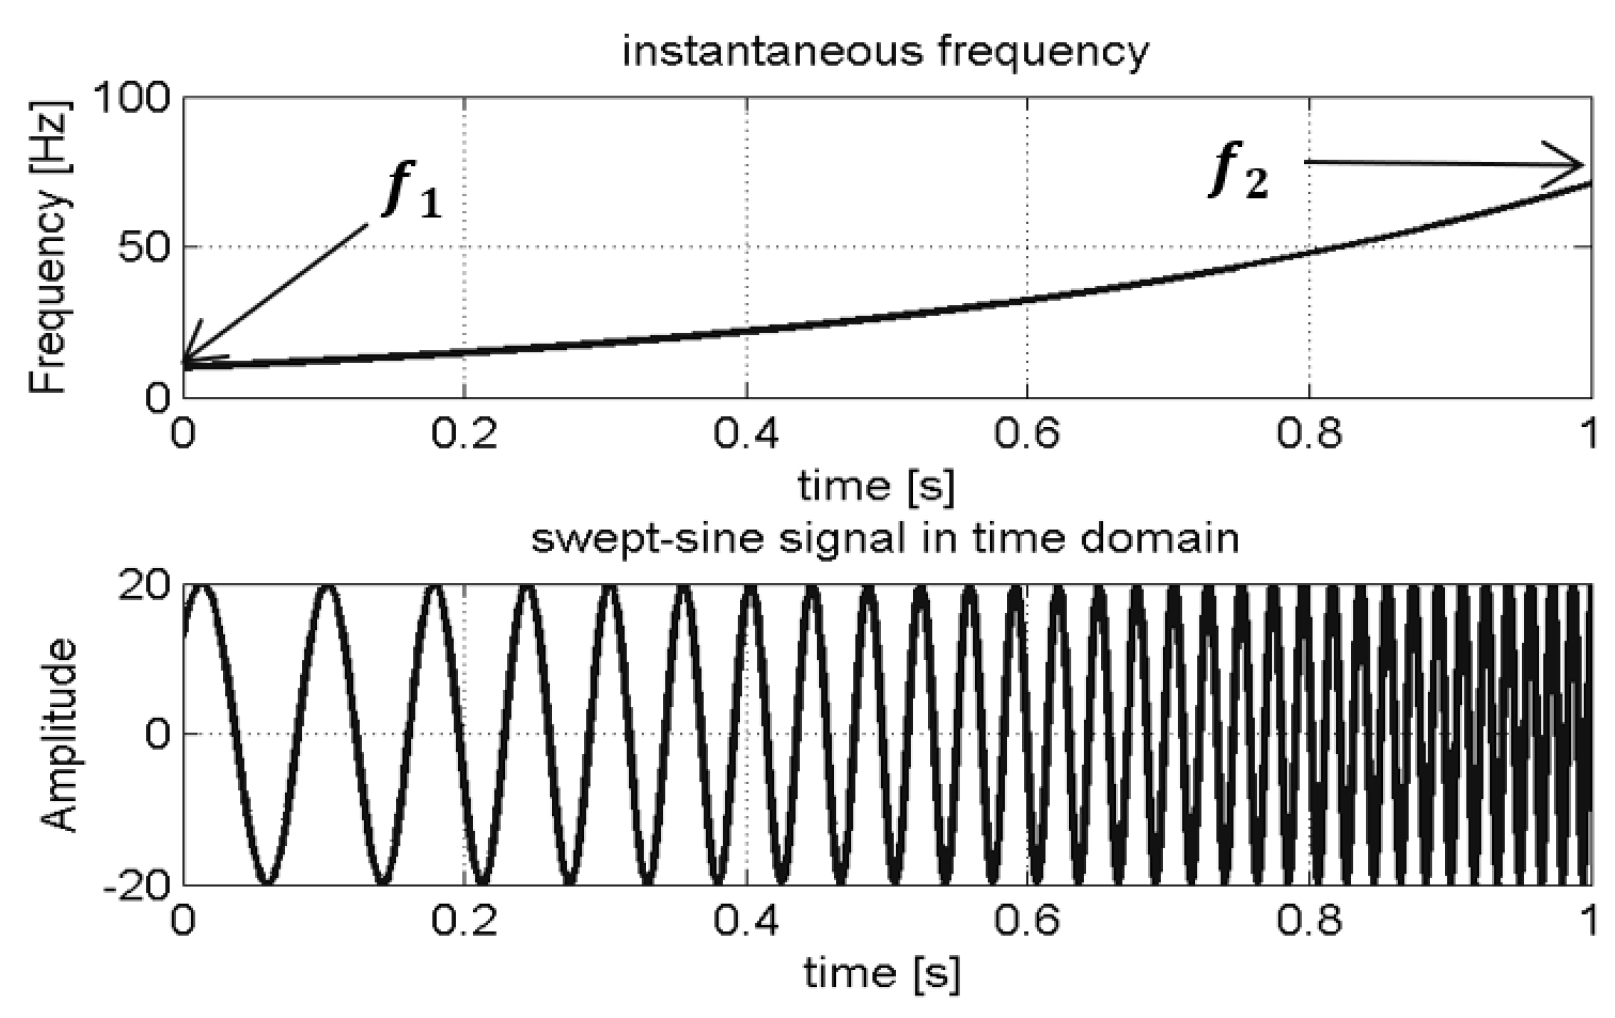
This section presents a technique for determining SRM parameters using the GHM. The approach involves utilizing a frequency identification solution to identify the SRM parameters. However, traditional frequency identification methods require the use of a sine wave as an excitation signal, which results in the need for multiple experiments at different frequencies. To avoid this inconvenience, the proposed method utilizes a swept-sine signal, also referred to as a chirp wave, which is characterized by a variable instantaneous frequency (Figure 2). This eliminates the need for repeated experiments.
The method proposed in this study is founded on nonlinear convolution, a technique originally employed for identifying the impulse response of linear systems [7] and later adapted for nonlinear systems. Nonlinear system identification using nonlinear convolution is based on the principle of detecting multiple harmonics produced by non-linearity, facilitating the separation and extraction of diverse impulse responses.
To eliminate the need for multiple experiments, the proposed frequency approach utilizes an exponential chirp signal denoted as s(t). The SRM parameters can be estimated by solely utilizing the input signal s t (i.e., phase current i ) and output signals y t (i.e., phase winding voltage V ).
Firstly, the frequency range of the input signal s t is labeled as f 1 , f 2 , with f 1 denoting the initial frequency and f 2 representing the final frequency of the signal. Furthermore, the inverse filter s i n v (t) of s t is introduced and defined as:
s t s i n v t = δ t
where δ ( t ) represents the Dirac impulse. Specifically, the expression for s i n v (t) can be expressed as follows:
s i n v t = f 1 L e t L s t
Denoting the Fourier transform of s i n v t and s t as S i n v f and S f , respectively, we can use the formula S i n v f = 1 S f (which can be derived from (5)) to obtain S i n v f . Using this result, we can express the nonlinear convolution product of y(t) and s i n v t :
s i n v t * y t = m = 1 N h m t + Δ t m
The term h m t in the expression represents the higher order impulse responses, while Δ t m represents the time difference between the linear impulse response (of order m = 1 ) [18] and the nonlinear impulse response of order (with m > 1 ). We can also represent these impulse responses in the frequency domain using their Fourier transform (TF) h m t . By using the following formula, we can directly determine the frequency response functions H m f :
H m f = TF h m t

Swept-Sine Wave

A swept-sine signal is commonly used in various fields, such as sonar, radar, communications, and acoustics [30,31]. Mathematically, a swept-sine wave can be defined as:
s ( t ) = a ( t ) sin ( φ ( t ) )
The amplitude a(t) in Equation (9c) can either be constant or varying, while the argument φ(t), also known as the instantaneous frequency, increases exponentially with time:
φ t = 2 π f 1 L e t L
The parameter L is dependent on both the frequency band and the duration of the signal. Using Equations (9b) and (9c), the signal s(t) can be expressed as shown in Equation (10):
s t = a t . sin ( 2 π f 1 L . exp t / L )
A swept-sine wave typically has a low crest factor and a non-flat amplitude spectrum. This waveform involves a frequency band with a lower Signal-to-Noise Ratio (SNR). Suppose the minimum and maximum frequencies of the selected band are denoted as f 1 and f 2 , respectively, and the duration is represented as T . In that case, the parameters T , L , f 1 , and f 2 are related via the following Equation [18]:
L = T ln f 2 f 1
The impulse response h t can be expressed as a sum of higher harmonic impulse responses h m t that are separated by time delays Δ t m :
h ( t ) = m = 1 N h m t + Δ t m
At the instant of time Δ t m , the signal s ( t ) equals zero s ( Δ t m ) = 0 . Then, it is readily seen that the time Δ t m satisfies:
Δ t m = L · ln ( m )
When linear and nonlinear blocks are connected in series, it can be challenging to distinguish between them using only the input signal s t and the output signal y t . To address this issue, a separation approach is proposed that involves deconvolving the two signals s t and y t .
It’s worth noting that a sinusoidal signal of frequency f 0 , when used to excite a nonlinear system, results in the generation of multiple higher-order harmonics by the nonlinear block. As a result, the presence of harmonic distortion can be detected by observing the appearance of harmonic components at frequencies that are multiples of the excitation frequency 2 f 0 , 3 f 0 , , N f 0 . The output of the GHM (Figure 1) can be expressed as a special case of the (diagonal) Volterra model [31,32], where the power terms . n , where n = 1 N , play a crucial role in generating harmonic distortion by multiplying frequencies in the system output. Thus, the system output of the GHM (Figure 1) can be represented as:
y ( t ) = g 1 ( t ) x ( t ) + + g n ( t ) x n ( t )
The GHM can be seen as a special case of the (diagonal) Volterra model that assumes no interactions between different time delays. By considering only the diagonal elements of the Volterra kernels. The (diagonal) Volterra model can be expressed mathematically as:
y t = H n 1 , n 2 , , n m s t n 1 s t n 2 s t n m
where:
  • y t is the output of the system at time t,
  • s t is the input of the system at time t,
  • H n 1 , n 2 , , n m represents the Volterra kernel coefficients for a specific set of time delays n 1 , n 2 , , n m , m denotes the order of the Volterra model, and the represents the summation over all possible combinations of delays n 1 , n 2 , , n m .
These Equations represent the mathematical formulations of the GHM and the (diagonal) Volterra model.
This can be rewritten as follows:
y ( t ) = n = 1 N g n ( t ) x n ( t )
The proposed identification method aims to establish a relationship between the partial frequency response H m f and the linear filter G n f , where H m f and G n f represent the Fourier transformation of h m t and g n t respectively. To achieve this, the frequency response of the linear filters G n f in the power series nonlinear model can be computed analytically using trigonometric power formulas.
H m ( f ) = n = 1 N A n , m G n ( f )
The connection between the average output signal and the partial frequency response, H m f , for f > 0, in the power series nonlinear model is established through the matrix A coefficients. The mth harmonic of each frequency response, Hm(f), can be obtained by combining the mth harmonics of all the n-th powers, weighted by the linear filters G n f . The specific coefficients for the mth harmonic of the n-th power are denoted as A n , m .

4. Simulation Results and Discussion

A swept-sine signal is employed in this study to develop a frequency identification method. This signal has a frequency band with sufficiently high harmonics, enabling the identification of SRM parameters through a single experiment. The SRM’s electrical model can be described by a polynomial GHM, where the phase current i t is the input signal, and the phase winding voltage v t is the system output (Section 2). The operating frequency starts from an initial frequency f 1 = 10   H z and increases exponentially to a final frequency f 2 = 500   H z (Figure 2). The frequency band is selected based on the stator and rotor iron saturation range.
Actual Inductance calculation using FEM software involves the following steps:
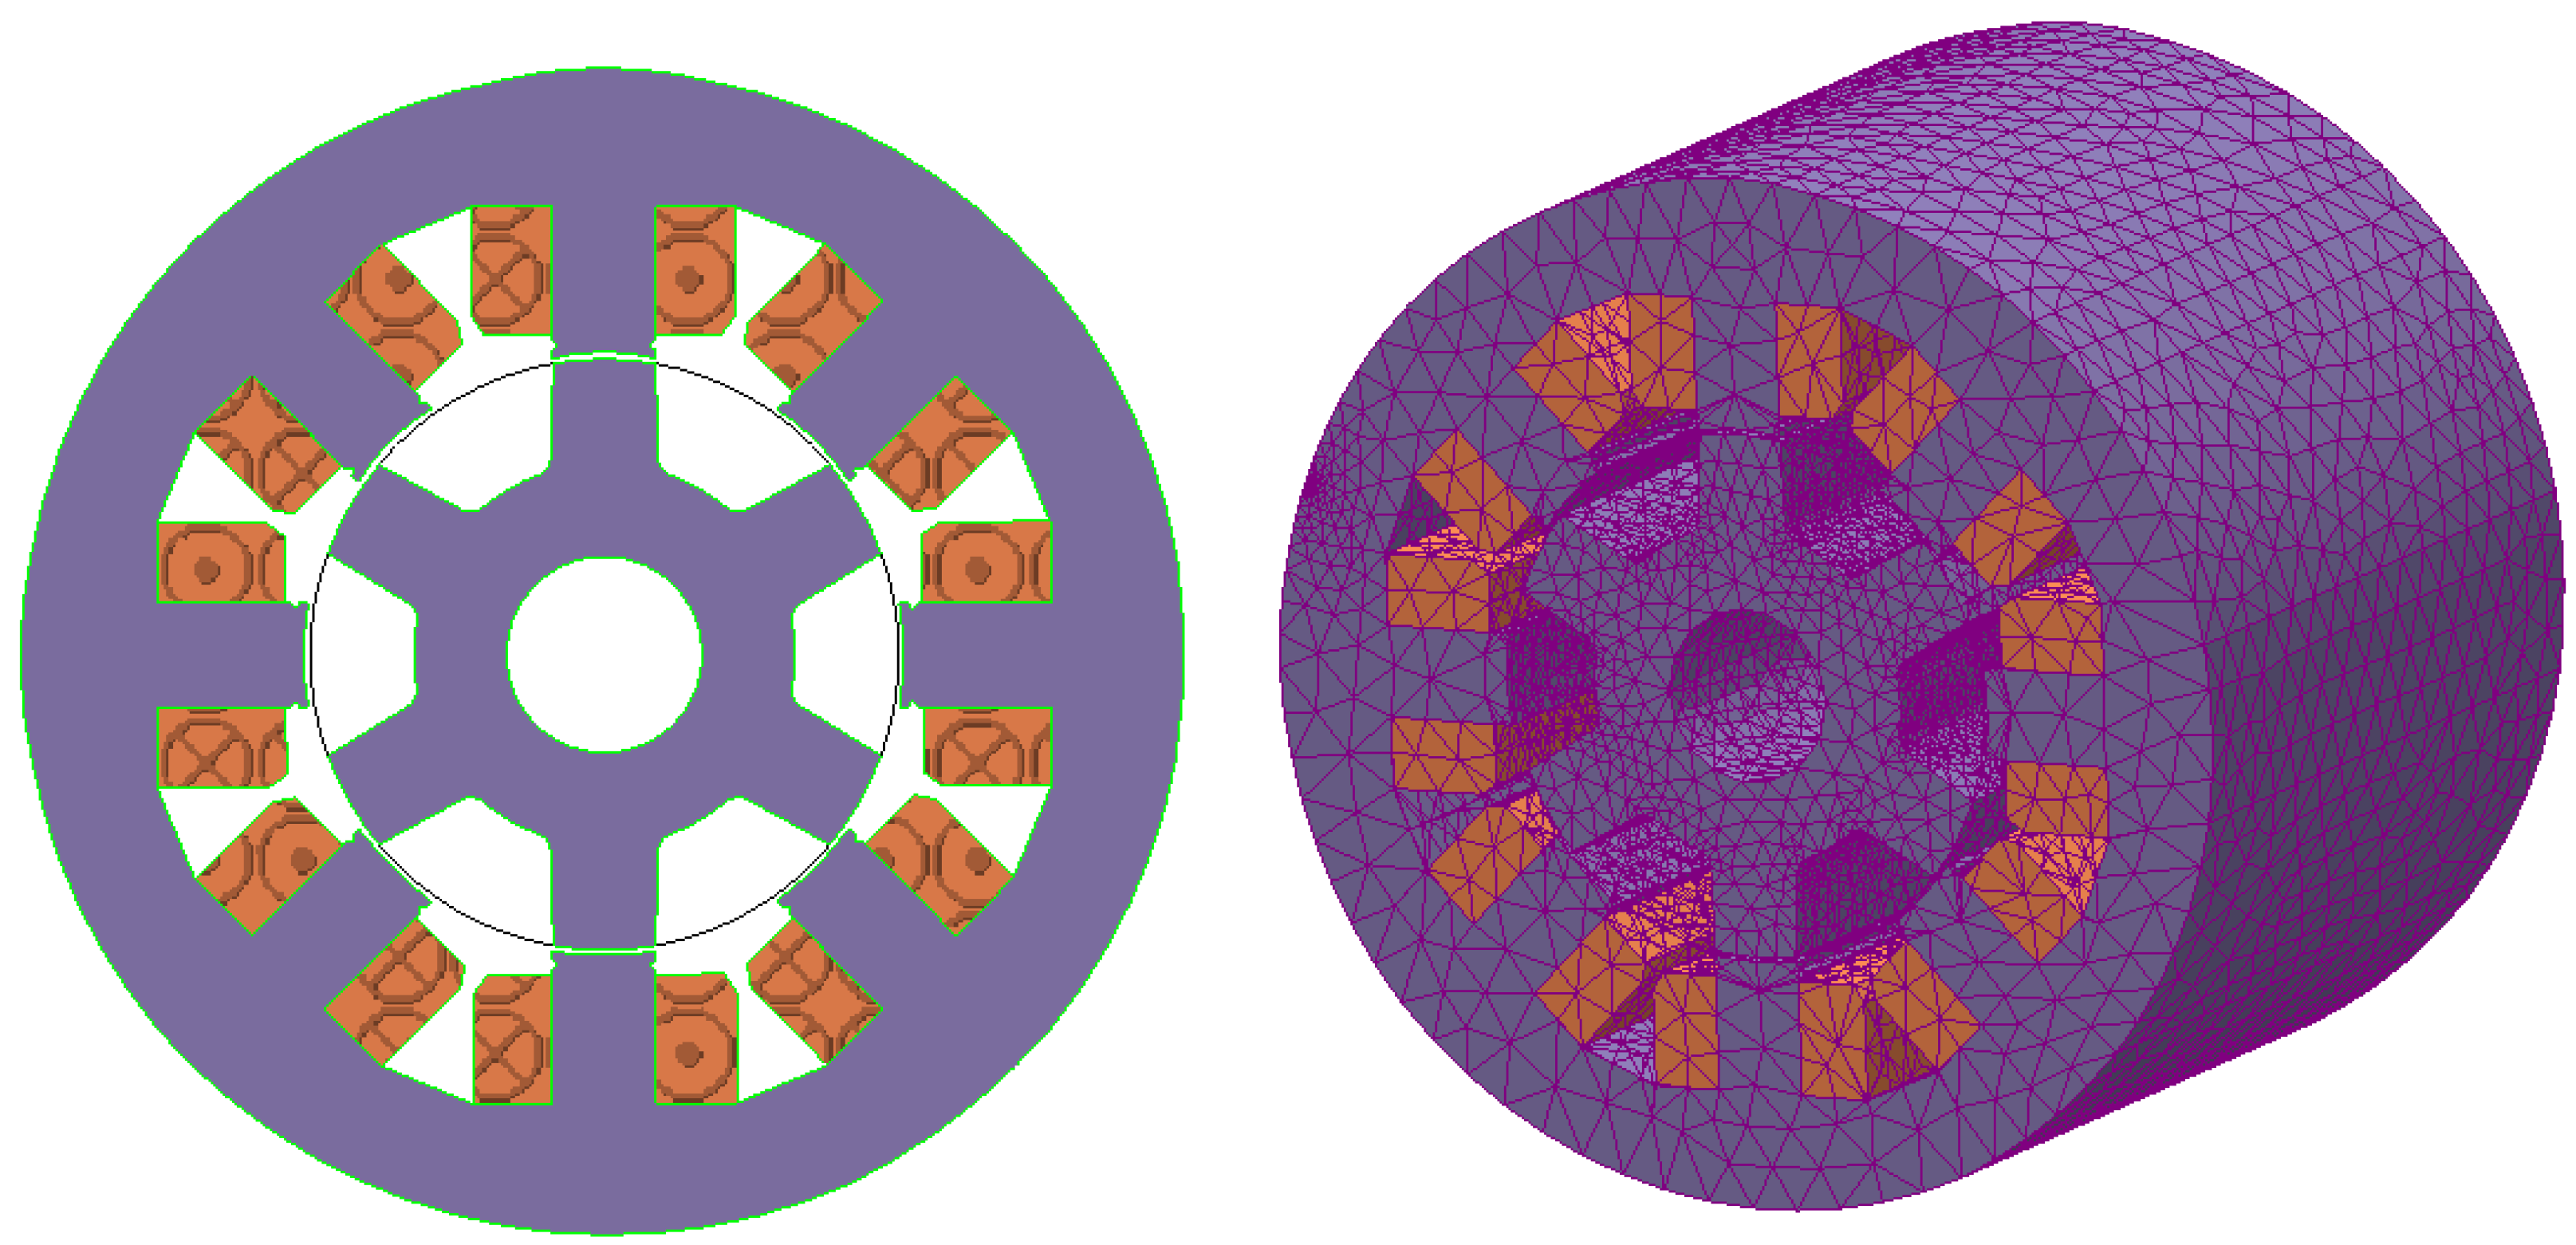
  • Create the geometry of the SRM.
  • Assign material properties to the components (coils, stator, rotor, air gap…).
  • Generate a mesh grid.
  • Define boundary conditions, including the applied current as an input.
  • Configure the solver settings for accurate results.
  • Run the model to solve the electromagnetic field equations and calculate the magnetic flux.
  • Extract the magnetic flux distribution from the simulation results (Table 2).
  • Divide the obtained magnetic flux by the applied current to obtain the value of the actual inductance.
Dividing the flux by the current, we determined the actual inductance value. This is based on the relationship between inductance L θ , i θ = c o n s t a n t current i ( t ) , and magnetic flux ( φ ), which states that inductance is equal to the ratio of magnetic flux to current ( L θ , i θ = c o n s t a n t = φ θ , i θ = c o n s t a n t i t ) .
The SRM is composed of two materials: copper coils and a stator made of high-resistivity M19-29-gauge iron. Finite Element Method (FEM) and MATLAB tools are used to simulate the SRM’s characteristics. The magnetic properties are calculated using FEM in ANSYS, based on a DXF file generated in AUTOCAD, as shown in Figure 3.
The magnetic flux and voltage values (listed in Table 2) are determined by evaluating the magnetic vector potential and co-energy across the machine’s cross-section. It’s important to note that when a nonlinear system is stimulated by a single frequency component, it can produce multiple frequency components in its output [19]. For instance, when a polynomial nonlinearity of degree n is excited by a single-frequency component with a frequency of ω (i.e., a sinusoidal signal), it usually generates harmonics with frequencies, where. Additionally, if a nonlinear model comprises a series connection of linear and polynomial functions of degree n, and it’s excited by a single frequency component with a frequency of ω, its output can contain the frequencies ω , 2 ω , , n ω . It’s worth mentioning that a linear block doesn’t generate any harmonic, but it does influence the amplitude and phase of the frequency component present in its input.
In this study, it is demonstrated that the Switched Reluctance Machine (SRM) can be modeled as a polynomial GHM. Consequently, when the SRM is stimulated by a sinusoidal signal with a frequency of ω , its output signal may comprise harmonics of the form k ω .
A swept-sine signal is employed in this study to develop a frequency identification method. This signal has a frequency band with sufficiently high harmonics, enabling the identification of SRM parameters through a single experiment. The SRM’s electrical model can be described by a polynomial GHM, where the phase current i t is the input signal, and the phase winding voltage V t is the system output (Section 2). The operating frequency starts from an initial frequency f 1 = 10   H z and increases exponentially to a final frequency f 2 = 500   H z (Figure 2). The frequency band is selected based on the stator and rotor iron saturation range.
The software utilizing 3D finite element (FEM) allows for the model simulation of the SRM (Table 3), with subsequent export of all input (phase current) and output (voltage) data to MATLAB tools. The proposed methodology is designed to effectively separate the harmonics of the SRM output, with a specific focus on determining the filters G 1 , G 2 , and G 3 of the GHM (refer to Figure 1). Notably, the only parameters unknown in the obtained model of SRM (the GHM of Figure 1) are the filters G 1 (s), G 2 (s), and G 3 (s) . By establishing the aforementioned filters, the characteristics of the SRM can be effectively determined.
Figure 4, Figure 5 and Figure 6 indicate that the three systems G 1 (f), G 2 (f), and G 3 (f) behave like a first-order system, with a positive slope (+20 dB per decade) and a phase φ = π 2 , which is characteristic of a derivative operator. Figure 4 confirms that the linear filter G 1 (f) behaves like a derivative function. The efficacy of the proposed methodology is demonstrated using MATLAB/Simulink tools. The input/output signals of the SRM model, generated using FEM software, are exported to MATLAB, and the linear filters G 1 ,   G 2 , and G 3 are estimated using the proposed model in MATLAB/Simulink, as depicted in Figure 4, Figure 5 and Figure 6. It is evident from these plots that the SRM can be accurately described by a GHM of order N = 3 . To compare the proposed model with the actual model obtained using FEM, a swept wave method is used, and the results of this comparison over the entire simulation interval are depicted in Figure 7a. For convenience, a zoom of this comparison is given in Figure 7b. The estimated output signal obtained using the proposed technique is remarkably similar to the actual system output obtained using FEM, thereby demonstrating the effectiveness of the proposed methodology.
To check the performance of the method, we carried out the simulations for different positions of the SRM (Table 2), namely (position aligned at 0° Figure 8, Figure 9 and Figure 10, midway position at 15° Figure 11, Figure 12 and Figure 13, and unaligned position at 30°) we subsequently extracted the parameters of the inductor proposing in Equation (4).
The inductance characteristics determined from FEM are verified using polynomial fitting and the flux is calculated for three rotor positions, aligned unaligned and midway position, Figure 7. We subsequently note that the results are very close, with low tolerances.
The simulation is performed using a sampling frequency f s = 2   k H z . The excitation signal used for the identification is a swept-sine signal, as defined in Section II, with the following parameters: f 1 = 10   H z ,   f 2 = 500   H z and T = 2   s The maximum frequency f 2 has been chosen to avoid any aliasing. The selection of the frequency range [f1 f2] was based on several factors, including the desired bandwidth for analysis and the system’s frequency response characteristics. These parameters were chosen to ensure that the input signal covers a sufficiently wide frequency range to capture the relevant dynamics of the system. The duration time T of the input signal was determined based on the desired time resolution and the system’s transient response.
In this study, the frequency range of the swept sine signal was set from f 1 = 10   H z to f 2 = 500   H z , based on the SRM’s speed variation range, covering the entire operating speed range of the motor [33]. The effectiveness of this technique can be proved by capturing the SRM’s response across a wide frequency range. Then, the identification process was performed offline, ensuring that the choice of a start frequency of f 1 = 10   H z in specific SRM applications, such as traction, does not affect the estimation process. The offline nature of the identification process guarantees that the frequency selection has no impact on the accuracy of the presented estimation results [30].
The order of the model is set to N = 3 Once the response of the NLS under test to this excitation signal is known, the nonlinear convolution described in Section III is performed, and the linear filters of the nonlinear model are estimated.
For the other positions of the SRM, we turned the rotor for three positions [0°, 15°, 30°], successively the aligned position, the intermediate position and the non-aligned position. Figure 8, Figure 9 and Figure 10 show the estimated linear systems for the Midway position, the filters obtained of order 1, we can see that there is phase noise on the linear blocks. For the non-aligned position, we were able to extract three linear blocks of order 1, the system obtained by the identification algorithm is a first order, and in other words, we can see that the linear blocks obtained are either integrators or derivatives.

5. Parameter Identification Procedure

The procedure is detailed in the following steps:
  • Reading the data obtained by FEM analyses, initialization of calculation parameters F s = 32   K H z , f 1 = 10 , f 2 = 500   H z , T = 2   s ( T = t o t a l   s i m u l a t i o n   t i m e ) .
  • Calculates the impulse response H ( t ) from the furrier transforms of the input signals x ( t ) and output y ( t ) we took into account the peaks of a time interval
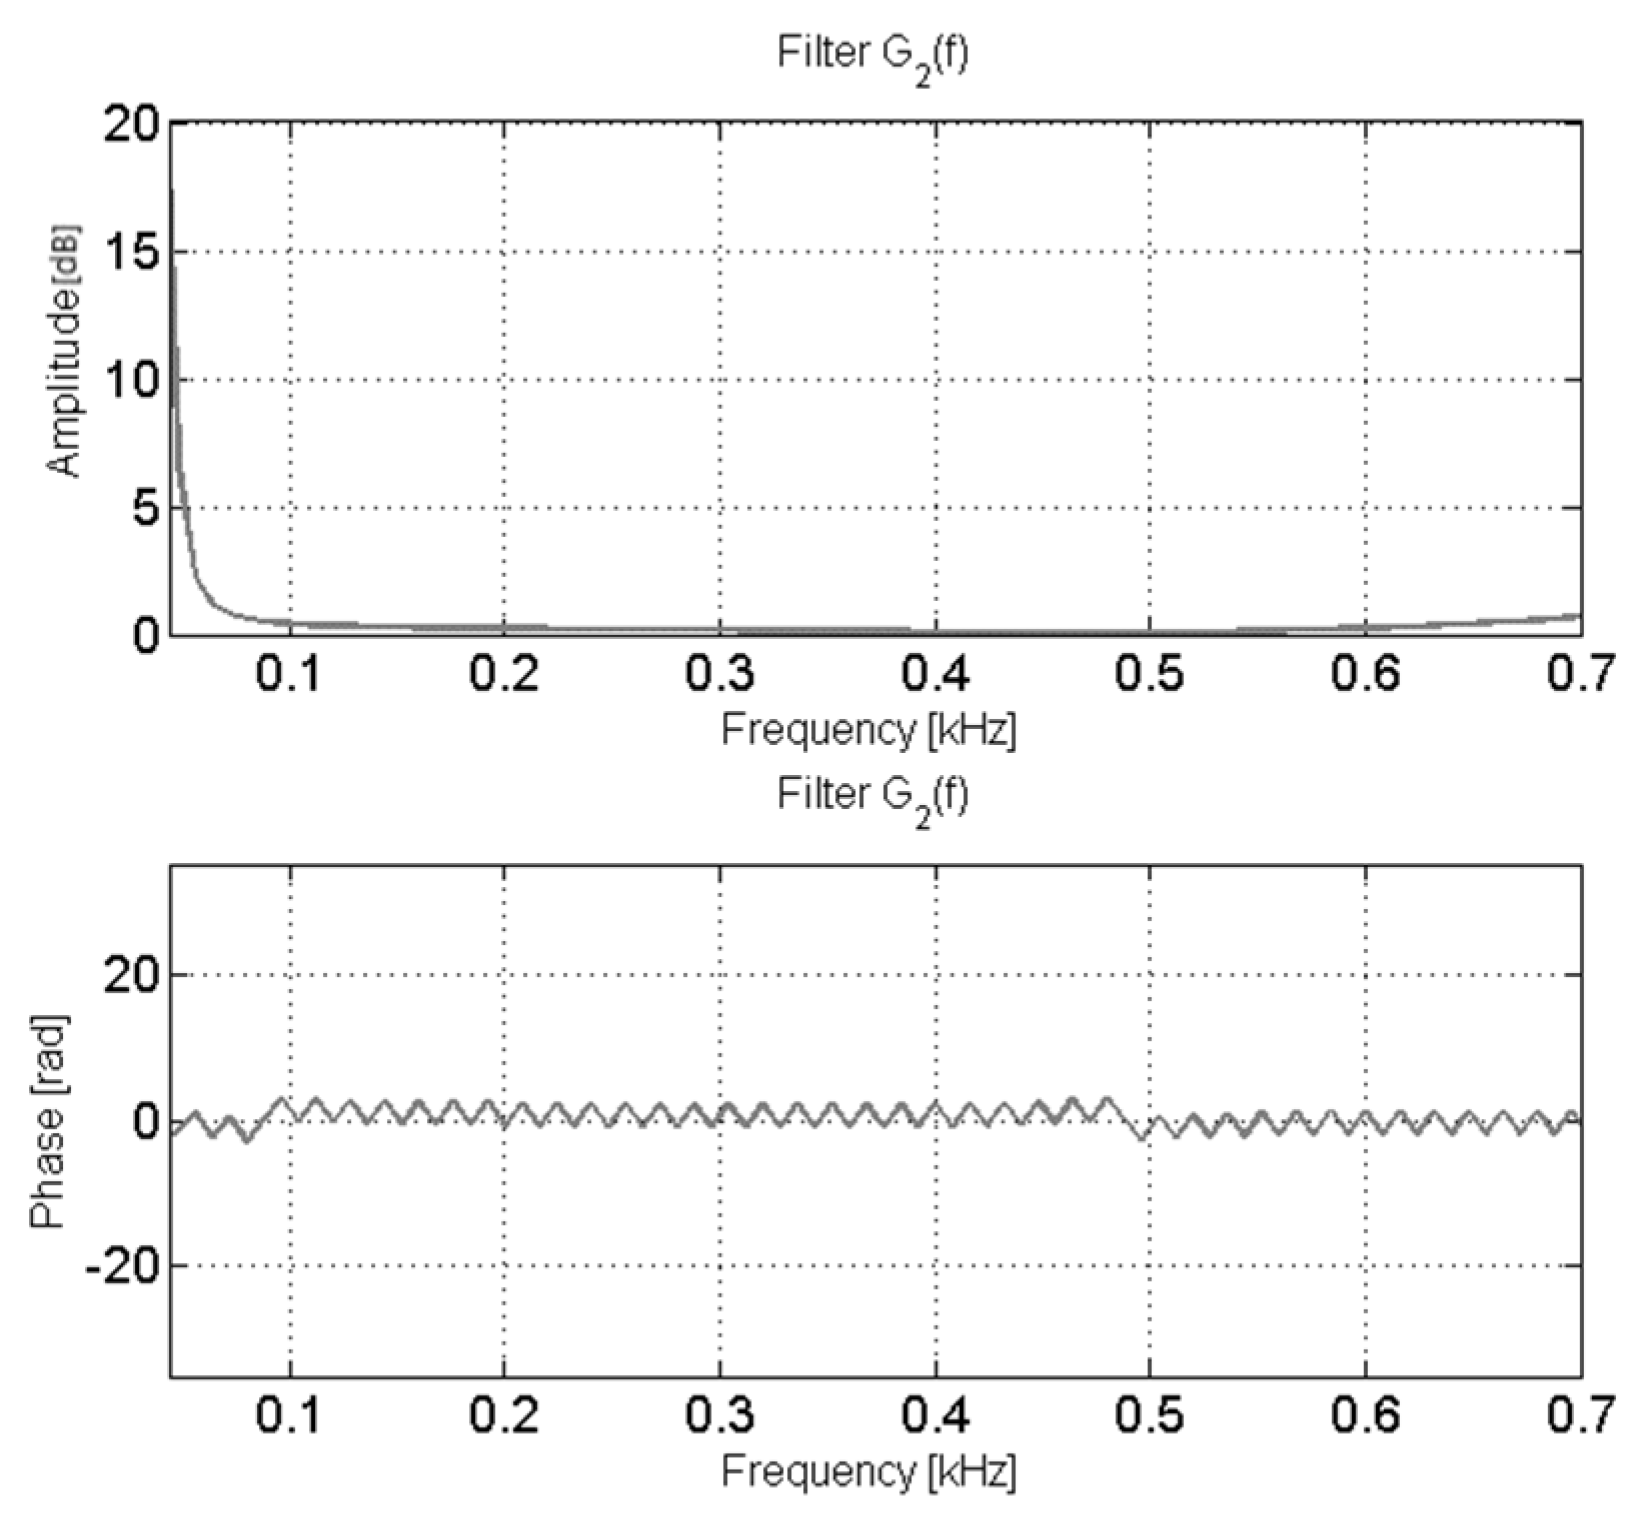
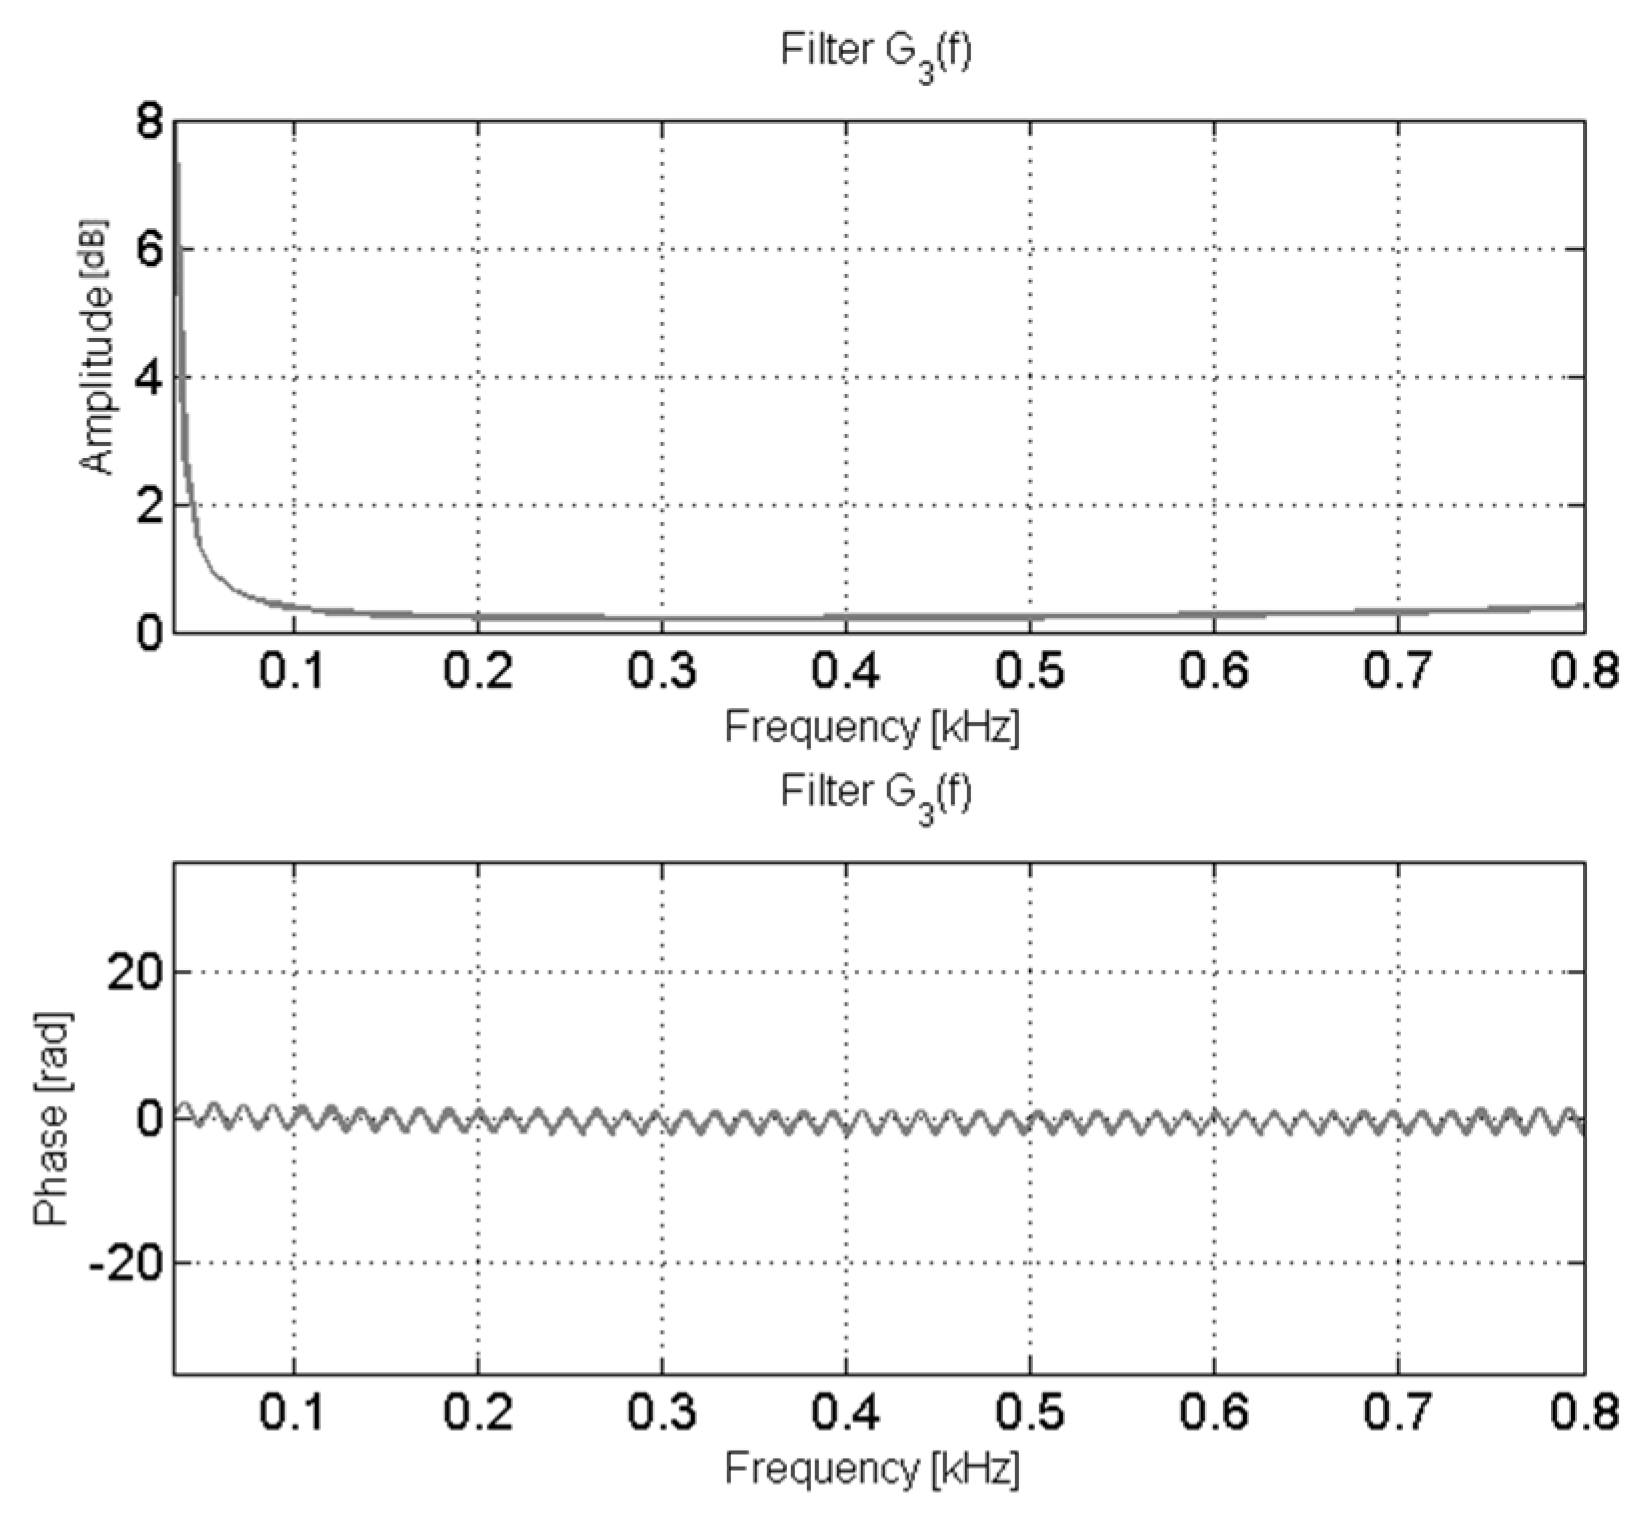
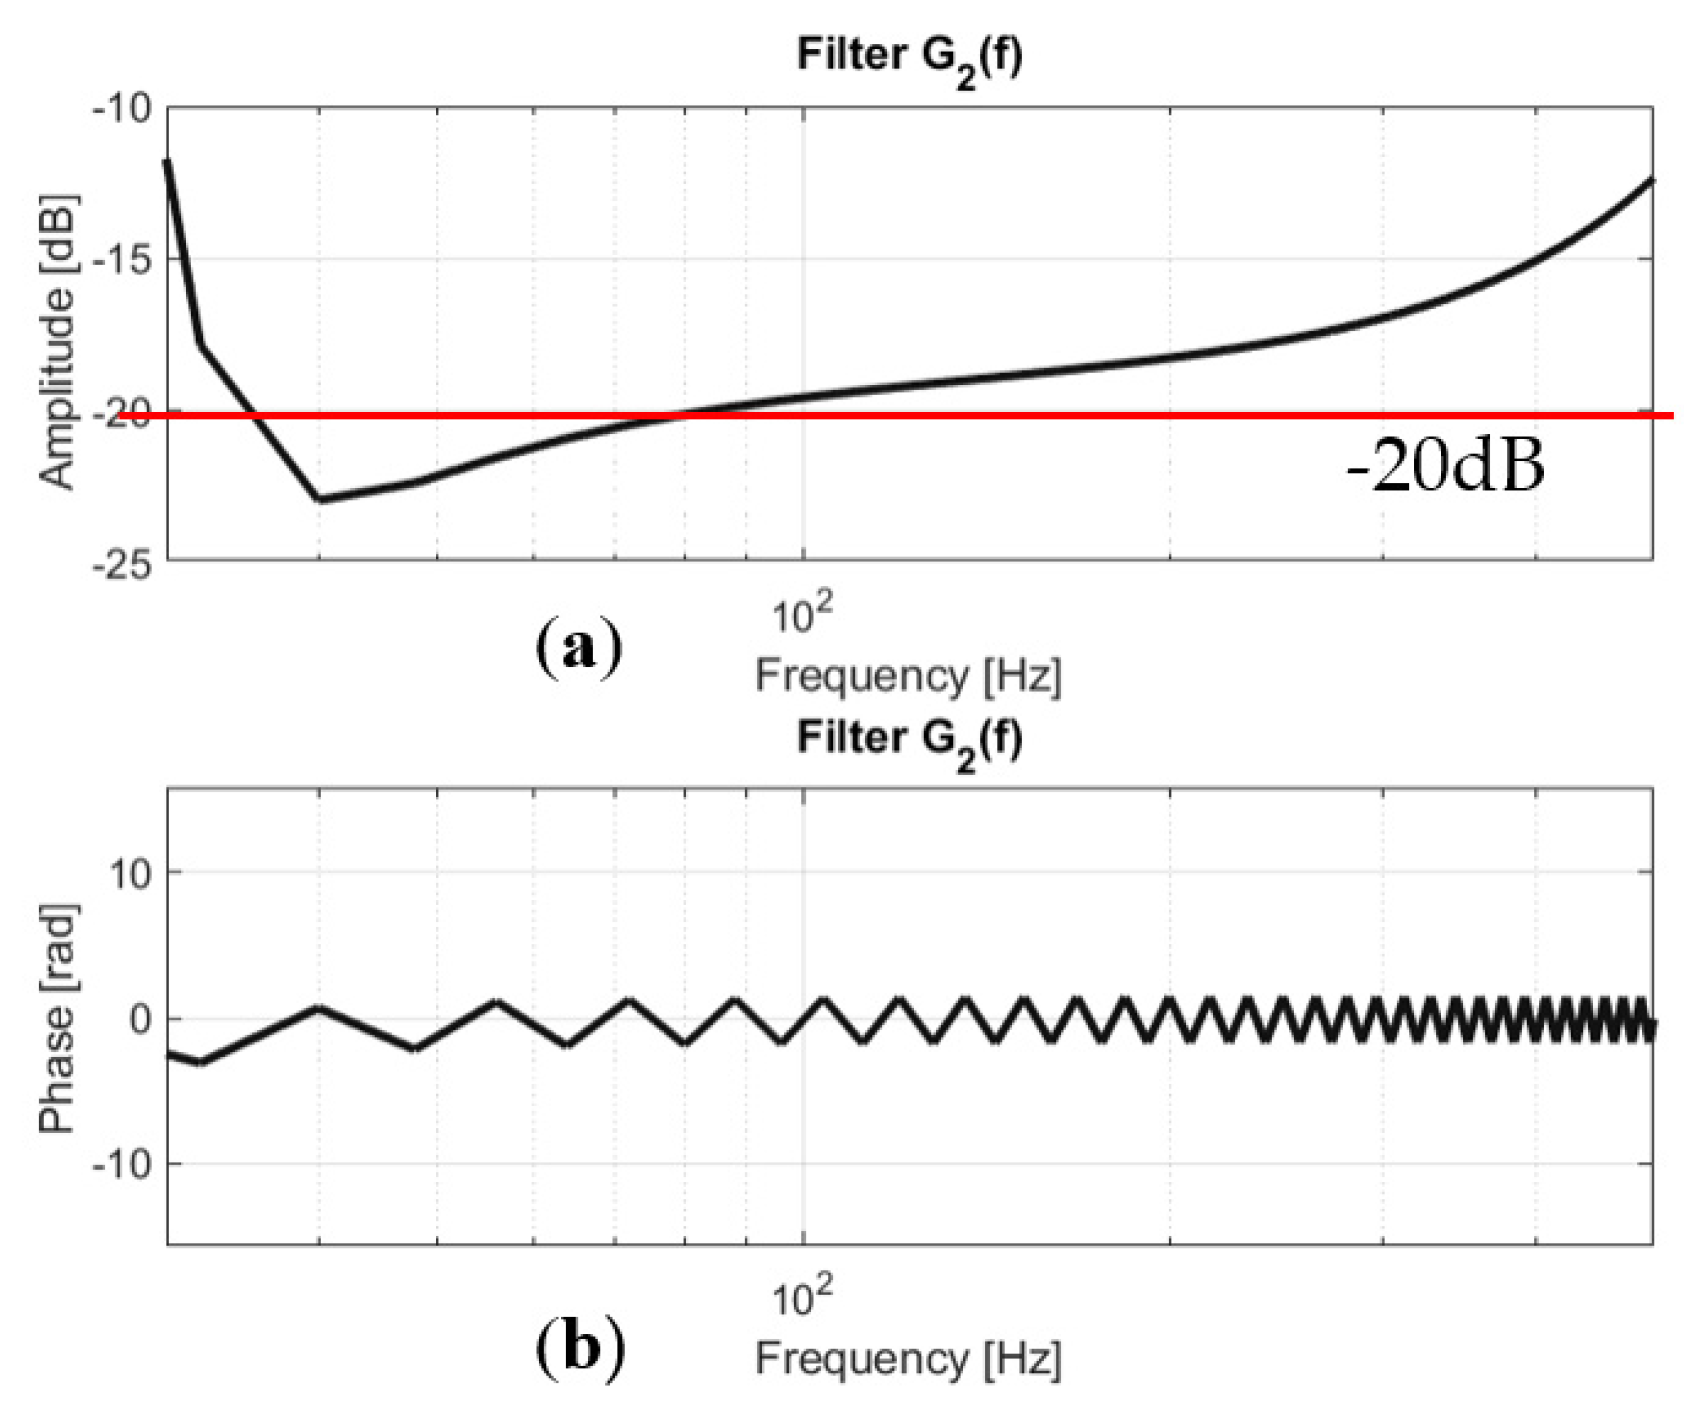
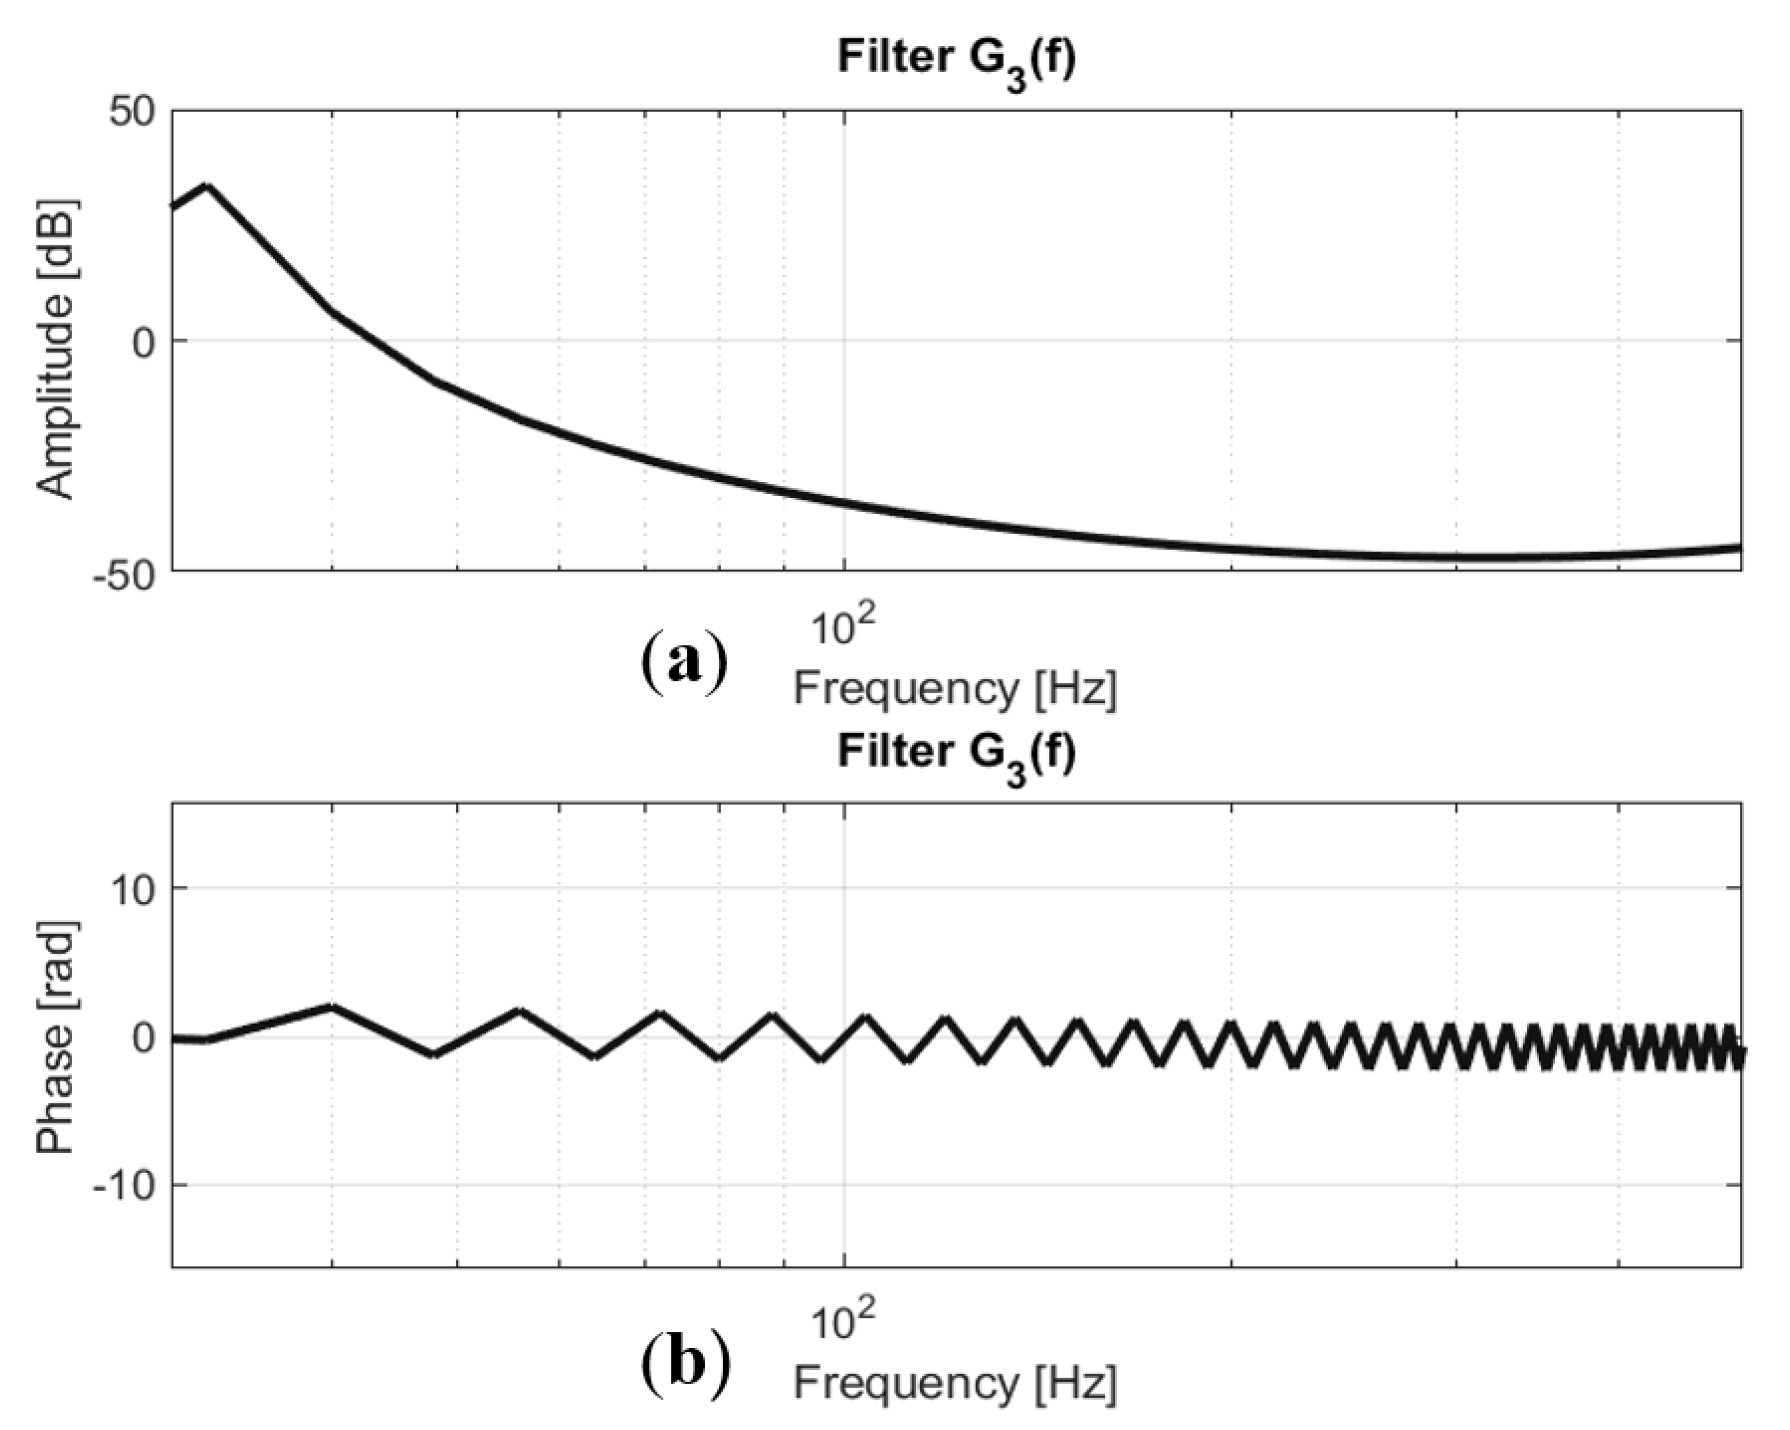
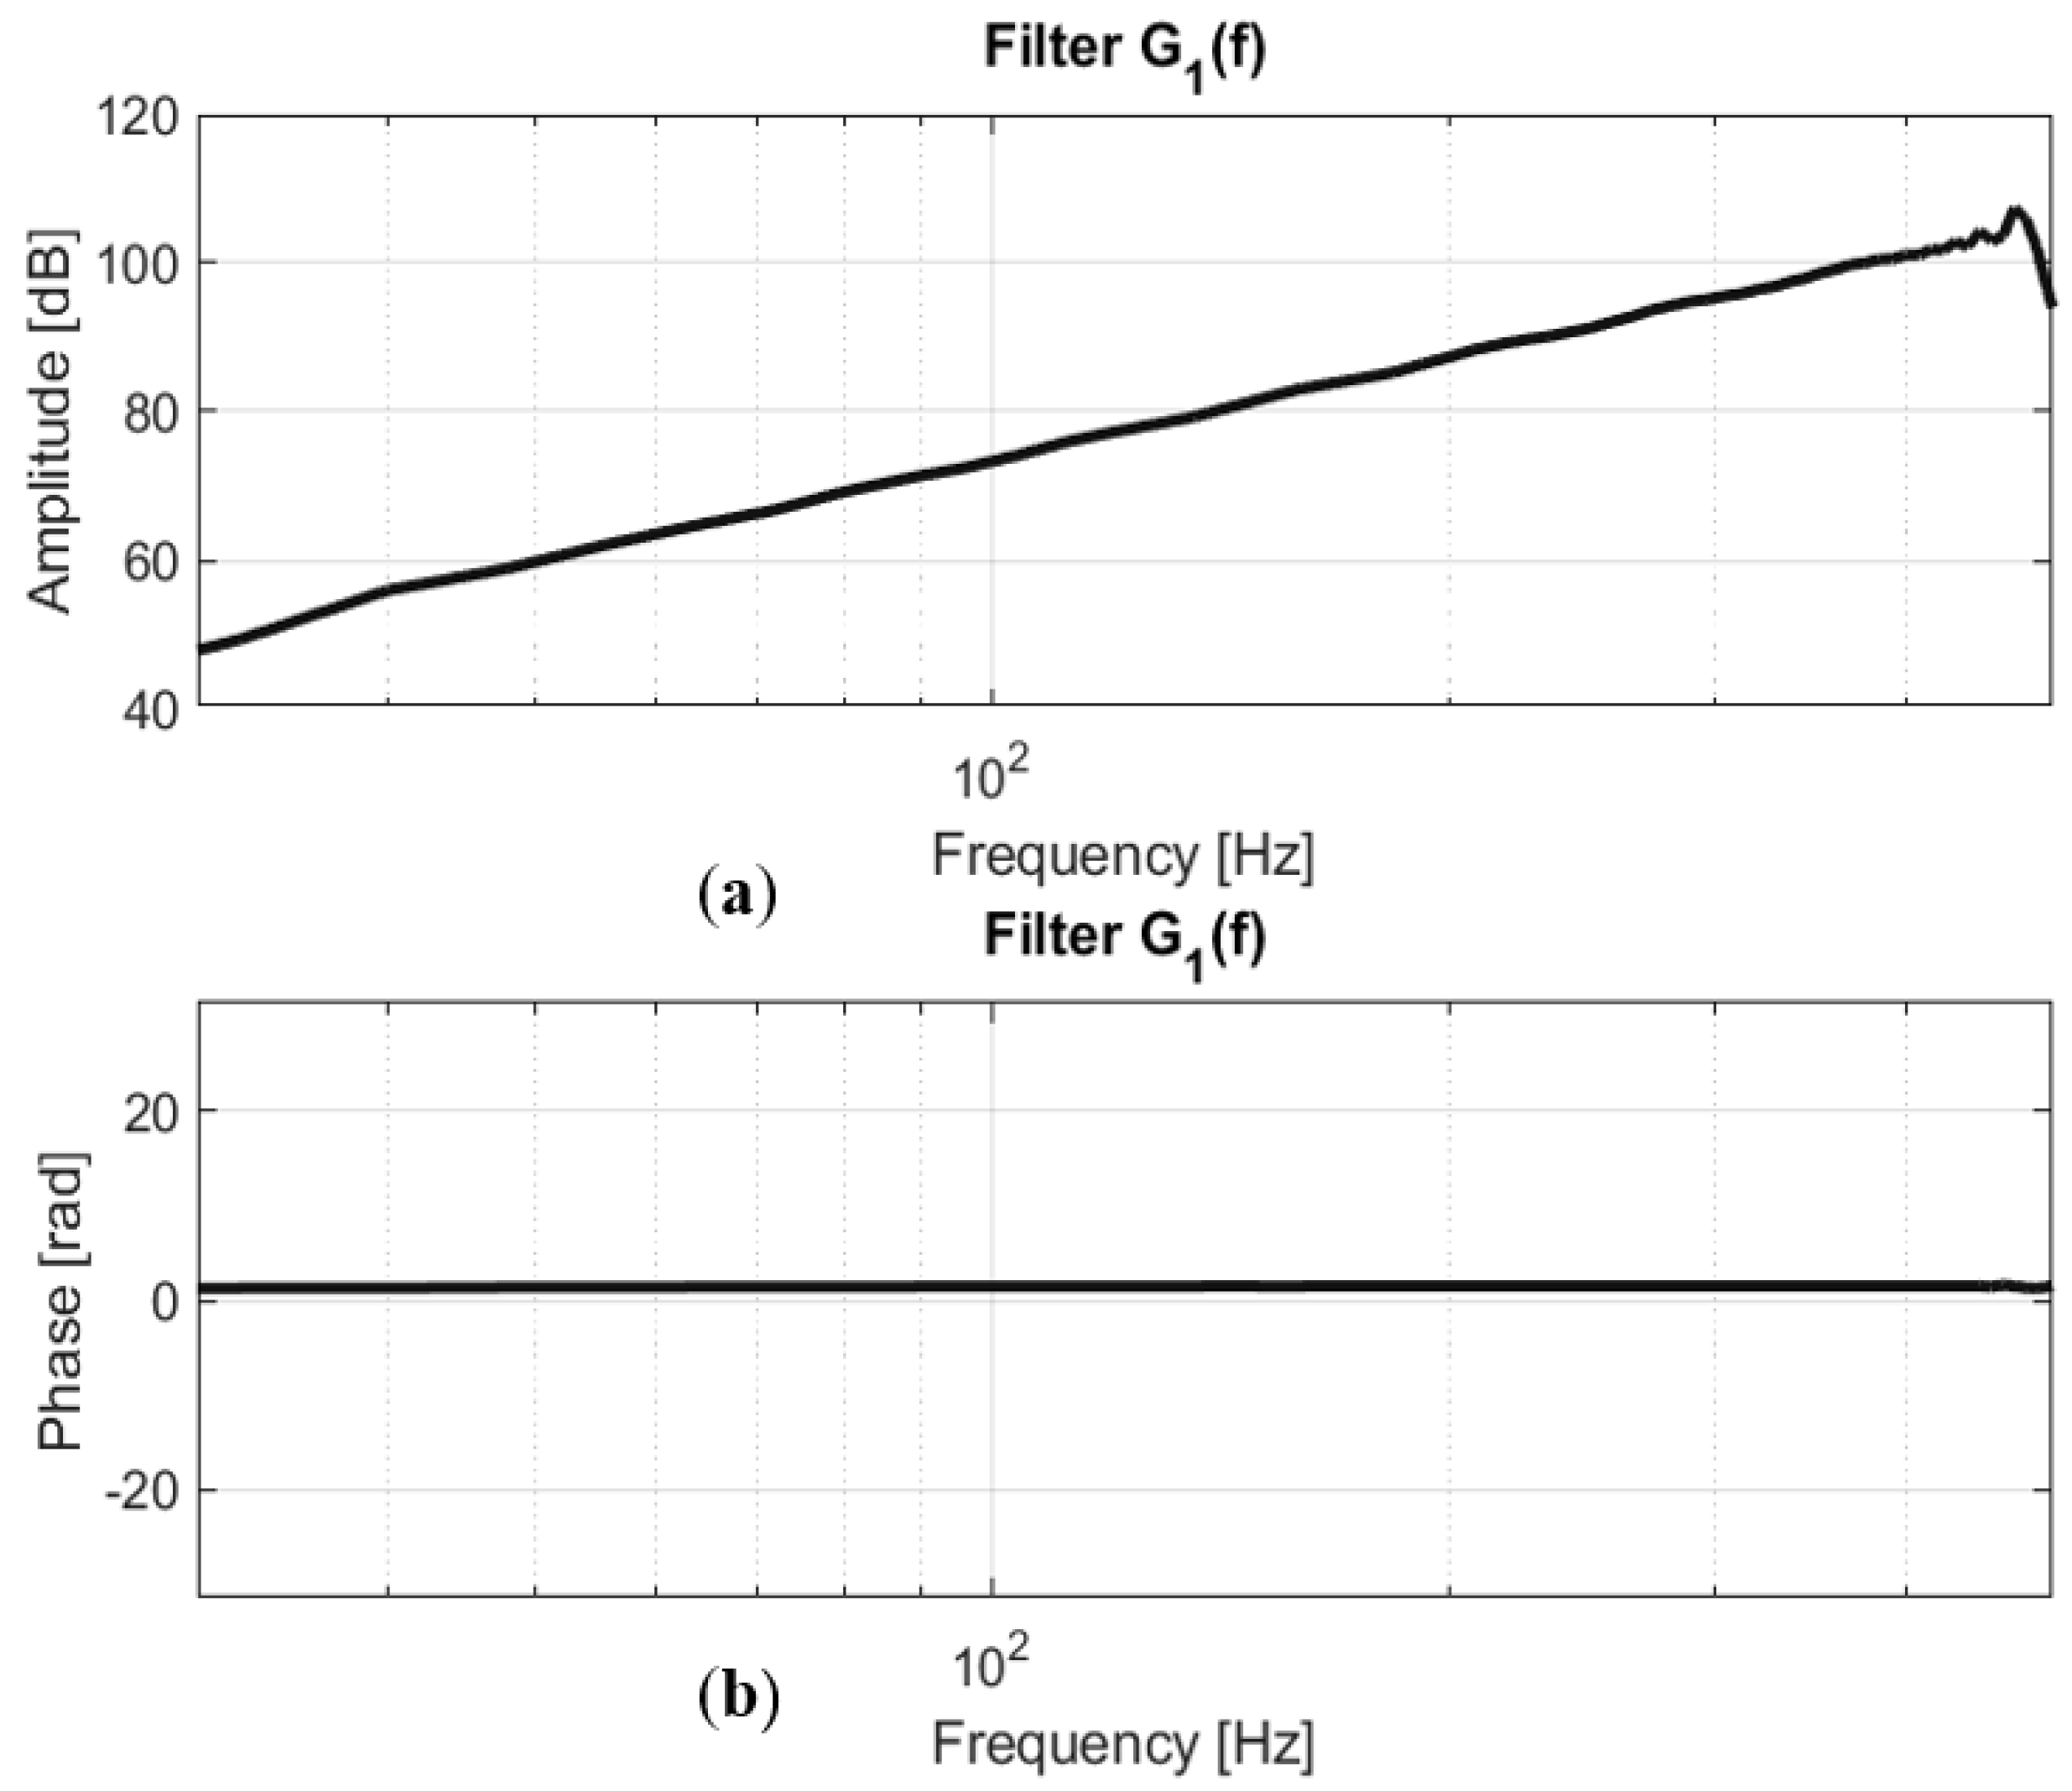
 T = 2   s .
  • The harmonics H m ( f ) were separated in order to calculate the values of the G m ( f ) filters.
  • Calculation of the trigonometric matrix A ( n , m ) , we calculated this value from Equation (16).
  • The value of the filters Gm was calculated from the following fraction G m ( f ) = H m ( f ) / A .
  • Extraction of parameters of first-order systems G m ( f ) .
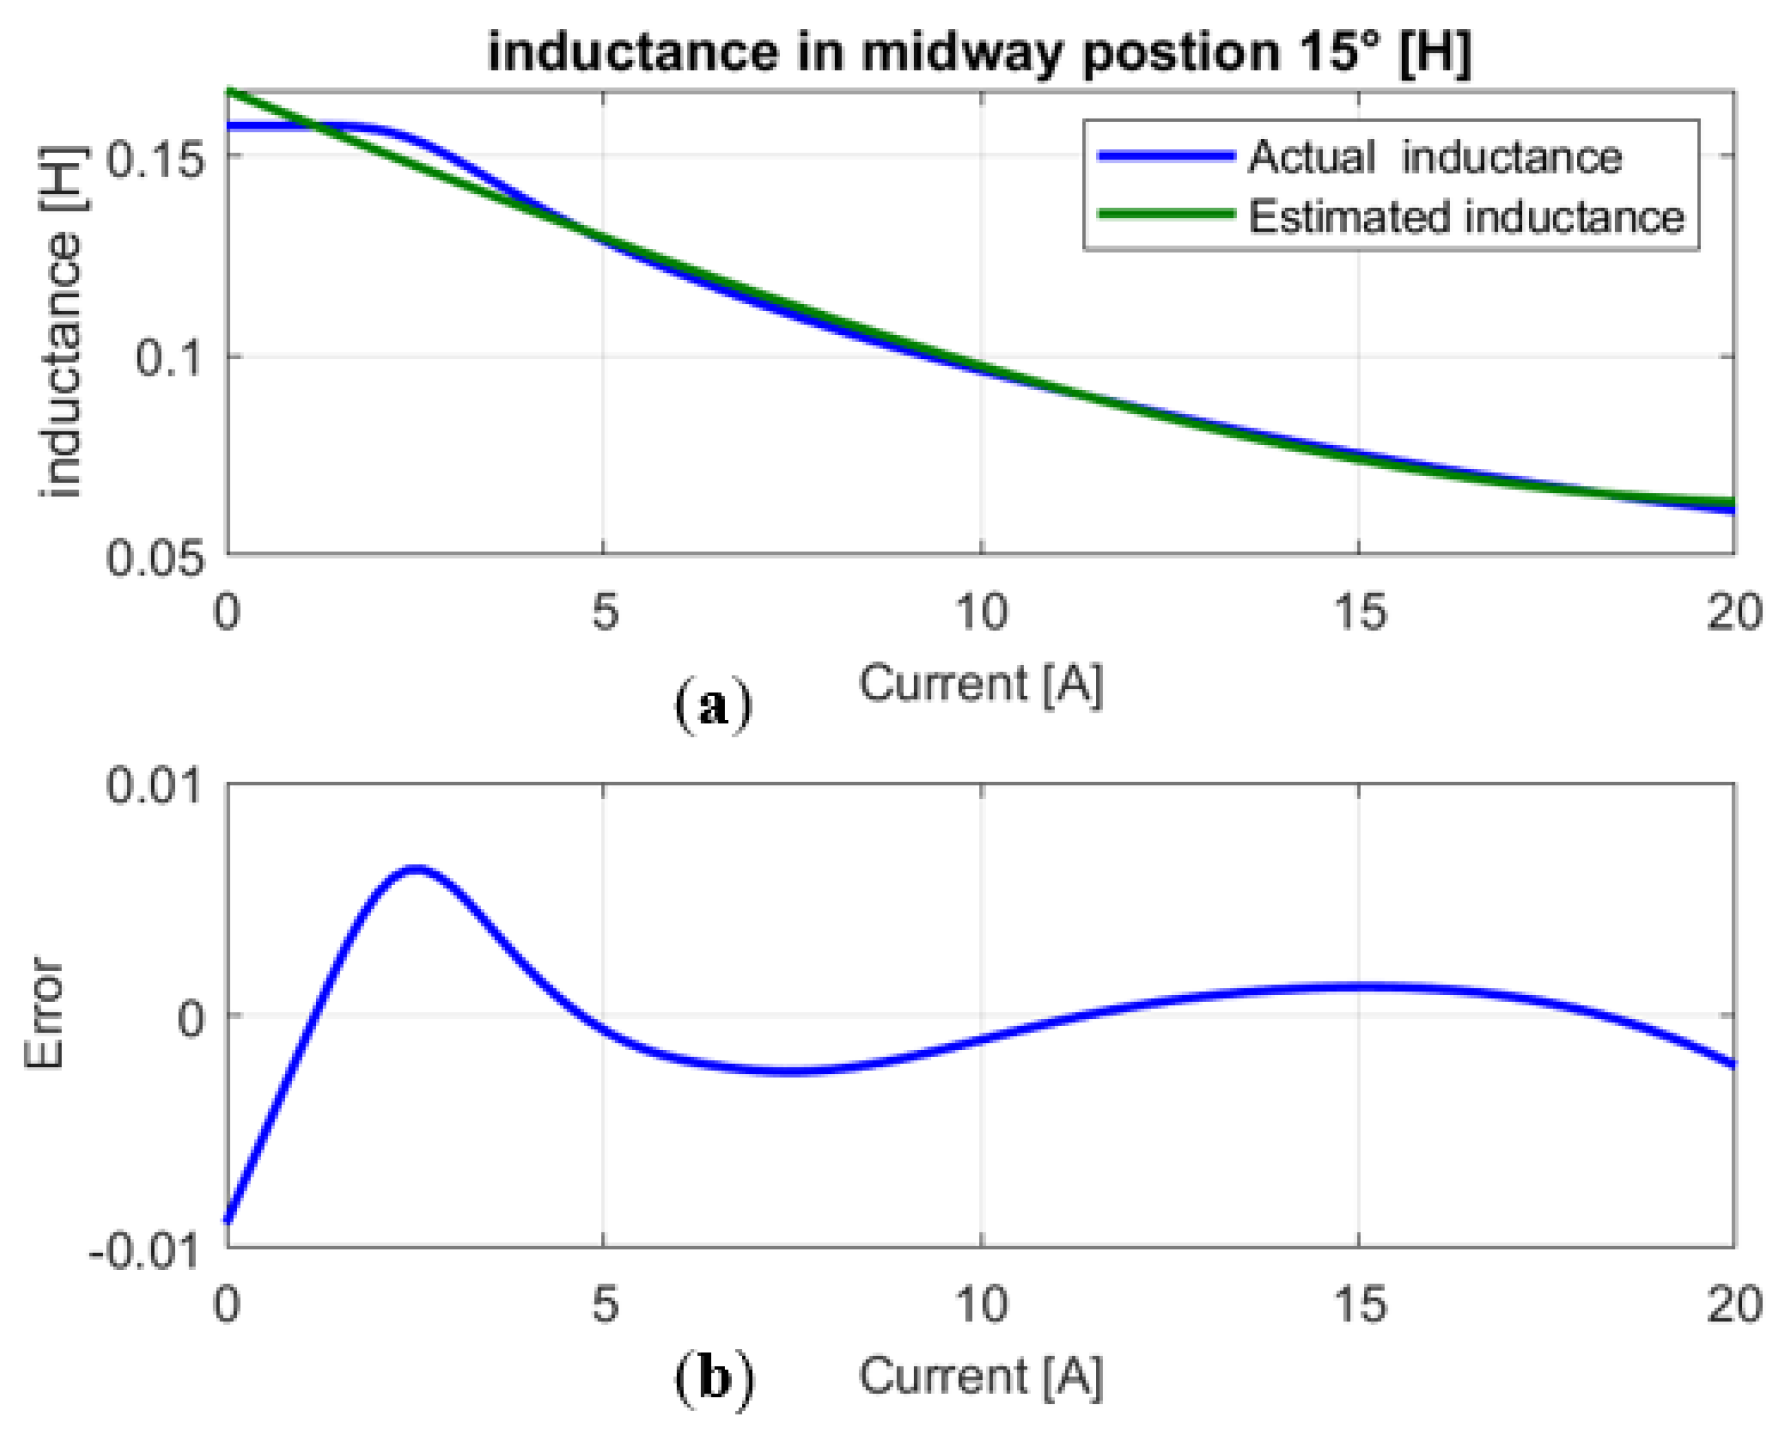
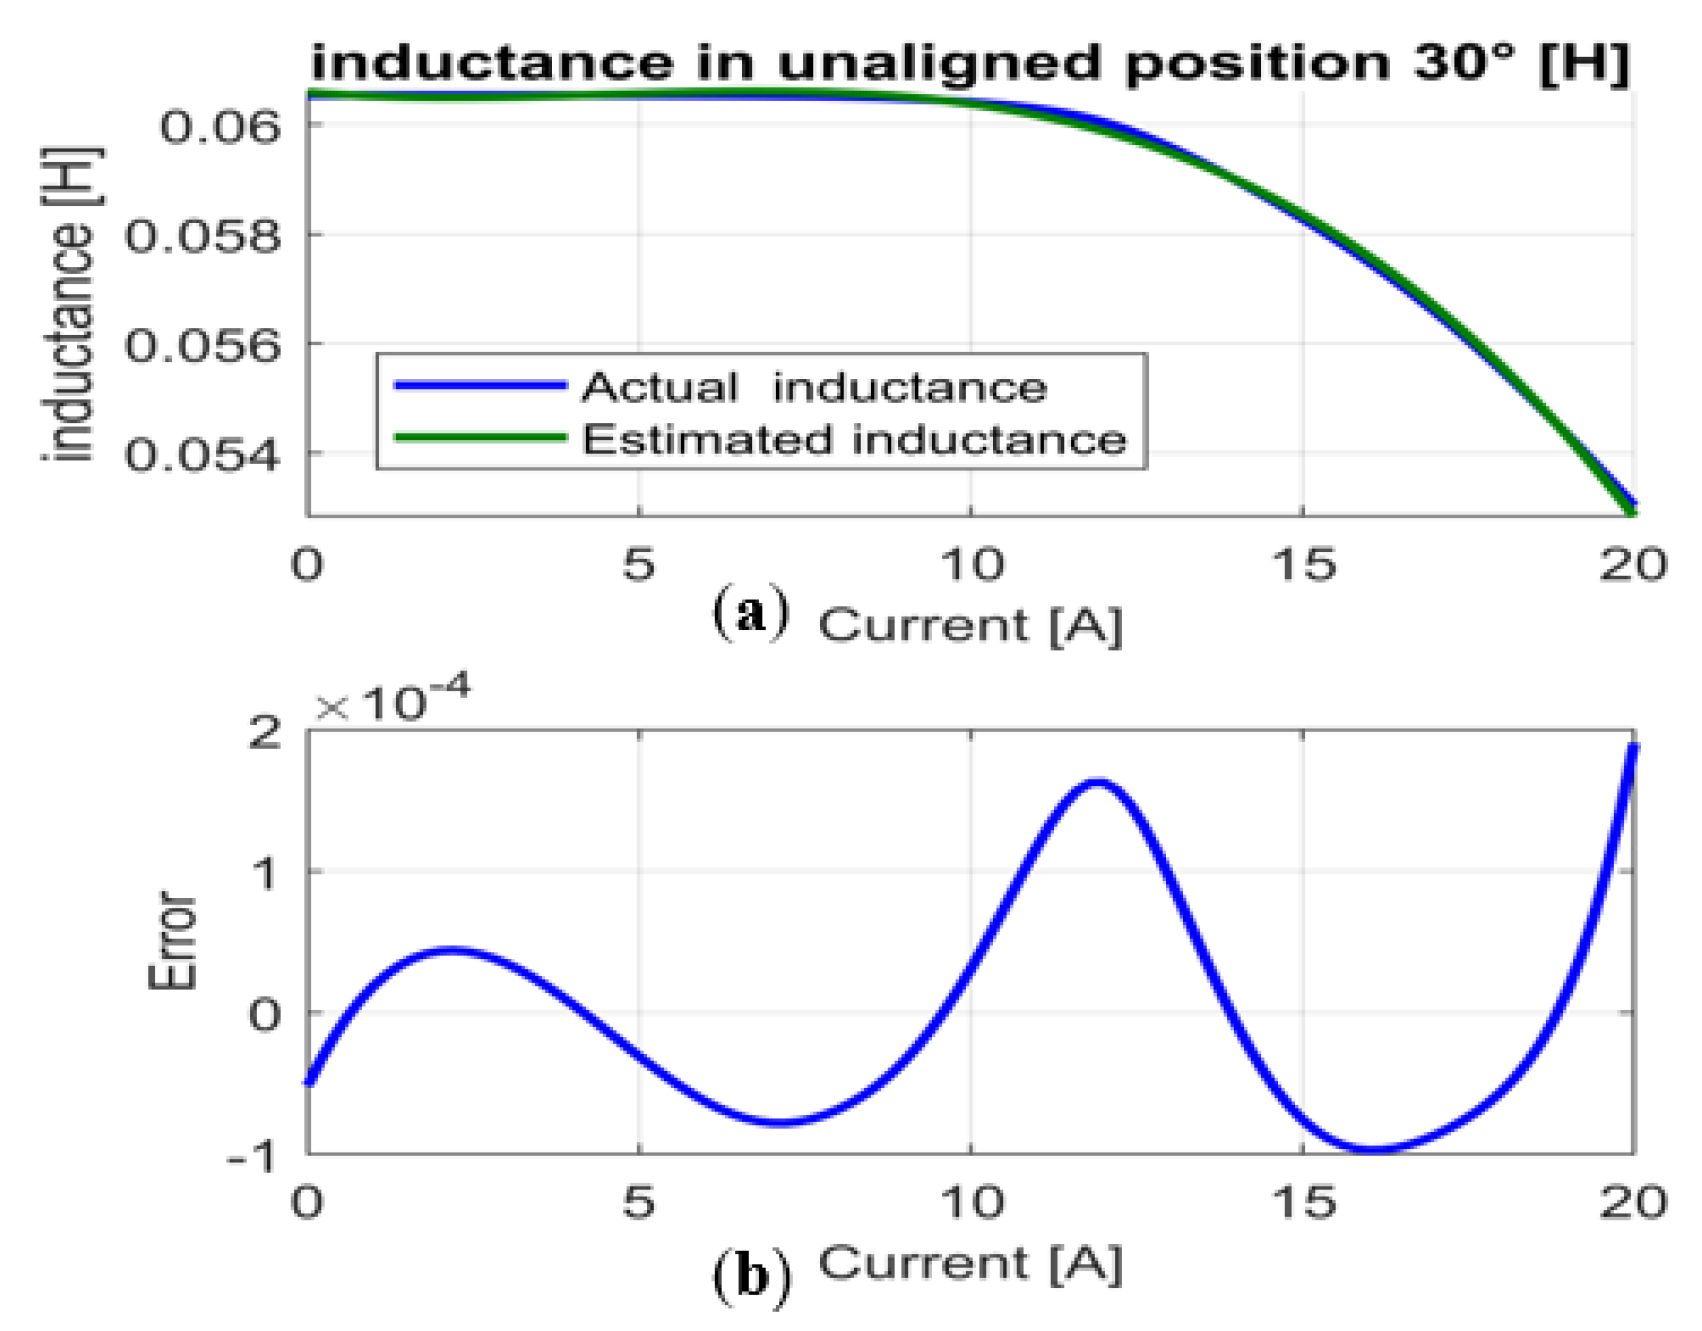
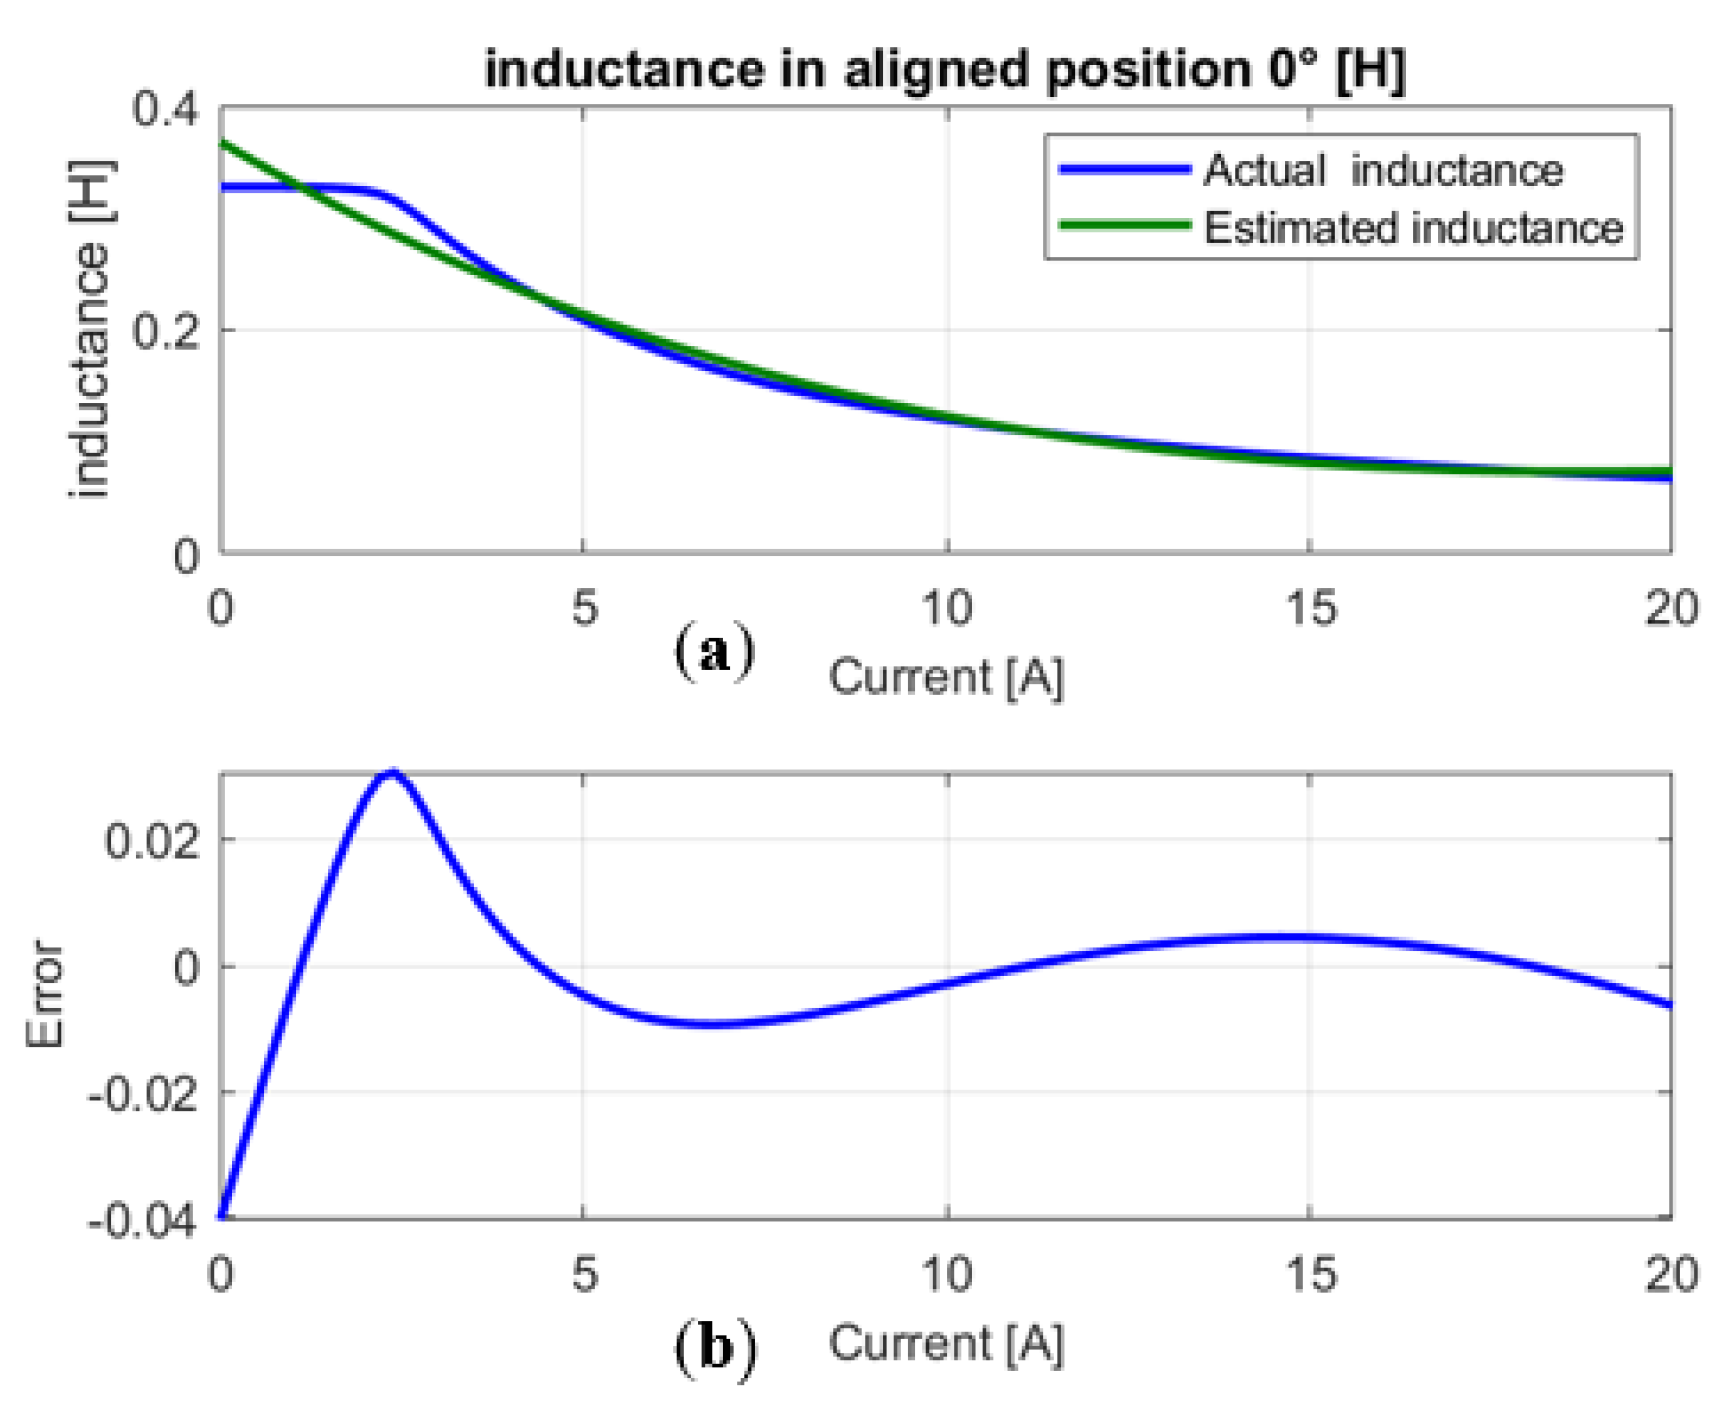
  • Construction of the inductors (for the 3 positions of the SRM rotor) from the GHM obtained in step 6.
  • Construction of the inductance curve estimate and extraction of the parameters of the inductance (see Table 2).
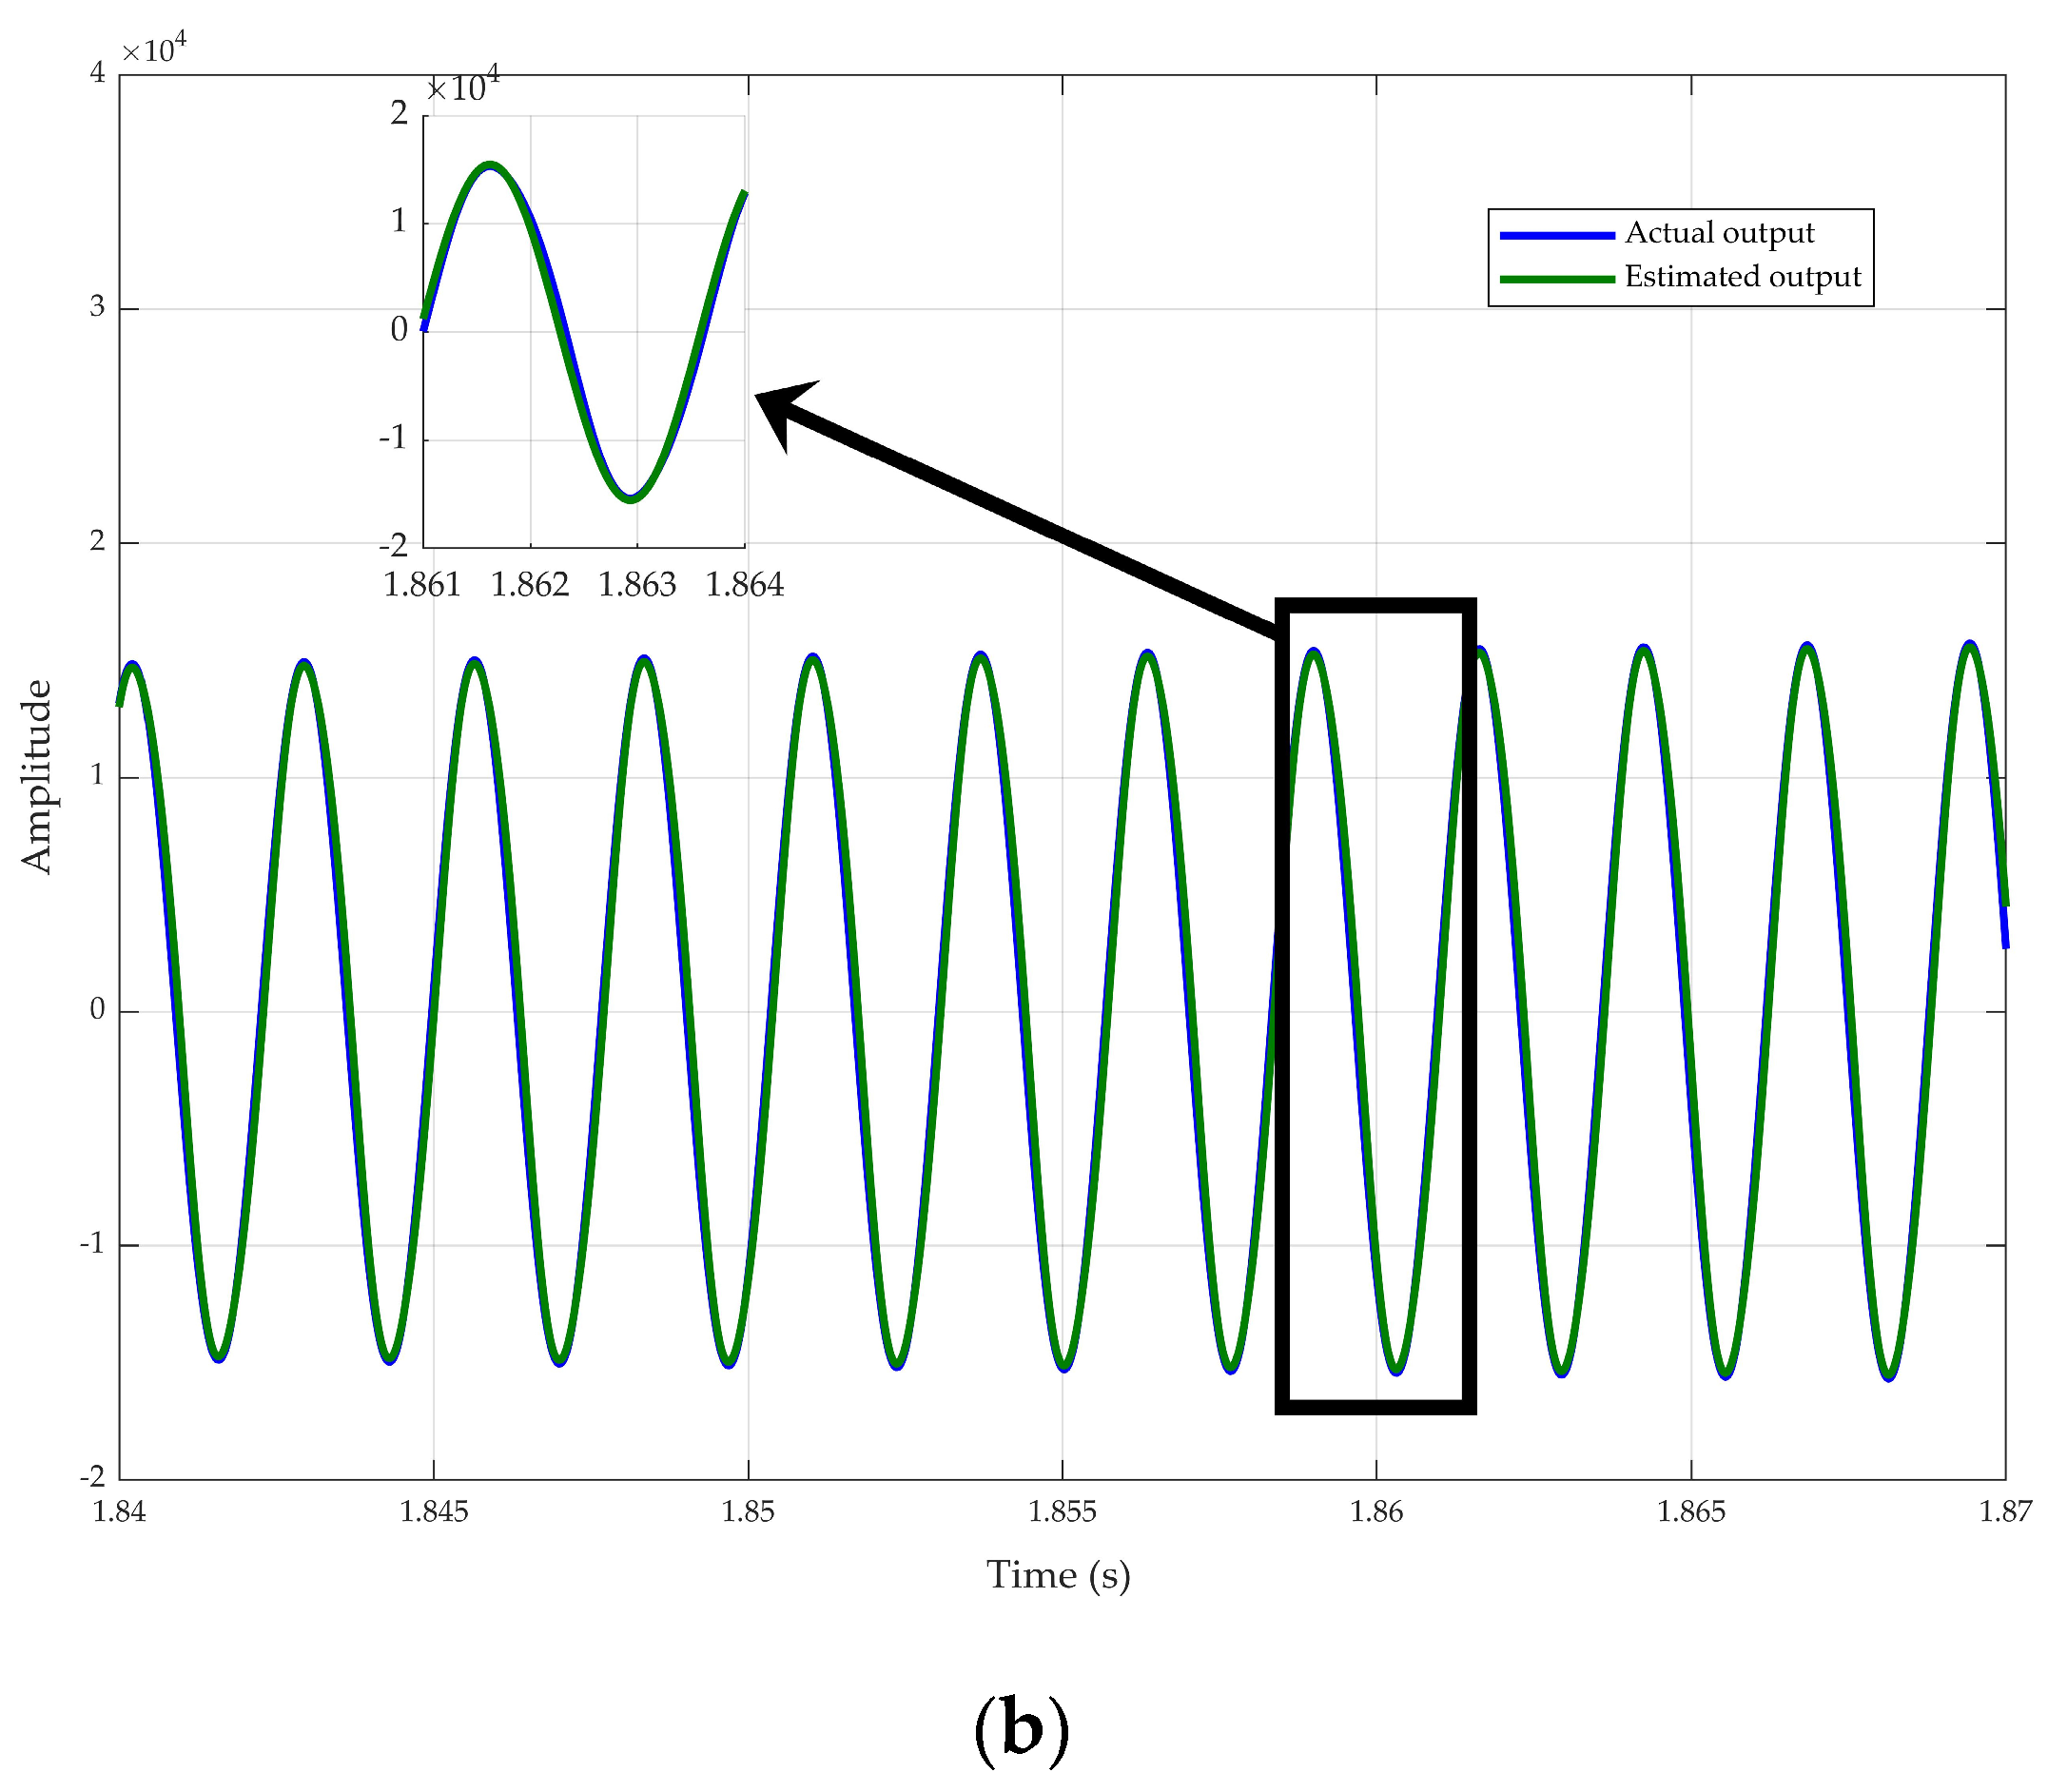
  • Calculates the identification error for each rotor position.
To test the robustness of the identification method, we calculated the mean square error MSE for each inductance curve. The MSE is calculated as the mean square of the modulus of the complex difference between the estimated and real inductance curve in the frequency range [ f 1 = 10   H z , f 2 = 500   H z ] . No synchronous averaging is performed. The robustness of the method is illustrated in Figure 14, Figure 15 and Figure 16.
The proposed method estimates the linear filters of the model with an error of less than 10 2 . As shown in Table 4 and Table 5, the parameters are identified for each position of the SRM. To validate this method, we calculated the error between the actual inductance and the estimated inductance (Equation (17)).
M S E = m e a n L a c t u a l t L e s t i m t 2
The coefficient of the proposed polynomial for four different positions including aligned, unaligned and midway are given in Table 4.
These polynomial coefficients are used to determine the estimated values of the mutual inductances in these three positions. These estimated inductances at these positions are compared to the actual ones obtained from the FEM in Table 5. The results demonstrate the excellent accuracy and low percentage error of the suggested approach to estimate the value of the inductance at three different positions.
Table 6 includes the Actual values for the estimated electrical parameters. The performance of the identification approach was demonstrated by a calculated error.

6. Conclusions

The paper puts forth a model that describes the SRM in a nonlinear manner, followed by a method to identify SRM parameters that take into account the nonlinear effects arising from magnetic circuit saturation and the double salient structure of the SRM.
First, it is demonstrated that a polynomial GHM can correctly predict the SRM nonlinear behavior. A swept-sine wave identification approach is suggested to identify the machine parameters. This method simply requires the system output and the input excitation (the phase current) (i.e., the phase winding voltage). As a result, only one experiment is required to determine the SRM parameter. Examples of simulation are established utilizing finite element technique analysis to demonstrate the efficacy of this study. Finally, keep in mind that this approach has the benefit of being quick and easy. Conducting validation tests using experimental measurements of an actual motor will be an important perspective for future research.

Author Contributions

Conceptualization, A.O., A.B., L.K. and F.G; methodology, A.O. and H.O.; software, S.A.H., N.A and M.I.M.; validation, H.O., F.G. and A.B.; formal analysis, A.O., A.B., L.K. and F.G; investigation, S.A.H., N.A and M.I.M.; resources, A.O., A.B., L.K. and F.G.; original draft preparation, A.O. and H.O.; writing—review and editing, A.O., H.O. and M.I.M.; visualization, A.O., H.O. and M.I.M.; supervision, A.O., A.B., L.K., H.O. and F.G.; funding acquisition, S.A.H. and N.A. All authors have read and agreed to the published version of the manuscript.

Funding

This research was funded by the Deanship of Scientific Research at Princess Nourah bint Abdulrahman University, through the Research Funding Program, Grant No. (FRP-1444-9).

Data Availability Statement

Not applicable.

Conflicts of Interest

The authors declare no conflict of interest.

References

  1. Jiang, H.; Chen, S.; Xiao, Z.; Hu, J.; Liu, J.; Dustdar, S. Pa-Count: Passenger Counting in Vehicles Using Wi-Fi Signals. IEEE Trans. Mob. Comput. 2023, 1–14. [Google Scholar] [CrossRef]
  2. Ding, W.; Fu, H.; Hu, Y. Characteristics Assessment and Comparative Study of a Segmented-Stator Permanent-Magnet Hybrid-Excitation SRM Drive with High-Torque Capability. IEEE Trans. Power Electron. 2018, 33, 482–500. [Google Scholar] [CrossRef]
  3. Mosaad, M.I. Direct Power Control of SRG-Based WECSs Using Optimised Fractional-Order PI Controller. IET Electr. Power Appl. 2020, 14, 409–417. [Google Scholar] [CrossRef]
  4. Chumacero, E.; Loría, A.; Espinosa-Pérez, G. Velocity-Sensorless Tracking Control and Identification of Switched-Reluctance Motors. Automatica 2014, 50, 3123–3130. [Google Scholar] [CrossRef] [Green Version]
  5. Tang, H.; Di, J.; Wu, Z.; Li, W. Temperature analysis for the asymmetric six-phase permanent magnet synchronous motor in healthy and fault-tolerant modes. IEEE Trans. Ind. Electron. 2022, 17, 1–12. [Google Scholar] [CrossRef]
  6. Krishnan, R. Switched Reluctance Motor Drives: Modeling, Simulation, Analysis, Design, and Applications; CRC Press LLC: Boca Raton, FL, USA, 2001. [Google Scholar]
  7. Farina, A. Simultaneous Measurement of Impulse Response and Distortion with a Swept-Sine Technique. In Proceedings of the 1999 IEEE Workshop on Applications of Signal Processing to Audio and Acoustics, New Paltz, NY, USA, 20 October 1999; pp. 1–15. [Google Scholar] [CrossRef]
  8. Crama, P.; Schoukens, J. Initial Estimates of Wiener and Hammerstein Systems Using Multisine Excitation. IEEE Trans. Instrum. Meas. 2001, 50, 1791–1795. [Google Scholar] [CrossRef]
  9. Schoukens, J.; Pintelon, R.; Rolain, Y. identification of Nonlinear and Linear Systems, Similarities, Differences, Challenges. IFAC Proc. Vol. 2006, 39, 122–124. [Google Scholar] [CrossRef]
  10. Brouri, A.; Kadi, L.; Slassi, S. Frequency Identification of Hammerstein-Wiener Systems with Backlash Input Nonlinearity. Int. J. Control. Autom. Syst. 2017, 15, 2222–2223. [Google Scholar] [CrossRef]
  11. Giri, F.; Radouane, A.; Brouri, A.; Chaoui, F.Z. Combined Frequency-Prediction Error Identification Approach for Wiener Systems with Backlash and Backlash-Inverse Operators. Automatica 2014, 50, 768–783. [Google Scholar] [CrossRef]
  12. Brouri, A.; Amdouri, O.; Chaoui, F.Z.; Giri, F. Frequency Identification of Hammerstein-Wiener Systems with Piecewise Affine Input Nonlinearity. IFAC Proc. Vol. 2014, 47, 10030–10035. [Google Scholar]
  13. Brouri, A.; Kadi, L.; Lahdachi, K. Identification of Nonlinear System Composed of Parallel Coupling of Wiener and Hammerstein Models. Asian J. Control 2021, 24, 1152–1164. [Google Scholar] [CrossRef]
  14. Schoukens, M.; Pintelon, R.; Rolain, Y. Parametric Identification of Parallel Hammerstein Systems. IEEE Trans. Instrum. Meas. 2011, 60, 3931–3938. [Google Scholar] [CrossRef]
  15. Radun, A. Analytically computing the flux linked by a switched reluctance motor phase when the stator and rotor poles overlap. IEEE Trans. Magn. 2000, 36, 1996–2003. [Google Scholar] [CrossRef]
  16. Aguado-Rojas, M.; Maya-Ortiz, P.; Espinosa-Pérez, G. On-Line Estimation of Switched Reluctance Motor Parameters. Int. J. Adapt. Control. Signal Process. 2018, 32, 950–966. [Google Scholar] [CrossRef]
  17. Kadi, L.; Brouri, A.; Ouannou, A. Frequency-Geometric Identification of Magnetization Characteristics of Switched Reluctance Machine. Adv. Syst. Sci. Appl. 2020, 20, 11–26. [Google Scholar] [CrossRef]
  18. Ouannou, A.; Giri, F.; Brouri, A.; Oubouaddi, H.; Abdelaali, C. Parameter Identification of Switched Reluctance Motor Using Exponential Swept-Sine Signal. IFAC-PapersOnLine 2022, 55, 132–137. [Google Scholar] [CrossRef]
  19. Emadi, A. (Ed.) Handbook of Automotive Power Electronics and Motor Drives, 1st ed.; CRC Press: Boca Raton, FL, USA, 2005. [Google Scholar] [CrossRef]
  20. Peng, F.; Ye, J.; Emadi, A. An Asymmetric Three-Level Neutral Point Diode Clamped Converter for Switched Reluctance Motor Drives. IEEE Trans. Power Electron. 2017, 32, 8618–8631. [Google Scholar] [CrossRef]
  21. Bilgin, B.; Jiang, J.W.; Emadi, A. Switched Reluctance Motor Drives: Fundamentals to Applications, 1st ed.; CRC Press/Taylor & Francis: Boca Raton, FL, USA, 2019; ISBN 9781787284395. [Google Scholar]
  22. Emadi, A.; Young Joo, L.; Rajashekara, K. Power Electronics and Motor Drives in Electric, Hybrid Electric, and Plug-In Hybrid Electric Vehicles. IEEE Trans. Ind. Electron. 2008, 55, 2237–2245. [Google Scholar] [CrossRef]
  23. Ouannou, A.; Brouri, A.; Kadi, L.; Oubouaddi, H. Identification of Switched Reluctance Machine Using Fuzzy Model. Int. J. Syst. Assur. Eng. Manag. 2022, 13, 2833–2846. [Google Scholar] [CrossRef]
  24. Sofiane, Y.; Tounzi, A.; Piriou, F. A Non Linear Analytical Model of Switched Reluctance Machines. Appl. Phys. 2002, 172, 163–172. [Google Scholar] [CrossRef]
  25. Zwerger, T.; Mercorelli, P. Using a Bivariate Polynomial in an EKF for State and Inductance Estimations in the Presence of Saturation Effects to Adaptively Control a PMSM. IEEE Access 2022, 10, 111545–111553. [Google Scholar] [CrossRef]
  26. Zwerger, T.; Mercorelli, P. Combining SMC and MTPA Using an EKF to Estimate Parameters and States of an Interior PMSM. In Proceedings of the 2019 20th International Carpathian Control Conference (ICCC), Krakow-Wieliczka, Poland, 26–29 May 2019; pp. 1–6. [Google Scholar]
  27. Barros, T.A.D.S.; Neto, P.J.D.S.; Filho, P.S.N.; Moreira, A.B.; Filho, E.R. An Approach for Switched Reluctance Generator in a Wind Generation System with a Wide Range of Operation Speed. IEEE Trans. Power Electron. 2017, 32, 8277–8292. [Google Scholar] [CrossRef]
  28. Diao, K.; Sun, X.; Bramerdorfer, G.; Cai, Y.; Lei, G.; Chen, L. Design Optimization of Switched Reluctance Machines for Performance and Reliability Enhancements: A Review. Renew. Sustain. Energy Rev. 2022, 168, 112785. [Google Scholar] [CrossRef]
  29. Garcia-Amoros, J.; Andrada, P.; Blanque, B.; Marin Genesca, M. Influence of Design Parameters in the Optimization of Linear Switched Reluctance Motor under Thermal Constraints. IEEE Trans. Ind. Electron. 2017, 46, 1. [Google Scholar] [CrossRef] [Green Version]
  30. Novak, A.; Lotton, P.; Simon, L. Synchronized Swept-Sine: Theory, Application, and Implementation. J. Audio Eng. Soc. 2015, 63, 786–798. [Google Scholar] [CrossRef]
  31. Yang, Z.; Yan, L. System Identification and Online Equalization Technique Based Swept Sine Vibration Testing Control. In Proceedings of the 2014 Sixth International Conference on Intelligent Human-Machine Systems and Cybernetics, Hangzhou, China, 26–27 August 2014. [Google Scholar] [CrossRef]
  32. Glentis, G.O.; Koukoulas, P.; Kalouptsidis, N. Efficient Algorithms for Volterra System Identification. IEEE Trans. Signal Process. 1999, 47, 3042–3057. [Google Scholar] [CrossRef]
  33. Liu, C.; Deng, Z.; Xie, L.; Li, K. The Design of the Simple Structure-Specified Controller of Magnetic Bearings for the High-Speed SRM. IEEE/ASME Trans. Mechatron. 2015, 20, 1798–1808. [Google Scholar] [CrossRef]
Figure 1. Polynomial GHM.
Machines 11 00625 g001
Figure 2. Instantaneous frequency variation from f 1 to f 2 (above) Swept-sine signal (below).
Machines 11 00625 g002
Figure 3. SRM 8/6 motor.
Machines 11 00625 g003
Figure 4. Estimated frequency response (above: Modulus; below: Phase) corresponding to the filter G 1 f .
Machines 11 00625 g004
Figure 5. Estimated frequency response (above: Modulus; below: Phase) corresponding to the filter G 2 f .
Machines 11 00625 g005
Figure 6. Estimated frequency response (above: Modulus; below: Phase) corresponding to the filter G 3 f .
Machines 11 00625 g006
Figure 7. (a) Comparison results between the actual and predicted outputs. (b) Zoom of comparison results between the actual and predicted outputs.
Machines 11 00625 g007aMachines 11 00625 g007b
Figure 8. Frequency response of the filter G 1 ( f ) Midway position. (a) Modulus. (b) Phase.
Machines 11 00625 g008
Figure 9. Frequency response of the filter G 2 ( f ) Midway position. (a) Modulus. (b) Phase.
Machines 11 00625 g009
Figure 10. Frequency response of the filter G 3 f Midway position. (a) Modulus. (b) Phase.
Machines 11 00625 g010
Figure 11. Inductance characteristics of SRM midway position. (a) inductance. (b) error between actual and estimated inductance.
Machines 11 00625 g011
Figure 12. Inductance characteristics of SRM unaligned position. (a) inductance. (b) error between actual and estimated inductance.
Machines 11 00625 g012
Figure 13. Inductance characteristics of SRM aligned position. (a) inductance. (b) error between actual and estimated inductance.
Machines 11 00625 g013
Figure 14. Frequency response of the filter G 1 ( f ) unaligned position. (a) Modulus. (b) Phase.
Machines 11 00625 g014
Figure 15. Frequency response of the filter G 2 ( f ) unaligned position. (a) Modulus. (b) Phase.
Machines 11 00625 g015
Figure 16. Frequency response of the filter G 3 ( f ) unaligned position. (a) Modulus. (b) Phase.
Machines 11 00625 g016
Table 1. Literature review comparison summary.
RefsOverviewContributionDrawbacks
[15]Identification method is developed online, but it fails to include the saturation effect. This hypothesis is not suitable for this type of electrical machine. Indeed, a highly saturated magnetic circuit features the latter, as the co-energy increases with the saturation level. Therefore, it works mainly in the magnetically saturated region.This model can be used to obtain the machine characteristics without requiring data measurement., it simply requires information on the geometry, flux density, iron saturation, and unsaturated iron permeability.This approach is not suitable for other positions. It is preferable to repeat this experiment for several rotor positions.
[7]An inexpensive method is introduced for measuring the transfer function of systems that are weakly non-linear and approximately time-invariant. The technique employs novel measurement techniques.There is no need to maintain tight synchronization between the sampling clock of the excitation signal and the system response.This technique works reliably if the system includes parts that exhibit non-linear behavior, and in these cases, the measurement results include the quantification of the harmonic distortion at various orders.
[14]The aim of this study is to introduce a new technique for identifying the parameters of parallel Hammerstein systems. In this approach, the linear dynamic aspects of the system are described by a parametric rational function in the z-domain, while the static nonlinear components are modeled using a linear combination of basic functions.The time required by this method to obtain the parameters is notably shorter. Unlike other algorithms, the main advantage of this approach is that the number of physical signal paths determines the number of parallel branches.The root mean square (RMS) error ratio between the parallel Hammerstein model and the single Hammerstein model is of value 10%.
[15]A three stages identification technique is developed. This solution gives the phase and modulus estimates of the linear part, as well as the estimates of the input and output nonlinearities.It is not necessary to have knowledge about the type of nonlinearity.To employ this approach, a significant quantity of data is required, which requires a slightly long computation time and large memory usage. Furthermore, this method has local convergence characteristics.
[10]A piecewise constant signal is utilized to detect the nonlinearities present in the system.A non-static nonlinearity (backlash or backlash-inverse).The dynamic nonlinearity is bordered by straight lines.
[16]The proposed approach by the authors involves a linear parametric model using a 2-stage identification process. In this solution, a recursive least-squares algorithm with a forgetting factor is used. This method assumes the availability of measurements for stator voltages and currents, as well as rotor position and speed.The identification method is developed online.The identification method does not take into account the saturation effect of the switched reluctance machine.
[17]In this work, the authors proposed an analytical modelling and identification method of magnetization characteristics of a SRM.
In this method, a Hammerstein model is excited by a signal having rich frequency spectrum. Its parameters can then be estimated using data acquisition and recursive least square (RLS).
The technic is based on frequency technics is developed allowing the identification of SRM nonlinearities (considering the saturation and the hysteresis effects).
This approach enjoys the simplicity of implementation, good convergence properties, and very fast computing time.
Identification scheme requires a less computational load and low memory usage.
the hysteresis effect is not considered. A filtering algorithm of the current at the winding terminal is suggested. Accordingly, the system nonlinearities can be easily identified using the recording of the phase current.
ProposedThe proposed technique is based on a parallel connection of several Hammerstein models that have polynomial nonlinearity. The model is driven by a swept-sine signal then finite element method analysis is performed to estimate the SRM parameters.This method can be performed easily allowing to obtain the flux-linkage characteristics with good accuracy. It also offers significant advantages in terms of signal-to-noise ratio and immunity to changes over time in the system being tested.Phase noise in linear blocks
Table 2. Parameters extracted from FEM software.
Current (A)Flux Linkage (Wb) 0°Inductance (H) 0°Flux Linkage (Wb) 15°Inductance (H) 15°Flux Linkage (Wb) 30°Inductance (H) 30°
0.2000.0660.3280.0320.1580.0120.061
0.4000.1310.3280.0630.1580.0240.061
0.6000.1970.3280.0950.1580.0360.061
0.8000.2620.3280.1260.1580.0480.061
1.0000.3280.3280.1580.1580.0610.061
1.2000.3930.3270.1890.1580.0730.061
1.4000.4580.3270.2210.1580.0850.061
1.6000.5230.3270.2520.1580.0970.061
1.8000.5860.3260.2830.1570.1090.061
2.0000.6480.3240.3130.1570.1210.061
Table 3. Mechanical parameter of the SRM 8/6.
Parameter DescriptionSymbolValueUnit
Number of stator teethNs8−−
Number of rotor teethNr6−−
Number of phasesq4−−
Number of turns/phasesN250
Bore diameterD46.02mm
Outer diameterD089.1mm
Air gap thicknessE0.8mm
Stator tooth heighths11.267mm
Rotor tooth heighthr7.498mm
Rotor tooth widthWr8.287mm
Stator tooth widthWs7.912mm
Rotor cylinder head thicknessYr6.263mm
Machine lengthL50mm
Table 4. Polynomial coefficient of inductance for three positions.
Position α 1 α 2 α 3 α 4
Aligned position 0° 1.07 × 10 2 1.23 × 10 2 2.74 × 10 2 3.79 × 10 1
Midway position 15° 7.75 × 10 2 7.75 × 10 2 6.98 × 10 2 2.44 × 10 1
Unaligned position 30° 4.11 × 10 2 4.11 × 10 2 4.10 × 10 2 1.02 × 10 1
Table 5. Estimated inductance in three positions.
Position L a c t u a l L e s t i m a t e d % E r r o r
Aligned position 0° 0.3893   H 0.4   H 1.07
Midway position 15° 0.1393   H 0.15   H 1.07
Unaligned position 30° 0.0499   H 0.0606   H 7.75
Table 6. Electrical parameter identification results.
ParameterActualEstimated% Error
R 0.8493 Ω 0.86 Ω 1.07
L a 0.3893 H0.4 H1.07
L m 0.1393 H0.15 H7.75
L u 0.0499 H0.0606 H4.11
Disclaimer/Publisher’s Note: The statements, opinions and data contained in all publications are solely those of the individual author(s) and contributor(s) and not of MDPI and/or the editor(s). MDPI and/or the editor(s) disclaim responsibility for any injury to people or property resulting from any ideas, methods, instructions or products referred to in the content.

