Abstract
In this paper, variable reactance (VR) criteria are proposed to mitigate voltage deviations in power transformers under light-load inductive and capacitive conditions, as well as for over-load conditions. Under capacitive load conditions, power transformers are affected by the Ferranti effect as much as AC lines are and can suffer damage if a large over-voltage is present at the secondary winding. A classical solution for this is the installation of expensive and bulky inductive reactors at different locations of the AC lines to absorb the reactive power. Instead, this paper addresses VR techniques focused on power transformer reactance modification to compensate for the over-voltage. With these techniques, the Ferranti effect on power lines can also be reduced. Another benefit is the cancellation of over-voltages whose cause is different from the Ferranti effect, namely under inductive load conditions. In addition, they can also enhance the parallel operation of power transformers by allowing more flexibility for overload sharing among transformers. The VR techniques are derived from the Kapp phasor-diagram theory and have been validated experimentally at a small scale in the laboratory. When implemented in a big network, they can also improve the load-flow voltage and AC line-loading profiles and even increase the power factor of certain generators.
1. Introduction
The problem of over-voltage in AC grids can be due to several causes [1]. These causes may involve a reactive power imbalance with excessive reactive power levels within an AC grid [2]. Apart from this, significant load shedding can provoke over-voltages and may even imply voltage instability [3]. Furthermore, harmonics, resonances, switching operations and faults may lead to the amplification of voltage levels due to non-linear loads, power electronic devices, insulation failures or ground faults, among others [4,5,6].
Currently, there are also renewable energy generators that impact the grid voltage levels, especially if not properly controlled [7]. Last but not least, the over-voltage level may be due to inadequate grid planning or even voltage regulation and control issues [8,9], as the traditional load voltage regulating transformers are still used [10]. Therefore, there is still room for improvement in this area, and the present paper encompasses this general topic.
The Ferranti effect has been traditionally studied in transmission lines, with almost no mention of the power transformers that are part of their surroundings [11,12]. However, under capacitive load conditions, power transformers are also affected by the Ferranti effect and can suffer from damage if a large over-voltage is present at the secondary winding. A classical solution for it is the installation of expensive and bulky inductive reactors at different locations of the lines to absorb the reactive power [11,13,14,15,16,17,18].
However, other measures in the literature have been found to mitigate the Ferranti effect and to compensate for reactive power [19,20,21]. In [22,23], the usage of a static synchronous compensator as a FACT device is proposed to mitigate the Ferranti effect on an AC line. In a similar way, the authors in [24,25] used a thyristor-controlled reactor based on a FACT device to compensate for the Ferranti effect. In [26], energy storage systems were studied for the purpose of minimizing reactive power requirements and, therefore, avoiding Ferranti effect issues. In addition, there are authors that use static VAR compensators to mitigate Ferranti effect [22,27].
However, neither of these papers considered power transformers as key elements that also suffer from the Ferranti effect. Indeed, they can also provide countermeasure effects as well as fault diagnosis [28]. Nevertheless, the authors in [29] developed a variable-reactance transformer to limit the fault current and adjust the secondary voltage that relies on a movable iron block as the mechanism to change the value of the leakage reactance. Furthermore, in [30], an improved saturable reactance transformer with a main core and a pair of adjacent auxiliary cores was invented, where the auxiliary cores carry DC control windings that control the reactance of the main core. The mechanism for reactance change relies on a control voltage signal applied to the control windings that regulates the output of the secondary windings. However, the criteria for reactance change under different load conditions were neither extracted nor proved.
Therefore, in this paper, criteria for VR techniques are derived from a Kapp phasor diagram of a power transformer under light-load inductive and capacitive conditions as well as over-load conditions. The VR techniques have the advantage of being computable using phasors measured by PMUs and have been validated experimentally at a small scale in the laboratory. With these VR techniques, the Ferranti effect on power lines can also be reduced, and consequently, expensive compensation reactance can be reduced in size. Hence, the main contributions of this paper are summarized below:
- An analytical framework that relates load power factor, load index and transformer leakage reactance with the module and sign of the transformer internal voltage drop.
- Experimental results that demonstrate the displacement of the load power factor at which the transformer first experiences the Ferranti effect under capacitive loads, thanks to the modification of transformer leakage reactance. Evolution of Ferranti angle for different load indices and transformer reactance levels. Exploration of the transformer’s behavior at light- and over-load inductive conditions.
- Based on the analytical expressions and experimental results, transformer VR techniques are defined that mitigate voltage deviations at the secondary windings of transformers under light-load capacitive and inductive conditions, as well as in over-load conditions in a set of two transformers working in parallel.
- Impact of the VR techniques on a simplified 2-bus system. Mitigation of the Ferranti effect on an AC line and reduction of the necessary shunt reactor size. Mitigation of over-voltage at the secondary winding under light-load inductive conditions. Flexibility enhancement of the parallel work of two transformers at over-load conditions.
- Impact of the VR techniques in other grid elements near to the transformer within a large, standardized grid, the IEEE-39-node AC grid. Modification of voltage profile of nodes, change in AC lines loading levels, other transformer’s loading levels and power factor levels at generator buses.
The paper is organized as follows: In Section 2, a theoretical analysis is provided for power transformers at light-load capacitive and inductive conditions as well as for over-load conditions. As a result, analytical relationships that relate the effect of the power factor on the sign of the internal voltage drop of the transformer as well as the impact of transformer reactance on the mitigation of over-voltages in light-load capacitive and inductive conditions are obtained. Furthermore, similar guidelines for the transformer reactance change address the case of overload sharing between two transformers working in parallel to manage the overload more efficiently or even to cancel it, as well as to prevent them from suffering from under-voltages. In Section 3, the methodology followed in this paper is presented, and further steps are described. This methodology consists of three stages: an analytical stage, the experimental verification in a laboratory and the simulation in both a simplified and a large grid to study the impacts of VR techniques on other grid elements. In Section 4, the experimental verification at a small-scale in a laboratory is presented, together with the description of the experimental setup and results. In Section 5, proposals of corrective VR techniques for the different studied situations are given, namely light-load inductive and capacitive conditions as well as over-load conditions. In Section 6, the simulation of the three different VR techniques is addressed in two types of AC grids: a simplified 2-bus system grid and an IEEE-39 node grid. In the simplified 2-bus system grid, the three VR techniques are implemented for three different transformers; in addition, for the step-down transformer, the implementation of the VR technique demonstrates the mitigation of the Ferranti effect, not only at the secondary side of the transformer but also at the receiving end of the adjacent AC line, with simultaneous reduction in the required reactance. In the IEEE-39 node grid one, the impact of the three VR techniques on other grid elements is studied, considering overall voltage profiles, AC line-loading levels, other transformers’ loading levels and power factor levels or the generators. In Section 7, the main conclusions are extracted.
2. Analysis of Power Transformers in Light- and Over-Load Conditions
In this section, the main theoretical relationships of a power transformer are extracted from its single-phase approximate equivalent circuit in light- and over-load conditions and from phasor and Kapp’s diagrams. The main outcomes of this section will be:
- The analytical expression of the relative internal voltage drop, , as a function of the short-circuit reactance, , the power factor at the secondary side, , and the load index, λ.
- The analytical expression of the Ferranti angle, , as a function of the load index, λ, and the short-circuit reactance of the power transformer, .
- Criteria for the variation of the short-circuit reactance of the power transformer, , as a function of the load index; the power factor at the secondary side and the source of over-voltage. From this relationship, the VR techniques will be extracted for both light-load capacitive and inductive conditions as well as for over-load conditions.
To extract these relationships, the approximate single-phase equivalent circuit reduced at the primary side of a three-phase transformer is presented in Figure 1. In it, the main equivalent circuit parameters are indicated, namely those of the series branch, , and , being the short-circuit resistance, reactance and impedance, respectively, and these of the parallel branch, and , being the iron-core resistance and magnetizing reactance, respectively.
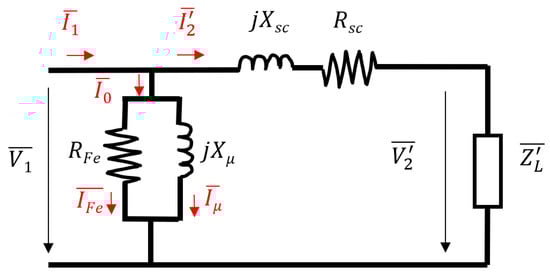
Figure 1.
Approximate single-phase equivalent circuit reduced to the primary side of a three-phase power transformer.
Different measurable magnitudes are also depicted in Figure 1, such as the primary phase voltage and current, and respectively; the secondary phase voltage and the current referred to the primary side, and , respectively; and the no-load currents, , and .
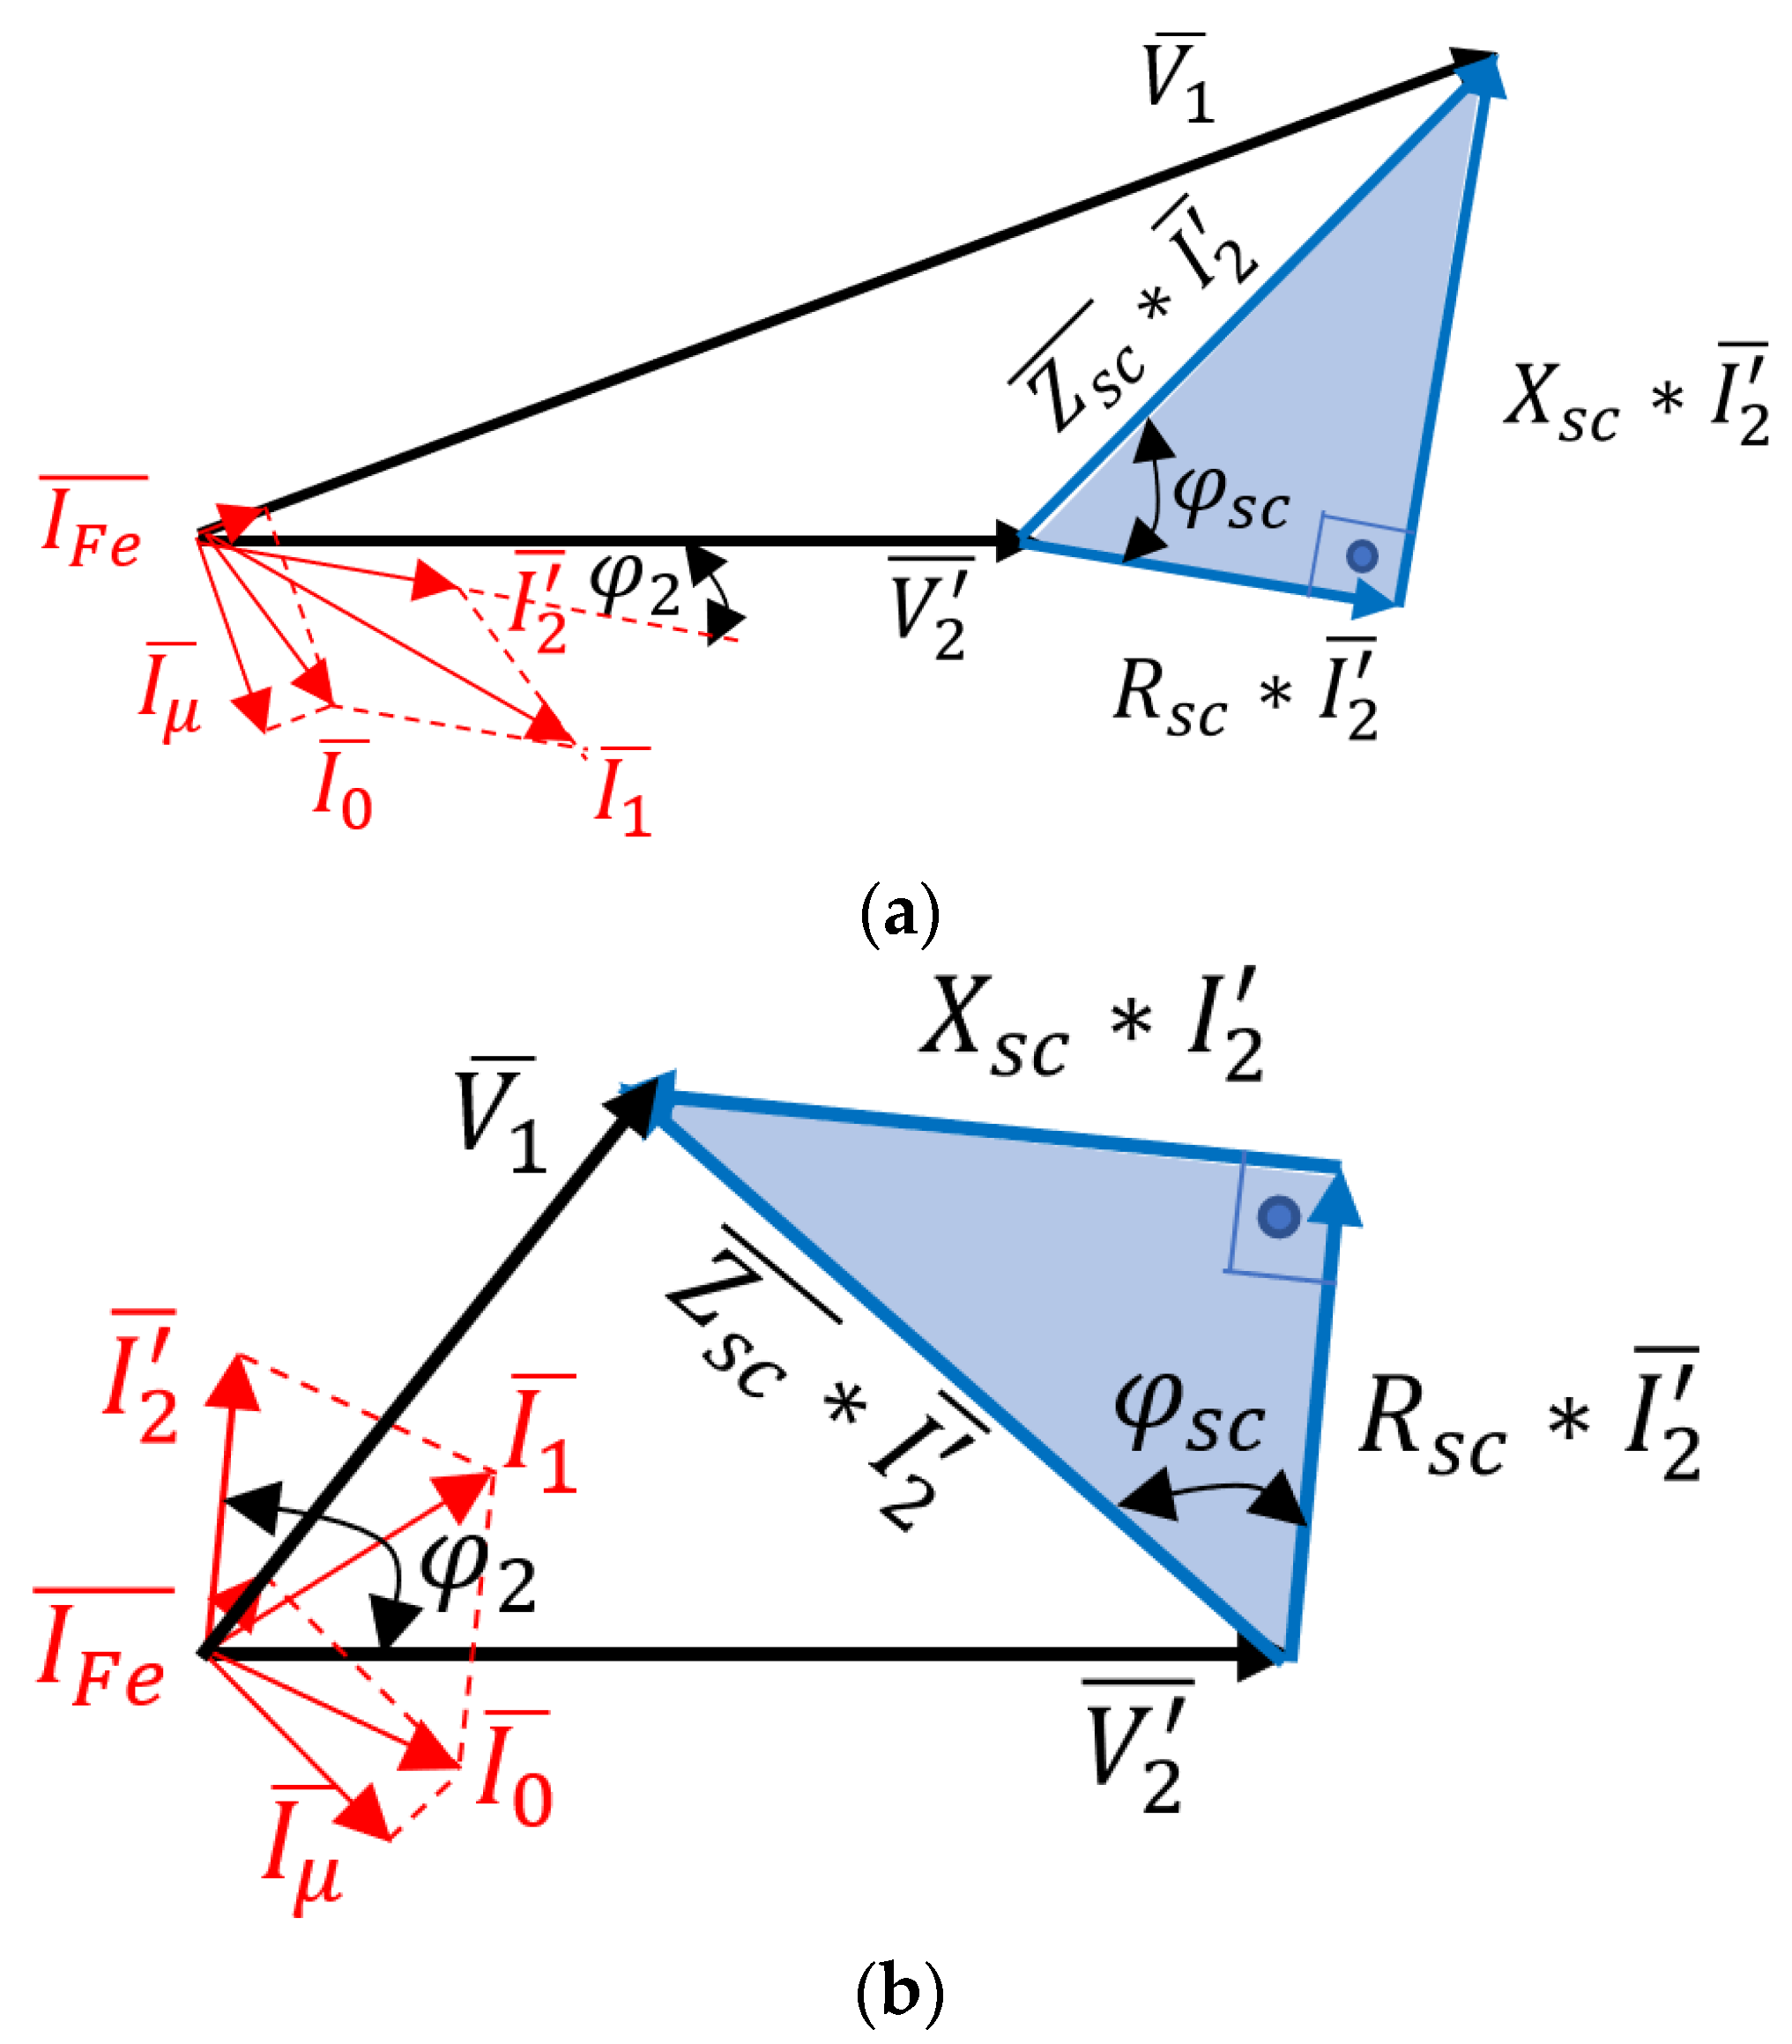
The load connected at the secondary side of the transformer is also included by means of and may imply unity, or a lagging or leading power factor. Based on the sign of the power factor at the secondary side of the transformer, two phasor diagrams are depicted in Figure 2a,b, which correspond to a lagging and leading power factor at the secondary side, respectively.
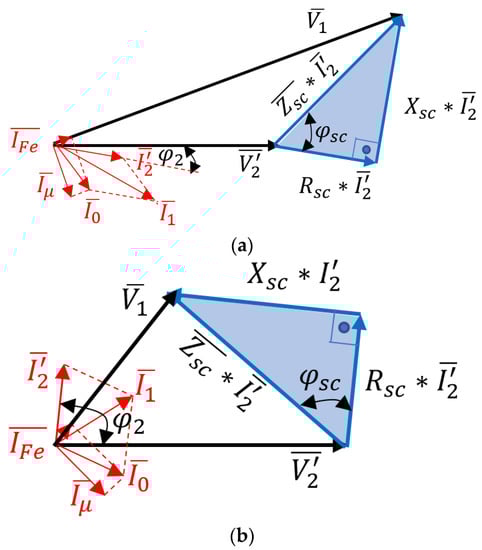
Figure 2.
Phasor diagram for a power transformer connected to (a) an inductive load (lagging power factor at the secondary side) or (b) a capacitive load (leading power factor at the secondary side).
Assume that is equal to the rated primary phase voltage . According to Figure 2, the phasor diagram of the transformer connected to an inductive load will impose a lagging power factor at the secondary side, and the condition is always guaranteed for the complete spectrum of lagging power factors at the secondary side of the transformer. This implies that the internal voltage drop for every lagging power factor level is positive. Therefore, unless there are over-voltages on the primary side, the phase voltage at the secondary side will not suffer any over-voltage.
However, the phasor diagram of the transformer connected to a capacitive load will impose a leading power factor at the secondary side, and the condition is not always guaranteed. Indeed, there will be a maximum power factor level at which , and below this power factor level at the secondary side, the transformer internal voltage drop will be negative. Therefore, this leading power factor level will define the sign change for an internal voltage drop of the transformer and, thus, the occurrence of the Ferranti effect. Therefore, the phase angle corresponding to the power factor level at the secondary side that first makes the condition true will be designated from now on as the Ferranti angle, . Hence, power factor levels that correspond to phase angles greater than will produce the Ferranti effect. These angles will imply over-voltage condition at the secondary side of the transformer, which endangers equipment connected to it.
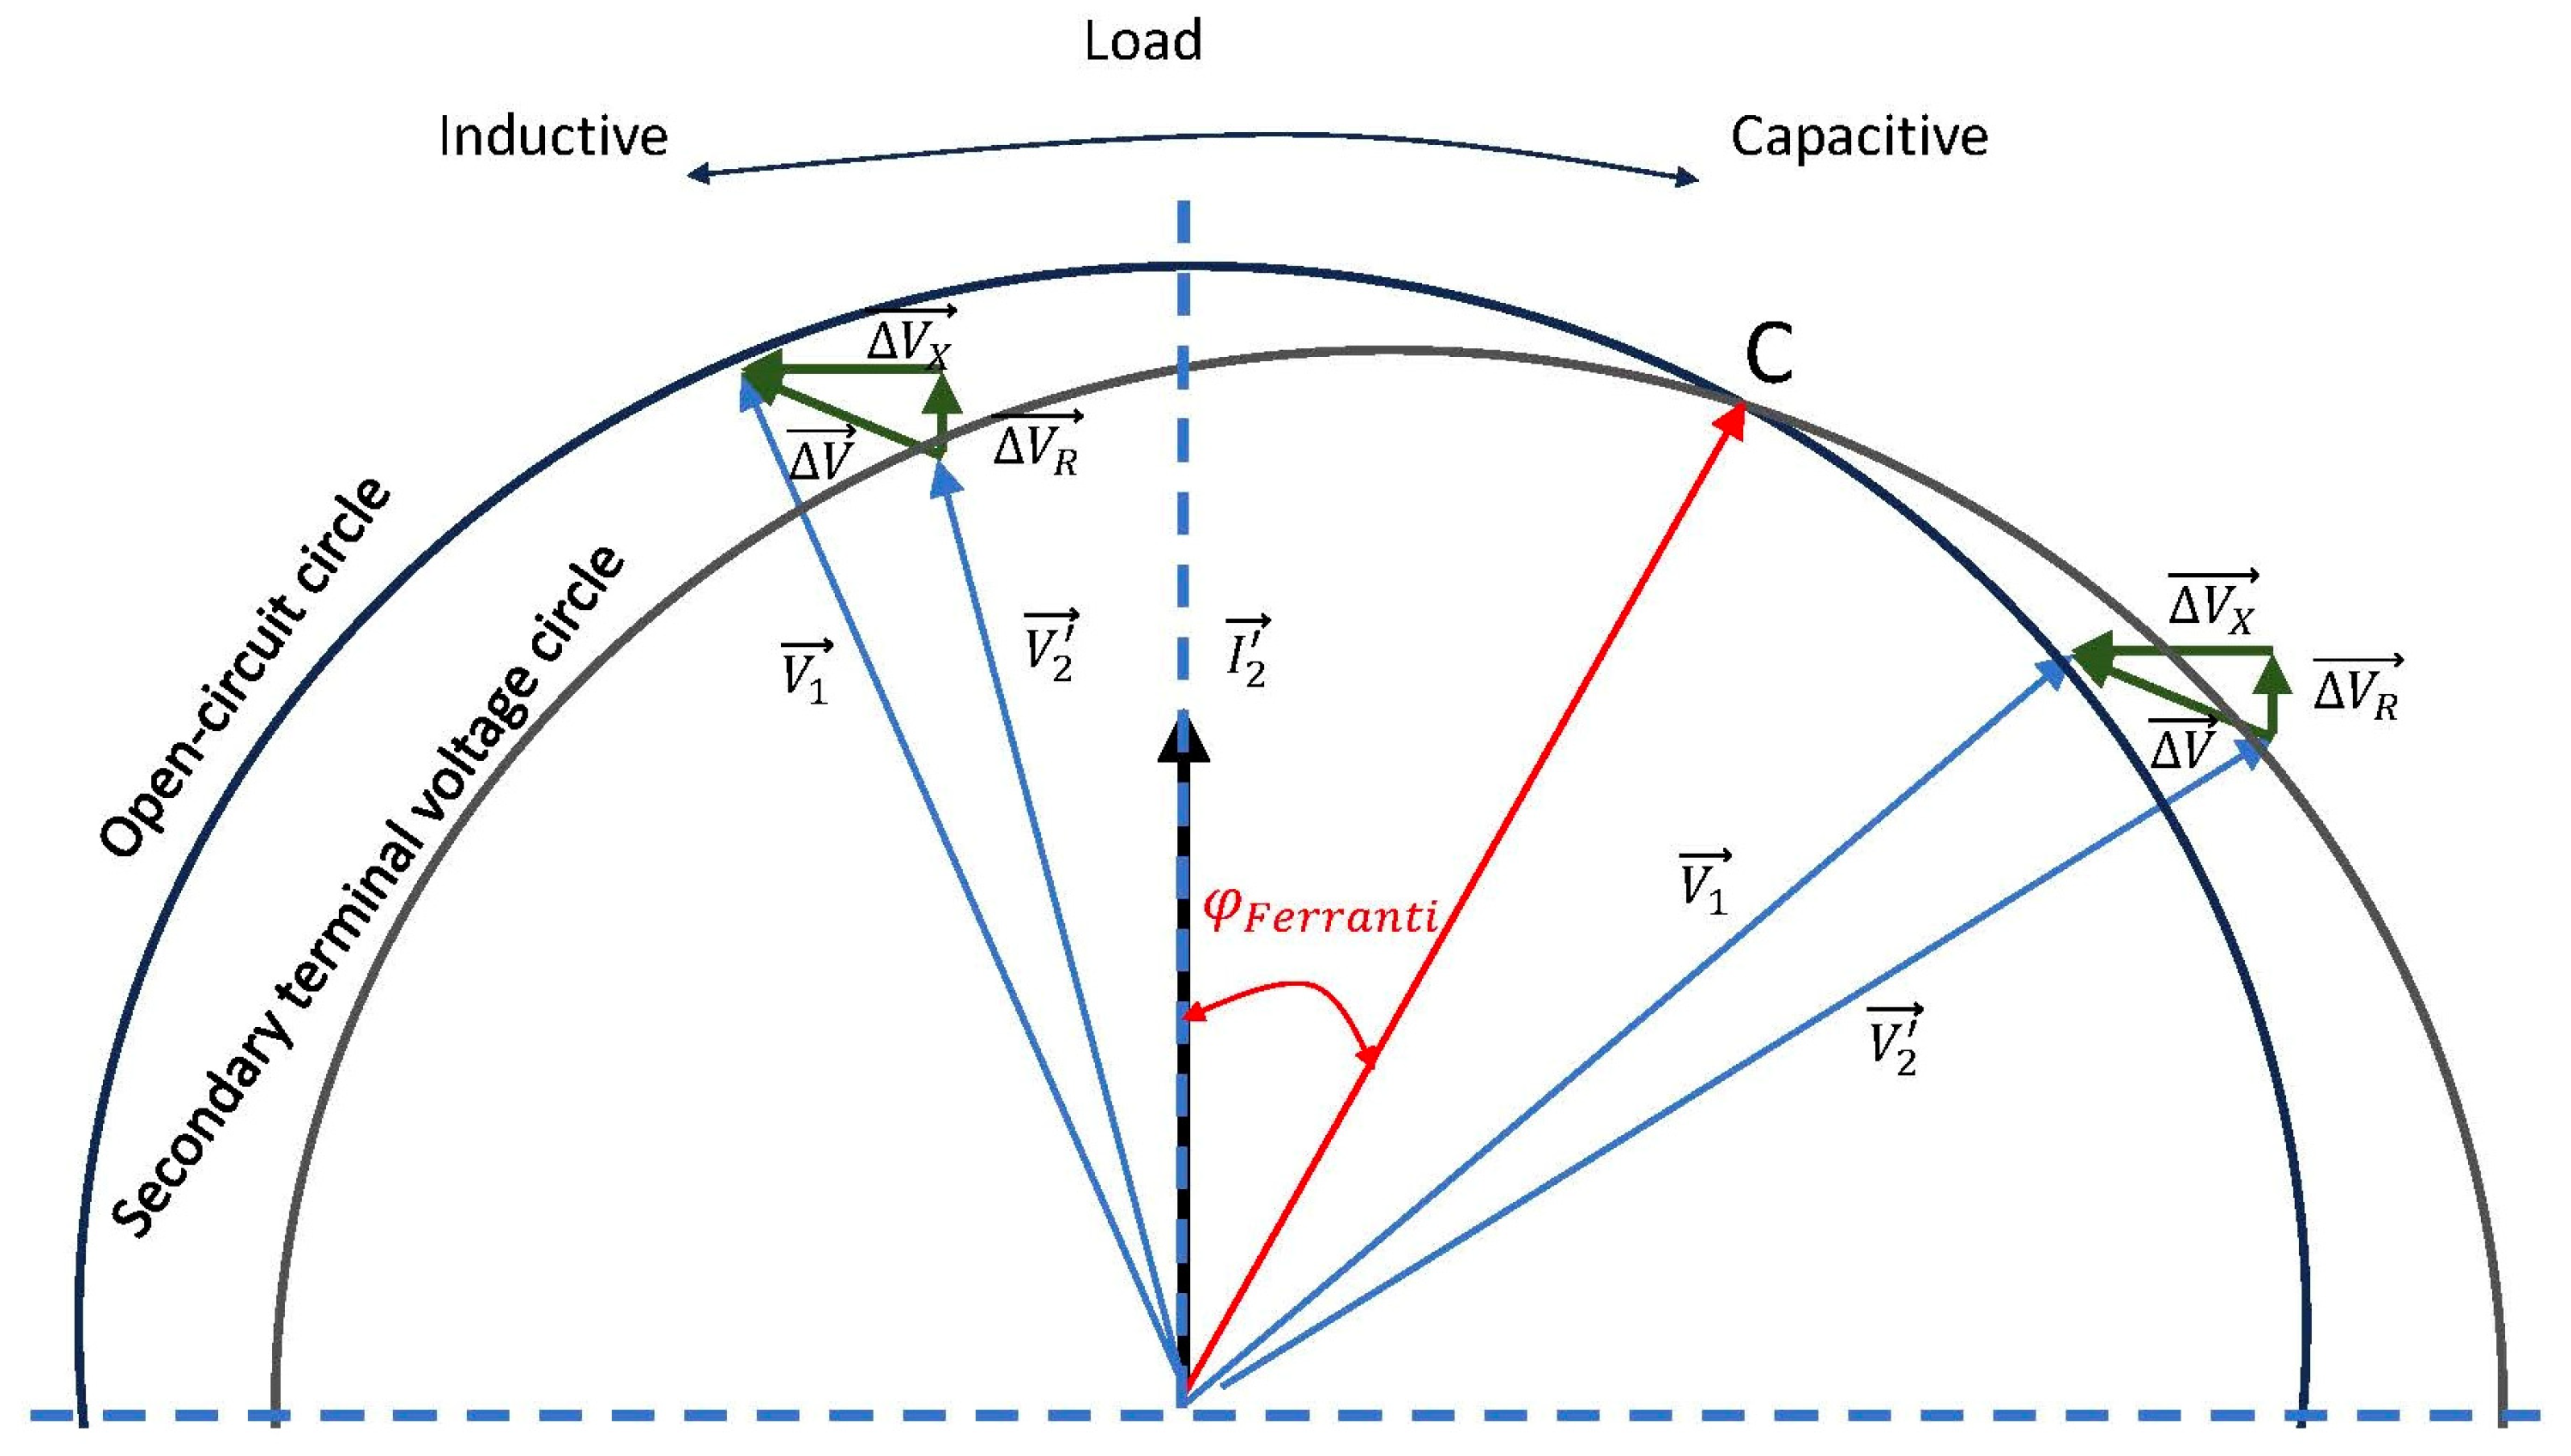
In Figure 3, phasor diagrams of a transformer for both inductive (lagging) and capacitive (leading) load conditions, as well as the Ferranti angle, , are depicted graphically based on Kapp’s diagram.
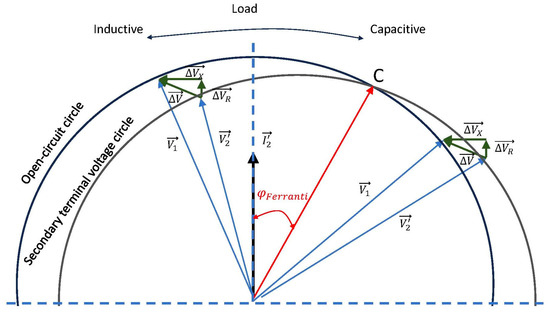
Figure 3.
Kapp’s diagram for a power transformer.
According to Figure 3, the phase shift between the vector and the vector connecting the origin with the point marked with “C” is depicted as the Ferranti angle, . The point “C” is defined as the intersection between the open-circuit circle, whose radius is , and the secondary terminal voltage circle, whose radius is . Therefore, the “C” point marks the leading power factor level at the secondary side that makes the internal voltage drop negative and, therefore, implies over-voltage due to the Ferranti effect.
The relative internal voltage drop for a power transformer can be approximated as a function of the load index, λ, the short-circuit angle (º), the secondary power factor angle (º), the primary rated current , the primary rated voltage , and the short-circuit resistance, reactance and impedance, , respectively, as indicated in (1).
The expression in (1) presents a sign to indicate the sign of the power factor at the secondary side of the transformer. Therefore, there will be a “+” sign for leading power factors and a “−” sign for lagging power factors.
Hence, the analytical expression of is calculated by using the expression in (1) for leading power factors and making it equal to zero, as indicated in (2). Thus, in (3), the approximate expression for is obtained, and in (4), a more accurate expression of the Ferranti angle is formulated based on the phasor diagram in Figure 3.
Therefore, a set of conclusions are derived from the analytical expressions for capacitive load conditions:
- is very similar for different λ load indices but for greater load indices, slightly increases.
- For greater λ load indices, higher values will be obtained.
- For greater short-circuit angle values, is reduced. A greater can be obtained by increasing . In this way, the Ferranti effect can appear for a greater variety of secondary power factor levels.
- For lower short-circuit angle values is increased. A lower can be obtained by decreasing . In this way, the Ferranti effect can appear for a lower variety of secondary power factor levels.
- Therefore, to minimize the risk of the Ferranti effect in capacitive load conditions, should be as high as possible so that it is difficult to be exceeded. In essence, should be as low as possible to avoid over-voltage at low leading power factors.
Similarly, a set of conclusions can be derived from the analytical expressions for inductive load conditions:
- There is no Ferranti effect and no sign change for the transformer internal voltage drop, this being always positive.
- For greater λ load indices, higher values will be obtained.
- If the source of over-voltage is on the primary side, greater values of are preferred to mitigate over-voltage at the secondary side, as .
- If a transformer which works in parallel with another transformer is subjected to over-load conditions, as its is increased, the overload can be transferred to the second transformer to achieve a better share of the overload or even to cancel the overload for the complete set of transformers, A and B, working in parallel. This comes from the condition of equal voltage drops at both transformers, as indicated in (5).
- Therefore, if is increased by means of , then must be decreased and vice versa.
3. Methodology
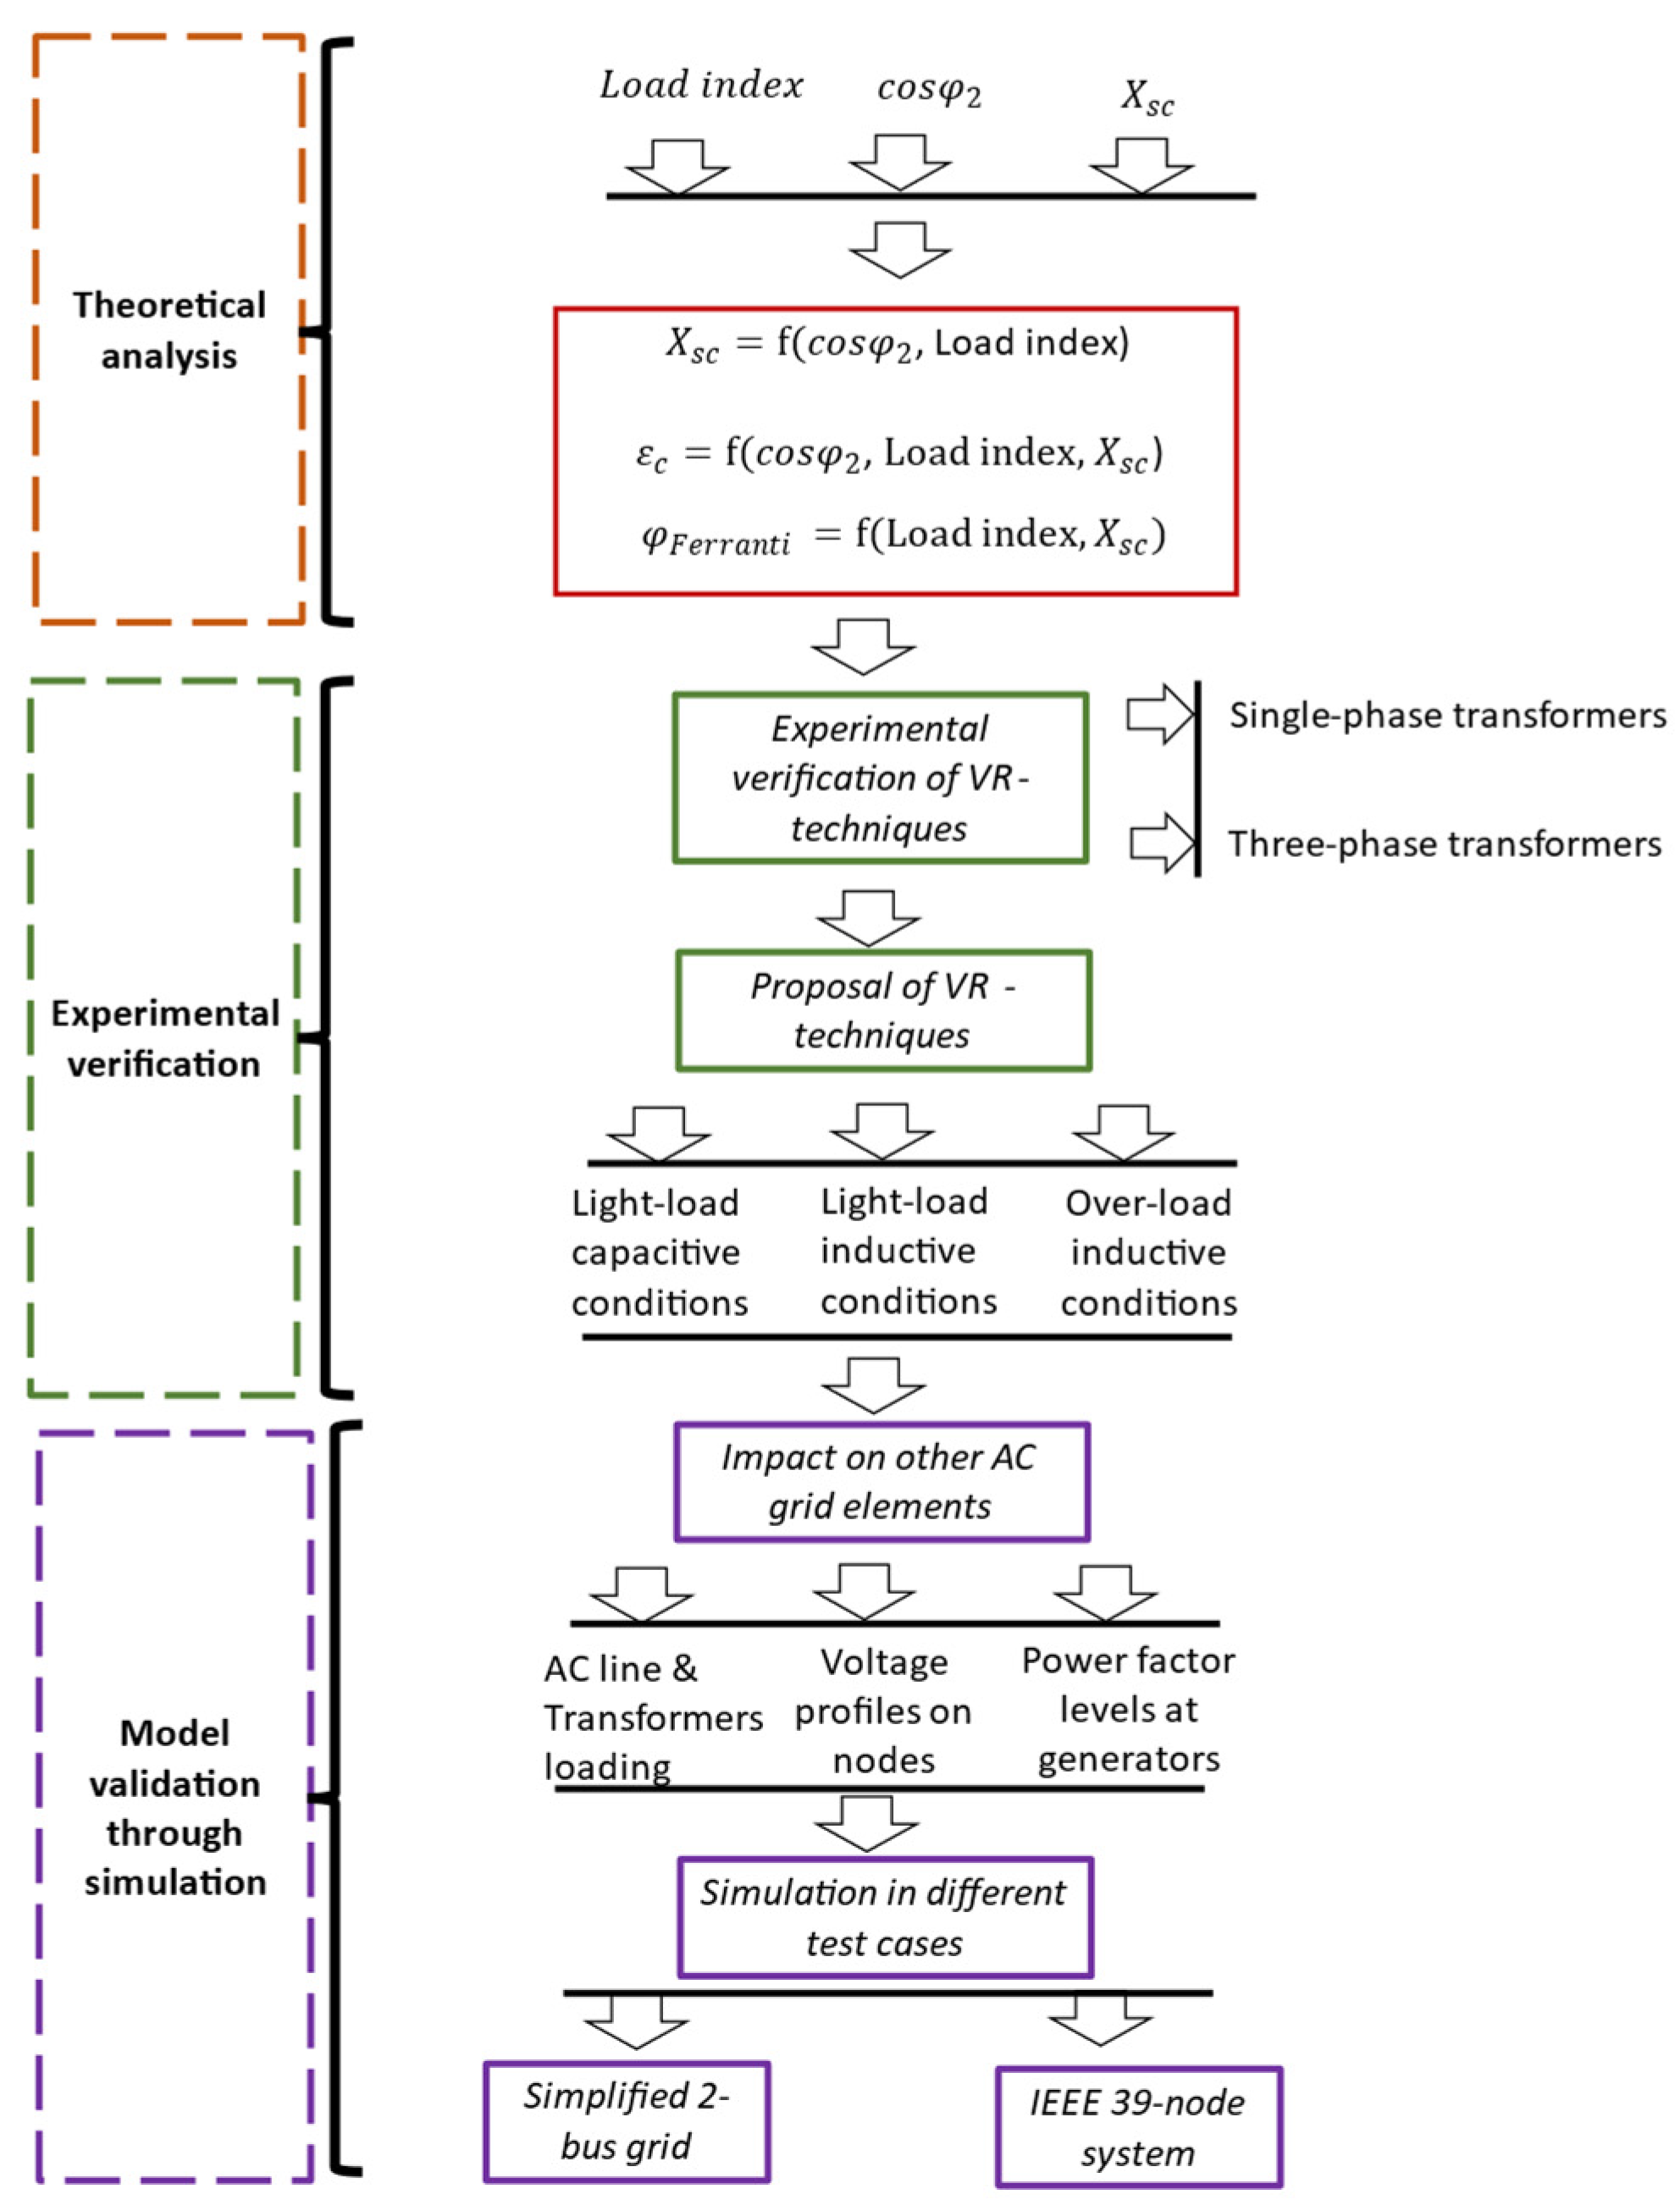
In this section, the methodology for this paper is described. In Figure 4, the methodology is presented by means of a flow-chart.

Figure 4.
Flow-chart of the methodology followed in this paper.
The methodology is composed of 3 stages: theoretical analysis, experimental verification and model validation through simulations.
In the first stage, the main theoretical equations are described for a power transformer at different load conditions. In the case of capacitive loads, the analytical expressions for the Ferranti angle are formulated based on corrective measures for transformer parameters that could mitigate the over-voltage level at the transformer secondary side. In the case of inductive loads, a similar analysis is developed, and analogous corrective actions on transformer parameters are studied. In addition, in a set of 2 transformers working in parallel, a similar analysis is carried out, but in this case, for over-load conditions. Therefore, the outcome of this stage is the proposal of VR techniques to be applied to transformers subjected to a variety of load conditions, such as over-voltage in light-load capacitive or inductive conditions or under-voltage in over-load inductive conditions. This stage has been described in Section 2.
In the second stage, an experimental study is carried out to verify the analytical relationships extracted in stage 1 and to provide more information regarding critical events, such as the change of sign in the internal voltage drop when the transformer is subjected to capacitive conditions. This stage is divided into two separate tasks: experiments for a single-phase transformer and those for a three-phase transformer. For both types of transformers, the main implications derived from the theoretical analyses in Section 2 are confirmed. In addition, the asymmetrical behavior in power and currents of the three-phase transformer topology is explored when considering the reactance changes.
In the third stage, the proposed framework is validated through simulations, on the one hand, on a simplified 2-bus grid, and on the other hand, on an IEEE 39 node system to analyze the impact on other grid elements, such as in the loading level of other transformers and AC lines, the voltage profile of nodes and the power factor levels at generators.
The final conclusions are finally proved to be consistent with the developed methodological stages, and pros and cons are finally addressed for these VR techniques, considering other grid elements.
4. Experimental Study
In this section, experimental verification stages are developed for both single-phase and three-phase transformers. These experimental setups have been built in the Laboratory of Electrical Machinery of the Electrical Engineering Department of the University of Zaragoza, Spain. First, an experimental setup was implemented for testing single-phase transformers to confirm the previous implications extracted in Section 2. Afterwards, a second experimental setup was also implemented for testing three-phase transformers to explore the effect of asymmetrical power and currents due to the central column of the core.
4.1. Description of Experimental Setups and Instrumentation
The instrumentation used for sensing the different variables in these tests consists of two grid analyzers based on current transformers, whose main datasheet parameters are included in Table 1.

Table 1.
Main datasheet information of the grid analyzer Circutor CVM-C10-ITF-485-ICT2.
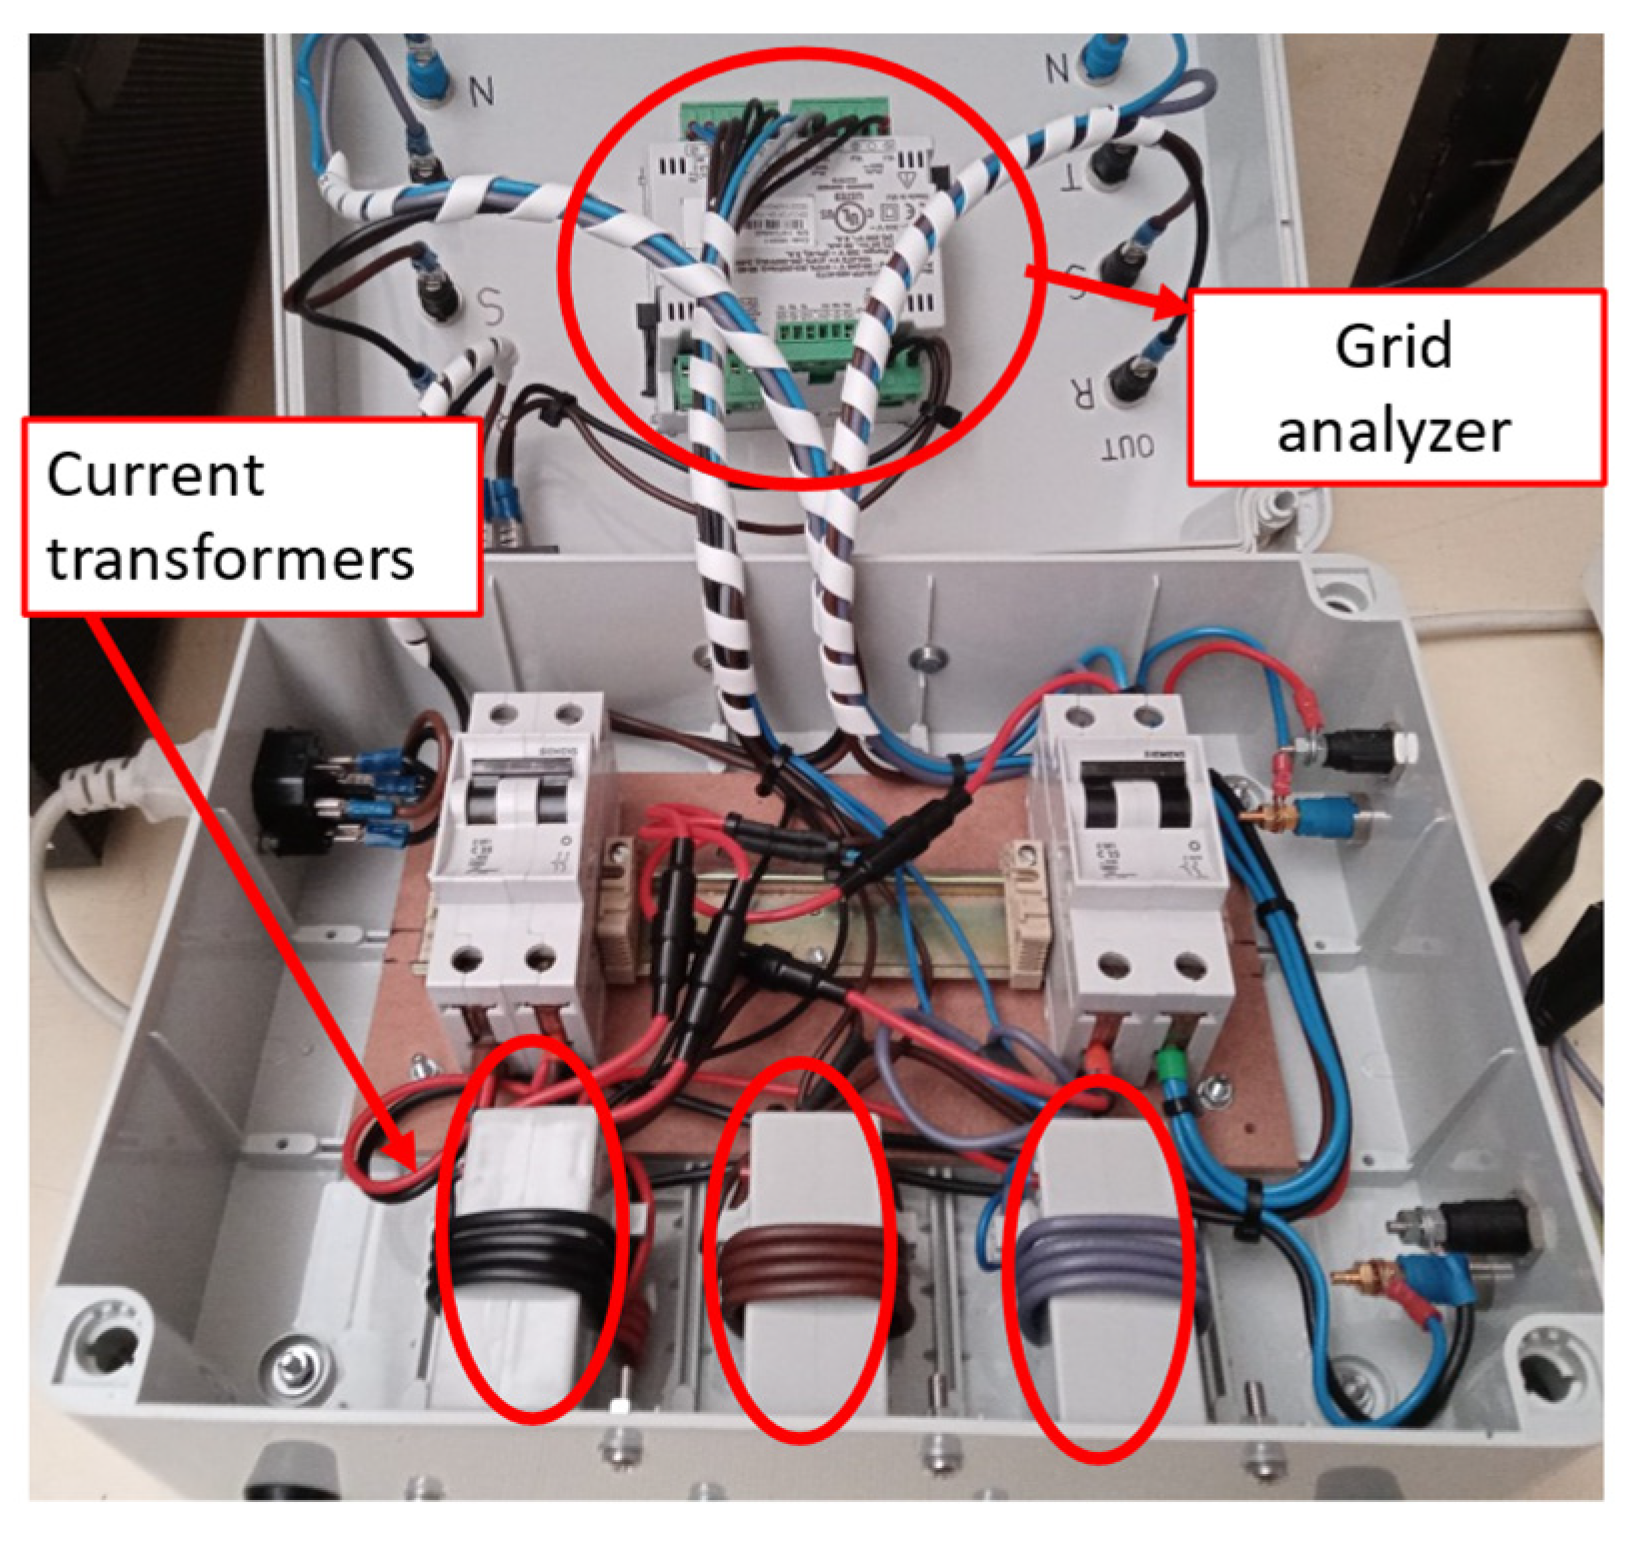
However, since the nominal current for the grid analyzer is set to 5A, as indicated in Table 1, and the maximum current to be sensed is 10 A, in the case of three-phase transformers, these grid analyzers include three current transformers inside its case, as seen in Figure 5. The aforementioned current transformers convert the measurable current (maximum 10 A) into a lower current that is compatible with the measurement unit of the grid analyzer. The main datasheet information for current transformers is included in Table 2.
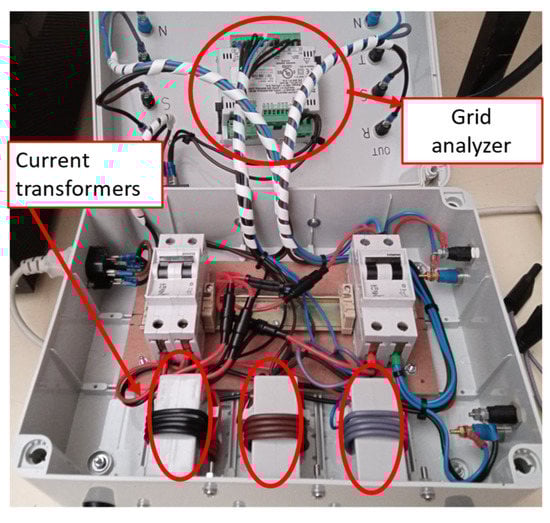
Figure 5.
Inner case of the grid analyzer.
Table 2.
Main datasheet information of a current transformer, c.
As seen in Figure 5, the number of primary turns of these current transformers have been increased to 6, thanks to the cable arrangements, so that whenever there are 10 A to be measured, the current transformers inside the grid analyzer reduce this current to 830 mA. This last value of the sensed current is then compatible with the nominal current rating of the grid analyzer, which is 5 A.
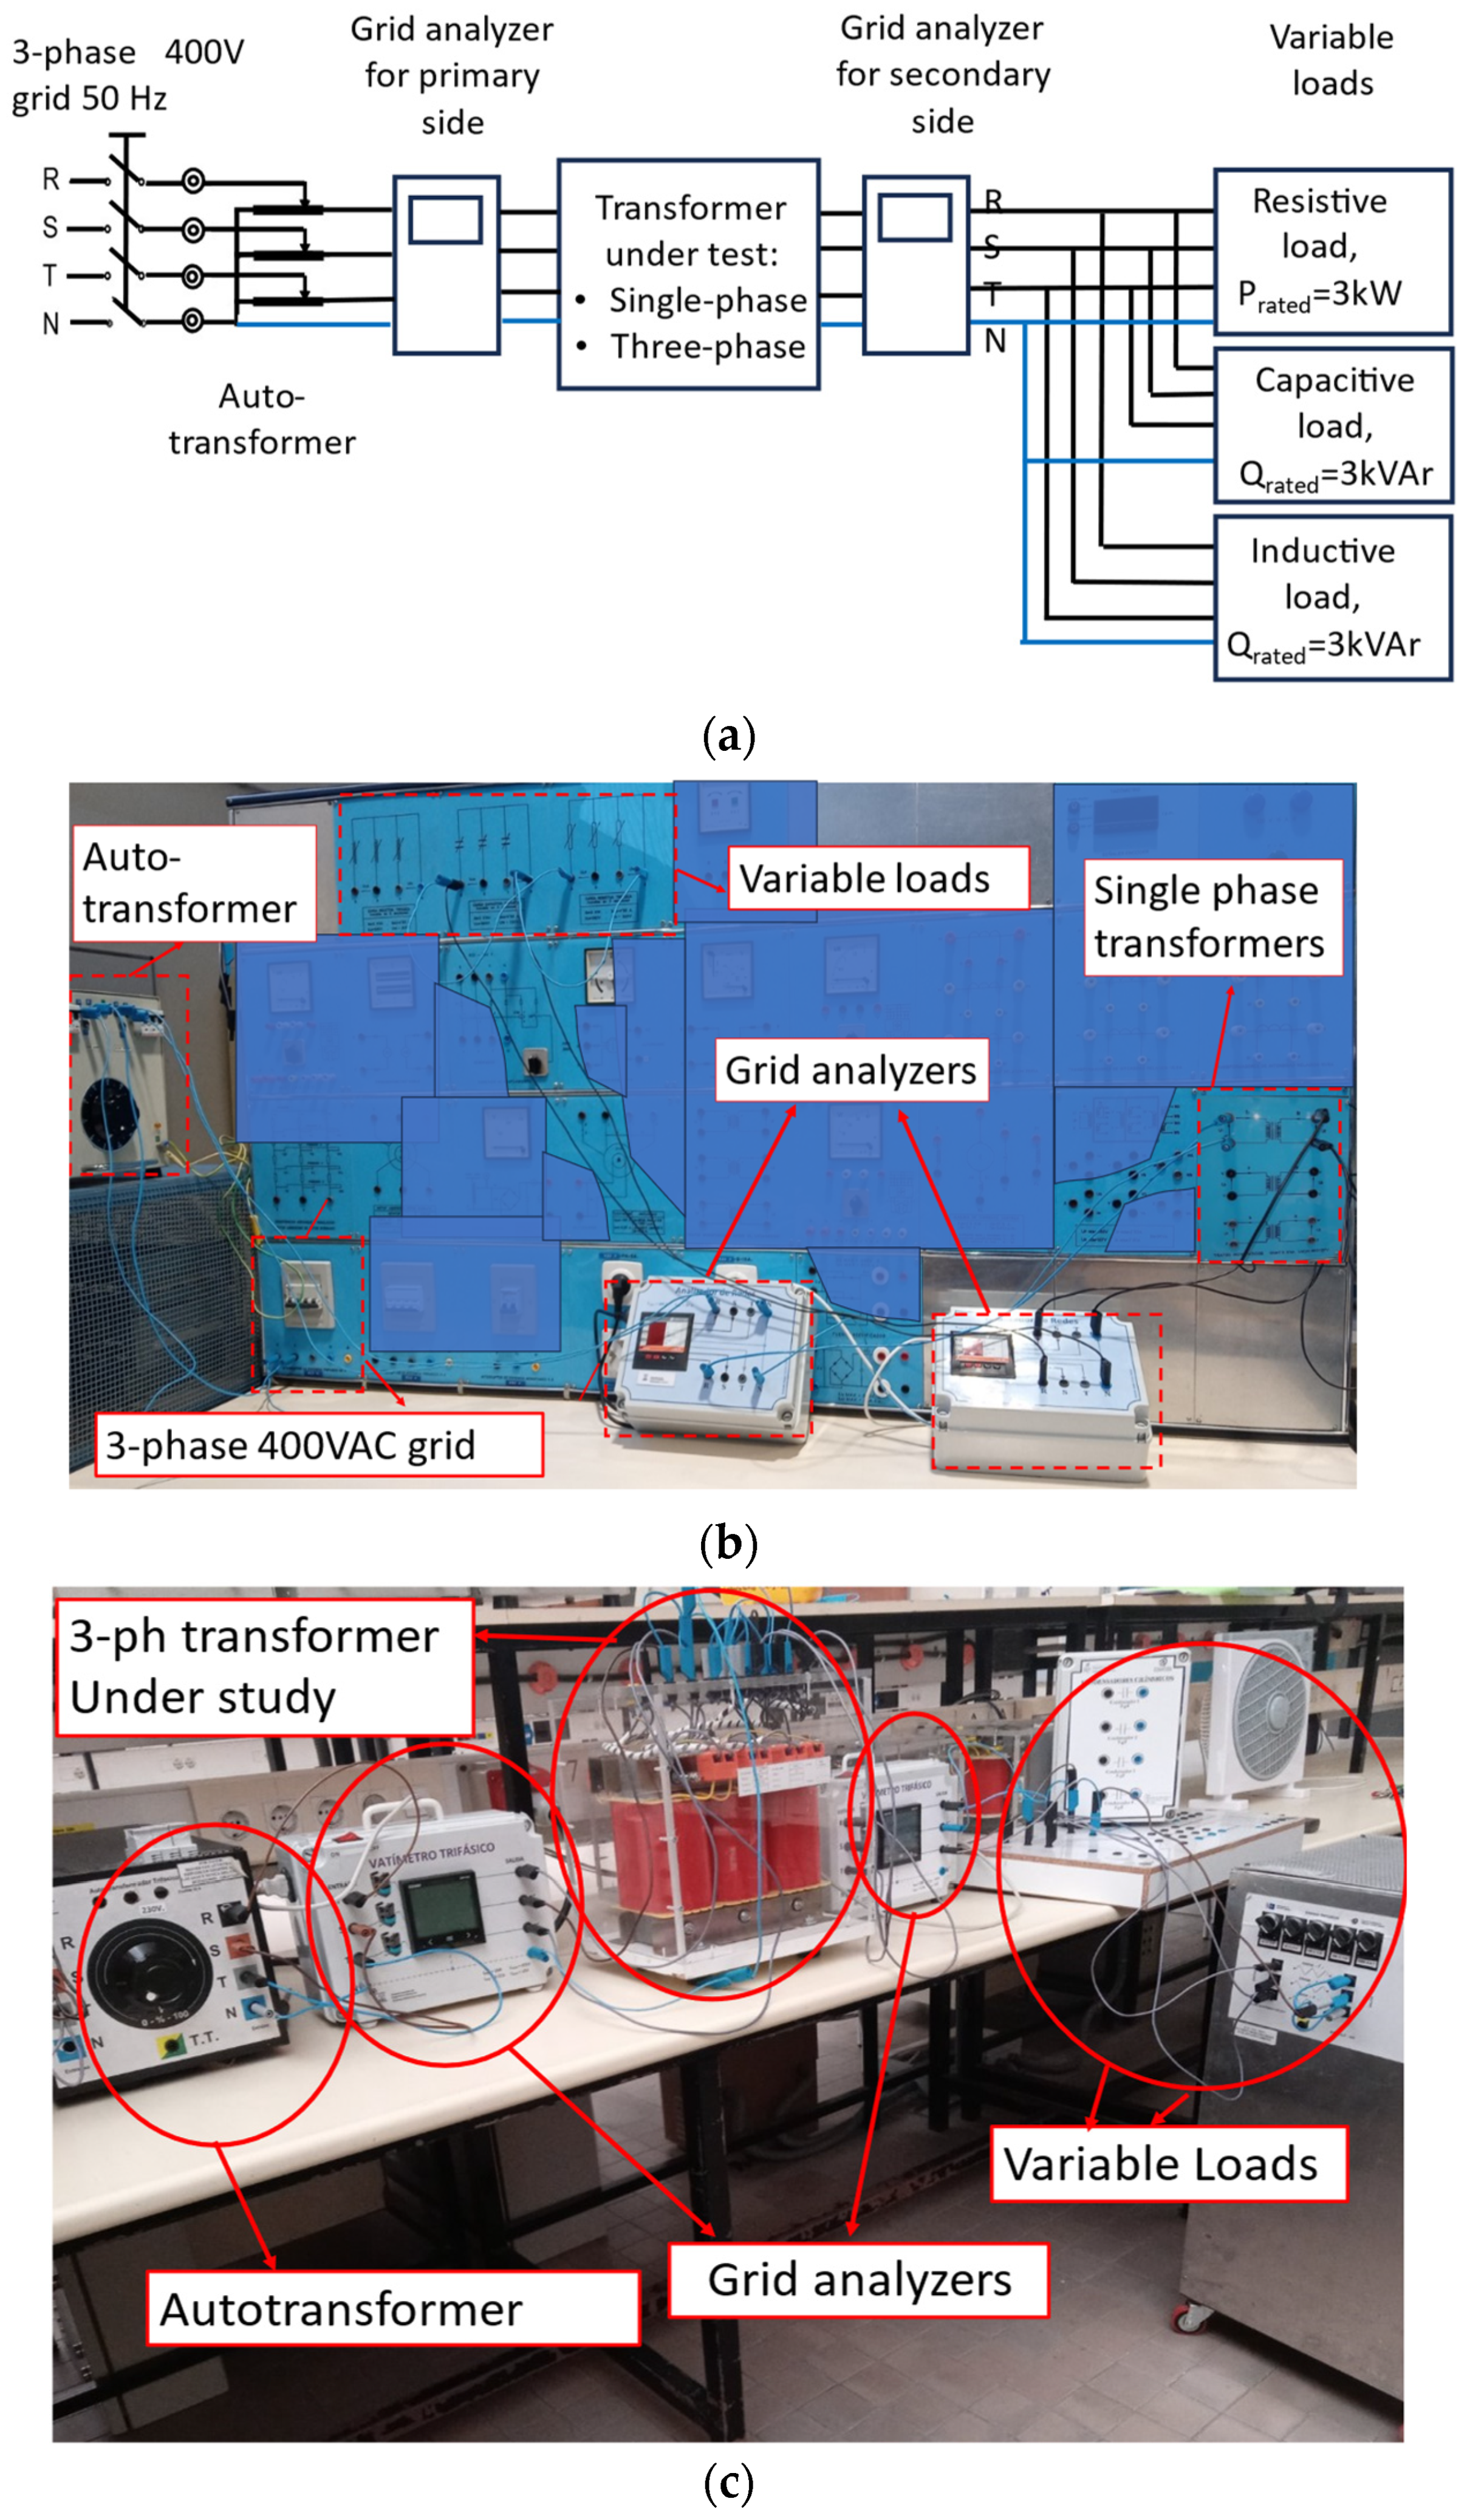
The connection sketch and photos of the experimental setups are enclosed in Figure 6 for both single-phase and three-phase transformers. In these setups, three different single-phase 380/127 V transformers, Tr-1, Trf-2 and Trf-3, and two three-phase transformers, Trf-4 and Trf-5, are the objects of study that are subjected to light-load and over-load capacitive and inductive conditions.
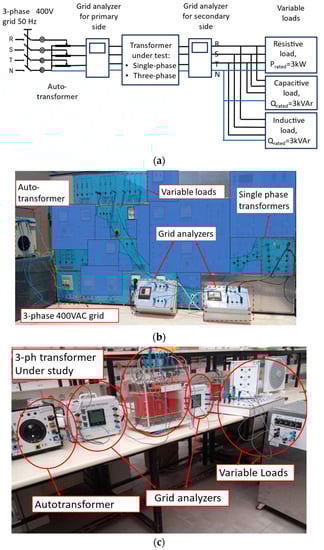
Figure 6.
Experimental setup for studying the behavior of transformers with different reactance value: (a) Conceptual sketch for the experimental setup for single-phase and three-phase transformers. (b) Photo of the experimental setup for single-phase transformers. (c) Photo of the experimental setup for three-phase transformers.
The rated parameters of the complete sets of power transformers being tested are specified in Table 3, where the current and voltage ratings for the three-phase transformers are their phase-to-phase values. For this purpose, variable resistive, inductive and capacitive loads in five steps have been included. Their technical information has been included in Table 4.
Table 3.
Rated values for the three single-phase and three-phase transformers under test.
Table 4.
Rated values for the variable loads for the two experimental setups.
Here, Sr is the rated power; V1,r and V2,r are the rated primary and secondary voltages, respectively; I1,r and I2,r are the rated primary and secondary currents, respectively; and Rl and Xl are the leakage resistance and reactance values, respectively.
4.2. Behavior of Single-Phase and Three-Phase Transformers under Light- and Over-Load Capacitive and Inductive Conditions
In this subsection, the theoretical analyses developed in Section 2 are validated by means of the experimental setups described in Section 4.1.
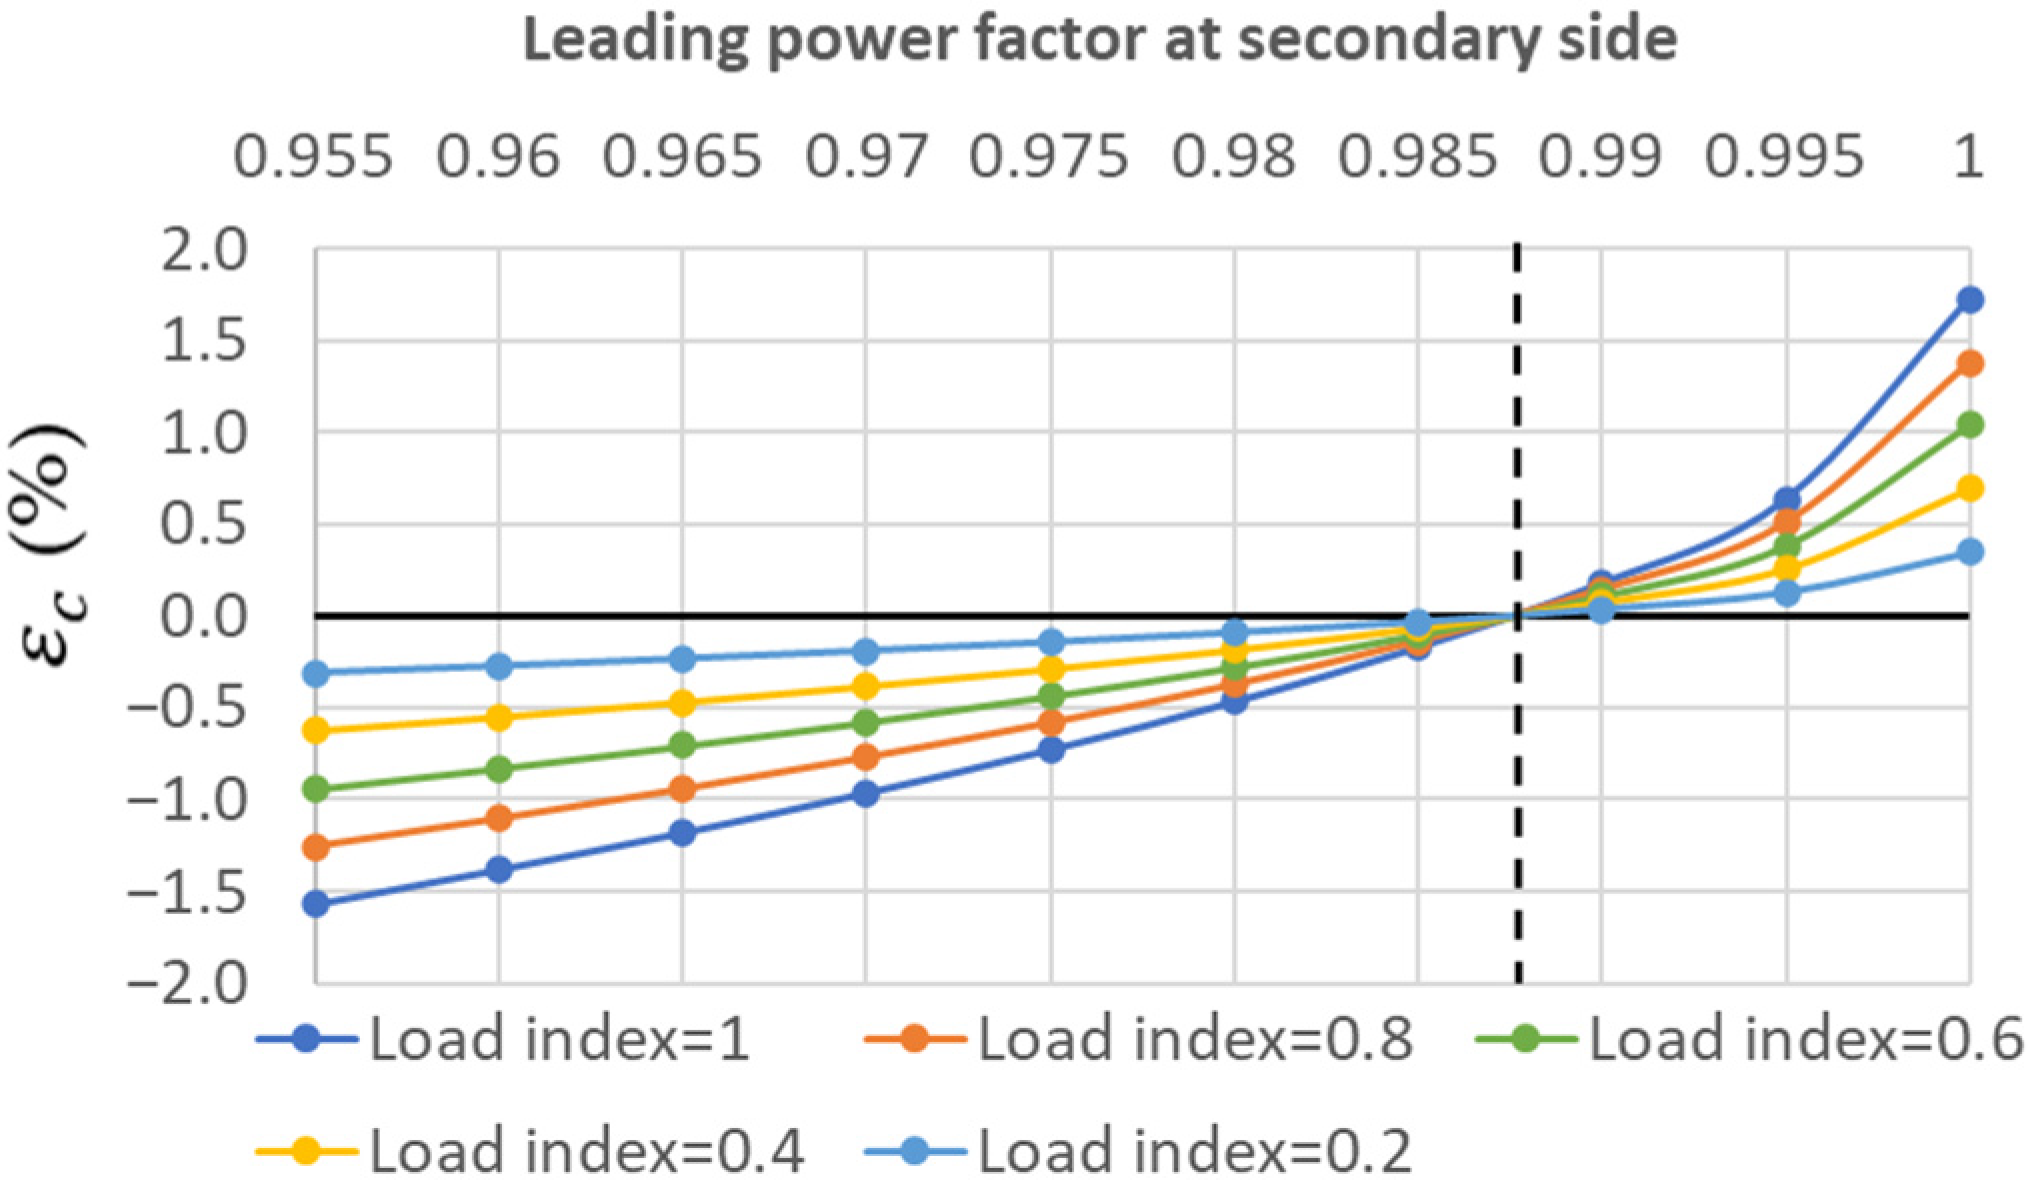
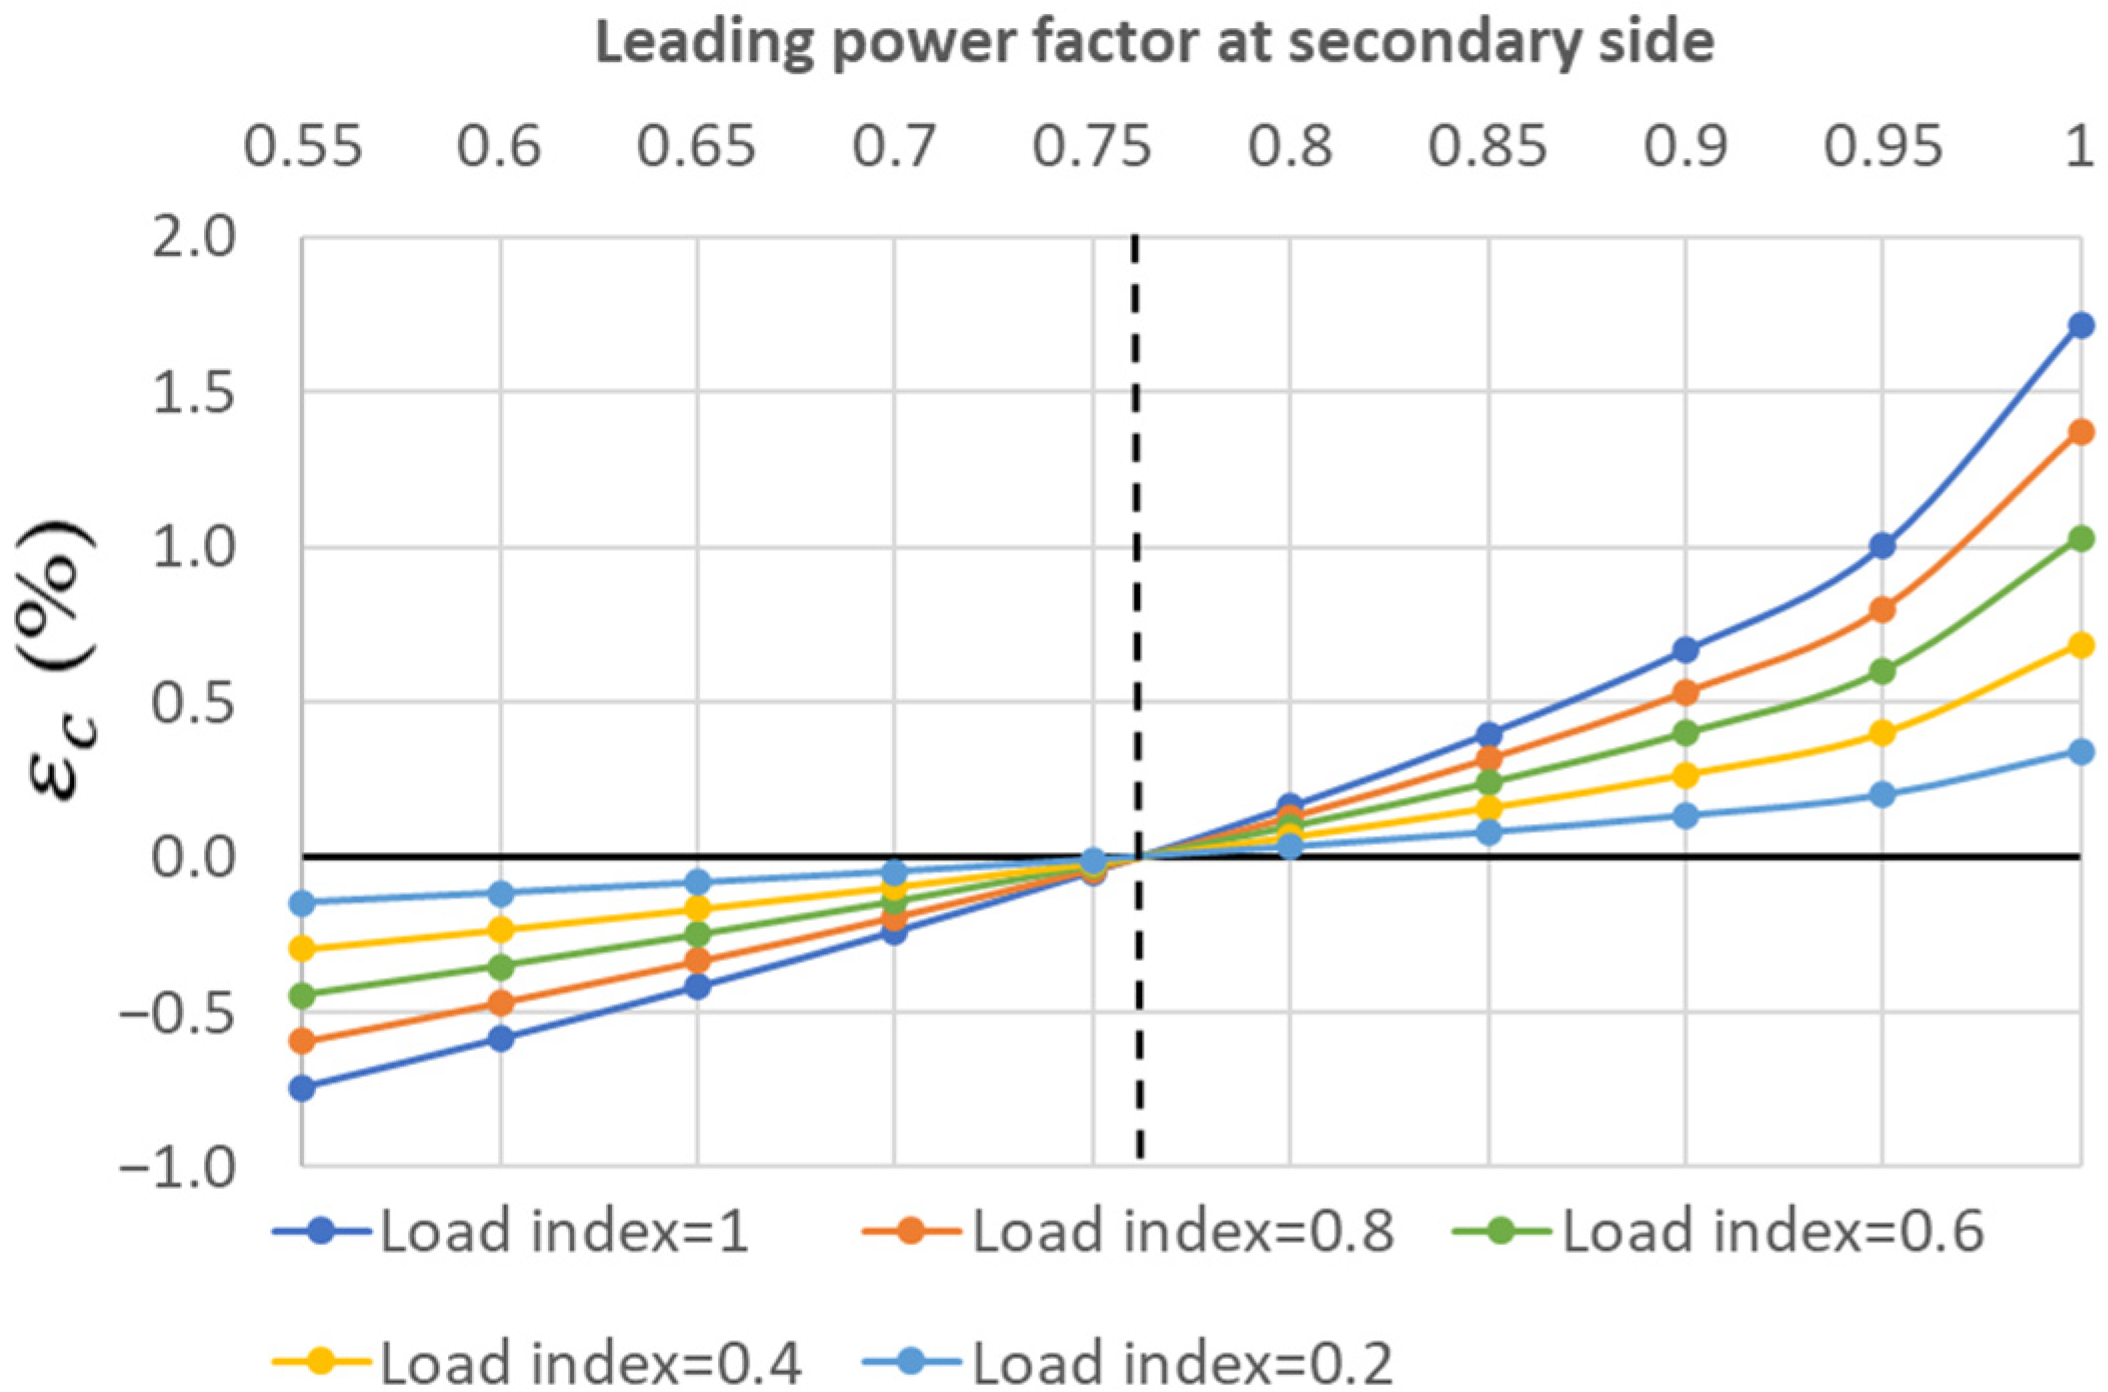
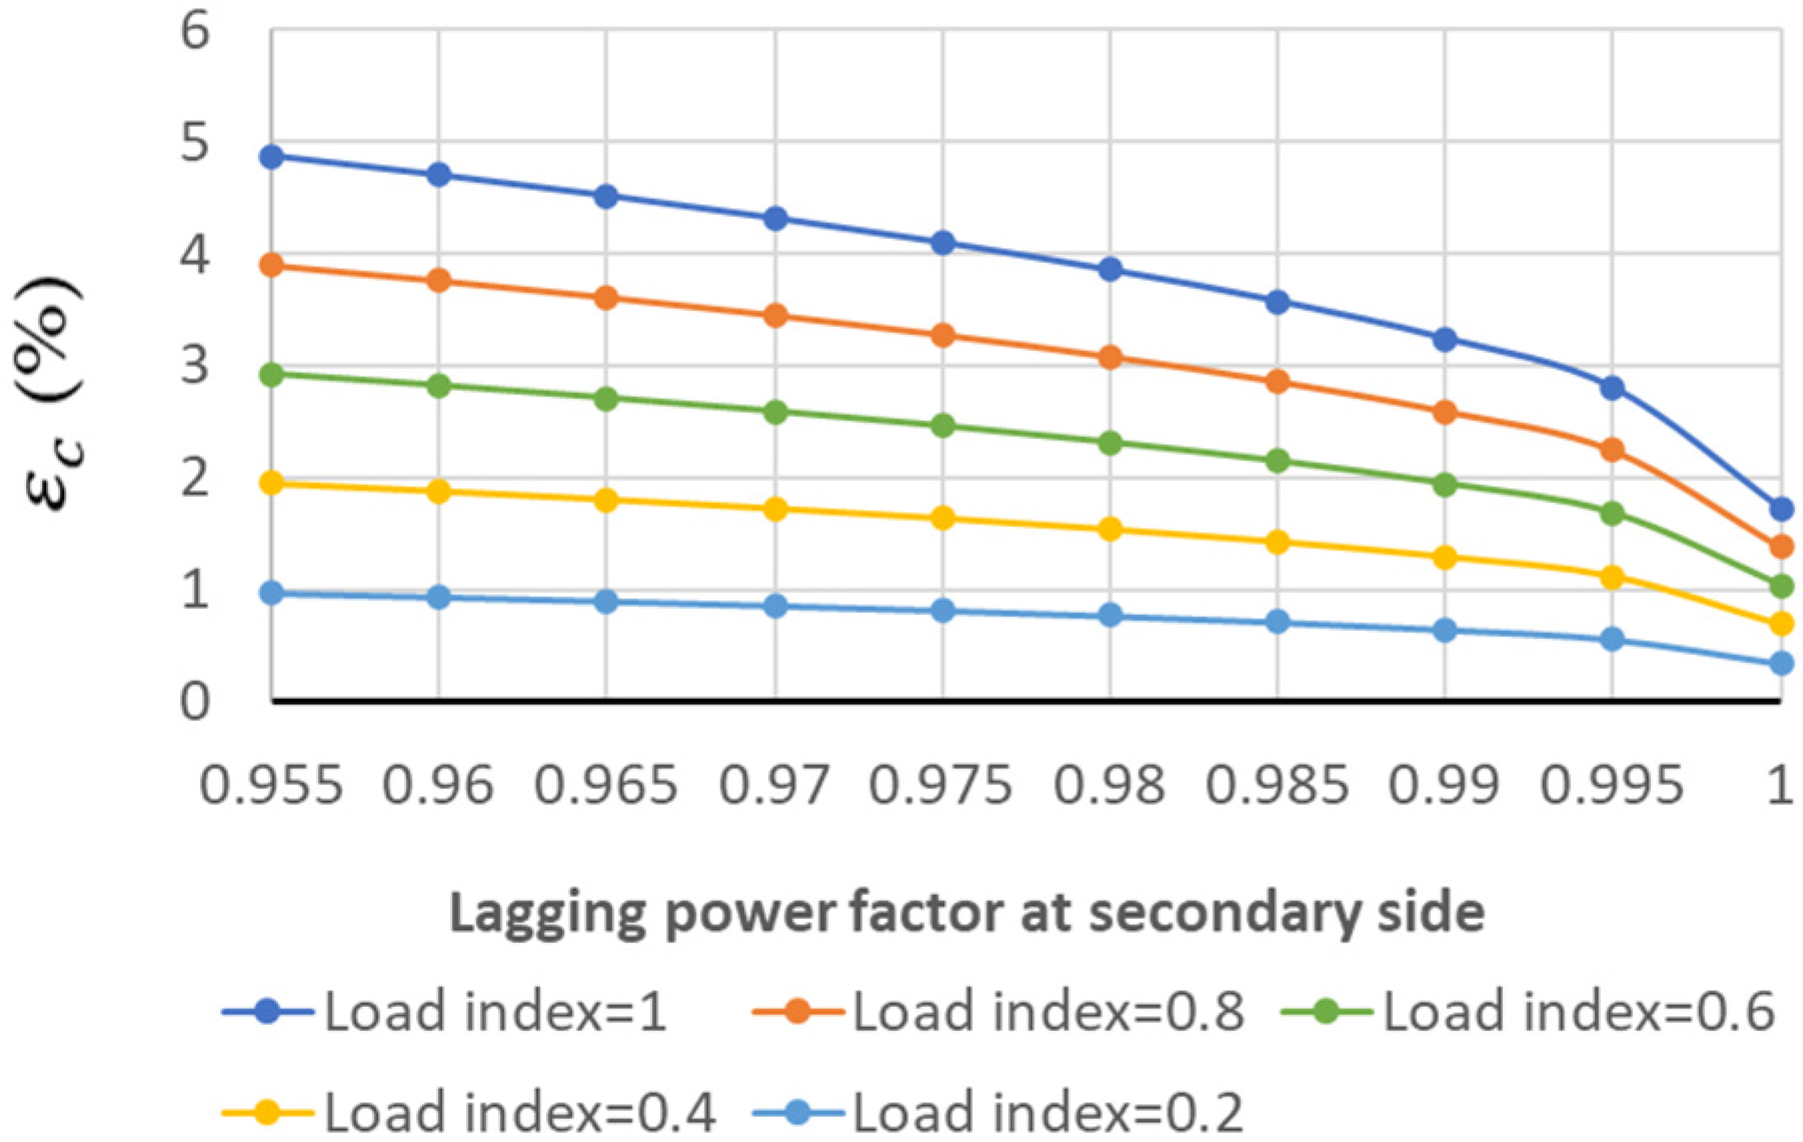
The five aforementioned transformers were subjected to different light-load and over-load tests consisting of a variation in the leading power factor at their secondary sides as well as of their load indices. By using the different capacitive and resistive steps of the variable loads, the power factor was varied from 1 to 0.955 leading for the single-phase transformers and from 0.55 to 1 leading for the three-phase transformers. Different ranges of the power factor at the secondary sides were considered since the single-phase and three-phase transformers have different Ferranti angles, and with these two ranges, the change in reactance can be better seen separately. Therefore, the evolution of the internal voltage drop at each transformer with the variation of load index and power factor at the secondary side was registered, and the results are summarized in Figure 7, Figure 8 and Figure 9 for the single-phase transformers Trf-1, Trf-2 and Trf-3 and in Figure 10 and Figure 11 for the three-phase transformers Trf-4 and Trf-5.
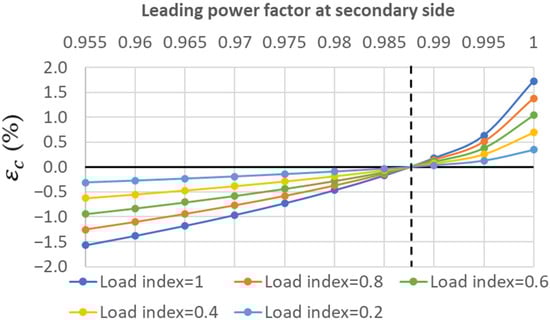
Figure 7.
Internal voltage drop (εc(%)) for Trf-1 in light-load capacitive conditions.
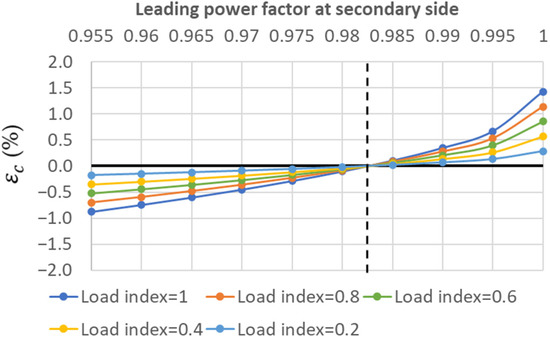
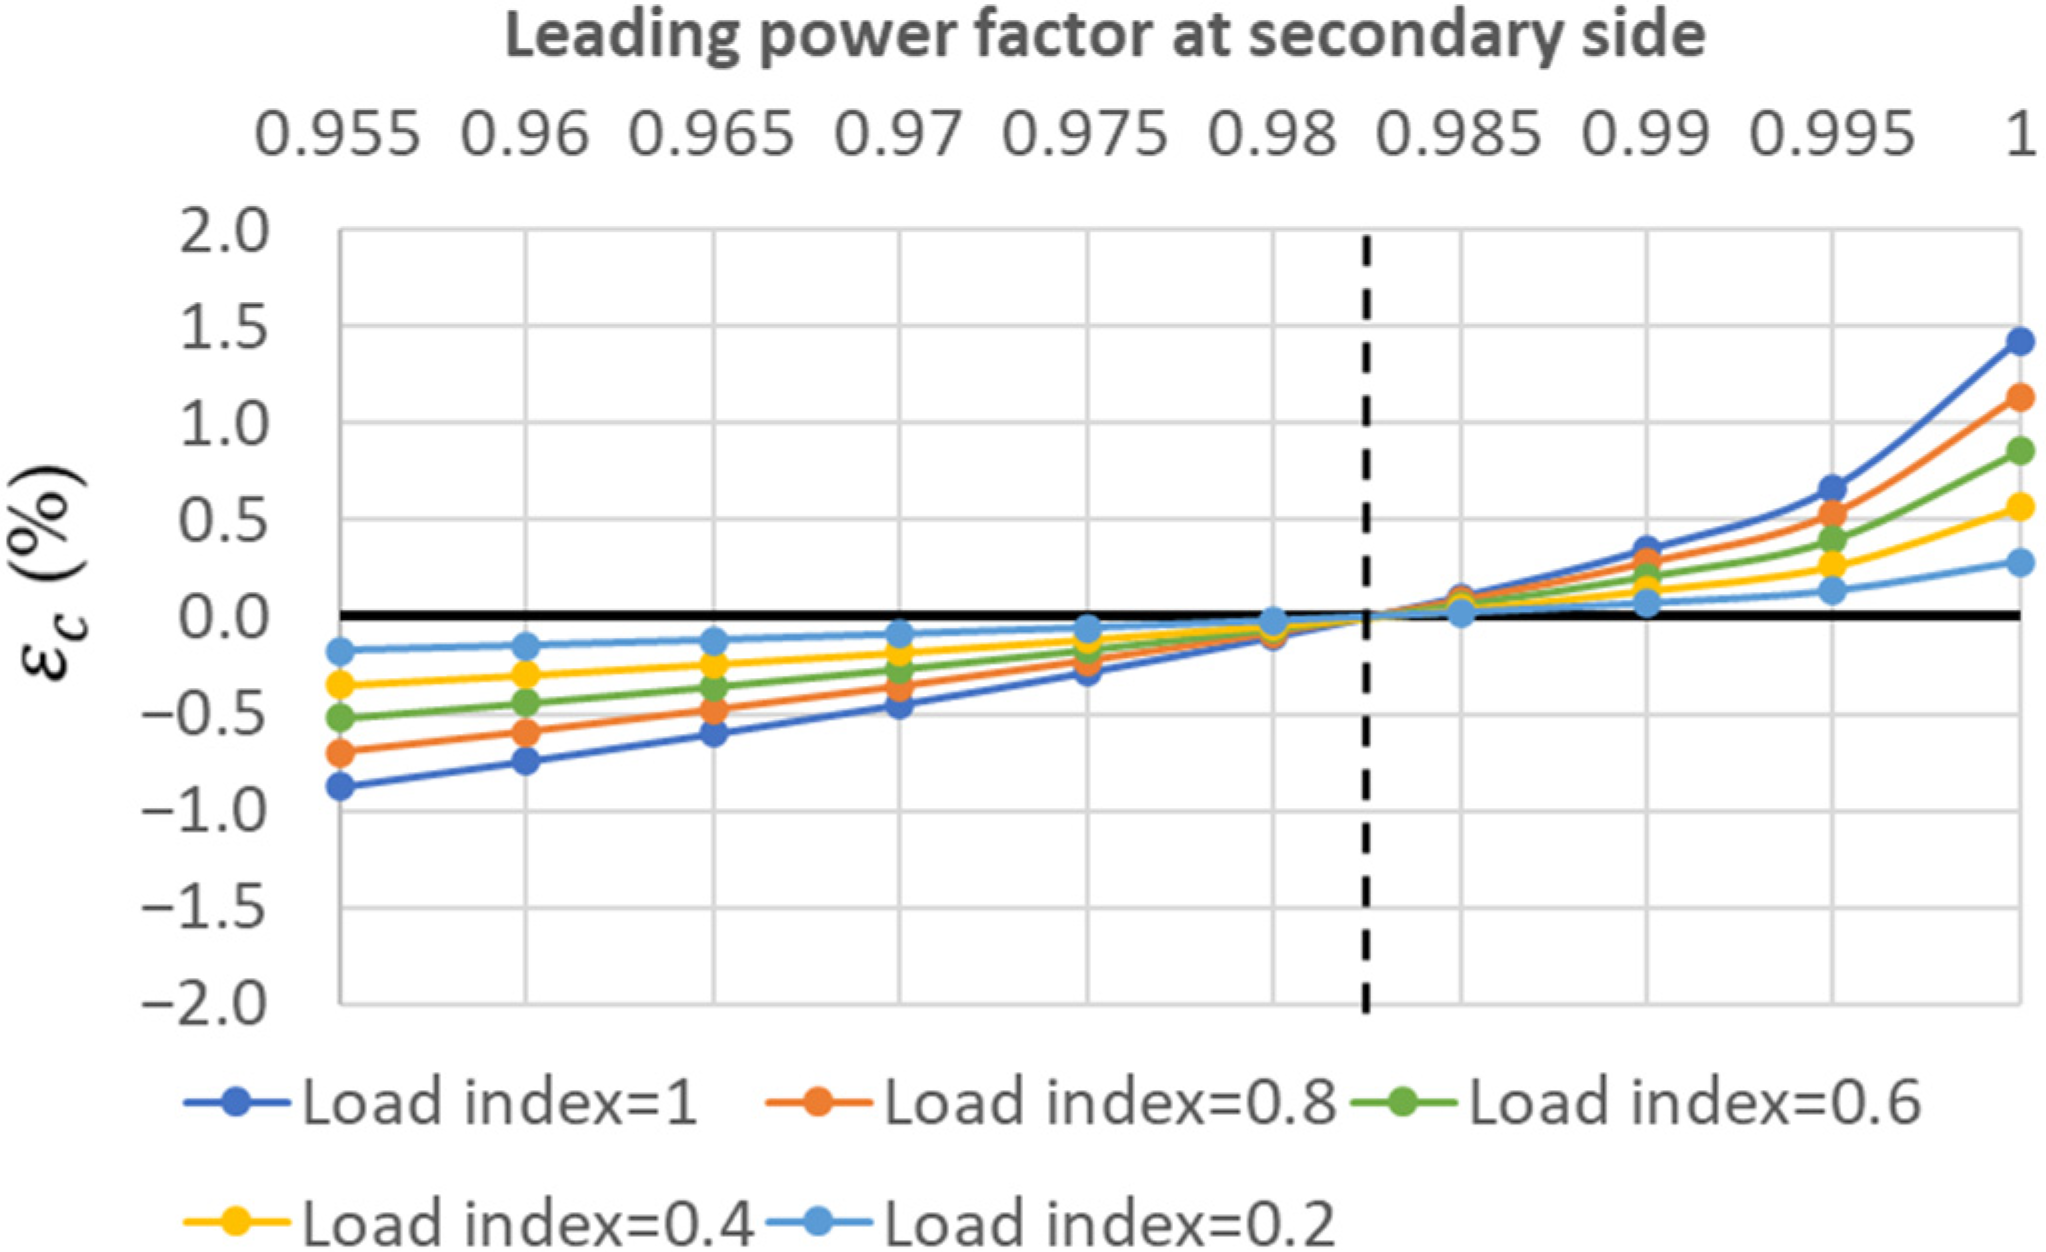
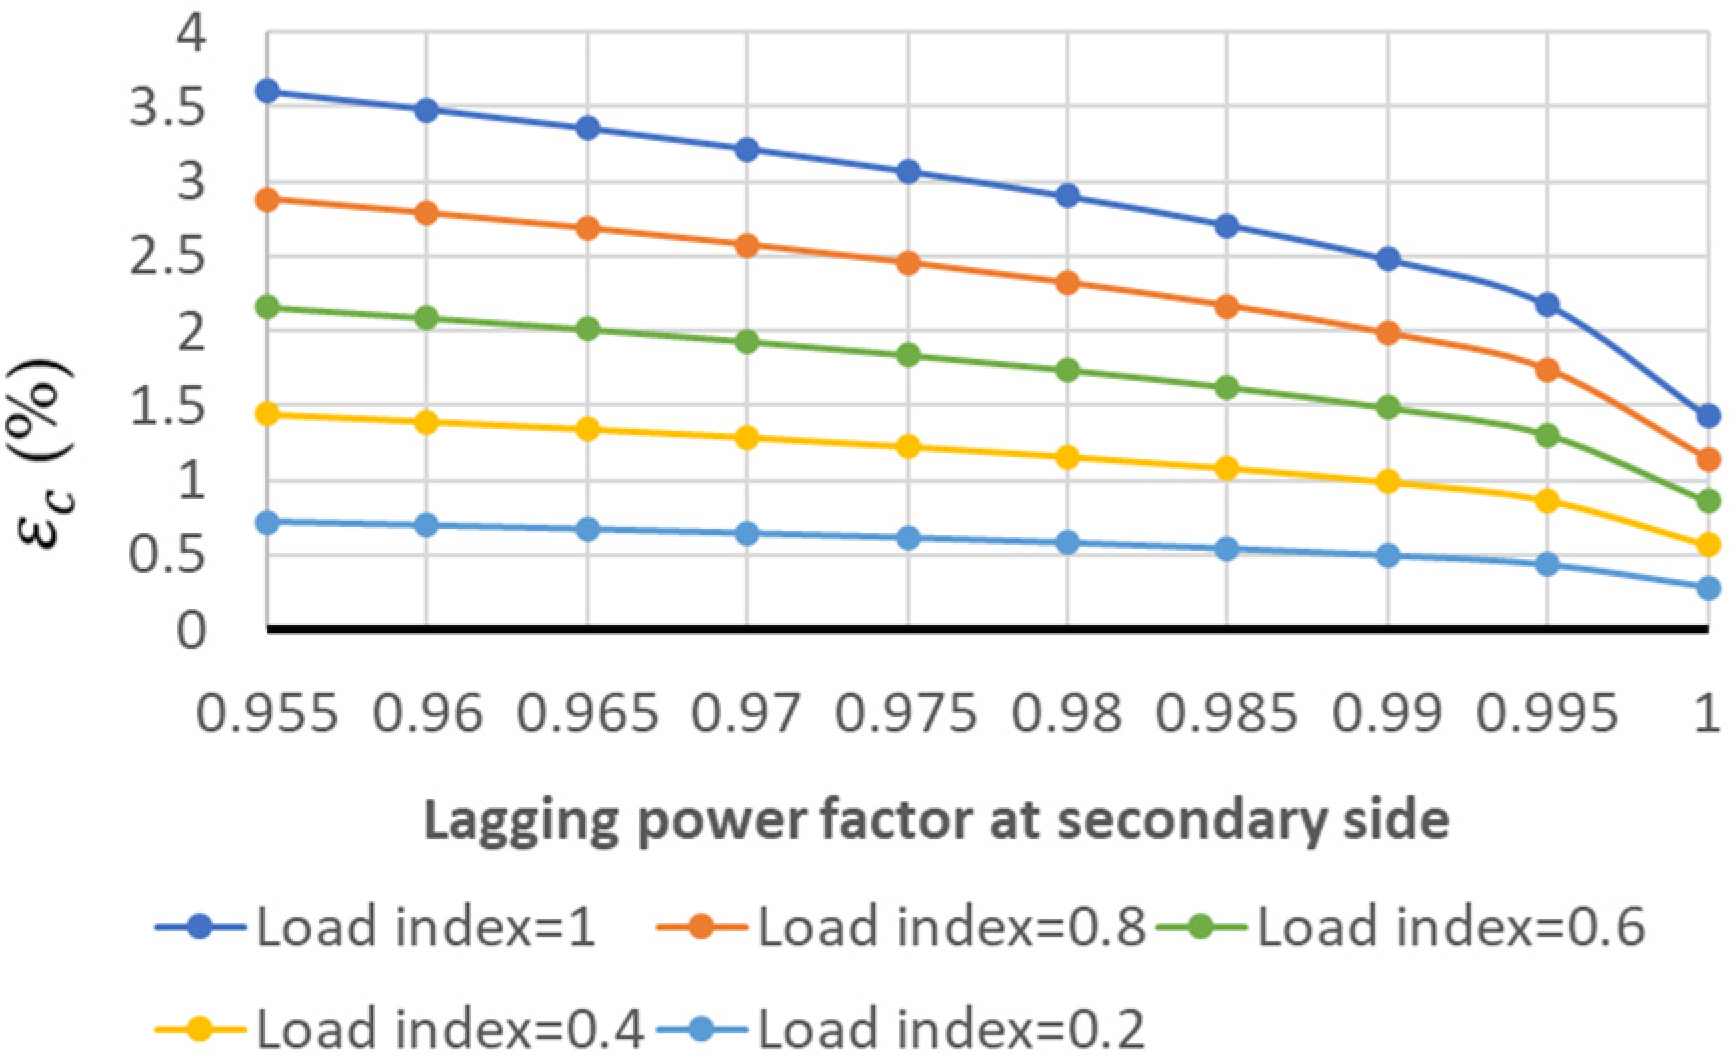
Figure 8.
Internal voltage drop (εc(%)) for Trf-2 in light-load capacitive conditions.
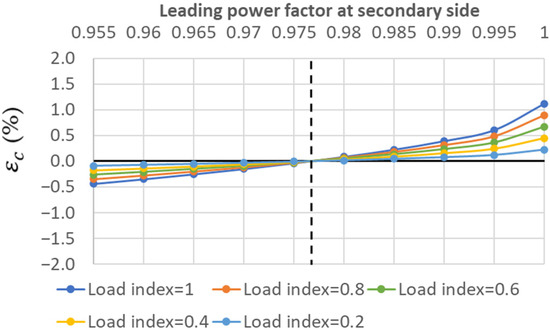
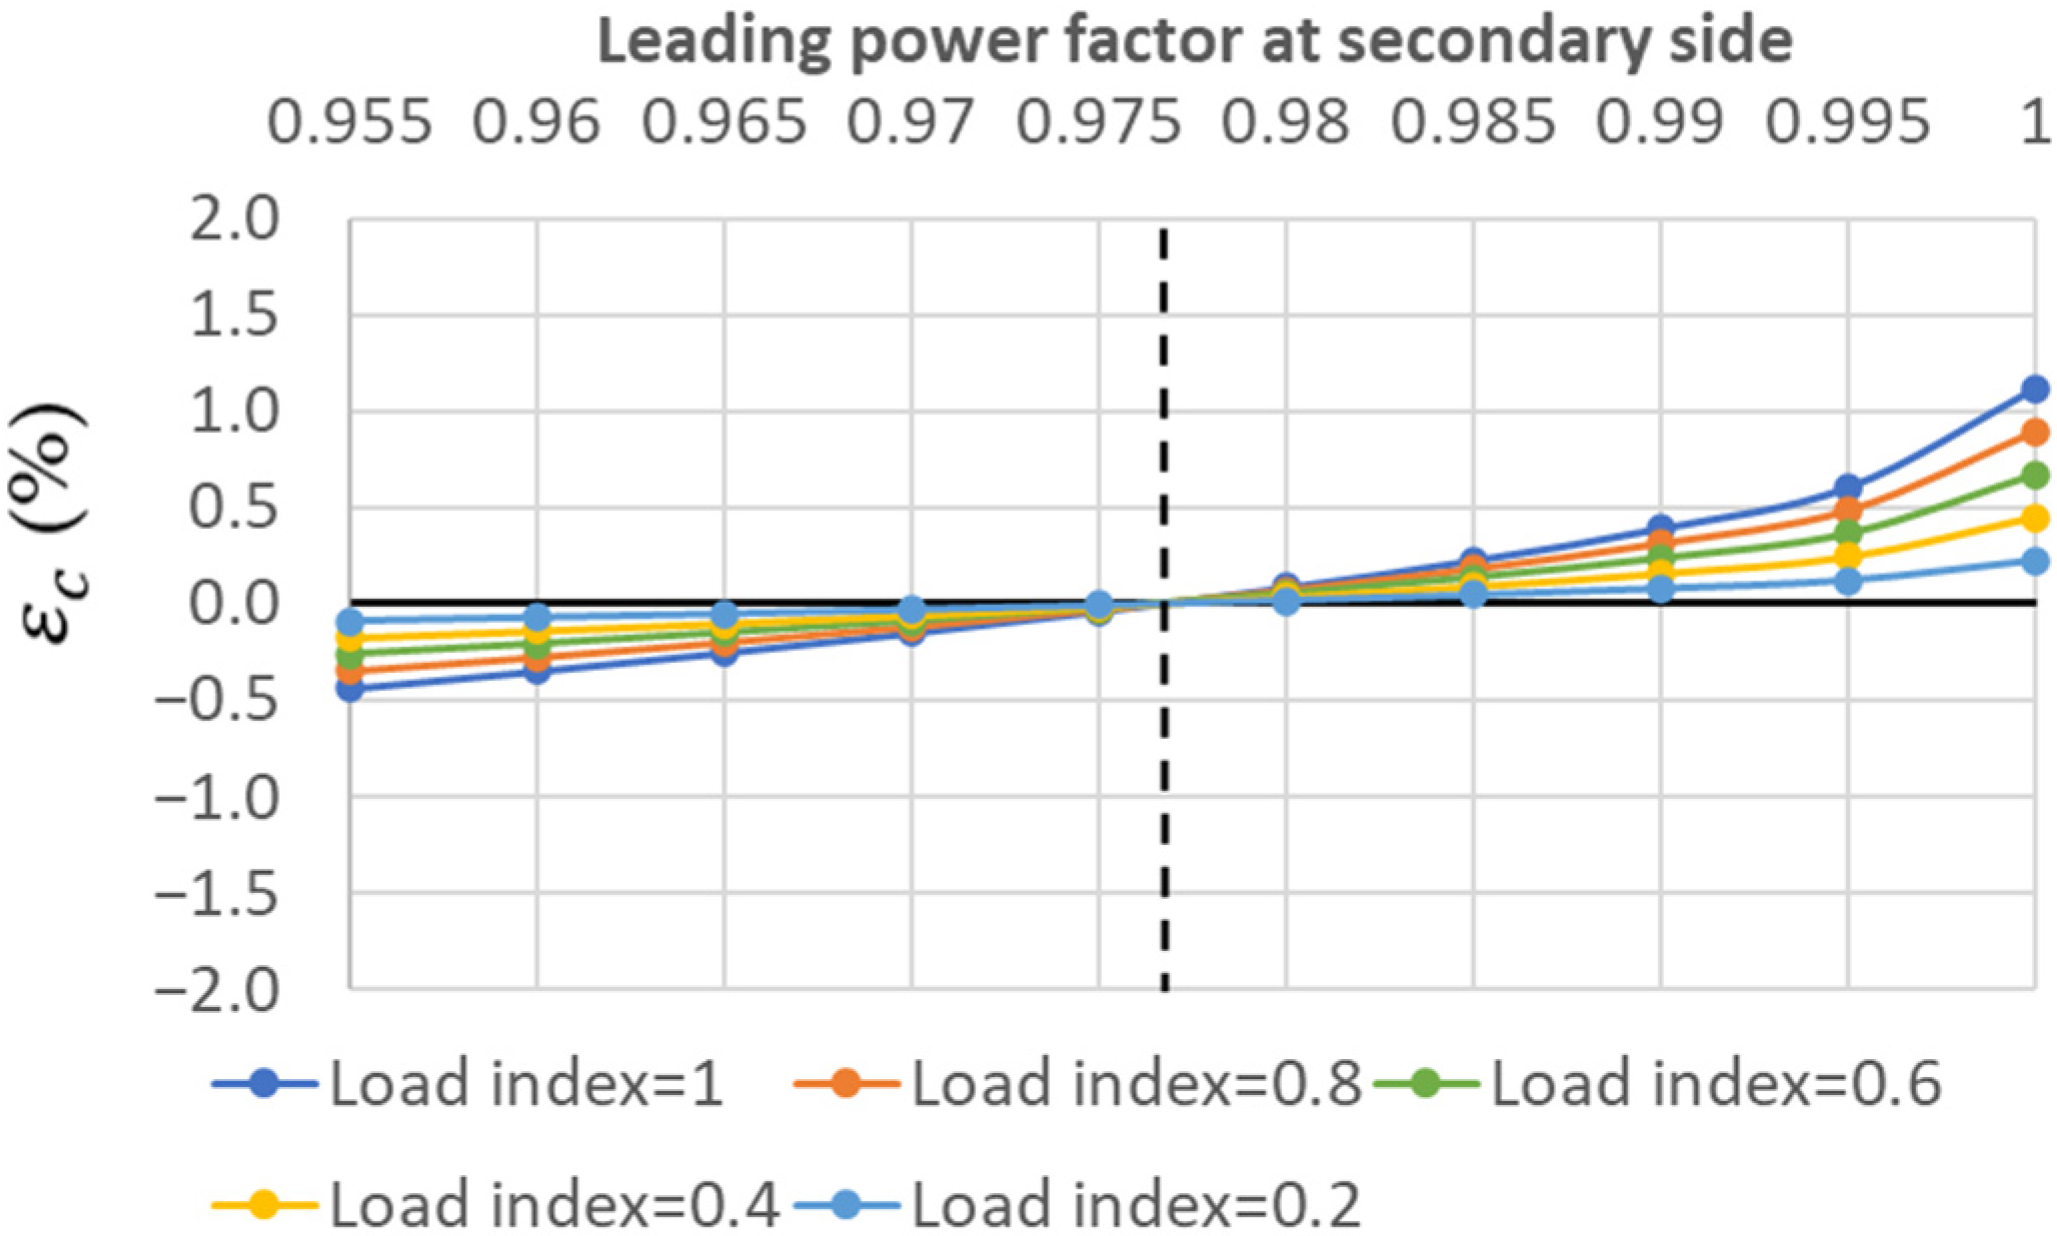
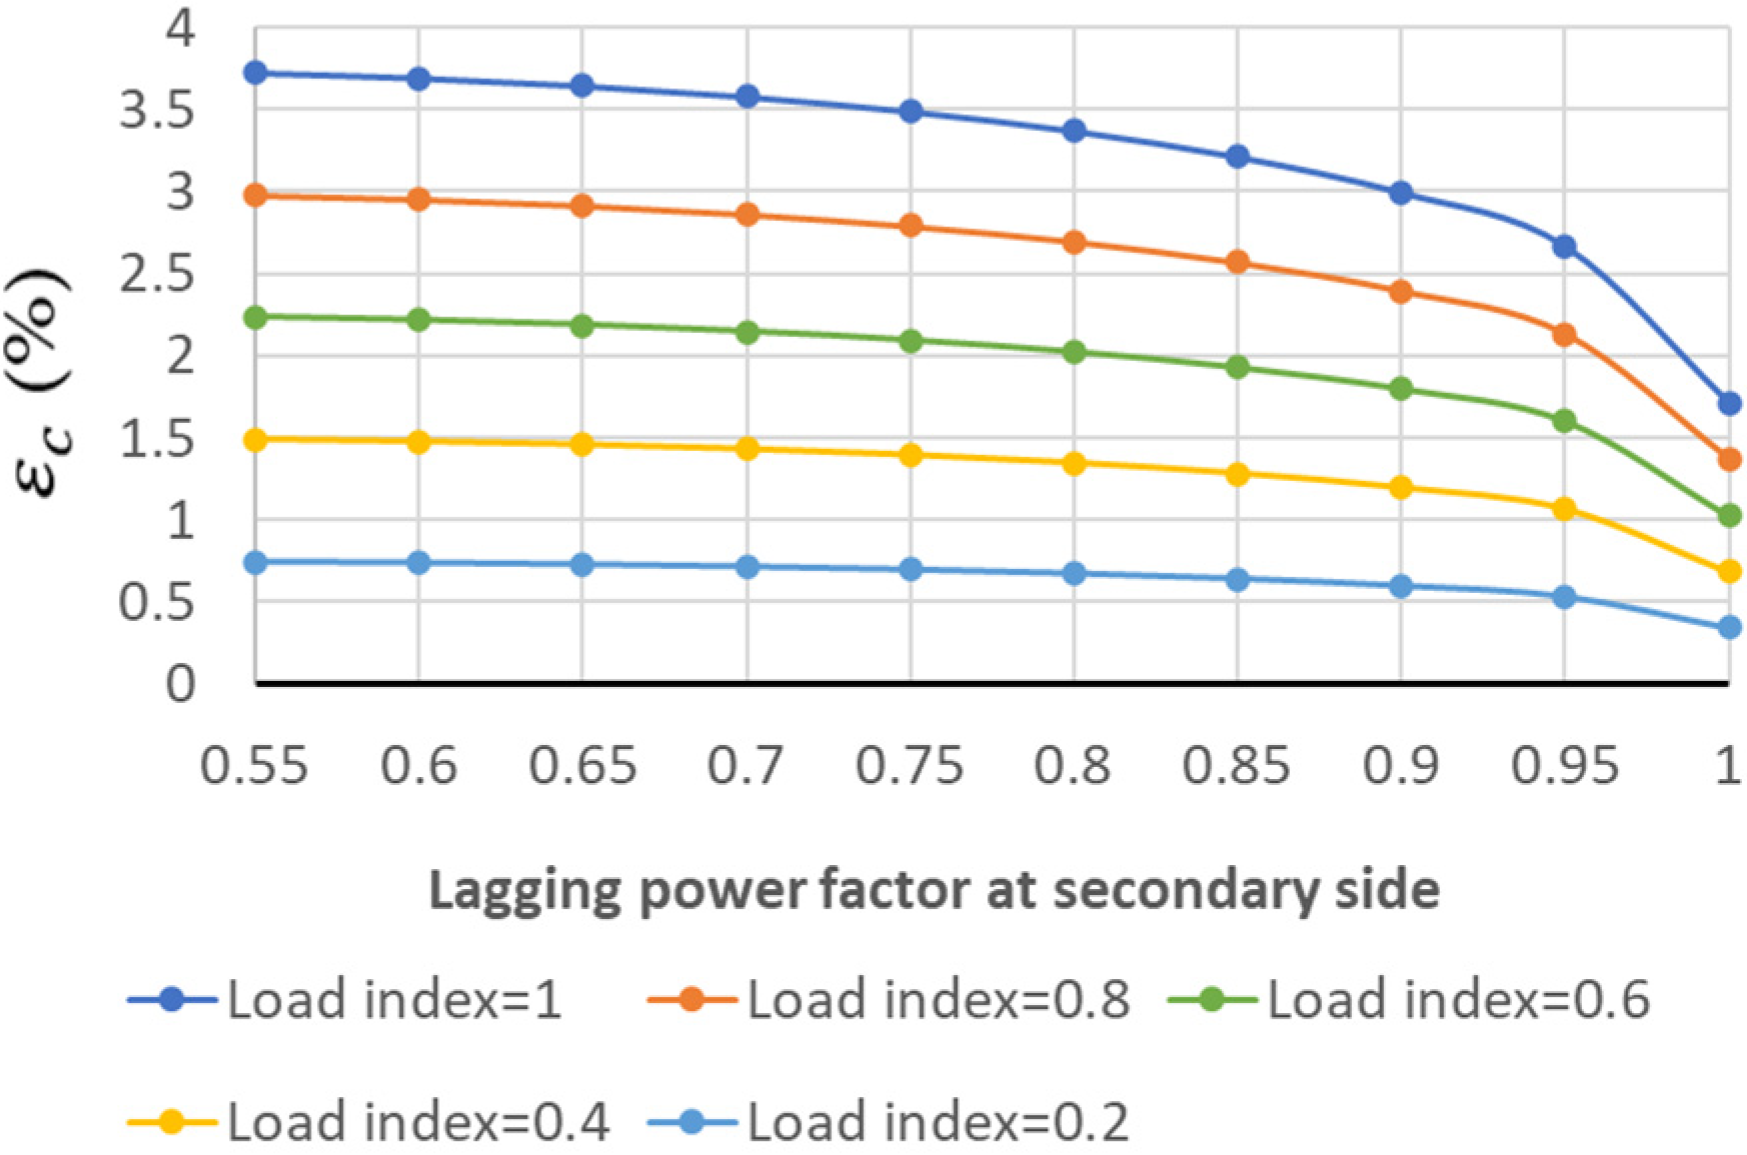
Figure 9.
Internal voltage drop (εc(%)) for Trf-3 in light-load capacitive conditions.
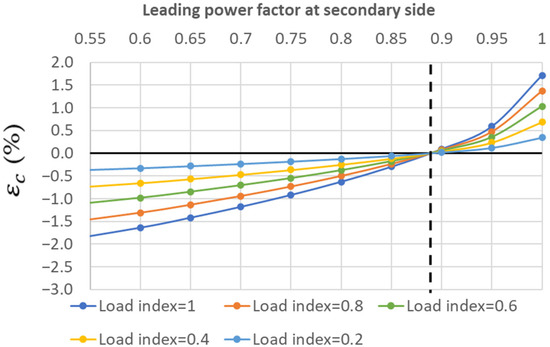
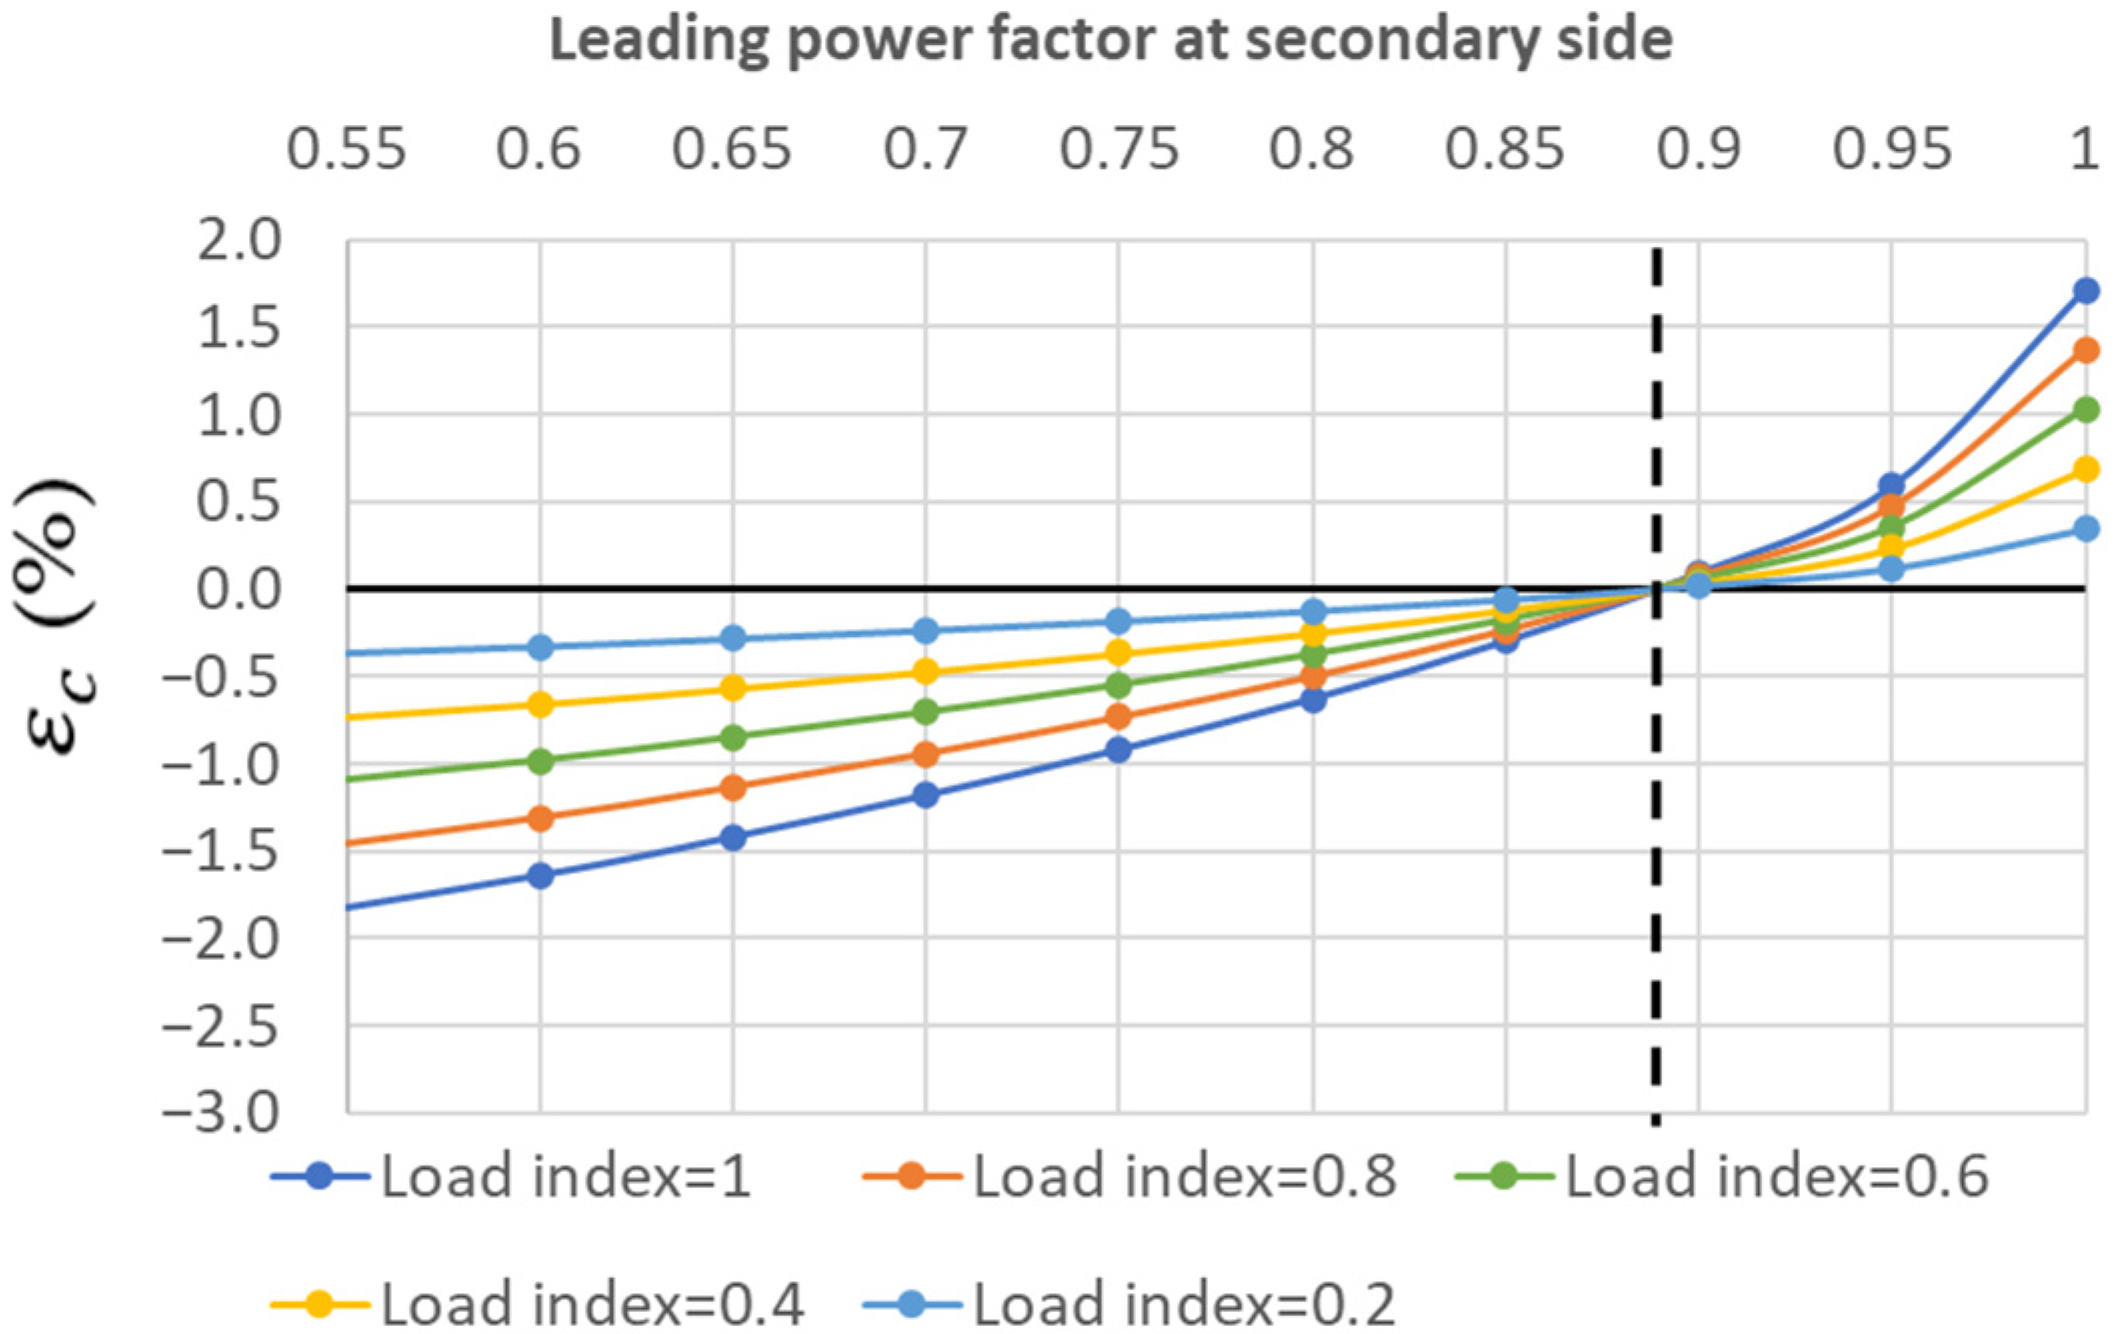
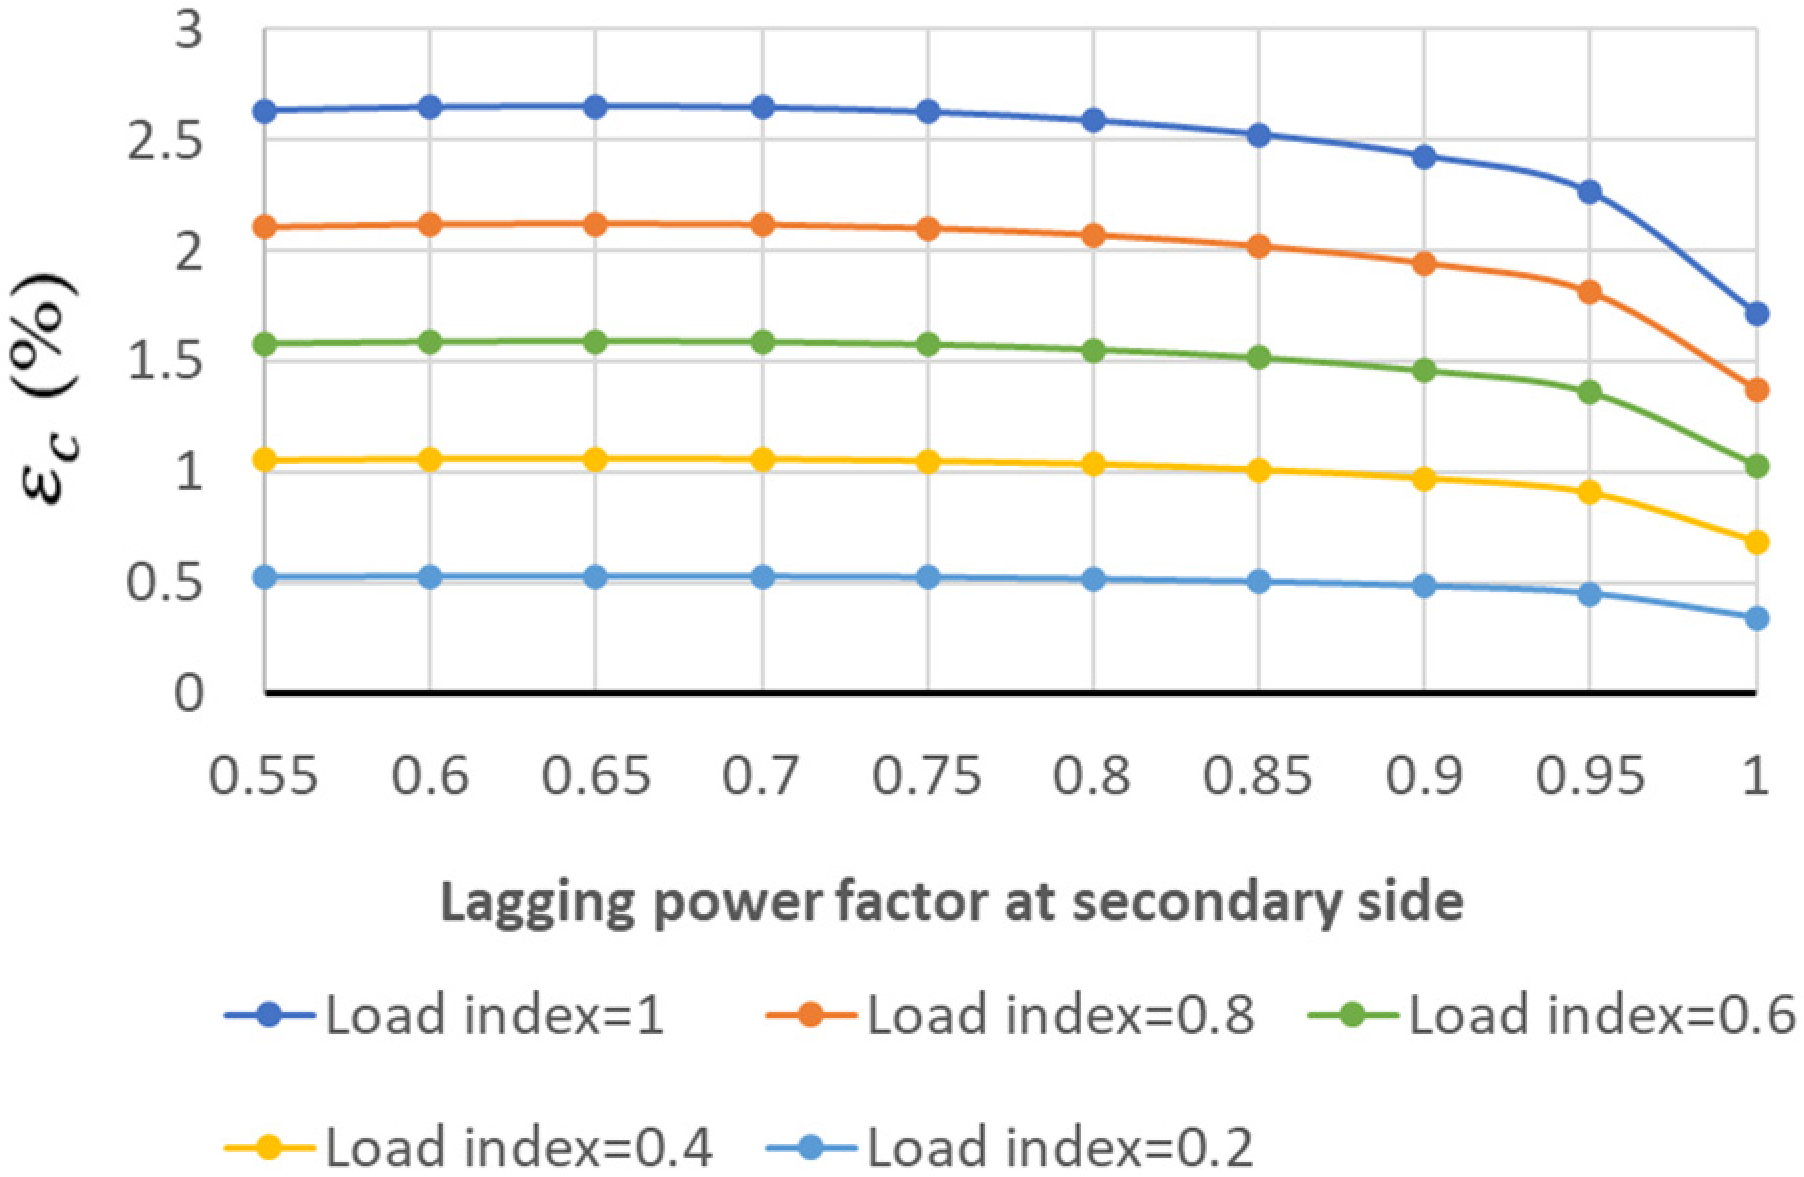
Figure 10.
Internal voltage drop (εc(%)) for Trf-4 in light-load capacitive conditions.
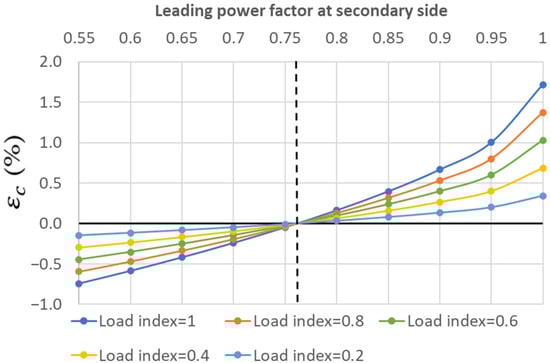
Figure 11.
Internal voltage drop (εc(%)) for Trf-5 in light-load capacitive conditions.
It can be noted that the sign change from a positive to a negative voltage drop occurs at a different power factor level for each of the five different transformers.
Among the single-phase transformers, the power factor levels that correspond to sign changes of an internal voltage drop are 0.9875, 0.9825 and 0.9765 leading for Trf-1, Trf-2 and Trf-3, respectively. Therefore, Trf-1, with the highest leakage reactance of 10.45 Ω, will be the one most prone to suffer the Ferranti effect for the widest spectrum of leading power factors at the secondary side, while Trf-3, with a lower leakage reactance of 4.88 Ω, will be less prone to it.
Among the three-phase transformers, the power factor levels that correspond to sign changes of an internal voltage drop are 0.89 and 0.76 leading for Trf-4 and Trf-5, respectively. Therefore, Trf-4, with the highest leakage reactance of 1.07 Ω, will be the more prone to suffer the Ferranti effect for the widest spectrum of leading power factors at the secondary side, while Trf-5, with the lowest leakage reactance of 0.647 Ω, will be less prone to it.
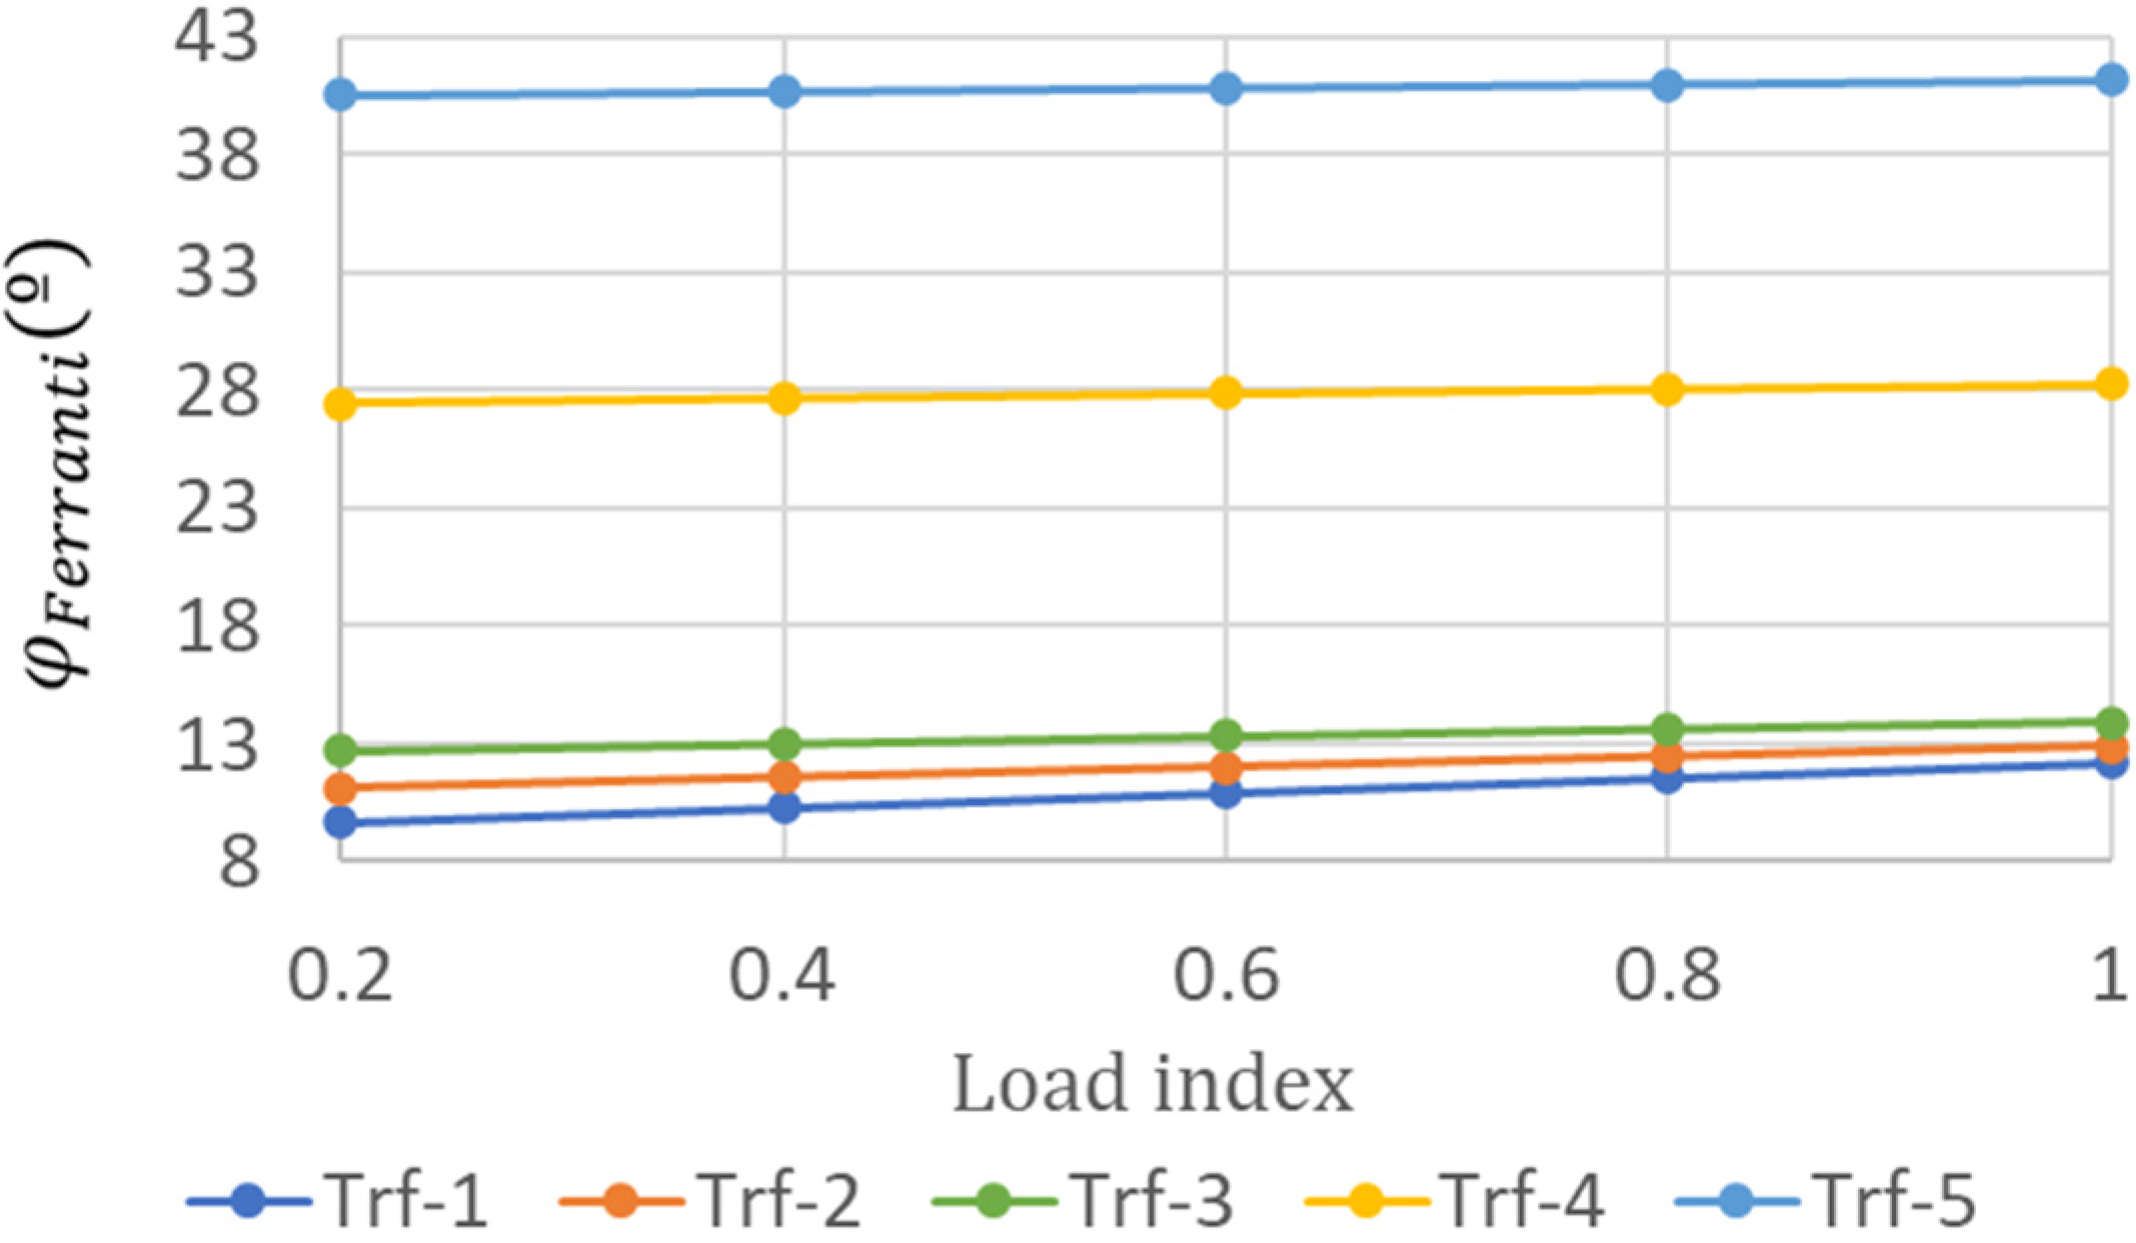
To illustrate this evidence, the Ferranti angle was computed for the three transformers at different load index levels and the results are shown in Figure 12. For each load index and transformer, the Ferranti angle adopts a different value. Among single-phase transformers, the Ferranti angle values corresponding to Trf-3 imply greater values than these corresponding to Trf-2 and Trf-1. Among the three-phase transformers, the Ferranti angle values corresponding to Trf-5 imply greater values than those corresponding to Trf-4. And, when comparing the three-phase and single-phase transformers, Ferranti angle values of Trf-4 and Trf-5 lie much above than these of Trf-1, Trf-2 and Trf-3.
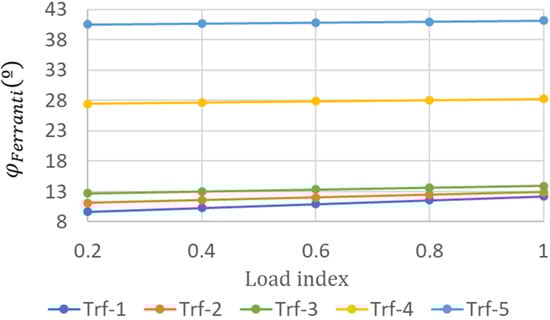
Figure 12.
Ferranti angle for the three different transformers at at light-load capacitive conditions.
In addition, the lowest leakage reactance of Trf-5 makes the overall values for the internal voltage drop lower than the remaining transformers, making Trf-5 more efficient than the remaining transformers when delivering power.
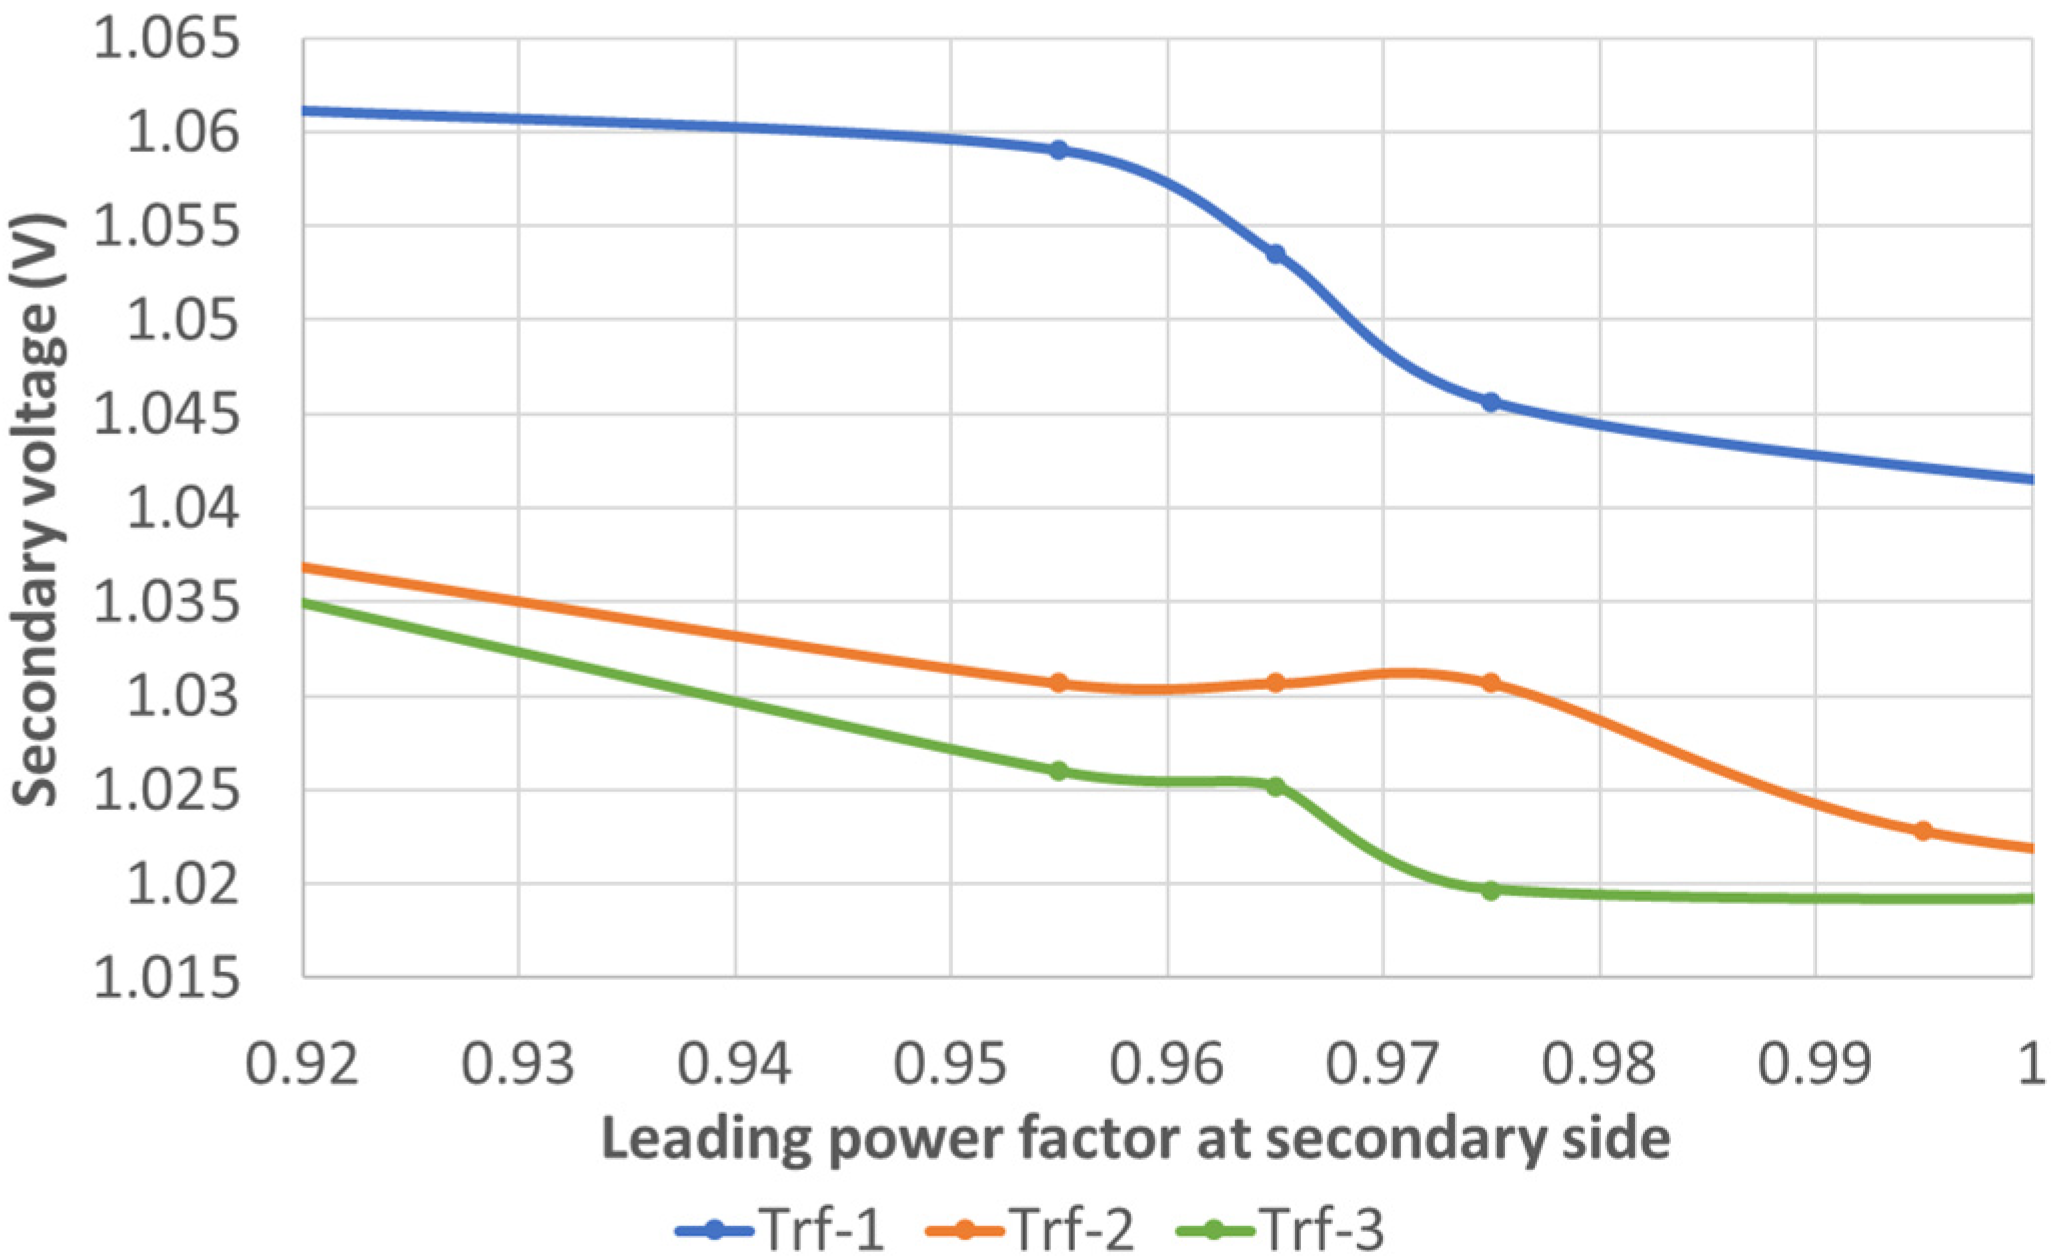
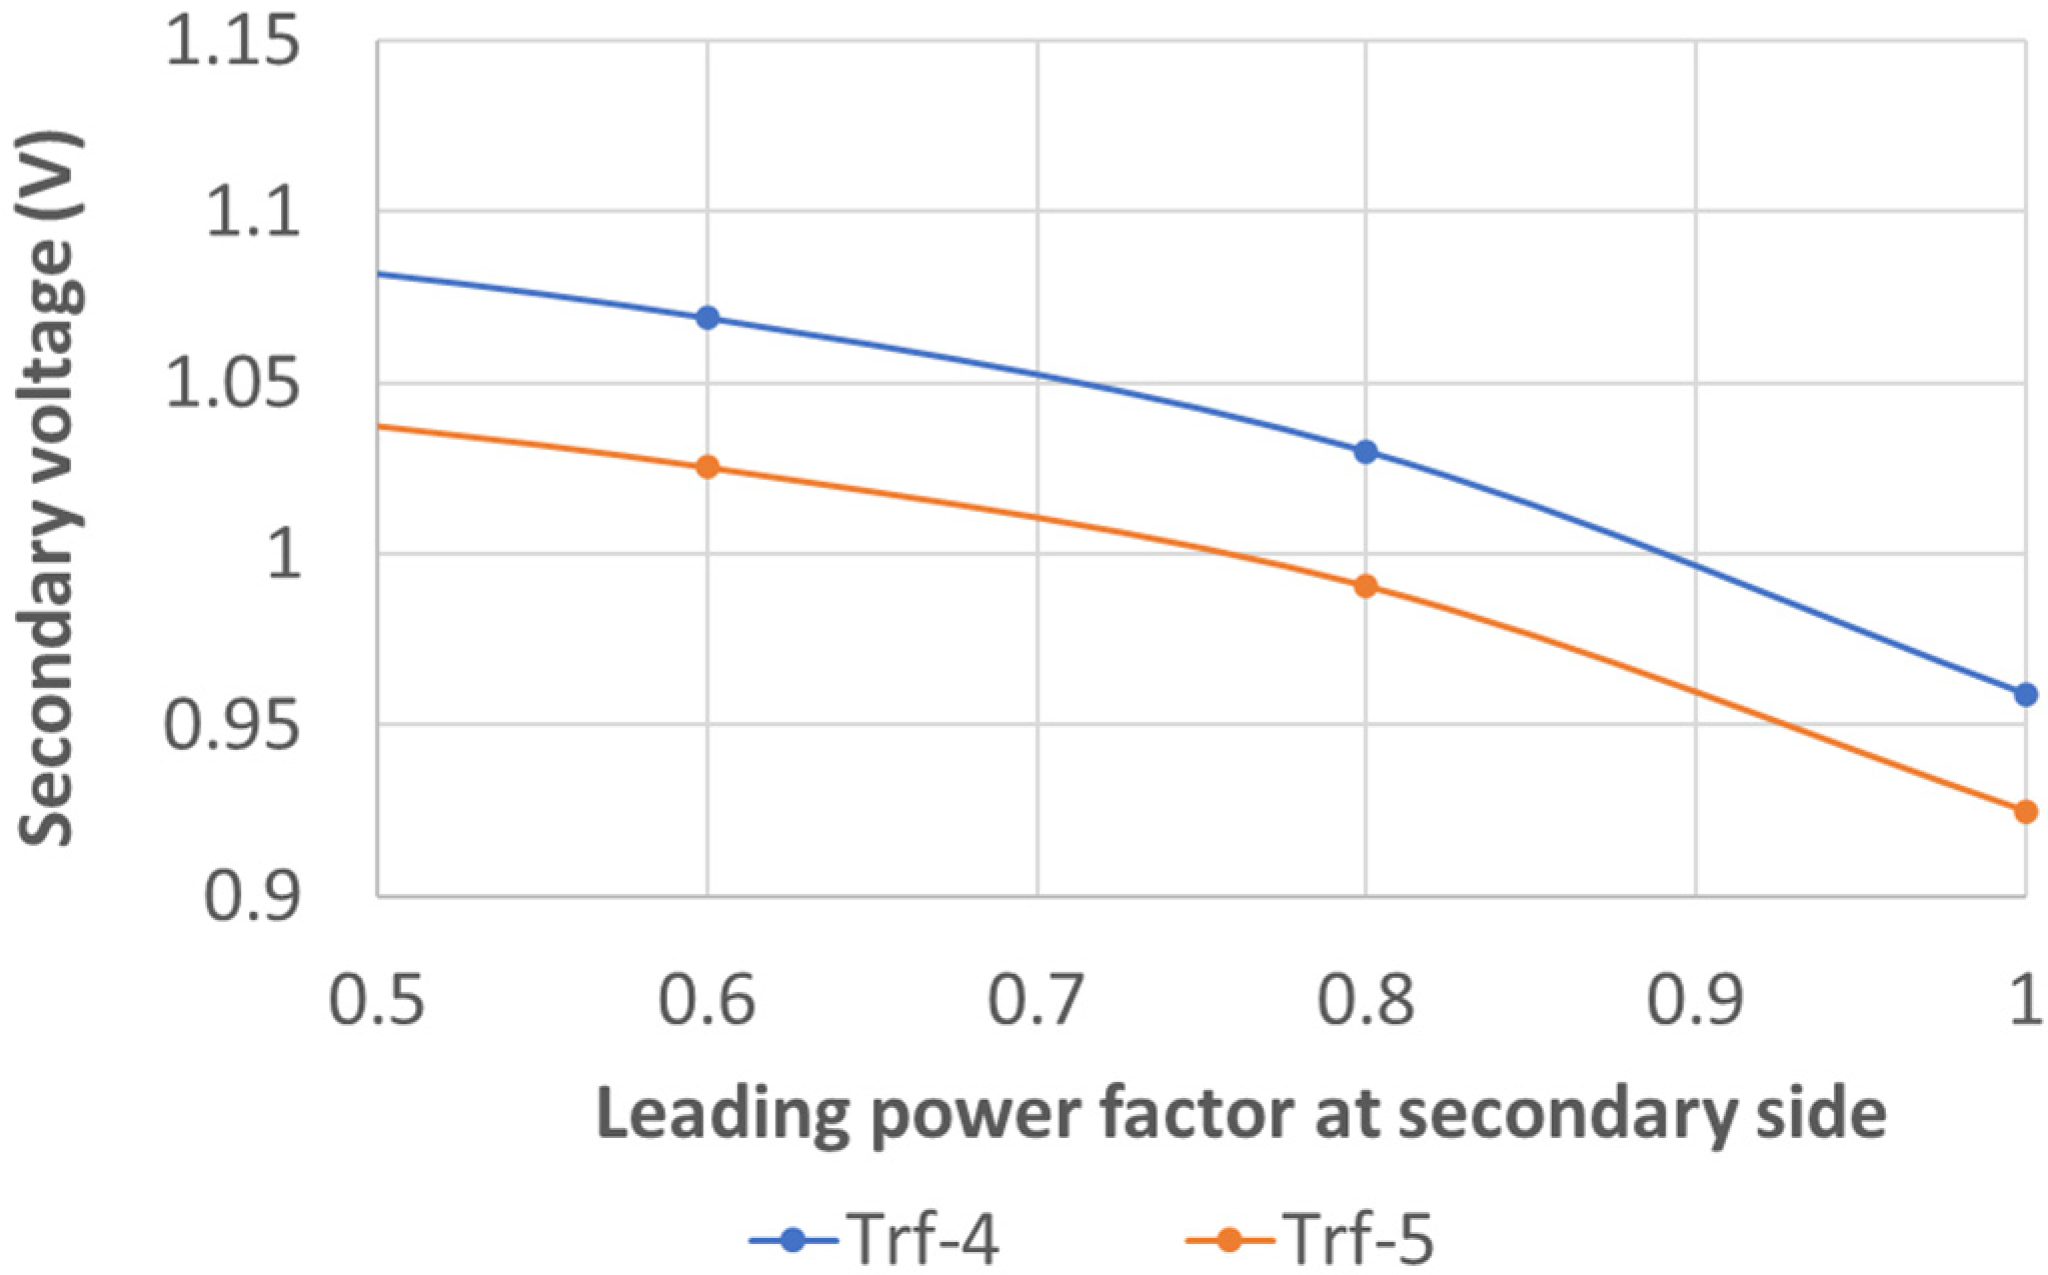
Therefore, the experimental results confirm the theoretical analysis. Furthermore, more information regarding the secondary voltage and its associated THD is added for Trf-1, Trf-2, Trf-3, Trf-4 and Trf-5 working at a load index of 0.24 and at a leading power factor values of Figure 13 and Figure 14, respectively.

Figure 13.
Secondary voltage for Trf-1, Trf-2 and Trf-3 at a load index equal to 0.24 and a leading power factor at the secondary side.
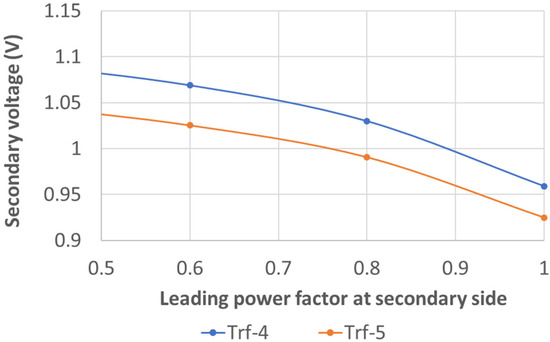
Figure 14.
Secondary voltage for Trf-4 and Trf-5 at a load index equal to 0.24 and a leading power factor at the secondary side.
In Figure 13, Trf-1 is the power transformer that presents the largest values for the secondary voltage for the complete set of leading power factor values, exceeding the 1.05 p.u limit value. In contrast, Trf-3 present the lowest values for the secondary voltage, which are within an acceptable range from 1 p.u. to 1.05 p.u. As for the three-phase transformers, in Figure 14, Trf-4 presents over-voltages for power factor levels at its secondary side that exceed the 1.05 p.u. limit for power factors lower than 0.7. In turn, Trf-5 presents over-voltages at the secondary side but does not exceed the 1.05 p.u. limit.
Apart from this, the five mentioned transformers are also subjected to light-load inductive conditions. The internal voltage drop levels for Trf-1, Trf-2, Trf-3, Trf-4 and Trf-5 are shown for different load indices and lagging power factors in Figure 15, Figure 16, Figure 17, Figure 18 and Figure 19, respectively.
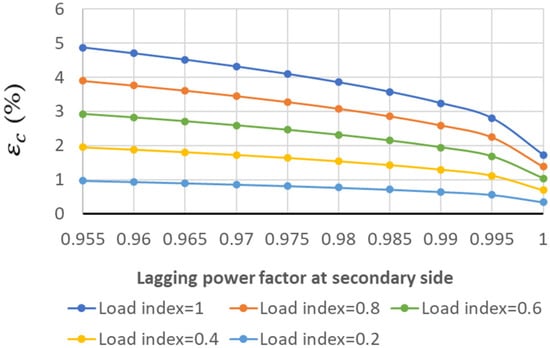
Figure 15.
Internal voltage drop (εc(%)) for Trf-1 in light-load inductive conditions.
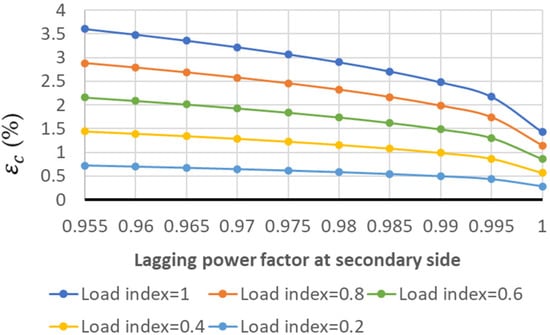
Figure 16.
Internal voltage drop (εc(%)) for Trf-2 in light-load inductive conditions.
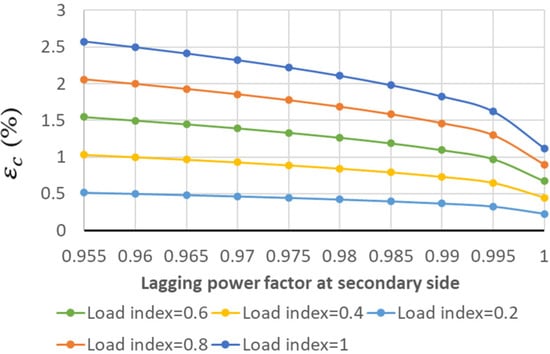
Figure 17.
Internal voltage drop (εc(%)) for Trf-3 in light-load inductive conditions.

Figure 18.
Internal voltage drop (εc(%)) for Trf-4 in light-load inductive conditions.
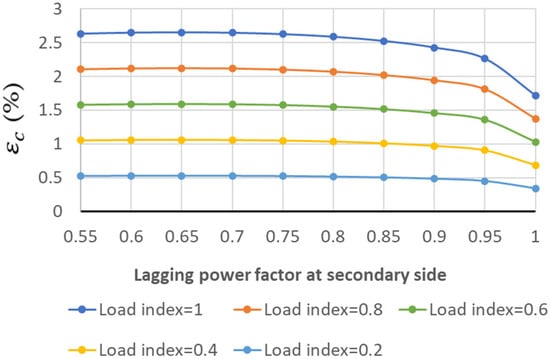
Figure 19.
Internal voltage drop (εc(%)) for Trf-5 in light-load inductive conditions.
In accordance with the results under the leading power factors, Trf-3 presents the lowest internal voltage drop values compared with Trf-1 and Trf-2, while Trf-1 presents the greatest ones. Although Trf-3 is more efficient than Trf-1, when both are subjected to an over-voltage at their primary sides, Trf-1 will reduce the over-voltage level at the secondary side more than Trf-3 will, thanks to the greater values of the internal voltage drop. Therefore, for the situation presented, Trf-1, with a greater leakage reactance level, will be more advantageous than Trf-3 at cancelling over-voltage at the secondary side when the source of over-voltage is at the primary side.
A similar deduction can be made using the three-phase transformers. While Trf-4 presents the greatest voltage drop values, Trf-5 presents more reduced values, thanks to its diminished reactance level. However, while Trf-5 is more efficient than Trf-4, Trf-4 will reduce over-voltage thanks to the greater internal voltage drop when the source of the over-voltage is on the primary side.
In previous analyses, the internal voltage drop values of Trf-1, Trf-2, Trf-3, Trf-4 and Trf-5 were presented for a wide range of load indices. Though these analyses were oriented to light-load conditions, load indices close to 1 were included to reflect that the variable reactance mechanism can be also applied to over-load conditions; in that sense, the change in leakage reactance of one transformer within a set of two transformers working in parallel could also help to share the overload or even cancel it.
4.3. Study of the Asymmetrical Current and Power Consumption in Three-Phase Transformers
Despite the analyses in Section 4.2, for three-phase transformers, there is an asymmetrical issue in the current and power signals. The authors in [31] associated two types of causes with such asymmetry: asymmetrical mutual impedances between phases due to the asymmetrical disposition of phases in space, and the deviation of the phase angle difference between phase voltage signals of the three-phase source. In the previous analyses, only the information regarding one phase was used, but now a detailed analysis is made for a leading power factor at the secondary of 0.4 for both Trf-4 and Trf-5, when working at a load index of approximately 0.4. The results are summarized in Figure 20, where the voltage levels at the secondary side and the load-index levels among phases are shown.
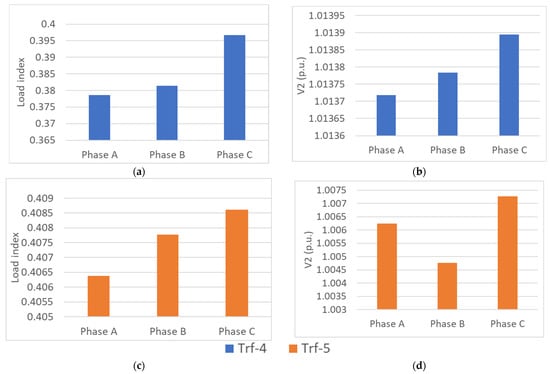
Figure 20.
Load index (λ) and voltage at the secondary side V2 (p.u.) for Trf-4 (a,b) and for Trf-5 (c,d).
It can be seen that the asymmetry between the load indices among phases is present, with load indices that range from 0.38 to 0.395 in Trf-4, and from 0.406 to 0.408 in Trf-5. Due to the asymmetrical current distribution, the voltage levels at the secondary side varies between 1.01375 p.u. and 1.0139 p.u. in Trf-4 and between 1.006 and 1.007 in Trf-5.
Therefore, there could be situations where one phase is more affected by the Ferranti effect than others but the difference among phase currents is not significant, as there are not no-load tests under consideration. Therefore, the following sections are oriented to three-phase transformers by analyzing one phase only.
5. Discussion and Proposal of a VR technique
As analyzed in the previous section, to avoid the Ferranti effect in light-load capacitive conditions, five power transformers with different parameters were considered.
Under capacitive load conditions, the reduction of leakage reactance is the key measure that can shift the sign change condition for the internal voltage drop to a greater value that is more difficult to reach, as seen with Trf-3 in comparison with Trf-2 and Trf-1 and with Trf-5 compared with Trf-4, as shown in Figure 7, Figure 8, Figure 9, Figure 10, Figure 11 and Figure 12. According to these figures, the absolute value of the load index is not a critical parameter that affects the sign change of the transformer internal voltage drop. However, the power factor at the secondary side of the transformer is indeed critical for the appearance of negative internal voltage drops and, therefore, for the occurrence of the Ferranti effect. For a specific power factor level of the secondary side, an increase in the load index value provokes a greater absolute value of the internal voltage drop, and the Ferranti effect in this case is more severe. Therefore, a decrease in the leakage reactance level is proposed for transformers working under risky capacitive load conditions.
Furthermore, contrary measures could also help the transformer operation in other light-load situations, such as in inductive conditions where the source of over-voltage is not the Ferranti effect but an over-voltage level occurring at the primary side. In that case, a transformer with a greater leakage reactance level is more advantageous than another one with a lower leakage reactance level, as seen in Figure 15, Figure 16, Figure 17, Figure 18 and Figure 19. According to these figures, the change in the load index does not alter the sign of the transformer internal voltage drop, as it is always positive. For a specific power factor level of the secondary side, the increase in the load index value provokes a greater absolute value of the internal voltage drop. So, in the case where there is a source of over-voltage in the primary side of the transformer, an increase of the reactance level is proposed to mitigate over-voltage at the secondary side.
When there is a set of two transformers working in parallel in over-load conditions, the decrease in reactance levels can help to share the overload more efficiently when needed or even to cancel an under-voltage issue at the secondary side of both transformers.
6. Simulations
In this section, the previous analyses are put into practice by implementing variable leakage reactance levels in a target transformer into two types of grids: first, in a simplified 2-bus system implemented in Matlab–Simulink to test the impact on the transformer itself or on immediately adjacent network elements; and second, in a standardized IEEE-39 node AC grid implemented in DIgSILENT PF to test the impact of variable leakage reactance transformers on voltage profiles of the remaining buses, AC line and transformer loading levels and power factor levels of the generators. It must be noted that for evaluating the over-voltage severity, a 1.05 p.u. level has been set as the maximum secure limit for operation. Analogously, in order to evaluate the under-voltage severity, a 0.95 p.u level has been set as the minimum secure limit for operation.
6.1. Simplified 2-Bus System
In this subsection, a simplified 2-bus system consisting of one three-phase AC grid, a three-phase transformer and a three-phase load is implemented. For cases of the Ferranti effect and over-load conditions, more elements are considered, such as shunt reactors or a second transformer to connect it in parallel to the first transformer. In each following subsection, a generic schematic with the rated data of grid elements is included for the sake of clarity. All the transformer parameters employed in the following subsections are listed in Table 5.
6.1.1. Light-Load Conditions with Highly Capacitive Loads: Mitigation of the Ferranti Effect at the Output of a Step-Down Transformer
The generic model for studying the mitigation of the Ferranti effect due to light-load capacitive conditions is shown in Figure 21, where the main data of the equipment are also indicated.
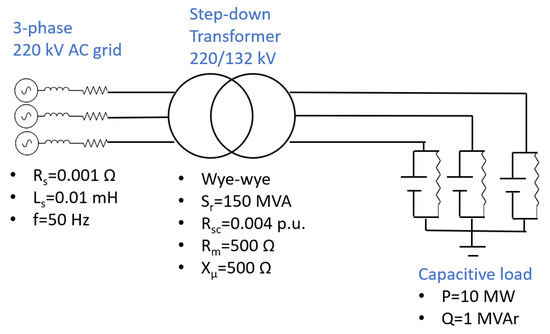
Figure 21.
Generic model for studying the mitigation of the Ferranti effect in a step-down transformer when subjected to light-load capacitive conditions.
Two scenarios are considered for this analysis: the baseline scenario, where the leakage reactance is set to 0.8 p.u, and the VR technique scenario, where the transformer reactance is reduced 10 times with respect to the baseline value. In Table 6, the main results of simulations in both scenarios are collated.
Table 6.
Main results for the step-down 220/132 kV transformer at light-load capacitive conditions.
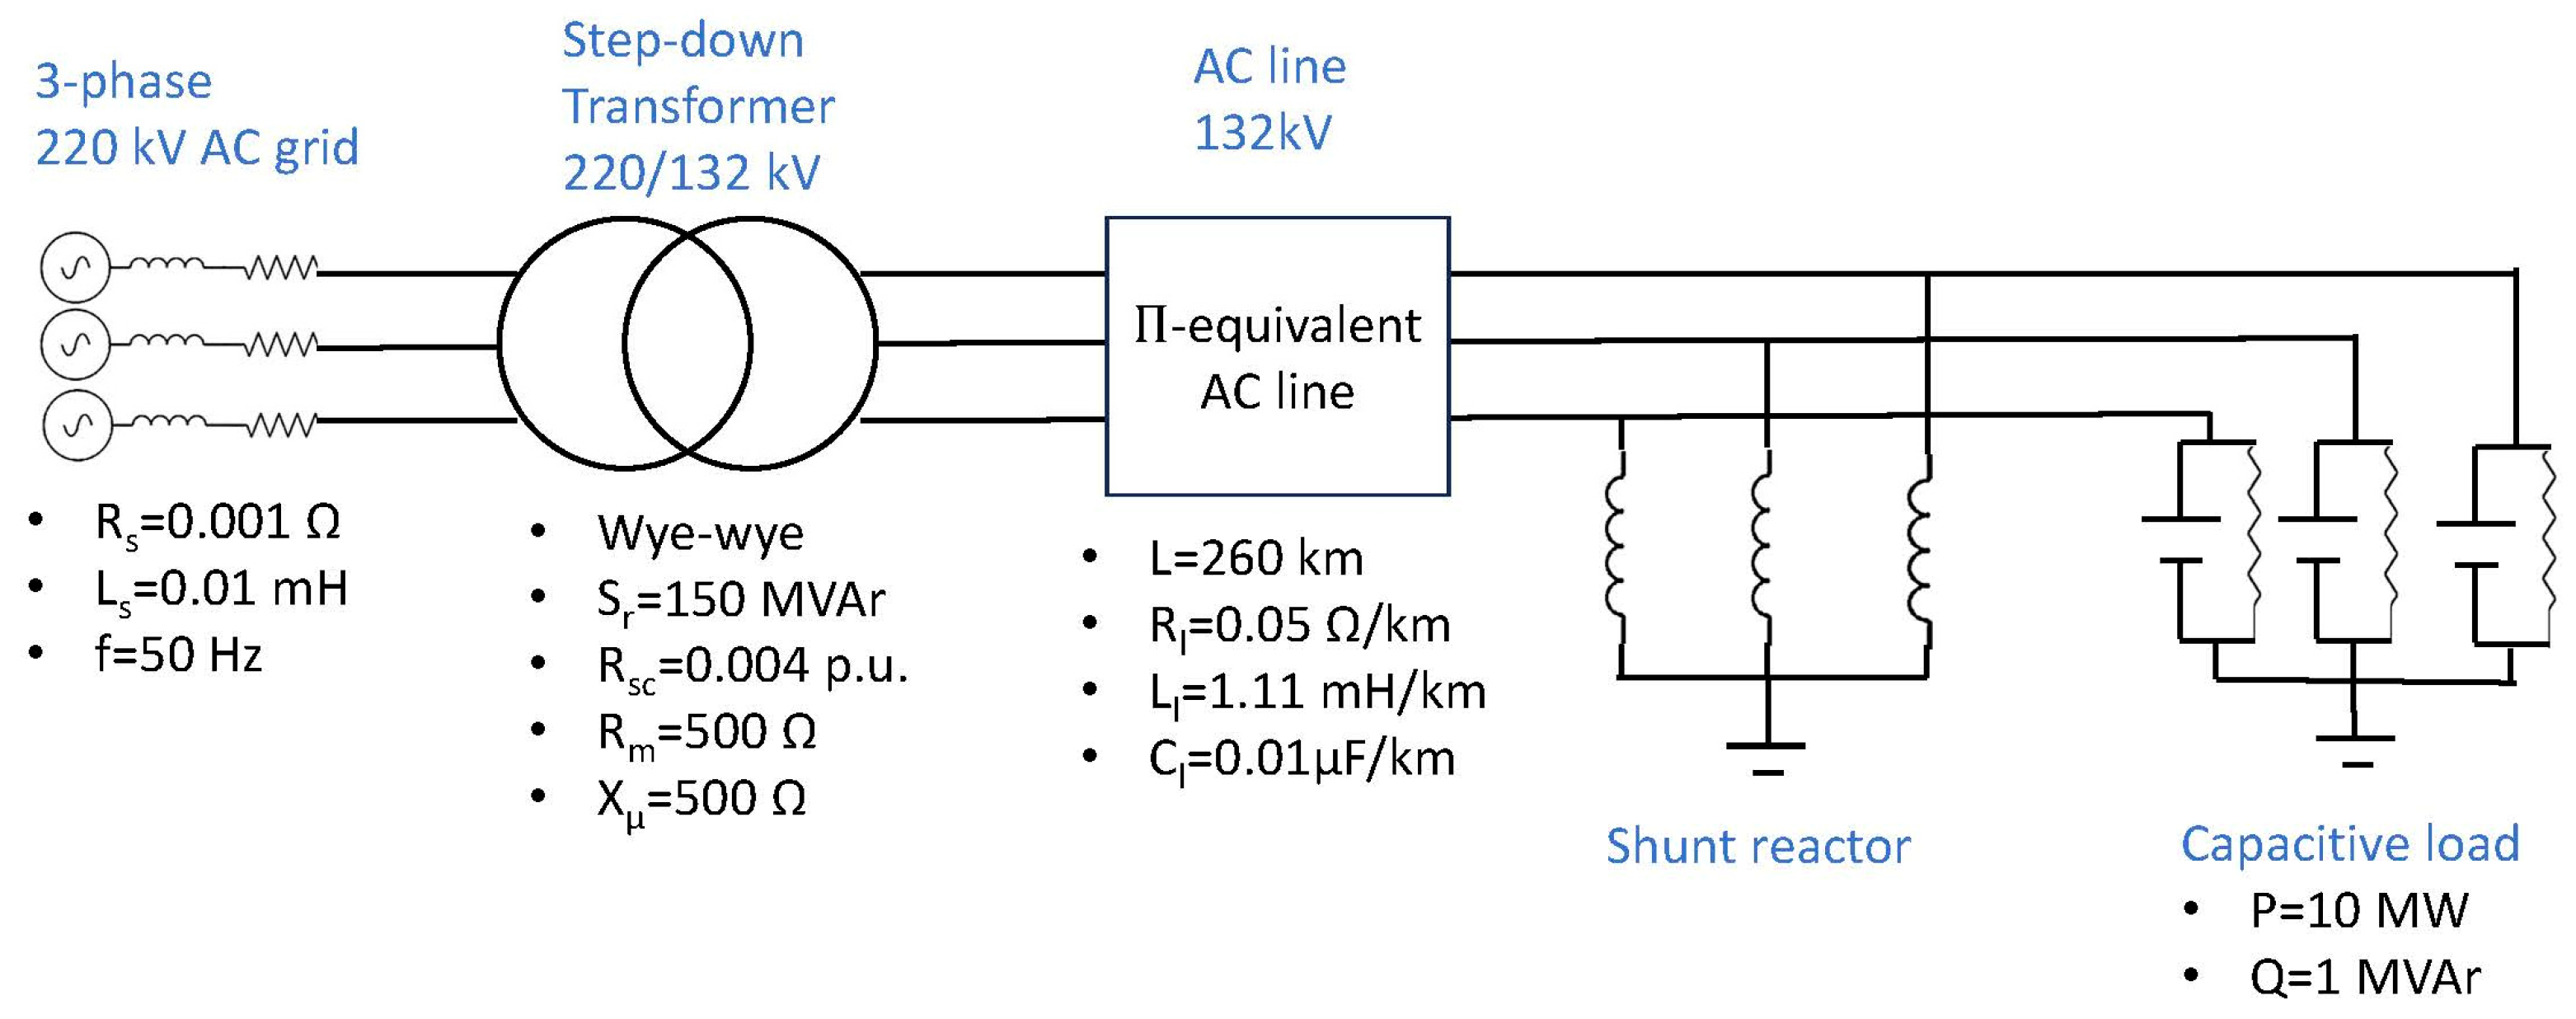
While in baseline scenario, the voltage level at the secondary side of transformer exceeds 1.05 p.u. and presents a largely negative internal voltage drop of −10.92%, in the VR technique scenario, the leakage reactance value is reduced 10-fold with respect to the baseline. Then, the voltage level at the secondary end of transformer is kept below 1.05 p.u., and the internal voltage drop, though still negative, is reduced significantly to −1.028%. Therefore, in both scenarios, there is evidence of the Ferranti effect as the voltage at the secondary side is beyond 1 p.u, but with the VR technique, the over-voltage at the secondary side is mitigated below limit levels. In addition, a second case for the Ferranti effect is analyzed for a transformer subjected to light-load capacitive conditions but with an AC line that connects the transformer with the load. The generic scheme implemented in Matlab–Simulink is shown in Figure 22, where all the rated values are shown. It is interesting to check how this VR technique can also help to mitigate the Ferranti effect at the receiving end of a long AC line, since the Ferranti effect has been mostly studied in long AC lines. Also, a shut reactor is included to reduce the Ferranti effect on the receiving end of the AC line, and the relative contributions between the shunt reactor and the VR technique to mitigate the Ferranti effect are assessed.
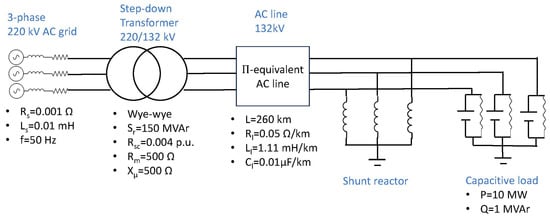
Figure 22.
Generic model for studying the mitigation of the Ferranti effect in a step-down transformer when subjected to light-load capacitive conditions with an AC line interconnection.
The main results for this second analysis are summarized in Table 7. Four scenarios are now considered: the baseline scenario without a shunt reactor nor the VR technique, the 10 MVAr shunt reactor, the VR technique, and a combination of the VR technique plus the 1 MVAr shunt reactor.
Table 7.
Main results for the step-down 220/132 kV transformer at light-load capacitive conditions with an AC line interconnection.
Within the baseline scenario, the voltage level at the secondary end of the transformer is 1.201 p.u., which is much greater than the 1.05 p.u. limit as well as the voltage level at the receiving end of the AC line, which is 1.247 p.u. Since the internal voltage drop at both the transformer (−20.05%) and the AC line are negative (−4.6%), an adverse Ferranti effect becomes evident, and solutions are needed to mitigate it.
In the second scenario, with the same light-load capacitive conditions as for the baseline, a 10 MVAr shunt reactor is connected at the receiving end of an AC line, which sets the voltage at that bus at the limit of 1.05 p.u., which leads to a positive internal voltage drop of the AC line of 1.45%. However, although this measure also reduces the severity of the Ferranti effect at the secondary side of the transformer, the voltage level at the secondary end is still at the limit of 1.05 p.u., and the transformer internal voltage drop is still negative at −6.47%. Therefore, by including a 10 MVAr shunt reactor, the problem is partially solved for the receiving end of the AC line but not for the secondary side of the transformer.
In the third scenario, with the same light-load capacitive conditions as for the baseline, a VR technique is implemented in the transformer that changes its leakage reactance from 0.8 p.u. to 0.08 p.u. without connecting any shunt reactor. The outcomes of this measure are the reduction of the voltage level at the secondary side of the transformer to 1.017 p.u., which is below the 1.05 p.u, limit, and the reduction of the voltage level at the receiving end of the AC line to 1.057 p.u., which, in contrast, is still beyond 1.05 p.u. The internal voltage drops at both the transformer and the AC line are −1.74% and −3.906%, respectively. The negative is reduced in both the baseline and the 10 MVAr shunt reactor scenarios, while the is only been reduced with respect to the baseline, but it turns to be more negative than with the 10MVAr shunt reactor.
Therefore, having analyzed the three previous scenarios, we can propose an interesting mixed strategy that combines both previous measures to reduce the size of the shunt reactor so that the adverse Ferranti effect can be cancelled. Therefore, a fourth last scenario is analyzed in which a combined action of VR technique that changes the leakage reactance from 0.8 to 0.08 p.u. plus a 1 MVAr shunt reactor is implemented. The outcomes of this measure are the reduction of the voltage level at both the secondary end of the transformer and the receiving end of the AC line to 1.016 p.u. and 1.05 p.u., respectively, which are below or equal to the 1.05 p.u. limit. Thus, the absolute value of the negative internal voltage drops at both the transformer and the AC line are reduced to −1.63% and −3.34%, respectively. Hence, while there is still a certain degree of the Ferranti effect as the voltages are greater than 1 p.u., the effect is not adverse since the voltage levels are kept within limits.
Consequently, the implementation of the VR technique at transformers can help to also mitigate the Ferranti effect at AC lines and reduce the required size of the shunt reactors for this purpose. In addition, this protects the secondary windings of the transformer from over-voltages.
6.1.2. Light-Load Conditions with Highly Inductive Loads: Mitigation of an Over-Voltage Scenario
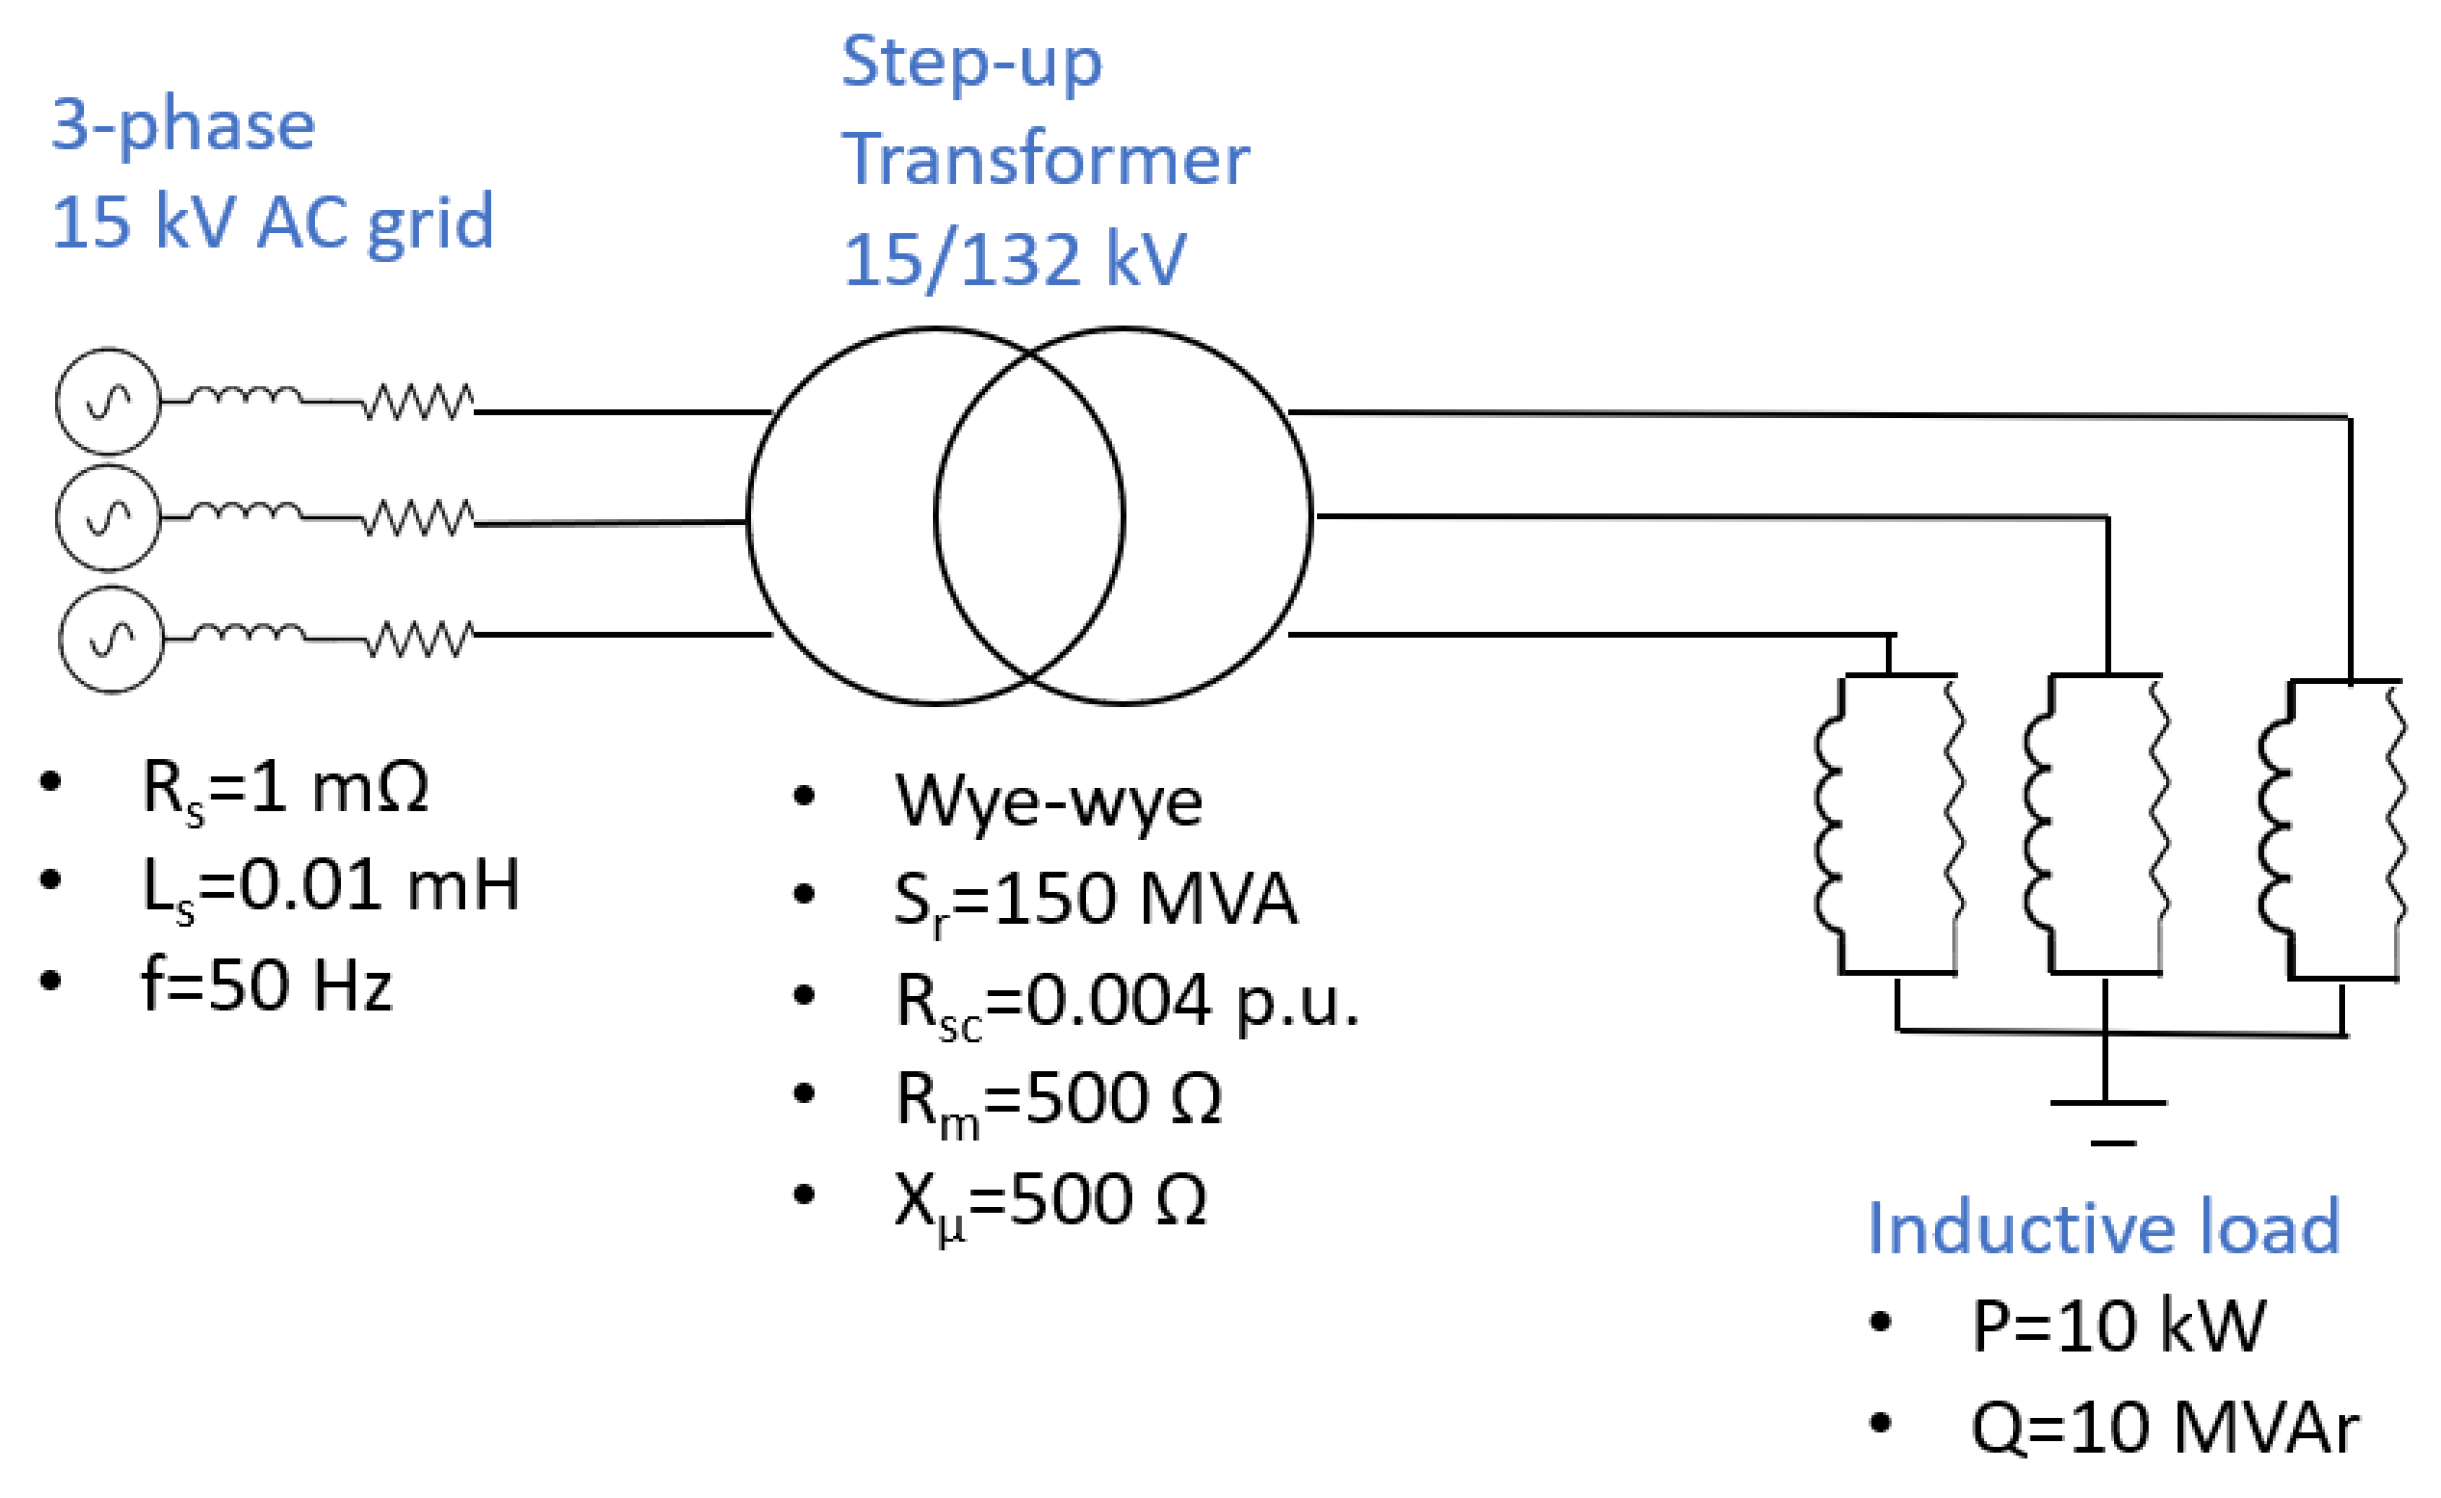
Highly inductive loads can also provoke over-voltages at different points of the electrical networks. In this subsection, implementation of the VR technique in a transformer is achieved to mitigate the over-voltage level. The main circuit schematic is shown in Figure 23.
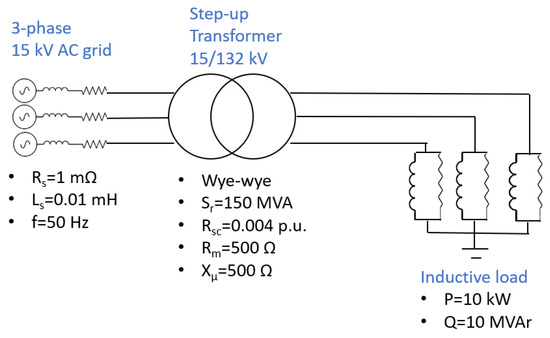
Figure 23.
Generic scheme for a step-up 15/132 kV transformer under light-load inductive conditions.
In this subsection, the source of the over-voltage is not the Ferranti effect but the main three-phase source connected to the primary side of the transformer, which is elevating the voltage to 16.2 kV from its rated value of 16 kV. Therefore, the over-voltage is also transferred to the secondary side of the transformer connected to the inductive load. According to Table 8, the secondary side of the transformer experiences a 1.068 p.u. voltage level, which is beyond the 1.05 p.u. limit. When implementing a VR technique that changes its leakage reactance from 0.8 p.u. to 0.4 p.u., the voltage level is reduced to 1.024 p.u., which is below the 1.05 p.u. limit. In turn, the internal voltage drop of the transformer is increased from 1.15% to 5.54% when the VR technique is applied.
Table 8.
Main results for the step-up 15/132 kV transformer in light-load inductive conditions.
6.1.3. Over-Load Conditions: Redistribution of Load between Transformers Working in Parallel
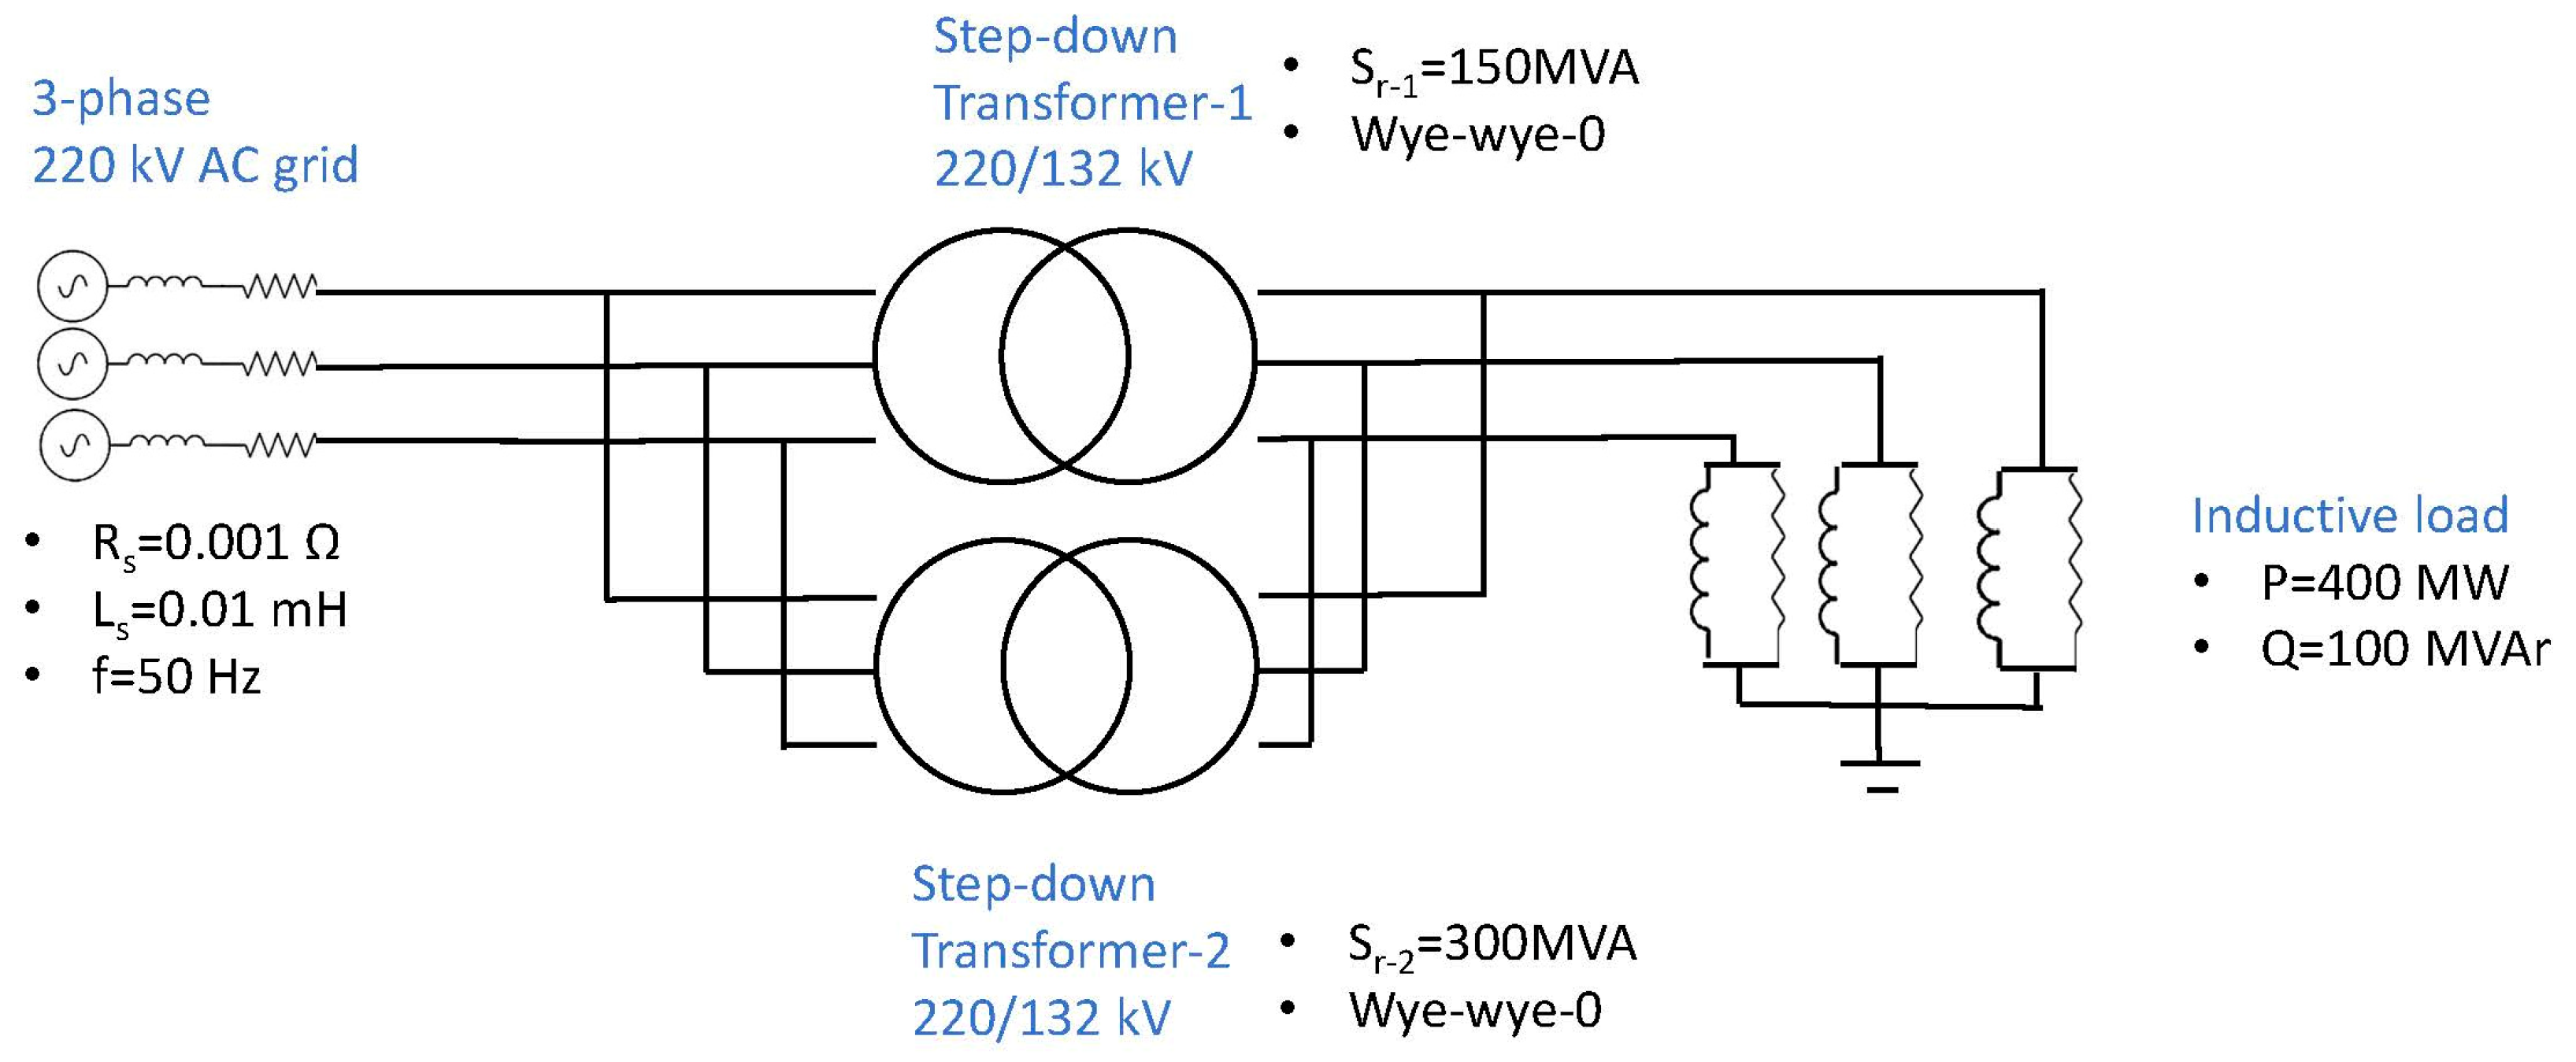
The parallel operation of two transformers is an arrangement to increase the power yielded by a transformation center whenever there is an increase in the demanded apparent power, which becomes a full-load condition. This arrangement allows the transformers to share the load to prevent either transformer from overloading while the yielded power by the group is increased. However, there are situations where there is a temporary overload to be withstood by the two transformers in parallel. Due to the parallel condition, the transformer with the higher relative short-circuit voltage will withstand a greater load than the other transformer and vice versa. The degree of relative overload will also depend on the difference in the rated apparent powers of the transformers. In Figure 24, the generic scheme for two step-down 220/132 kV transformers working in parallel is shown.
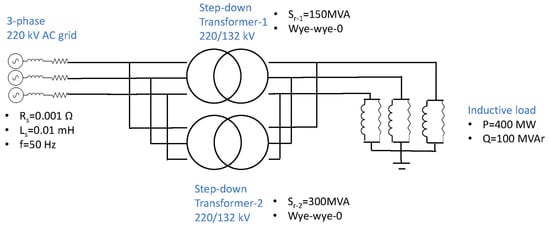
Figure 24.
Scheme for 2 step-down 220/132 kV transformers working in parallel in over-load conditions.
In Table 9, the main results for the implementation of the VR technique for the transformers working in parallel are summarized.
Table 9.
Main results for 2 step-down 220/132 kV transformers of equal apparent rated power working in parallel under over-load conditions.
In the baseline scenario in Table 9, Trf 1 presents a lower than Trf 2, which causes the overload of Trf 1, with a load index of 1.108, while Trf 2 is loaded at a 0.74 index. In addition, in the baseline scenario, there is an under-voltage issue, as the voltage level at the secondary sides of the transformers is 0.938 p.u., which is below the minimum level of 0.95 p.u.
When VR technique 1 is implemented, Trf 2 assumes the overload with a load index of 1.017, while Trf 1 becomes loaded at 0.61. This has been made possible by changing the leakage reactance values of both transformers, namely by increasing Xsc-1 from 0.08 p.u. to 0.1 p.u. and by reducing Xsc-2 from 0.12 p.u. to 0.06 p.u. In this case, the under-voltage issue has been solved as the voltage level at secondary side of transformers is 0.96 p.u., which is greater than 0.95 p.u. However, this technique does not cancel the overload but alternates it from one transformer to another.
To cancel the overload in the parallel group, VR technique 2 is implemented; just by making both Xsc-1 and Xsc-2 equal to 0.08 p.u., both transformers are loaded to 0., and neither of them becomes overloaded. Therefore, with proper VR techniques, the over-load condition can be cancelled so that transformers are as little affected as possible. In this last scenario, the voltage level at the secondary side is still within the 0.95 and 1 p.u. limits. Hence, it is important to design the VR technique so as not to cause under-voltage issues at the secondary side of the transformers.
Having analyzed the previous cases in simplified networks, it is also necessary to study the impact of these VR techniques in larger networks to assess how these affect the voltage profiles of different buses, the loading levels of the remaining transformers and AC lines and the power factor levels at the generators.
6.2. Impact of the VR Technique on Transformers within the IEEE-39 Node AC Grid
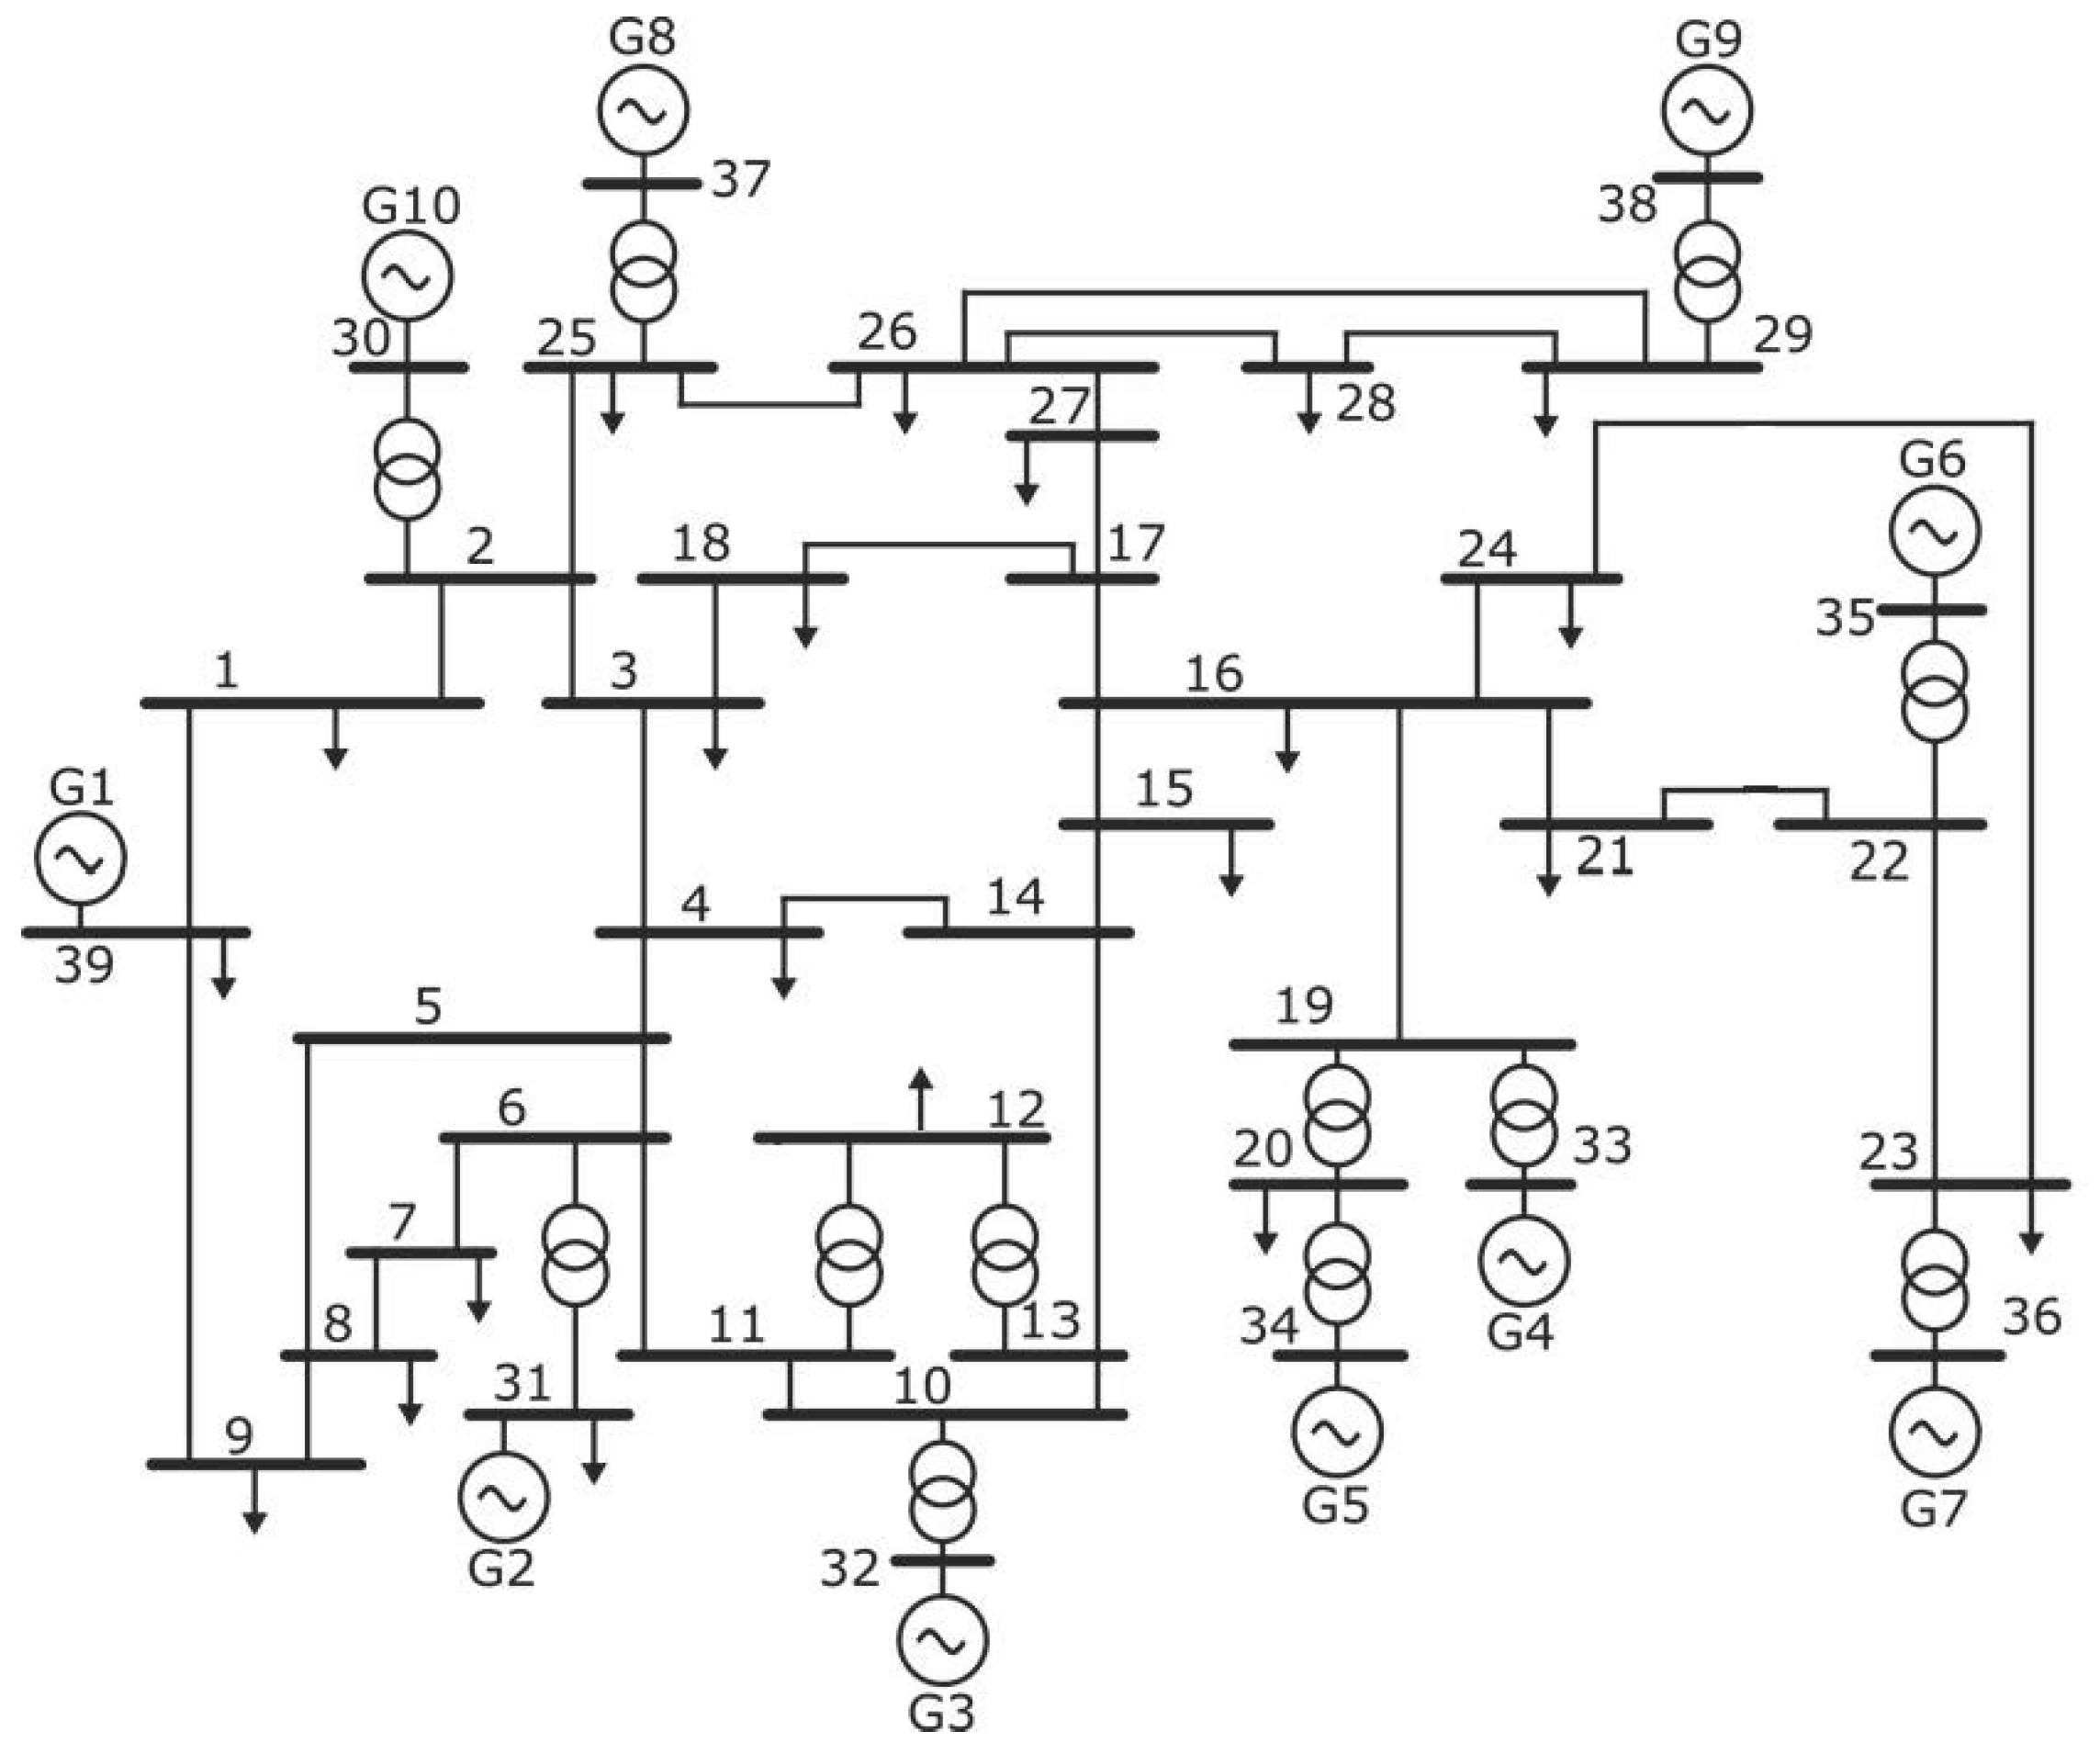
In this subsection, similar study cases as in Section 6.1 are analyzed within a larger grid, and the impact of varying the leakage reactance of the target transformer is assessed in other nodes. The selected larger grid for this purpose is the IEEE-39 node AC grid, whose schematic is shown in Figure 25, and the nomenclature for the different nodes, generators, AC lines and transformers is also indicated for the following analyses. Basic information related to this grid can be found at [32], including the transformer parameters.

Figure 25.
IEEE-39 node AC grid.
6.2.1. Impact of the VR Technique on a Step-Down Transformer under Light-Load Capacitive Conditions
In Section 6.1.1, the impact of varying the leakage reactance of a step-down transformer under light-load capacitive conditions was assessed for a simplified 2-bus system. Now such an impact is studied in the case of the transformer Trf 13-12 in the IEEE 39-node grid presented in Figure 25, which joins buses 13 and 12 in the grid. In this case, two reactance modification proposals are assessed from the base leakage reactance value of 0.1305 p.u.: one lower, 0.0326 p.u., and one larger, 0.522 p.u. According to the analysis in Section 6.1.1, for light-load capacitive conditions, the improvement in voltage profiles in the 2-bus system was achieved by decreasing the leakage reactance of the involved transformer.
In Figure 26, the voltage profiles of nodes in the IEEE-39 node AC grid are shown for the previous leakage reactance values for the transformer Trf 12-13 when Load 12 stops consuming 88 MVAr and starts injecting 88 MVAr. The change to Load 12 from an inductive to a capacitive nature with no leakage reactance changes provokes an overall increase in the voltage profile of the buses, exceeding in a several of them the predefined 1.05 p.u. level for the bus voltage, although there were buses that previously exceeded this level with an inductive Load 12, namely 35 and 36.
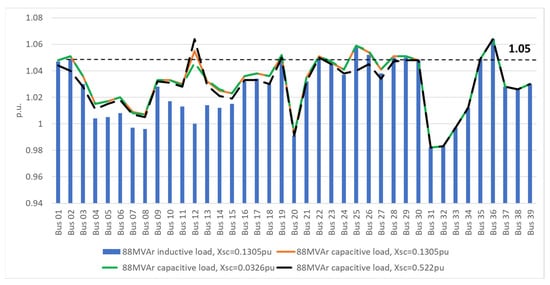
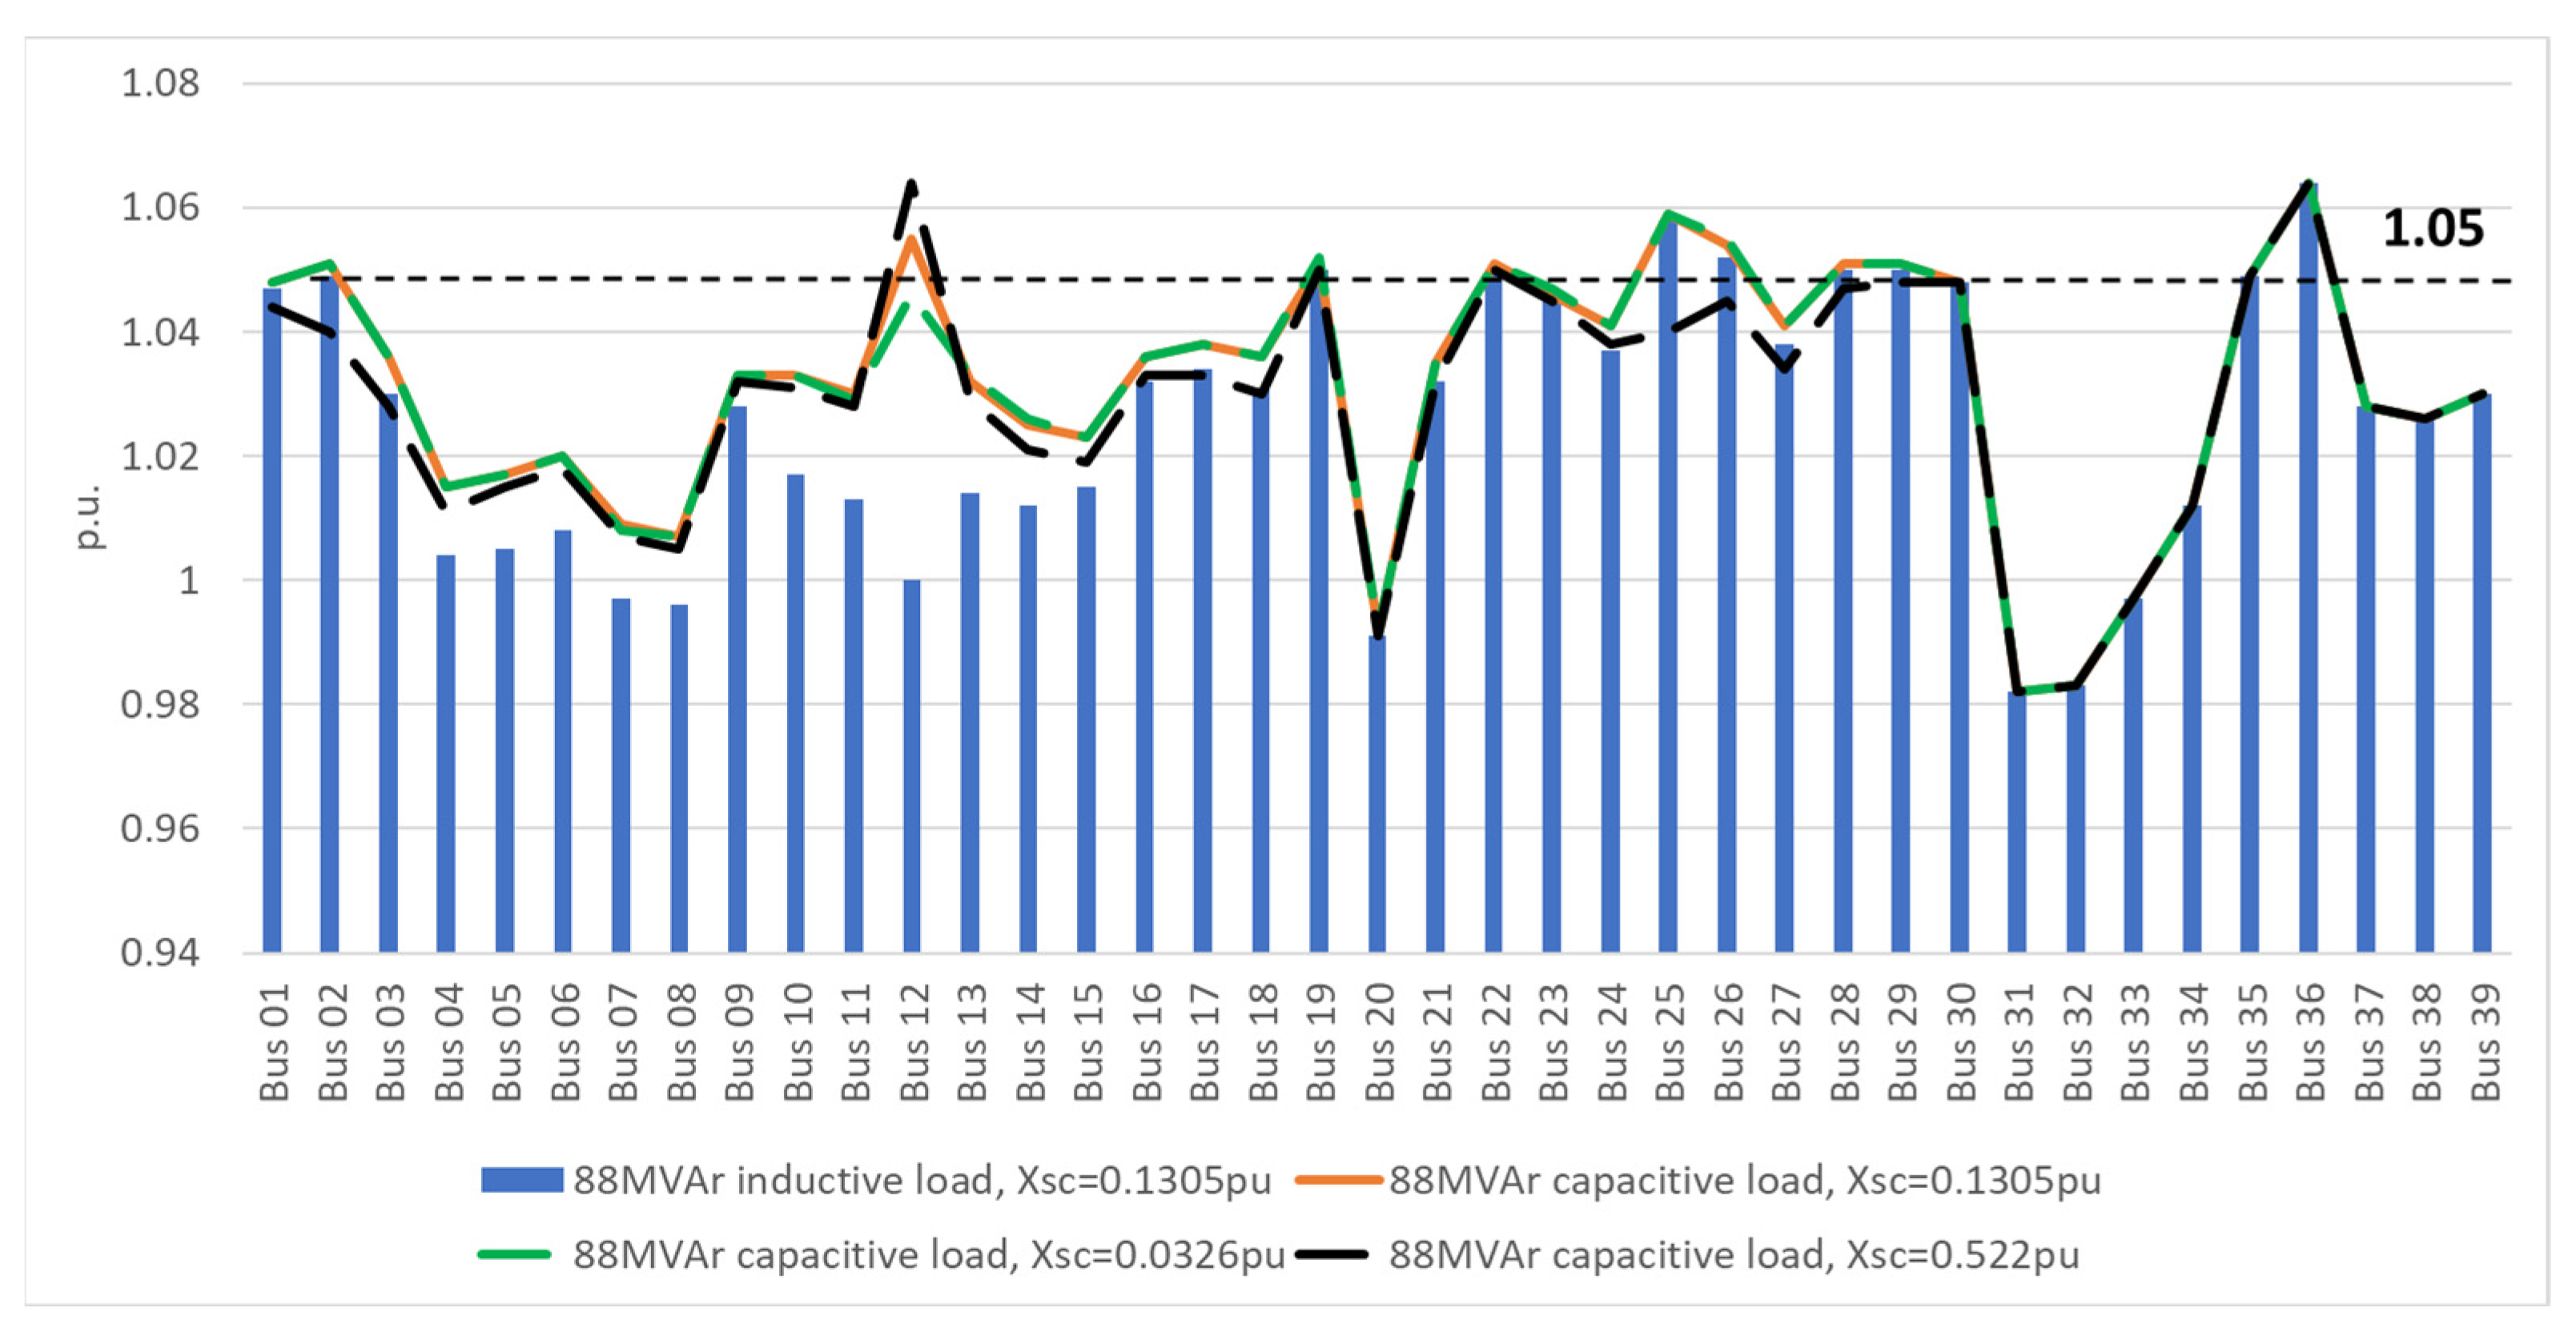
Figure 26.
Voltage profile of buses in the IEEE-39 node AC grid in response to changes in leakage reactance in Trf 12-13 when subjected to light-load inductive and capacitive conditions.
However, bus 12 experiences an over-voltage condition from 1 p.u. to 1.055 p.u. with this change. Based on the previous analysis in Section 6.1.1, a new lower leakage reactance value for Trf 13-12 was tested, namely 0.0326 p.u., and this returned bus 12 to below the 1.05 p.u. limit.
Also, a greater leakage reactance value for Trf 13-12 was tested, namely 0.522 p.u., and while buses 25 and 26 set the voltage below the 1.05 p.u. limit, the over-voltage level is exacerbated in bus 12, reaching 1.064 p.u. at their secondary side.
The values for relative internal voltage drop are −2.33, −1.27 and −2.47% for Trf 13-12 leakage reactance values of 0.1305, 0.0326 and 0.522 p.u., respectively. In all the three light-load capacitive conditions, Trf 13-12 exhibits negative internal voltage drop and there is certain degree of the Ferranti effect, since the voltage level at bus 12 exceeds 1 p.u. However, the Ferranti effect in case of leakage reactance values of 0.1305 and 0.522 is aggravated since it drives voltage level at bus 12 beyond the 1.05 p.u. level.
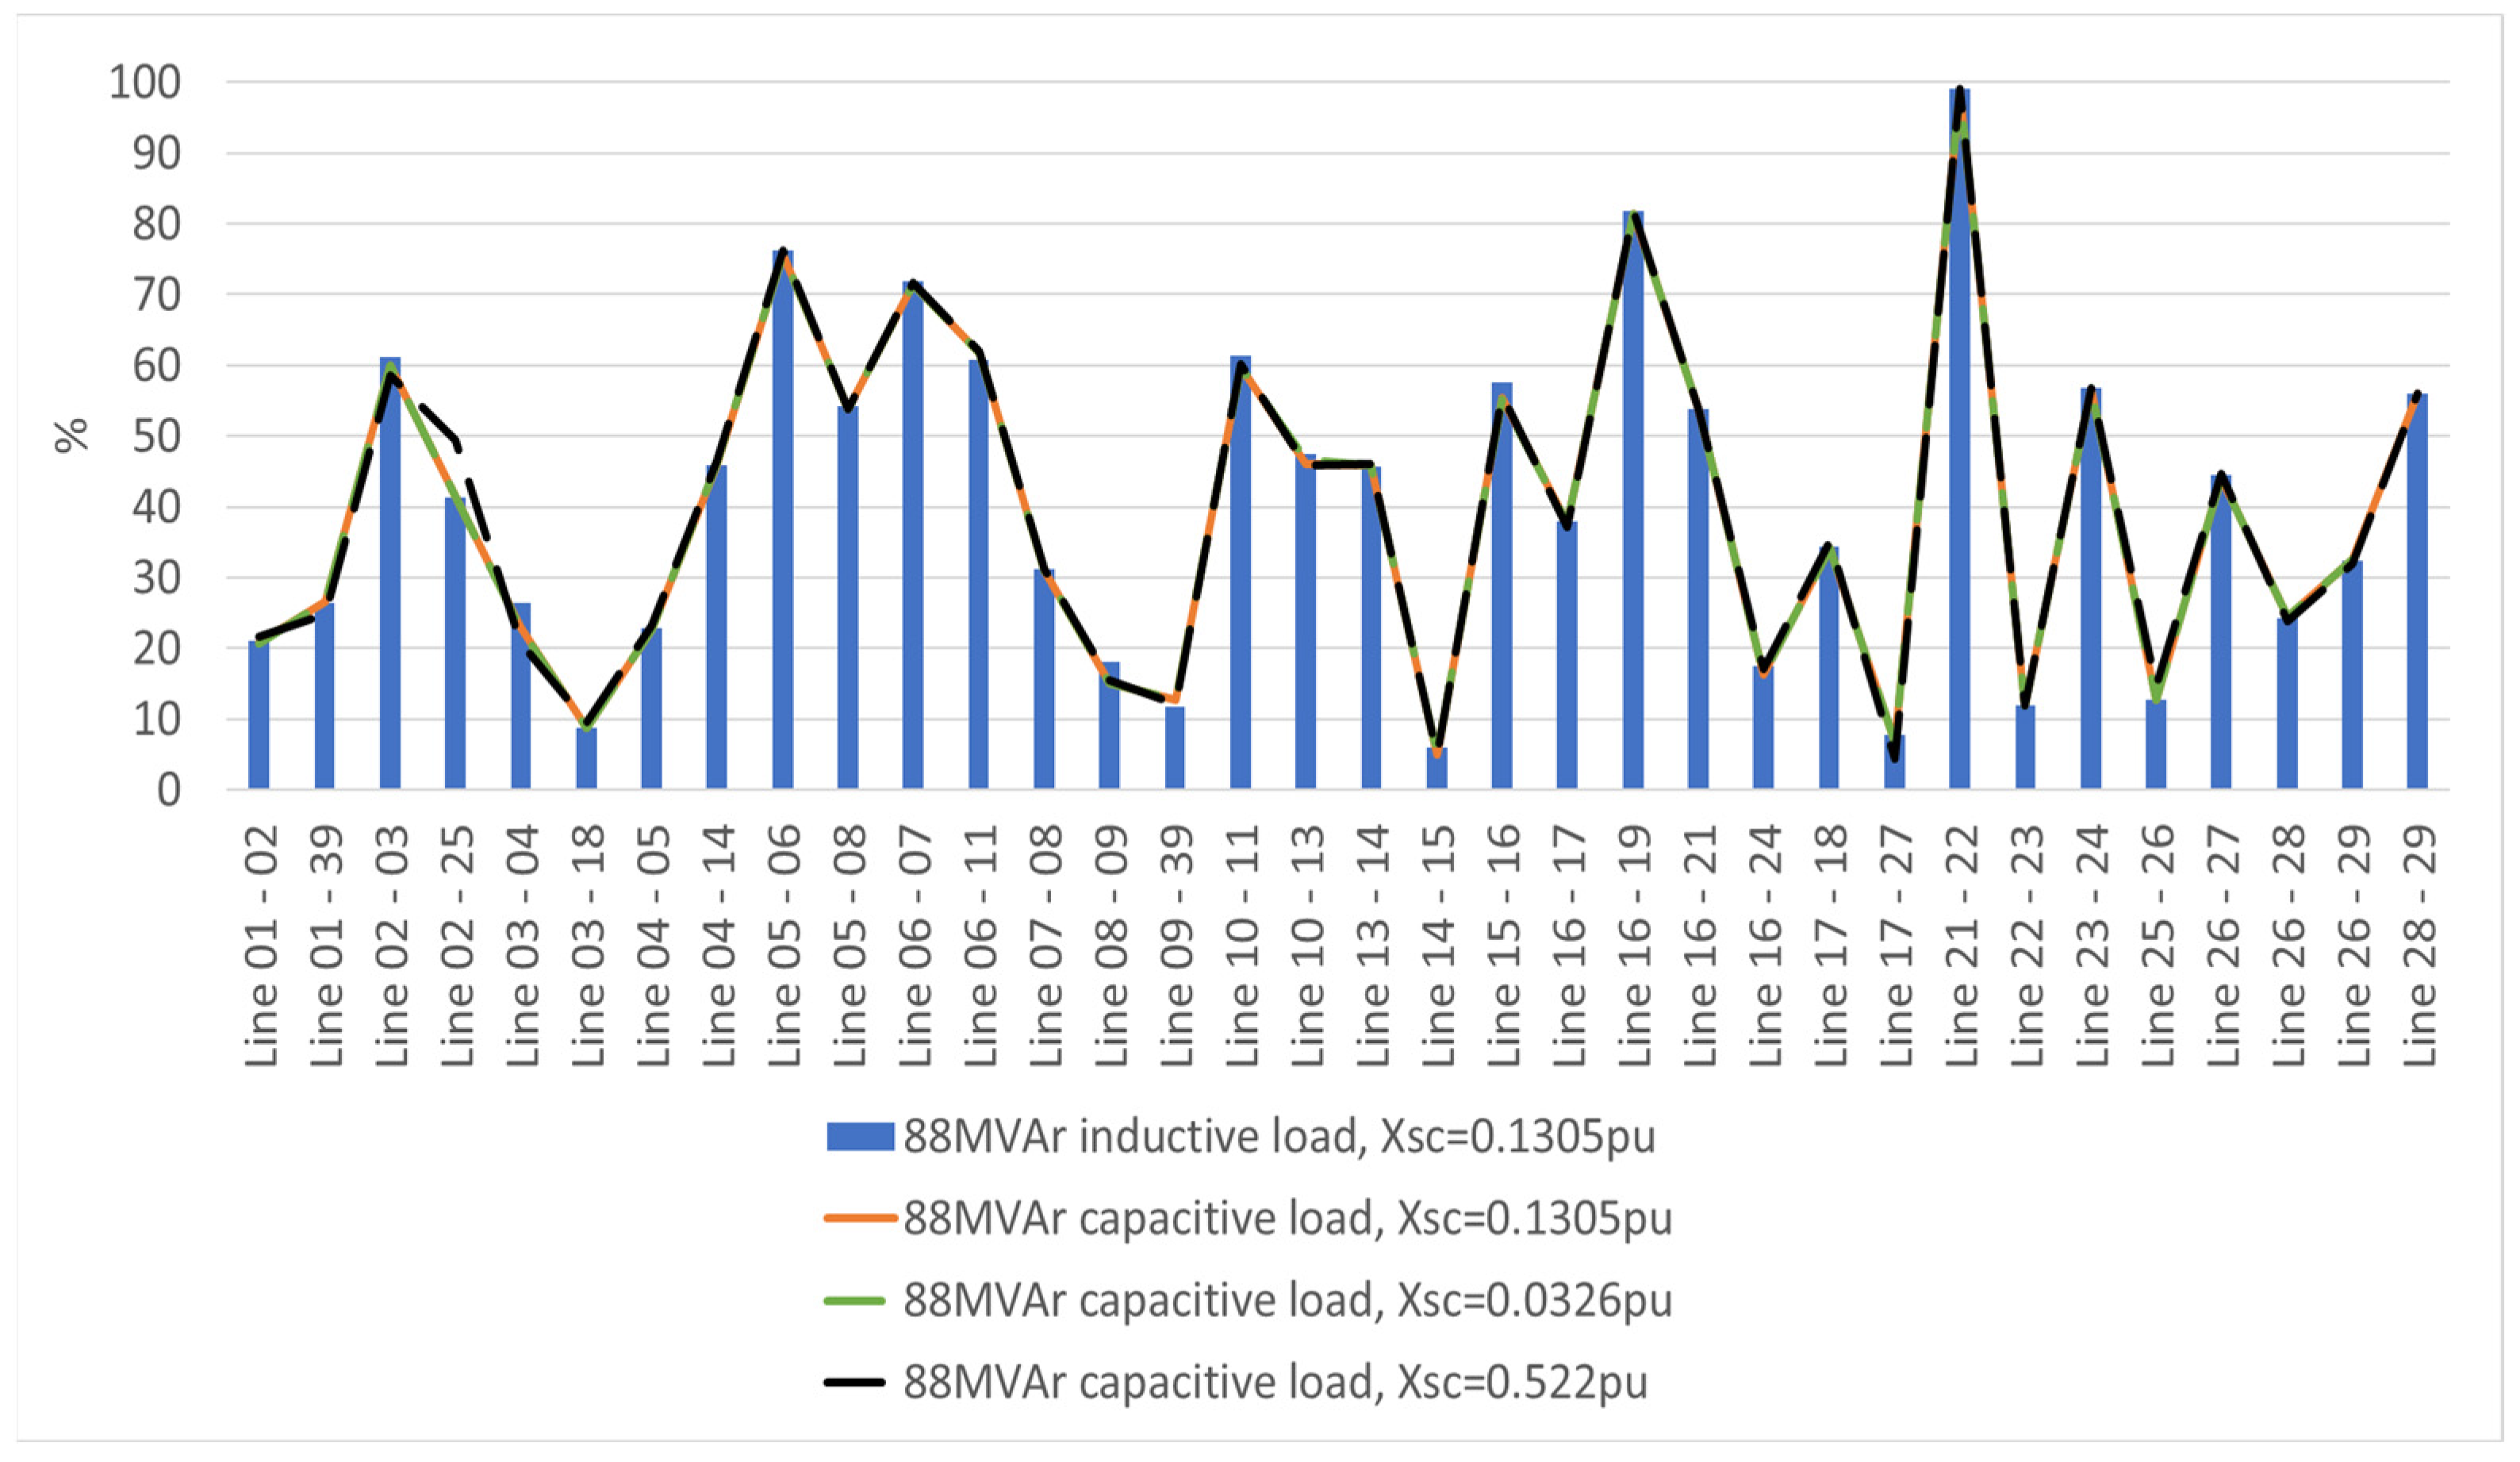
As for the effect on the line and transformer loading levels, in Figure 27 and Figure 28, it is clear that modification of the leakage reactance values of Trf 13-12 does not alter significantly the loading level of either the AC lines or transformers in the IEEE node-39 AC grid. There only increase is in the loading level in Line 02-25, from a 40% to a 50% level, which is from varying the leakage reactance value to 0.522 p.u. In addition, the involved Trf 13-12 transformer experiences an increase in the loading level from 10% to 20% when its leakage reactance is changed from 0.1305 to 0.0362 p.u. and a decrease in the loading level from 10% to 5% for a leakage reactance change from 0.1305 to 0.522 p.u.
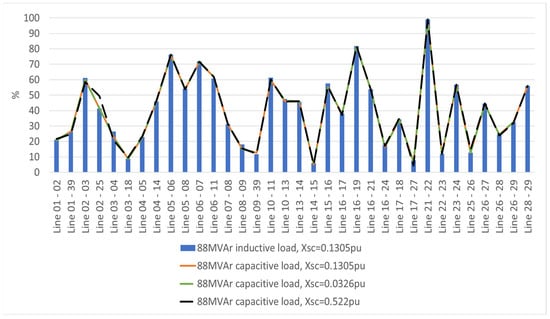
Figure 27.
Line-loading level (%) of AC lines in the IEEE-39 node AC grid in response to changes in the leakage reactance in Trf 13-12.
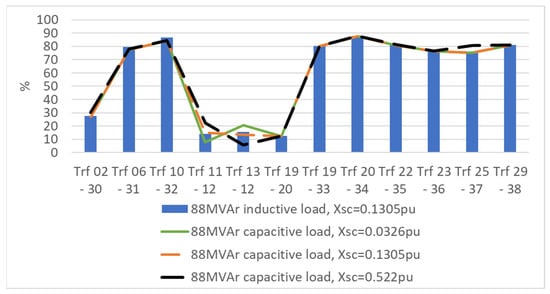
Figure 28.
Transformer loading level (%) of transformers in the IEEE-39 node AC grid in response to changes in the leakage reactance in Trf 13-12.
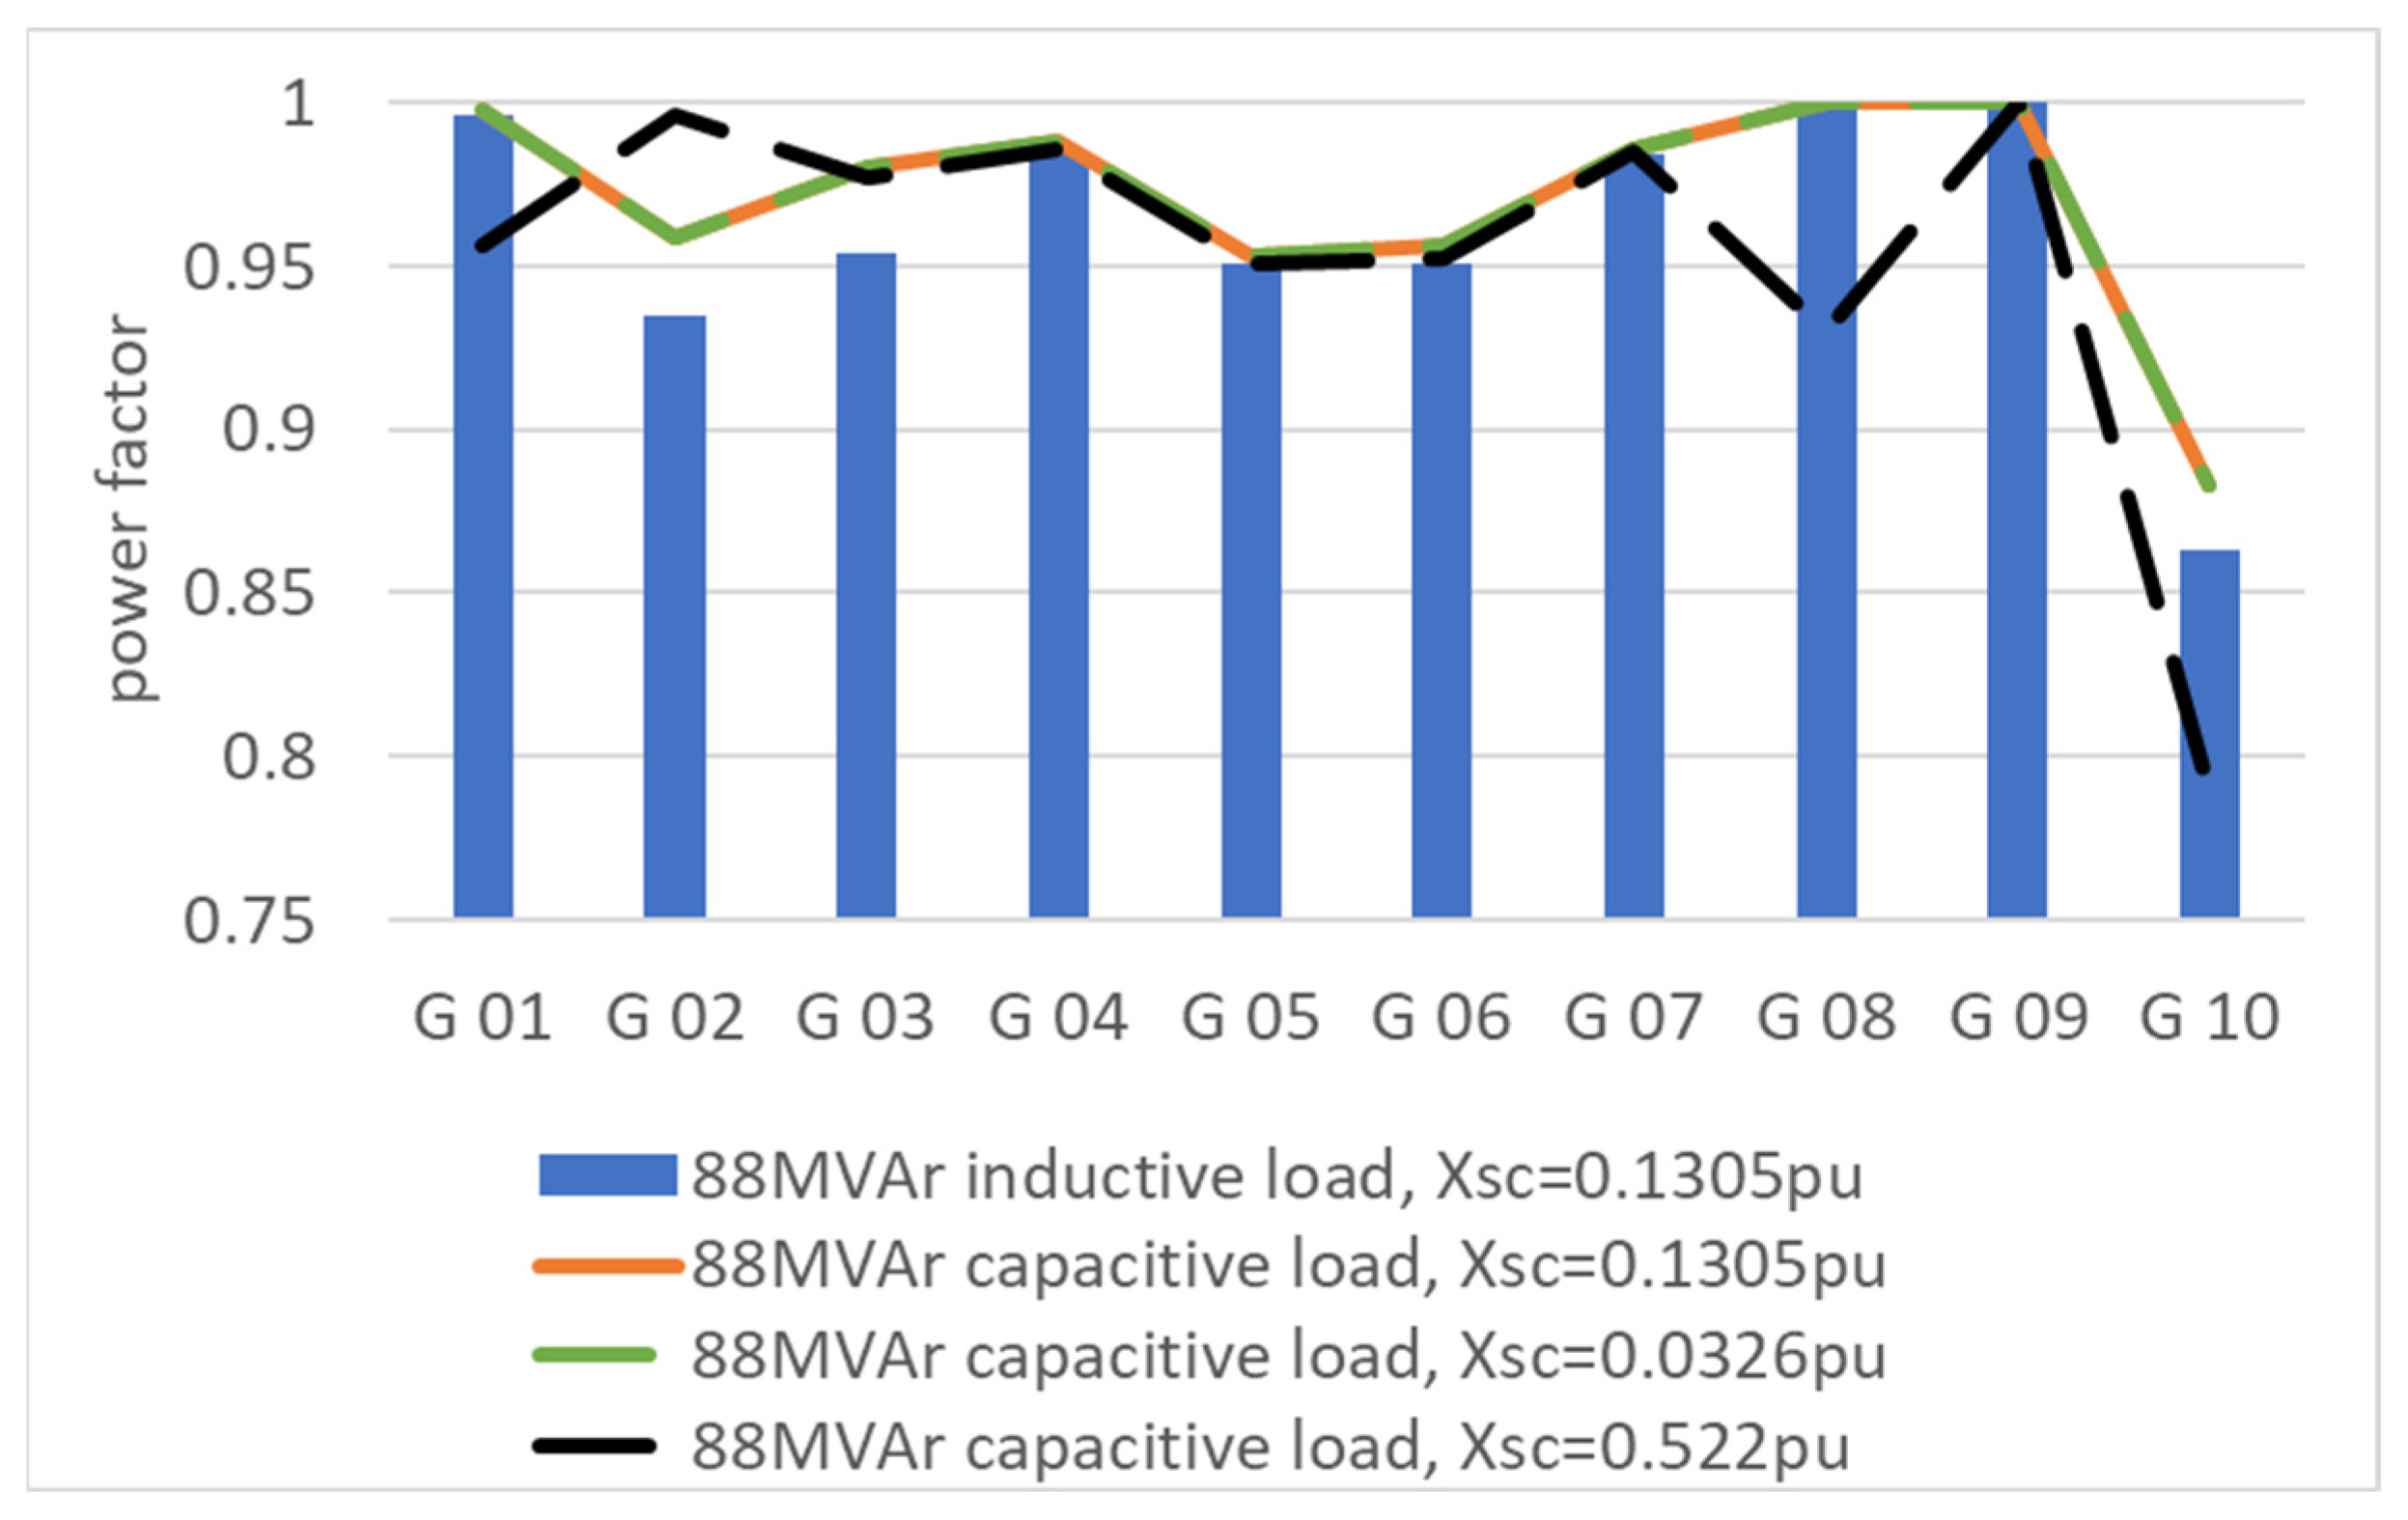
As shown in Figure 29, the leakage reactance changes in Trf 13-12 modify the power factor in several generators of the IEEE-39 node AC grid. Without changing the leakage reactance level of Trf 13-12, the change from an inductive to a capacitive nature in Load 12 increases the power factor level in all the generators so that they are bounded overall between 0.95 and 1, except for that of G10, which remains below 0.9.
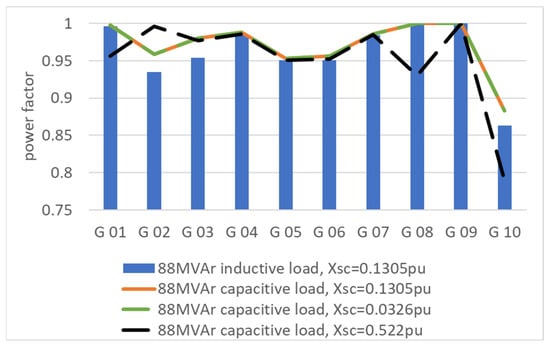
Figure 29.
Power factor of generators in the IEEE-39 node AC grid in response to changes in the leakage reactance in Trf 13-12.
When the leakage reactance level is decreased to 0.0326 p.u., the power factor level of G10 increases to 0.89 p.u., and in turn, when it is increased to 0.522 p.u., the power factor level of G10 decreases markedly to 0.8. With the last change, the power factor level of G08 also decreases below 0.95. In contrast, the increase to 0.522 p.u. enhances the power factor level of G02 to values close to 1.
Therefore, this analysis is consistent with the one performed in Section 6.1.1, and it validates the reduction of the leakage reactance level of the transformer whenever it is subjected to light-load capacitive conditions, as it improves not only the behavior of its own transformer buses but also improves the power factor of the closest generator. Furthermore, it also alleviates the over-voltage level in bus 12 due to the Ferranti effect and keeps it below the 1.05 p.u. level. However, the decrease in the leakage reactance level of Trf 13-12 does not help to mitigate other over-voltage levels in the grid, such as in the 25, 26, 35 and 36 buses, as they maintain their voltage level beyond 1.05 p.u. regardless of the leakage reactance change. The increase in the reactance level of Trf 13-12, on the contrary, increases the over-voltage level in bus 12 due to the Ferranti effect, but it reduces the over-voltage levels of buses 25 and 26 to below 1.05 p.u.
6.2.2. Impact of the VR Technique on a Step-Up Transformer under Light-Load Inductive Conditions
In Section 6.1.2, the impact of varying the leakage reactance of a step-up transformer under light-load inductive conditions was assessed for a simplified 2-bus system. Now a similar impact is studied in the case of the Trf 02-30 transformer in the IEEE 39-node grid presented in Figure 25, which joins buses 2 and 30 in the grid.
In this case, two reactance modification proposals are assessed from the base value of 0.181 p.u.: one lower, at 0.0362 p.u., and one larger, at 0.905 p.u. According to the analysis in Section 6.1.2, for light-load inductive conditions, the improvement in voltage profiles in the 2-bus system was achieved by increasing the leakage reactance of the involved transformer.
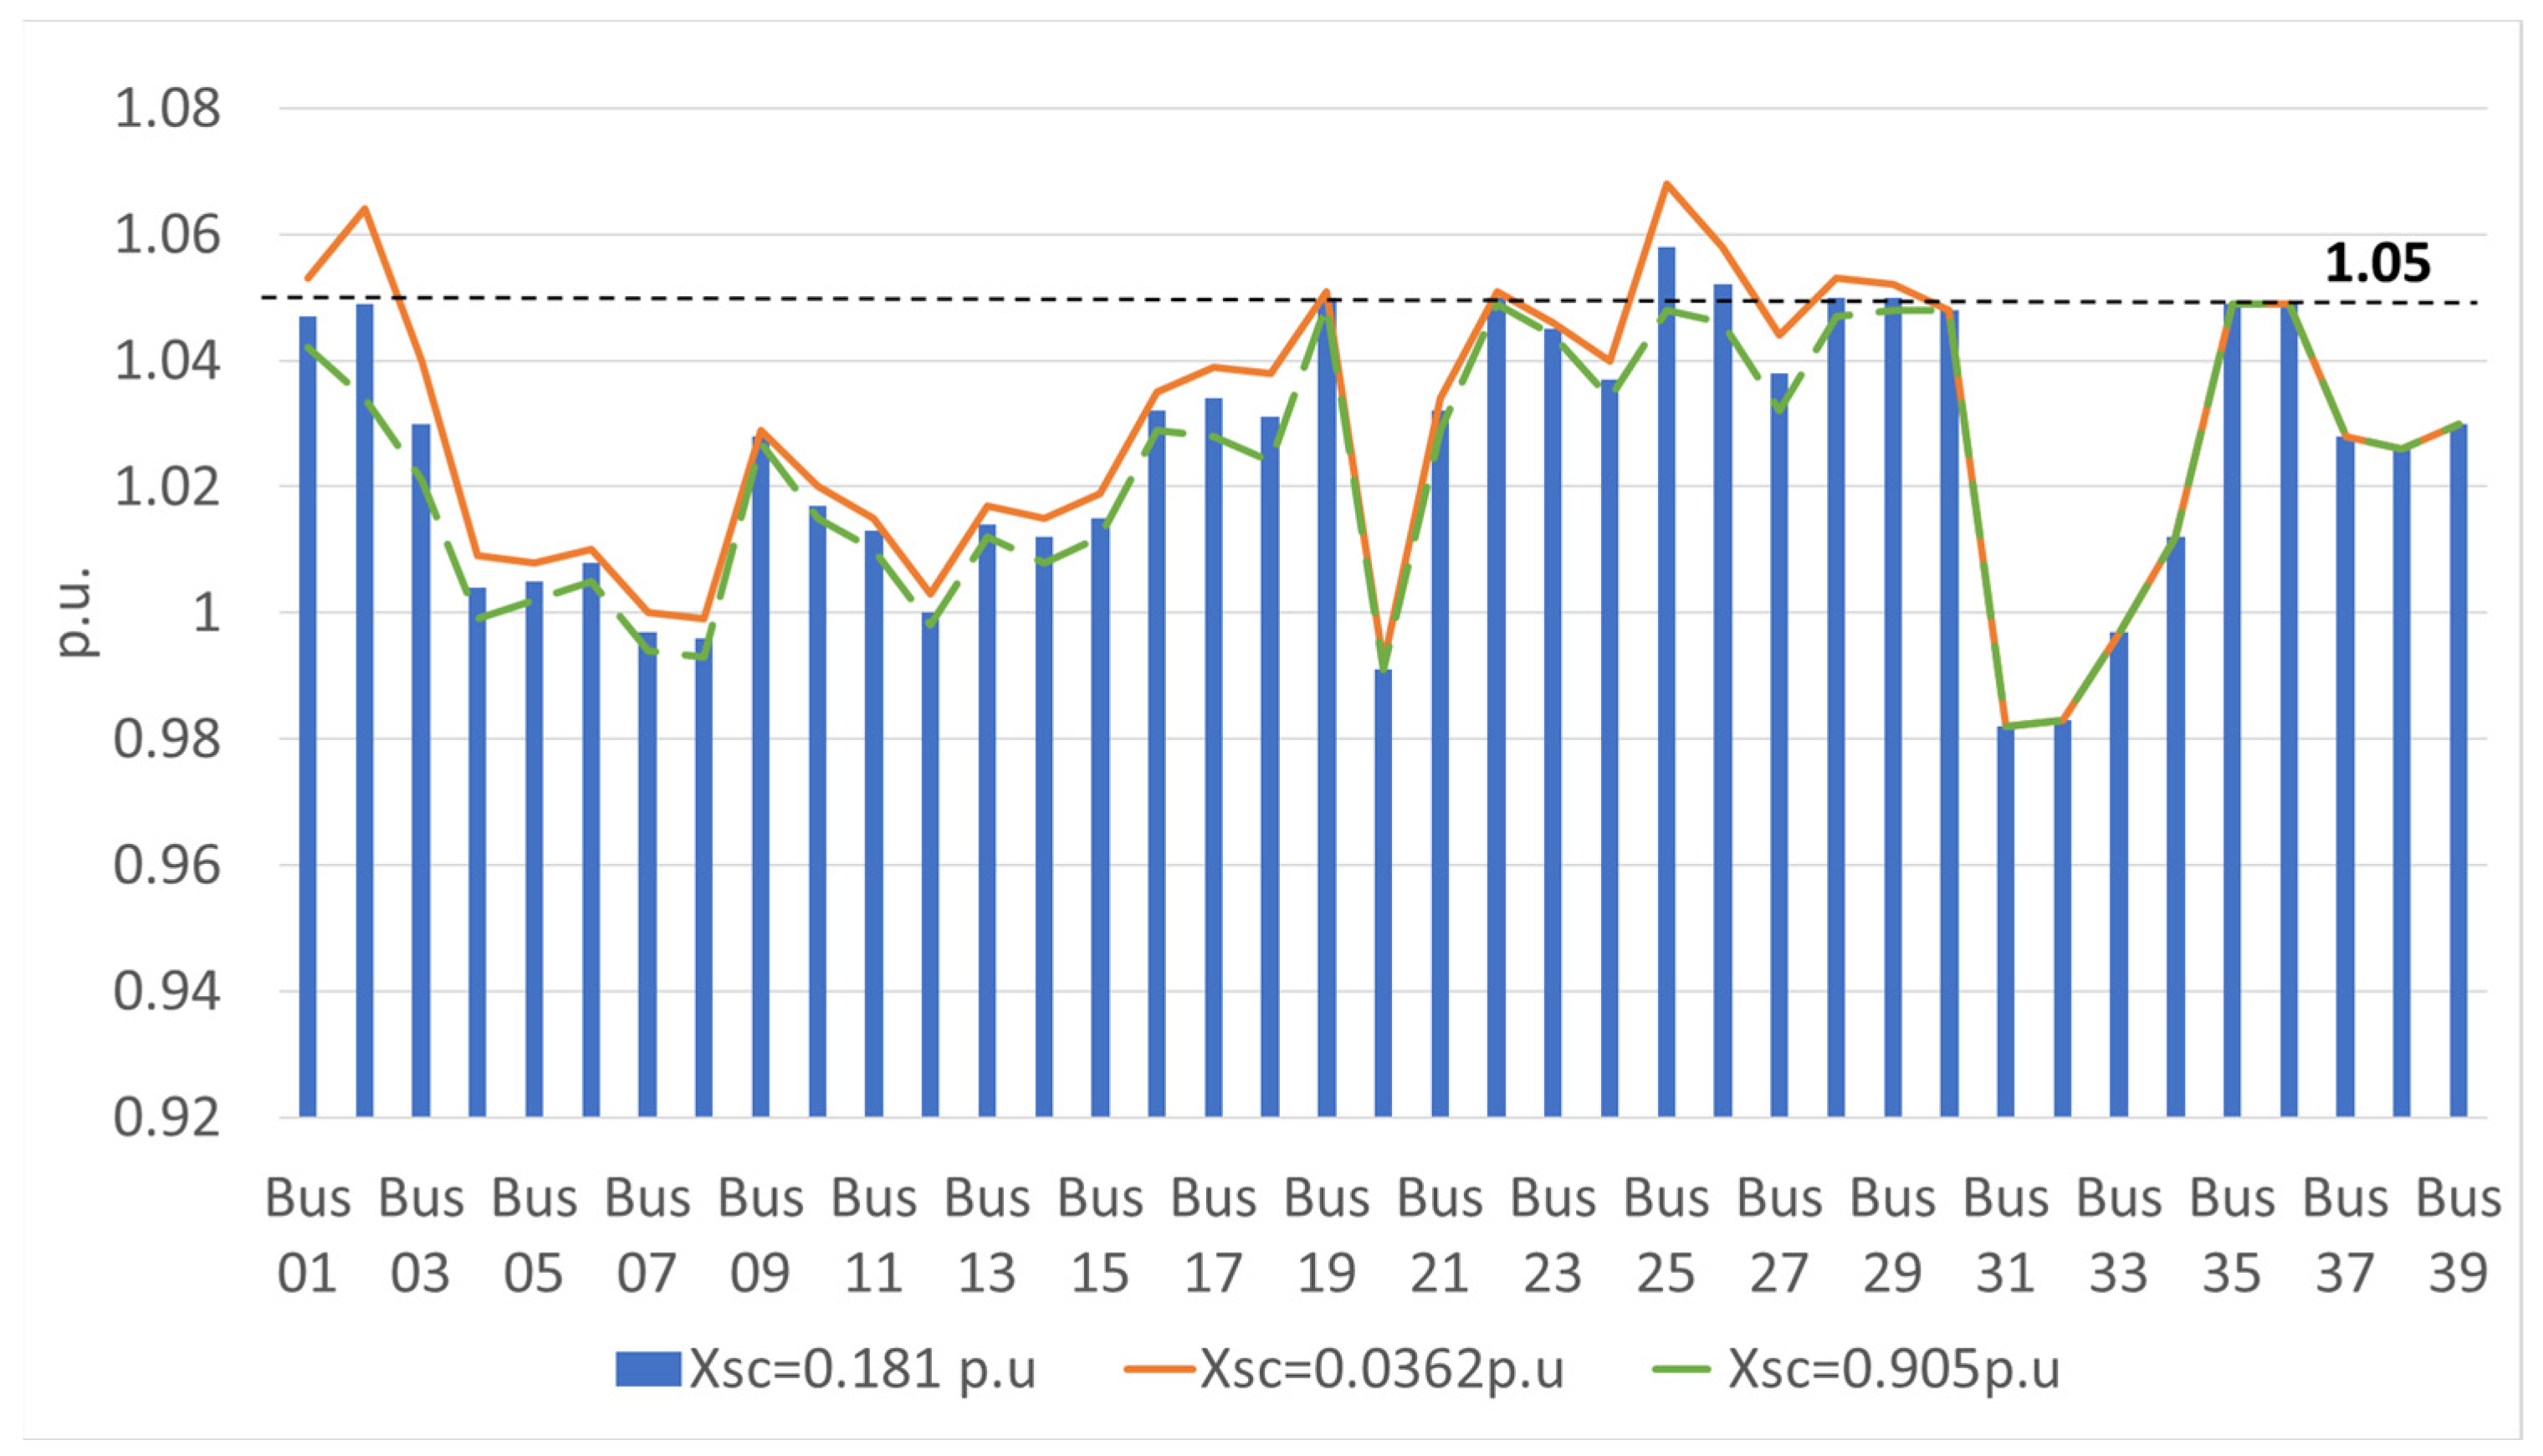
In Figure 30, the voltage profiles of nodes in the IEEE-39 node AC grid are shown for the previous three scenarios for the Trf 02-30 transformer. It can be seen that the 0.905 p.u. leakage reactance value improves the voltage profiles of the remaining buses, and especially of buses 01, 02, 25 and 26, which are the closest buses around Trf 02-30 and whose voltage levels equal or exceed the limit set at 1.05 p.u.
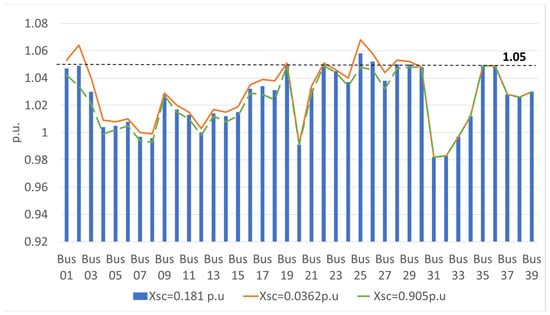
Figure 30.
Voltage profile of buses in the IEEE-39 node AC grid in response to changes in the leakage reactance in Trf 02-30.
In contrast, a lower leakage reactance value of 0.0362 p.u. for Trf 02-30 worsens the voltage profiles of the remaining buses, as the orange curve is boosted over the previous values, especially for buses 01, 02, 25 and 26, which exceed the 1.05 p.u. limit.
As for the effect on the line loading, the 0.905 p.u. leakage reactance value for Trf 02-30 marginally decreases the loading level of the AC lines in the model or keeps it constant, as shown in Figure 31.
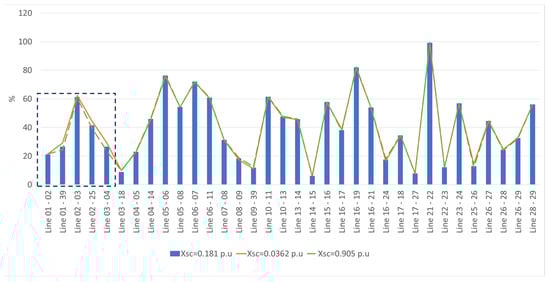
Figure 31.
Line-loading level (%) of AC lines in the IEEE-39 node AC grid in response to changes in the leakage reactance in Trf 02-30.
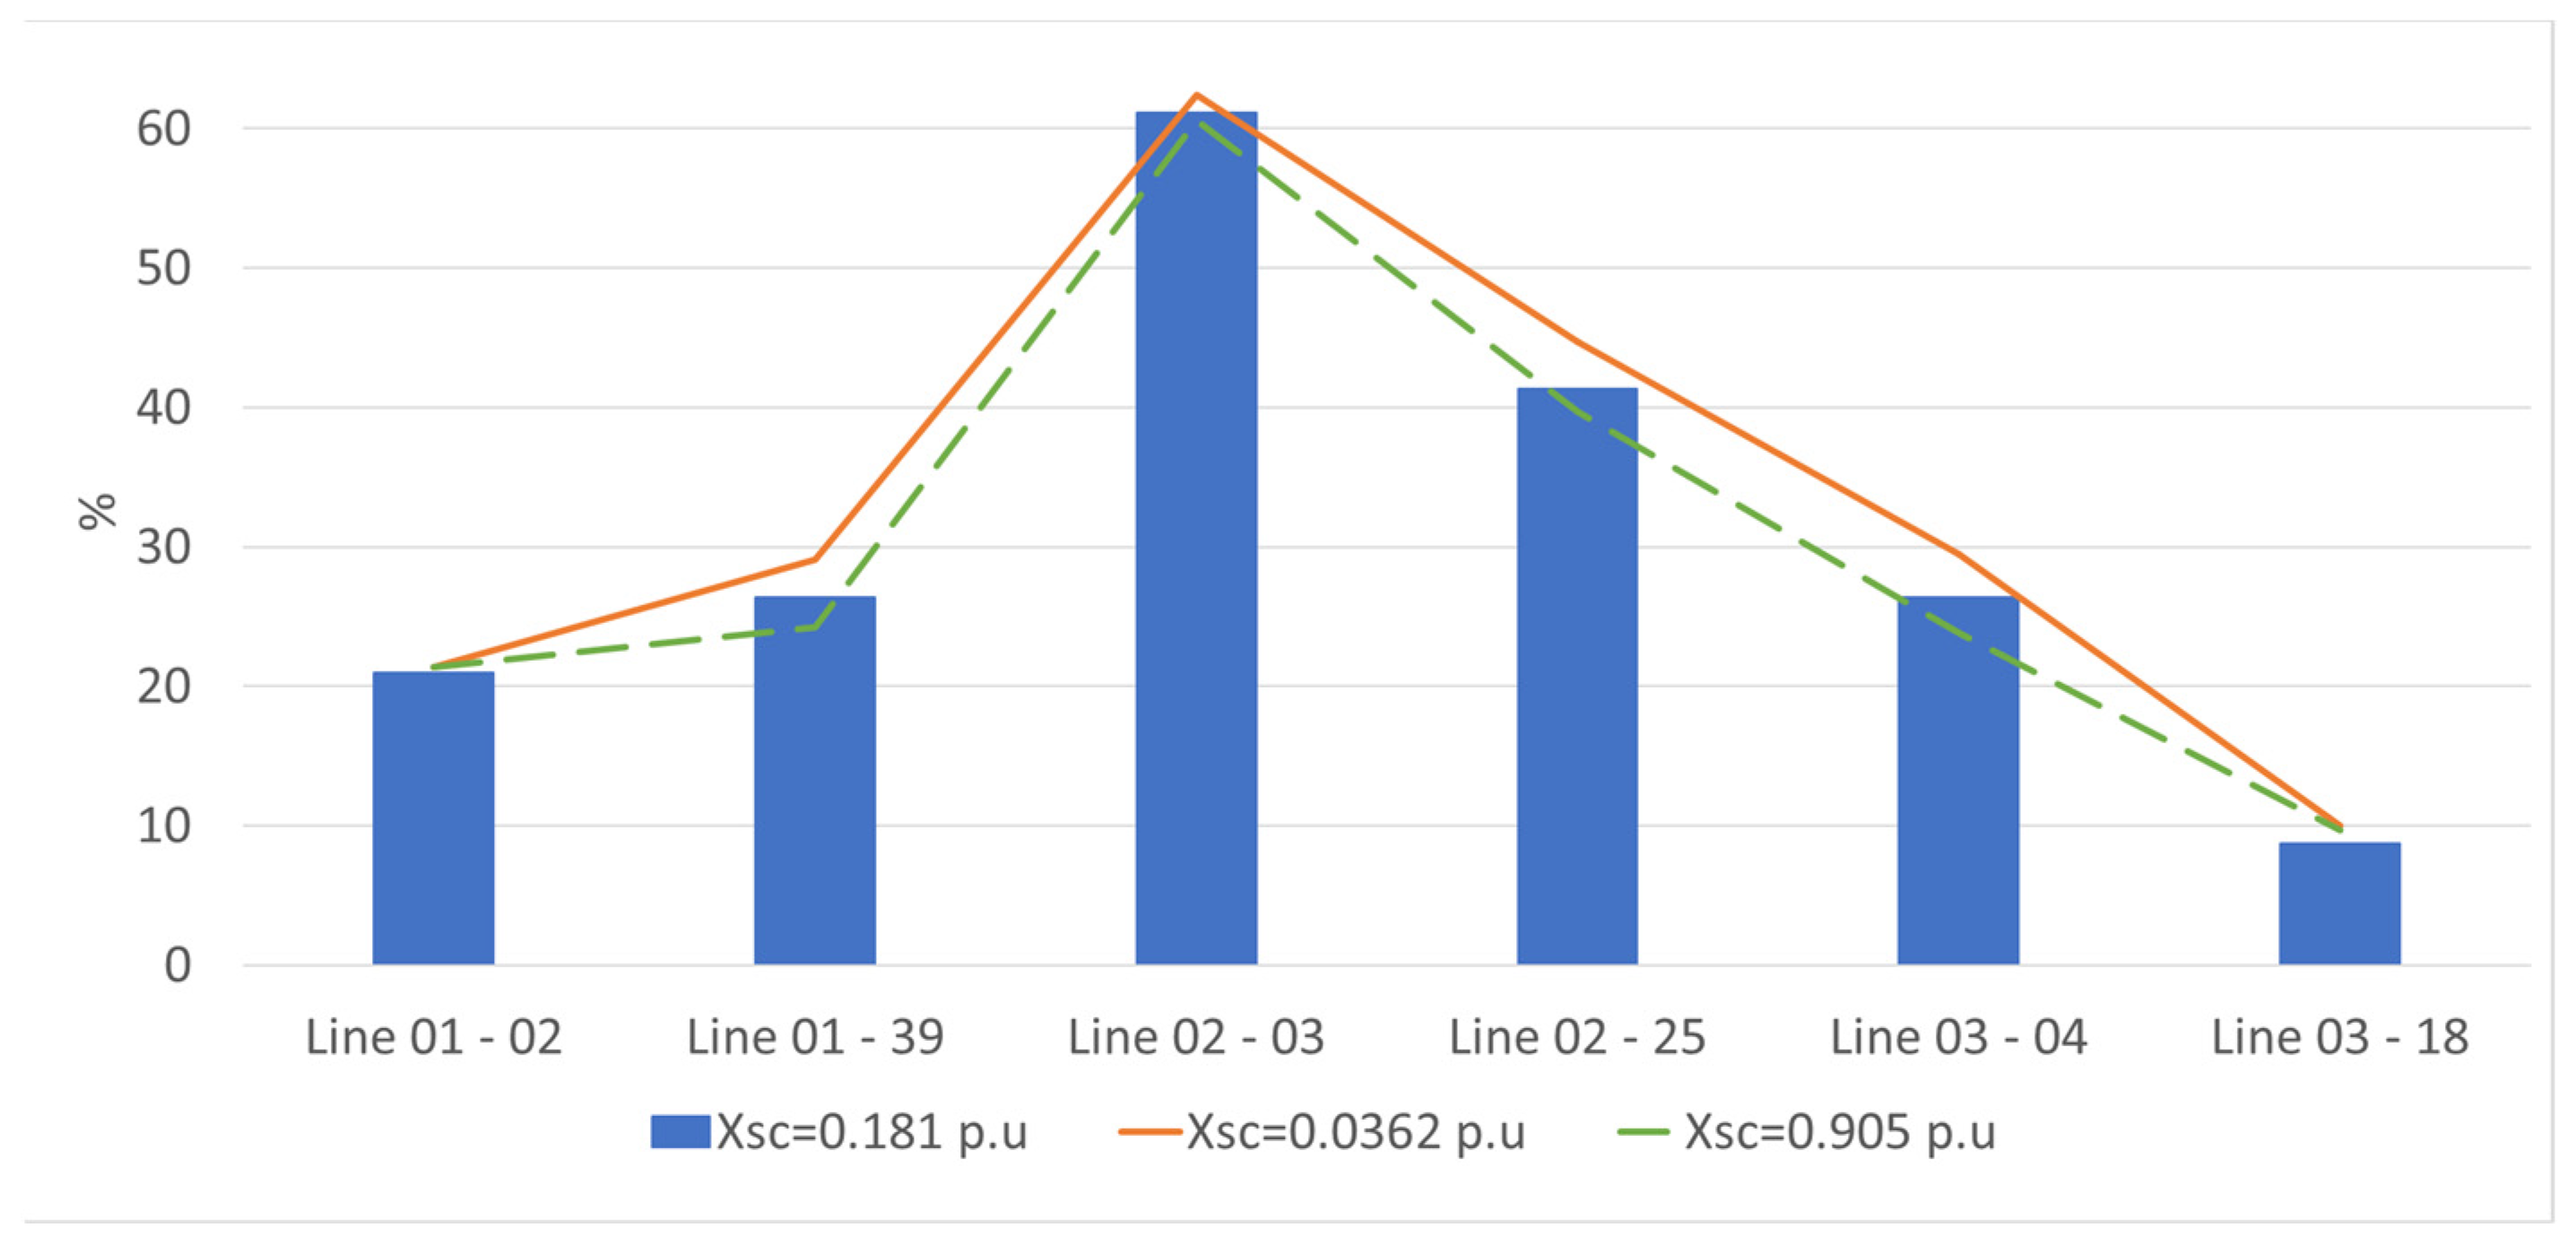
In Figure 32, a magnified view of Figure 31 is presented to show the lines most affected by this change. The AC lines that surround Trf 02-30 marginally decrease their loading level when the leakage reactance of Trf 02-30 is increased to 0.905 p.u. and marginally increase their loading level when the leakage reactance of Trf 02-30 is decreased to 0.0362 p.u.
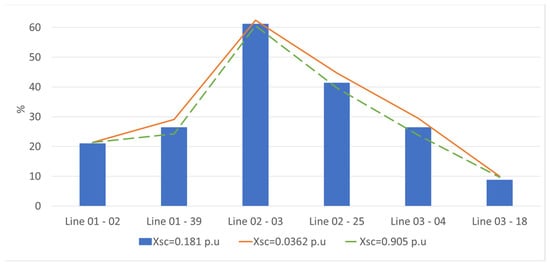
Figure 32.
Magnified view of Figure 31 for lines 01-02, 01-39, 02-03, 02-25, 03-04 and 03-18.
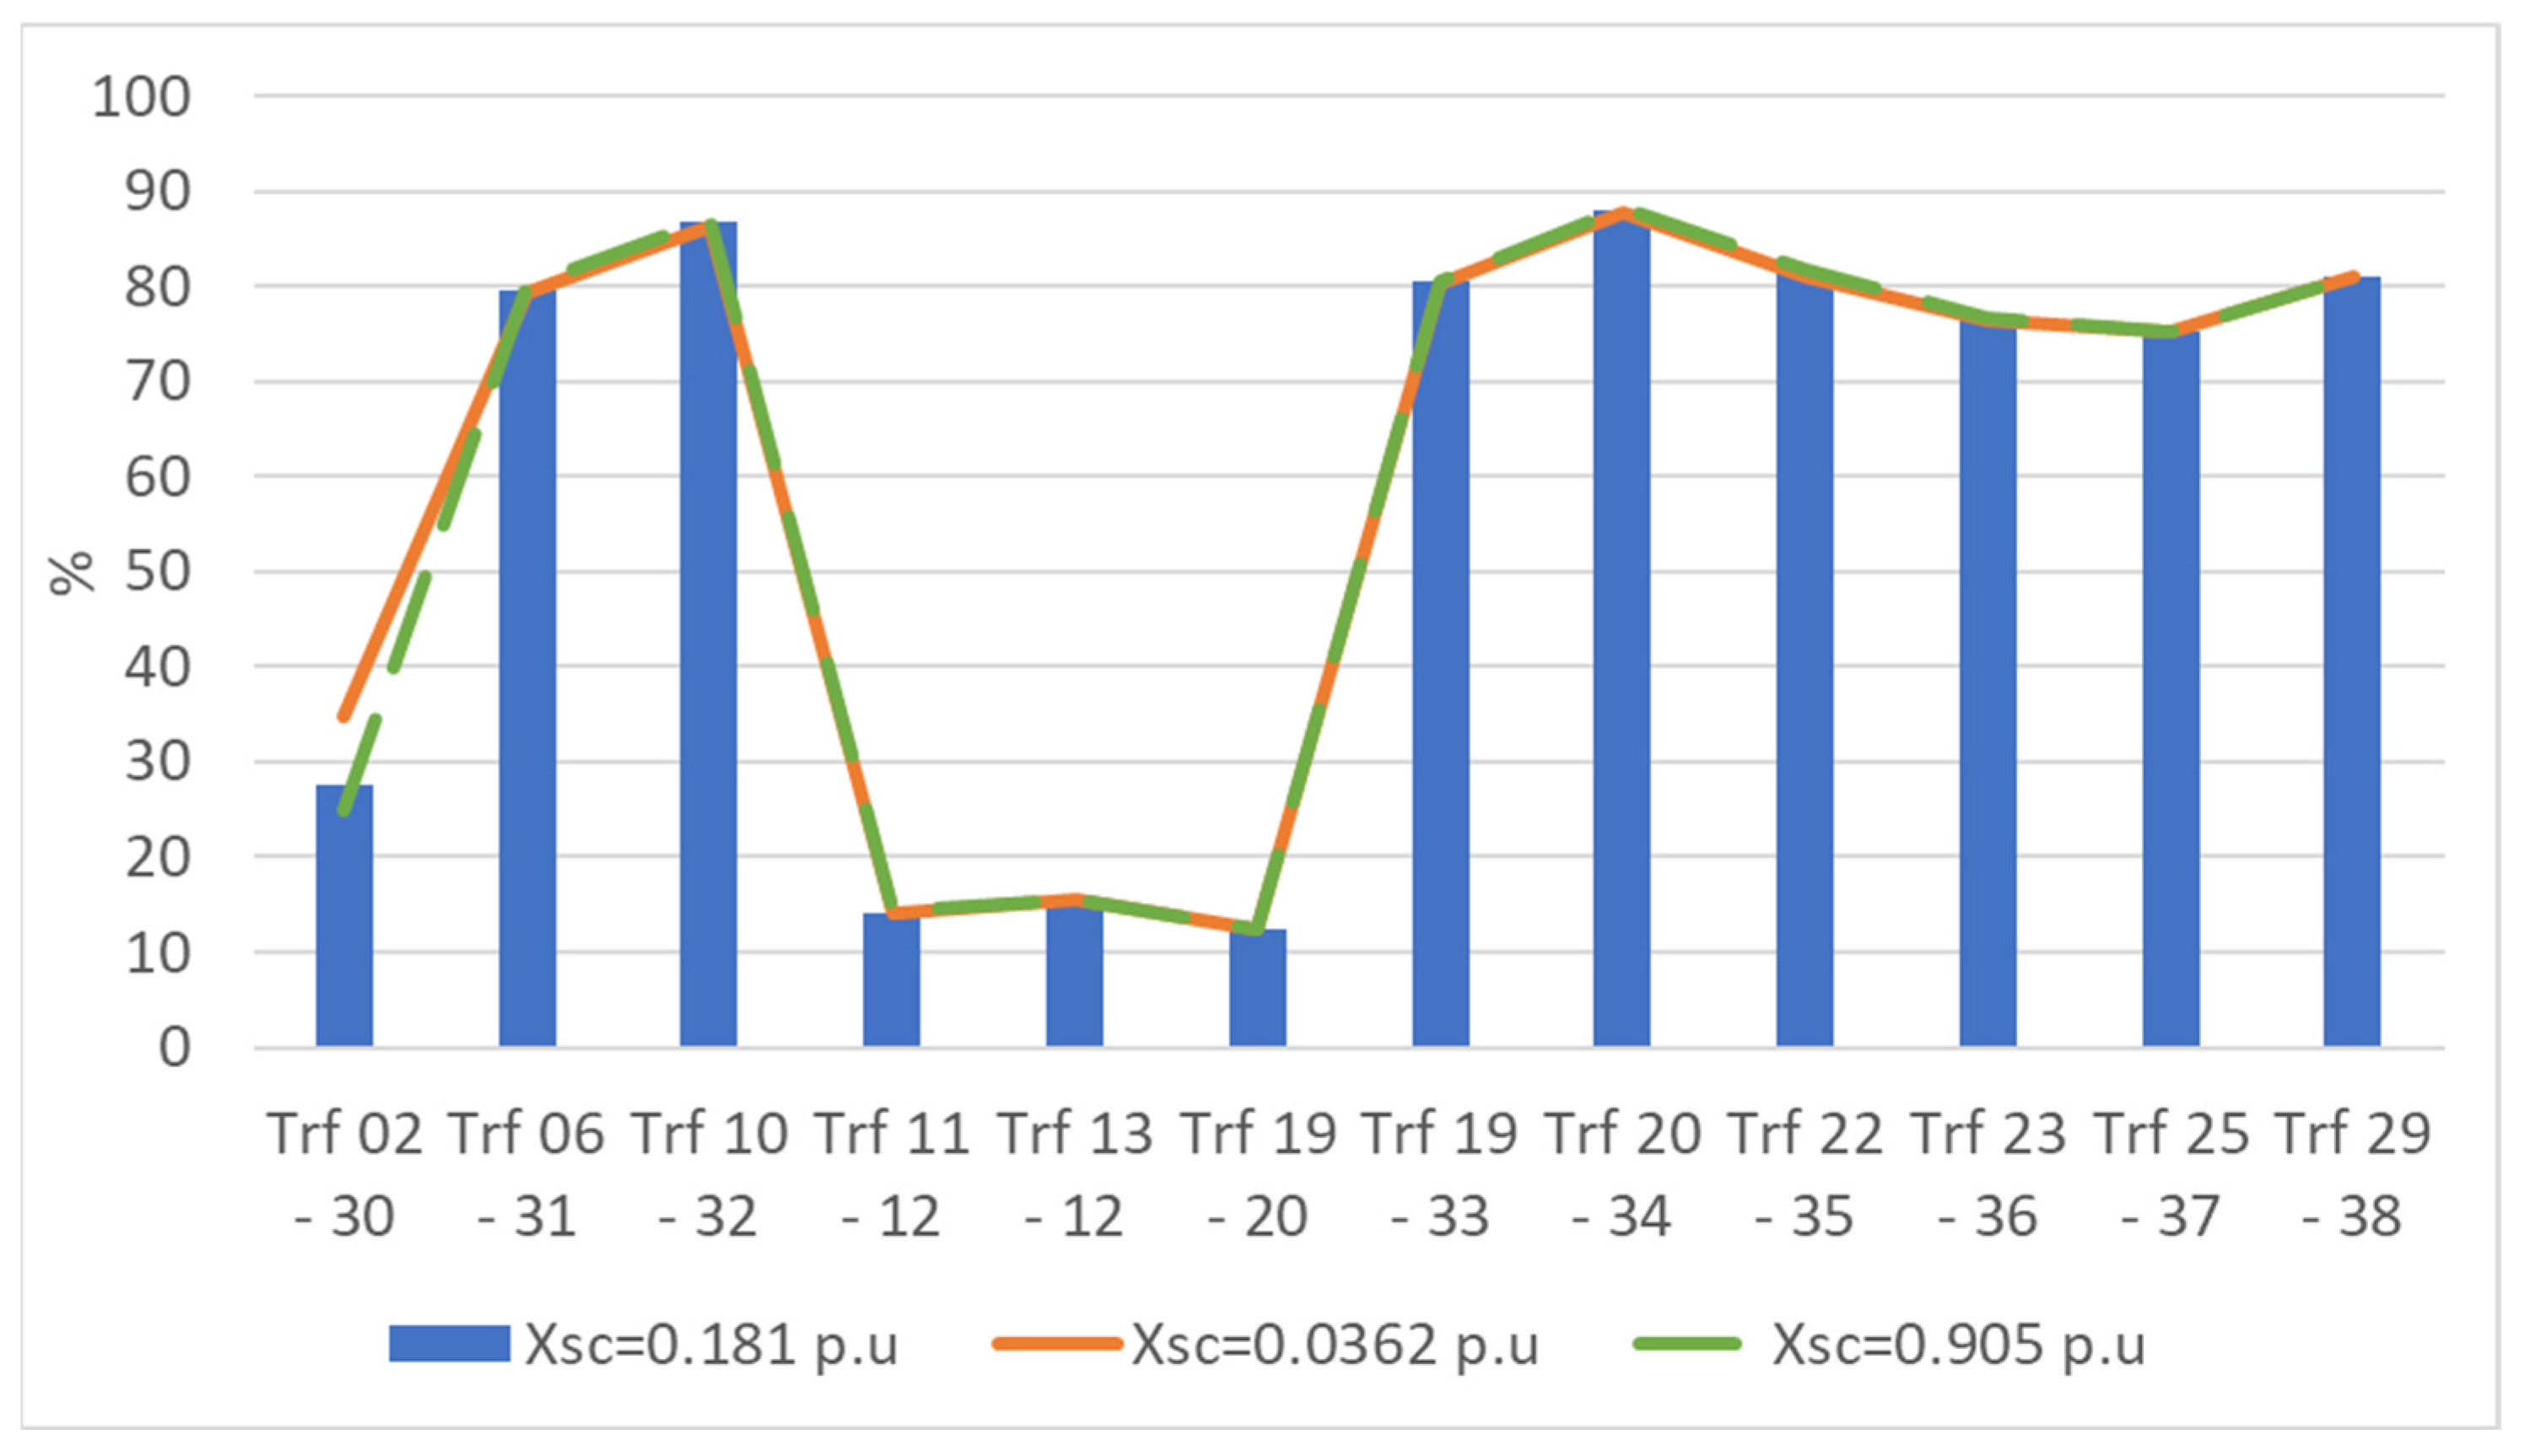
In Figure 33, the loading level of the transformers present in IEEE-39 node AC grid is shown for the different leakage reactance levels of Trf 02-30. As can be seen, the other transformers are not affected by such changes. However, Trf 02-30 marginally decreases its load level to 24.8% from 27.6% when its leakage reactance is increased to 0.905 p.u. from 0.181 p.u. However, its loading level is marginally increased from 26.6% to 34.7% when its leakage reactance is decreased from 0.181 p.u. to 0.0362 p.u.

Figure 33.
Transformer loading level (%) of transformers in the IEEE-39 node AC grid in response to changes in the leakage reactance in Trf 02-30.
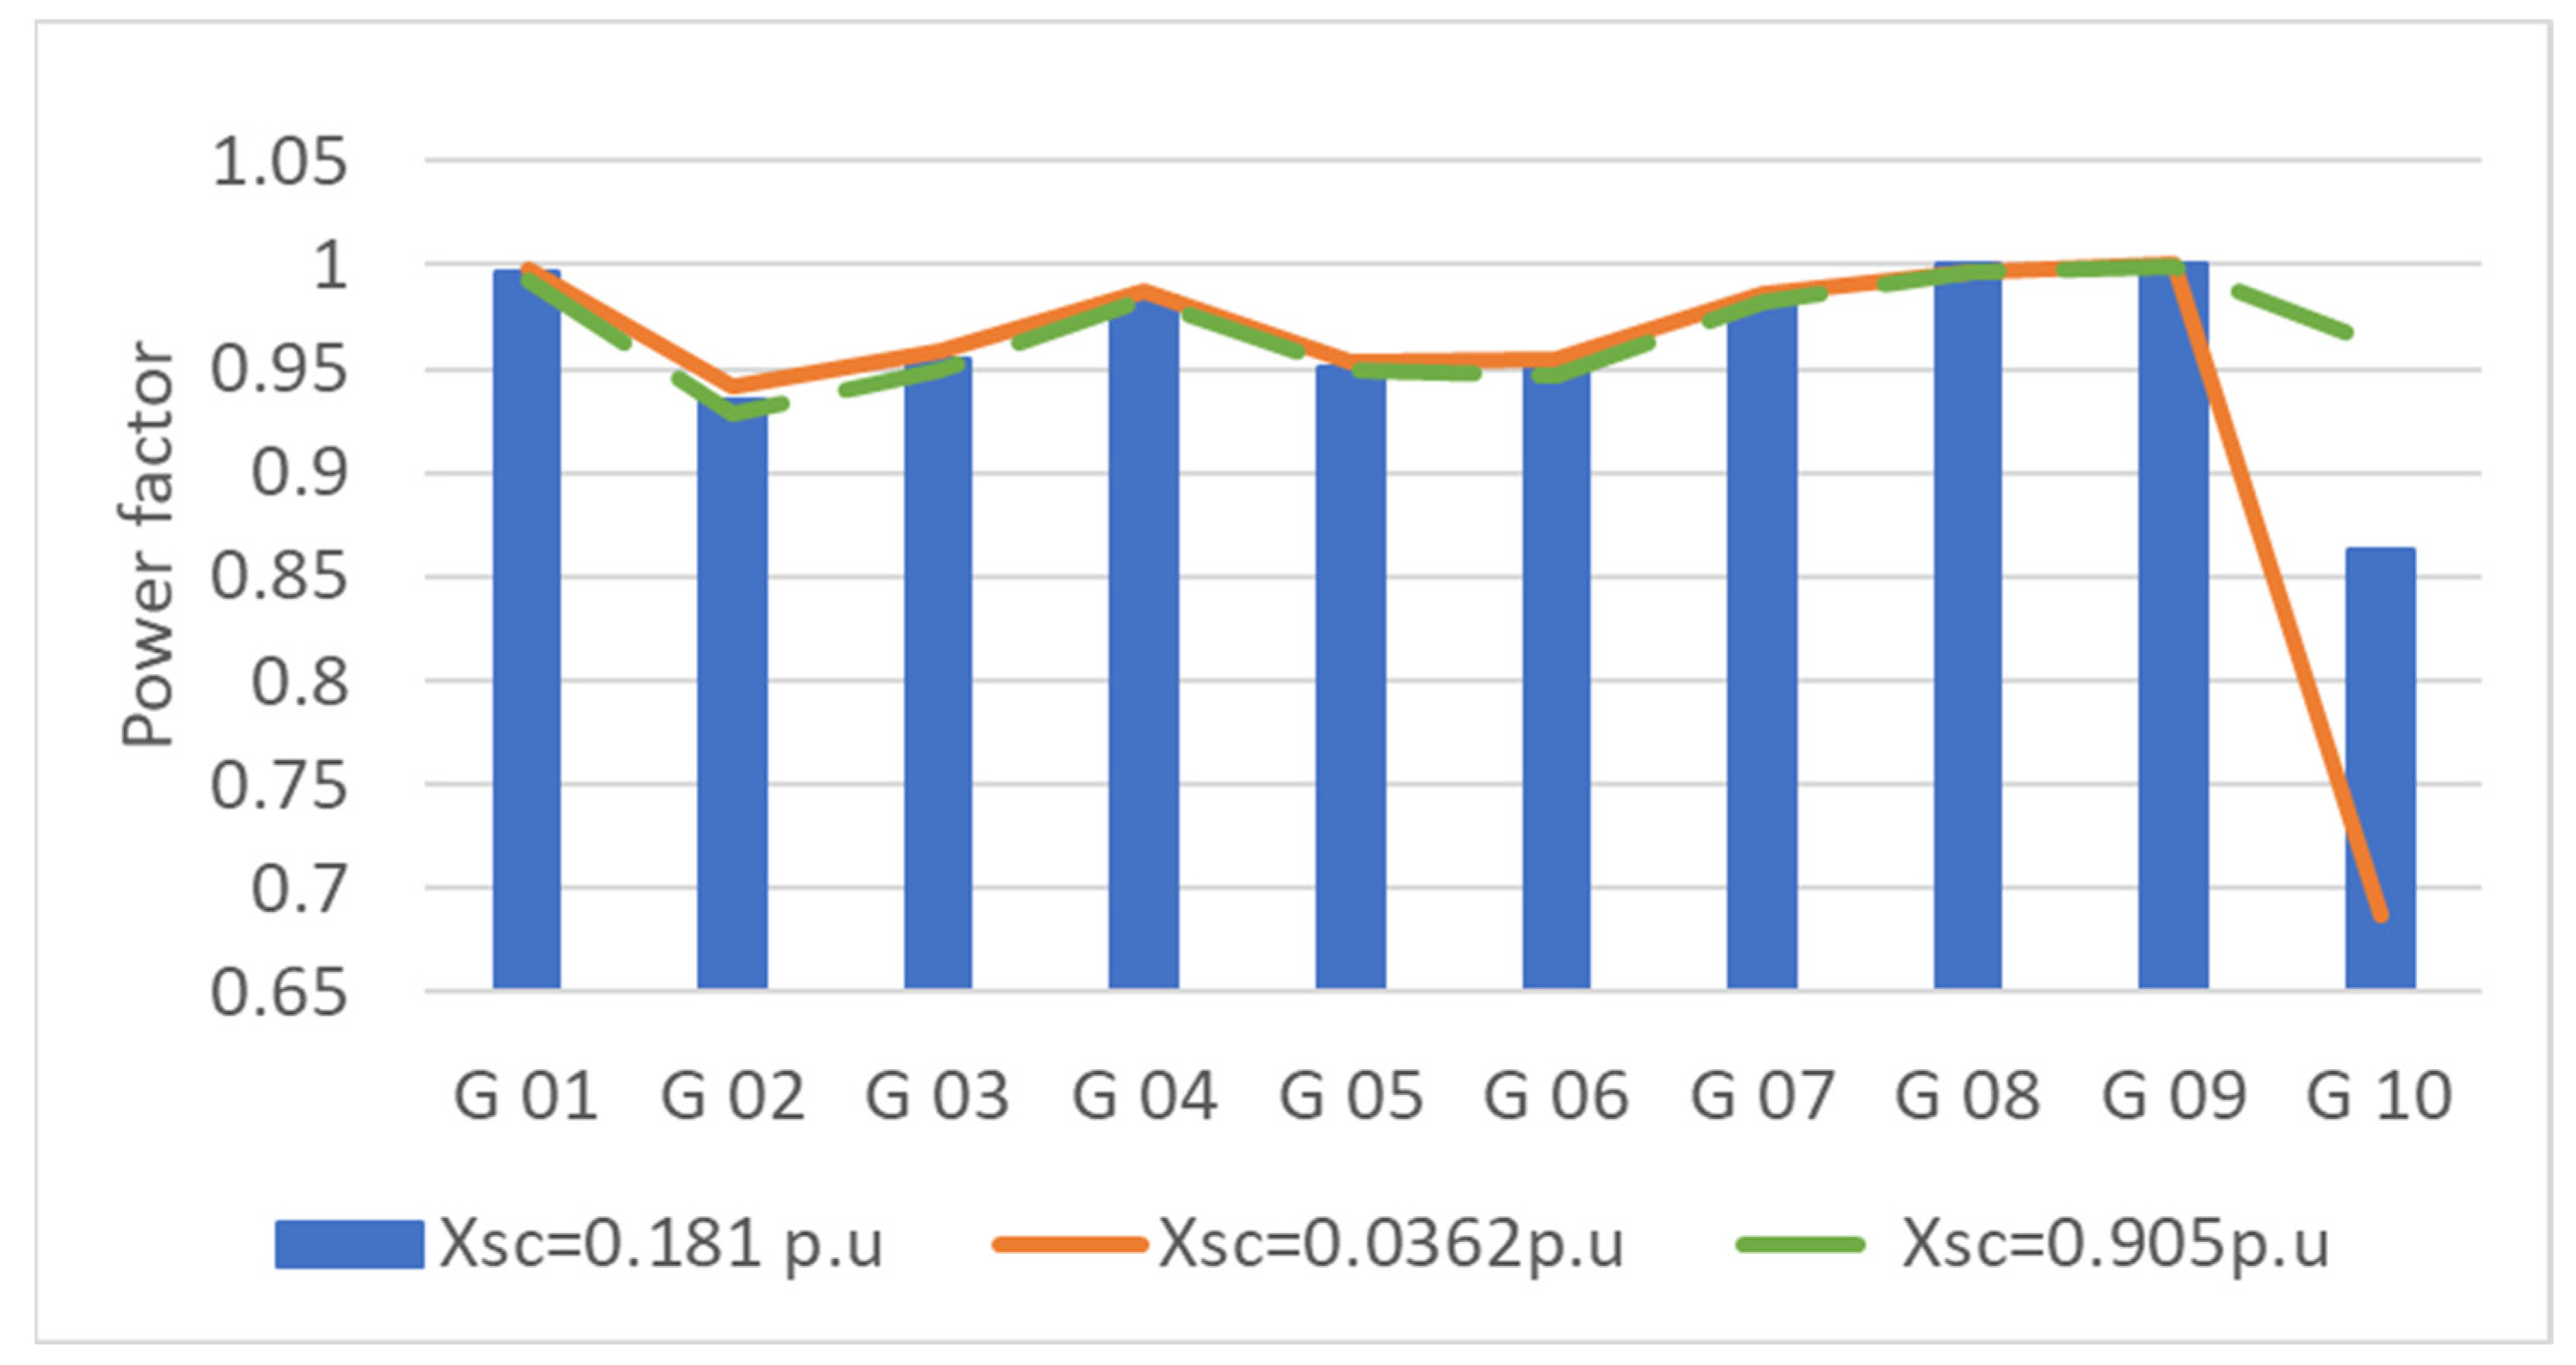
In Figure 34, the power factor levels of generators in the IEEE-39 node AC grid are shown for the changes in the leakage reactance level of Trf 02-30. In this case, the increase of leakage reactance from 0.181 to 0.905 p.u. causes small reductions in the power factor level of G02 to below 0.95; in contrast, it achieves a great increase in the power factor level of G10, from 0.87 to 0.96. In turn, the decrease in leakage reactance from 0.181 to 0.0362 p.u. causes small increments in the power factor level of G02 to beyond 0.95, but, in contrast, it achieves a great decrease in the power factor level of G10, from 0.87 to 0.69.
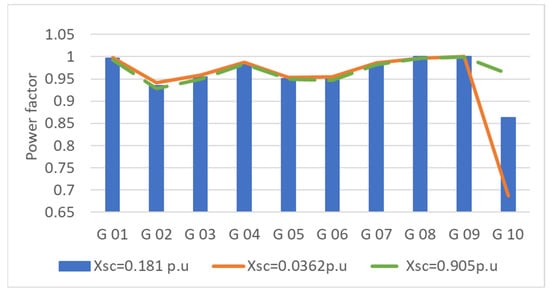
Figure 34.
Power factor of generators in the IEEE-39 node AC grid in response to changes in the leakage reactance in Trf 02-30.
Therefore, this analysis is consistent with the one performed in Section 6.1.2, as it validates the increment in the leakage reactance level of the transformer whenever it is subjected to light-load inductive conditions. In addition, it improves not only the behavior of its own transformer buses but also enhances, albeit marginally, the overall voltage profile of the nodes and the line-loading level of the surrounding buses and lines, respectively. Furthermore, it increases the power factor of the closest generator.
However, a decrease in the leakage reactance level provokes the contrary effect, as it worsens not only the behavior of the transformer’s own buses but also the overall voltage profile of the nodes and line loading level of surrounding buses and lines, respectively, albeit marginally. In addition, it largely deteriorates the power factor of the closest generator.
6.2.3. Impact of the VR Technique on Two Transformers Working in Parallel under Over-Load Conditions
In Section 6.1.3, the impact of varying the leakage reactance of step-up transformers working in parallel under over-load inductive conditions was assessed for a simplified 2-bus system. Now, a similar impact is studied for the case of transformers Trf 11-12 and Trf 13-12 in the IEEE 39-node grid presented in Figure 25. It is important to note that these two transformers are not actually working strictly in parallel, although they share the bus at their secondary sides, bus 12, where Load 12 is connected. Instead, the buses at the primary ends of both transformers are two independent buses, buses 11 and 13, which are rated at the same voltage level of 345 kV. However, it is interesting to analyze how the change in the leakage reactance level of 1 transformer alleviates the loading level to below 100% by alternating the over-load condition among transformers or even by canceling the over-load condition for each transformer.
Therefore, according to the analysis in Section 6.1.3, an over-load condition is obtained in the IEEE-39 node AC grid by increasing the active power consumed by Load 12 from 7.5 to 750 MW and by reducing the consumed active power of Load 8 from 522 to 52 MW. In such conditions, an overload situation can be simulated for Trf 11-12 and Trf 13-12 with minimal alterations in the other buses. In Figure 35, the loading levels of all transformers in the IEEE-39 node AC grid are shown; except for Trf 02-30 and Trf 19-30, all of them are loaded by more than 60% for all simulated leakage reactance cases of Trf 11-12 and Trf 13-12.
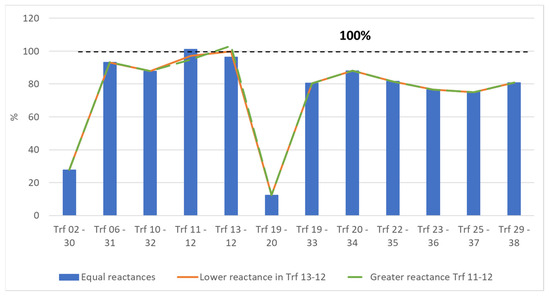
Figure 35.
Transformer loading level (%) of transformers in the IEEE-39 node AC grid in response to changes in the leakage reactance level in Trf 13-12 and Trf 11-12.
Trf 11-12 becomes overloaded beyond 100% when the leakage reactance levels of Trf 11-12 and Trf 13-12 are equal. This can be avoided by either decreasing the leakage reactance level of Trf 13-12 or by increasing the leakage reactance level of Trf 11-12. In the first case, both Trf 11-12 and Trf 13-12 becomes loaded below 100%, and in the second case, Trf 11-12 becomes loaded below 100% at the cost of overloading Trf 13-12.
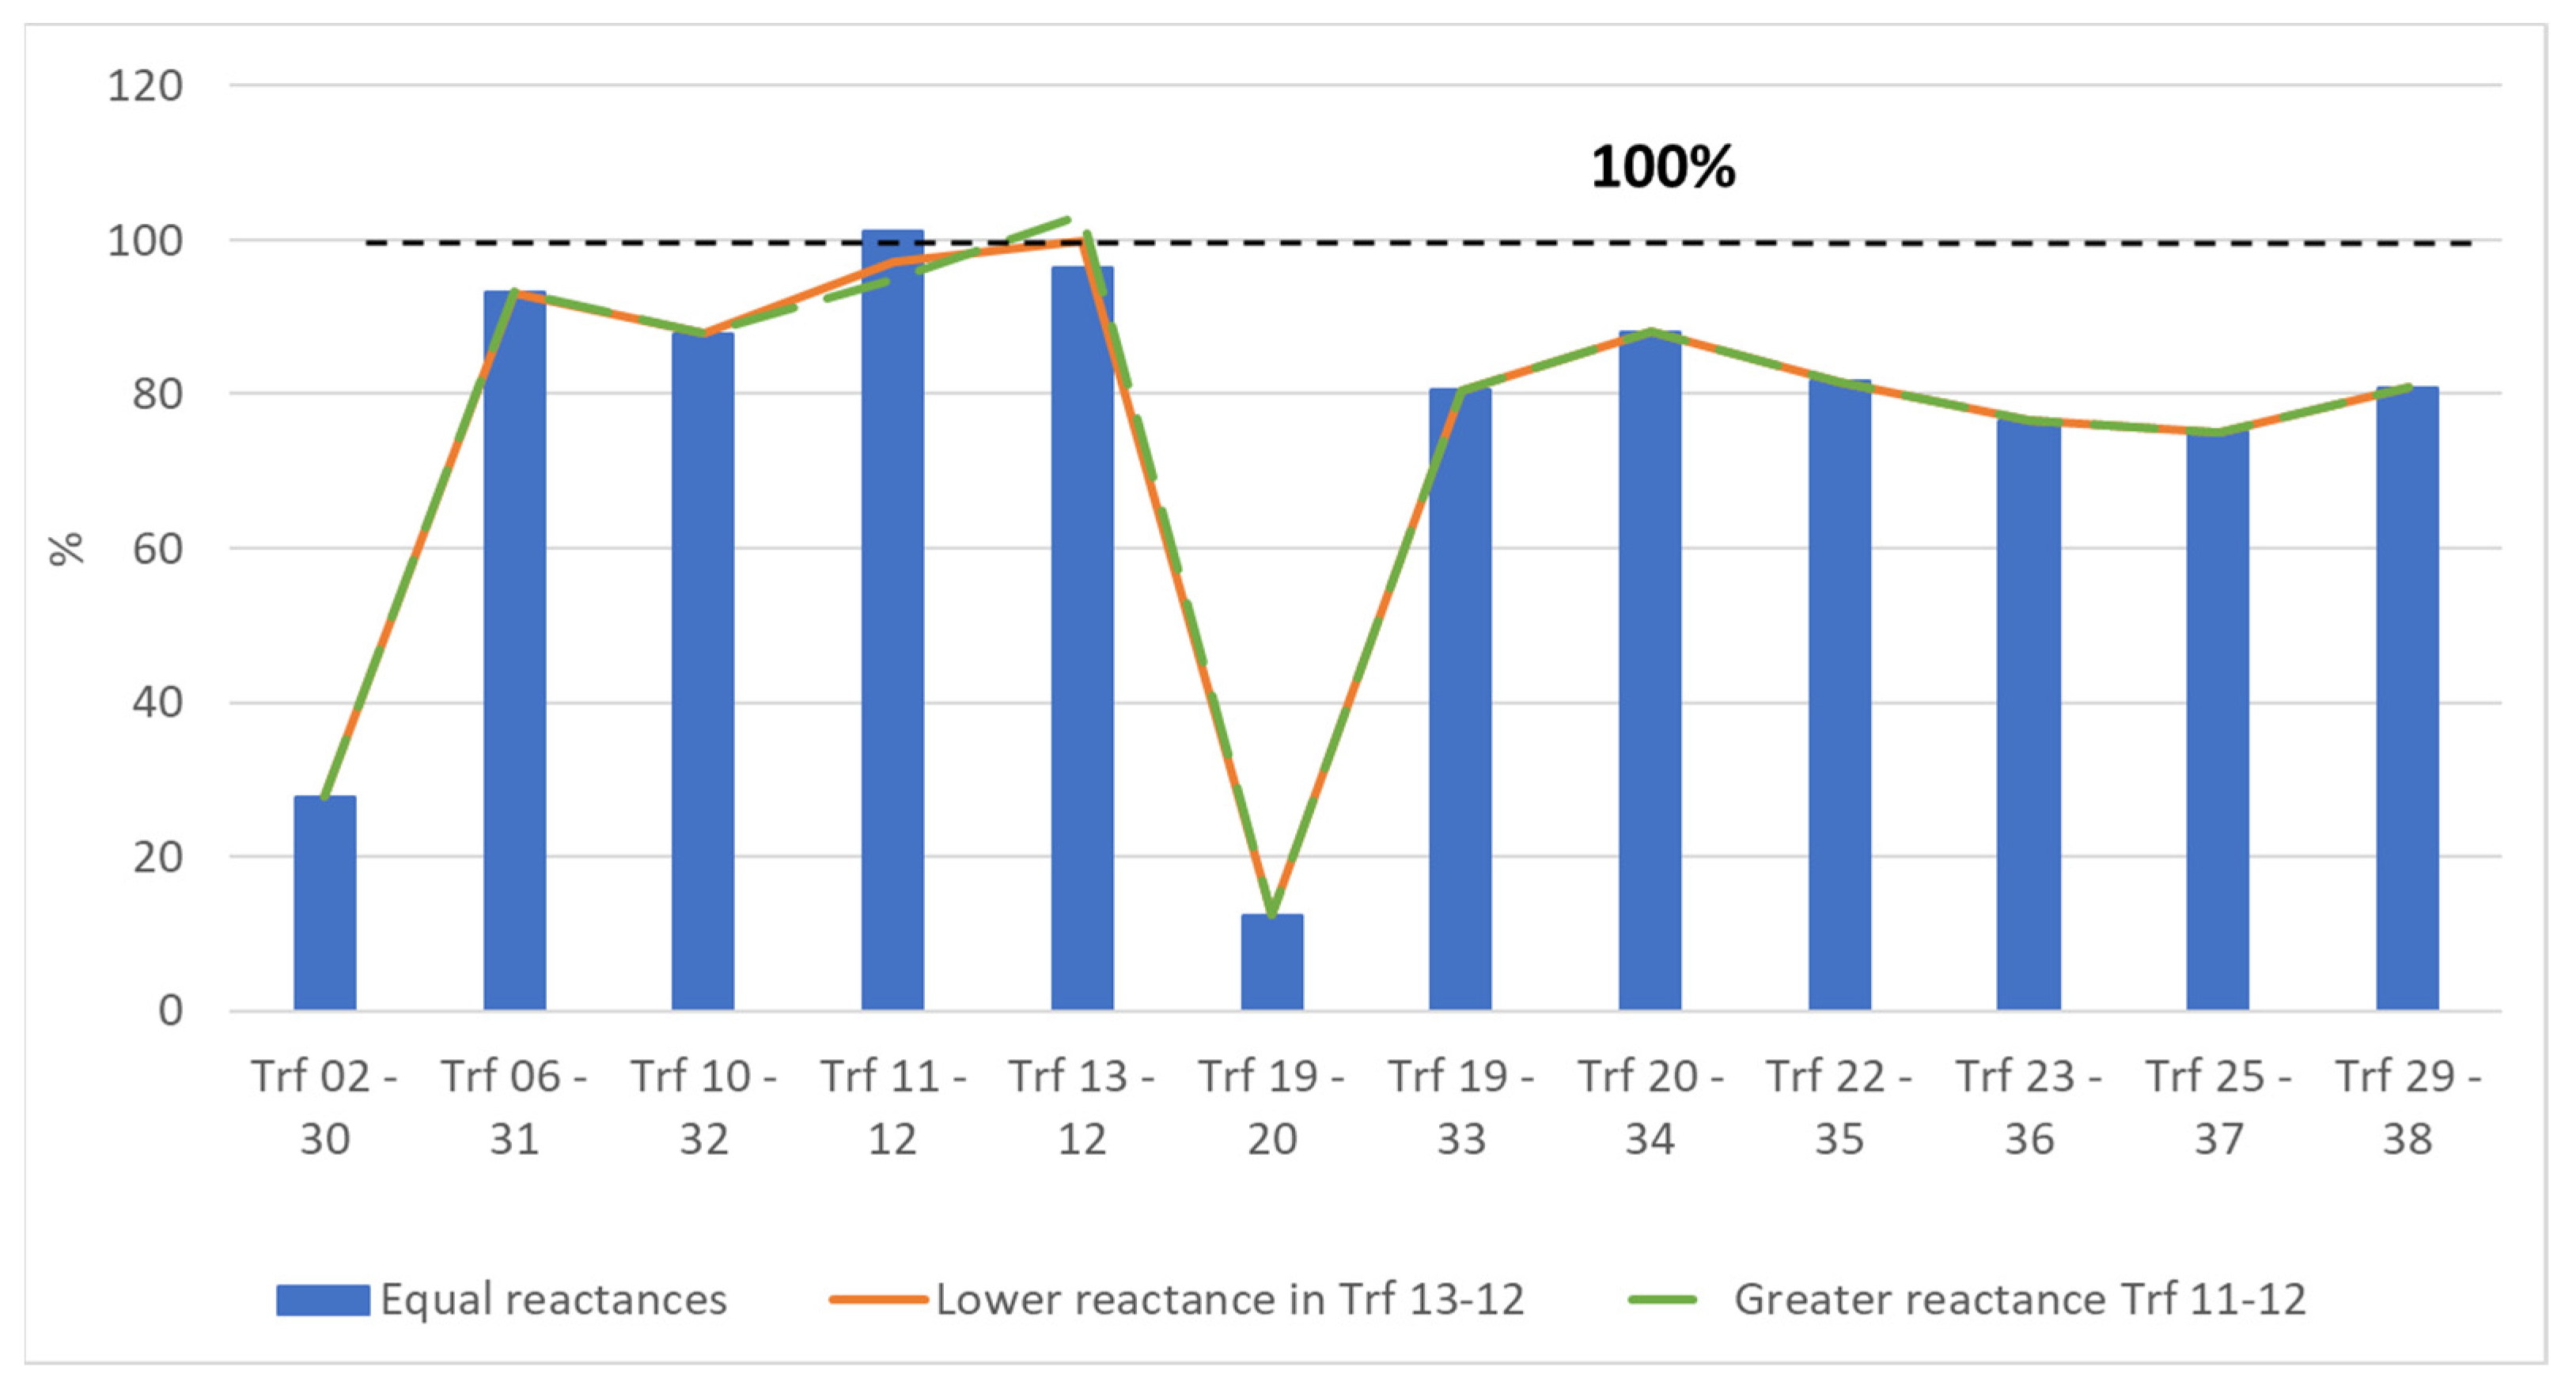
In Figure 36, the loading levels of the target transformers of this case study are shown at a magnified view for the sake of clarity. With equal leakage reactance levels of 0.1305 p.u., Trf 11-12 presents an overload level of 1%, while Trf 13-12 is loaded at 96.2%.
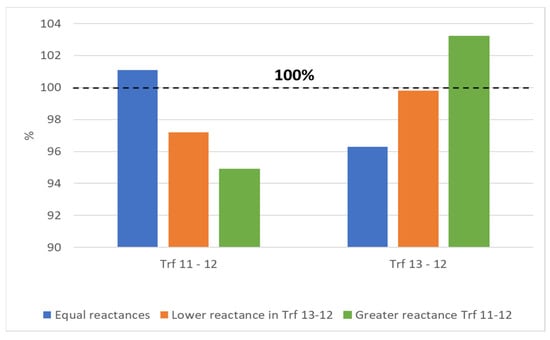
Figure 36.
Magnified view of Figure 35.
With a lower leakage reactance level in Trf 13-12 of 0.12 p.u., Trf 11-12 reduces its loading level to 97.2%, while Trf 13-12 increases its loading level to 99.2%. In this situation, no transformer is overloaded.
However, the underloading of Trf 11-12 can also be obtained by increasing its leakage reactance level, f.i., to 0.15 p.u. In this case, the loading level of Trf 11-12 is reduced to 94.8% at the cost of overloading Trf 13-12 to 3.2%.
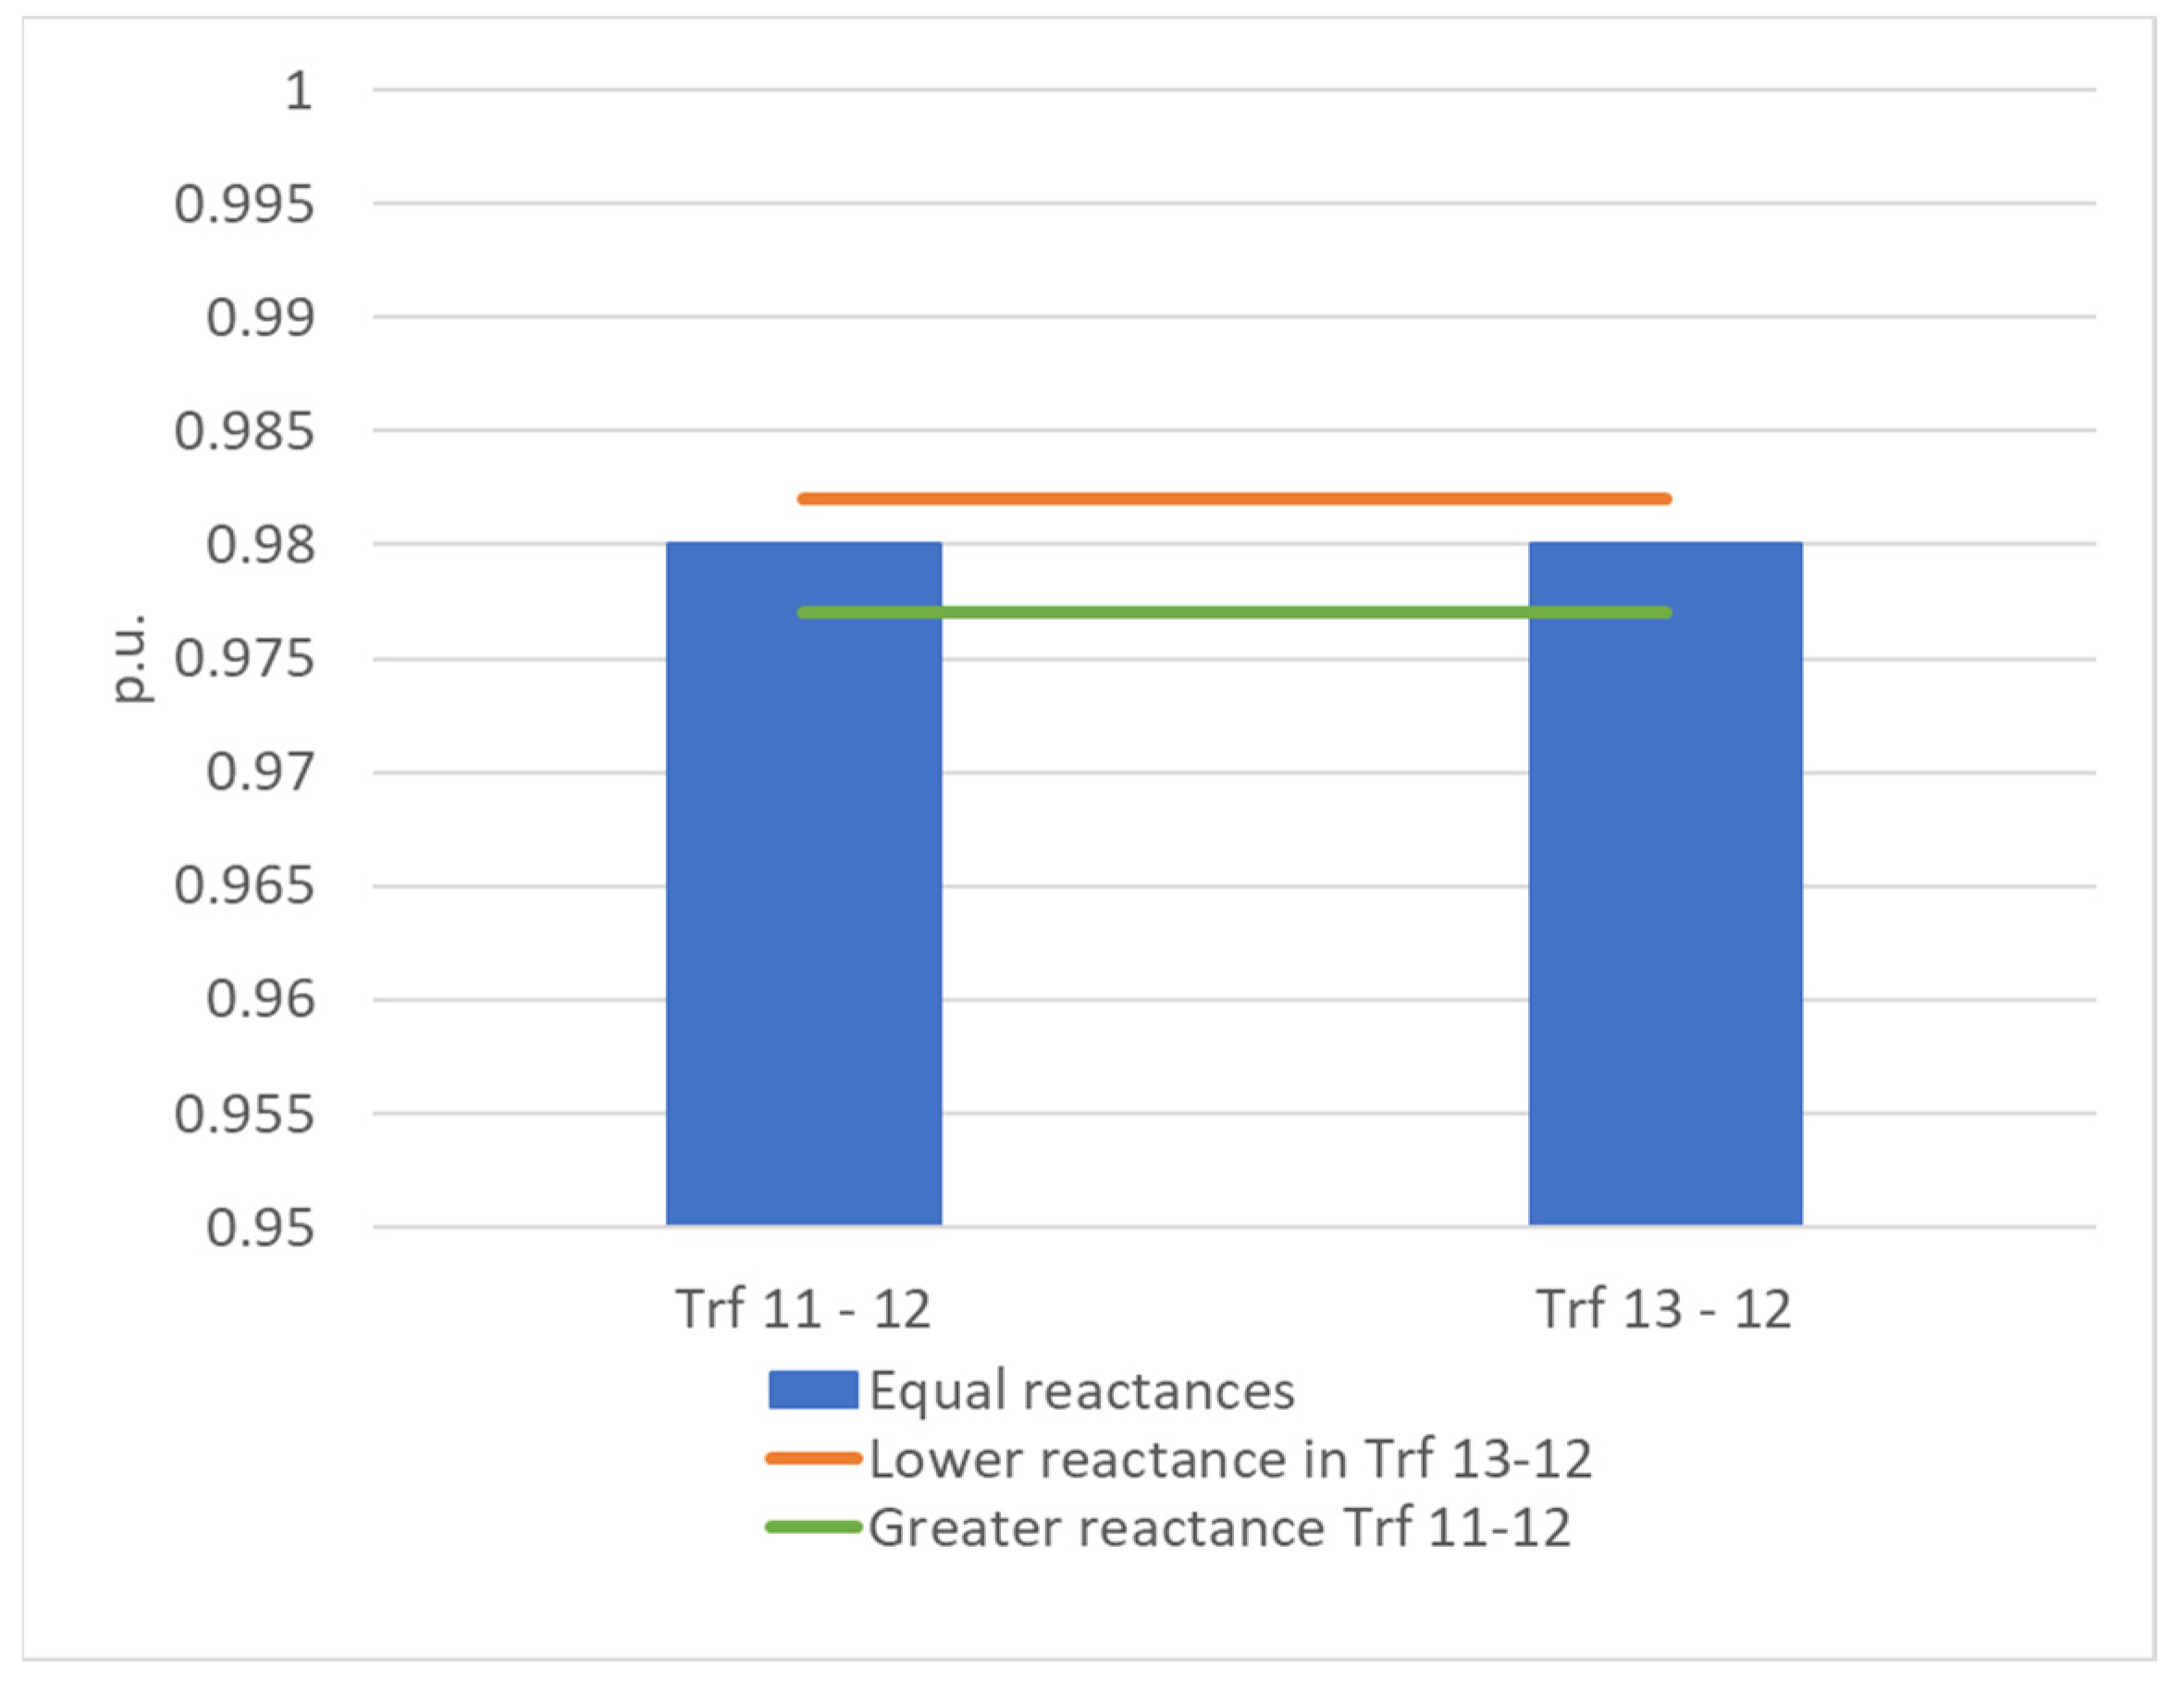
The effectivity of both strategies is conditioned more by the degree of modification of the leakage reactance level. In the first case, the loading levels were set to below 100% in both transformers as the range for varying the reactance was lower (1.08 times lower than 0.1305 p.u.) compared with that of the second case (1.15 times greater than 0.1305 p.u.). Therefore, the relative increase or decrease in the leakage reactance level plays an important role in achieving the desired equilibrium. The voltage level at the secondary side of both transformers for the mentioned leakage reactance cases is shown in Figure 37.

Figure 37.
Voltage level at the secondary sides of Trf 11-12 and Trf 13-12 in the IEEE-39 node AC grid in response to changes in the leakage reactance level in Trf 13-12 and Trf 11-12.
Therefore, this analysis is consistent with the one performed in Section 6.1.3, as it validates both the increase in the leakage reactance level of the transformer that suffers the overload or the decrease in the leakage reactance level of the non-overloaded transformer. However, either strategy yields either an alternation of the over-load condition among Trf 11-12 and Trf 13-12 or a cancellation of the over-load condition at both transformers. For this purpose, the relative change in the leakage reactance level should be kept as small as possible to prevent alternating the over-load condition but kept significant enough to cancel the overload in both transformers. The implementation of both leakage reactance changes does not affect the rest of the buses in the IEEE-39 node AC grid. Therefore, the voltage profile of the buses, the loading levels of AC lines and the power factor levels of generators in the IEEE-39 node AC grid have not been shown.
7. Conclusions
The main conclusions of the paper are hereafter summarized. Different VR techniques have been proposed for transformers working at light-load capacitive and inductive conditions as well as in over-load conditions. The VR techniques have been first deduced analytically by means of phasor diagrams and have subsequently been verified experimentally. Therefore, different criteria for varying the reactance of the transformer have been extracted depending on the operation condition. For light-load capacitive conditions, the reduction of transformer reactance levels is recommended to mitigate the Ferranti effect. This technique can also contribute to the mitigation of the Ferranti effect at the receiving end of adjacent AC lines while reducing the size of shunt reactors. For light-load inductive conditions subjected to over-voltages, an increase in transformer reactance levels is recommended to mitigate the over-voltage level. For over-load conditions and particularly, in a set of two transformers working in parallel, the modification of reactance can alleviate the overload level of the most loaded transformer or allow the overload to be shared more efficiently. In addition, the VR techniques have been validated by means of simulations in two types of grids: a simplified 2-bus system grid and a standardized IEEE-39 node grid. In the last grid, the impact of these VR techniques on other grid elements and variables has been studied, i.e., on the voltage profile of buses, the AC line and other transformer loading levels and power factor levels of generators.
Funding
This research received no external funding.
Data Availability Statement
Not applicable.
Conflicts of Interest
The author declares no conflict of interest. The funders had no role in the design of the study; in the collection, analyses, or interpretation of data; in the writing of the manuscript, or in the decision to publish the results.
References
- Ahire, N.R.; Dake, V. Analysis of voltage profile, it’s issues and mitigation techniques used in western regional grid of India. In Proceedings of the 4th IEEE International Conference on Advances in Electrical and Electronics, Information, Communication and Bio-Informatics, AEEICB 2018, Chennai, India, 27–28 February 2018. [Google Scholar] [CrossRef]
- Yin, C.; Li, F. Reactive power control strategy for inhibiting transient overvoltage caused by commutation failure. IEEE Trans. Power Syst. 2021, 36, 4764–4777. [Google Scholar] [CrossRef]
- Paramo, G.; Bretas, A. Proactive Frequency Stability Scheme: A Distributed Framework Based on Particle Filters and Synchrophasors. Energies 2023, 16, 4530. [Google Scholar] [CrossRef]
- Zhang, S.; Wang, L.; Du, X.; Zhang, R.; Huang, Z.; Duan, S.; Yang, W.; Wang, P.; Zhang, J. Improved Active Islanding Detection Technique with Different Current Injection Waveform. Processes 2023, 11, 1838. [Google Scholar] [CrossRef]
- Yan, Z.; Xu, J.; Yu, G.; Bai, E.; Chen, W. Detailed Wideband Impedance Modeling and Resonance Analysis of Grid-Connected Modular Multilevel Converter. Energies 2023, 16, 4782. [Google Scholar] [CrossRef]
- Zaitsev, I.O.; Kuchanskyy, V.V. Corona discharge problem in extra high voltage transmission line. Stud. Syst. Decis. Control 2021, 346, 3–30. [Google Scholar] [CrossRef]
- Aboshady, F.; Ceylan, O.; Zobaa, A.F.; Ozdemir, A.; Taylor, G.; Pisica, I. Sequentially Coordinated and Cooperative Volt/Var Control of PV Inverters in Distribution Networks. Electronics 2023, 12, 1765. [Google Scholar] [CrossRef]
- Masters, C.; Mutale, J.; Strbac, G.; Curcic, S.; Jenkins, N. Statistical evaluation of voltages in distribution systems with embedded wind generation. IEE Proc.-Gener. Transm. Distrib. 2000, 147, 207–212. [Google Scholar] [CrossRef]
- Qing, P.; Jiang, L.; Ning, K. Simulation of wide range on-load voltage regulation technology in distribution network low voltage management. In Proceedings of the China International Conference on Electricity Distribution, CICED, Changsha, China, 7–8 September 2022; pp. 1109–1113. [Google Scholar] [CrossRef]
- Liu, F.; Mu, Y.; Chen, Z. Control Strategy for Improving the Voltage Regulation Ability of Low-Carbon Energy Systems with High Proportion of Renewable Energy Integration. Electronics 2023, 12, 2513. [Google Scholar] [CrossRef]
- Foqha, T.; Alsadi, S.; Refaat, S.S.; Abdulmawjood, K. Experimental Validation of a Mitigation Method of Ferranti Effect in Transmission Line. IEEE Access 2023, 11, 15878–15895. [Google Scholar] [CrossRef]
- Deb, G. Ferranti Effect in Transmission Line. Int. J. Electr. Comput. Eng. IJECE 2012, 2, 447–451. [Google Scholar] [CrossRef]
- Ankaliki, S.G.; Sureban, M.S.; Vibhuti, P.S.; Amminabhavi, S.P. Performance Analysis of Unloaded Long Transmission Line using transmission line hardware simulator. I-Manag. J. Power Syst. Eng. 2021, 9, 1–7. [Google Scholar]
- Al Riyami, H.A.; Al Busaidi, A.G.; Al Nadabi, A.A.; Al Sayabi, M.N.; Al Omairi, A.S.; Abdalla, O.H. Impact of Installation of 400 kV Shunt Reactors on Oman Grid. In Proceedings of the 2018 53rd International Universities Power Engineering Conference, UPEC 2018, Glasgow, UK, 4–7 September 2018. [Google Scholar] [CrossRef]
- Elansari, A.; Burr, J.; Finney, S.; Edrah, M. Optimal location for shunt connected reactive power compensation. In Proceedings of the Universities Power Engineering Conference, Cluj-Napoca, Romania, 2–5 September 2014. [Google Scholar] [CrossRef]
- Ismail, B.; Wahab, N.I.A.; Othman, M.L.; Radzi, M.A.M.; Vijyakumar, K.N.; Naain, M.N.M. A Comprehensive Review on Optimal Location and Sizing of Reactive Power Compensation Using Hybrid-Based Approaches for Power Loss Reduction, Voltage Stability Improvement, Voltage Profile Enhancement and Loadability Enhancement. IEEE Access 2020, 8, 222733–222765. [Google Scholar] [CrossRef]
- Mali, B.N.; Aglawe, P.M.; Mane, S.A.; Shakya, M. Performance Study of Transmission Line Ferranti Effect and Fault Simulation Model Using MATLAB. Int. J. Iinovative Res. Electr. Electron. Instrum. Control Eng. 2016, 4, 2321–5526. [Google Scholar] [CrossRef]
- Hu, J.; Yuan, P.; Li, X.; Liu, Y. Analysis on the Necessity of High-Voltage Shunt Reactors in Power Grid. In Proceedings of the 2020 10th International Conference on Power and Energy Systems, ICPES 2020, Chengdu, China, 25–27 December 2020; pp. 83–87. [Google Scholar] [CrossRef]
- Dixon, J.; Moran, L.; Rodriguez, J.; Domke, R. Reactive Power Compensation Technologies: State-of-the-Art Review. Proc. IEEE 2005, 93, 2144–2164. [Google Scholar] [CrossRef]
- Tabatabaei, N.M.; Aghbolaghi, A.J.; Bizon, N.; Blaabjerg, F. Reactive Power Control in AC Power Systems: Fundamentals and Current Issues; Springer: Berlin/Heidelberg, Germany, 2017. [Google Scholar] [CrossRef]
- Mathur, R.M.; Varma, R.K. ReactivePower Control in Electrical Power Transmission Systems. In Thyristor-Based FACTS Controllers for Electrical Transmission Systems; Wiley-IEEE Press: Hoboken, NJ, USA, 2015. [Google Scholar] [CrossRef]
- Chavan, G.; Acharya, S.; Bhattacharya, S.; Das, D.; Inam, H. Application of static synchronous series compensators in mitigating Ferranti effect. In Proceedings of the 2016 IEEE Power and Energy Society General Meeting (PESGM), Boston, MA, USA, 17–21 July 2016. [Google Scholar] [CrossRef]
- Konidala, H.; Kumar, Y.N.V. Optimal Placement of Shunt Connected Facts Device in a Series Compensated Long Transmission Line. Int. J. Adv. Res. Electr. Electron. Instrum. Eng. 2014, 3, 11841–11848. [Google Scholar] [CrossRef]
- Venu, Y.; Nireekshana, T.; Phanisaikrishna, B. Mitigation of Ferranti Effect Using Thyristor Controlled Reactor. Lect. Notes Electr. Eng. 2021, 700, 2533–2545. [Google Scholar] [CrossRef]
- Sosnina, E.; Kralin, A.; Kryukov, E.; Bedretdinov, R. Research of thyristor voltage regulator characteristics in transverse output voltage regulation mode. In Proceedings of the 2020 IEEE PES Innovative Smart Grid Technologies Europe (ISGT-Europe), The Hague, The Netherlands, 26–28 October 2020; pp. 960–964. [Google Scholar] [CrossRef]
- Han, S. Selecting an Effective ESS Installation Location from the Perspective of Reactive Power. IEEE Access 2020, 8, 51945–51953. [Google Scholar] [CrossRef]
- Yarlagadda, V.; Lakshminarayana, G.; Ambati, G.; Nireekshana, T.; Karthika, G.A. Mitigation of Ferranti Effect and Voltage Control in Transmission Systems Using Fuzzy Logic Controlled SVC. In Proceedings of the 1st IEEE International Conference on Smart Technologies and Systems for Next Generation Computing, ICSTSN 2022, Villupuram, India, 25–26 March 2022. [Google Scholar] [CrossRef]
- Wang, J.; Zhao, Z.; Zhu, J.; Li, X.; Dong, F.; Wan, S. Improved Support Vector Machine for Voiceprint Diagnosis of Typical Faults in Power Transformers. Machines 2023, 11, 539. [Google Scholar] [CrossRef]
- Kondoh, J.; Ishii, I. Fault Current Limiting Transformer With Variable Reactance. IEEE Trans. Appl. Supercond. 2004, 14, 875–878. [Google Scholar] [CrossRef]
- Brook, E.M. Variable Reactance Transformer. Available online: https://patents.google.com/patent/US4129820A/en (accessed on 28 June 2023).
- Escarela-Perez, R.; Kulkarni, S.V.; Kodela, N.K.; Olivares-Galvan, J.C. Asymmetry during load-loss measurement of three-phase three-limb transformers. In Proceedings of the 2007 IEEE Power Engineering Society General Meeting, PES, Tampa, FL, USA, 24–28 June 2007. [Google Scholar] [CrossRef]
- Gérin-Lajoie, L. IEEE PES Task Force on Benchmark Systems for Stability Controls Report on the EMTP-RV 39-Bus System (New England Reduced Model). Available online: http://www1.sel.eesc.usp.br/ieee/IEEE39/New_England_Reduced_Model_(39_bus_system)_EMTP_RV_study_report.pdf (accessed on 28 June 2023).


Disclaimer/Publisher’s Note: The statements, opinions and data contained in all publications are solely those of the individual author(s) and contributor(s) and not of MDPI and/or the editor(s). MDPI and/or the editor(s) disclaim responsibility for any injury to people or property resulting from any ideas, methods, instructions or products referred to in the content. |
© 2023 by the author. Licensee MDPI, Basel, Switzerland. This article is an open access article distributed under the terms and conditions of the Creative Commons Attribution (CC BY) license (https://creativecommons.org/licenses/by/4.0/).