Abstract
In order to enhance application scenarios and increase the proportion of industrial robots in the field of drilling composites, the damage caused by carbon-fiber-reinforced polymer robotic drilling is studied. The shortcomings of the existing damage evaluation factors are analyzed, and new damage evaluation factors for carbon-fiber-reinforced polymer laminates made of unidirectional prepreg are proposed. A robot and a brad-and-spur drill were used to drill carbon-fiber-reinforced polymer laminates to study the influence of the process parameters on robotic drilling damage. Digital image correlation equipment and industrial computed tomography were used to study the formation process and the damage forms of the hole on the exit side with different process parameters. The test results show that delamination and tearing are significantly affected by the feed rate and spindle speed, while burrs are less affected by the cutting parameters. Appropriately increasing the spindle speed and reducing the feed rate are beneficial to reducing the comprehensive damage factor and improving the hole quality. To avoid hole scrapping caused by a large amount of damage, it is suggested that the robotic drilling parameters should be controlled at a spindle speed higher than 8000 rpm and a feed rate lower than 360 mm/min.
1. Introduction
Carbon-fiber-reinforced polymer (CFRP) is a new type of material formed by a spatial combination of carbon fiber as the reinforcing material and resin as the matrix material. With the advantages of high specific strength, high specific stiffness, corrosion resistance, and fatigue resistance, CFRP has been widely used in the field of aerospace manufacturing, such as in aircraft skin panels, wings, vertical tails, horizontal tails, fairings, doors, and other structural components [1]. The amount of composite materials has emerged as a key indicator for measuring the advanced nature of aerospace equipment. The assembly method for CFRP is mainly mechanical connection, such as rivet connection and bolt connection [2], and a large number of high-precision holes need to be processed during assembly. The characteristics of high strength and hardness, coupled with the hard and brittle machinability of carbon fiber and the plasticity and soft viscosity of the resin matrix make CFRP a difficult-to-machine material with anisotropy, low thermal conductivity, and low interlayer bonding strength. Various forms of damage are prone to occur during the drilling process [3]. This damage significantly reduces the mechanical properties and assembly performance of the structural components [4], leading to a decrease in strength and fatigue life, and may even directly lead to the direct scrapping of parts, seriously affecting flight safety. Therefore, it is necessary to study principles, influencing factors, and suppression methods for the damage to improve the quality of drilling and connection and further improve the life of the product.
Although some special unconventional drilling processes (such as water jets, lasers, and electrolytic corrosion) have been properly industrialized on composite laminates, traditional mechanical drilling using drilling tools is still the mainstream technology [5]. In recent years, the rapid development of robot and end-effector technology has provided new ideas for automatic drilling and flexible assembly. Robotic equipment has many advantages that machine tools do not have, such as a high degree of automation, a large workspace, low cost, the integration of vision/force sensing, and flexible reconfiguration of the production layout. Moreover, it can co-operate with large-stroke gantry cranes, automated guided vehicles (AGVs), multi-source sensors, machine learning, and intelligent cloud platforms to achieve large-scale, high-precision, high-flexibility, and adaptive assembly operations [6,7]. However, compared with machine tools, the weak stiffness characteristics of robots cause them to be easily affected by drilling resistance during the drilling process to produce obvious chatter [8]. This unstable drilling state causes the drilling process and damage to CFRP to appear as new features. The rules and conclusions obtained from research on machine tools are no longer applicable to robotic drilling. Therefore, it is of great significance to study the drilling process and damage in CFRP robotic drilling, the influence of input variables on drilling quality, and damage suppression methods to promote the application of robots in CFRP drilling.
CFRP drilling damage can be divided, based on its location, into entry damage, intermediate damage, and exit damage. Among these three, exit damage, which is the most serious, deserves more attention, and is also the focus of previous articles. Exit damage is manifested in various forms, such as delamination, burrs, tearing, resin ablation, and micro-cracks. Among these, delamination, tearing, and burrs are the three most common and harmful types of damage. Delamination refers to the interlayer bonding failure of CFRP laminates inside the material, which usually occurs at the entry and exit of the edge of machined holes [3,9]. The delamination on the exit side is called ‘push-out delamination’, which is more common and more serious than the ‘peel-up delamination’ on the entry side. Researchers have reached a consensus on the formation mechanism of push-out delamination: with the feed of the drill, the thickness of the CFRP laminate to be cut decreases, and the uncut layers are more likely to deform. When the thrust force generated by the drill exceeds the interlayer bonding strength, push-out delamination occurs. Delamination is the most serious of all the forms of damage, which not only directly reduces the surface finish and assembly tolerance but also affects the fatigue resistance of the hole, thus reducing the service performance of the assembled parts. According to statistics, more than 60% of unqualified products are caused by delamination in the final assembly process for aircraft [10]. Tearing refers to the phenomenon where fibers and matrices fall off in the CFRP surface layer. When the cutting stress reaches the maximum interface strength, the fiber matrix begins to debond, and micro-cracks are generated. When the cutting force is applied, these micro-cracks will continue to propagate along the fiber direction due to the insufficient support provided by the uppermost polymer matrix, resulting in severe tearing faults [11]. Tearing not only affects the assembly quality, but also easily leads to stress concentration [12]. Burrs usually refer to the excess material on the product that has not been removed. The relationship between the fiber cutting angle and the occurrence of debonding on CFRP leads to the formation of burrs, which are manifested as fibers that are not completely cut off. Burrs appear in the form of a bundle of fibers and epoxy resin, so some researchers also call them uncut fibers [13]. Although burrs generally do not weaken the synthetic strength of composites, they will affect the assembly accuracy [14] and become a potential risk source for crack propagation and delamination. Moreover, burrs need to be removed by time-consuming and expensive post-processing operations (deburring), so burrs should be avoided as much as possible [15,16].
The research methods for these forms of damage mainly focus on tests, finite element simulation, and theoretical analysis methods. Among these, the test method is favored for its objectivity, authenticity, and accuracy. Although scholars have done much research on CFRP hole damage, few articles can reveal the dynamic formation process for the damage on the exit side. Therefore, a method based on digital image correlation (DIC) and strain analysis is proposed in this paper. The material removal process and strain distribution on the exit-side surface of the CFRP hole during drilling are recorded by a high-speed camera to dynamically reveal the damage formation process.
The main content of the subsequent sections of the paper is as follows. Section 2 analyzes the shortcomings of existing damage evaluation methods and introduces new three-dimensional damage evaluation factors applicable to CFRP laminates made of unidirectional prepreg plies. Section 3 introduces the robot system, DIC equipment, industrial computed tomography (CT), drilling tools, and materials used in the drilling tests. Section 4 introduces the methodology for drilling and specifies the cutting parameters used. Section 5 presents the variations in strain distribution on the exit sides of the holes captured by DIC, internal damage observed through CT scans, and the variation trends for each damage factor with cutting parameters. Additionally, this section analyzes the formation process for damage on the exit sides of the holes and the impact of cutting parameters on damage. Section 6 summarizes the conclusions obtained through drilling tests.
2. Evaluation Methods for CFRP Drilling Damage
The forms of damage in CFRP drilling are various. Qualitatively reflecting the influence of each variable on damage is challenging. Therefore, the quantitative description of damage severity has always been a focal point among scholars [17]. In this regard, for decades, scholars have proposed various quantitative evaluation methods for different types of damage.
2.1. Evaluation Method for Delamination
Chen [18] first proposed the concept of the delamination factor and used the ratio Fd of the maximum diameter of the damage zone Dmax to the nominal diameter D0. The advantage of this factor is that it is convenient to measure and simple to calculate. However, as a one-dimensional delamination factor, it can only reflect damage length along the radial direction, which cannot accurately characterize the size of the actual damage area. Some researchers have proposed an area-based two-dimensional delamination factor Fa, defined as the ratio of the damage area Adel around the hole to the nominal area Anorm [19,20]. Although this factor is superior to the one-dimensional delamination factor, it is still inaccurate when the delamination damage is accompanied by long cracks [9]. In order to refine the damage area and make the calculation formula more accurate, many scholars have proposed various improved two-dimensional delamination factors on this basis. Davim et al. [21] proposed an adjusted delamination factor considering the size of the crack and damage area contributions. Tsao et al. [22] proposed an equivalent delamination factor. Nagarajan et al. [23] divided the damage area according to Buckingham’s π theorem, considering the severity of the damage, and proposed a refined delamination factor. Babu et al. [24] improved the equivalent delamination factor and proposed a refined equivalent delamination factor. Al-wandi et al. [25] combined the adjusted delamination factor and the equivalent delamination factor and proposed an equivalent adjusted delamination factor.
Although these delamination factors can more accurately reflect the two-dimensional damage area through continuous improvement, there are still two primary defects:
- (1)
- The delamination area is not necessarily circular. Most of the articles are devoted to identifying an optimal circle to enclose the delamination region, using either the radius or area of the circle as measures of damage severity, as shown in Figure 1. For woven composites, treating the delamination region as a circle is reasonable because the single layer is quasi-isotropic. However, for laminates composed of unidirectional prepreg layers, due to the anisotropy of the single layer, the delamination on the exit side shows pronounced directivity. Specifically, the delamination along the fiber direction is more severe than that perpendicular to the fiber direction, as shown in Figure 2a. In this case, regarding the delamination region closer to the ellipse as a circle is inappropriate. This assertion finds support in the exit damage images of fibers of woven CFRP provided in [21,22] and the exit damage images of CFRP laminates composed of unidirectional prepreg layers provided in [26].
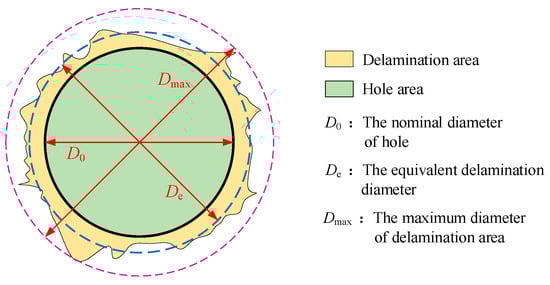 Figure 1. The widely used two-dimensional delamination evaluation methods.
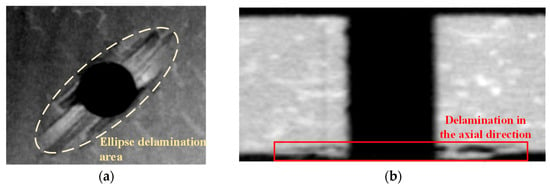 Figure 2. Damage image on the exit side of a hole in CFRP made of unidirectional prepreg layers taken by industrial CT: (a) ellipse delamination area; (b) delamination in the axial direction.
 - (2)
- Delamination does not only occur in the outermost layer of the material. The two-dimensional delamination factors exclusively consider delamination damage on the outermost layer, disregarding delamination within the material’s thickness. Figure 2b illustrates the potential for multi-layer delamination on the exit side of the hole. The thickness of delamination is influenced by many factors, and assessing it aids in refining the critical thrust force model and optimizing drilling conditions. The limitations of two-dimensional delamination factors in accurately representing three-dimensional delamination information underscore the necessity of establishing a three-dimensional volume delamination factor to describe the delamination defects more accurately. Xu et al. [27] proposed a three-dimensional volume delamination factor Fv expressed by Equation (1)where and represent the delamination area and nominal area of the hole for the kth layer, and p is the number of delamination layers. While this factor provides a more accurate characterization of the three-dimensional damage volume, it necessitates obtaining a binary image of each layer to calculate the delamination area. The process is cumbersome and fails to reflect the shape characteristics of the delamination area and the contribution of the maximum crack length. In addition, because the factor ignores the thickness of the composite material, its utility is confined to comparing drilling outcomes within the same test piece.
This paper proposes a three-dimensional volume delamination factor to simplify measurement and calculation while ensuring accurate assessment of the delamination damage to better meet engineering needs. In a single-layer plane composed of unidirectional fibers, delamination along the fiber direction is often more severe than that perpendicular to the fiber direction. Moreover, the delamination damage on either side of the hole along the fiber direction might differ. Two semi-ellipses are used to encompass the delamination zone, as shown in Figure 3a. The measured values amL, amR, and bm of the maximum distance from the edge of the delamination zone to the center of the hole are taken as the semi-major axis aL, aR, and the common semi-minor axis b of the two semi-ellipses, that is,
aL and aR also serve to characterize the maximum crack lengths on either side of the hole. Figure 3b illustrates the shape of the delamination zone within the thickness direction of the laminate. The delamination damage near the exit side is more severe compared to the regions far from the exit side. Two quarter-ellipses are used to encompass the delamination zones on either side of the hole. hmL and hmR represent the measured values of the maximum delamination height along the thickness direction of the laminate on both sides of the hole. hL and hR represent the semi-short axes of the two quarter-ellipses. The relationship between hL and hmL, as well as that between hR and hmR, can be derived from Equations (3) and (4):
aL, b, and hL, along with aR, b, and hR, collectively define two quarter-ellipsoids in three-dimensional space. The three-dimensional delamination region is represented by the remaining entity resulting from the subtraction of the intersection part with the hole cylinder from the two quarter-ellipsoids, as depicted in Figure 3c. The three-dimensional delamination factor Fve is calculated by Equation (5)
where Ve is the combined volume of the two quarter-ellipsoids, Vp is the approximate volume of the intersection between the hole cylinder and the quarter-ellipsoids, and V0 is the nominal volume of the hole.
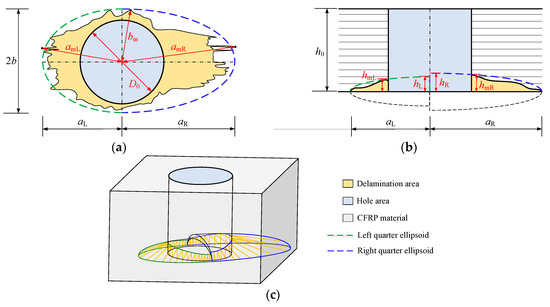
Figure 3.
The three-dimensional delamination evaluation method: (a) Two-dimensional planar delamination region; (b) Delamination region in the thickness direction; (c) Three-dimensional delamination region.
Substitute Equation (6) into Equation (5) to obtain
where h0 is the thickness of the laminate.
2.2. Evaluation Method for Burrs
Burrs and tearing both occur in the outermost single layer on the exit side of the hole. Despite varying height values for the damage in the thickness direction, the evaluation factors are mostly one-dimensional or two-dimensional due to the lack of effective measurement methods. One-dimensional burr factors include the number of burrs, maximum burr length, average burr length, burr width, and burr contour length. While these factors provide partial insights into burr characteristics, they are suitable for occasions where the hole quality demands are not stringent and accurate burr information is not required. Two-dimensional factors reflect the coverage of burrs to the hole area through the correlation calculations for the burr area, presenting more accurate characterization methods. The most commonly used two-dimensional burr factor, Fb, is calculated with Equation (8) [15,28,29]:
where Ab represents the burr area, which can be obtained by counting the black/white pixels of the binary image of the hole or manually dividing the measurement region for area calculation [30]. Anom represents the nominal area of the hole, and Afree is the burr-free area of the hole.
Daniel et al. [15] compared the advantages and disadvantages of a variety of one-dimensional and two-dimensional burr factors. They recommended the use of area-based and ratio-based two-dimensional burr factors for reproducible quality control. Nevertheless, they noted a limitation in the burr factor Fb, as it fails to provide specific information about the location, length, and width of burrs. Longer burrs pose a heightened risk of delamination during the insertion of fasteners into holes. Wider burrs necessitate increased time and energy to deburr. Figure 4 illustrates that burr characteristics, deburring difficulty, and their impact on the assembly may differ significantly among holes sharing the same Fb value, which should be reflected in the establishment of the burr factor.
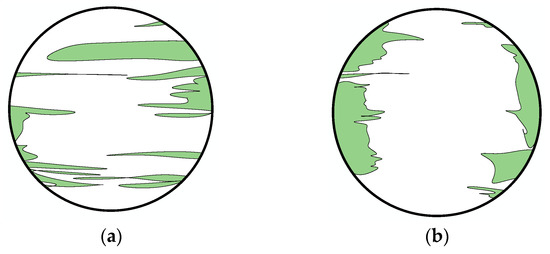
Figure 4.
Different burr characteristics of two holes with the same Fb: (a) Long slender burrs; (b) Wide burrs.
A burr factor Fba considering the influence of burr length and width is proposed in this paper on the basis of Fb, which is expressed as
where and are the burr length and width compensation coefficients, which are calculated according to
where Lb is the maximum burr length, which is defined as the distance from the burr tip to the hole’s edge along the fiber direction, as shown in Figure 5. Wb is the maximum burr width, which is defined as the maximum contact arc length between the hole’s edge and the single burr, measured along the circumferential direction. D0 is the nominal diameter of the hole.
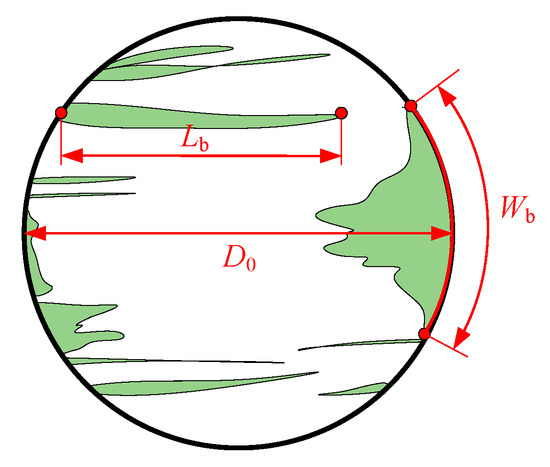
Figure 5.
Measurement methods of Lb and Wb.
2.3. Evaluation Method for Tearing
The evaluation method for tearing can refer to the burr factor and can be expressed as a two-dimensional tearing factor based on area. However, the damage shapes of the two are different, leading to a distinction in the calculation of the damage area. The burr area consists of a limited number of individual burrs within the hole, and there exists a distinct separation between the burrs, allowing for straightforward area measurement for each burr. Tearing, on the other hand, manifests as numerous slender linear segments within a confined zone, where the spaces between these thin linear segments are minimal. Consequently, measuring the area of each tearing segment is impractical, and relying on pixel counts based on binary images also makes it difficult to distinguish the boundaries of these thin linear tearing segments. According to the tearing damage shapes of different holes, specific zones encompassing the majority of localized fine linear tearing segments are manually designated, and the areas of the zones are calculated, as shown in the blue area in Figure 6. A length compensation coefficient is used to adjust the tearing factor for extremely long linear tearing segments extending beyond the zones. According to the principle that the tearing length should not exceed three times the hole diameter and the width should not surpass 1.8 mm, 3D0 × 1.8 is selected as the comparison benchmark for tearing damage [12,14]. The expression of the tearing factor Ft is
where is calculated by Equation (12):
where Lt is the maximum tearing length, defined as the distance from the tearing tip to the hole’s edge along the fiber direction.
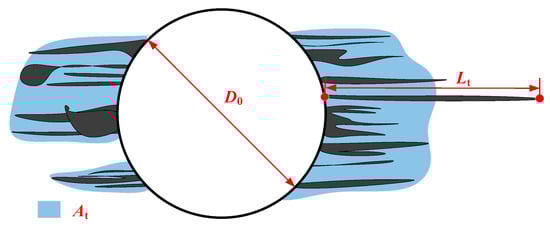
Figure 6.
Measurement method for Lt.
2.4. Comprehensive Evaluation Method for Damage
In order to study the collective impact of each damage type on the quality of drilling, scholars have put forward various calculation methods for comprehensive factors. The fundamental concept behind these factors involves assigning weights to each damage factor and subsequently accumulating them. The difference lies in determining the weighting coefficients. Wen et al. [14] used a trial-and-error approach to ascertain each weighting coefficient by comparing the variation trends between tool wear and damage factors within the same test group. Voß et al. [29] determined the coefficients using the conventional least-squares method by analyzing the variations in hole quality and thrust force with the number of holes. Although this method yields well-matched coefficients, test outcomes are influenced by multiple factors, including tool material, coating, tool geometry, carbon fiber hardness, laminate thickness, and hole diameter. Consequently, wear curves or changes obtained from different tests may lack uniformity. The determined weighting coefficients only apply to the specific tool and composite material conditions used in the test and cannot be compared horizontally. In addition, the experimental approach to determine the weighting coefficients for assessing hole quality is cumbersome. A more straightforward and efficient method should be sought.
In this paper, the proposed comprehensive damage factor FC is also determined through the weighted-sum method. Burrs and tearing are regarded as the damage occurring in the outermost single layer. Accordingly, the burr factor and tearing factor are normalized by the number of layers to ensure uniformity in the calculation dimensions across the three damage factors. FC is expressed as
where α, β, and γ are weighting coefficients and satisfy α + β + γ = 1. In this paper, the weight is assigned to each damage factor according to their respective influence on the assembly. Delamination-induced product scrap constitutes 60% of the unqualified components, so α = 0.6. Given the lack of effective methods for repairing tearing damage compared with burr removal through post-processing, it is imperative to prioritize the reduction or avoidance of tearing more than burrs. Consequently, β is designated as 0.25 and γ as 0.15. The values of the above three coefficients are consistent with the weighting coefficient values derived by Wen et al. [14] through the trial-and-error method. The expression of the comprehensive damage factor FC is
3. Test Equipment
3.1. Robotic Drilling Equipment
The robotic drilling equipment consists of a KR500L340 robot produced by KUKA (Augsburg, Germany) and an end effector, as shown in Figure 7. The maximum speed of the motorized spindle reaches 30,000 rpm, enabling a broad range of cutting speed adjustments. An industrial camera is utilized to image and identify the reference hole to realize the rough positioning of the drilling area. The feed unit, composed of AC servo motors and ball screw mechanisms, facilitates the feed motion during drilling operations. Due to the periodic change in cutting force during drilling, which leads to periodic vibration at the end, the design of the pressure foot aims to enhance the stiffness of the robot end. The pressure foot augments the friction of the end effector on the machined surface by exerting pressure on the workpiece surface. This method equivalently boosts the tangential stiffness of the tool, addressing lateral slipping issues during machining. As a result, it improves the hole roundness and minimizes milling trajectory deviation [31]. Four laser ranging sensors are affixed to the sides of the pressure foot to determine the normal direction of the surface point to be processed on the workpiece. This alignment ensures the tool axis coincides with the normal direction of the hole’s drilling point, guaranteeing the perpendicularity of the drilled hole when the pressure foot plane fits the workpiece. A chip removal pipe connected to a vacuum cleaner is installed at the bottom of the pressure foot for timely suction of powdered debris.
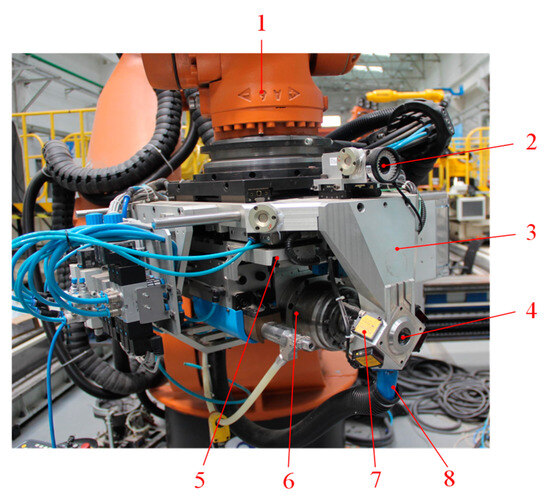
Figure 7.
Robotic drilling equipment: 1, industrial robot; 2, industrial camera; 3, pressure foot; 4, drilling tool; 5, feed unit; 6, motorized spindle; 7, laser ranging sensors; 8, chip removal pipe.
3.2. Introduction of the DIC Method
Digital image correlation (DIC) is a non-contact optical measurement method. It directly captures deformation information from randomly distributed spots or artificial speckle fields on the surface of an object. Then, it calculates displacement and deformation according to the statistical correlation before and after the deformation of the speckle field. DIC enables full-field displacement and strain analysis, evaluating material or structural surface behavior under load [32,33]. Its advantages include user-friendly operation, low environmental requirements, a wide measurement range, high precision, and real-time capabilities. DIC has been widely used in deformation field measurement in mechanical manufacturing, material testing, engineering construction, and other fields [34]. Two-dimensional digital image correlation (2D-DIC) was used in the test. Initially, speckles were sprayed on the surface of the laminate on the exit side of the hole. Subsequently, a high-speed camera continuously captured a series of images of the surface on the exit side during a complete drilling cycle (from the tool cutting into the material to the tool exiting the hole) to record the dynamic change process at the surface when the tool drilled out of the material, as shown in Figure 8. The material removal and damage generation process was revealed by analyzing the surface strain variation on the exit side during the tool penetrating the laminate. The DIC equipment utilized in the test was the ARAMIS 3D 12M, produced by the company GOM in Germany. Displacement and strain analysis were conducted using the ARAMIS professional 2020 software.
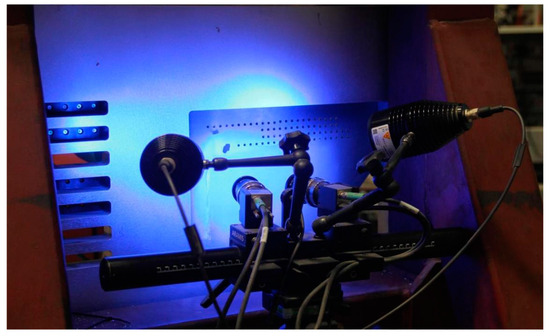
Figure 8.
DIC equipment.
However, damage not only occurs on the material’s surface but may also occur between several layers near the exit side of the hole. Relying solely on 2D-DIC, it is not possible to observe the degree of axial damage in the hole, and other non-destructive testing methods must be adopted. Industrial CT is an excellent choice.
3.3. Introduction of Industrial CT
As a non-destructive testing technology, industrial computed tomography (CT) technology is extensively applied in aerospace, automotive, shipbuilding, archaeology, and other fields. Its basic principle is based on the X-ray’s attenuation and absorption characteristics within the workpiece to be tested. The internal structural information of the component is entirely reconstructed with a detector and is displayed in visual form through computer information processing and image reconstruction technology [35,36]. In the test, an IPT04203C industrial CT system from Beijing Guhong Technology Co., Ltd. (Beijing, China) was used. After all the holes were prepared, the 160 KV microfocus ray source scanned the laminate, and the VGStudio Max 3.4.2 software facilitated data processing and analysis to obtain axial damage information for the holes.
3.4. Selection of Tools
The quality of CFRP holes is significantly impacted by the selection of tools [3,9,11,17,37]. Scholars have conducted extensive comparative research on drilling CFRP with different tools, categorized into three aspects: tool material, coating, and tool geometry.
In terms of the tool material, J.P. Davim et al. [38] compared the performance of a carbide twist drill and a high-speed steel (HSS) twist drill under identical cutting conditions. They found that the HSS drill always caused more significant damage, while the carbide drill performed better. Ameur et al. [39] also confirmed that the carbide drill generated lower drilling forces compared to the HSS drill, and the carbide drill with coatings presented more advantages for drilling CFRP composites.
Regarding the coating, Montoya et al. [40] used uncoated, TiAlCrN-coated, AlTiSiN-G-coated, and diamond-coated tungsten carbide twist drills to drill CFRP/Al stacks, respectively. Their test results revealed that diamond coating notably reduced drilling wear, by about 80%, resulting in lower thrust force and superior hole quality. In contrast, the TiAlCrN and AlTiSiN-G coatings were less effective. The research of Pinho et al. [41] demonstrated that diamond-coated tools outperformed TiN/TiAlN-coated and conventional tools in minimizing delamination damage. Iliescu et al. [42] pointed out that a carbide drill with diamond coating offered a lifespan 10 to 12 times longer than uncoated carbide drills, allowing for a threefold increase in cutting speed. Hrechuk et al. [43] also indicated that CVD diamond-coated drills exhibited better drilling quality and service life than uncoated drills. Although they also confirmed that PCD diamond drills performed better than CVD diamond-coated drills, the latter presented a more cost-effective option when considering expenses.
Tool geometry mainly affects drilling quality by influencing thrust force and chip-breaking mechanism. Hocheng et al. [44] compared the critical thrust force and delamination damage for the the twist drill, saw drill, candlestick drill (brad-and-spur drill), step drill, and core drill. They indicated that the candlestick drill, core drill, saw drill, and step drill could be used at a higher feed rate without causing delamination damage compared with the twist drill, with the core drill exhibiting the most favorable effect. Durão et al. [45] suggested using a twist drill with a 120° point angle or a special step drill to reduce delamination at a high feed rate. Othman et al. [46] conducted CFRP drilling tests using a twist drill, a brad-and-spur drill, and a dagger drill. They observed that despite the brad-and-spur drill generating higher thrust force, it exhibited the best drilling quality. This result owes to its geometric design, enabling a cutting action from the outer to the inner diameter, aiding in preventing severe plastic deformation at the center of the drill. Xu et al. [47] also used these three geometric shapes of tools to drill CFRP laminates, but the experimental results were different. Their selections of carbon fiber strength, laminate thickness, tool material, and cutting parameters were quite different from those of Othman et al. [46]. Their findings revealed that the brad-and-spur drill generated the lowest thrust force among the three tools, followed by the twist drill and dagger drill. Nonetheless, they all confirmed the exceptional performance of the brad-and-spur drill in terms of hole quality.
Based on the research results of the above articles, aiming to fulfill the requirements of practical engineering applications and minimize the interference of other variable factors, the brad-and-spur drill, with its high-quality drilling performance, was chosen as the cutting tool for the test. During the drilling process, as the tool approaches the hole’s exit, the two flank cutting edges cut off the fibers of the outermost layer along the hole’s edge, thus preventing tension among the fibers. Subsequently, the outermost layer of the material is pushed out when the main cutting edge penetrates the laminate. This cut–push effect proves effective in reducing drilling damage [48]. The material of the brad-and-spur drill for tests was carbide with CVD diamond coating, as shown in Figure 9. The diameter of the brad-and-spur drill was 4.18 mm.
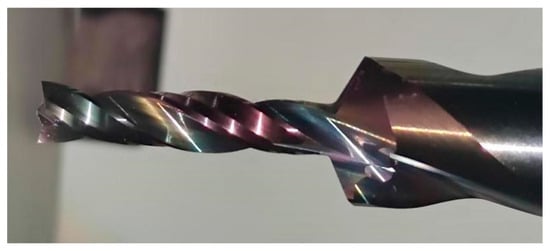
Figure 9.
The brad-and-spur drill used for tests.
3.5. Test Material
The type of CFRP laminate was ZT7H3194U/QY9512, which adopted the [45/0/–45/90]3S layering method with a total of 24 layers and a thickness of 4.8 mm.
4. Methodology
The CFRP laminate, following the application of artificial spray speckles, was installed on the test piece installation platform using screws. The robot was located on one side of the test platform, as shown in Figure 10a. The DIC equipment was arranged on the platform’s other side to record the drilling process, as shown in Figure 10b.
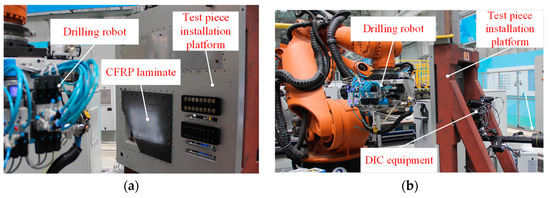
Figure 10.
Construction of the test platform: (a) installation of the CFRP laminate; (b) layout of the robot and DIC equipment.
The tests were divided into two groups to study the damage forms and hole quality with different cutting parameters. The first group kept the spindle speed constant while varying the feed rate, as shown in Table 1. The second group kept the feed rate constant while varying the spindle speed, as shown in Table 2. Each set of parameters underwent three repetitions, and the worst hole was chosen for comparison. Before drilling, the laser ranging sensors were initially utilized to determine the normal direction of the specimen. Due to the specimen’s flat surface, this step only needed to be performed once. Throughout each drilling procedure, the pressure foot was applied to the specimen’s surface before initiating the feed motion. The DIC camera boasted a resolution of 12 million pixels with a focal length of 35 mm and operated at a sampling frequency of 20 Hz.

Table 1.
Cutting parameters of the first group.
Table 2.
Cutting parameters of the second group.
After the drilling process concluded, a three-coordinate measuring instrument was used to detect the diameter on the exit side of each hole, and the measured value was designated as the nominal diameter. Subsequently, industrial CT was used to scan the cross-section of the hole to detect internal damage. The delamination factor, burr factor, tearing factor, and comprehensive damage factor were calculated.
5. Test Results
The surface morphologies on the exit sides of the holes in the first group are shown in Figure 11. It can be seen from the figure that the hole surface morphologies of Figure 11a–d are relatively good. The tearing area around each hole is small, and the maximum tearing length is short. The burrs are slender. Apparent boundaries can be seen between the circular edge of each hole and the surrounding material. The hole surface morphologies of Figure 11e–h are poor, with short and wide burrs. The tearing area and the maximum tearing length gradually increase, and the edge of each hole is an irregular polygon rather than a prominent circle. When the spindle speed remains constant, reducing the feed rate helps to improve the exit side morphology of the hole.
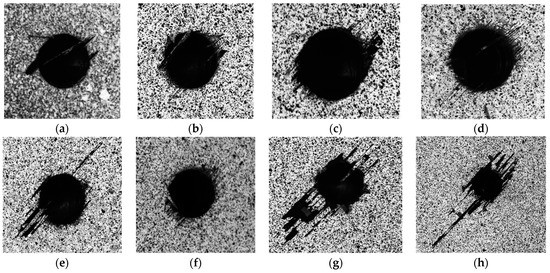
Figure 11.
Surface morphologies on the exit sides of the first group (constant spindle speed: 8000 rpm). Feed rates: (a) 60 mm/min; (b) 80 mm/min; (c) 100 mm/min; (d) 150 mm/min; (e) 240 mm/min; (f) 360 mm/min; (g) 480 mm/min; (h) 720 mm/min.
Figure 12, Figure 13 and Figure 14 illustrate the strain distribution variations recorded with DIC on the exit sides of the holes. The hole shown in Figure 12 was drilled at a spindle speed of 8000 rpm and a feed rate of 60 mm/min. Figure 13 represents the hole drilled at a spindle speed of 8000 rpm and a feed rate of 240 mm/min. Figure 14 represents the hole drilled at a spindle speed of 8000 rpm and a feed rate of 720 mm/min. To more intuitively reflect the variation trend for the strain distribution, the strain threshold (legend) is set to 0.1~1%. Various colors within the figures represent different strain magnitudes. The red represents the area where the strain is greater than or equal to 1%. The blue represents the area where the strain is less than or equal to 0.1%. The double arrows in the figures denote the direction of the engineering principal strain.
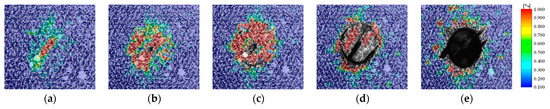
Figure 12.
The variation trend for the strain distribution on the exit side of the hole at a spindle speed of 8000 rpm and a feed rate of 60 mm/min during drilling: (a) Stage 1; (b) Stage 2; (c) Stage 3; (d) Stage 4; (e) Stage 5.
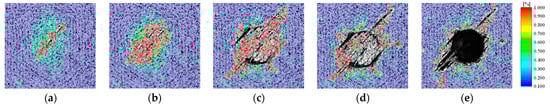
Figure 13.
The variation trend for the strain distribution on the exit side of the hole at a spindle speed of 8000 rpm and a feed rate of 240 mm/min during drilling: (a) Stage 1; (b) Stage 2; (c) Stage 3; (d) Stage 4; (e) Stage 5.
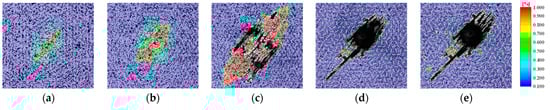
Figure 14.
The variation trend for the strain distribution on the exit side of the hole at a spindle speed of 8000 rpm and a feed rate of 720 mm/min during drilling: (a) Stage 1; (b) Stage 2; (c) Stage 3; (d) Stage 4; (e) Stage 5.
It can be found from the comparison among the three figures that the strain distribution variations at different feed rates are different when the spindle speed remains unchanged. At lower feed rates, as illustrated in Figure 12, a small elliptical deformation zone initially forms along the fiber direction at the hole’s center. As the feed motion progresses, the deformation expands outward from the center of the hole. After large deformation occurs throughout the hole area, the outermost layer of the material begins to be removed, resulting in the formation of a complete hole. With an increase in the feed rate, as depicted in Figure 13, the initial deformation zone at the center of the hole elongates into a strip. As the feed motion progresses, the deformation not only enlarges within the hole area but also extends along the fiber direction toward the hole’s perimeter. Tearing damage starts to occur before the material within the hole area is completely removed. After the completion of the hole, the tearing damage is further aggravated. When the feed rate is further increased, as shown in Figure 14, a large deformation zone is generated outside the hole. These deformation zones eventually form severe tearing damage. Because of the anisotropy within the single layer, the tensile strength along the fiber direction significantly surpasses that perpendicular to it. Thus, the engineering principal strain is consistently perpendicular to the fiber direction in the red areas.
The CT scan results for these three holes are shown in Figure 15. It can be seen from Figure 15 that the hole drilled with the cutting parameters of 8000 rpm and 60 mm/min has no prominent delamination characteristics, and the hole wall is completely smooth. Evident delamination traces can be observed in the hole drilled with the cutting parameters of 8000 rpm and 240 mm/min, and there are a small number of uneven defects on the left hole wall. Severe delamination damage can be observed in the hole drilled with the cutting parameters of 8000 rpm and 720 mm/min, and the hole wall is not linear like the first two holes but similar to the uneven burr shape.
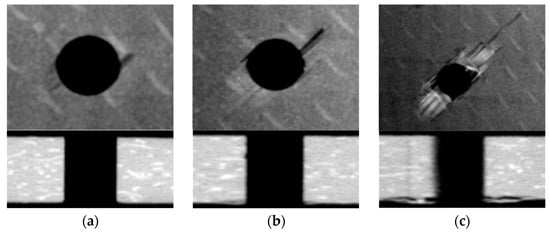
Figure 15.
CT scan images of the three holes in the first group. (a) The hole drilled at the spindle speed of 8000 rpm and feed rate of 60 mm/min. (b) The hole drilled at the spindle speed of 8000 rpm and the feed rate of 240 mm/min. (c) The hole drilled at the spindle speed of 8000 rpm and the feed rate of 720 mm/min.
The surface morphologies on the exit sides of the holes in the second group are illustrated in Figure 16. It can be seen from the figure that the hole surface morphologies depicted in Figure 16e–h exhibit better characteristics compared to those in Figure 16a–d. The holes in Figure 16a,b appear as wide burrs and have poor roundness. The holes in Figure 16c,d display longer tearing lengths. Maintaining a constant feed rate, an increase in the spindle speed demonstrates an improvement in the hole’s exit side morphology.
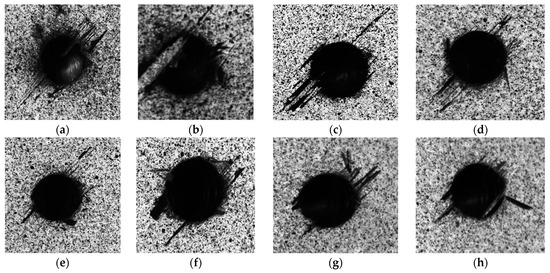
Figure 16.
Surface morphologies on the exit sides of the second group (constant feed rate: 240 mm/min). Spindle speeds: (a) 5000 rpm; (b) 6000 rpm; (c) 8000 rpm; (d) 10,000 rpm; (e) 12,000 rpm; (f) 14,000 rpm; (g) 16,000 rpm; (h) 18,000 rpm.
The strain distribution variations recorded with DIC on the exit sides of the holes are depicted in Figure 17, Figure 18 and Figure 19. The hole in Figure 17 was drilled at a spindle speed of 5000 rpm and a feed rate of 240 mm/min. Figure 18 represents the hole drilled at a spindle speed of 12,000 rpm and a feed rate of 240 mm/min. Lastly, Figure 19 displays the hole drilled at a spindle speed of 18,000 rpm and a feed rate of 720 mm/min. The strain distributions presented in Figure 17c, Figure 18c and Figure 13c exhibit high similarity, indicating analogous formation processes among the holes drilled with different cutting parameters: 5000 rpm and 240 mm/min, 12,000 rpm and 240 mm/min, and 8000 rpm and 240 mm/min, respectively. This similarity implies that the impact of feed rate on material deformation processes is more significant than that of spindle speed. Upon forming a complete hole, conspicuous red blocks are visible outside the hole in Figure 17e, signifying substantial deformations on the material surface surrounding the hole. Although these red areas with extensive deformations have not yet led to tearing damage, they diminish the material’s strength and can cause assembly failure. This occurrence is particularly pronounced at lower spindle speeds. The enlarged deformation area outside the hole diminishes as spindle speed increases, as shown in Figure 18e. However, higher spindle speeds escalate specimen vibration frequency and exacerbate thermal effects, potentially causing significant deformation in the material surrounding the hole. This is also why there are more zones with strain greater than 1% around the hole drilled at the highest spindle speed of 18,000 rpm, depicted in Figure 19e.
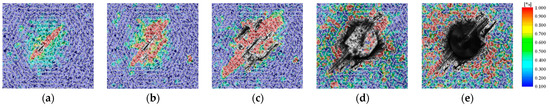
Figure 17.
The variation trend for the strain distribution on the exit side of the hole at a spindle speed of 5000 rpm and a feed rate of 240 mm/min during drilling: (a) Stage 1; (b) Stage 2; (c) Stage 3; (d) Stage 4; (e) Stage 5.
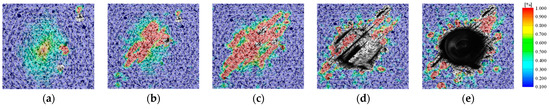
Figure 18.
The variation trend for the strain distribution on the exit side of the hole at a spindle speed of 12,000 rpm and a feed rate of 240 mm/min during drilling: (a) Stage 1; (b) Stage 2; (c) Stage 3; (d) Stage 4; (e) Stage 5.
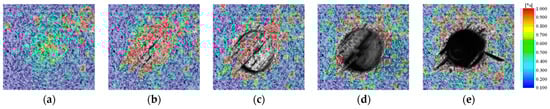
Figure 19.
The variation trend for the strain distribution on the exit side of the hole at a spindle speed of 18,000 rpm and a feed rate of 240 mm/min during drilling: (a) Stage 1; (b) Stage 2; (c) Stage 3; (d) Stage 4; (e) Stage 5.
The CT scan results for the above three holes are presented in Figure 20. The figure displays apparent delamination damage in the hole drilled with the cutting parameters of 5000 rpm and 240 mm/min, as well as in the hole drilled with the cutting parameters of 12,000 rpm and 240 mm/min. Both holes exhibit uneven defects along their walls, and the hole drilled with the cutting parameters of 5000 rpm and 240 mm/min displays a more severe condition. The delamination damage in the hole drilled with the cutting parameters of 18,000 rpm and 240 mm/min is not readily apparent, demonstrating good quality along the hole wall.
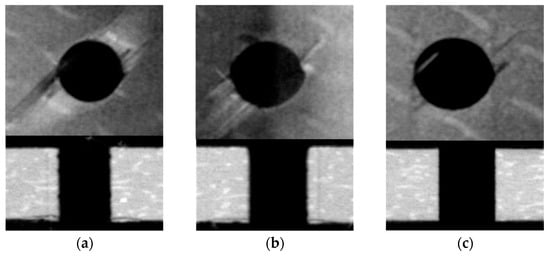
Figure 20.
CT scan images of the three holes in the second group. (a) The hole drilled at the spindle speed of 5000 rpm and the feed rate of 240 mm/min. (b) The hole drilled at the spindle speed of 12,000 rpm and the feed rate of 240 mm/min. (c) The hole drilled at the spindle speed of 18,000 rpm and the feed rate of 240 mm/min.
Based on the above DIC and CT results, the damage formation processes related to different cutting parameters can be deduced. The cutting edges of the brad-and-spur drill perform cutting and simultaneously push out the outermost material. Under suitable cutting parameters, the two flank cutting edges on both sides initially cut off the material along the hole’s edge. Then, the central cutting edges push the chips out. With higher feed rates, the thrust force increases, enhancing the ‘push-out’ effect. This can cause the cutting edges to push out the outermost layer or layers of material without completely cutting off the material at the hole’s edge, resulting in partial removal of the material. The material is separated in a ‘breaking’ way rather than a ‘cutting’ way, which finally results in damage. At lower spindle speeds, the chip-breaking ability of the cutting edges is reduced, weakening the ‘cutting’ effect. This indirectly amplifies the ‘push-out’ effect, contributing to the formation of damage.
The diameters measured by the three-coordinate measuring instrument are shown in Figure 21. Figure 21a illustrates the variation trend for hole diameter with feed rate while maintaining a constant spindle speed. Figure 21b illustrates the variation trend for hole diameter with spindle speed while keeping the feed rate constant. The dashed lines in the figures represent the nominal diameter of the drilling tool. It can be seen from the two figures that regardless of the increase in feed rate or spindle speed, the variation of diameter values remains relatively small. Additionally, the data tend to be more stable when the feed rate remains constant, indicating that the hole diameter values obtained within the selected cutting parameter range are satisfactory. The hole diameter obtained at the spindle speed of 8000 rpm and the feed rate of 100 mm/min is 4.179 mm, slightly smaller than the tool’s nominal diameter of 4.18 mm. This is because the elastic modulus of the resin matrix is relatively low. After drilling, the material rebounds, causing a shrinkage phenomenon resulting in a diameter less than the nominal diameter of the tool. The maximum hole diameter among all holes is 4.200 mm, obtained with the cutting parameters of 6000 rpm and 240 mm/min. The diameter deviation of this hole is 0.02 mm, indicating that the holes obtained within the selected cutting parameter range can attain an accuracy level of IT9, which proves the feasibility of the CFRP robotic drilling scheme.
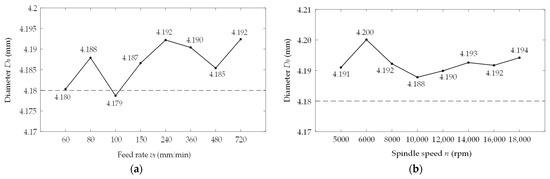
Figure 21.
Variation trends for hole diameter with cutting parameters. (a) The variation trend for hole diameter with feed rate. (b) The variation trend for hole diameter with spindle speed.
The damage evaluation factors are calculated using the calculation methods proposed in Section 2.2. The variation trends for the delamination factor with spindle speed and feed rate are depicted in Figure 22a,b. Figure 22a illustrates that the delamination factor increases as the feed rate rises while maintaining the spindle speed. At feed rates lower than 360 mm/min, the delamination factor exhibits a gradual growth trend. When the feed rate is higher than 360 mm/min, the delamination factor increases sharply. The delamination factor for the hole drilled at a feed rate of 60 mm/min is 0%, indicating that no apparent interlayer damage is observed in the axial direction of the hole. It is inferred that the hole only has intra-layer damage, without any delamination occurring. From Figure 22b, it can be seen that the delamination factor demonstrates an overall decreasing trend as the spindle speed rises under constant feed rate conditions. A comparison between the delamination factor’s variation trends from both figures suggests that higher spindle speeds and lower feed rates are more conducive to reducing delamination damage, and the influence of the feed rate on delamination is more evident than that of the spindle speed.
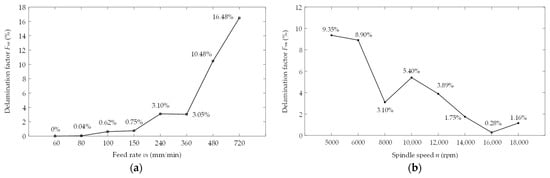
Figure 22.
Variation trends for the delamination factor with cutting parameters. (a) The variation trend for the delamination factor with feed rate. (b) The variation trend for the delamination factor with spindle speed.
Figure 23a and Figure 23b display the variation trends for the burr factor with feed rate and spindle speed, respectively. It is worth noting that the two figures do not reflect obvious variation rules for the burr factor with the cutting parameters. Although higher spindle speeds and lower feed rates appear to be advantageous for burr removal, an observation indicates a significant burr factor at the spindle speed of 18,000 rpm, while the minimum burr factor is observed at the highest feed rate of 720 mm/min. The impact of spindle speed and feed rate on burrs does not present an evident correlation, which contradicts the widely recognized conclusion that the severity of burrs caused by drilling primarily depends on the feed rate. Considering the distinct tools and materials utilized in various test scenarios within the articles, it is inferred that tool geometry, wear degree, and carbon fiber hardness are more influential factors in burr formation.
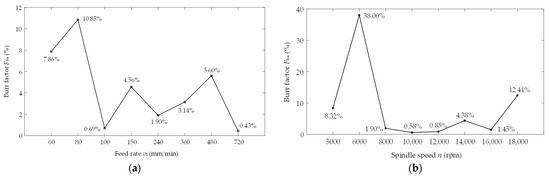
Figure 23.
Variation trends for the burr factor with cutting parameters. (a) The variation trend for the burr factor with feed rate. (b) The variation trend for the burr factor with spindle speed.
Figure 24a and Figure 24b show the variation trends for the tearing factor with feed rate and spindle speed, respectively. The trend observed in Figure 24a for the tearing factor with feed rate is similar to that of the delamination factor. A clear shift occurs at 360 mm/min as a demarcation point. At feed rates below 360 mm/min, the tearing factor shows a gradual increase with an increase in feed rate. When the feed rate is higher than 360 mm/min, the tearing factor increases sharply as the feed rate rises. Figure 24b displays a diminishing trend in the tearing factor with increasing spindle speed. A comparative analysis between the two figures highlights the more pronounced influence of the feed rate on tearing damage in contrast to spindle speed. The tearing factor at a 720 mm/min feed rate is 38 times that at a 60 mm/min feed rate, while the tearing factor at a 5000 rpm spindle speed is only four times that at an 18,000 rpm spindle speed.
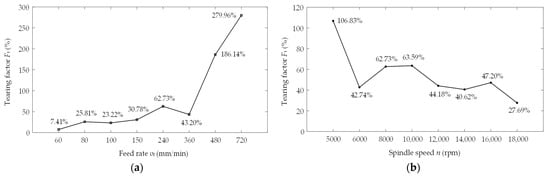
Figure 24.
Variation trends for the tearing factor with the cutting parameters. (a) The variation trend for the tearing factor with feed rate. (b) The variation trend for the tearing factor with spindle speed.
Figure 25a and Figure 25b depict the variation trends for the comprehensive damage factor with feed rate and spindle speed, respectively. Comparative analysis among Figure 22a, Figure 24a and Figure 25a reveals that the variation trend for the comprehensive damage factor with feed rate is highly consistent with those of the delamination factor and tearing factor with feed rate. Similarly, the comparison between Figure 21b and Figure 25b demonstrates that the variation trend for the comprehensive damage factor with spindle speed is highly consistent with that of the delamination factor. This observed consistency stems from the substantial contribution of delamination damage to the overall comprehensive damage factor. Moreover, the impacts of the feed rate on both the delamination and tearing factors are similar, thus reflected by a similar pattern in the superimposed comprehensive factor. Conversely, the burr factor, constituting a relatively minor proportion and being less affected by the feed rate, exhibits a negligible impact on the overall trend for the comprehensive damage factor. As a parameter reflecting the damage extent in three-dimensional drilling, a lower value of FC is preferable. Effectively mitigating drilling damage is achievable by increasing the spindle speed and reducing the feed rate, with a more pronounced effect noticed with the feed rate reduction. However, drilling at a very high speed with a low feed rate may result in severe thermal damage and impact processing efficiency. Therefore, the selection of appropriate cutting parameters ought to be tailored to actual damage tolerance and processing efficiency requirements.
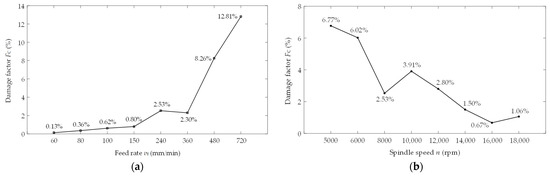
Figure 25.
Variation trends for the comprehensive damage factor with cutting parameters. (a) The variation trend for the comprehensive damage factor with feed rate. (b) The variation trend for the comprehensive damage factor with spindle speed.
In addition to the feed rate, the feed per tooth is also a commonly used cutting parameter in research, and the calculation equation is
where fz is the feed per tooth and z is the number of tool teeth. The feed rate was converted to feed per tooth to study its influence on the test results. Table 3 displays the relationship between the test results and feed per tooth, with feed per tooth values arranged in ascending order. The damage factor reflects the overall extent of damage to the hole, while the measured hole diameter value indicates the drilling accuracy. The variation trends for the hole diameter value and damage factor with feed per tooth are depicted in Figure 26 and Figure 27, respectively.
Table 3.
Relationship between the test results and feed per tooth.
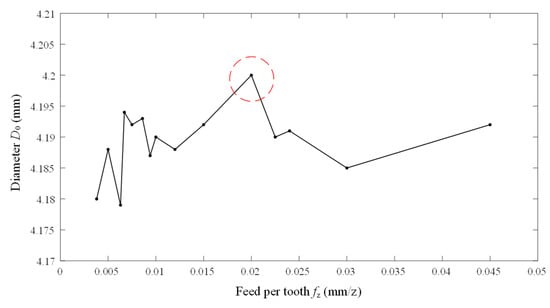
Figure 26.
Variation trend for the hole diameter with feed per tooth.
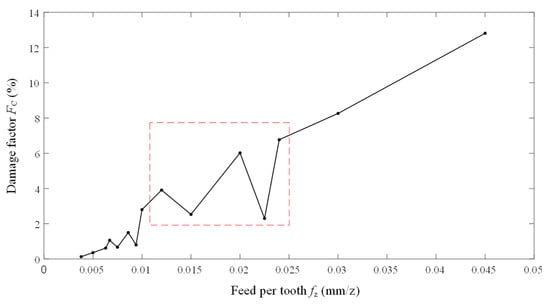
Figure 27.
Variation trend for the comprehensive damage factor with feed per tooth.
Figure 26 illustrates that as the feed per tooth increases, the hole diameter value exhibits minimal fluctuations within a small range. The red dashed circle encircles the hole exhibiting the most significant deviation in diameter. This hole was drilled with the cutting parameters of 0.02 mm/z and 6000 rpm. Upon comparison of the data in the table, it is evident that this particular hole exhibits prominent damage factors. However, a hole drilled under similar feed per tooth conditions of 0.0225 mm/z and a spindle speed of 8000 rpm demonstrates improved diameter accuracy and reduced damage. Increasing the spindle speed can enhance hole diameter accuracy under similar feed per tooth conditions.
Figure 27 illustrates that, as feed per tooth increases, the damage factor exhibits a steady rise, with a notable rapid increase occurring after feed per tooth surpasses 0.01 mm/z. The part enclosed by the dashed rectangular frame shows significant twists and fluctuations. Upon comparing the data in the table for these five holes (ranging from a feed per tooth of 0.012 to 0.024 mm/z), it is evident that the drill operating at 0.0225 mm/z and 8000 rpm yields better results than one operating at 0.012 mm/z and 10,000 rpm. Additionally, higher feed per tooth and a lower spindle speed (0.02 mm/z and 6000 rpm, 0.024 mm/z and 5000 rpm) lead to more detrimental damage outcomes. It is worth noting that although the spindle speed of 8000 rpm is highly advantageous for feed rates below 0.02 mm/z, the extent of hole damage escalates rapidly as the feed rate continues to increase. This observation aligns with the findings derived from analyzing the feed rate.
6. Conclusions
This paper studies the forms and characteristics of damage on the exit sides of holes caused by CFRP drilling. The paper analyzes the limitations of existing damage evaluation methods and proposes new evaluation methods for laminates consisting of common unidirectional prepreg layers. These methods include the three-dimensional delamination factor, two-dimensional burr factor, two-dimensional tearing factor, and comprehensive damage factor. These factors offer the advantages of high accuracy and simple and fast calculation, enabling comparison among drilled holes with different diameters and laminate thicknesses.
An industrial robot was used as the drilling equipment, and a brad-and-spur drill was used as the drilling tool to study the impact of cutting parameters on damage. The purpose was to explore suitable cutting parameters for robotic processing. DIC and industrial CT were used to analyze the formation process and forms of damage on the exit sides of the holes. The relevant conclusions are as follows.
- (1)
- The images captured by DIC reveal distinct characteristics in the strain distribution variation and damage formation process for the outermost material on the exit side of the hole under different cutting parameters. At lower feed rates, the strain distribution in the hole area presents a uniform circular shape before the tool completely penetrates the material. The material at the hole’s edge is removed after sufficient cutting by the tool, resulting in minimal or no noticeable damage. Higher feed rates intensify the tool’s push-out effect, leading to extensive material deformation beyond the hole. Prior to complete material penetration by the tool, the strain distribution exhibits a notably uneven and enlarged elliptical shape. In this scenario, the cutting edges push out the outermost layer or several layers without completely cutting off the material at the hole’s edge, resulting in severe damage. At lower spindle speeds, the lack of cutting capacity may result in more severe burrs. In addition, post-drilling, the material in a larger area outside the hole is deformed, but no damage has been formed. Considering their potential adverse impact on the hole strength, such outcomes should be avoided whenever possible.
- (2)
- Satisfactory hole diameter values were obtained within the selected cutting parameter range. The maximum deviation, for the hole diameter drilled with the cutting parameters of 6000 rpm and 240 mm/min, was 0.02 mm, which attains an accuracy level of IT9, proving the feasibility of the proposed CFRP robotic drilling methodology.
- (3)
- At feed rates below 360 mm/min, the delamination factor gradually increases as the feed rate rises. Once the feed rate exceeds 360 mm/min, the delamination factor increases sharply. Maintaining the spindle speed constant at 8000 rpm and increasing the feed rate from 60 mm/min to 720 mm/min results in a substantial 16.48% increase in the delamination factor. Conversely, the delamination factor decreases as the spindle speed rises. With a constant feed rate of 240 mm/min, the delamination factor reaches its minimum value at the spindle speed of 16,000 rpm, representing a 9.07% reduction compared to the maximum delamination factor at 5000 rpm.
- (4)
- The impacts of feed rate and spindle speed on the burr factor appear to be relatively insignificant, while the burr factor is more susceptible to the influence of tool geometry and wear degree. Maintaining a constant feed rate of 240 mm/min yields favorable burr factors within the spindle speed range from 8000 rpm to 12,000 rpm. With cutting parameters of 6000 rpm and 240 mm/min, the most severe burr damage is produced.
- (5)
- The variation trends for the tearing factor and comprehensive damage factor with feed rate are highly similar to that of the delamination factor with feed rate. When the spindle speed remains constant at 8000 rpm and the feed rate increases from 60 mm/min to 720 mm/min, the tearing and comprehensive damage factors increase by 272.55% and 12.68%, respectively. Both the tearing factor and comprehensive damage factor exhibit a decreasing trend with the increase in spindle speed. When increasing the spindle speed from 5000 rpm to 18,000 rpm, the tearing factor decreased by a maximum of 12.68%, and the damage factor decreased by a maximum of 4.24%. The impact of the feed rate on damage is more significant than that of spindle speed, indicating that increasing spindle speed while reducing the feed rate is advantageous in minimizing damage.
- (6)
- This paper recommends controlling the spindle speed of robotic drilling to higher than 8000 rpm, the feed rate to lower than 360 mm/min, and the feed per tooth to lower than 0.023 mm/z to prevent enormous drilling damage.
Author Contributions
Conceptualization, F.S. and Z.D.; methodology, F.S., Y.Y. and N.S.; software, C.Z.; validation, F.S., Z.D. and C.Z.; formal analysis, F.S., Y.Y. and D.Z.; investigation, F.S. and Y.Y.; resources, N.S. and Z.D.; data curation, F.S. and C.Z.; writing—original draft preparation, F.S.; writing—review and editing, Z.D. and D.Z.; visualization, C.Z.; supervision, N.S. and Y.Y.; project administration, Z.D.; funding acquisition, Z.D. All authors have read and agreed to the published version of the manuscript.
Funding
This research was funded by the National Natural Science Foundation of China, grant number 62133001.
Data Availability Statement
Data is contained within the article.
Conflicts of Interest
Authors are employed by the AVIC Manufacturing Technology Institute. The authors declare that the research was conducted in the absence of any commercial or financial relationships that could be construed as a potential conflict of interest.
References
- Composite Materials Technology Center of AVIC. Aeronautical Composite Technology; Aviation Industry Press: Beijing, China, 2013; pp. 1–45. [Google Scholar]
- Chen, Y.; Ge, E.; Fu, Y.; Su, H.; Xu, J. Review and prospect of drilling technologies for carbon fiber reinforced polymer. Acta Mater. Compos. Sin. 2015, 32, 301–316. [Google Scholar]
- Chen, M.; Xu, J.; An, Q. Machining Theory and Application Technologies for CFRP Composites and Multilayer Stacks; Shanghai Scientific & Technical Publishers: Shanghai, China, 2019; pp. 1–193. [Google Scholar]
- He, W. The Research on Drilling Technology of Carbon Fiber Composites for Robo. Master’s Thesis, Dalian University of Technology, Dalian, China, 2021. [Google Scholar]
- Sorrentino, L.; Turchetta, S.; Bellini, C. A new method to reduce delaminations during drilling of FRP laminates by feed rate control. Compos. Struct. 2018, 186, 154–164. [Google Scholar] [CrossRef]
- Wang, H.; Chen, G. Research progress and perspective of robotic equipment applied in aviation assembly. Acta Aeronaut. Astronaut. Sin. 2022, 43, 41–63. [Google Scholar]
- Zhu, Z.; Tang, X.; Chen, C.; Peng, F.; Yan, R.; Zhou, L.; Li, Z.; Wu, J. High precision and efficiency robotic milling of complex parts: Challenges, approaches and trends. Chin. J. Aeronaut. 2022, 35, 22–46. [Google Scholar] [CrossRef]
- Dong, S.; Zheng, K.; Meng, D.; Liao, W.; Sun, L. Robotic drilling of large complex components: A review. Acta Aeronaut. Astronaut. Sin. 2022, 43, 627133. [Google Scholar]
- Geng, D.; Liu, Y.; Shao, Z.; Lu, Z.; Cai, J.; Li, X.; Jiang, X.; Zhang, D. Delamination formation, evaluation and suppression during drilling of composite laminates: A review. Compos. Struct. 2019, 216, 168–186. [Google Scholar] [CrossRef]
- Stone, R.; Krishnamurthy, K. A neural network thrust force controller to minimize delamination during drilling of graphite-epoxy laminates. Int. J. Mach. Tools Manuf. 1995, 36, 985–1003. [Google Scholar] [CrossRef]
- Xu, J.; Geier, N.; Shen, J.; Krishnaraj, V.; Samsudeensadham, S. A review on CFRP drilling: Fundamental mechanisms, damage issues, and approaches toward high-quality drilling. J. Mater. Res. Technol. 2023, 24, 9677–9707. [Google Scholar] [CrossRef]
- Liu, S.; Xia, W.; Wang, N.; Song, Y.; Luo, B.; Zhang, K. Multi-objective drilling parameters optimization method for CFRP/Ti stack. J. Mech. Eng. 2020, 56, 193–203. [Google Scholar]
- Park, K.; Kurniawan, R.; Yu, Z.; Ko, T.J. Evaluation of a hybrid cryogenic deburring method to remove uncut fibers on carbon fiber-reinforced plastic composites. Int. J. Adv. Manuf. Technol. 2019, 101, 1509–1523. [Google Scholar] [CrossRef]
- Wen, Q.; Guo, D.; Gao, H.; Zhao, D. Comprehensive evaluation method for carbon/epoxy composite hole-making damages. Acta Mater. Compos. Sin. 2016, 33, 265–272. [Google Scholar]
- Poor, D.I.; Geier, N.; Pereszlai, C.; Xu, J. A critical review of the drilling of CFRP composites: Burr formation, characterisation and challenges. Compos. Part B. Eng. 2021, 223, 109155.1–109155.17. [Google Scholar] [CrossRef]
- Kim, J.; Kim, Y.B.; Seo, J.W.; Park, H.W. Deburring drilled holes in CFRP composites with large pulsed electron beam (LPEB) irradiation. J. Manuf. Process. 2019, 40, 68–75. [Google Scholar] [CrossRef]
- Zadafiya, K.; Bandhu, D.; Kumari, S.; Chatterjee, S.; Abhishek, K. Recent trends in drilling of carbon fiber reinforced polymers (CFRPs): A state-of-the-art review. J. Manuf. Process. 2021, 69, 47–68. [Google Scholar] [CrossRef]
- Chen, W.C. Some experimental investigations in the drilling of carbon fiber-reinforced plastic (CFRP) composite laminates. Int. J. Mach. Tools Manuf. 1997, 37, 1097–1108. [Google Scholar] [CrossRef]
- Faraz, A.; Biermann, D.; Weinert, K. Cutting edge rounding: An innovative tool wear criterion in drilling CFRP composite laminates. Int. J. Mach. Tools Manuf. 2009, 49, 1185–1196. [Google Scholar] [CrossRef]
- Mohan, N.S.; Kulkarni, S.M.; Ramachandra, A. Delamination analysis in drilling process of glass fiber reinforced plastic (GFRP) composite materials. J. Mater. Process. Tech 2007, 186, 265–271. [Google Scholar] [CrossRef]
- Davim, J.P.; Rubio, J.C.; Abrao, A.M. A novel approach based on digital image analysis to evaluate the delamination factor after drilling composite laminates. Compos. Sci. Technol. 2007, 67, 1939–1945. [Google Scholar] [CrossRef]
- Tsao, C.C.; Kuo, K.L.; Hsu, I.C. Evaluation of a novel approach to a delamination factor after drilling composite laminates using a core–saw drill. Int. J. Adv. Manuf. Technol. 2012, 59, 617–622. [Google Scholar] [CrossRef]
- Nagarajan, V.A.; Selwin Rajadurai, J.; Annil Kumar, T. A digital image analysis to evaluate delamination factor for wind turbine composite laminate blade. Composites 2012, 43, 3153–3159. [Google Scholar] [CrossRef]
- Babu, J.; Alex, N.P.; Mohan, K.P.; Philip, J.; Davimet, J.P. Examination and modification of equivalent delamination factor for assessment of high speed drilling. J. Mech. Sci. Technol. 2016, 30, 5159–5165. [Google Scholar] [CrossRef]
- Al-Wandi, S.; Ding, S.; Mo, J. An approach to evaluate delamination factor when drilling carbon fiber-reinforced plastics using different drill geometries: Experiment and finite element study. Int. J. Adv. Manuf. Technol. 2017, 93, 4043–4061. [Google Scholar] [CrossRef]
- Wang, C.; Qiu, K.; Chen, M.; Cai, X. Machinability of drilling T700/LT-03A carbon fiber reinforced plastic (CFRP) composite laminates using candle stick drill and multi-facet drill. Int. J. Mod. Phys. B 2015, 29, 1540031. [Google Scholar] [CrossRef]
- Xu, J.; Li, C.; Mi, S.; An, Q.; Chen, M. Study of drilling-induced defects for CFRP composites using new criteria. Compos. Struct. 2018, 201, 1076–1087. [Google Scholar] [CrossRef]
- Pereszlai, C.; Geier, N. Comparative analysis of wobble milling, helical milling and conventional drilling of CFRPs. Int. J. Adv. Manuf. Technol. 2020, 106, 3913–3930. [Google Scholar] [CrossRef]
- Voß, R.; Henerichs, M.; Rupp, S.; Kuster, F.; Wegener, K. Evaluation of bore exit quality for fibre reinforced plastics including delamination and uncut fibres. Cirp J. Manuf. Sci. Technol. 2016, 12, 56–66. [Google Scholar] [CrossRef]
- Xu, J.; An, Q.; Cai, X.; Chen, M. Drilling machinability evaluation on new developed high-strength T800S/250F CFRP laminates. Int. J. Precis. Eng. Manuf. 2013, 14, 1687–1696. [Google Scholar] [CrossRef]
- Tian, W.; Jiao, J.; Li, B.; Cui, G. High precision robot operation equipment and technology in aerospace manufacturing. J. Nanjing Univ. Aeronaut. Astronaut. 2020, 52, 341–352. [Google Scholar]
- Xiao, Z.; Wu, L.; Qiu, X.; Ke, X.; Cai, L. Application progress of digital image correlation in composite materials research. Phys. Test. Chem. Anal. (Part A Phys. Test.) 2021, 57, 39–49. [Google Scholar]
- Wang, Y.; Zhu, Y.; Gao, Q.; Wang, H. Position and pose measurement of spatial object based on digital image correlation. Acta Opt. Sin. 2022, 42, 121–129. [Google Scholar]
- Dong, Q. Research on Micro Displacement Measurement Base on Digital Image Cprrelation Method. Master’s Thesis, Southwest Jiaotong University, Chengdu, China, 2019. [Google Scholar]
- Liu, J. Defect detection research of industrial CT images. Mach. Des. Manuf. 2020, 9, 118–121. [Google Scholar]
- Yang, H.; Tan, C.; Sheng, J.; Si, L.; Duan, L. Form and position error analysis of inner and outer surface of parts based on the industrial CT. Chin. J. Sci. Instrum. 2021, 42, 230–238. [Google Scholar]
- Melentiev, R.; Priarone, P.C.; Robiglio, M.; Settineri, L. Effects of tool geometry and process parameters on delamination in CFRP drilling: An overview. Procedia CIRP 2016, 45, 31–34. [Google Scholar] [CrossRef]
- Davim, J.P.; Reis, P. Study of delamination in drilling carbon fiber reinforced plastics (CFRP) using design experiments. Compos. Struct. 2003, 59, 481–487. [Google Scholar] [CrossRef]
- Ameur, M.F.; Habak, M.; Kenane, M.; Aouici, H.; Cheikh, M. Machinability analysis of dry drilling of carbon/epoxy composites: Cases of exit delamination and cylindricity error. Int. J. Adv. Manuf. Technol. 2016, 88, 2557–2571. [Google Scholar] [CrossRef]
- Montoya, M.; Calamaz, M.; Gehin, D.; Girot, F. Evaluation of the performance of coated and uncoated carbide tools in drilling thick CFRP/aluminium alloy stacks. Int. J. Adv. Manuf. Technol. 2013, 68, 2111–2120. [Google Scholar] [CrossRef]
- Pinho, L.; Carou, D.; Davim, J. Comparative study of the performance of diamond-coated drills on the delamination in drilling of carbon fiber reinforced plastics: Assessing the influence of the temperature of the drill. J. Compos. Mater. 2016, 50, 3409–3417. [Google Scholar] [CrossRef]
- Iliescu, D.; Gehin, D.; Gutierrez, M.E.; Girot, F. Modeling and tool wear in drilling of CFRP. Int. J. Mach. Tools Manuf. 2010, 50, 204–213. [Google Scholar] [CrossRef]
- Hrechuk, A.; Bushlya, V.; M’Saoubi, R.; Ståhl, J. Experimental investigations into tool wear of drilling CFRP. Procedia Manuf. 2018, 25, 294–301. [Google Scholar] [CrossRef]
- Hocheng, H.; Tsao, C.C. Effects of special drill bits on drilling-induced delamination of composite materials. Int. J. Mach. Tools Manuf. 2006, 46, 1403–1416. [Google Scholar] [CrossRef]
- Durão, L.M.P.; Goncalves, D.J.S.; Tavares, J.M.R.S.; Albuquerque, V.H.C.; Vieira, A.A.; Marques, A.T. Drilling tool geometry evaluation for reinforced composite laminates. Compos. Struct. 2010, 92, 1545–1550. [Google Scholar] [CrossRef]
- Othman, A.R.; Hassan, M.H.; Bakar, E.A.; Othman, W.A.F.W. Statistical Analysis of the Machining Parameters in Drilling of Carbon Fibre Reinforced Plastics (CFRP) Composite with Various Drill Types. In Intelligent Manufacturing & Mechatronics; Springer: Singapore, 2018. [Google Scholar]
- Xu, J.; Li, C.; Chen, M.; Mansori, M.E.; Ren, F. An investigation of drilling high-strength CFRP composites using specialized drills. Int. J. Adv. Manuf. Technol. 2019, 103, 3425–3442. [Google Scholar] [CrossRef]
- Su, F.; Zheng, L.; Sun, F.; Wang, Z.; Deng, Z.; Qiu, X. Novel drill bit based on the step-control scheme for reducing the CFRP delamination. J. Mater. Process. Tech. 2018, 262, 157–167. [Google Scholar] [CrossRef]
Disclaimer/Publisher’s Note: The statements, opinions and data contained in all publications are solely those of the individual author(s) and contributor(s) and not of MDPI and/or the editor(s). MDPI and/or the editor(s) disclaim responsibility for any injury to people or property resulting from any ideas, methods, instructions or products referred to in the content. |
© 2023 by the authors. Licensee MDPI, Basel, Switzerland. This article is an open access article distributed under the terms and conditions of the Creative Commons Attribution (CC BY) license (https://creativecommons.org/licenses/by/4.0/).