

Research on Cutting Edge form Factor of Milling Tool after Drag Finishing Preparation Based on Discrete Element Method


Abstract
:1. Introduction
2. Removal Mechanism Analysis of Abrasive Finishing Materials
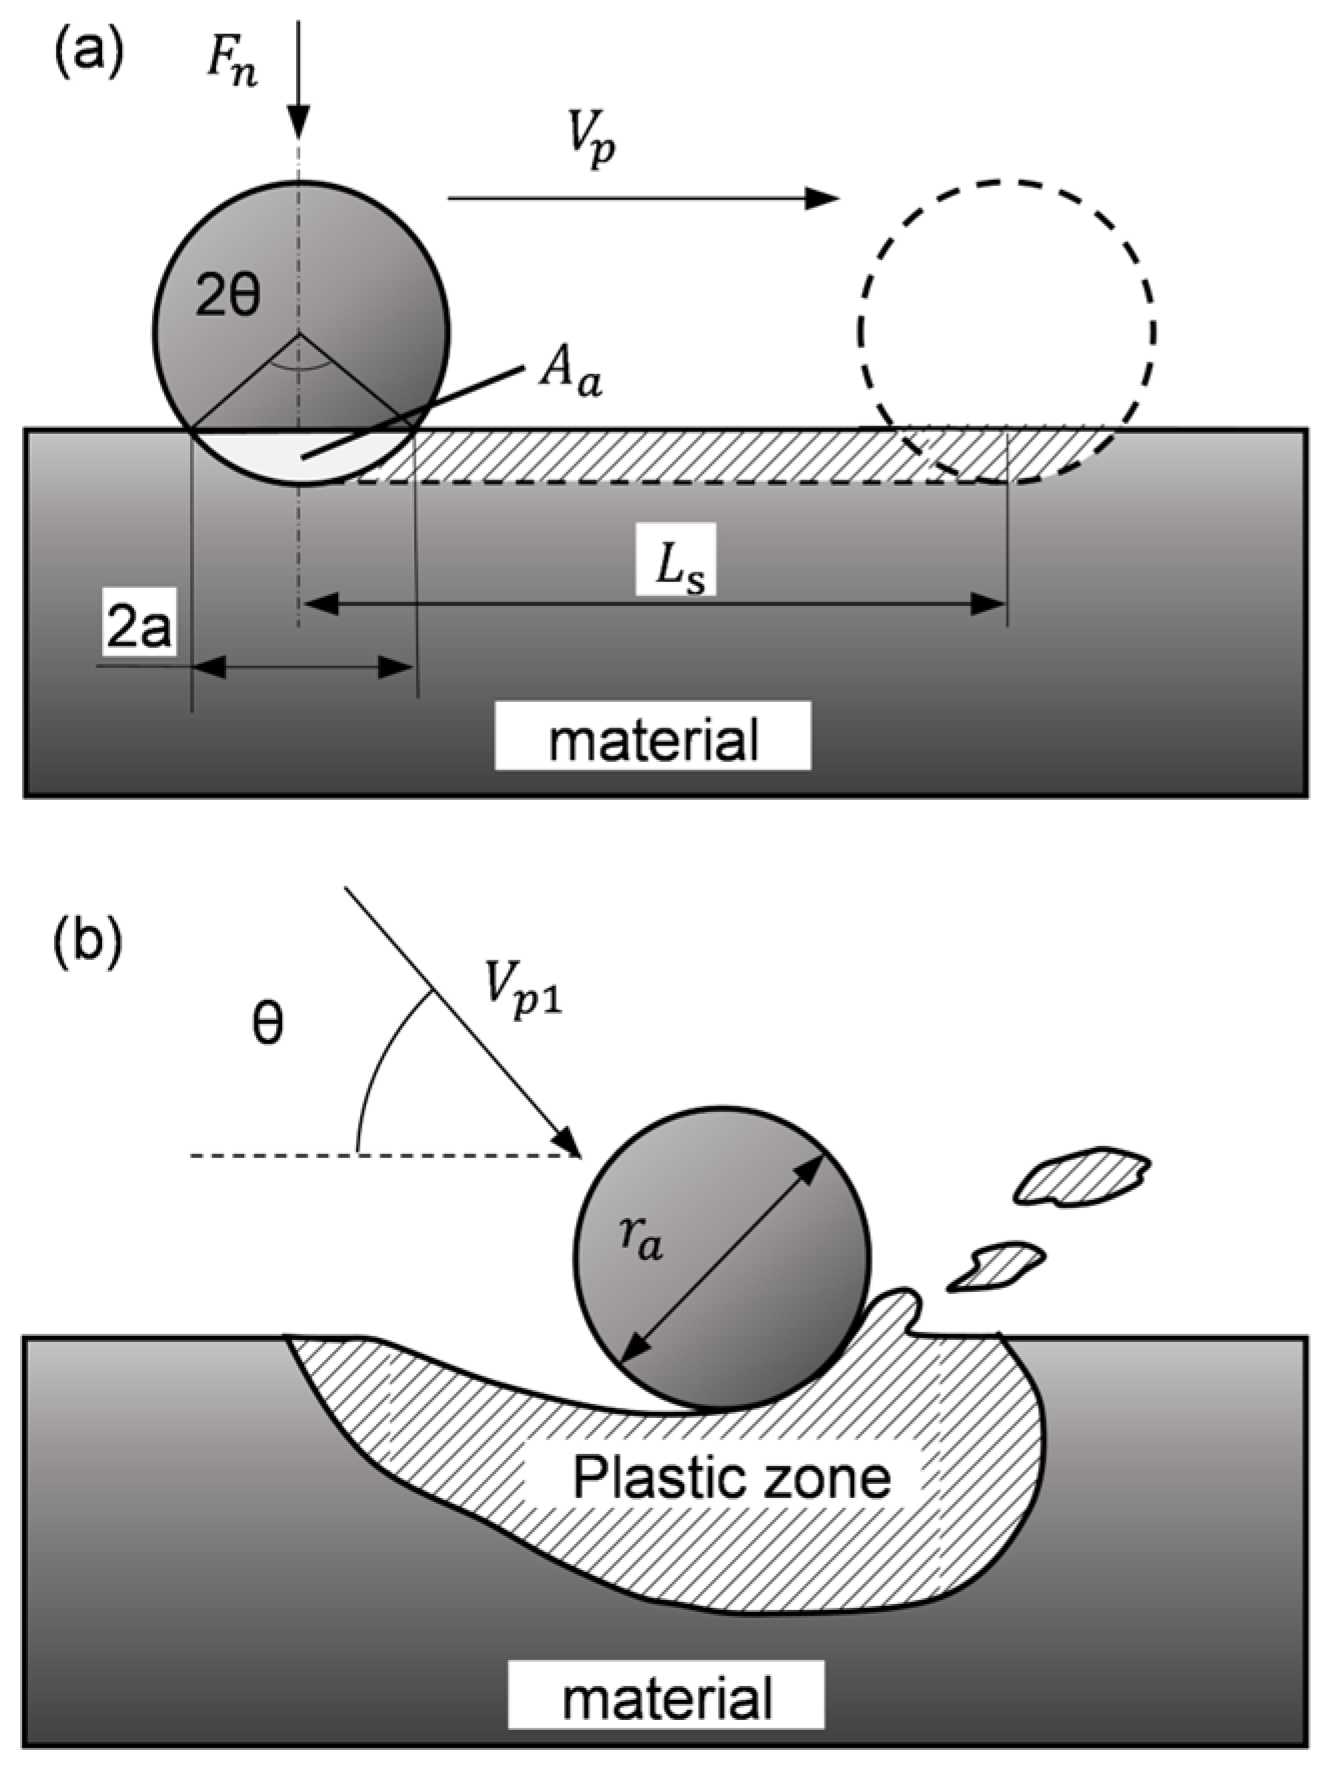
2.1. Material Removal Model of Abrasive Wear
- The size and material of abrasive grains as well as the applied load are all identical.
- The surface material of the tool is uniform and can be treated as a smooth curve.
- Ignore the deformation of abrasive particles during wear.
2.2. Material Removal Model of Impact Erosion Wear
- The influence of plastic deformation and cyclic residual stress can be ignored under low velocity erosion conditions.
- Ignore the energy and heat loss of abrasive particles when they impact the material.
- The whole process of stress fatigue erosion is irreversible deformation.
3. DEM Simulation and Experiment of Tool Edge Preparation
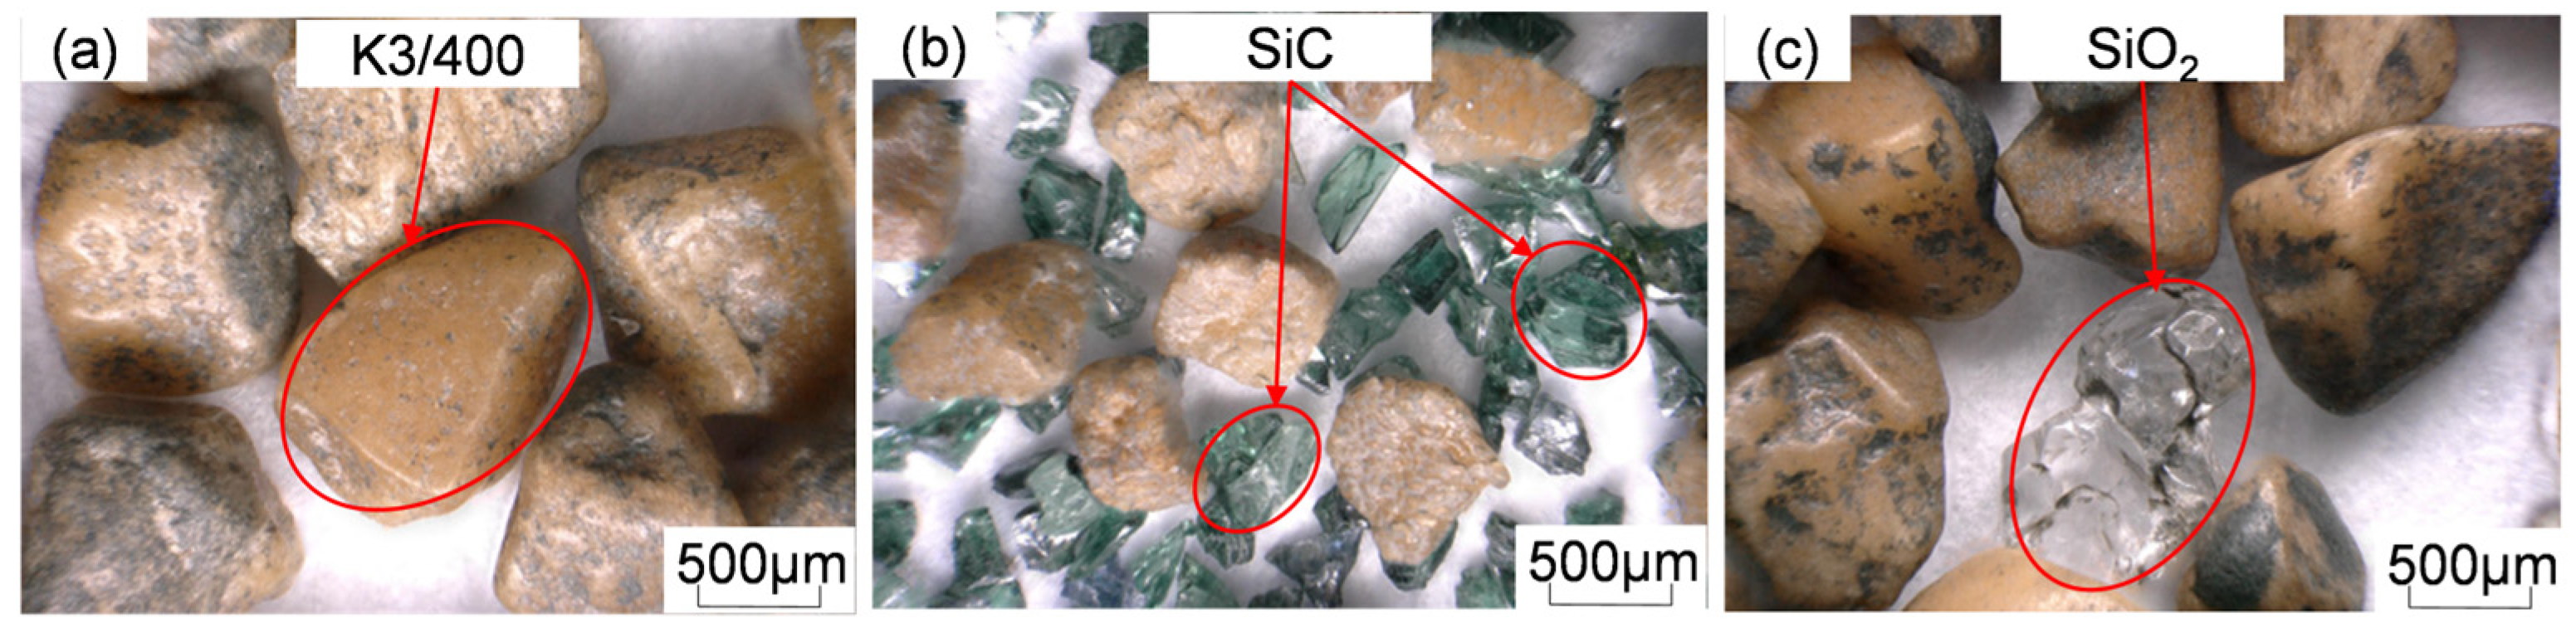
3.1. Abrasive and Milling Tool
3.2. Discrete Element Model Setup
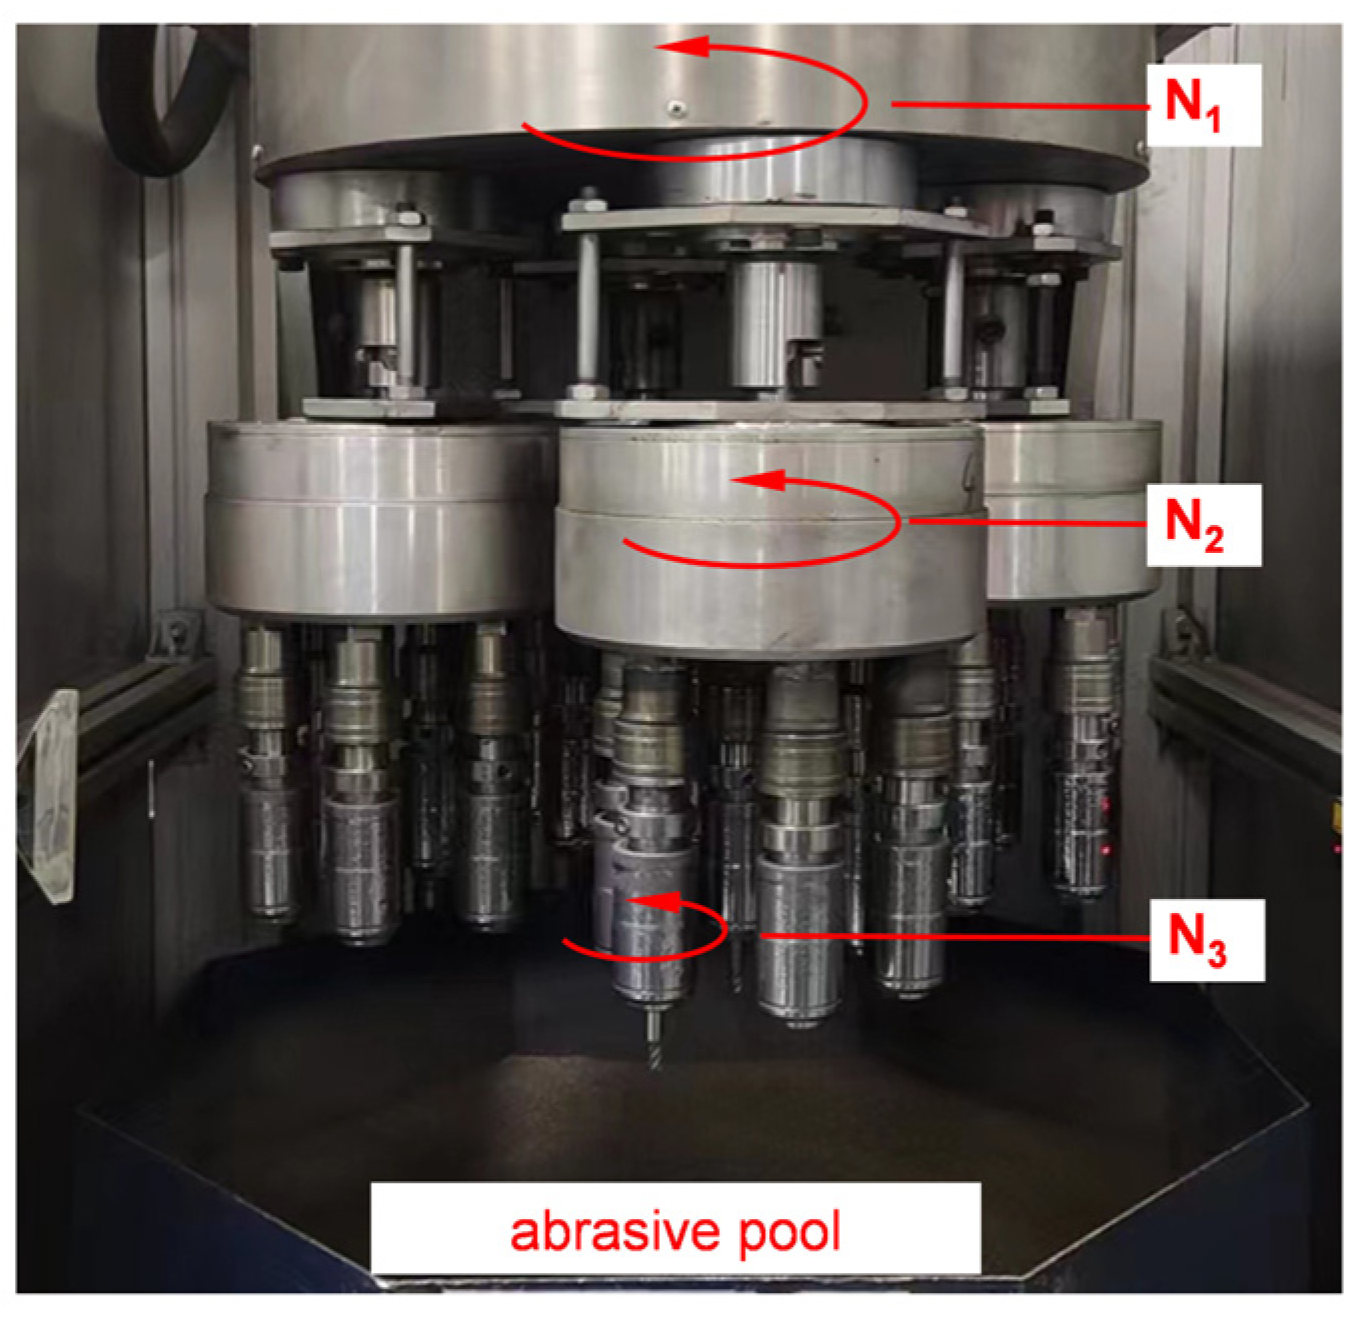
3.3. DF Experiment Settings
4. Discussion
4.1. Results of Simulation and Taguchi Experiment
4.2. Analysis of Variance
5. Conclusions
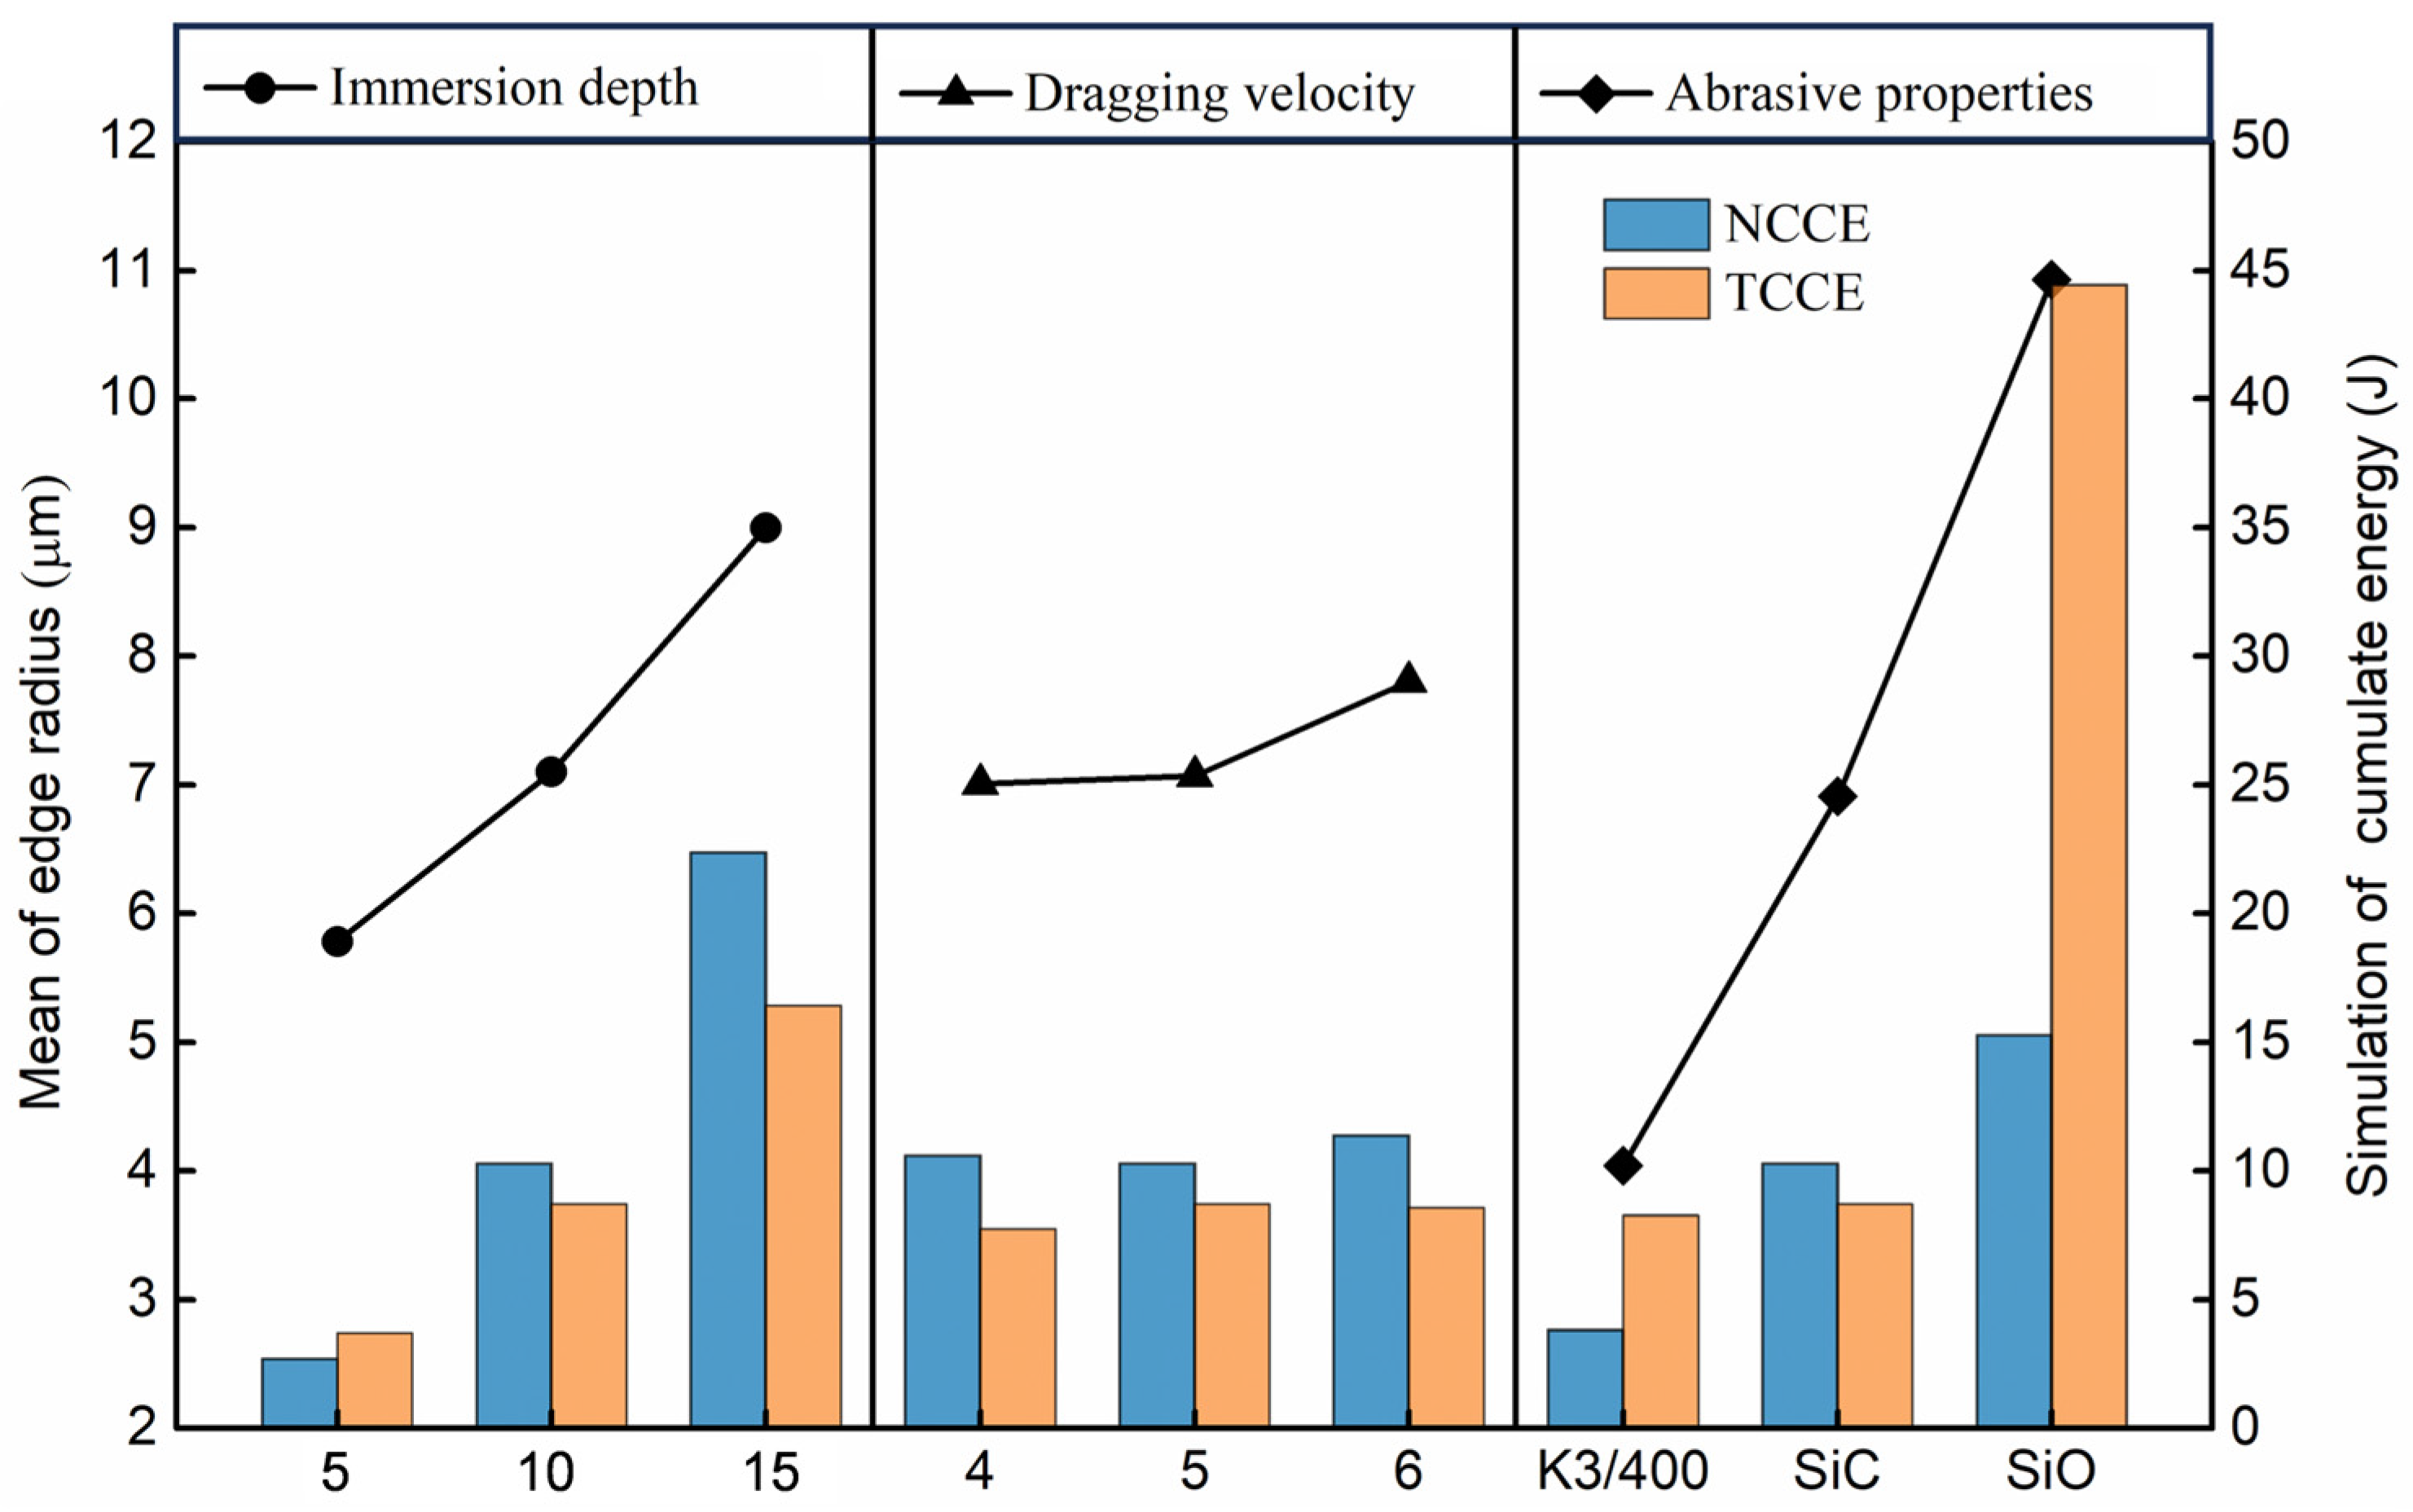
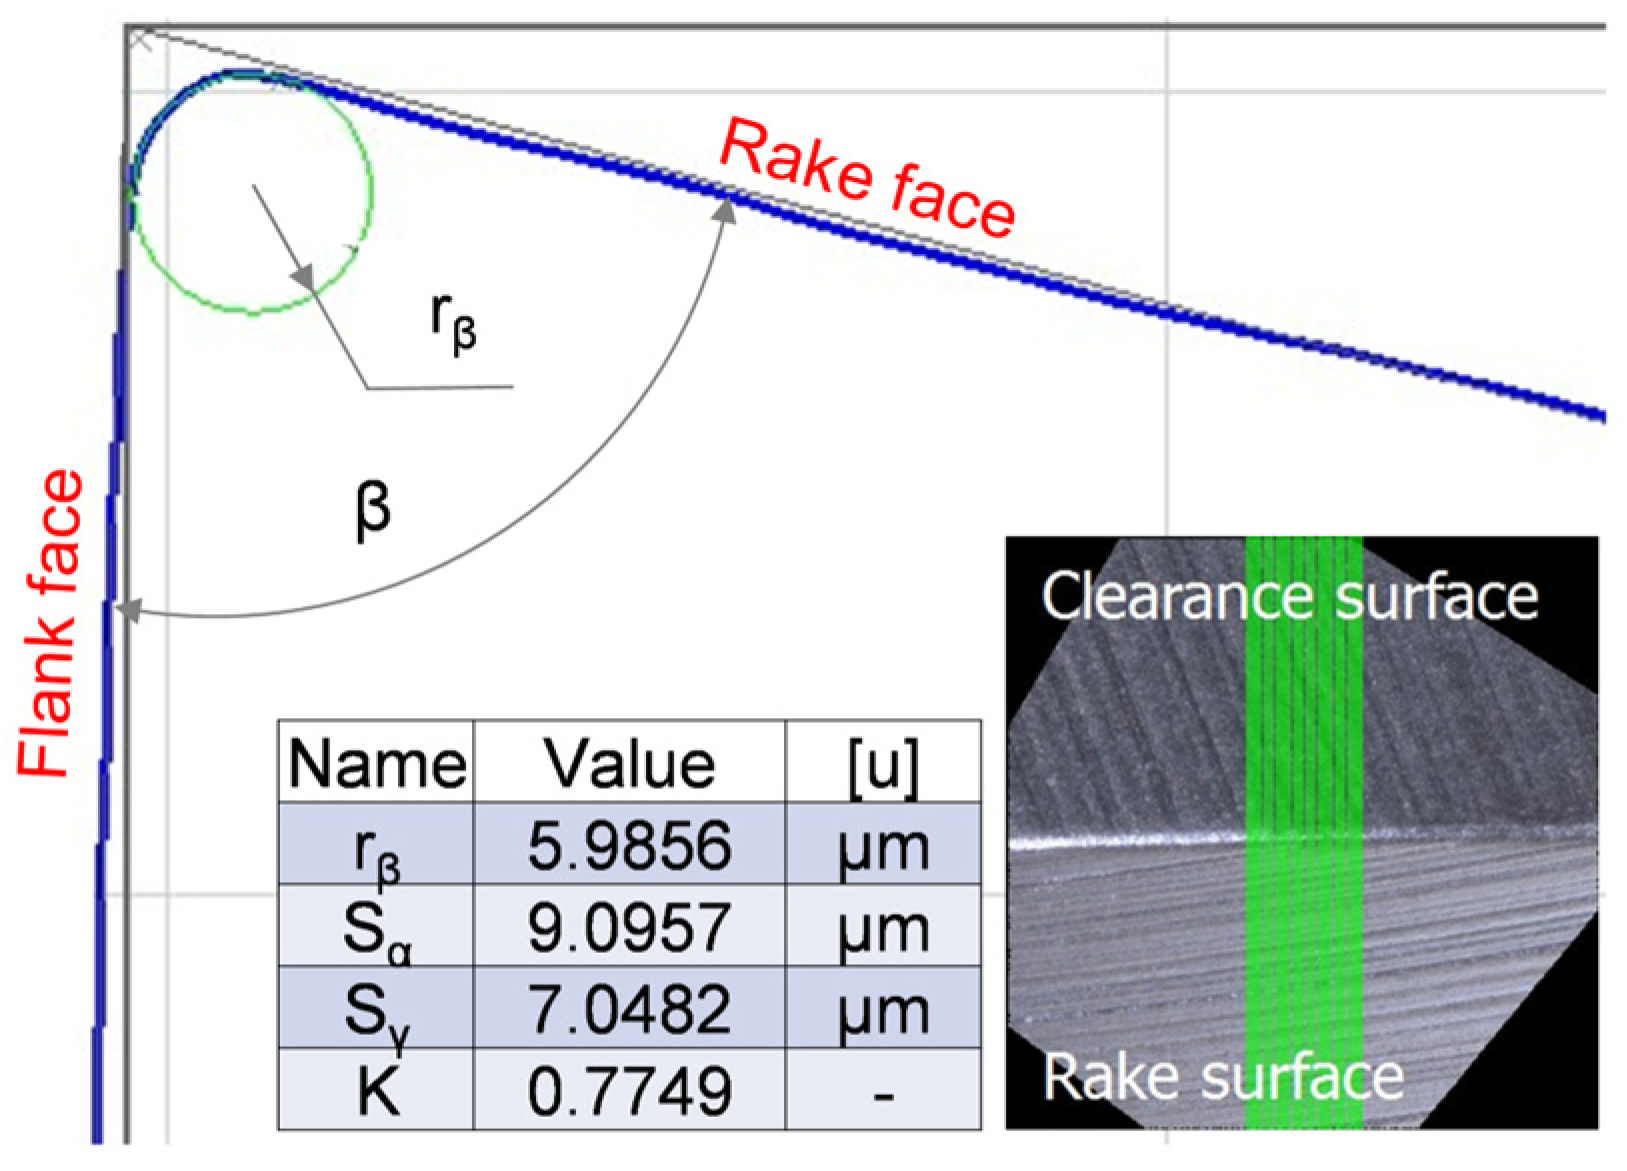
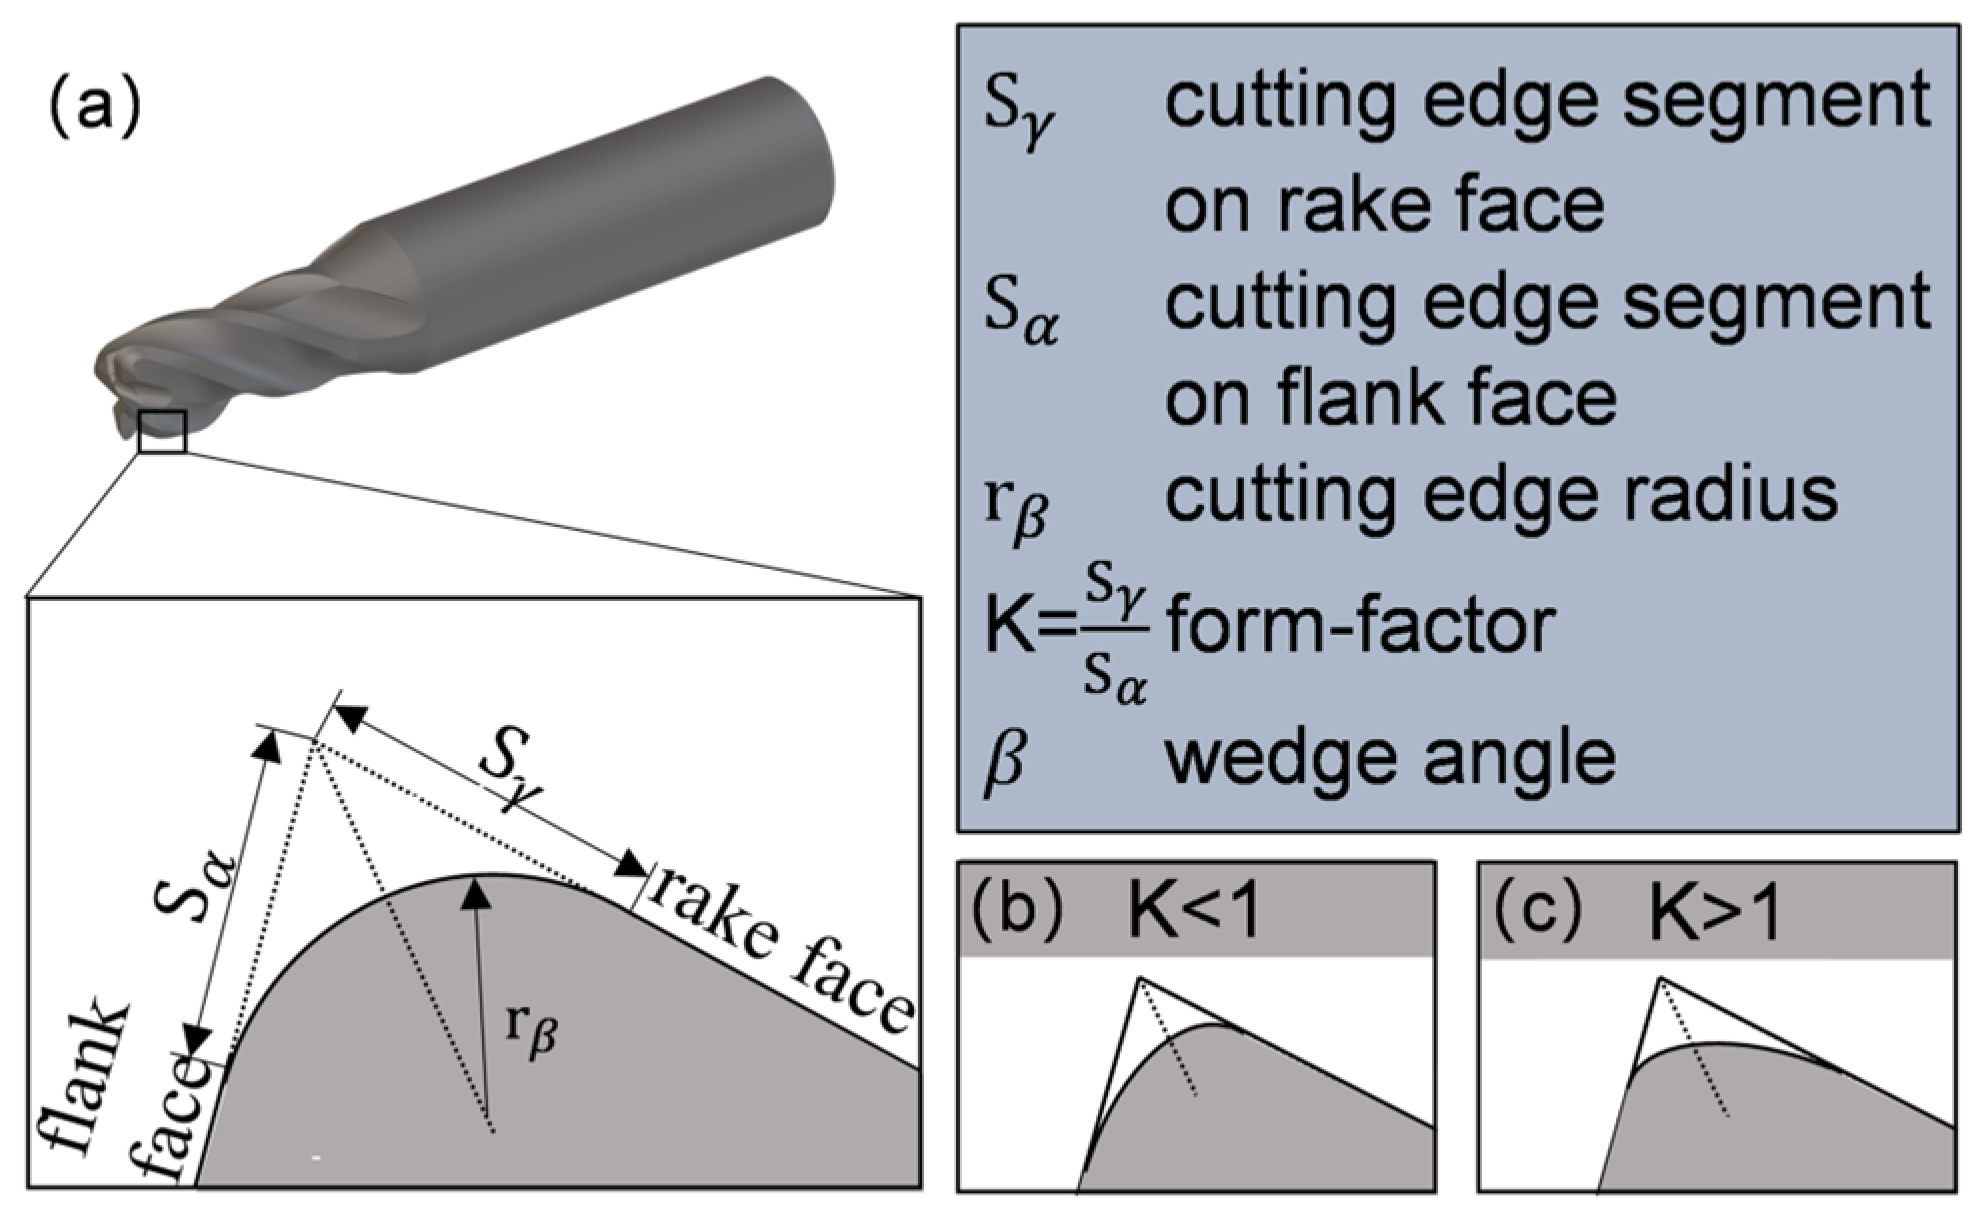
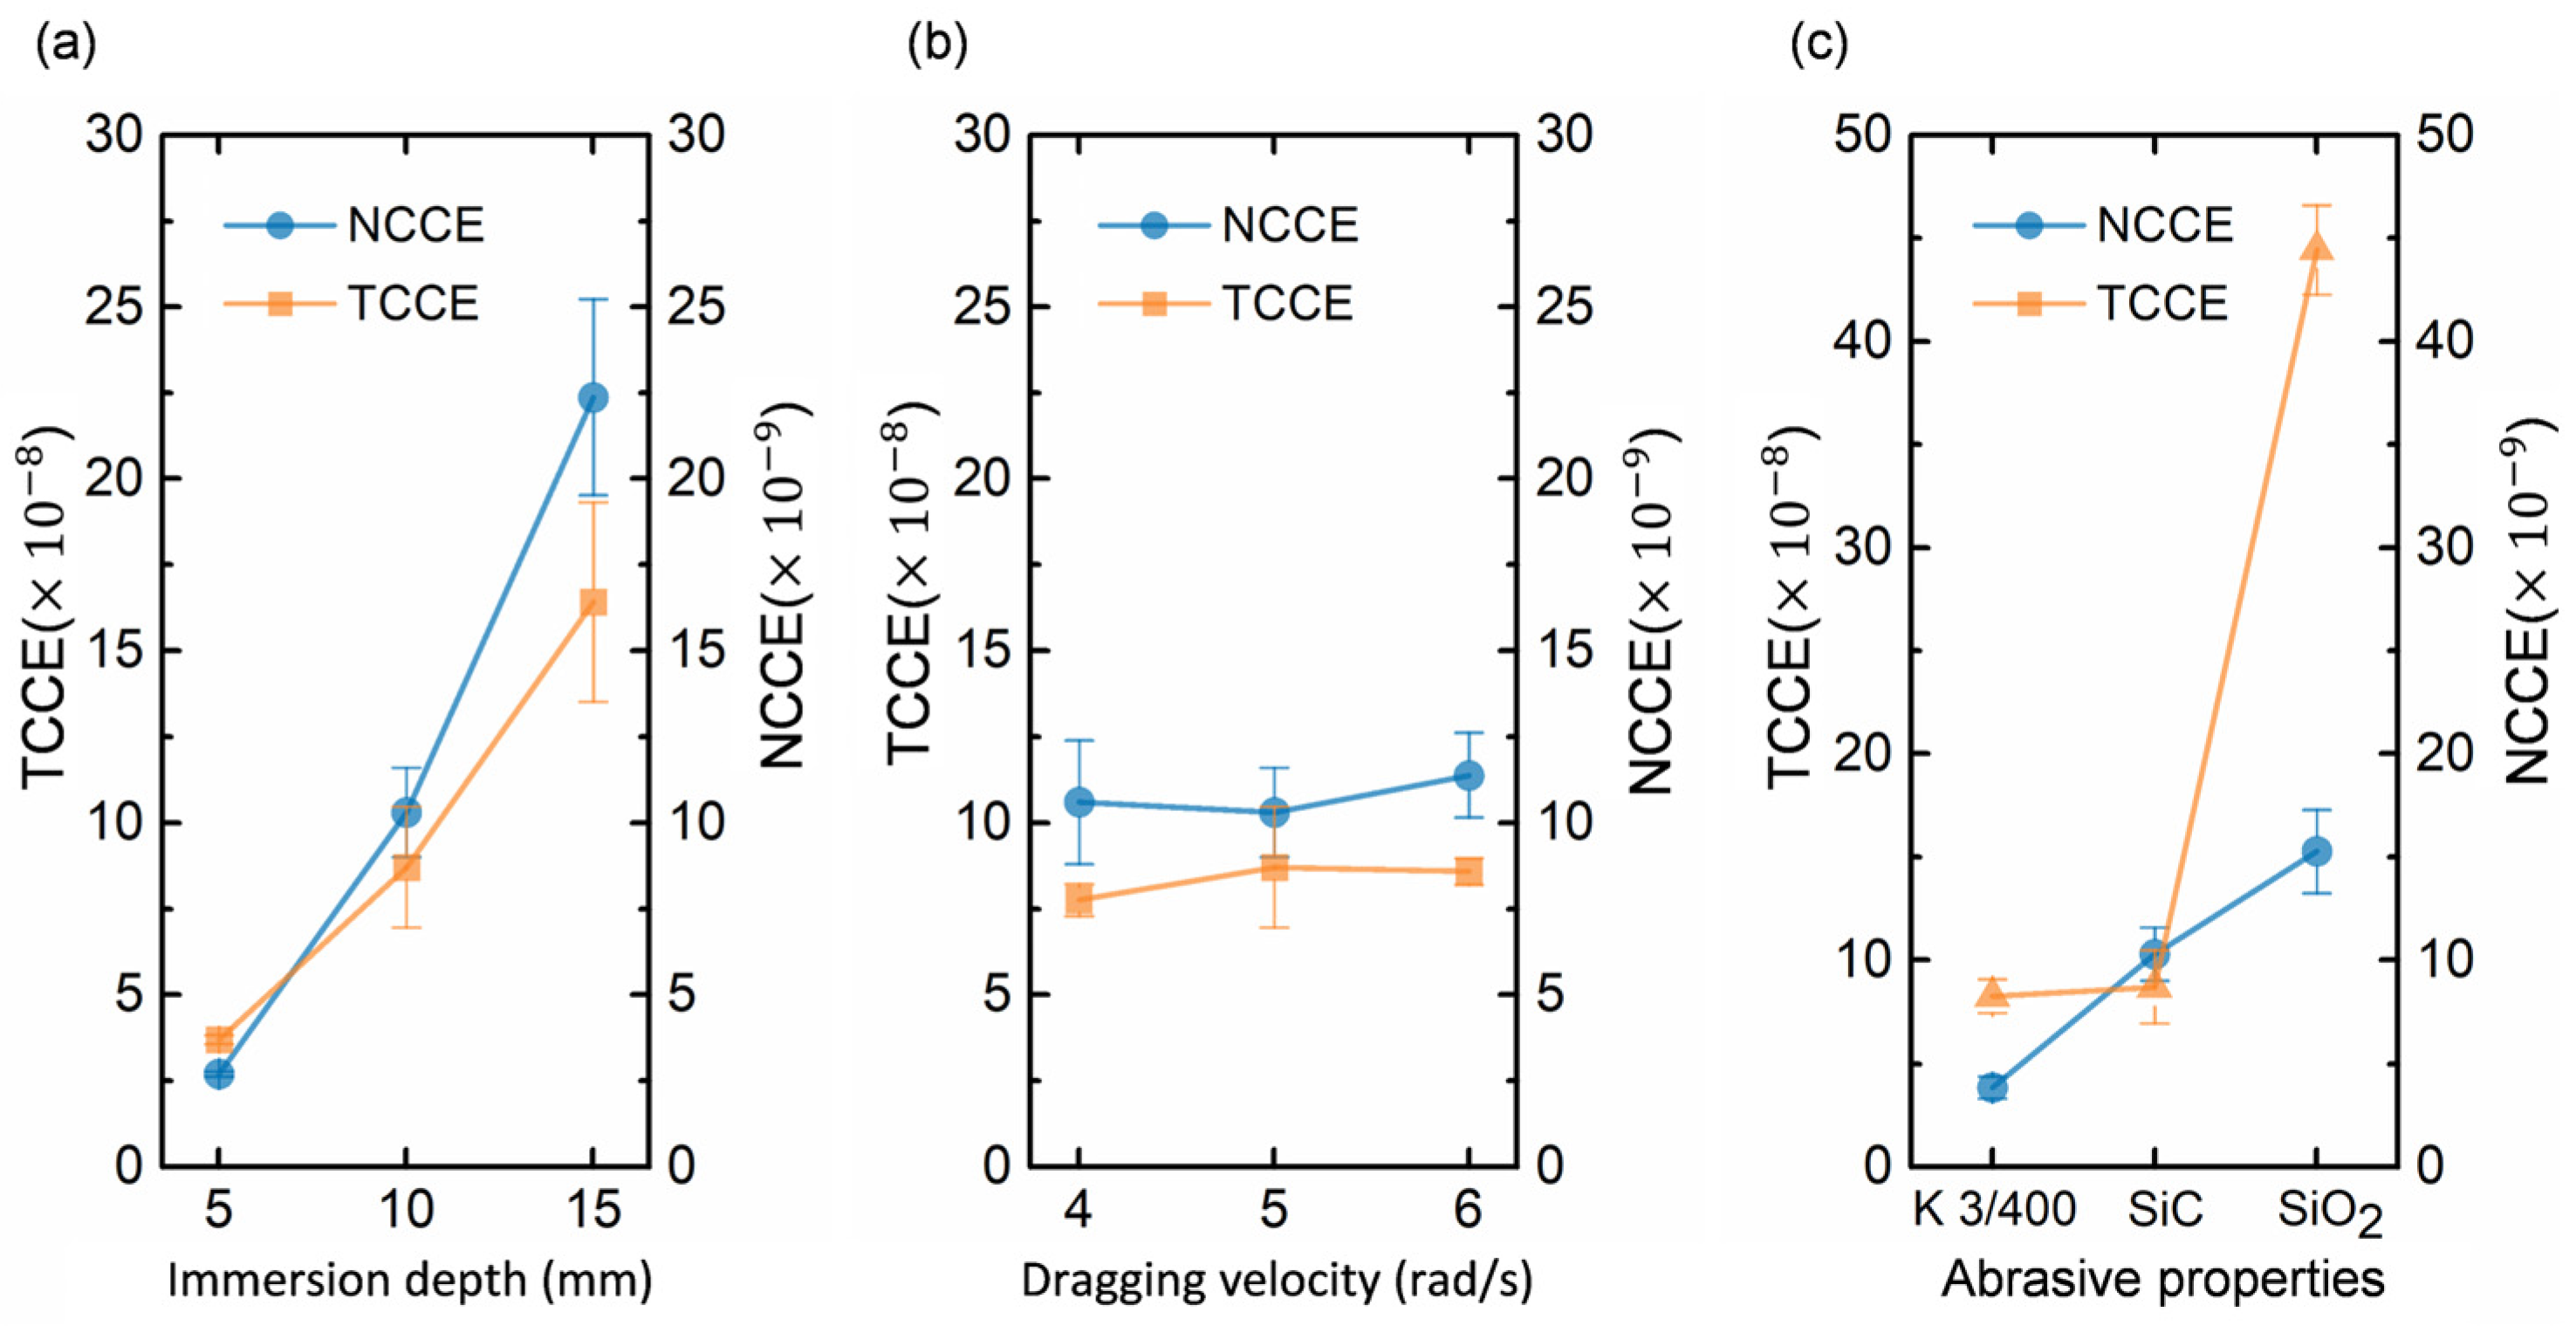
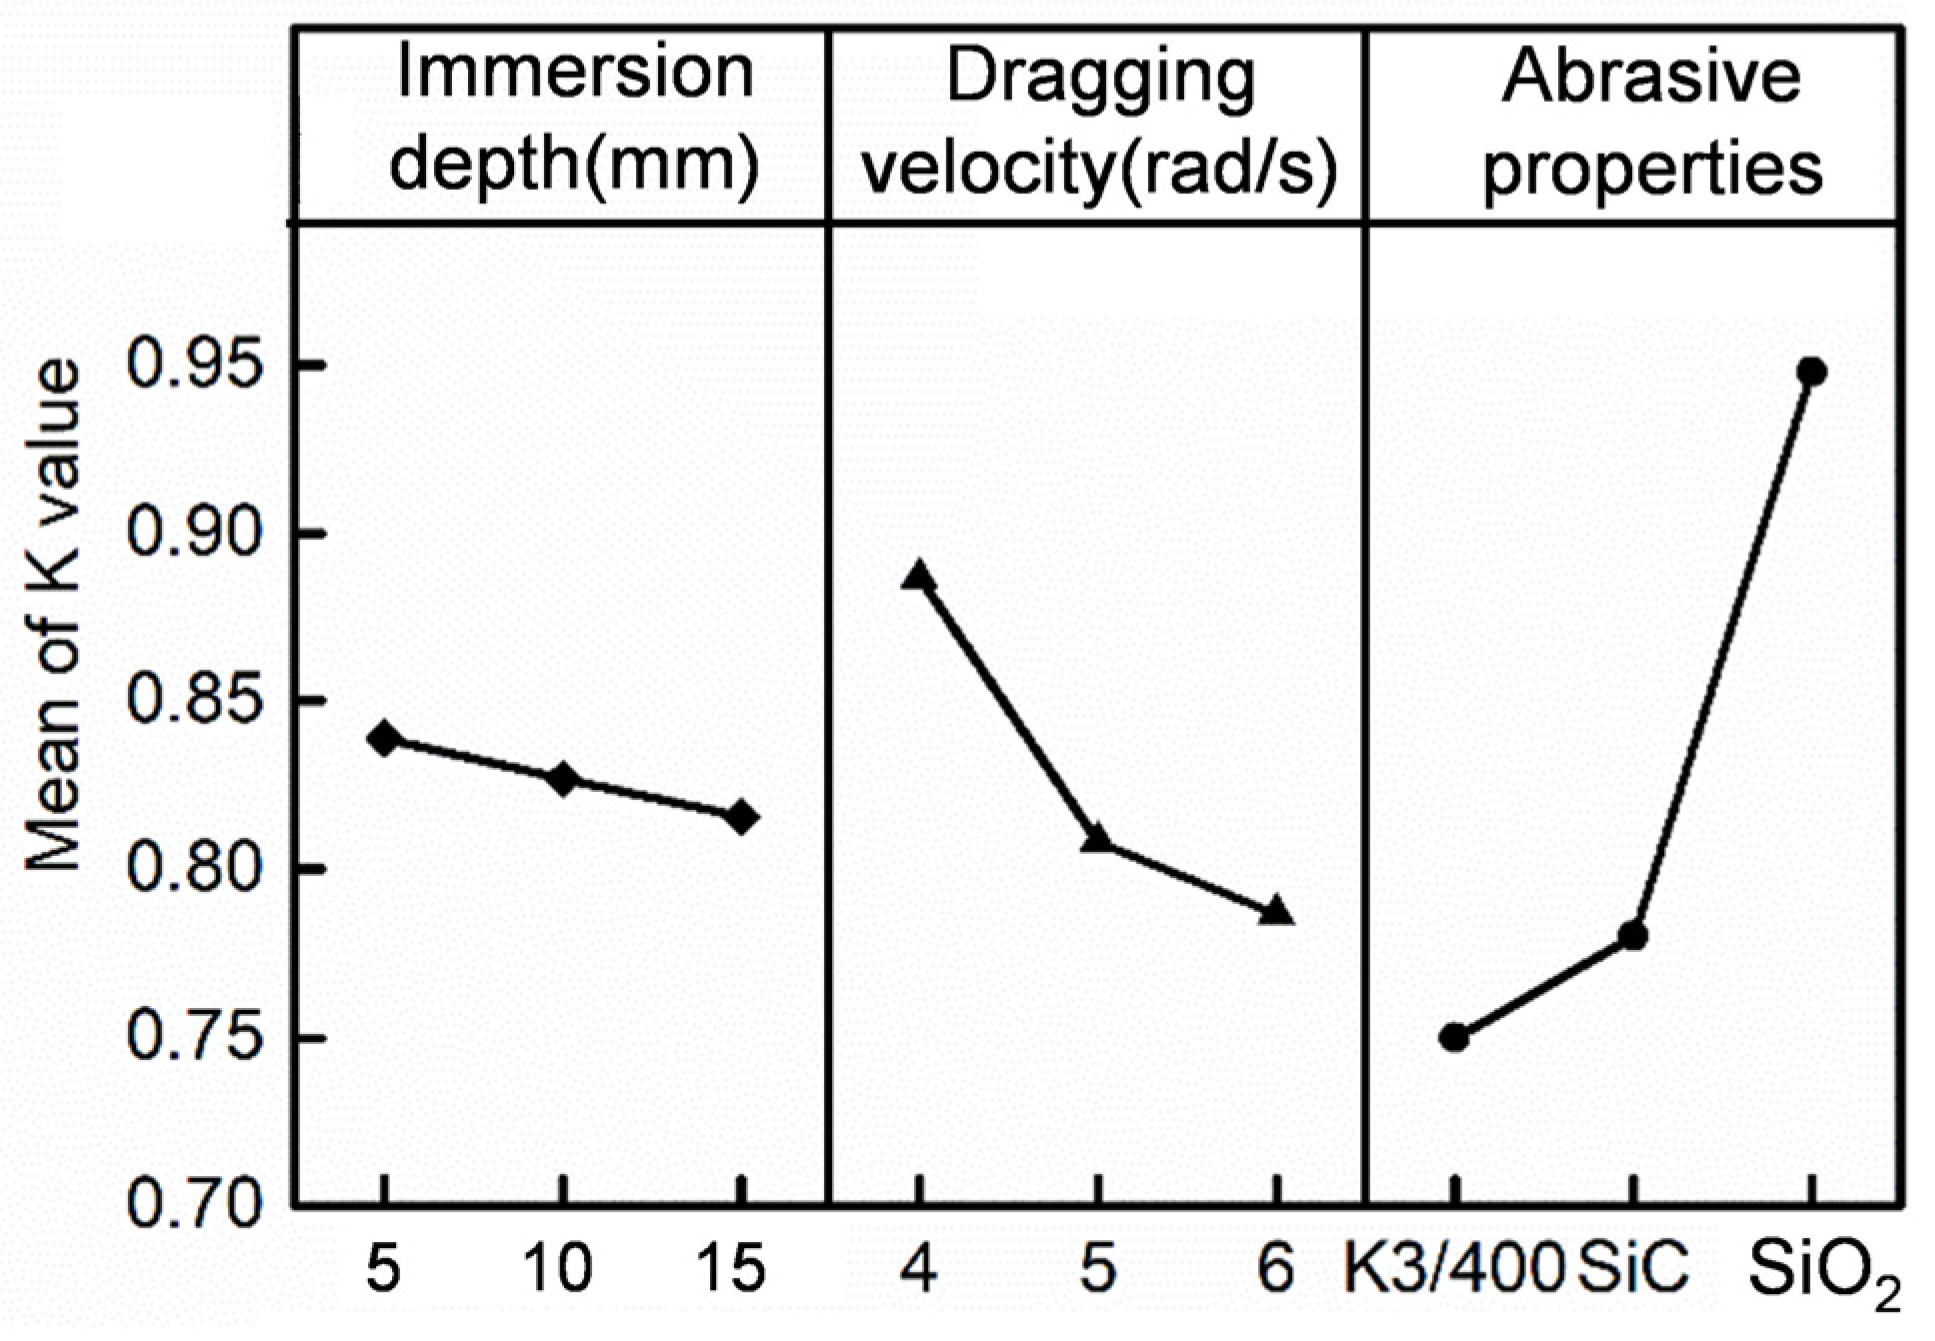
- The alteration of process parameters has resulted in a significant change not only in the cutting edge radius but also in the K value, which previous studies have ignored. Previous articles suggested that the K value is only affected by the ratio of forward and backward rotation. The K value is significantly impacted by both abrasive properties and dragging velocity. The influence of abrasive type, dragging velocity, and immersion depth on the K value is ranked from high to low. As the dragging velocity increases, the K value decreases.
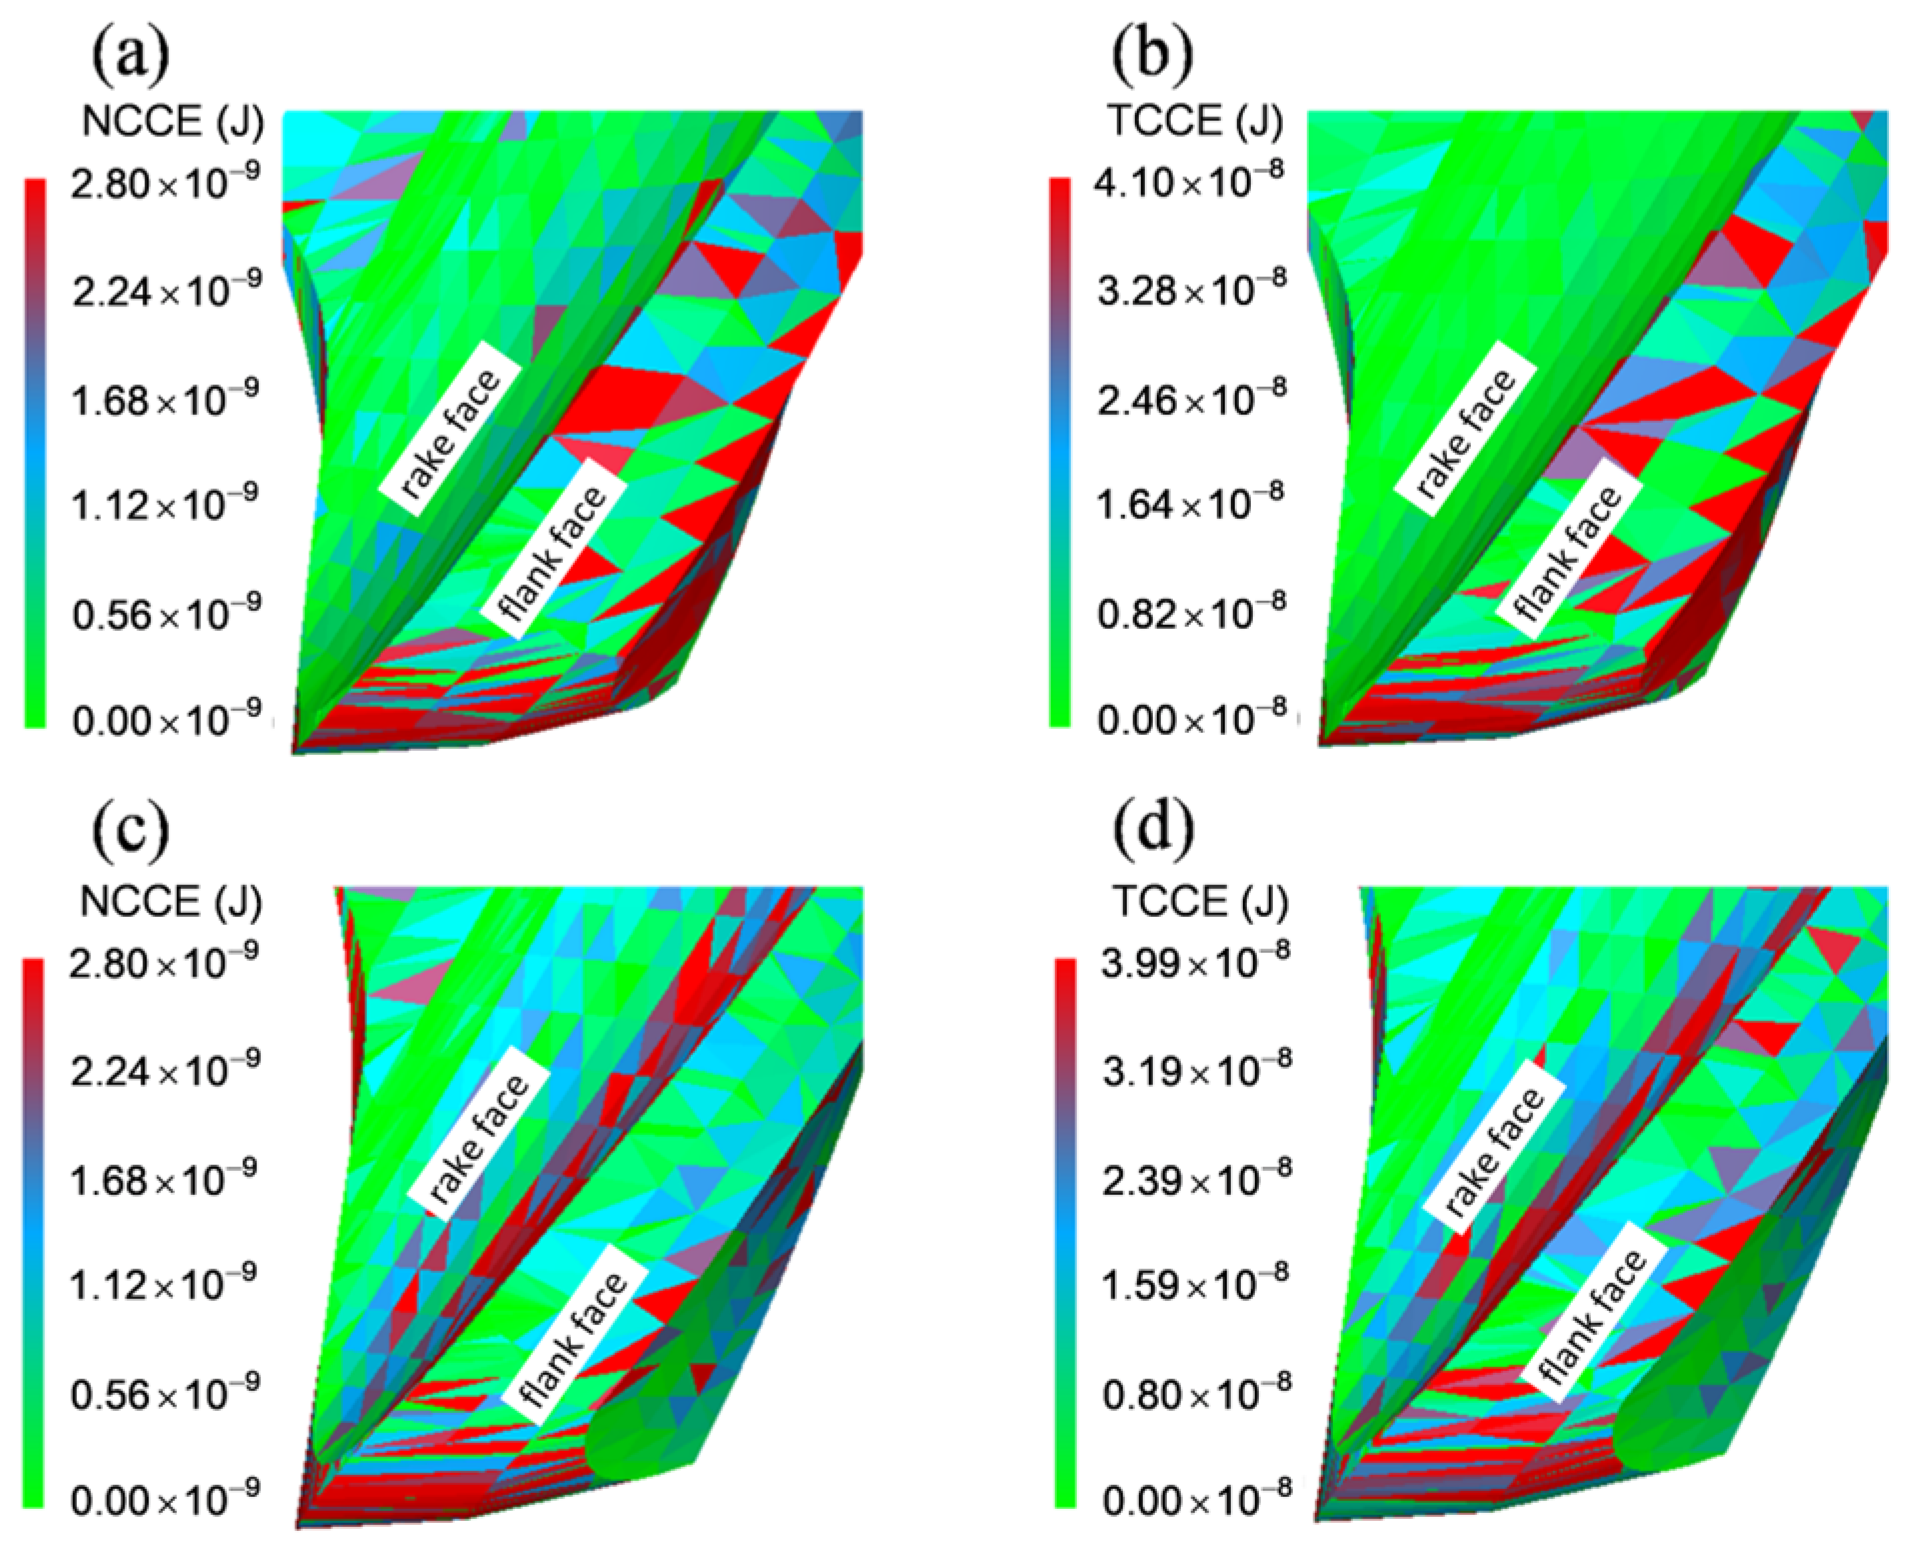
- Based on the results of the DEM, the distribution of TCCE and NCCE differ in the position of the cutting edge and caused a different distribution of material removal. The theoretical analysis also shows the sensitivity of immersion depth, wear particle type, and wear particle velocity to the removal rate of the two wear forms. This is the direct cause of the varying K values in conclusion 1.
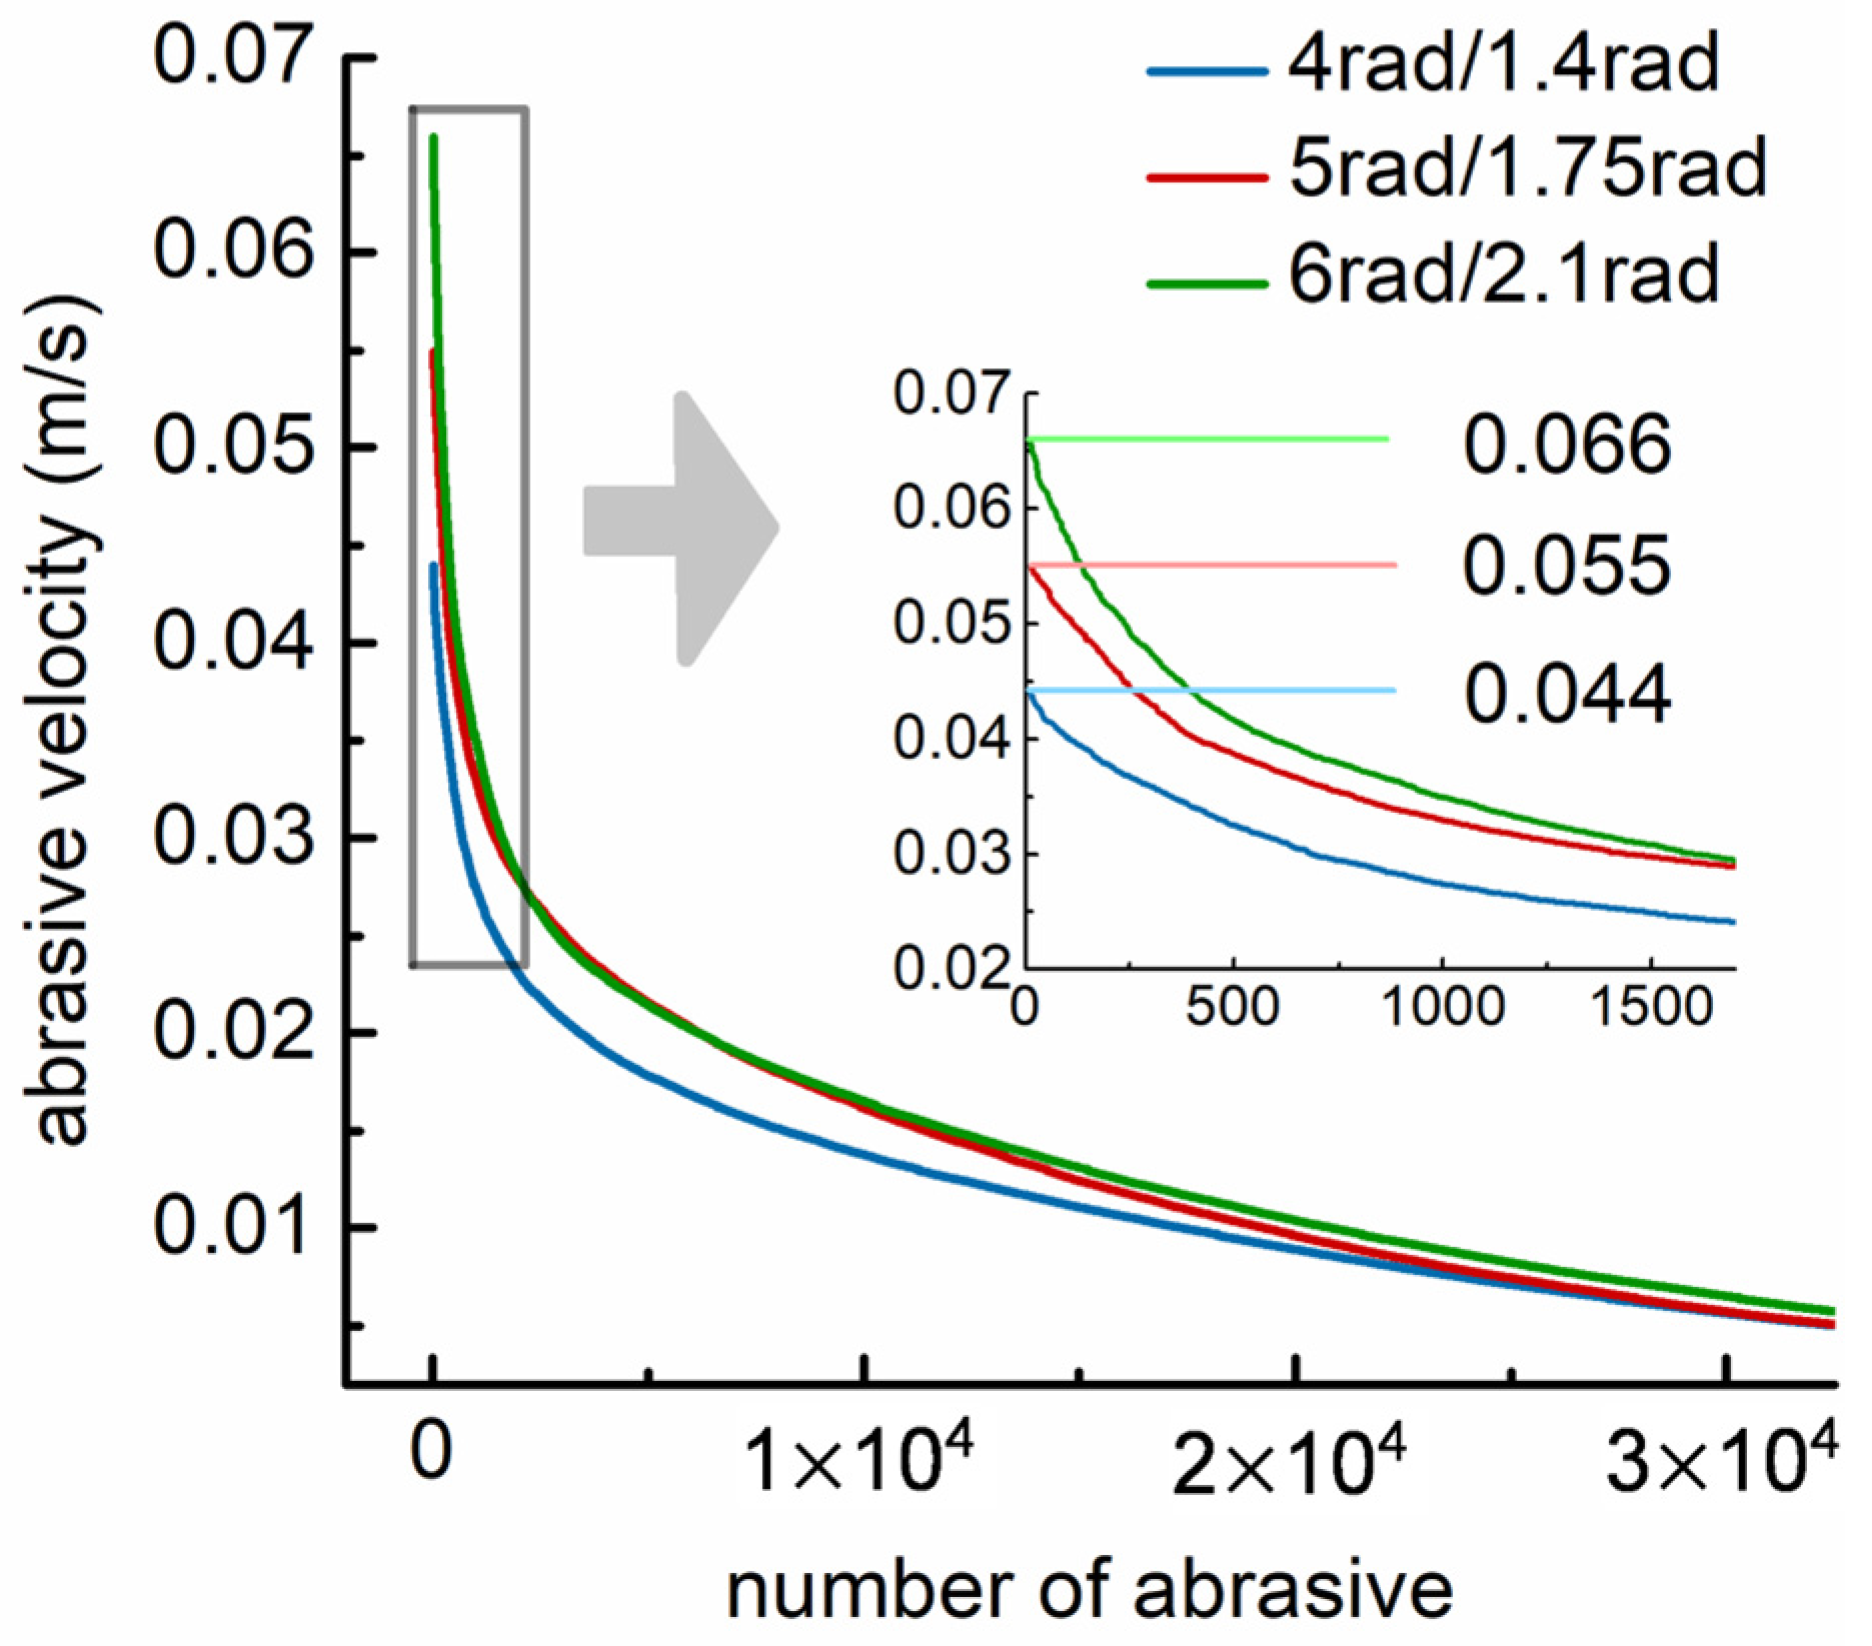
- From the range analysis of the orthogonal experiments, both the immersion depth and the drag velocity have a positive effect on the material removal rate, but the positive effect of the drag velocity is not clear in the drag finishing. By comparing the abrasive velocity and the tool velocity in the simulation results, it is found that the change in the drag velocity is weakened in the relative velocity change of the tool and the abrasive particle, causing the effect to be insignificant.
Author Contributions
Funding
Data Availability Statement
Conflicts of Interest
References
- Hashimoto, F.; Yamaguchi, H.; Krajnik, P.; Wegener, K.; Chaudhari, R.; Hoffmeister, H.-W.; Kuster, F. Abrasive Fine-Finishing Technology. CIRP Ann. 2016, 65, 597–620. [Google Scholar] [CrossRef]
- Li, B.; Zhang, S.; Yan, Z.; Jiang, D. Influence of Edge Hone Radius on Cutting Forces, Surface Integrity, and Surface Oxidation in Hard Milling of AISI H13 Steel. Int. J. Adv. Manuf. Technol. 2018, 95, 1153–1164. [Google Scholar] [CrossRef]
- Ventura, C.E.H.; Köhler, J.; Denkena, B. Influence of Cutting Edge Geometry on Tool Wear Performance in Interrupted Hard Turning. J. Manuf. Process. 2015, 19, 129–134. [Google Scholar] [CrossRef]
- Wang, W.; Saifullah, M.K.; Aßmuth, R.; Biermann, D.; Arif, A.F.M.; Veldhuis, S.C. Effect of Edge Preparation Technologies on Cutting Edge Properties and Tool Performance. Int. J. Adv. Manuf. Technol. 2020, 106, 1823–1838. [Google Scholar] [CrossRef]
- Denkena, B.; Köhler, J.; Breidenstein, B.; Abrão, A.M.; Ventura, C.E.H. Influence of the Cutting Edge Preparation Method on Characteristics and Performance of PVD Coated Carbide Inserts in Hard Turning. Surf. Coat. Technol. 2014, 254, 447–454. [Google Scholar] [CrossRef]
- Wang, W.; Biermann, D.; Aßmuth, R.; Arif, A.F.M.; Veldhuis, S.C. Effects on Tool Performance of Cutting Edge Prepared by Pressurized Air Wet Abrasive Jet Machining (PAWAJM). J. Mater. Process. Technol. 2020, 277, 116456. [Google Scholar] [CrossRef]
- Hartig, J.; Kirsch, B.; Aurich, J.C. Analysis of the Grinding Wheel Wear and Machining Result during Cutting Edge Preparation with Elastic Bonded Grinding Wheels. J. Manuf. Process. 2022, 75, 181–202. [Google Scholar] [CrossRef]
- Aurich, J.C.; Effgen, C.; Kirsch, B. Cutting Edge Preparation with Elastic Bonded Superabrasive Grinding Wheels. CIRP Ann. 2016, 65, 329–332. [Google Scholar] [CrossRef]
- Guan, X.; Zhao, D.; Yu, Y.; Zuo, D.; Song, S. Controllable Preparation of Non-Uniform Tool Edges by Magnetorheological Finishing. Int. J. Adv. Manuf. Technol. 2023, 125, 4119–4131. [Google Scholar] [CrossRef]
- Lv, D.; Wang, Y.; Yu, X.; Chen, H.; Gao, Y. Analysis of Abrasives on Cutting Edge Preparation by Drag Finishing. Int. J. Adv. Manuf. Technol. 2022, 119, 3583–3594. [Google Scholar] [CrossRef]
- Pérez-Salinas, C.F.; Del Olmo, A.; López De Lacalle, L.N. Estimation of Drag Finishing Abrasive Effect for Cutting Edge Preparation in Broaching Tool. Materials 2022, 15, 5135. [Google Scholar] [CrossRef] [PubMed]
- Hashimoto, Y.; Ito, T.; Nakayama, Y.; Furumoto, T.; Hosokawa, A. Fundamental Investigation of Gyro Finishing Experimental Investigation of Contact Force between Cylindrical Workpiece and Abrasive Media under Dry Condition. Precis. Eng. 2021, 67, 123–136. [Google Scholar] [CrossRef]
- Misra, A.; Pandey, P.M.; Dixit, U.S. Modeling of Material Removal in Ultrasonic Assisted Magnetic Abrasive Finishing Process. Int. J. Mech. Sci. 2017, 131–132, 853–867. [Google Scholar] [CrossRef]
- Ohlert, M.; Brüssel, F.; Prinz, S.; Barth, S.; Bergs, T. Influence of Relative Velocity and Contact Force between Abrasive Media and Workpiece on Material Removal in Gyro Finishing. J. Manuf. Process. 2022, 79, 614–625. [Google Scholar] [CrossRef]
- Barletta, M.; Pietrobono, F.; Rubino, G.; Tagliaferri, V. Drag Finishing of Sensitive Workpieces with Fluidized Abrasives. J. Manuf. Process. 2014, 16, 494–502. [Google Scholar] [CrossRef]
- Barletta, M.; Rubino, G.; Valentini, P.P. Experimental Investigation and Modeling of Fluidized Bed Assisted Drag Finishing According to the Theory of Localization of Plastic Deformation and Energy Absorption. Int. J. Adv. Manuf. Technol. 2015, 77, 2165–2180. [Google Scholar] [CrossRef]
- Azami, A.; Khoshanjam, A.; Jerez-Mesa, R.; Lluma-Fuentes, J.; Travieso-Rodriguez, J.A. A New Theoretical Model for Surface Roughness Prediction in Rotational Abrasive Finishing Process. Wear 2023, 524–525, 204772. [Google Scholar] [CrossRef]
- Gao, Y.; Zhao, Y.; Zhang, G.; Yin, F.; Zhang, H. Modeling of Material Removal in Magnetic Abrasive Finishing Process with Spherical Magnetic Abrasive Powder. Int. J. Mech. Sci. 2020, 177, 105601. [Google Scholar] [CrossRef]
- Chen, H.; Wang, Y.; Jiao, J.; Tan, Z.; Huang, L.; Zhong, Z. Combined Post-Treatment Approach for Improving the Surface Integrity of CVD α-Al2O3 Coating and the Tool Wear Resistance. Ceram. Int. 2023, 49, 39488–39498. [Google Scholar] [CrossRef]
- Yang, S.; Fan, J.; Zhang, L.; Sun, B. Performance Prediction of Erosion in Elbows for Slurry Flow under High Internal Pressure. Tribol. Int. 2021, 157, 106879. [Google Scholar] [CrossRef]
- Yang, P.; Yue, W.; Chen, A.; Bin, G. Influence of SiO2 and Al2O3 Particles on Erosion Wear of Aero-Compressor Blades. Wear 2023, 530–531, 204992. [Google Scholar] [CrossRef]
- Yaer, X.; Shimizu, K.; Qu, J.; Wen, B.; Cao, X.; Yilagaqi; Kusumoto, K. Surface Deformation Micromechanics of Erosion Damage at Different Angles and Velocities for Aero-Engine Hot-End Components. Wear 2019, 426–427, 527–538. [Google Scholar] [CrossRef]
- Zhang, X.; Yuan, J.; Deng, Q.; Wang, X.; Luo, Y. High-Speed Abrasive Flow Composite Polishing Based on Dielectrophoresis Effect. Int. J. Adv. Manuf. Technol. 2022, 119, 8137–8146. [Google Scholar] [CrossRef]
- Malkorra, I.; Souli, H.; Claudin, C.; Salvatore, F.; Arrazola, P.; Rech, J.; Seux, H.; Mathis, A.; Rolet, J. Identification of Interaction Mechanisms during Drag Finishing by Means of an Original Macroscopic Numerical Model. Int. J. Mach. Tools Manuf. 2021, 168, 103779. [Google Scholar] [CrossRef]
- Zhao, X.; Zheng, P.; He, L.; Tao, M. Cutting Edge Preparation Using the Discrete Element Software EDEM. J. Braz. Soc. Mech. Sci. Eng. 2020, 42, 163. [Google Scholar] [CrossRef]
- Wang, L.; Sun, Y.; Chen, F.; Zhang, G.; Sun, Y.; Zuo, D. Modeling and Simulation of the Action Mechanism of Multi-Particles in Magnetic Abrasive Finishing for Internal Blind Cavity Using the Discrete Element Method. Int. J. Adv. Manuf. Technol. 2023, 125, 1179–1192. [Google Scholar] [CrossRef]


| Typical Analysis | Hardness [kgf/mm2] | Density [g/cm3] | Average Abrasive Diameter [mm] | Shear Modulus [Pa] | Poisson’s Ratio | Coefficient of Restitution | Coefficient of Static Friction |
|---|---|---|---|---|---|---|---|
| Tool | 1700 | 14.5 |  | 0.3 | 0.5 | 0.25 | |
| K3/400 | 1500 | 3.0 | 0.8~1.3 | 0.1 | 0.45 | 0.2 | |
| SiC | 2700 | 3.2 | 0.4~0.8 | 0.14 | 0.75 | 0.25 | |
| SiO2 | 2400 | 3.6 | 0.8~1.3 | 0.3 | 0.85 | 0.3 |
| Parameter | Value |
|---|---|
| Shank diameter D | 8 mm |
| Tool diameter d | 6 mm |
| Number of teeth Z | 4 |
| Cutting edge length l | 10 mm |
| Helix angle β | 40° |
| Radial rake angle γ | 0° |
| Radial relief angle α | 8° |
| Corner radius R | 1 mm |
| Factors | Immersion Depth (mm) | Dragging Velocity * | Abrasives |
|---|---|---|---|
| 1 | 5 | 1.4/4 | K3/400 |
| 2 | 10 | 1.75/5 | SiC |
| 3 | 15 | 2.1/6 | SiO2 |
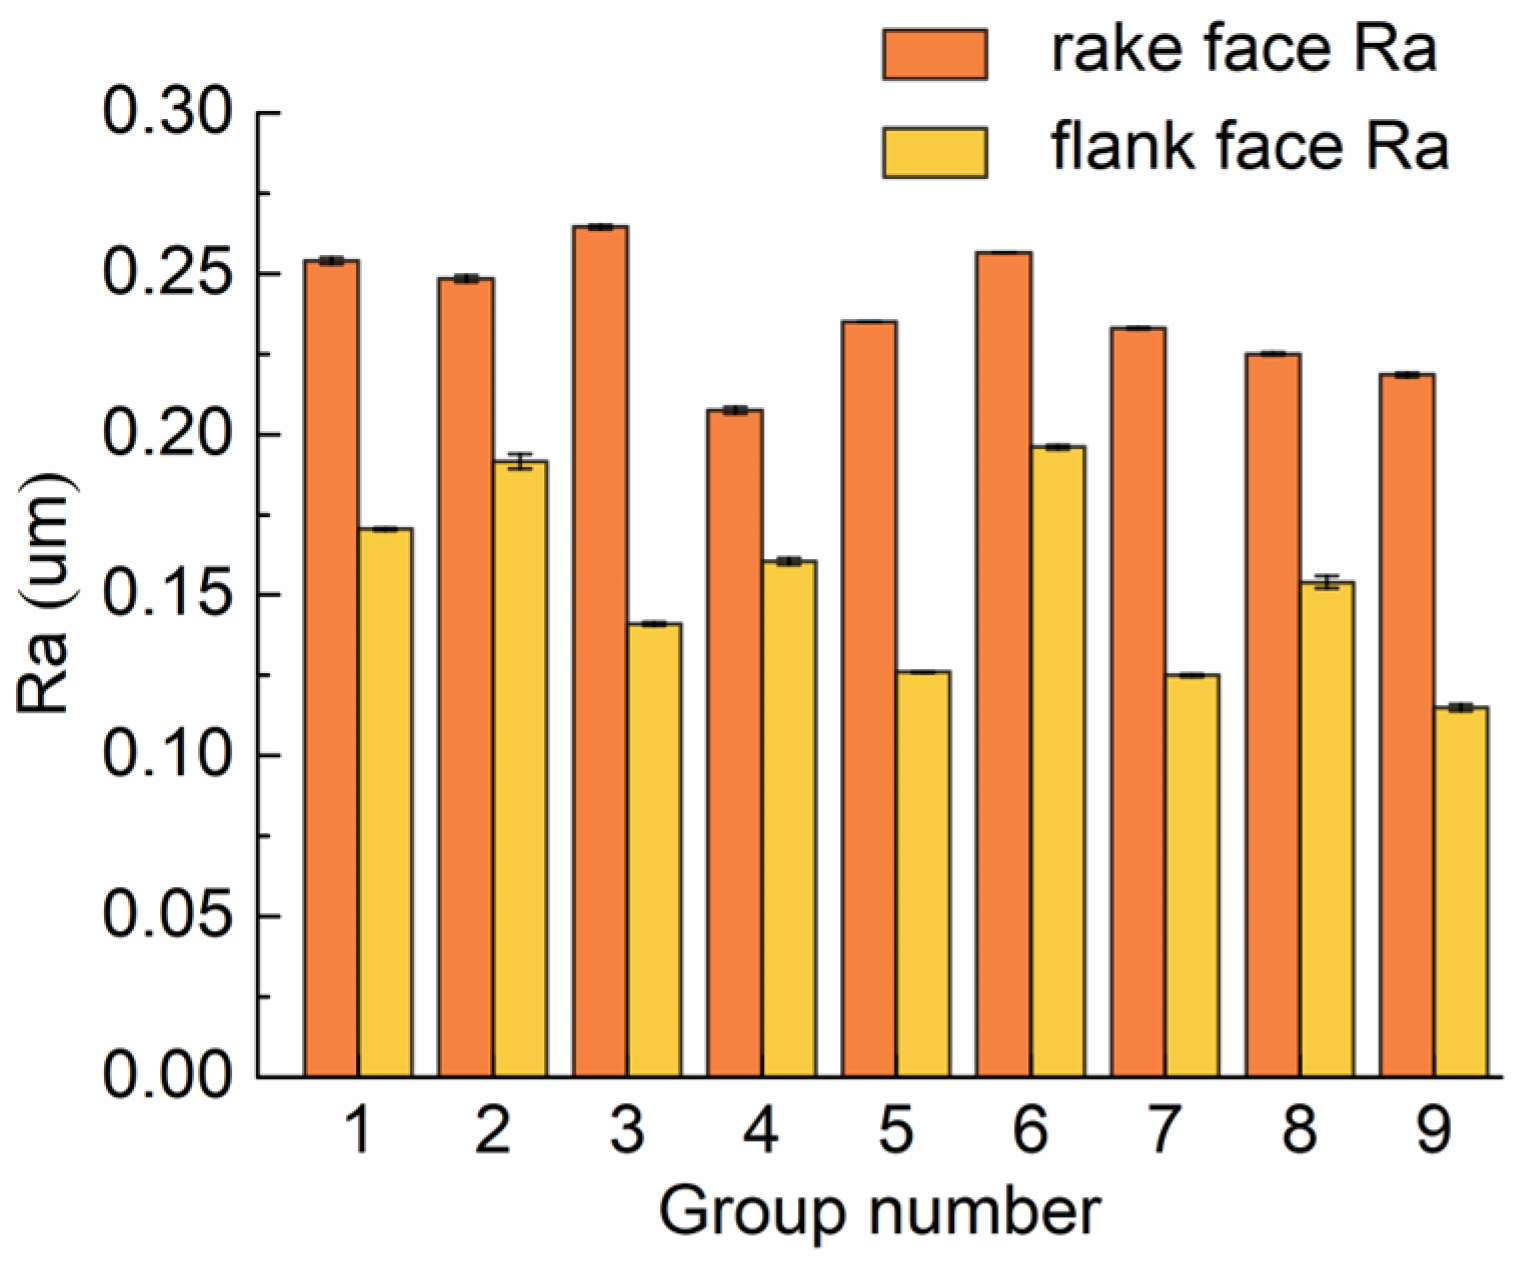
| Group Number | Immersion Depth | Dragging Velocity | Abrasive Properties | Edge Radius (μm) | K Value | Rake Face Ra (μm) | Flank Face Ra (μm) |
|---|---|---|---|---|---|---|---|
| 1 | 1 | 1 | 1 | 3.097 | 0.833 | 0.254 | 0.1705 |
| 2 | 1 | 2 | 2 | 4.860 | 0.747 | 0.2485 | 0.1915 |
| 3 | 1 | 3 | 3 | 9.553 | 0.937 | 0.2645 | 0.141 |
| 4 | 2 | 1 | 2 | 5.977 | 0.860 | 0.2075 | 0.1605 |
| 5 | 2 | 2 | 3 | 11.353 | 0.940 | 0.235 | 0.126 |
| 6 | 2 | 3 | 1 | 3.880 | 0.680 | 0.2565 | 0.196 |
| 7 | 3 | 1 | 3 | 11.870 | 0.967 | 0.233 | 0.125 |
| 8 | 3 | 2 | 1 | 5.1467 | 0.737 | 0.225 | 0.154 |
| 9 | 3 | 3 | 2 | 9.970 | 0.743 | 0.2185 | 0.115 |
| Factors | Sum of Square | Degrees of Freedom | Mean of Square | F Value | p |
|---|---|---|---|---|---|
| Immersion depth | 15.207 | 2.000 | 7.604 | 7.031 | 0.049 * |
| Dragging velocity | 1.156 | 2.000 | 0.578 | 0.534 | 0.623 |
| Abrasive properties | 71.693 | 2.000 | 35.847 | 33.146 | 0.003 ** |
| error | 4.326 | 4.000 | 1.081 |
| Factors | Sum of Square | Degrees of Freedom | Mean Square | F Value | p |
|---|---|---|---|---|---|
| Immersion depth | 0.0008 | 2.0000 | 0.0004 | 0.3466 | 0.726 |
| Dragging velocity | 0.0167 | 2.0000 | 0.0083 | 7.0691 | 0.048 * |
| Abrasive properties | 0.0673 | 2.0000 | 0.0336 | 28.5277 | 0.004 ** |
| Error | 0.0047 | 4.0000 | 0.0012 |
Disclaimer/Publisher’s Note: The statements, opinions and data contained in all publications are solely those of the individual author(s) and contributor(s) and not of MDPI and/or the editor(s). MDPI and/or the editor(s) disclaim responsibility for any injury to people or property resulting from any ideas, methods, instructions or products referred to in the content. |
© 2024 by the authors. Licensee MDPI, Basel, Switzerland. This article is an open access article distributed under the terms and conditions of the Creative Commons Attribution (CC BY) license (https://creativecommons.org/licenses/by/4.0/).
Share and Cite
Zhou, L.; Wang, Y.; Lv, D. Research on Cutting Edge form Factor of Milling Tool after Drag Finishing Preparation Based on Discrete Element Method. Machines 2024, 12, 236. https://doi.org/10.3390/machines12040236
Zhou L, Wang Y, Lv D. Research on Cutting Edge form Factor of Milling Tool after Drag Finishing Preparation Based on Discrete Element Method. Machines. 2024; 12(4):236. https://doi.org/10.3390/machines12040236
Chicago/Turabian StyleZhou, Lihong, Yongguo Wang, and Dejin Lv. 2024. "Research on Cutting Edge form Factor of Milling Tool after Drag Finishing Preparation Based on Discrete Element Method" Machines 12, no. 4: 236. https://doi.org/10.3390/machines12040236
APA StyleZhou, L., Wang, Y., & Lv, D. (2024). Research on Cutting Edge form Factor of Milling Tool after Drag Finishing Preparation Based on Discrete Element Method. Machines, 12(4), 236. https://doi.org/10.3390/machines12040236