Abstract
An electrified vehicle equipped with a stepped-ratio transmission and clutch(es) requires precise control of the clutch actuator(s) and power sources to achieve optimal gear shift performance, which is characterized by smooth and swift gear shifts. Owing to the absence of the smoothing effect of torque converters, dual-clutch transmission (DCT) powertrains are prone to inducing abrupt shift shocks—particularly during rapid clutch-to-clutch shifts. Balancing the smoothness and speed of shifts is a significant challenge and was the key focus of this study. Multiple experiments and model-based analyses were conducted to investigate the tradeoff between smoothness and shift time during the clutch-to-clutch shifts of a parallel-type hybrid electric vehicle with a dry DCT. Additionally, the adverse effects of inaccurate power-source control on shift quality were experimentally investigated. The results revealed the primary physical factors in terms of control causing torsional driveline oscillations in clutch-to-clutch shifts. According to these observations, a detailed quantitative guide including how to generate reference trajectories for shift control is proposed, with the aim of reducing the driveline torsional vibrations without compromising the shift time. The effectiveness of the proposed control strategy was demonstrated through real-time experiments on an electrified powertrain with a DCT using a dedicated test bench. This study provides valuable insights for optimizing the shift performance of electrified vehicles—particularly for managing torsional vibrations during clutch-to-clutch shifts.
1. Introduction
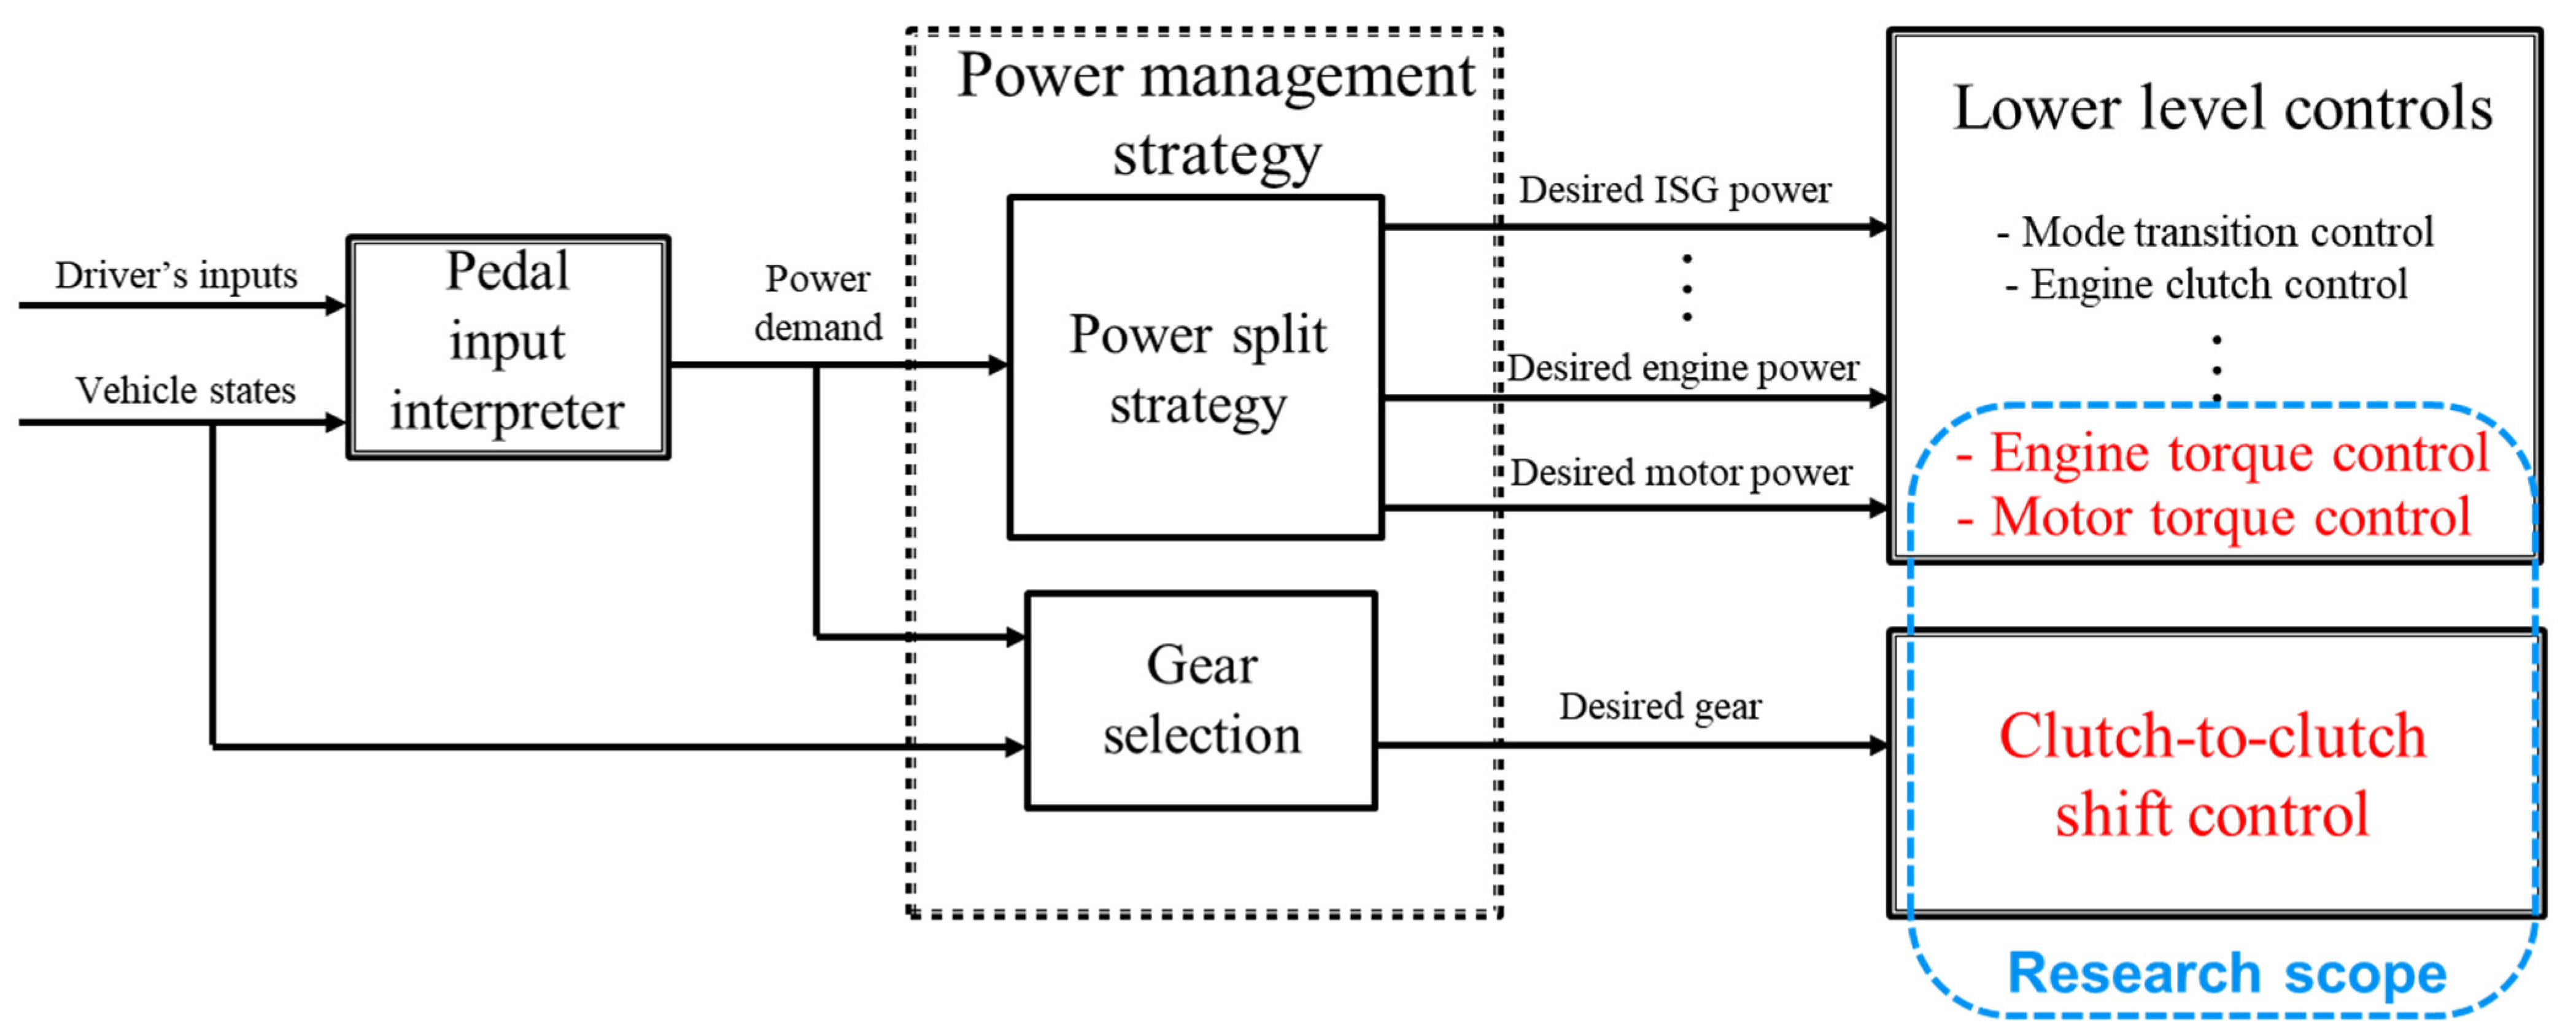
Electrified vehicles, including hybrid electric vehicles (HEVs), have superior emission reduction and energy efficiency compared to their conventional engine-driven counterparts. For HEVs, this is achieved through the effective utilization of multiple energy sources—typically a combination of fuel and electrical energy. Critical to optimizing the vehicle performance is the adept management of the power distribution between these energy sources and the determination of optimal gear ratios for various driving conditions. A typical integrated powertrain control structure for HEVs is represented in Figure 1. Power management control strategies play a pivotal role, with the primary objective of minimizing fuel consumption while satisfying the driver’s power demand and adhering to constraints such as emissions, drivability, and state of charge regulation. Numerous power management strategies have been proposed for optimizing fuel economy and emissions in diverse HEV configurations [1,2,3]. Power management strategies establish set points for individual servo control loops operating at higher frequencies. To realize the intended HEV performance outlined by the power management strategy, each servo control loop must reliably achieve its set point through practical control algorithms. These algorithms consider the actual hardware or actuator characteristics to ensure precise tracking. Among the various servo control loops, control of the transmission system is particularly crucial. It is responsible for executing actual gear shifts in alignment with the optimal gear commanded by the power management control loop while maintaining the overall vehicle performance and mitigating issues such as shift shock. Achieving the optimal fuel economy during gear shifts necessitates the swift minimization of the shift transient time to reach the optimal gear ratio. However, excessively rapid gear shifts may induce substantial torque vibrations throughout the driveline, potentially degrading the shift quality.
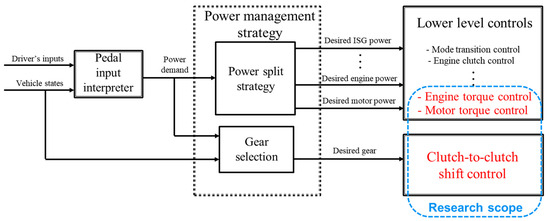
Figure 1.
Integrated powertrain control structure for a parallel hybrid vehicle.
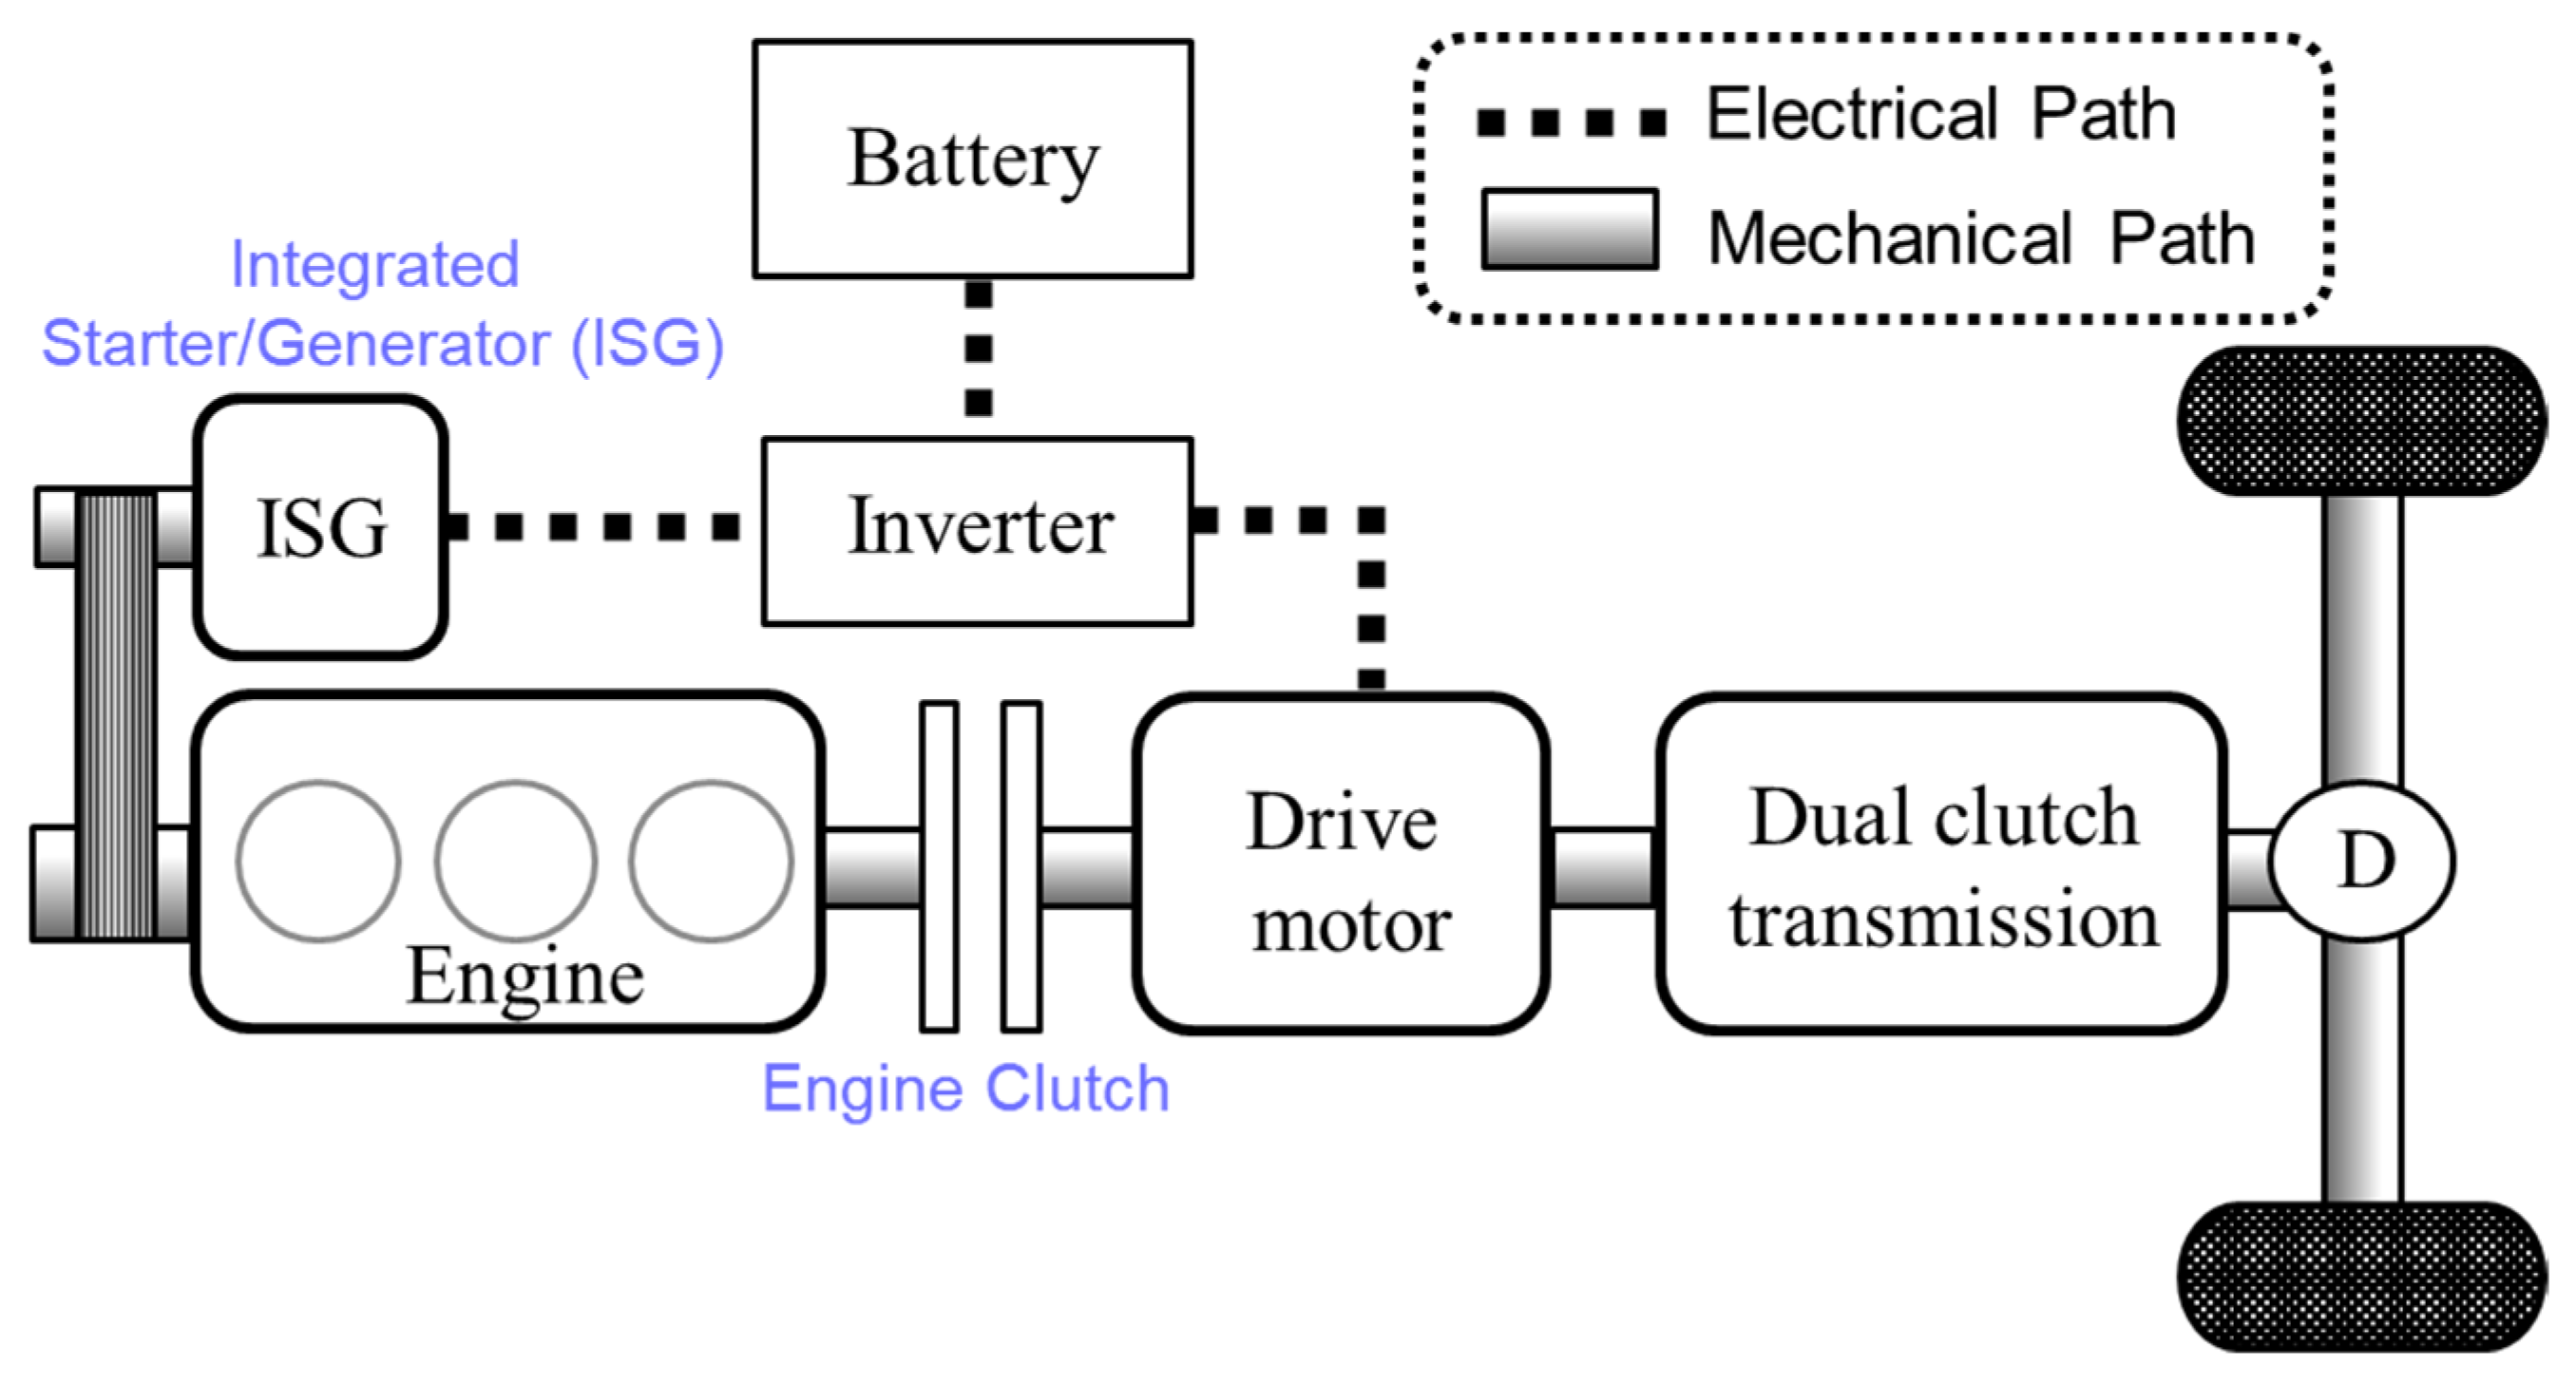
This study focuses on a parallel-type HEV equipped with a dry dual-clutch transmission (DCT), as illustrated schematically in Figure 2. The engine is linked to the integrated starter generator (ISG) through a belt, serving the purpose of initiating engine startup. Engagement of the engine clutch, which is positioned between the engine and drive motor, is initiated when transitioning from the pure electric vehicle mode to the parallel hybrid mode becomes necessary. DCTs have attracted considerable attention globally in the automotive industry owing to their notable performance in vehicle efficiency and shift quality. During gear shifts, DCTs employ two sets of clutches and transfer shafts to transmit torque from the power sources to the axle shaft, eliminating the need for torque converters and effectively addressing the drawbacks associated with other types of transmissions. This configuration allows DCTs to substantially mitigate torque disruptions, interruptions, and other issues prevalent in manual transmissions (MTs) and automated manual transmissions (AMTs). Additionally, DCTs have significantly higher efficiency than conventional planetary-type automatic transmissions (ATs) [4]. Recent applications have extended DCT usage to pure electric vehicles (EVs) and production HEVs, recognizing their advantages [5,6,7]. However, the absence of the smoothing effect of torque converters in DCT powertrains increases the likelihood of uncomfortable shift shocks during gear shifts—particularly in rapid clutch-to-clutch shifts [8]. Swift gear shifts are generally desirable for optimal fuel economy, minimizing the loss of vehicle acceleration, and reducing clutch friction losses (for transmissions with clutch(es)), irrespective of the transmission type. Moreover, if the driver seeks rapid acceleration by abruptly pressing the accelerator pedal, the shift duration must be shortened [9]. In essence, the pursuit of comfortable and fast shifts presents a conflict, and these represent the two primary objectives of gear shift control (e.g., [10]). A practical gear shift control strategy must be designed for real vehicle applications, with careful consideration of the conflicts among various shift quality criteria.
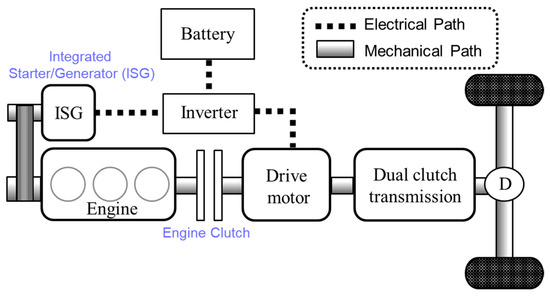
Figure 2.
Configuration of a parallel-type HEV with a DCT.
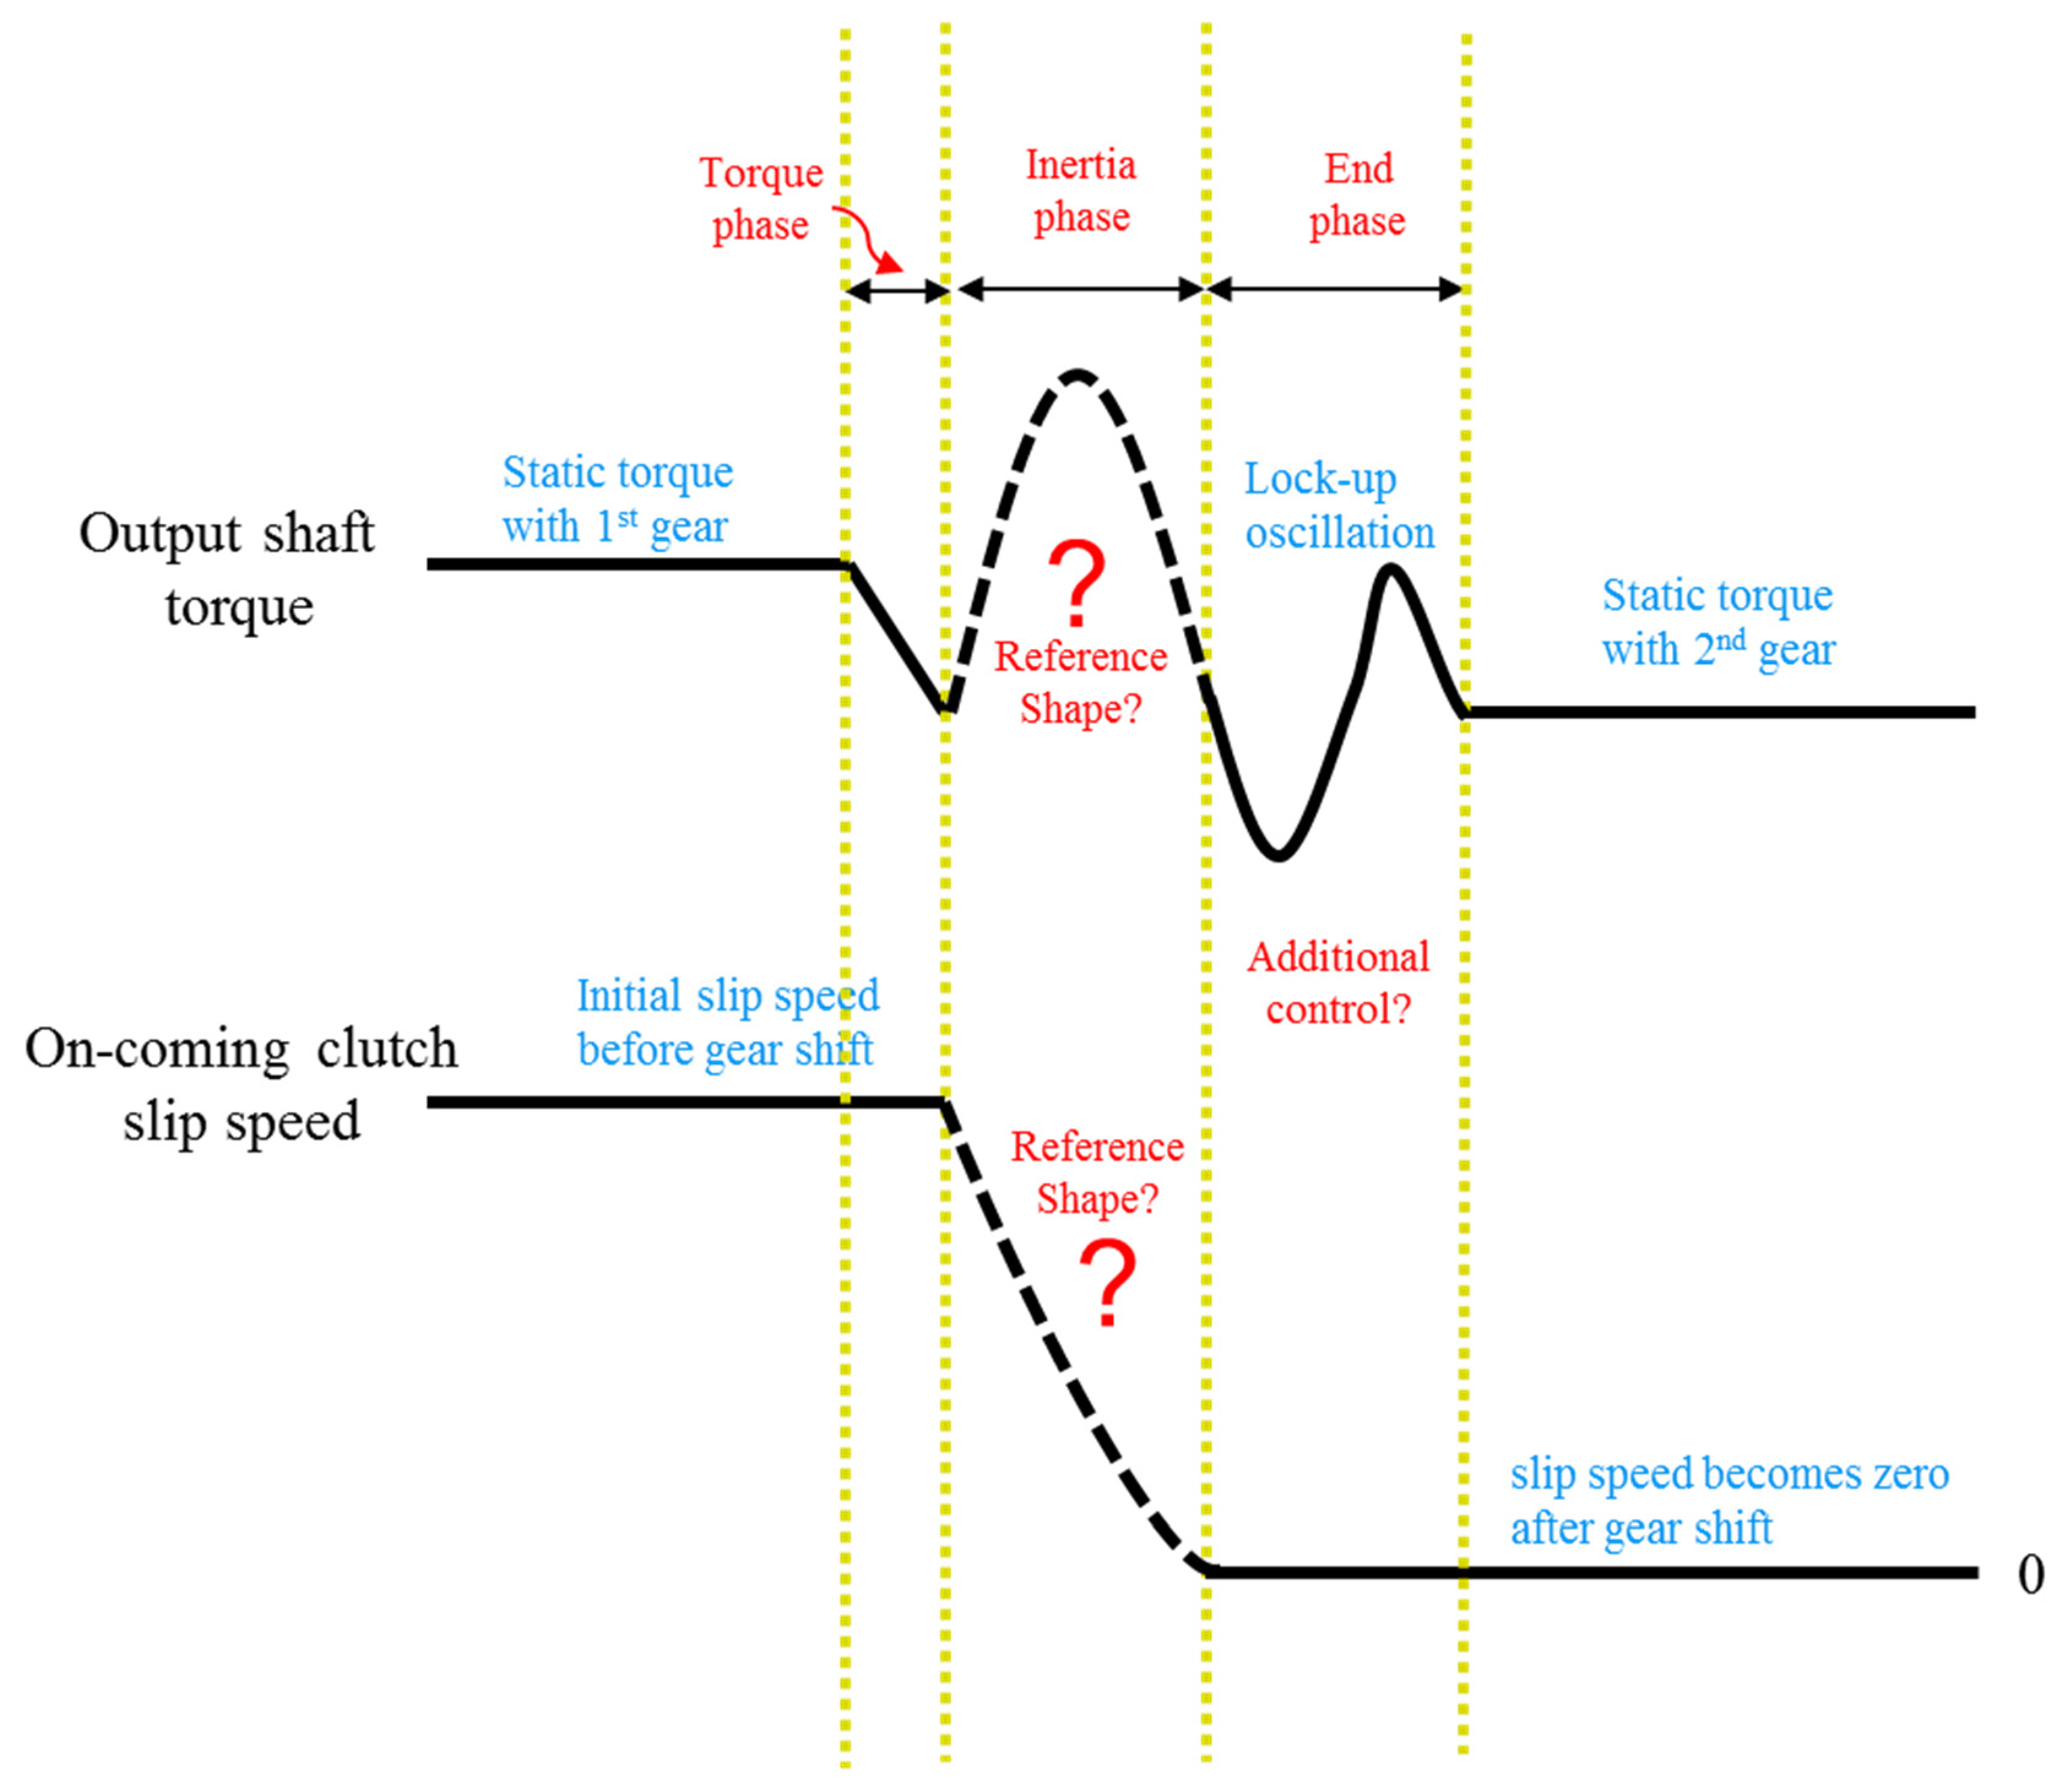
In DCT powertrains, gear shifts involve the transition of torque delivered by power sources from one clutch to another, which is commonly known as a clutch-to-clutch shift. Generally, the DCT shift process consists of three phases: (i) the torque phase, in which the torque is transferred from the engaged clutch to the oncoming clutch; (ii) the inertia phase, which involves the synchronization of the oncoming clutch with the engine with the new gear ratio; and (iii) the end phase, which is characterized by transient lock-up oscillations immediately after the engagement of the oncoming clutch. During the torque phase, precise cross-shift control of the two clutches is essential for minimizing torque dips without inducing engine flares or clutch tie-ups [11]. In the inertia phase, the synchronization control of the oncoming clutch, coupled with power-source control, plays a crucial role in achieving a comfortable shift and rapid engagement. Torque control of power sources such as drive motors or engines is necessary to compensate for driveline vibrations resulting from abrupt gear ratio changes and inertial torque lag [12,13]. In studies on DCT shift control, various methods have been employed to control the torque or speed state, with the aim of satisfying predetermined shift requirements in multiple shift phases [9,10,14,15]. Detailed control strategies for the clutch and engine speeds designed to meet the target torque requirements have been outlined in the literature [9]. In another study, the gear shifts were segmented into distinct phases, and control strategies for each phase based on the clutch slip and output torque information were proposed to ensure fast and smooth clutch engagement [10]. Additionally, a coordinated control algorithm for the engine and clutches considering the detailed modeling of the hydraulic actuators was introduced to achieve the target average torque [15].
The gear shift process in vehicles with stepped-ratio transmissions typically induces torsional vibrations in the driveline, which is attributed to an abrupt change in the gear ratio. As these driveline vibrations negatively impact the shift quality, it is imperative to conduct detailed analyses and dynamic modeling of this physical phenomenon. Such investigations are essential for gaining insights into effectively attenuating vibrations through the implementation of proper control methods or improvements in mechanical design. A comprehensive mathematical model of a vehicle powertrain equipped with an automatic transmission was developed considering nonlinearities in both the clutch and planetary gear sets [16]. To capture the influence of nonlinear clutch characteristics on driveline torsional vibration, a generic nonlinear driveline model was formulated [17]. Additionally, dynamic models for drivelines were established [18,19], focusing on the dynamic characteristics of the gear-rattling phenomenon in vehicles with a DCT under various clutch engagement conditions. These studies provide valuable guidance for automotive designers in optimizing driveline design strategies—particularly in addressing various vibroacoustic issues.
While most previous research focused on detailed modeling methods to accurately describe and analyze driveline vibrations, this work investigated the characteristics of the tradeoff between fast and smooth shifts during a clutch-to-clutch shift in an electrified vehicle with a dry DCT by combining experiments with model-based analyses. The experimental results revealed the primary factors in shift control that contribute to driveline torsional vibrations. Importantly, we demonstrated that the vibrations can be significantly reduced by addressing these factors through appropriate control methods without compromising shift time performance. In contrast to previous studies, a detailed control strategy for the clutch-to-clutch shift is proposed on the basis of observations to provide quantitative guidance on how to control clutches and power sources for enhancing the shift quality with regard to driveline torsional vibrations and shift time. Furthermore, a drive motor control strategy is proposed to attenuate the remaining driveline oscillations immediately after clutch lock-up.
The remainder of this paper is organized as follows. Section 2 discusses the clutch-to-clutch process of electrified vehicles with a DCT, which was investigated through model-based analysis and experiments. Section 3 introduces a novel shift control strategy aimed at minimizing driveline torsional vibrations without extending the shift time, with a focus on the generation of reference trajectories for control and power-source feedback control. The effectiveness of the control strategy was experimentally verified using a test bench for a HEV with a dry DCT. Finally, conclusions are presented in Section 4.
2. Investigation of Clutch-to-Clutch Shifts
2.1. Clutch-to-Clutch Shift Process
In this study, we focused on the 1–2 upshift—a relatively challenging maneuver characterized by significant torque transmission and large driveline vibrations. The primary goal of DCT shift control is to execute the clutch-to-clutch shift swiftly in alignment with the driver’s intention while ensuring that the criteria for both shift smoothness and drivability are satisfied. As previously highlighted, the clutch-to-clutch shift process in a DCT vehicle occurs in three distinct phases: the torque, inertia, and end phases. Typically, the end phase is overlooked when managing gear shifts in traditional DCT vehicles because additional engine control during this phase provides limited scope for improvement. However, in the case of HEVs, the electric drive motor can actively contribute to reducing driveline oscillations during the end phase. Thus, the end phase is considered in this study, and a control strategy for each phase is developed according to the experimental analyses, as described in the following section.
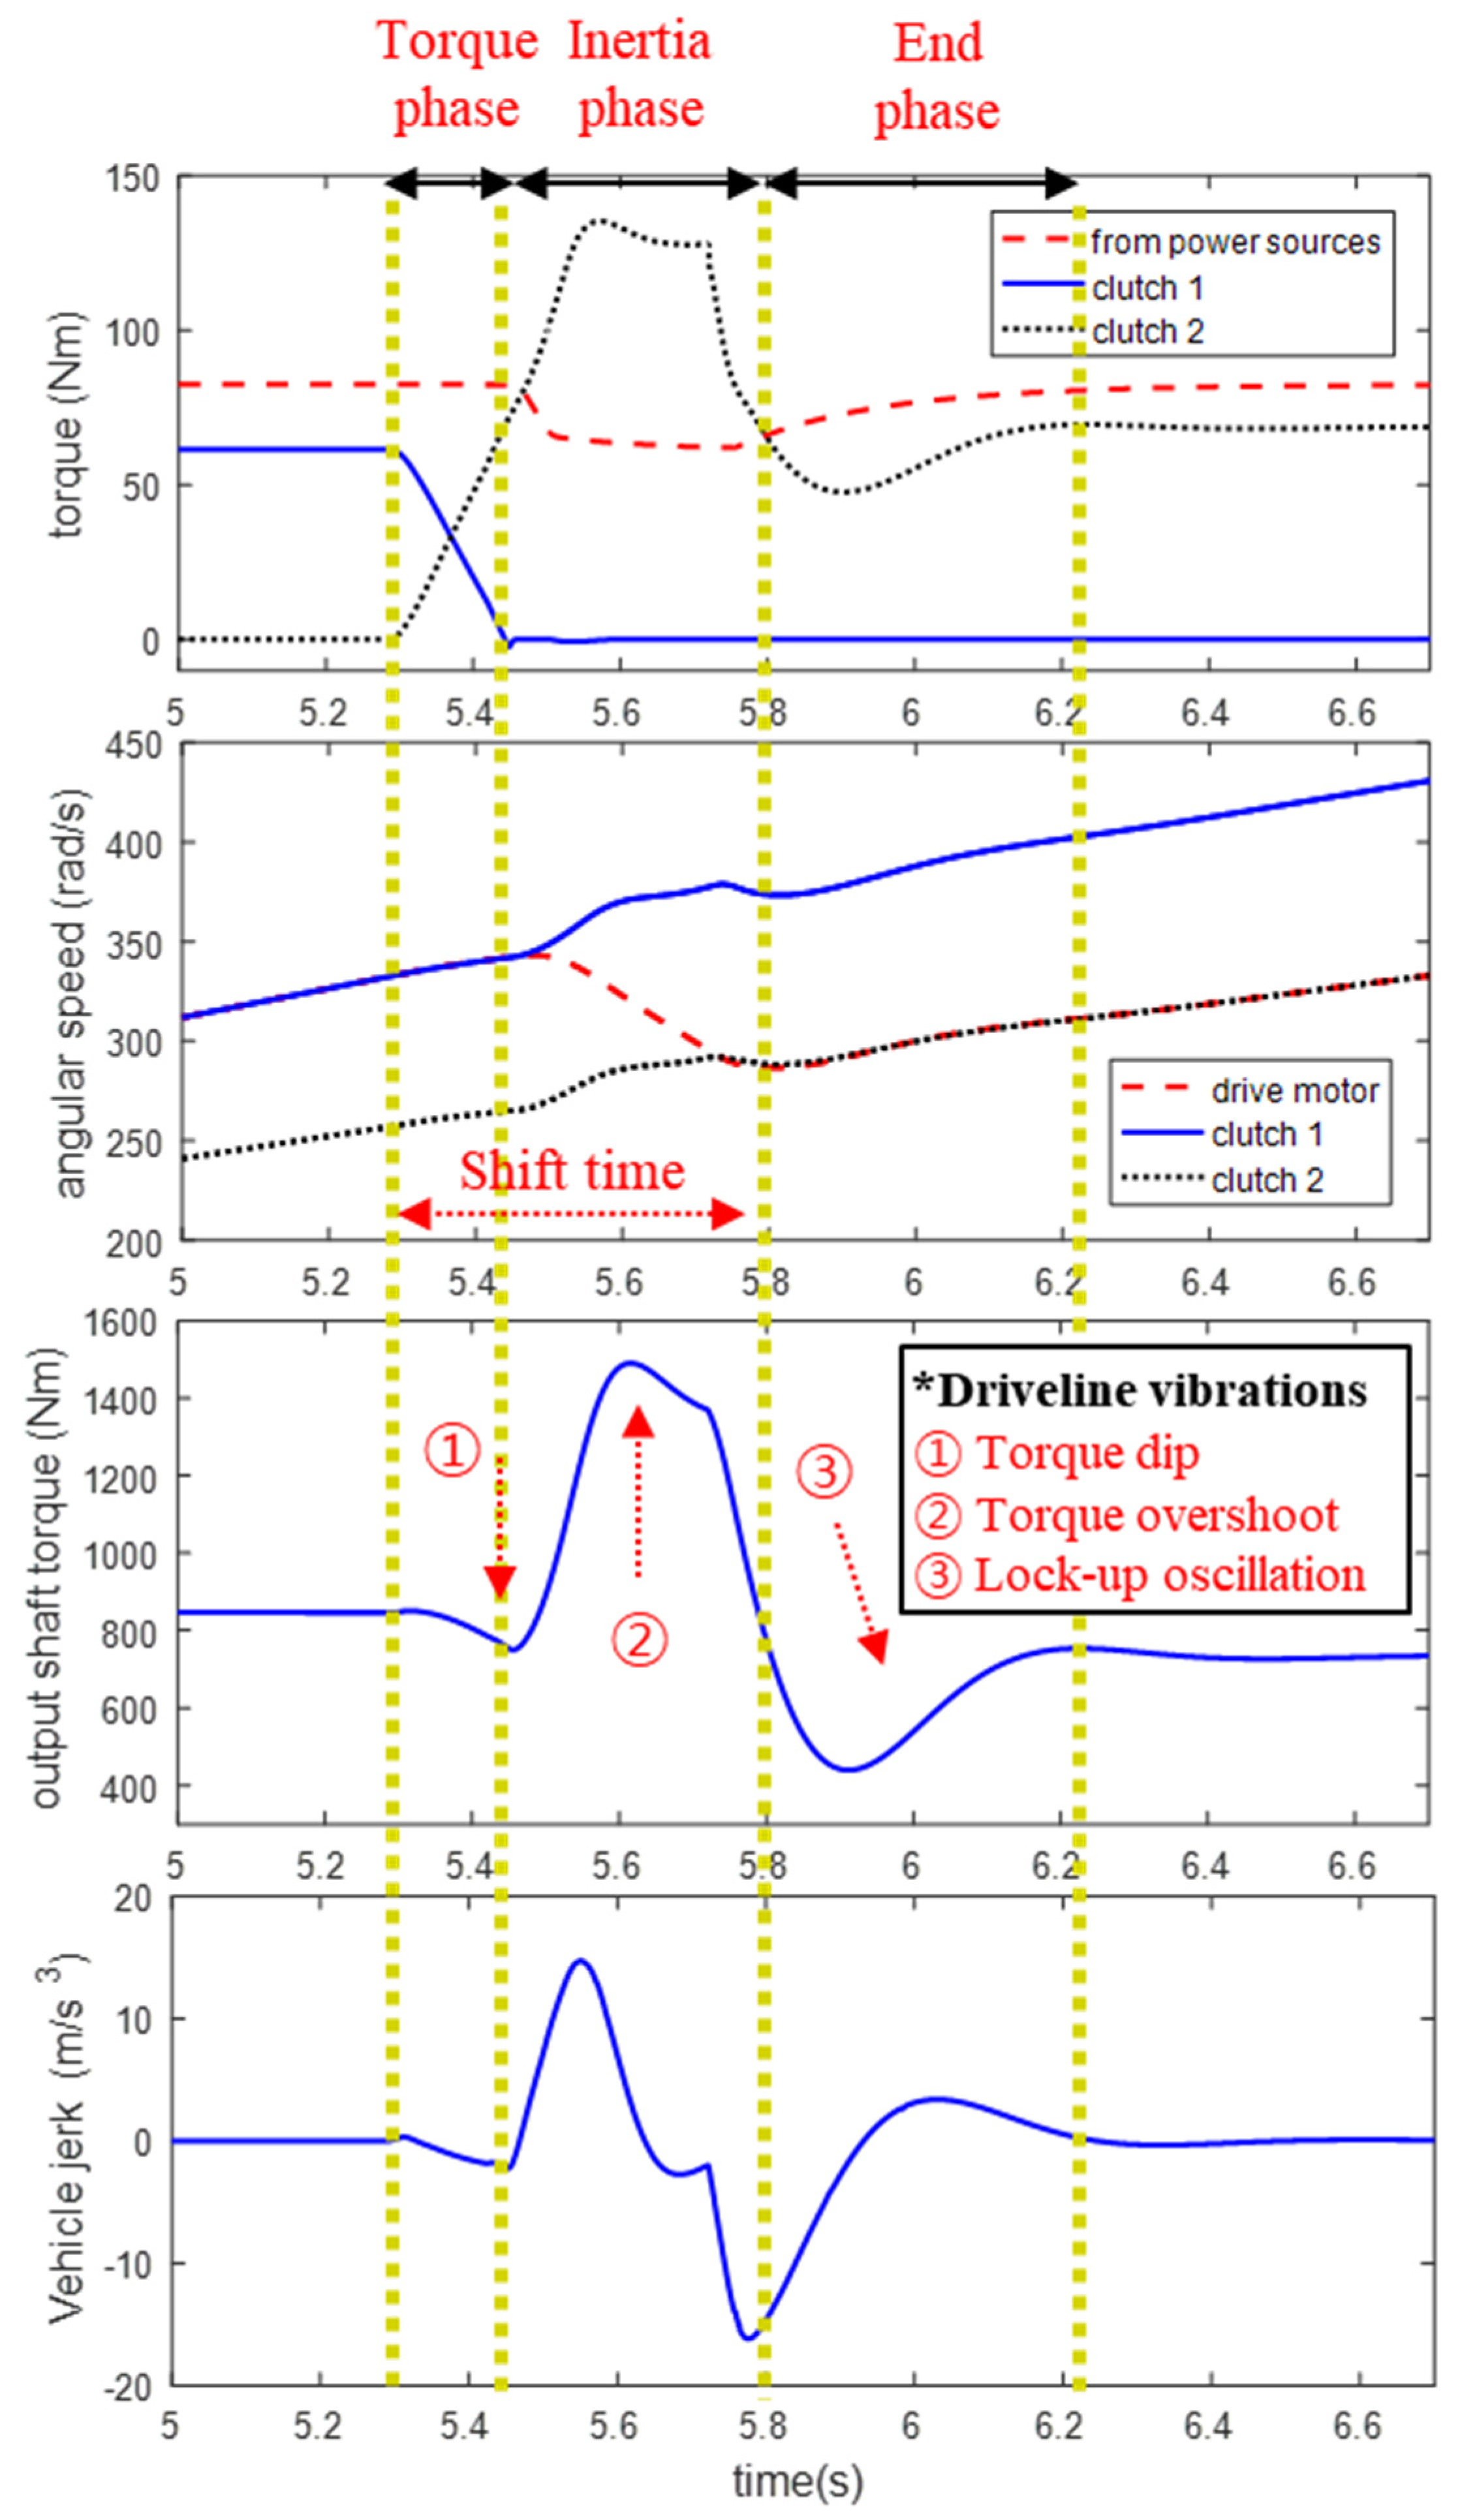
Figure 3 illustrates the typical driveline responses in a DCT vehicle during a gear shift from first to second. In the torque phase, the offgoing clutch stroke gradually decreases, whereas the oncoming clutch stroke increases. This facilitates the transfer of torque from the offgoing clutch to the oncoming clutch. During this phase, a change in the gear ratio reduces the output torque. Importantly, even with optimal control, which ensures the disengagement of the offgoing clutch and engagement of the oncoming clutch without engine flare or clutch tie-up, a dip in the output torque is unavoidable unless the power-source torque is further increased. The inertia phase begins when the offgoing clutch starts to slip. In this phase, the engine speed or power must be reduced to synchronize with the input shaft featuring the new gear ratio. The reduction in engine speed, along with other mechanically linked components, such as the drive motor and ISG, induces a significant overshoot in the output shaft torque, negatively affecting the shift quality. In conventional engine-driven vehicles, compensation for this inertial torque is typically achieved through engine-torque reduction control. However, in HEVs, the regenerative operation of the drive motor can be utilized to compensate for the inertial torque, resulting in a significantly enhanced fuel economy compared with traditional engine-driven vehicles. The subsequent end phase begins when the oncoming clutch is fully engaged with the engine. Unfortunately, the lock-up of the oncoming clutch often triggers driveline oscillations, negatively affecting the shift quality. These oscillations primarily result from the difference between the dynamic torque of the clutch before lock-up and its static torque after lock-up. As illustrated in Figure 3, the precise control of the clutch and power sources during the inertia and end phases is crucial, given the relatively substantial driveline oscillations occurring in these phases compared with the torque phase, where speed or torque variations are minimal. Effectively addressing post-torque phase oscillations without extending the shift time is key to enhancing the overall shift performance.

Figure 3.
Clutch−to−clutch shift process of a DCT vehicle (1–2 upshift; clutch 1: offgoing, clutch 2: oncoming).
2.2. Model-Based Analysis
2.2.1. Driveline Model
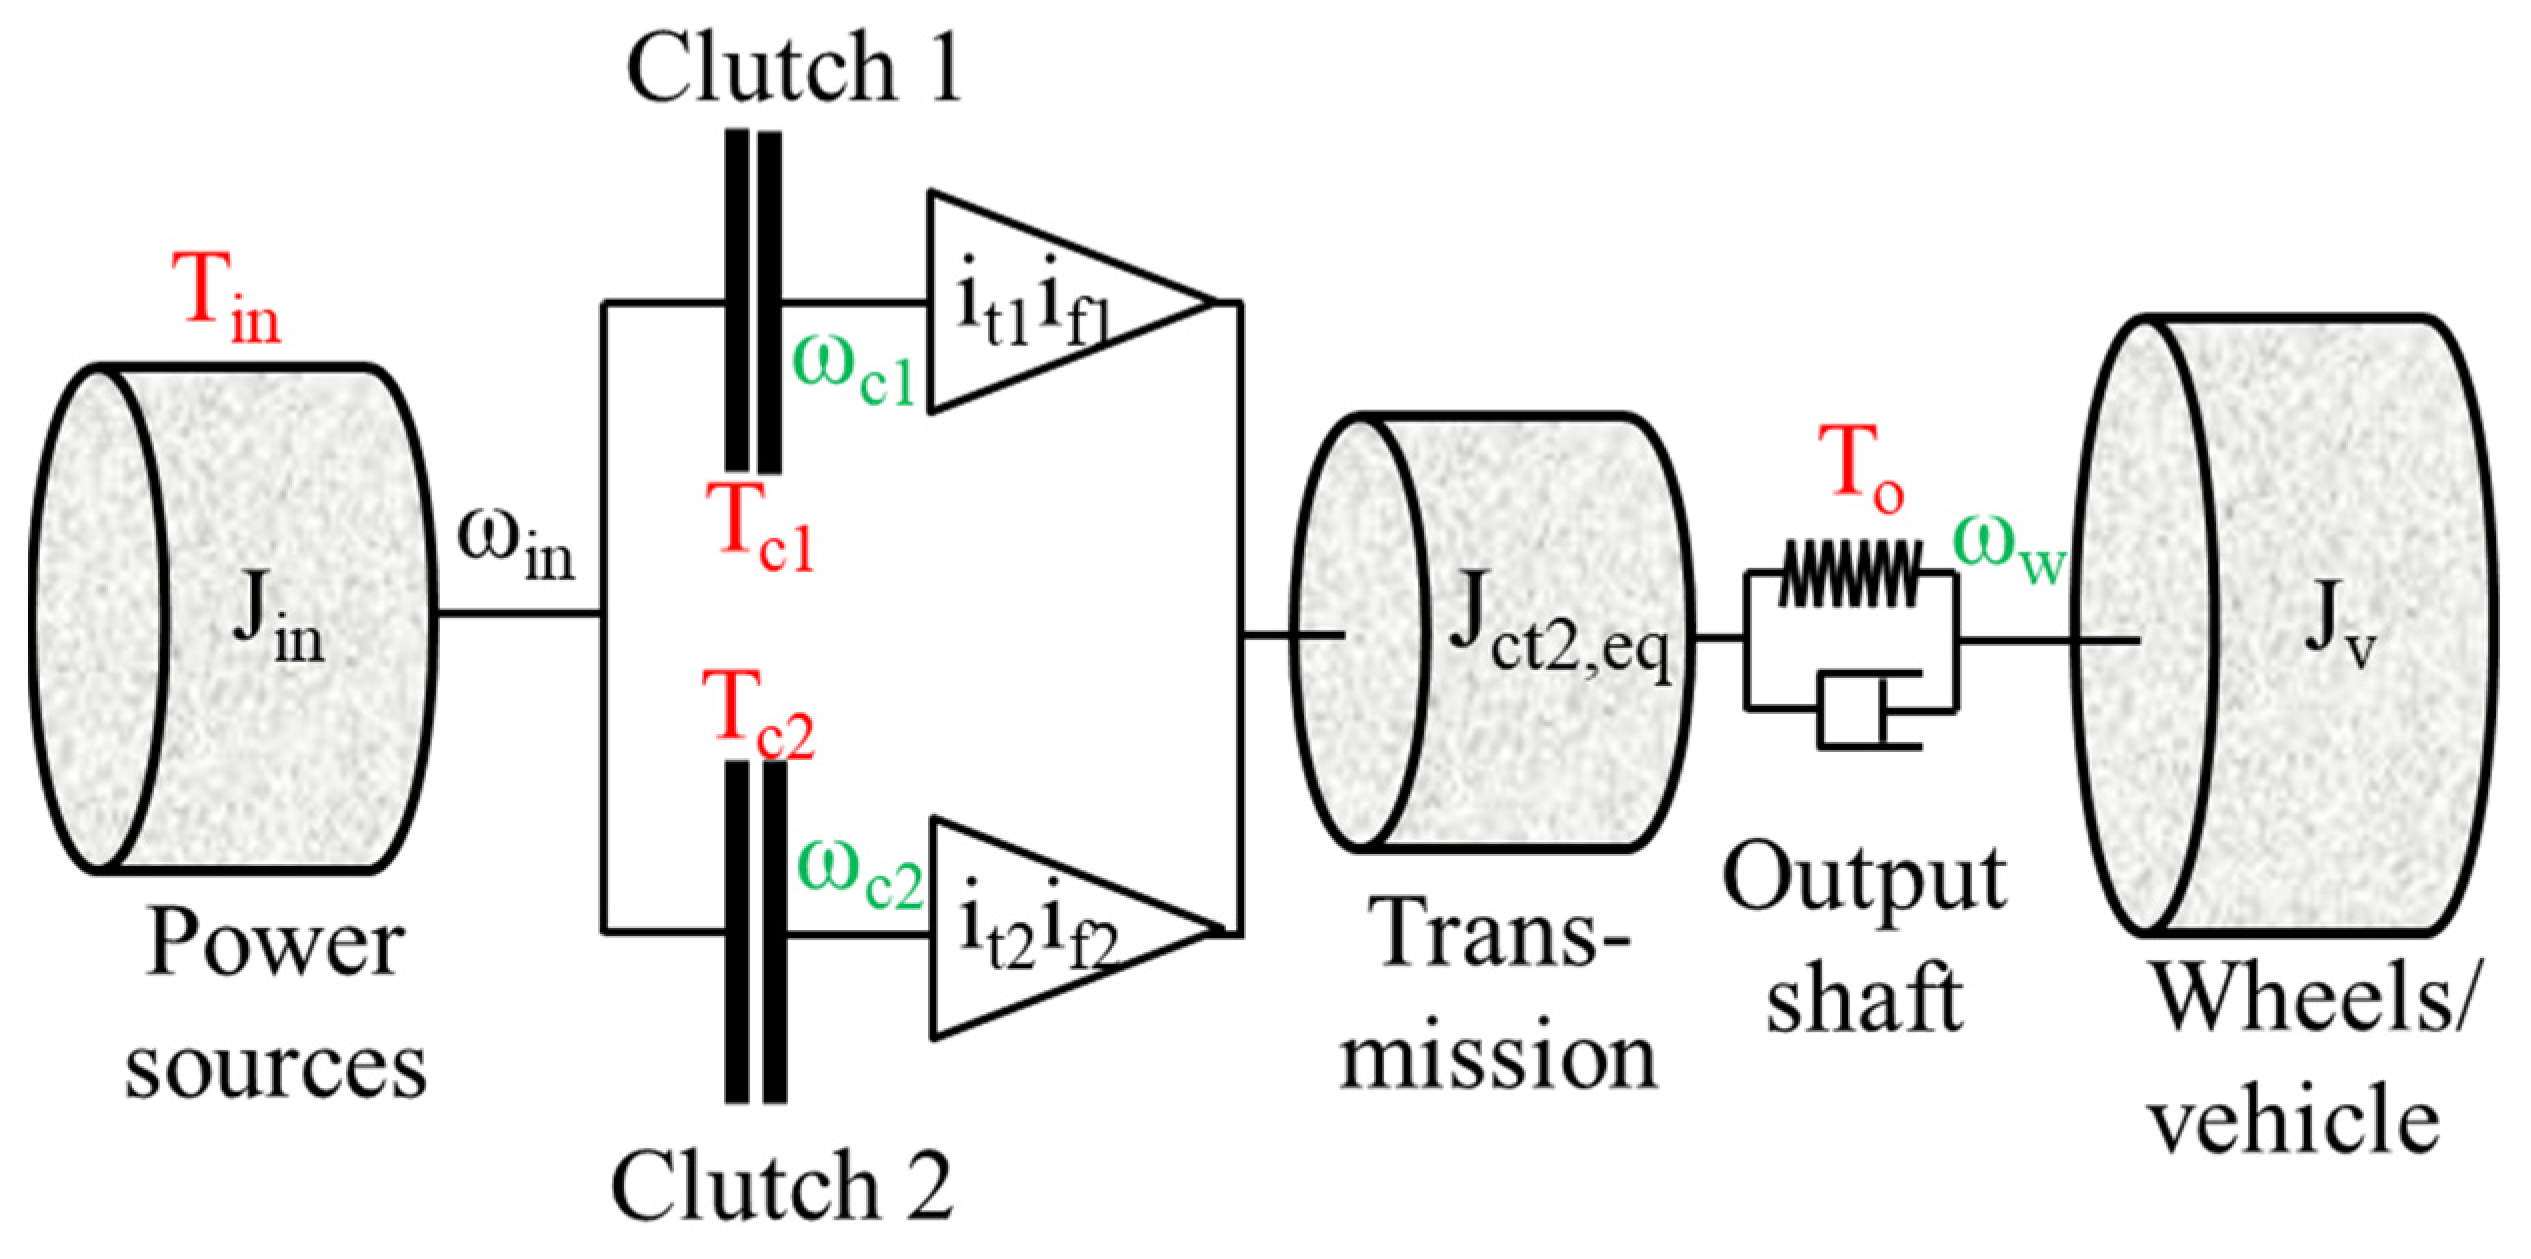
This section introduces a third-order model for the driveline of a HEV equipped with a DCT, as shown schematically in Figure 4 [20,21]. In contrast to traditional engine-driven vehicles, the examined parallel HEV incorporates two additional electric machines: an ISG and a drive motor [22]. Given that the focus of this study is on HEV gear shift control, our analysis is limited to parallel-mode operations, where the engine clutch is engaged and the vehicle is either partially or fully driven by the engine. In Figure 4, the variables ω, J, and T represent the angular speed, inertia, and torque, respectively. The subscripts, in, c1, c2, o, w, and v denote the power sources (drive motor and engine), input shaft with clutch 1, input shaft with clutch 2, output shaft, wheel, and vehicle, respectively.
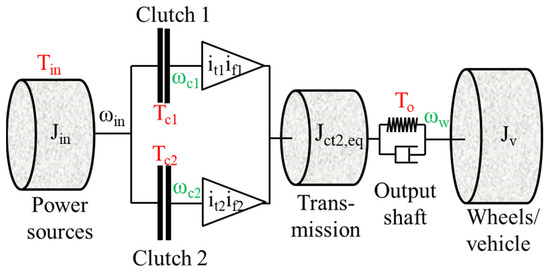
Figure 4.
Driveline model structure.
The speed dynamics of the power sources operating in the parallel mode are expressed by
where Tin represents the input torque from the power sources, which is defined as the sum of the torques from all the power sources, and Jin represents the equivalent inertia of the power sources, including the inertia of all components co-rotating with the drive motor.
Considering Jct2,eq as the equivalent inertia seen from clutch 2, which includes the inertias of all components rotating synchronously with input shaft 2, the speed dynamics of input shaft 2 are expressed as
where it1 and it2 represent the gear ratios of input and transfer shafts 1 and 2, respectively, and if1 and if2 denote the final reduction gear ratios of each shaft.
The torque transmitted through each clutch is determined by its state, which can be disengaged, slipped, or engaged [23].
Here, , , , , , and represent the kinetic and static friction coefficients, actuator normal force, effective torque radius, number of friction surfaces, and tuning parameter for determining slipping condition for each clutch, respectively. The subscript 1 and 2 denote clutch 1 and clutch 2, respectively. The clutch state is defined according to the magnitude of the slipping speed and a comparison between the maximum torque capacity () and the transmitted torque through the clutches from power sources ().
In the third-order driveline model, we neglect the torsional compliance in input shafts 1 and 2. Consequently, the difference in speed dynamics between these shafts is solely due to the gear ratios, as indicated by Equation (2). The speed dynamics of the wheel are expressed by Equation (5), using the torque balance principle.
Here, To and Tv represent the output shaft torque and vehicle load torque, respectively, and Jv represents the vehicle inertia. The output shaft torque can be expressed by Equation (6) using the torsional compliance model:
Here, the variable θ stands for torsional angle of the shaft, while and represent the torsional stiffness and damping coefficient of the output shaft, respectively.
2.2.2. Investigation of Driveline Vibrations
The evaluation of the driveline torsional vibrations involves a detailed examination of the oscillations in the output shaft torque. As shown in Figure 3, these torque oscillations result from three distinct phenomena during an upshift: torque dip, torque overshoot, and clutch lock-up oscillation. To enhance the shift quality, it is crucial to minimize these phenomena without extending the shift time. Equation (2) provides insight into the torque dip phenomenon. Owing to the larger gear ratios of clutch 1 (it1if1) compared with clutch 2 (it2if2), the output shaft torque inevitably decreases at the end of the torque phase, where the cross-shifts of clutches 1 and 2 are performed.
Furthermore, according to Equation (2), the output shaft torque is predominantly influenced by the torque of clutch 2 during the inertia phase, where . According to Equation (1), the magnitude of the equivalent inertia of the power sources Jin is correlated with the amount of torque transmitted through clutch 2 required for synchronization with the power sources. Therefore, reducing the inertia or extending the synchronization time (shift time) is effective for eliminating torque overshoot; however, this approach may not be practical with regard to control.
Finally, lock-up oscillations arise primarily from the difference between the dynamic torque (the second equation in (4)) and static torque (the third equation in (4)) of clutch 2 during the inertia phase. Specifically, at the beginning of the inertia phase, the torque of clutch 2 can be modeled using the second equation in (4) to predict the behavior of the clutch during slipping. Subsequently, when synchronization between the clutch and drive motor is complete, the clutch torque can be expressed by the third equation in (4), indicating that the clutch torque is directly dependent on the power-source torque when engaged. Reducing the disparity between the dynamic and static torques of the clutch through a sophisticated control strategy is crucial for eliminating oscillations following clutch lock-up.
2.3. Experimental Analysis
Experiments involving an electrified powertrain with a DCT were conducted on a test bench to investigate the clutch-to-clutch shift process in detail. The objective was to validate and gain a more comprehensive understanding of the findings derived from the model-based analyses.
2.3.1. Experimental Setup
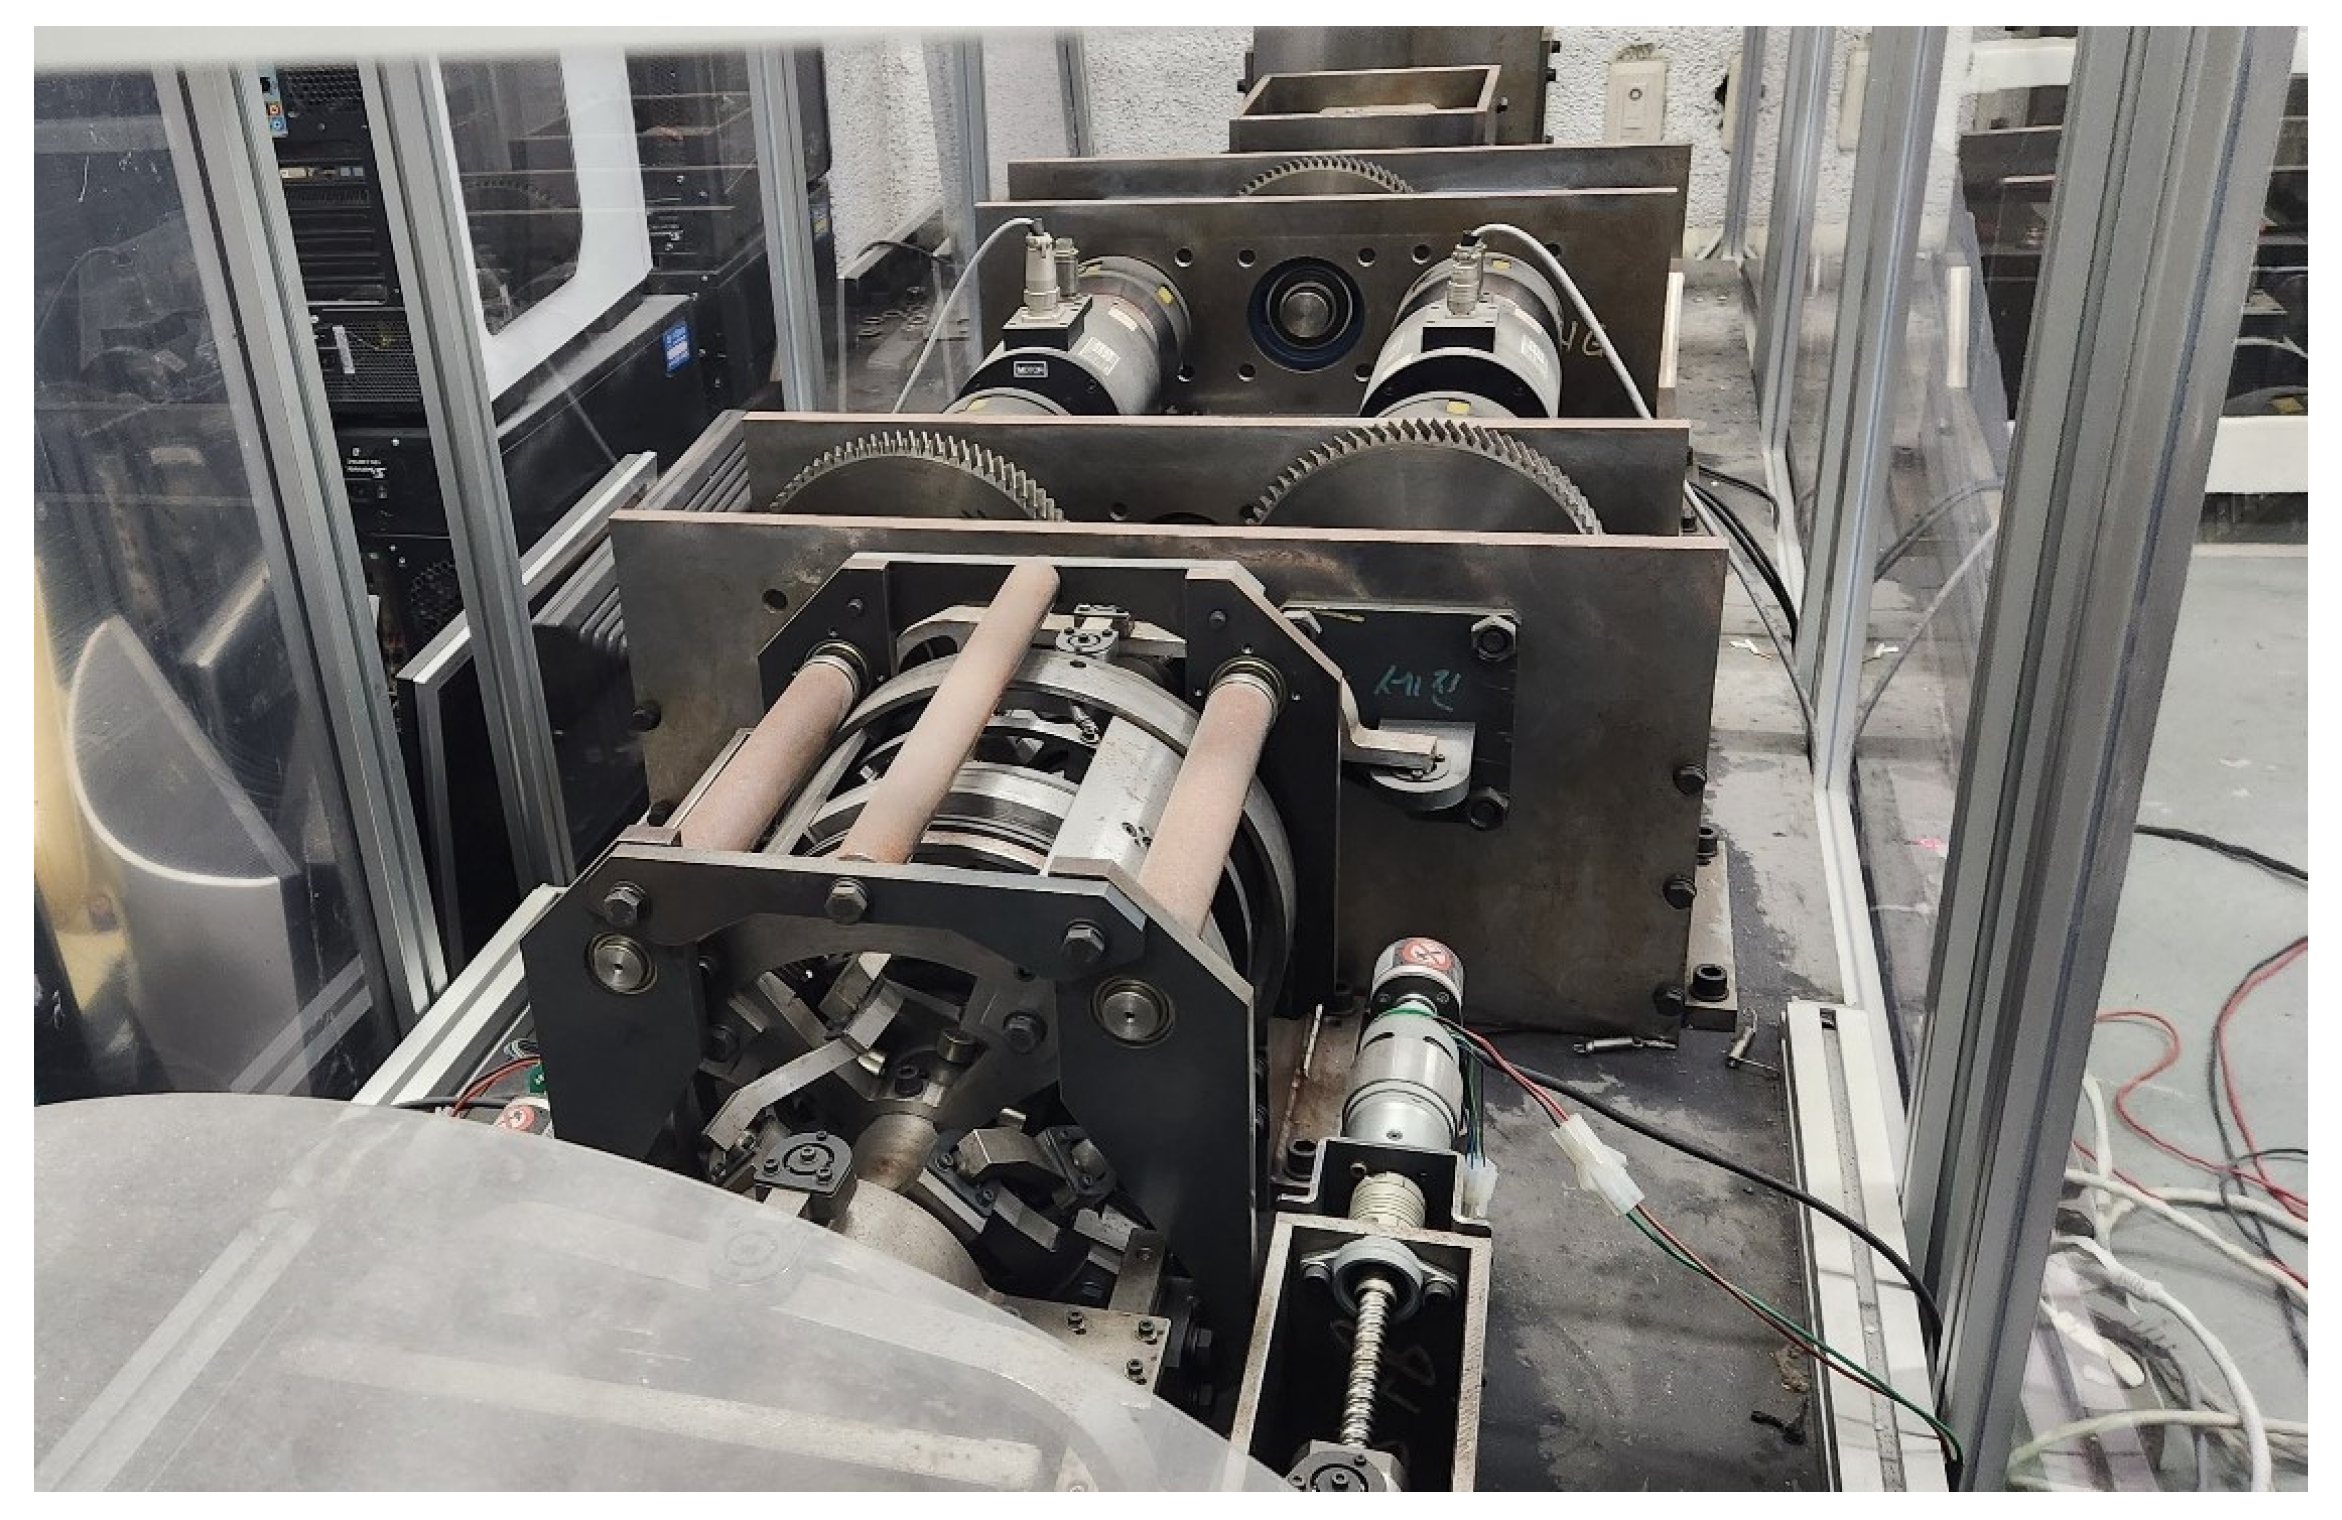
Figure 5 illustrates the experimental setup of the test bench, whose parameters are presented in Table 1. The test bench had the same mechanical configuration as production DCTs, with encoders attached to multiple shafts to supply angular speed data to the controller. Torque transducers were added to the shafts solely for validation purposes. Signal processing from these sensors and real-time execution of the control algorithm were performed using a MicroAutobox dSPACE 1401. Importantly, this test bench is well suited for evaluating driveline control in a parallel HEV—particularly during parallel-mode operation. The substantial inertia of the power source effectively represents the equivalent inertia of all the components on the power-source side of an actual vehicle.

Figure 5.
Test-bench setup.

Table 1.
Parameters for the test bench.
2.3.2. Experiments: Open-Loop Control
Case #1: Fast clutch-to-clutch shift
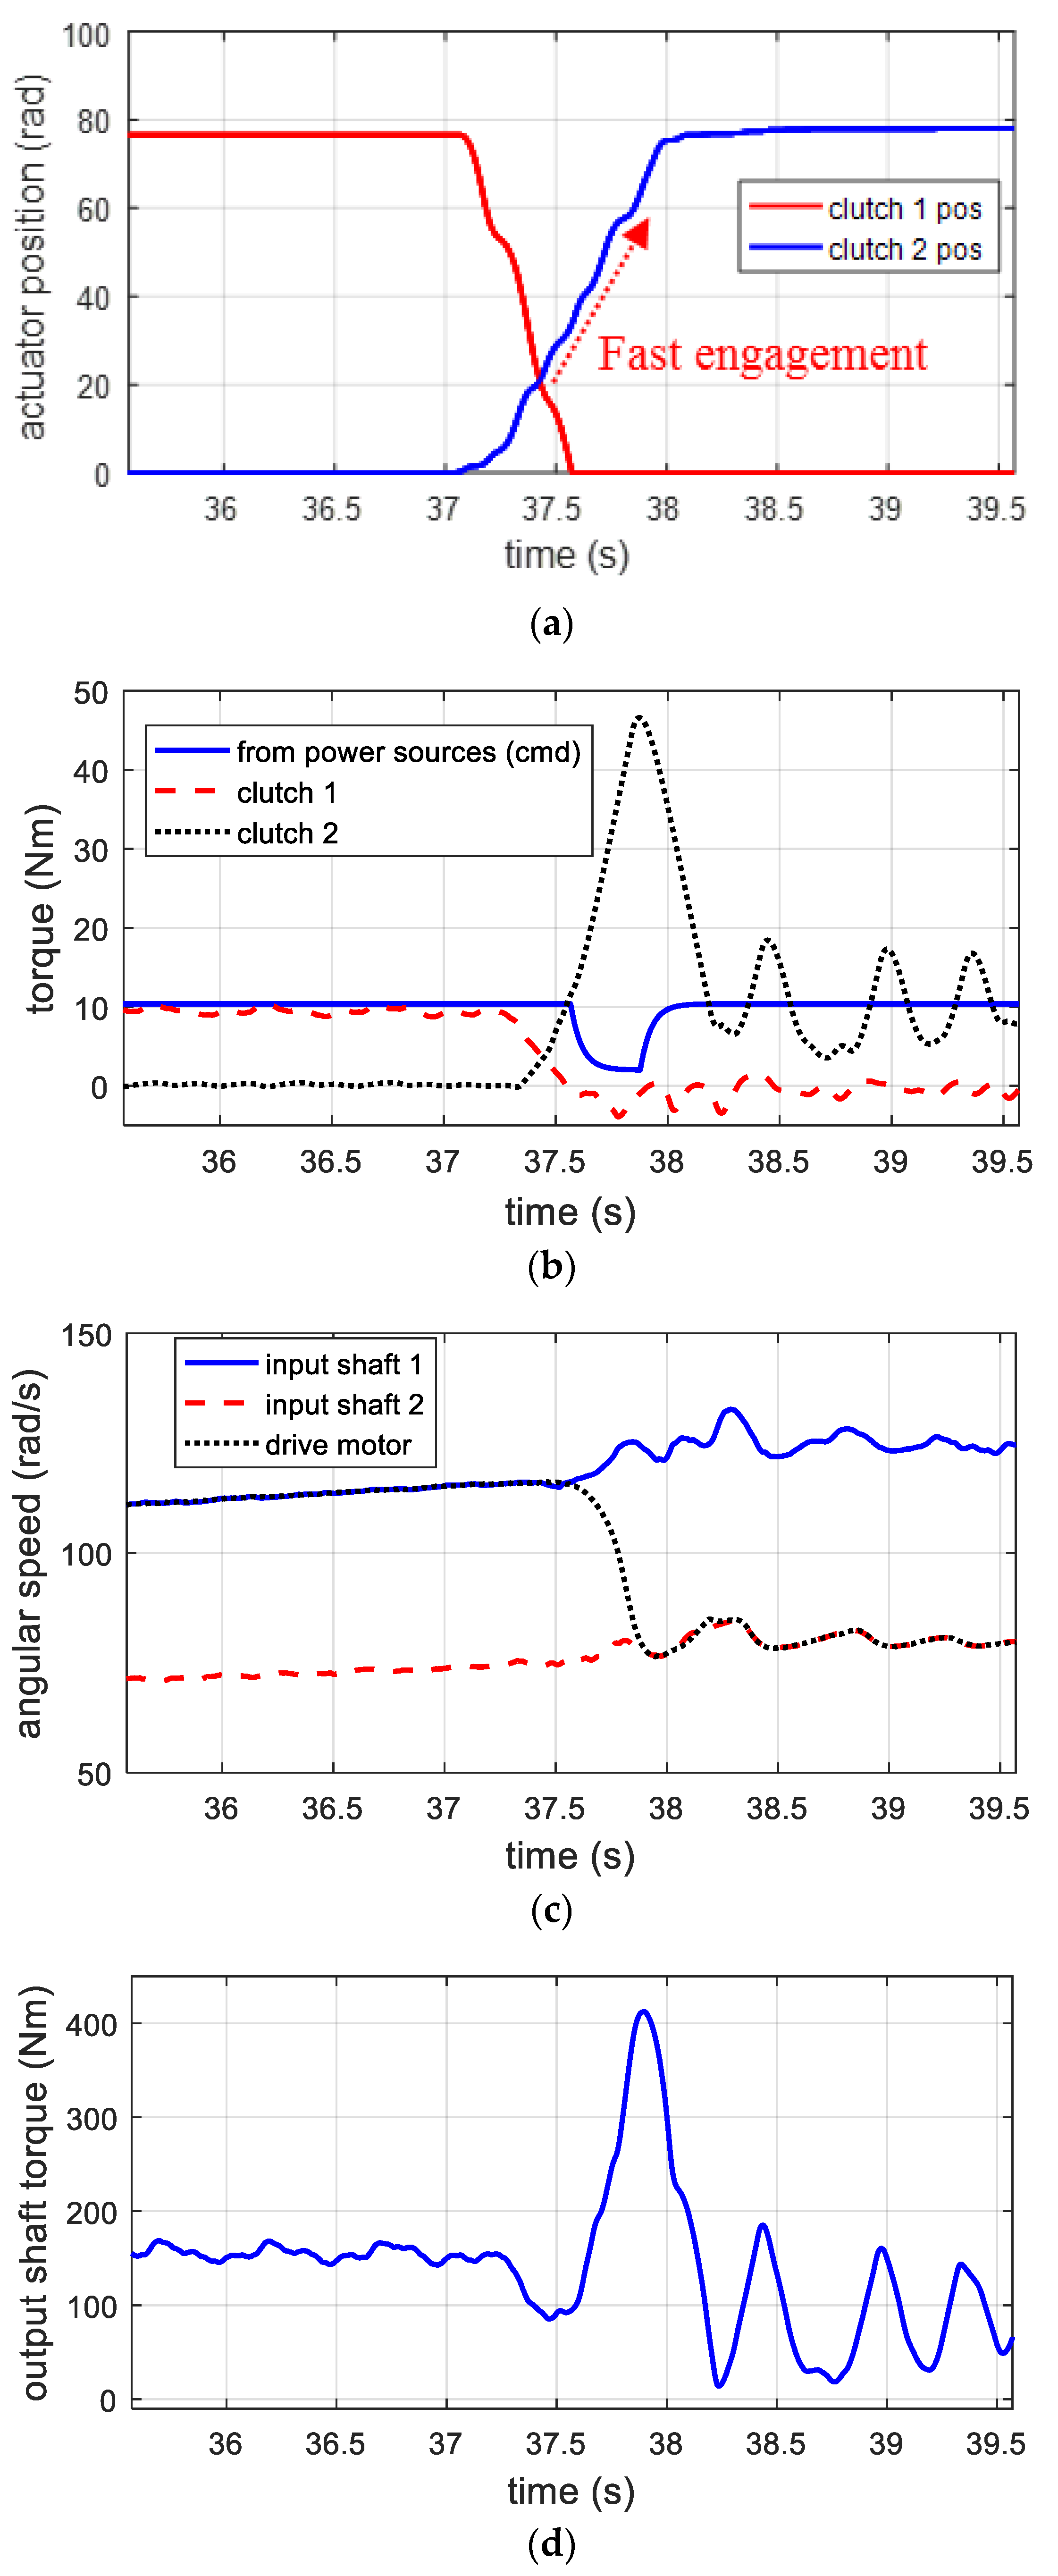
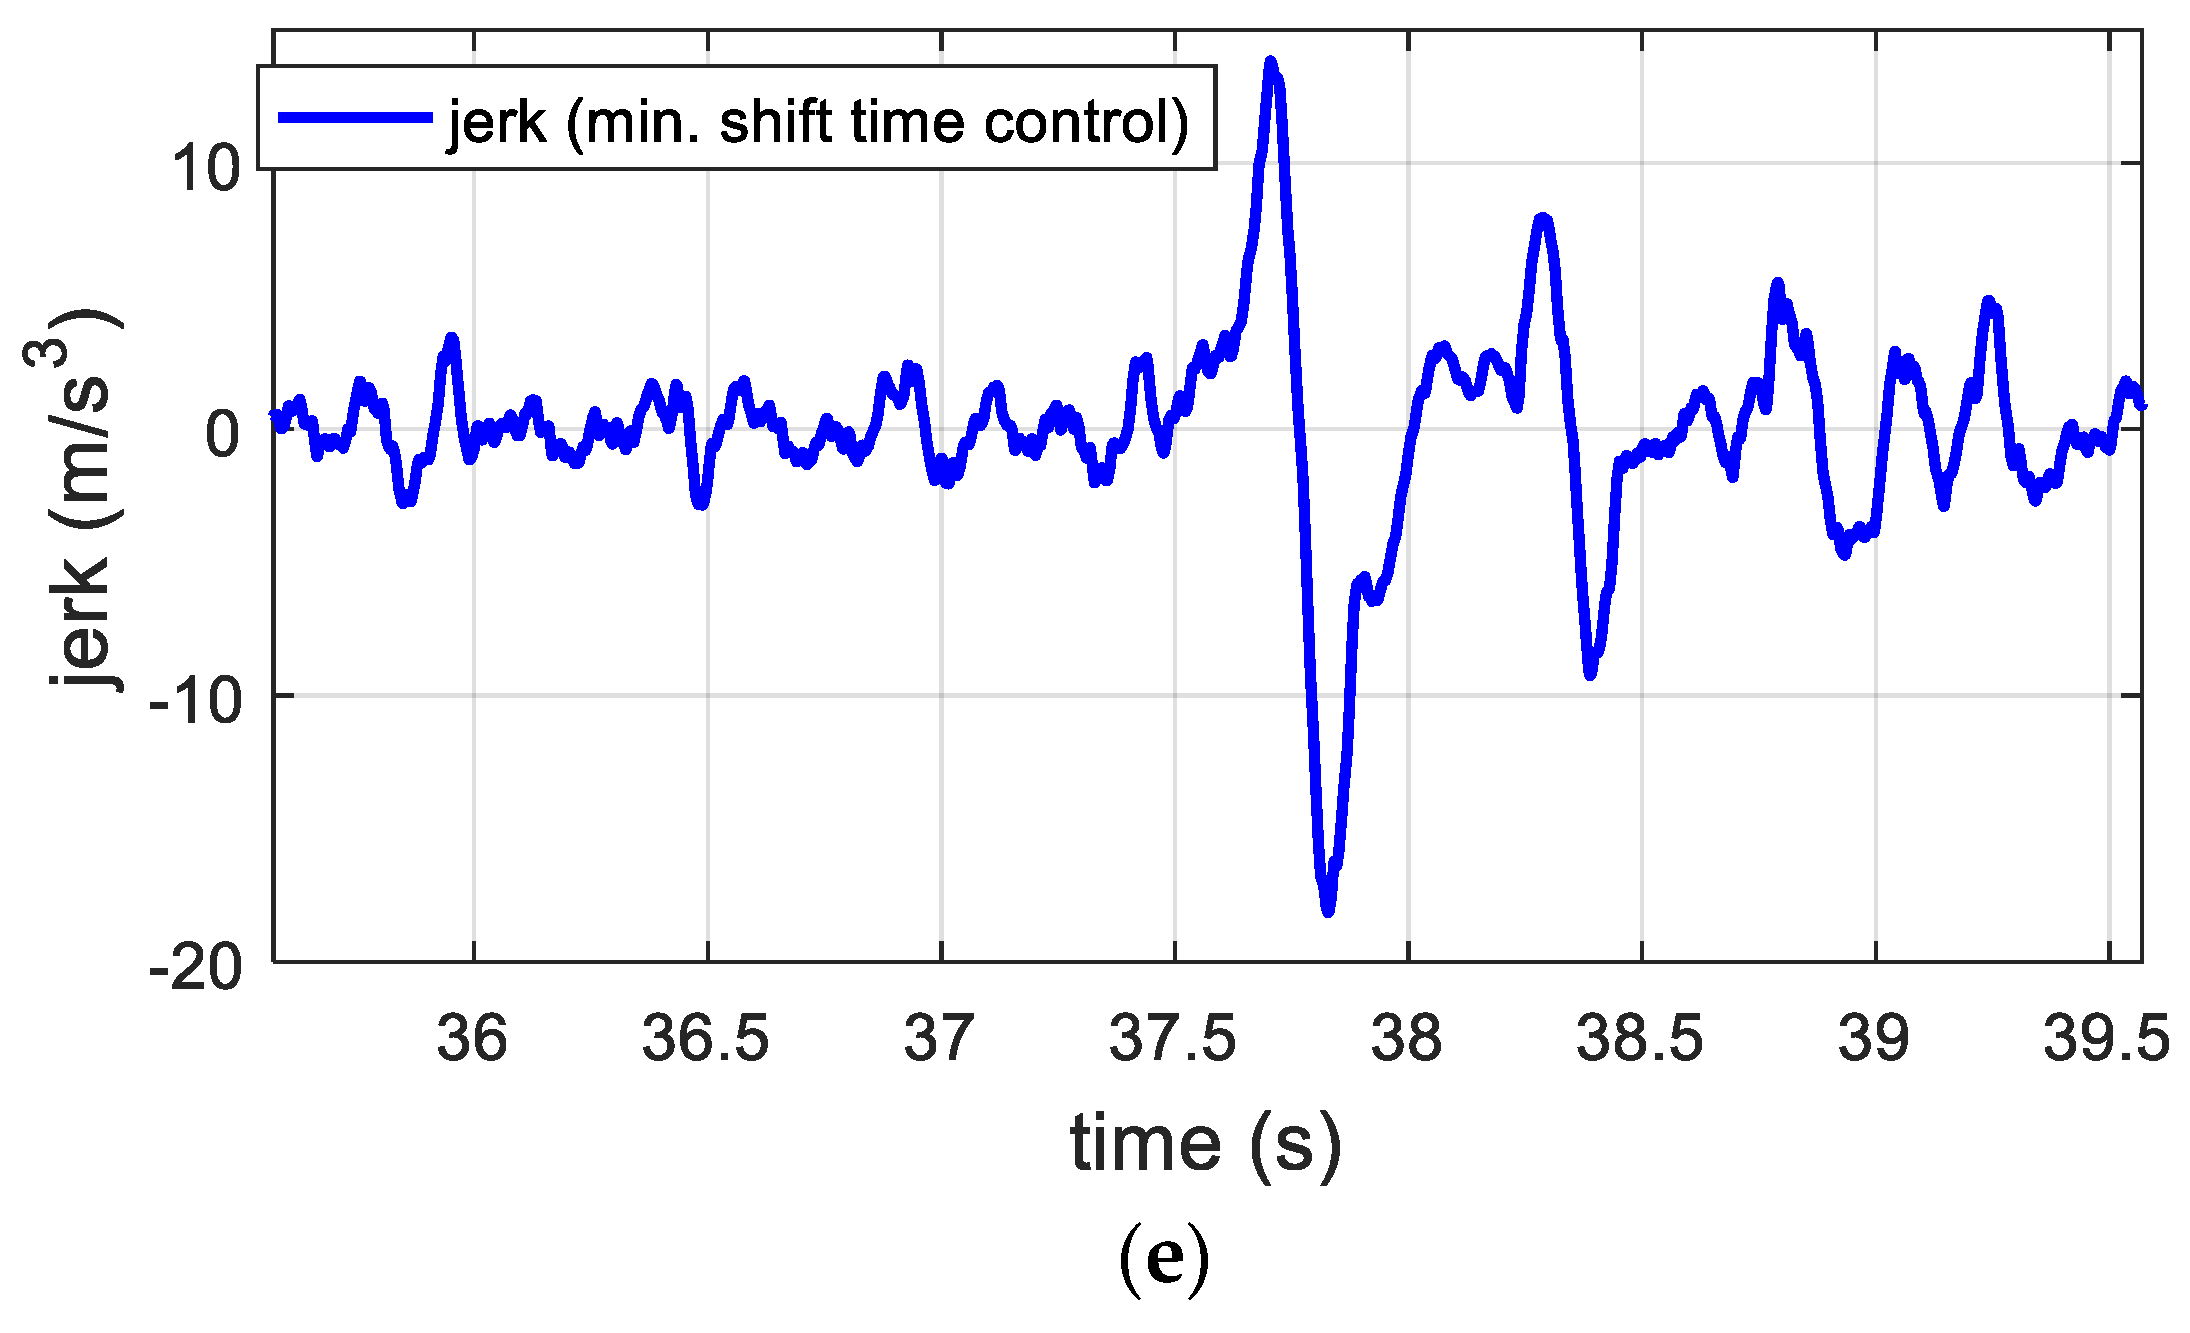
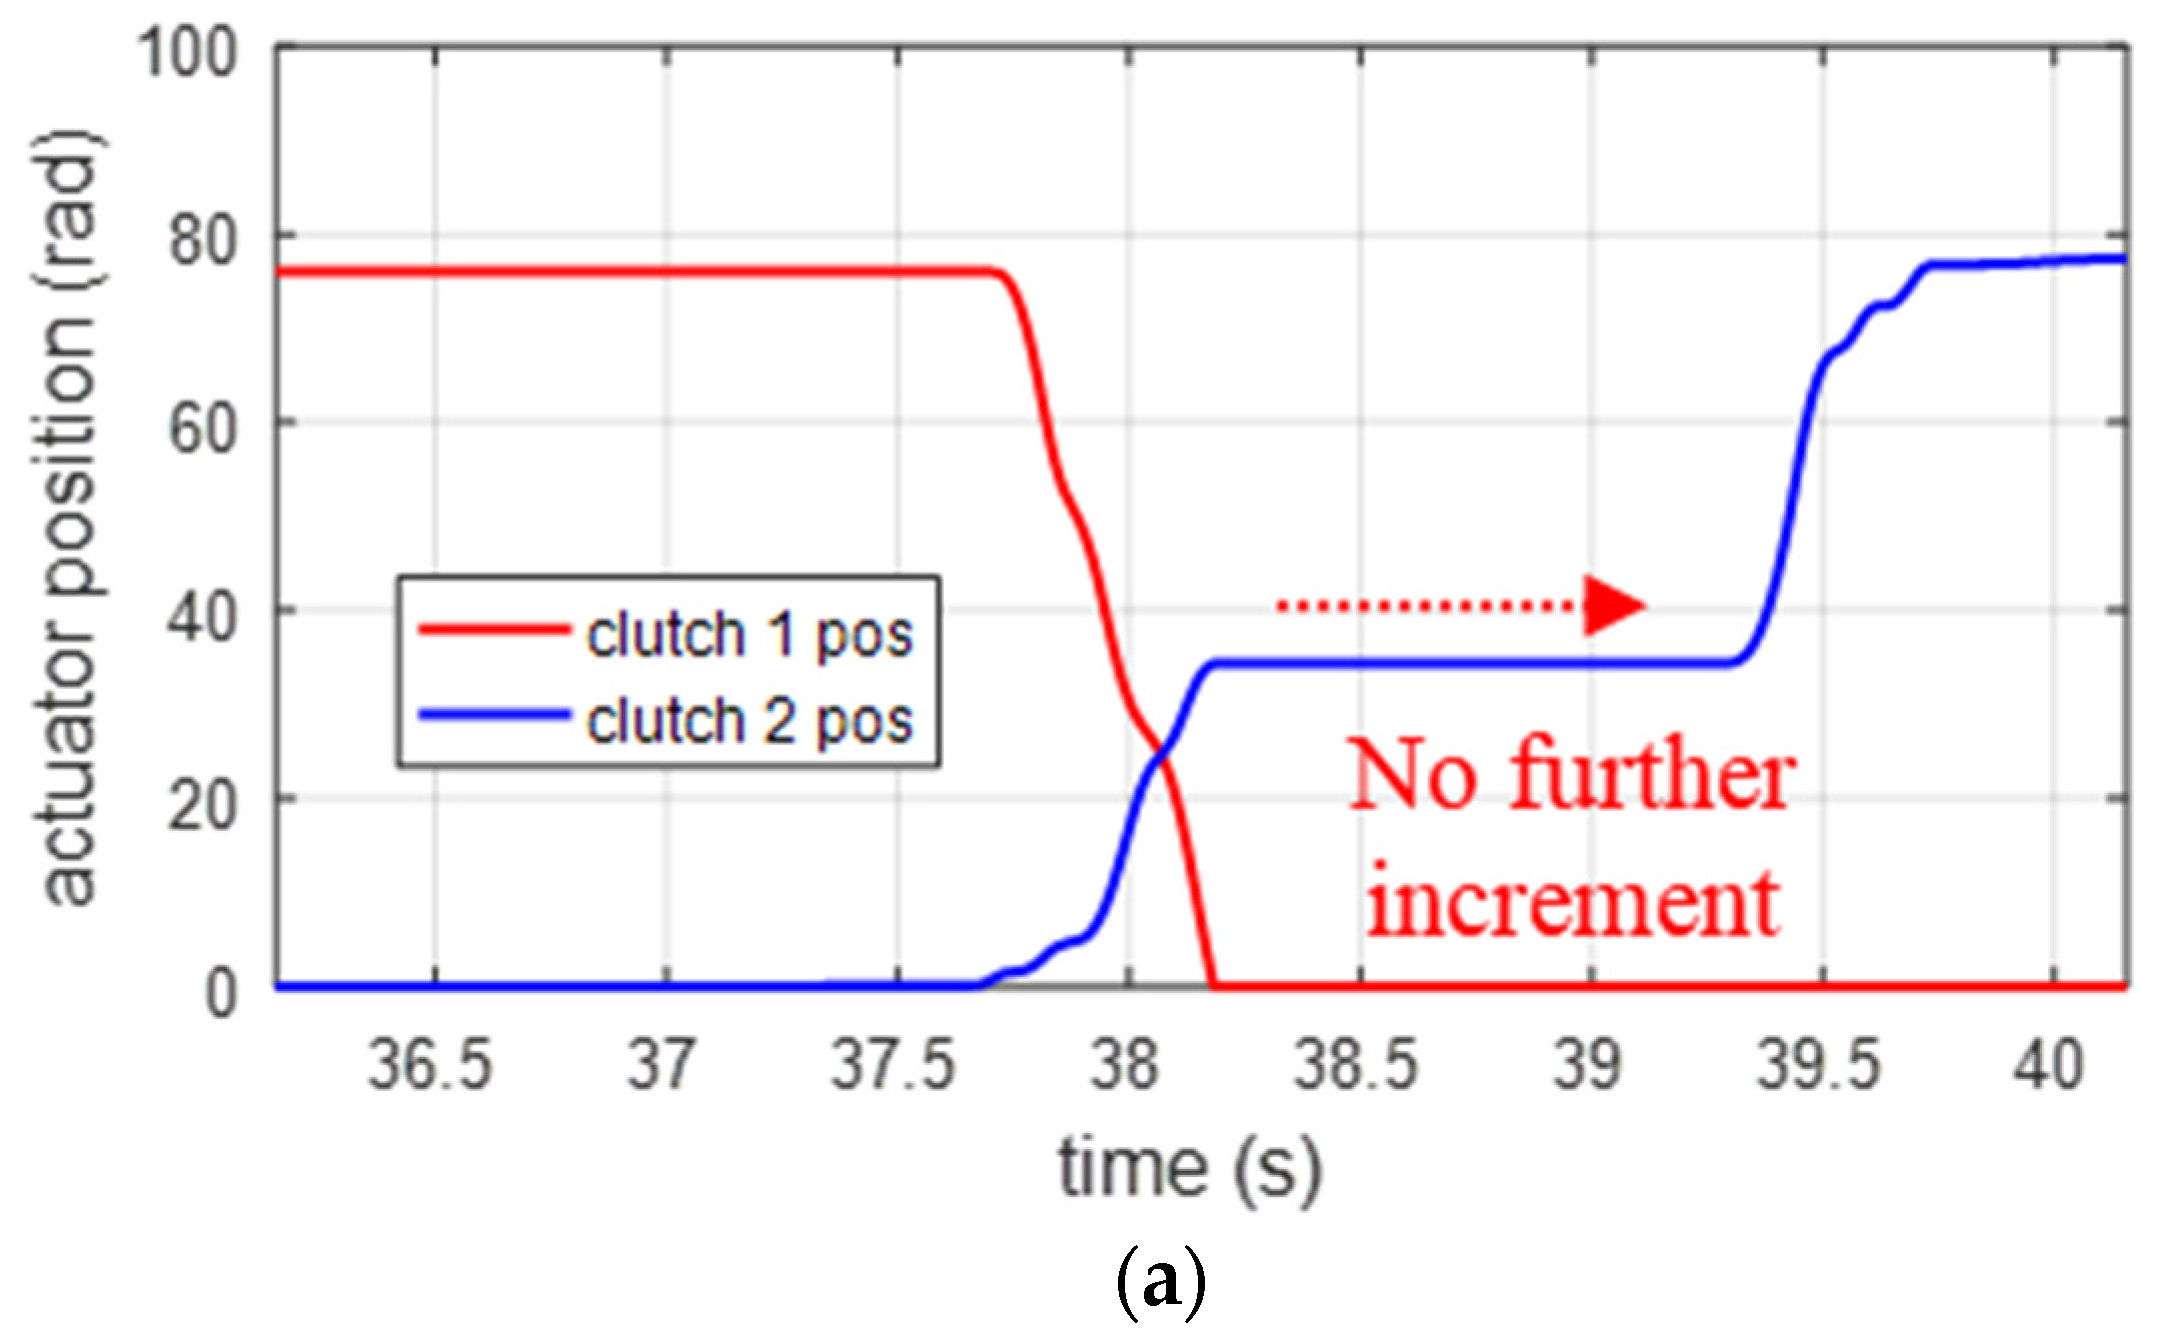
To investigate the tradeoff between smooth and fast shifts, experiments were conducted on a DCT test bench under two extreme scenarios. The first is the case denoted as “fast gear shift” where the oncoming clutch is controlled in an open-loop manner such that it is engaged as fast as possible while the power-source torque is sufficiently reduced during the inertia phase to minimize the shift time. The results of fast-shift control are shown in Figure 6. As the position of the oncoming clutch increases rapidly, the torque transmitted through the clutch increases. The large dynamic torque generated by the oncoming clutch leads to a large overshoot in the output shaft torque. The lock-up of the oncoming clutch is achieved at a very large stroke of the actuator, resulting in large lock-up oscillations in the end phase. Such large variations in the output torque significantly degrade the shift quality, as indicated by the jerk plot in Figure 6e. However, a rapid increase in the oncoming clutch torque substantially reduces the synchronization time.
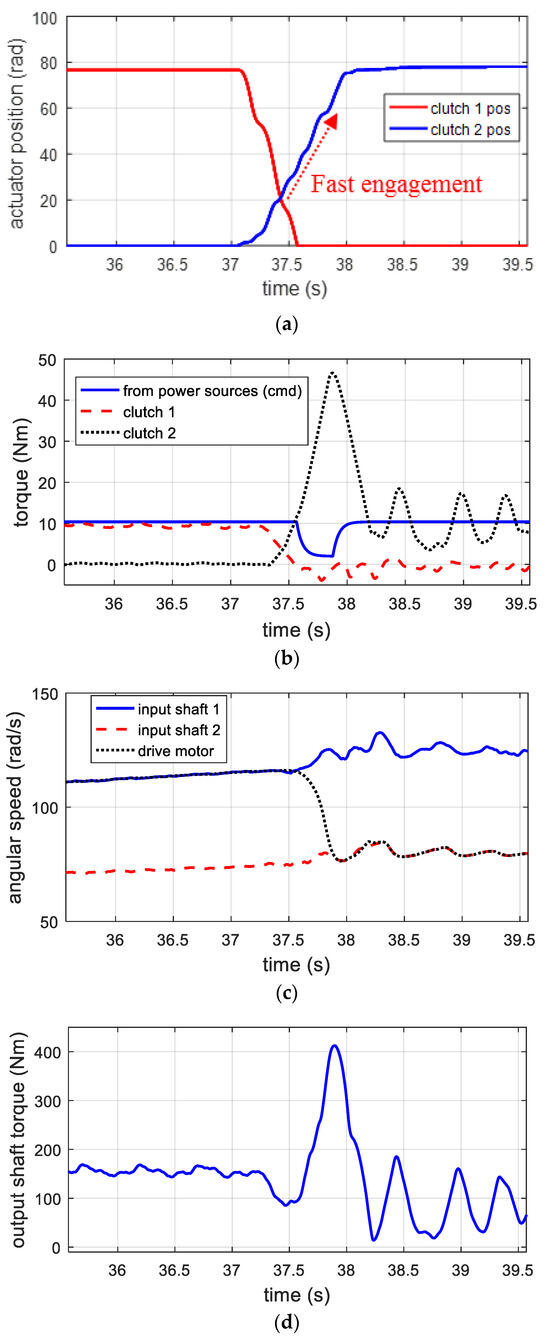

Figure 6.
Experimental results for fast gear shift (open−loop control): (a) clutch actuator positions; (b) torques; (c) angular speeds; (d) output shaft torque; and (e) jerk.
Case #2: Smooth clutch-to-clutch shift
Next, an experiment involving the second scenario—“smooth gear shift”—was performed for comparison. This scenario focuses only on minimizing the jerk by manipulating the oncoming clutch such that its stroke no longer increases during the inertia phase. The corresponding results are presented in Figure 7. In the inertia phase, the actuator stroke of the oncoming clutch is kept constant, which corresponds to small variations in the clutch torque and output shaft torque. In this manner, clutch lock-up is achieved at a very small clutch torque, which significantly reduces the lock-up oscillations compared with the first scenario. After the inertia phase, the clutch position was increased to ensure clutch lock-up until a new gear shift command was entered. The controller used to obtain the results is a simple open-loop controller from physical intuition; however, the results of the smooth shift are consistent with those of “optimal” smooth control specified in [24,25]. The results for the two scenarios are quantitatively compared in Table 2.

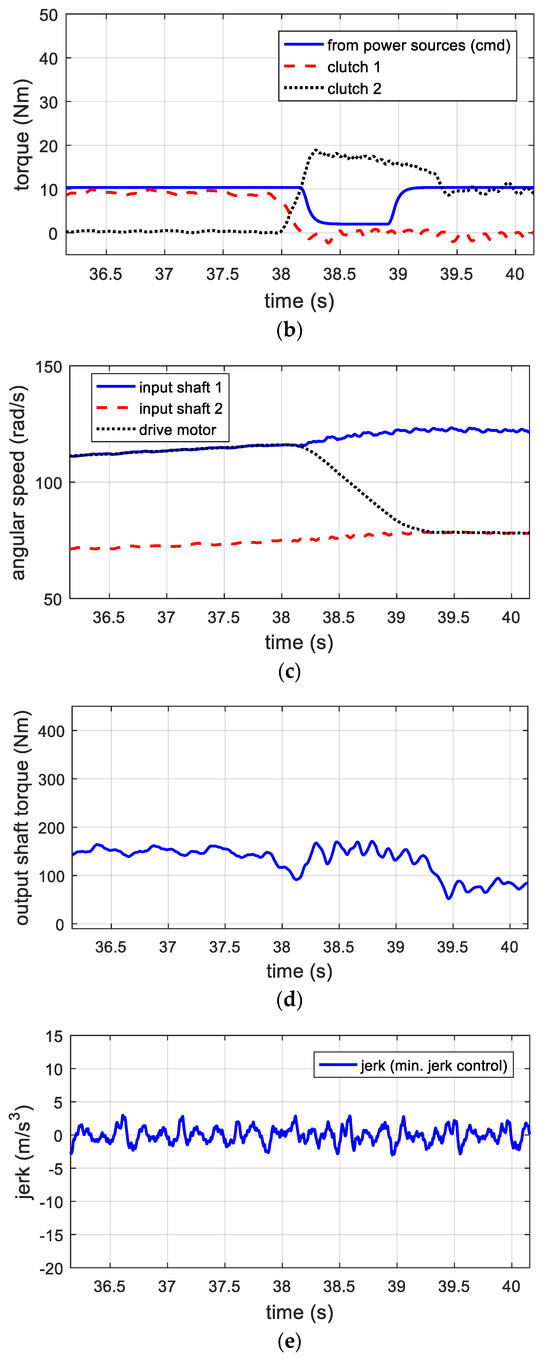
Figure 7.
Experimental results for smooth gear shift (open−loop control): (a) clutch actuator positions; (b) torques; (c) angular speeds; (d) output shaft torque; and (e) jerk.
Table 2.
Comparison of the experimental results for the two scenarios.
The magnitude of the jerk or its squared equivalent directly reflects the physical impact experienced by the driver. However, in assessing the smoothness of a gear shift, it is crucial to consider the shift time. Thus, the integrated value of the squared vehicle jerk during the inertia and end phases was employed to quantitatively assess the shift shock [26]. As indicated by Table 2, the shift time for smooth shift control was nearly twice that for fast shift control. Conversely, the jerk value was significantly lower for smooth shift control than for fast shift control.
In practical terms, balancing the shift performances should consider factors such as the driver pedal position, vehicle conditions, and vehicle type. For instance, in a sports car, when the driver fully depresses the pedal for rapid acceleration, the focus should be on swift gear shifts, with less concern for shift shocks. However, in a sedan, if the driver desires a seamless gear shift by gently pressing the pedal, the shift control strategy should prioritize improving the shift shock rather than minimizing the shift time. A novel shift control strategy capable of fine-tuning based on the driver’s intentions and addressing the identified tradeoff characteristics was developed, as described in the subsequent section.
2.4. Improving Tradeoff between Shift Time and Smoothness
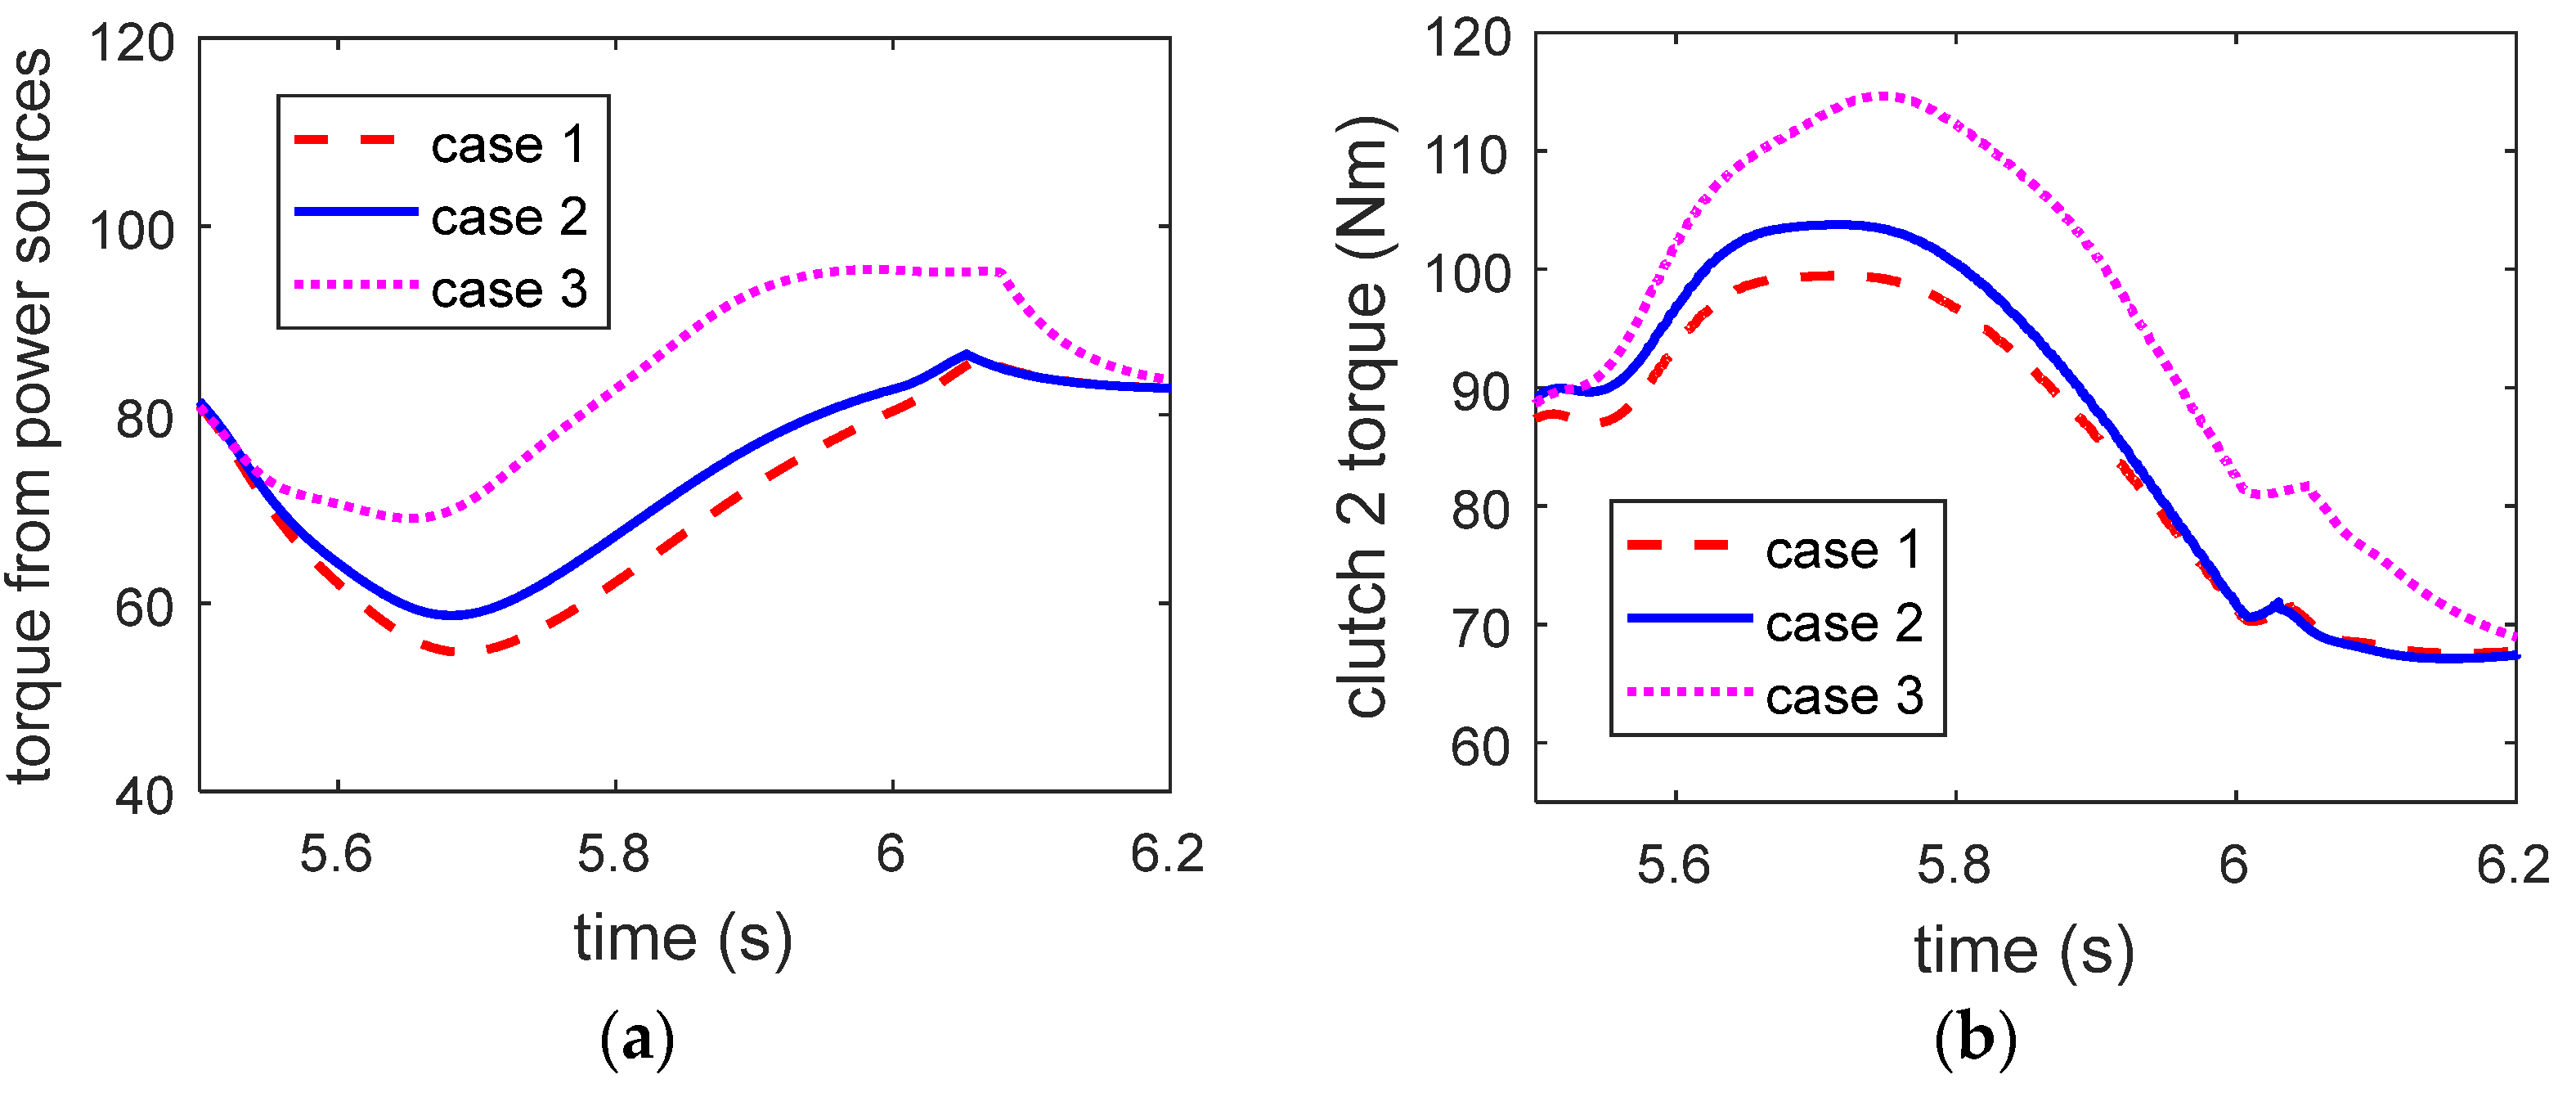
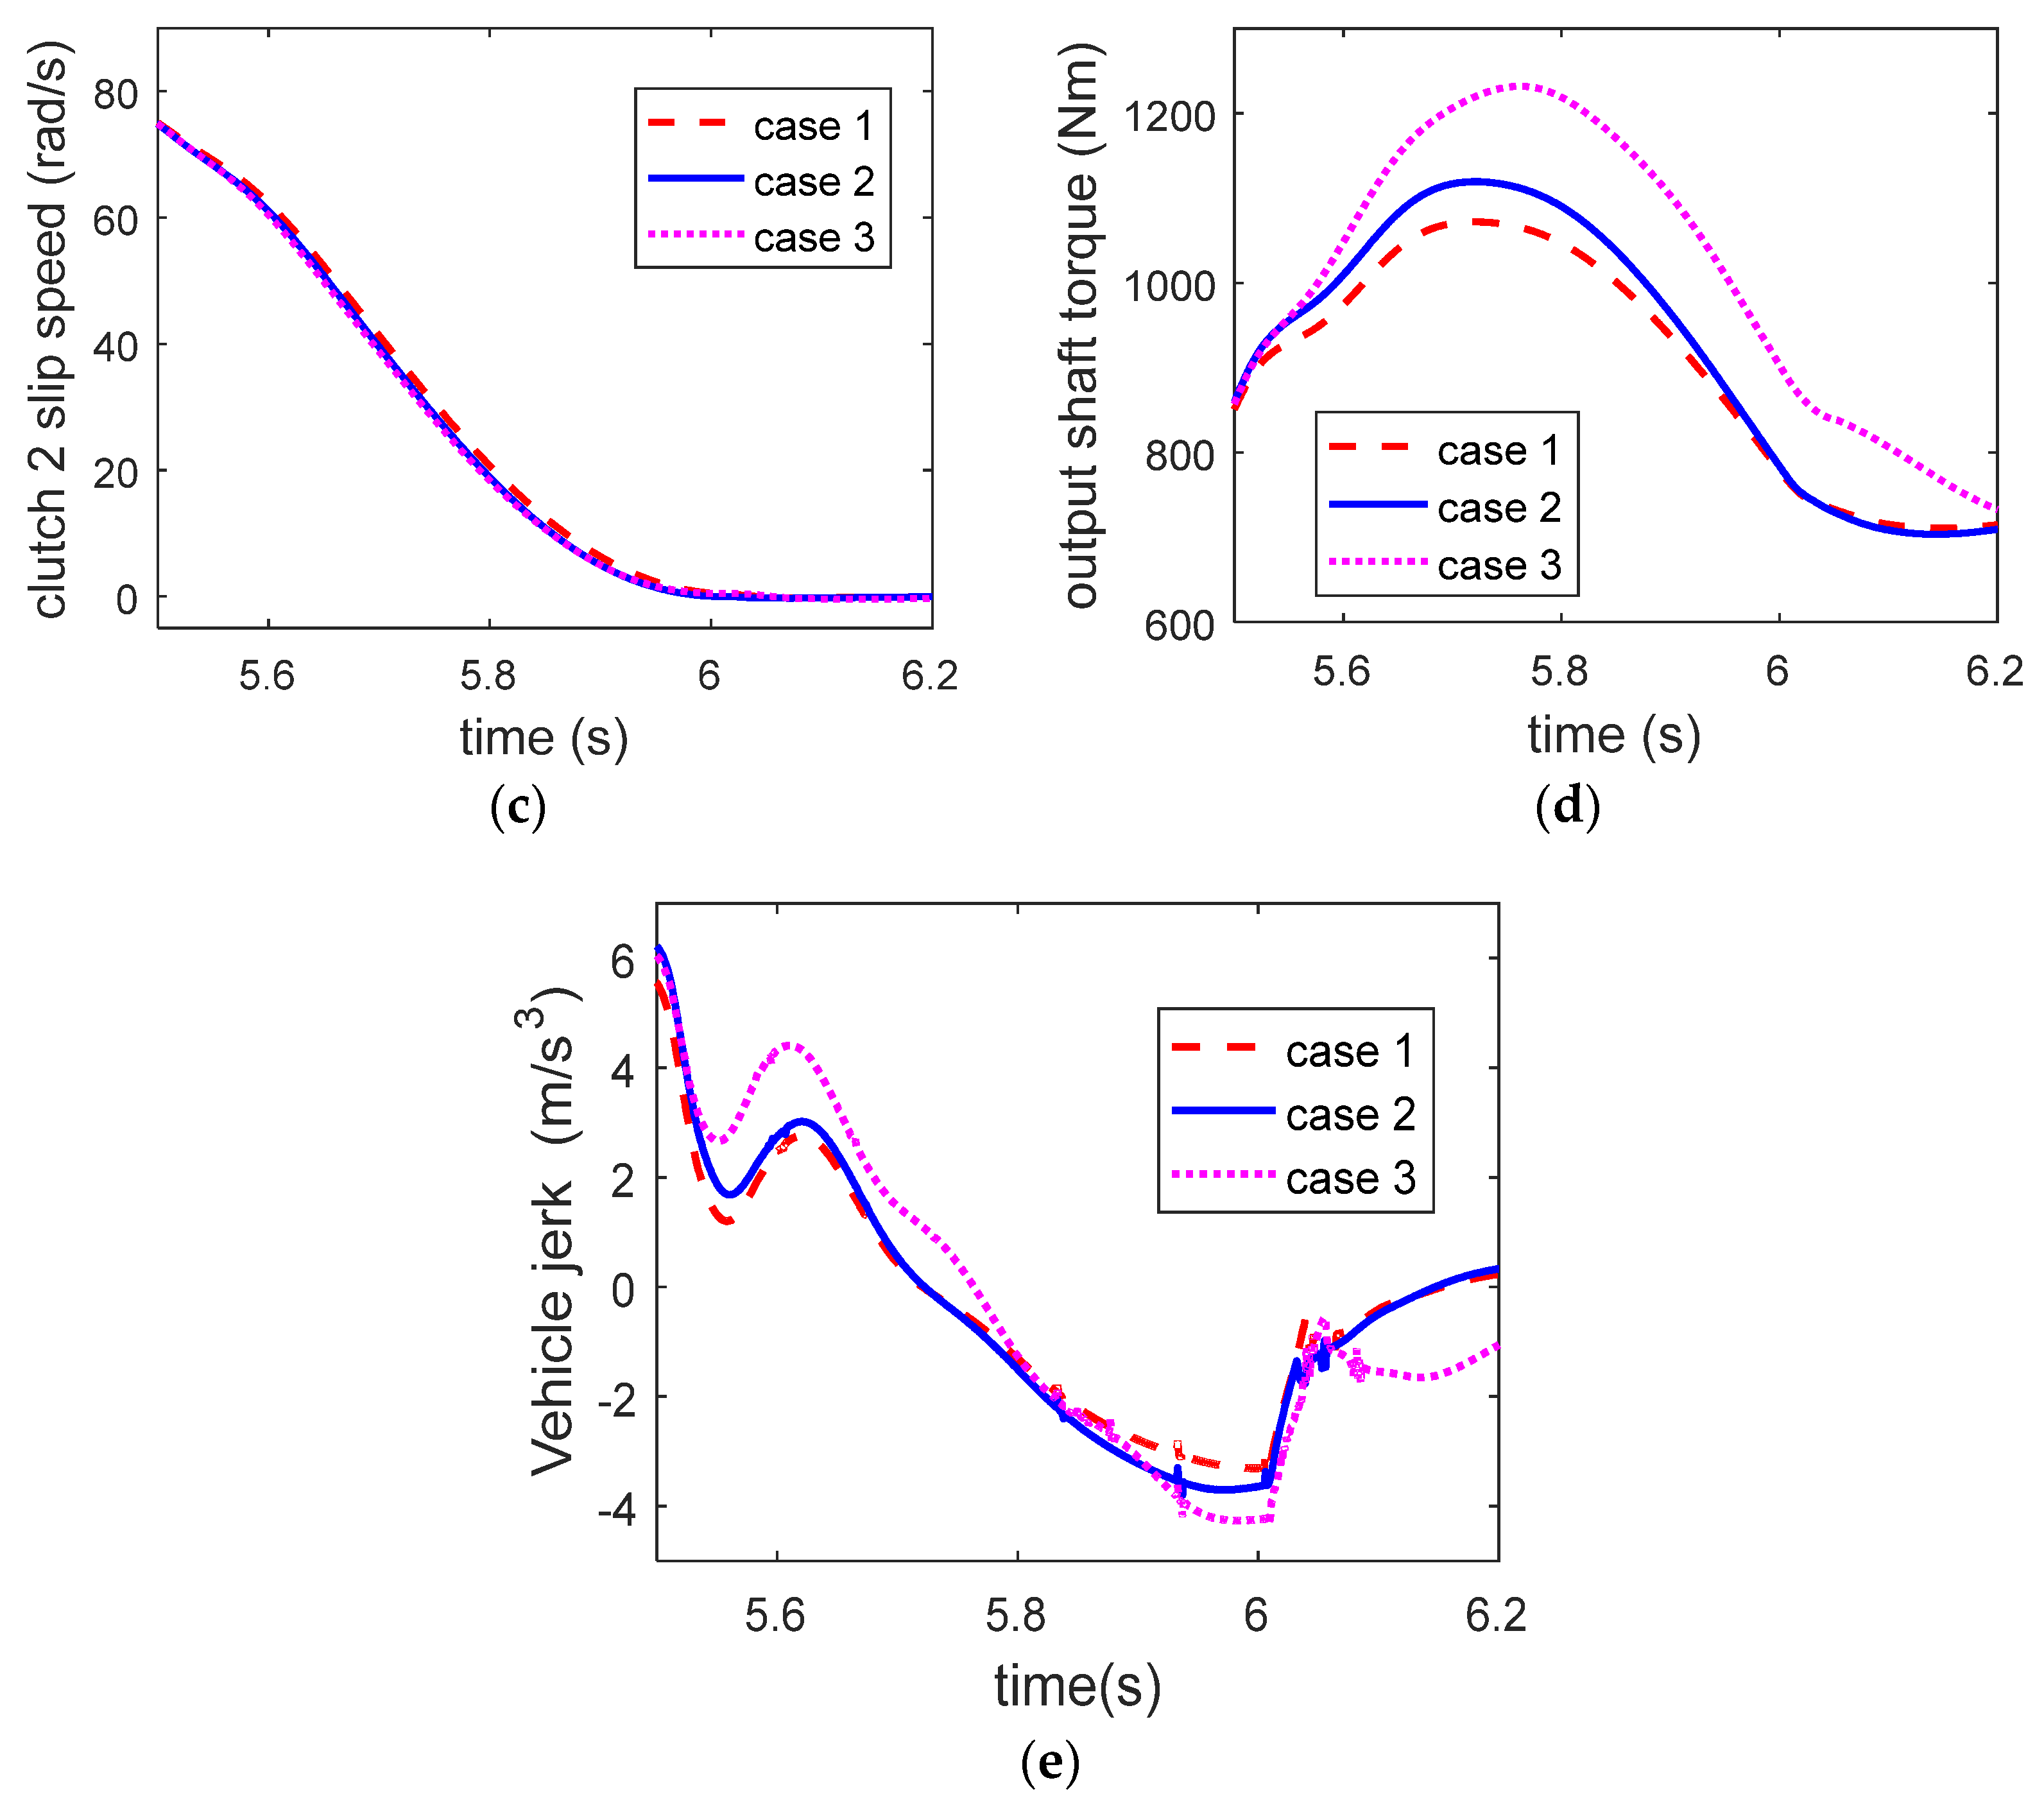
Enhancing the tradeoff between swift and smooth shift performance can be achieved through proper control of both the clutch and the power source. To substantiate this claim, several simulations were performed using the sophisticated DCT driveline model developed in MATLAB SimDriveline, with a focus on the 1–2 upshift condition. In these simulations, three cases were examined, each representing different input combinations of clutch 2 torque and power-source torque during the inertia phase. The three cases exhibited identical slip speed with the same acceleration responses (Figure 8c) but different output torque and jerk responses (Figure 8d,e). Notably, although all three cases exhibited identical shift times, they differed with regard to shift smoothness.
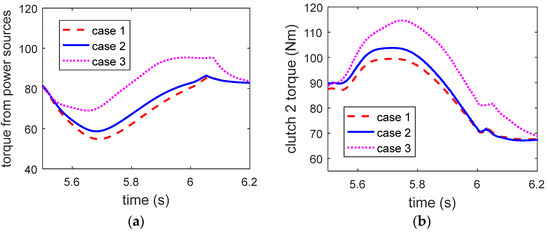

Figure 8.
Shift responses for different input combinations of the clutch and power source torque. (a) torque from power sources (b) clutch 2 torque (Nm) (c) clutch 2 slip speed (rad/s) (d) output shaft torque (Nm) (e) Vehicle jerk (m/s3).
The crucial point is that during the inertia phase, the output torque response is primarily determined by the clutch torque, whereas both the clutch torque and power-source torque contribute to shaping the slip speed response. This highlights the necessity for simultaneous control of the torque and speed states for improving shift quality. In addition, in the context of HEVs, incorporating a drive motor can enhance the overall control performance compared with conventional engine-driven vehicles.
3. Shift Control Strategy for Driveline Vibration Minimization
As mentioned previously, vehicles with DCT require sophisticated control of clutches and power sources to achieve smooth and rapid torque transfer through the driveline during gear shifts. A typical control structure for the gear shift of HEVs with a DCT is shown in Figure 9 where the variable V stands for input for each actuator. The control scheme comprises a reference-trajectory generator and two hierarchical control loops. Initially, the reference-trajectory planning strategy establishes reference values for the control states to satisfy the desired shift performance. Subsequently, the upper-level controller computes the required torque values for the clutches and power sources to satisfy the desired shift performance, whereas the lower-level controller implements specific strategies for each actuator to track the desired torques accurately. The focus of this study is the reference-trajectory planning component, which significantly affects determining the overall shift quality.
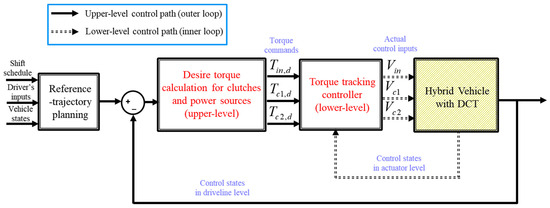
Figure 9.
Typical gear shift control structure for electrified vehicles with DCTs.
In the inertia-phase control strategy, the following three assumptions are considered:
- The ISG is inactive during gear shifts, implying that .
- To prevent excessive torsional distortion in the driveline, the reduction in torque from the power sources is constrained by the inequality: .
- The drive motor is solely responsible for adjusting torque during the inertia phase control within the constraints of motor power.
3.1. Control Strategy and Analysis for Inertia Phase
3.1.1. Reference-Trajectory Planning
According to the insights from the model-based analysis outlined in Section 2, it becomes evident that the control performance during the inertia and end phases notably impacts the quality of the shift. Therefore, this subsection focuses on the development of a detailed strategy for generating reference state trajectories for feedback control during the inertia phase.
Throughout the inertia phase, the output shaft torque and slip speed of the oncoming clutch are designated as the outputs to be regulated by two actuators: the oncoming clutch and the power source (drive motor). Viewing the gear shift control problem as a tracking control problem for the speed and torque states within the vehicle driveline underscores the importance of defining reference trajectories. Because the control states are directly related to shift quality, it is crucial to define their reference trajectories. Assuming minimal changes in the input torque from the power sources during a gear shift, the output shaft torque value at the location of the oncoming clutch is precisely computed using the input torque and gear ratio data. With the proper execution of torque-phase control (beyond the scope of this study), the initial and final values of the output torque align with the static torque of the new gear engagement. Similarly, the slip speed values before and after the gear shift are determined from speed measurements. Consequently, it is essential to design the desired transient trajectories for the states between the initial and final values during the inertia phase, as shown in Figure 10.
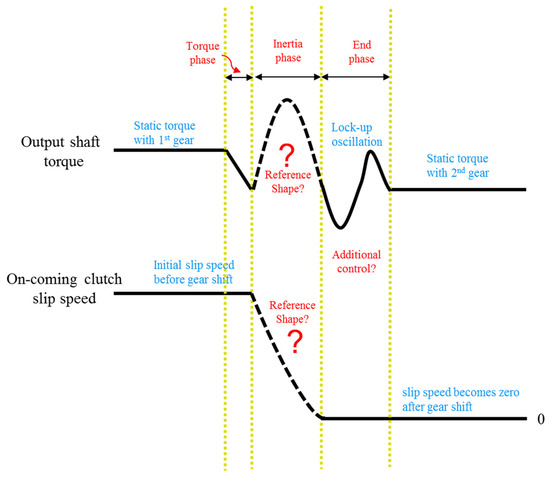
Figure 10.
Development of the control strategy for the inertia and end phases.
The reference values for the two control states were tailored to optimize the shift smoothness, aligning with the desired shift time determined by the driver’s pedal position. As shown in Figure 7, achieving the optimal shift smoothness involves maintaining the desired output torque value at the static torque value corresponding to the engagement of the new gear, even if it potentially compromises the desired shift time requirement. Initially, we designed the reference trajectory for the slip speed of the oncoming clutch to increase the deceleration magnitude until the first half of the inertia phase, thereby expediting the shift time before gradually reducing it until the conclusion of the phase to ensure superior shift quality. Minimizing the slip acceleration at the end of the inertia phase is essential for mitigating the torque discontinuity between the pre- and post-lock-up states [27].
The conditions for the slip speed and acceleration at clutch lock-up to eliminate the lock-up vibrations are expressed as follows:
where represents the end time of the inertia phase.
Additionally, the output shaft torque values should increase until halfway through the inertia phase to facilitate rapid engagement and then decrease during the remaining duration to minimize lock-up oscillations. Specifically, by defining as the static output torque value when the new gear is engaged after lock-up, the initial and final value conditions for the output shaft torque can be expressed as follows:
where represents the initiation time of the inertia phase.
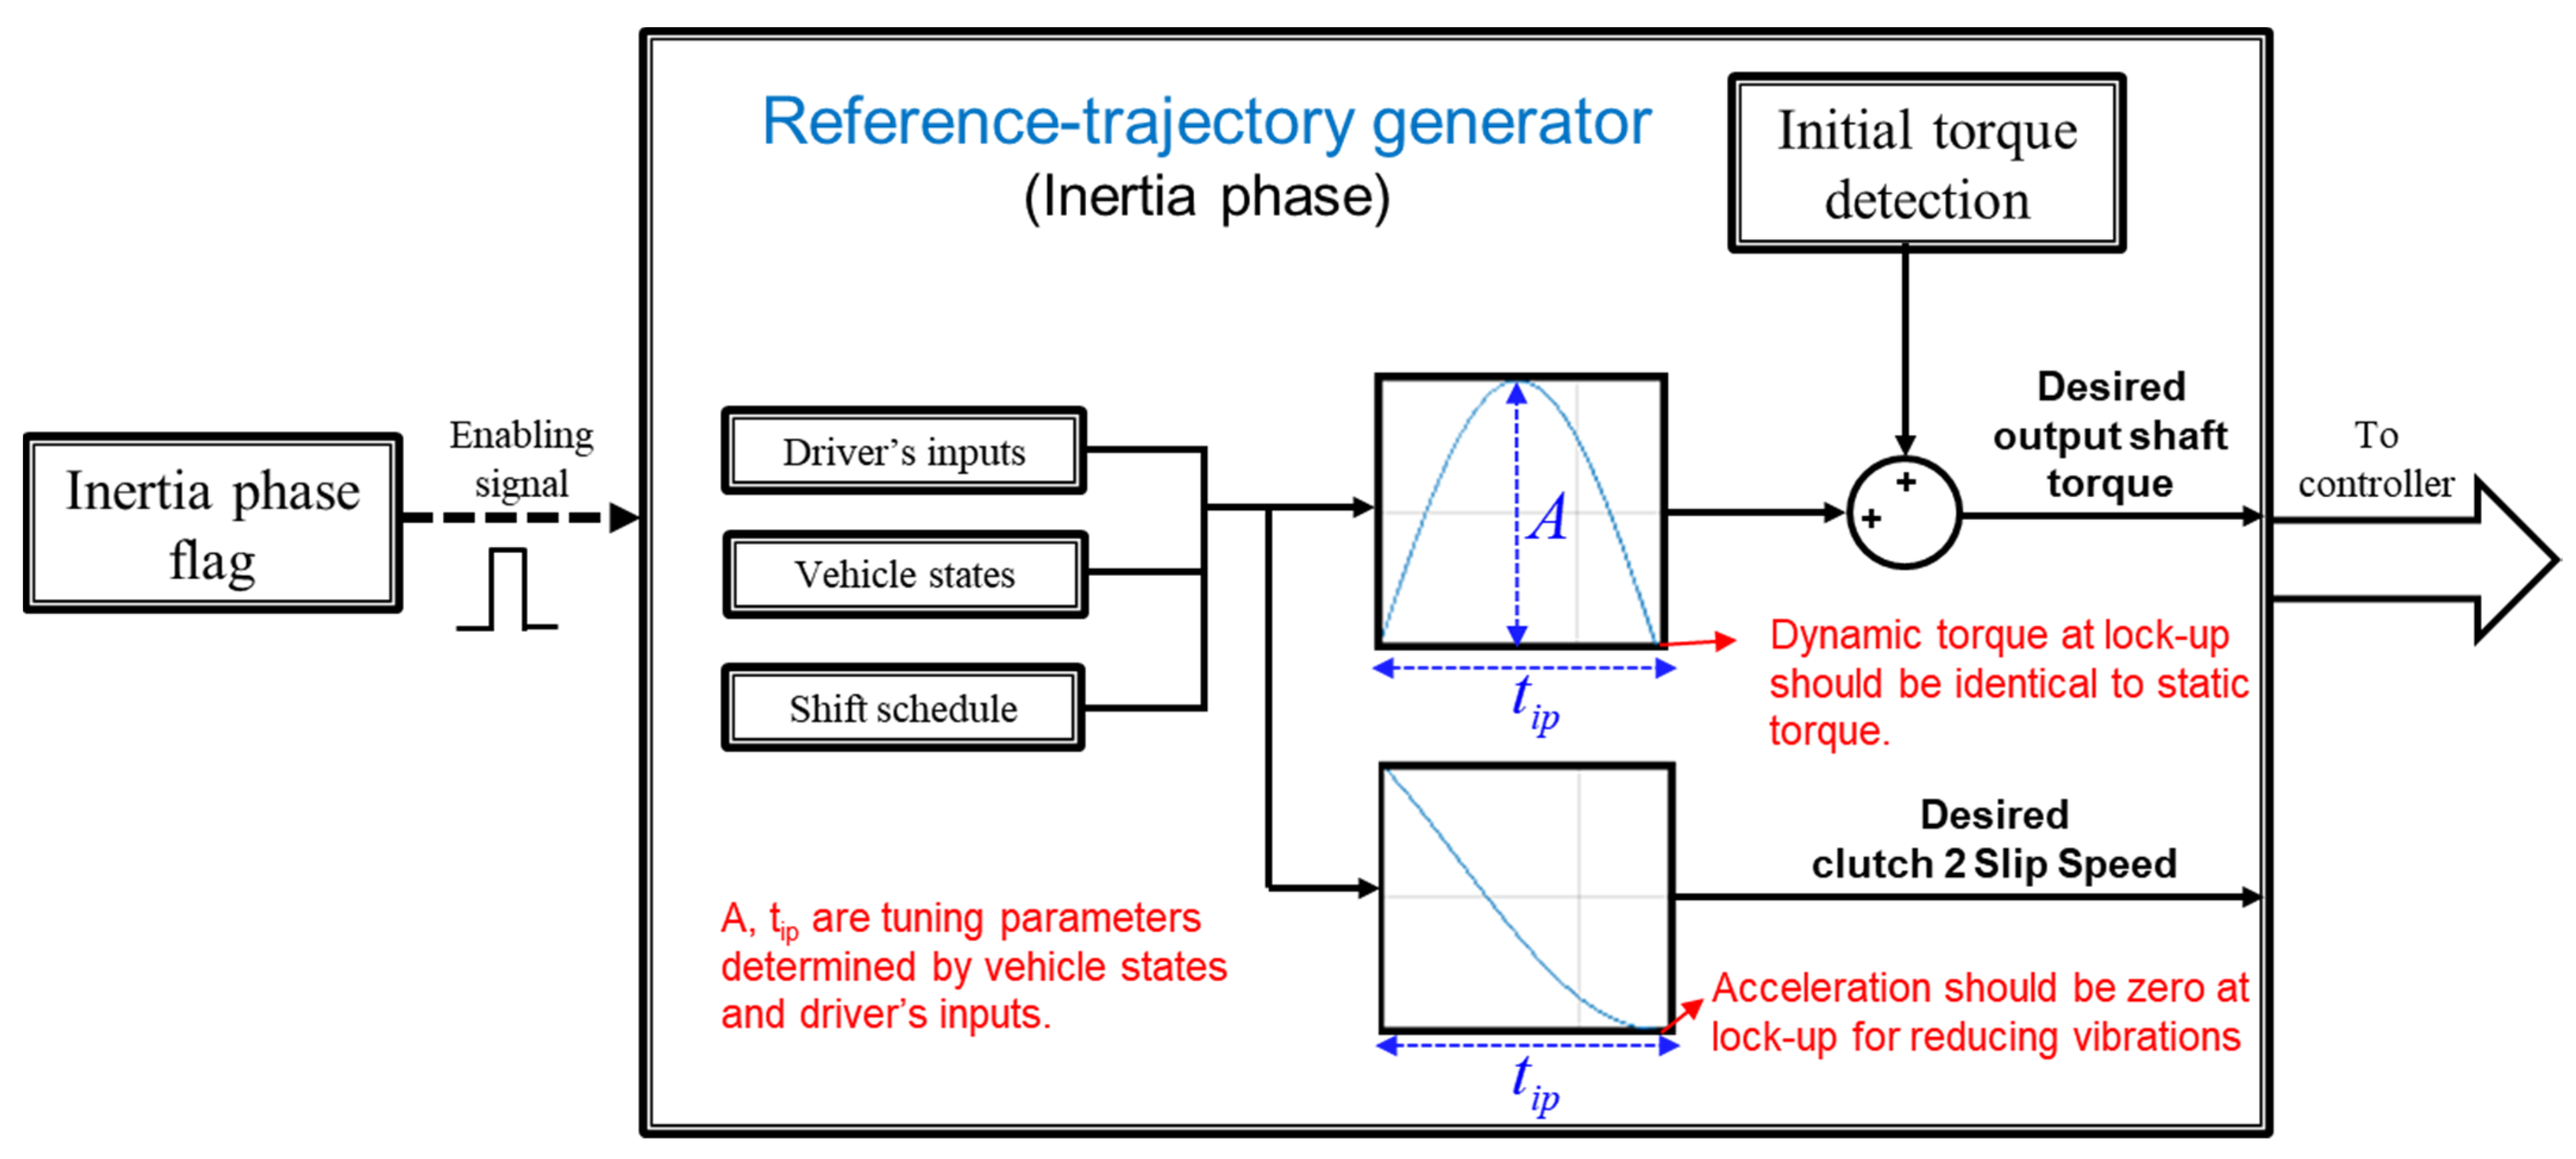
The combination of Equations (7) and (8) ensures the minimization of the driveline oscillations after lock-up. Equation (8) specifies that although the stroke of the oncoming clutch increases during the inertia phase, it should be reduced to the level of the next static torque at lock-up. The reference state trajectories that satisfy the desired shift time and boundary conditions specified in Equations (7) and (8) are established and organized as look-up tables. These trajectories assume a sinusoidal shape and are selected for their smoothness, facilitating tracking via lower-level actuator control. The structure of the reference value generator is illustrated in Figure 11. Once the inertia-phase flag is activated, the generator operates in real time to generate reference values for inertia-phase control. The desired shift time and maximum allowable output torque value, which are determined by the driver’s inputs, are established, and the corresponding references are fed to the controller.
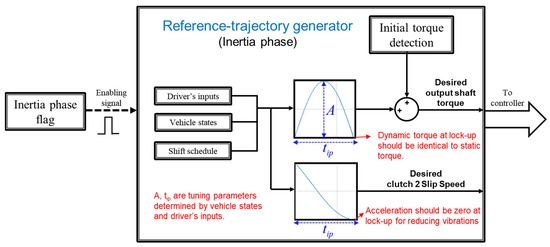
Figure 11.
Reference-trajectory generator for feedback control in the inertia phase.
3.1.2. Reference Tracking Controllers
The reference tracking controllers consist of an upper-level controller that computes the required torque values for clutches and power sources to align with the reference trajectories and a lower-level controller that manages the strategies for each actuator to precisely track the desired torques. Although the detailed development of reference tracking controllers is beyond the scope of this study, we present a brief overview of the controllers utilized for validation.
The upper-level controller used has the form of an observer-based H-infinity loop-shaping controller combined with feedforward control, whose design procedure is explained in [7]. The robust feedback control law based on H-infinity loop shaping is utilized to accurately track the desired state values in the presence of uncertainties and disturbances [28]. Because the output shaft torque state is generally not directly measurable in a vehicle, it is estimated using an adaptive torque observer developed in the author’s previous study [29]. The upper-level control generates the desired torque input values for the oncoming clutch and power source in real time. In the lower-level control loop, the drive motor is regulated by the inverter drive via pulse-width modulation, and the clutch actuators are controlled using a proportional–derivative control algorithm to track the respective desired clutch torque.
3.1.3. Influences of Inaccurate Power-Source Control
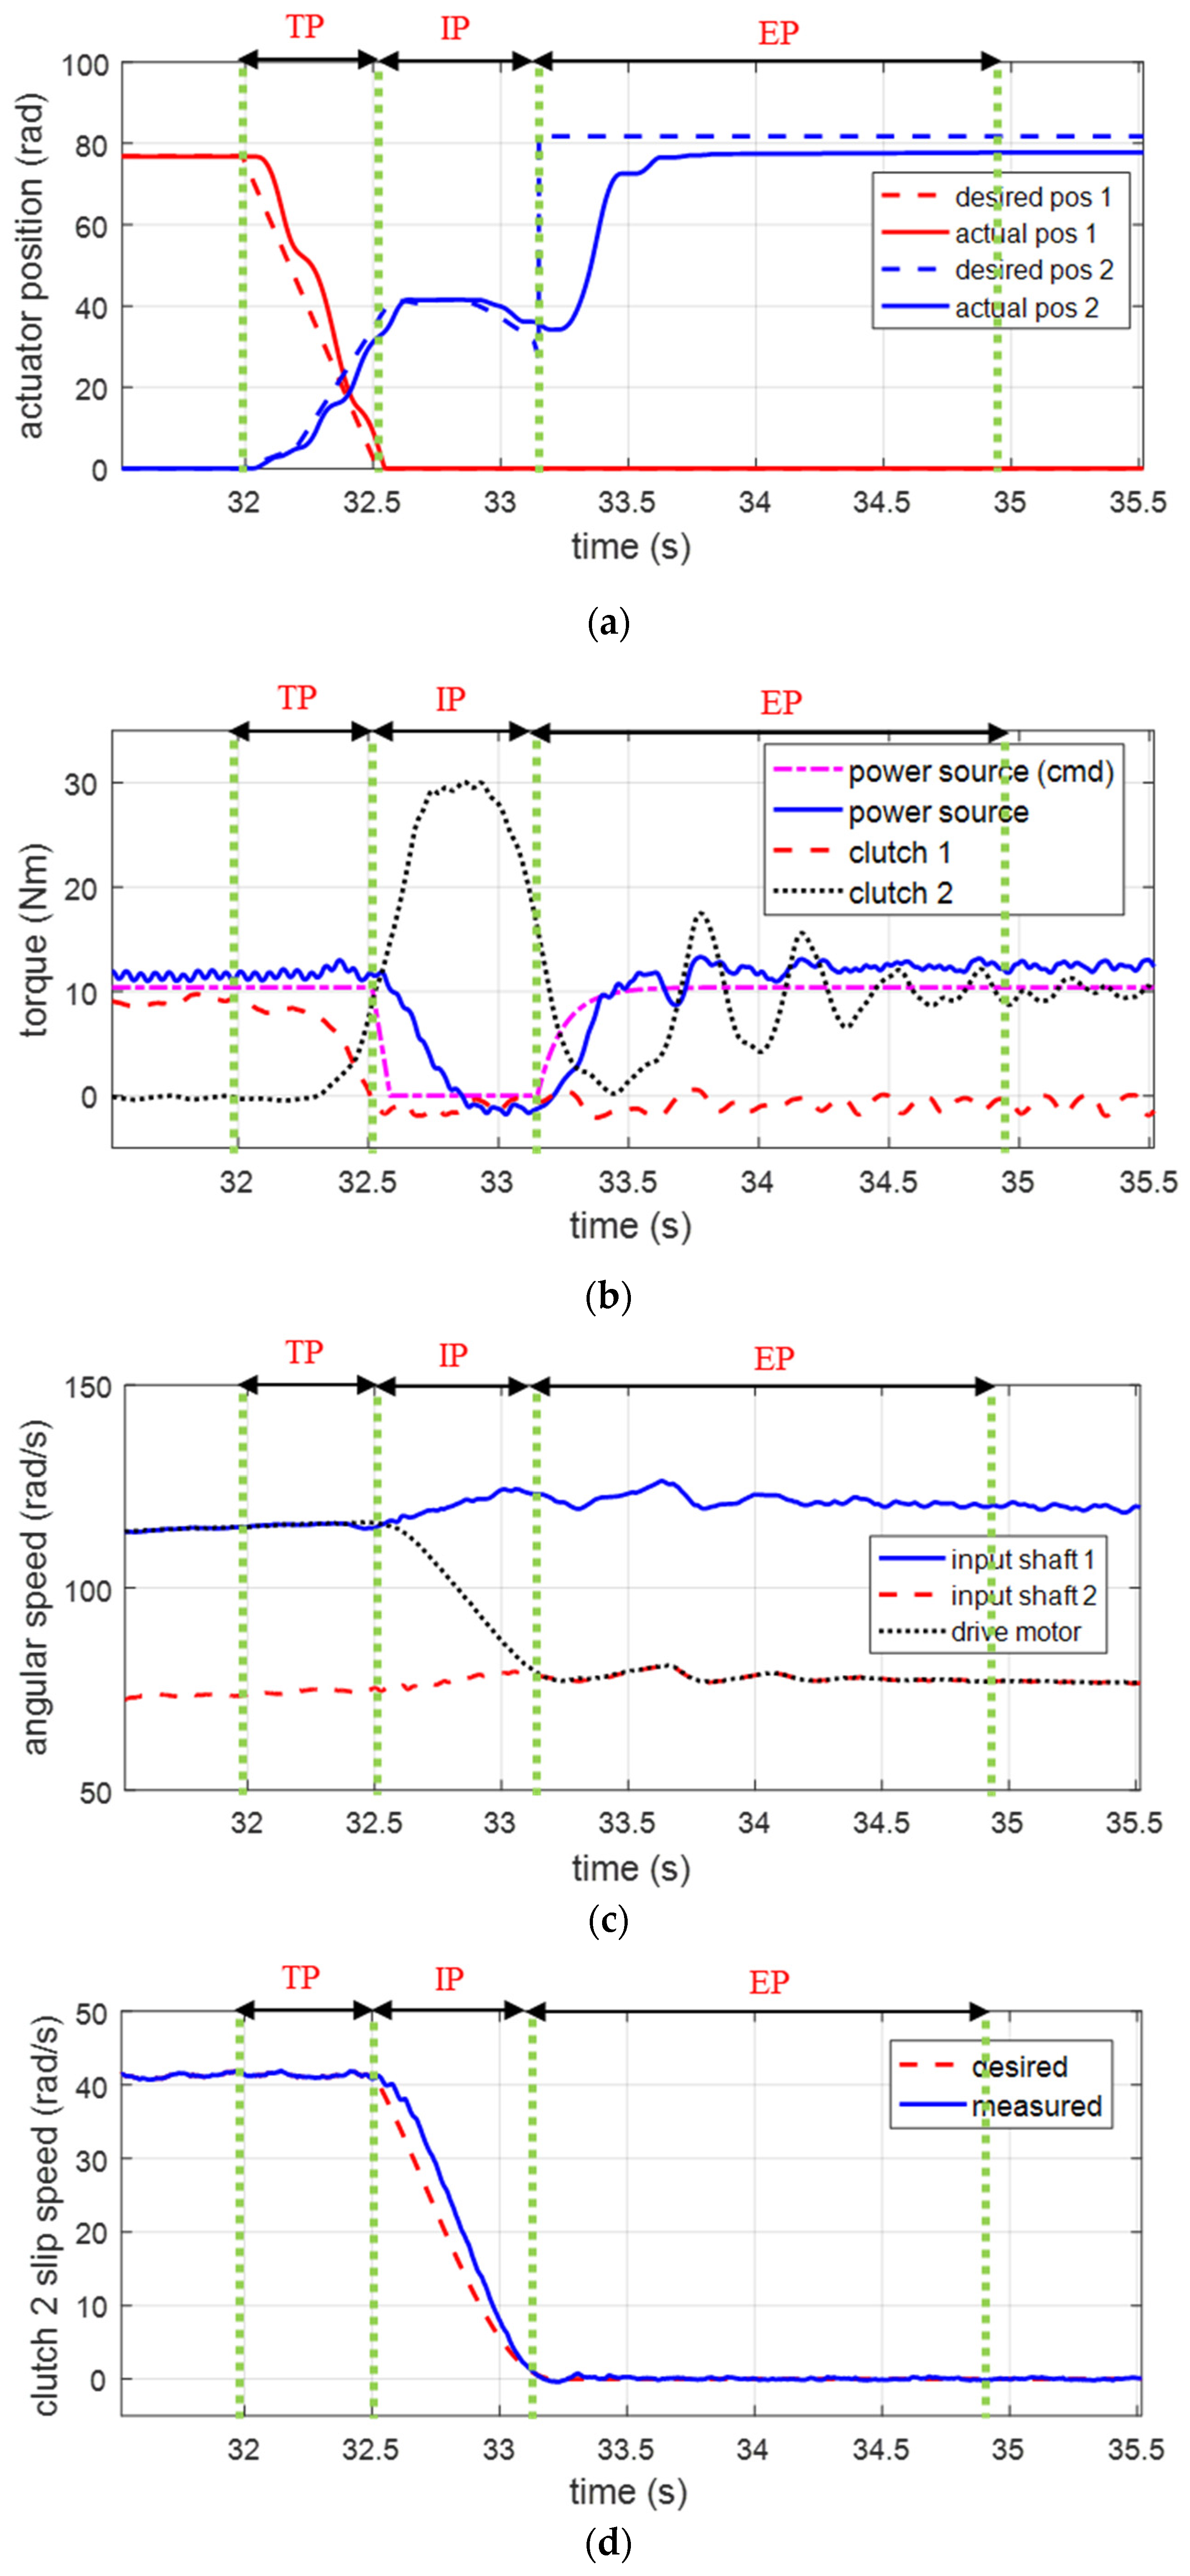
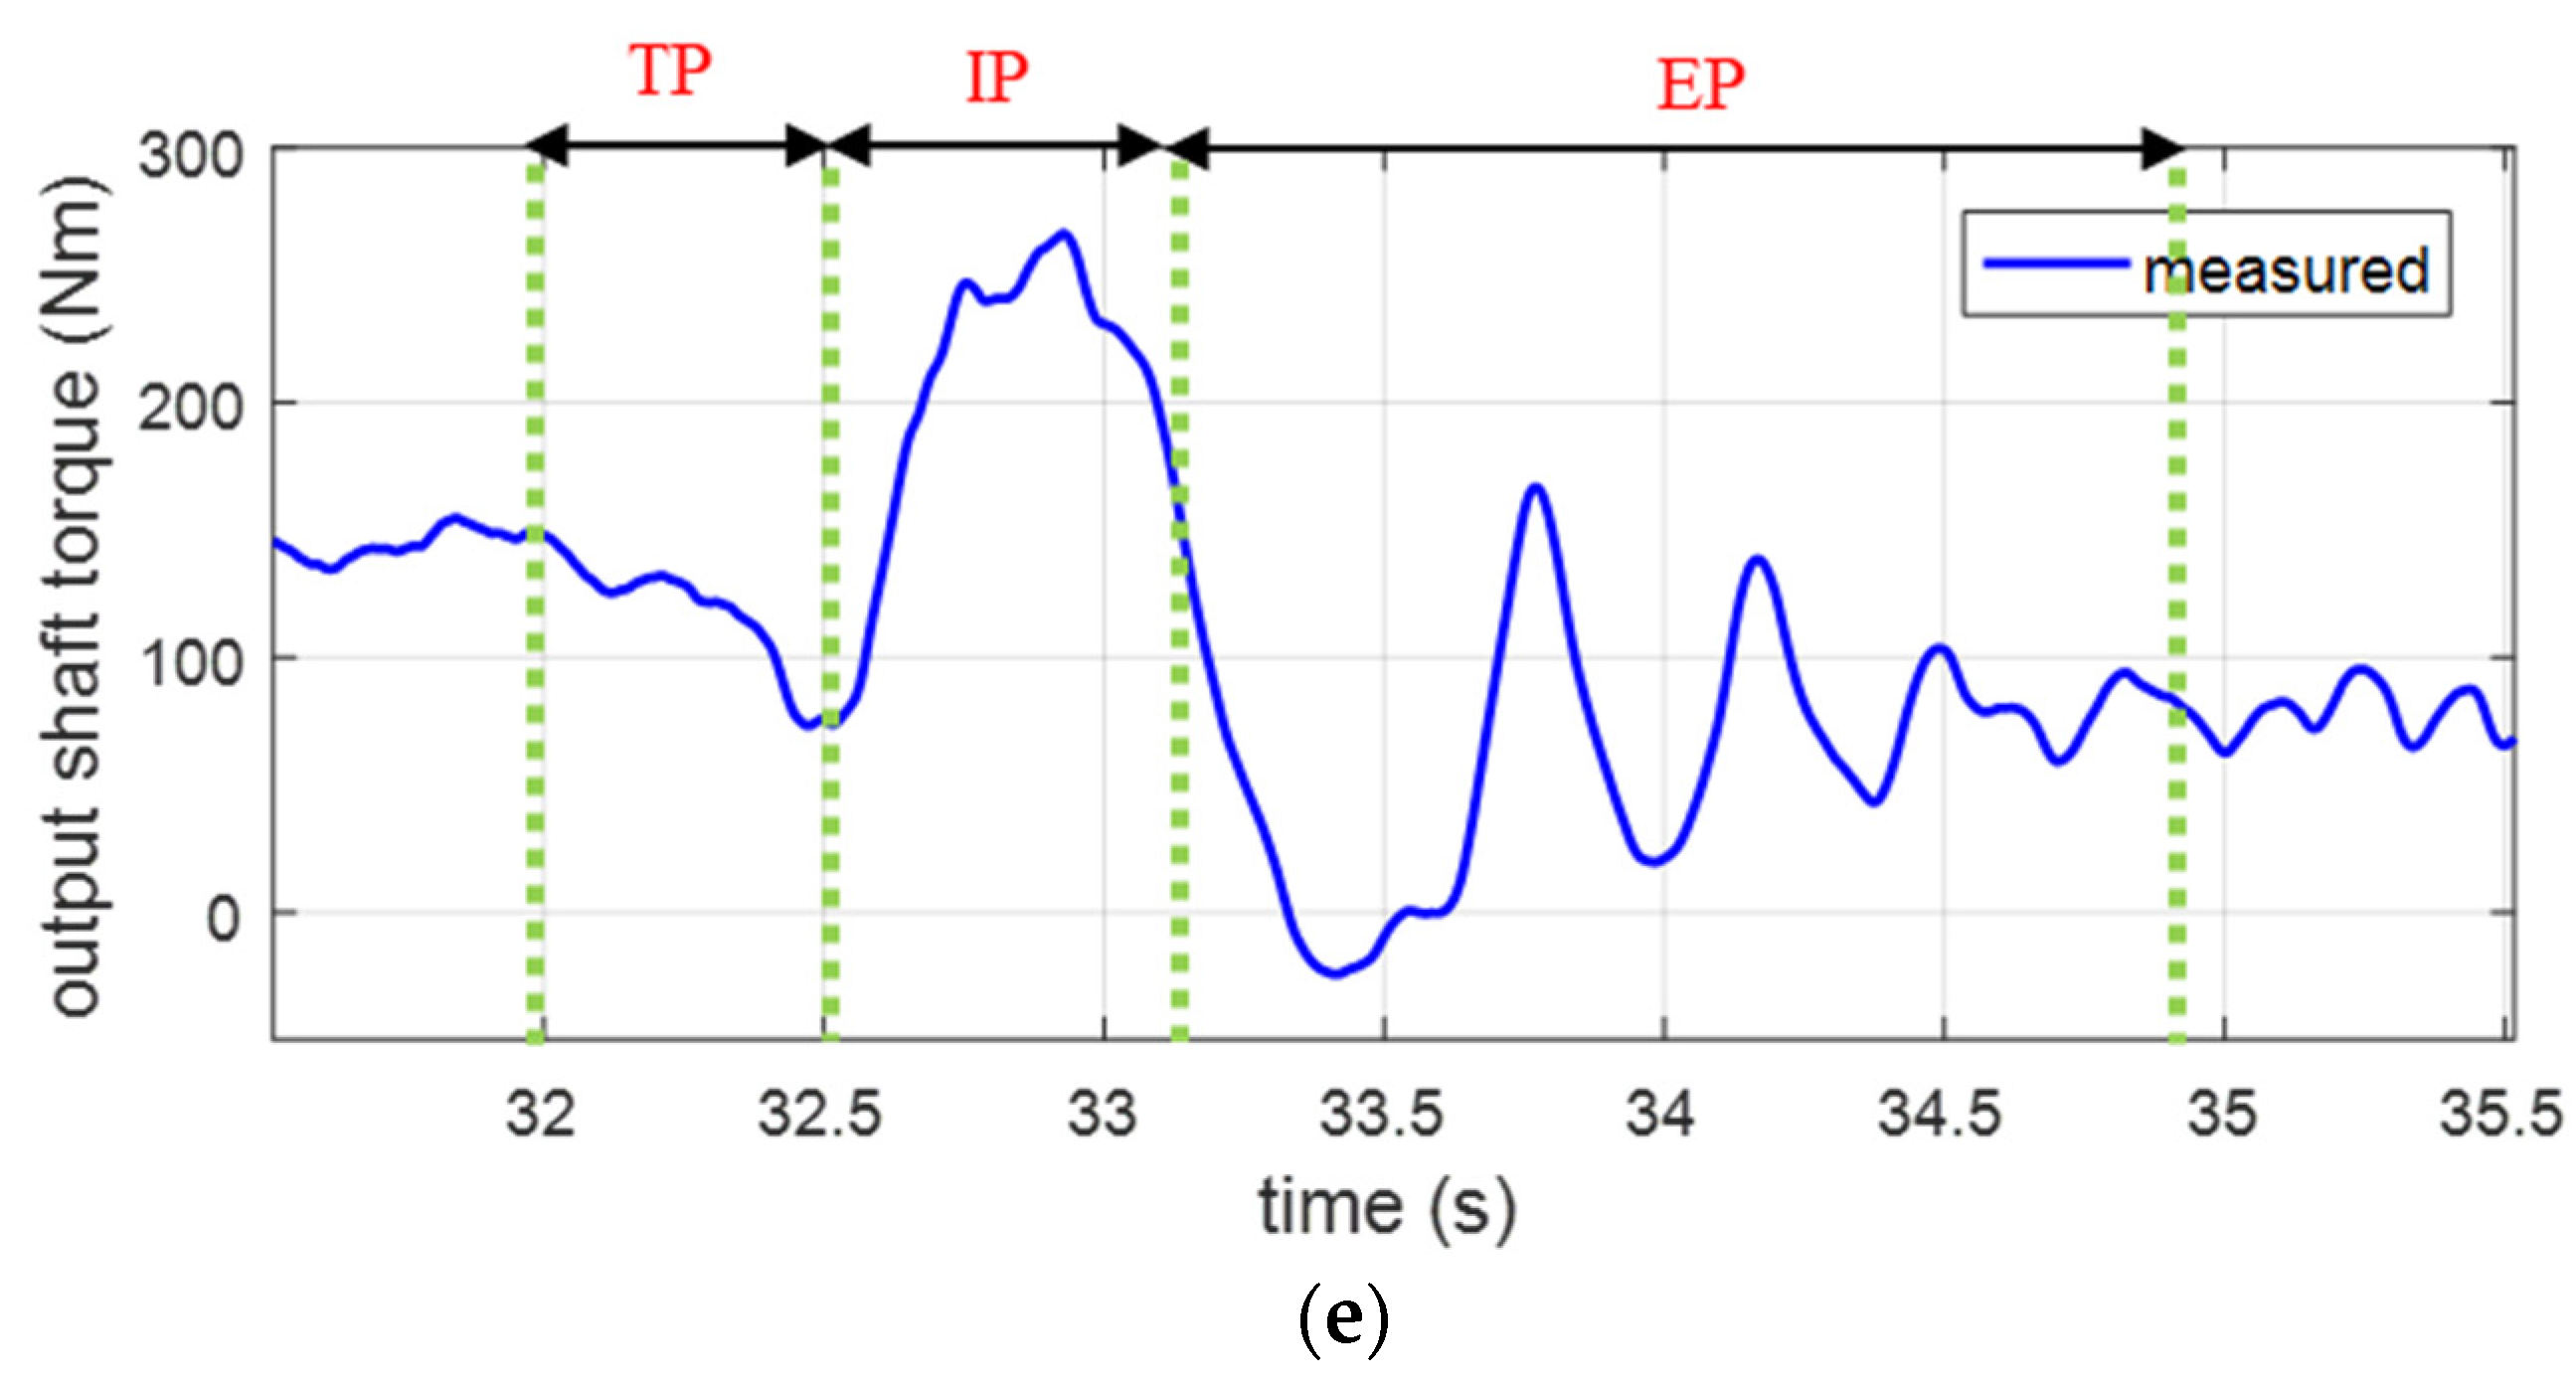
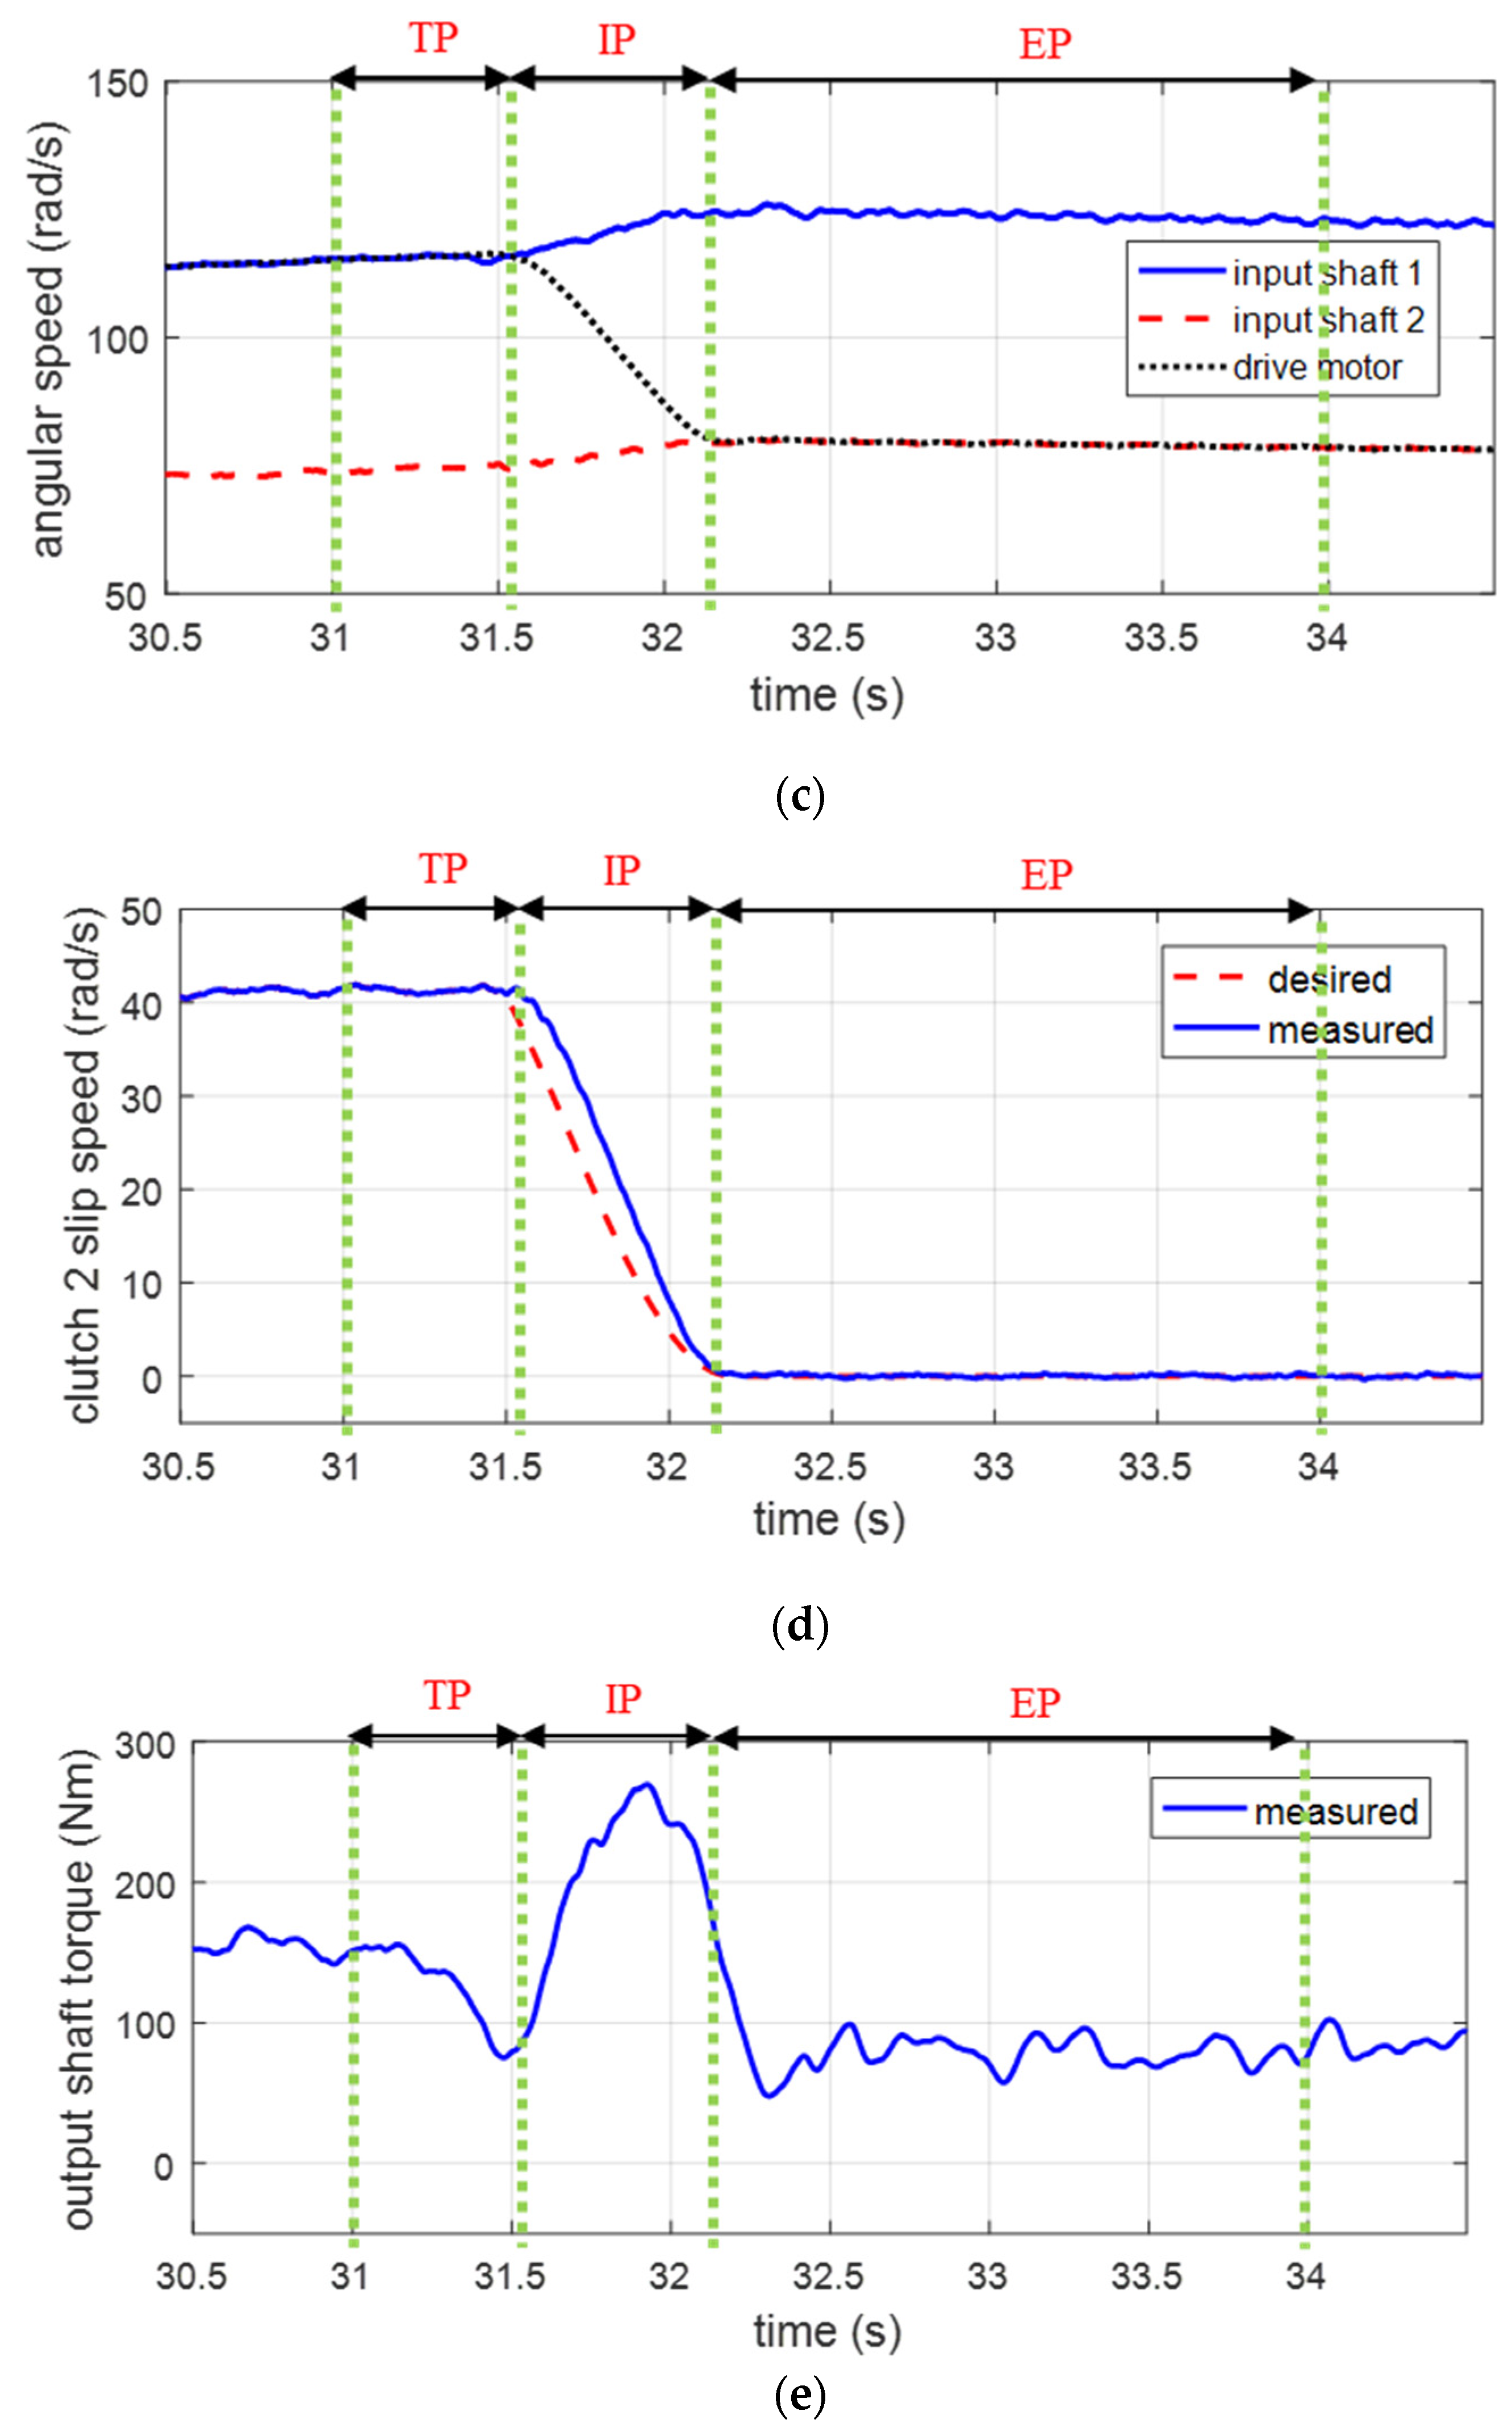
Another factor that should be considered to achieve outstanding shift quality is the characteristics of the actuators. The intricate control strategy developed in the preceding subsections relies on the ability of both the clutch actuator and the drive motor to accurately follow the reference torque trajectories. In this section, we focus on evaluating the performance of the power-source control (engine control or drive-motor control). To demonstrate the adverse effects of inaccurate drive motor control on the overall shift performance, we conducted several experiments on a test bench, and the results are shown in Figure 12.
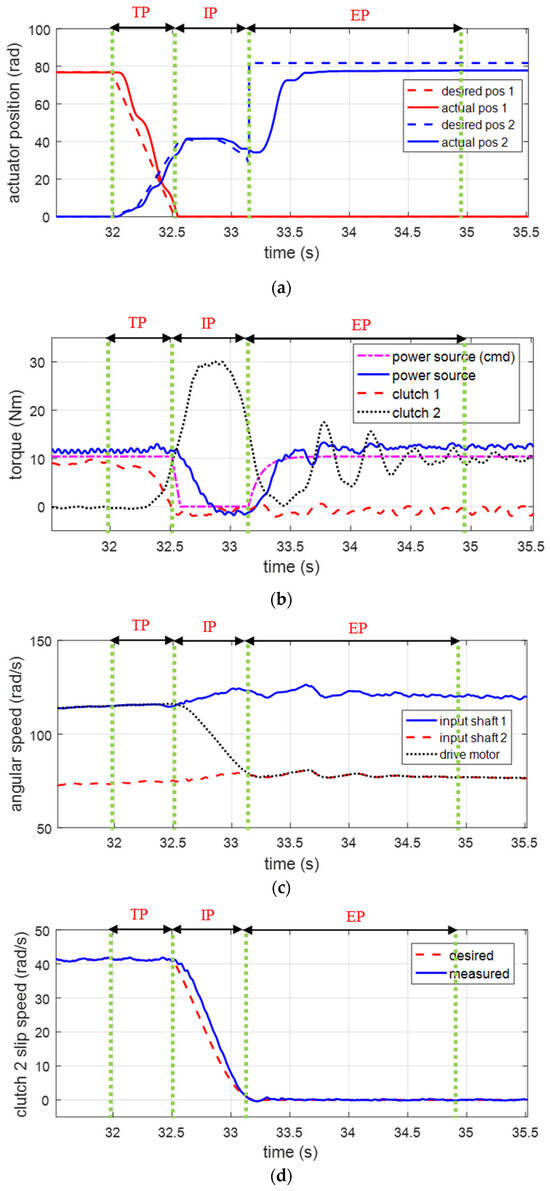

Figure 12.
Experimental results for inaccurate drive motor control: (a) clutch actuator positions; (b) torques; (c) angular speeds; (d) clutch 2 slip speed; and © output shaft torque. (TP: torque phase, IP: inertia phase, EP: end phase); (e) output shaft torque (Nm).
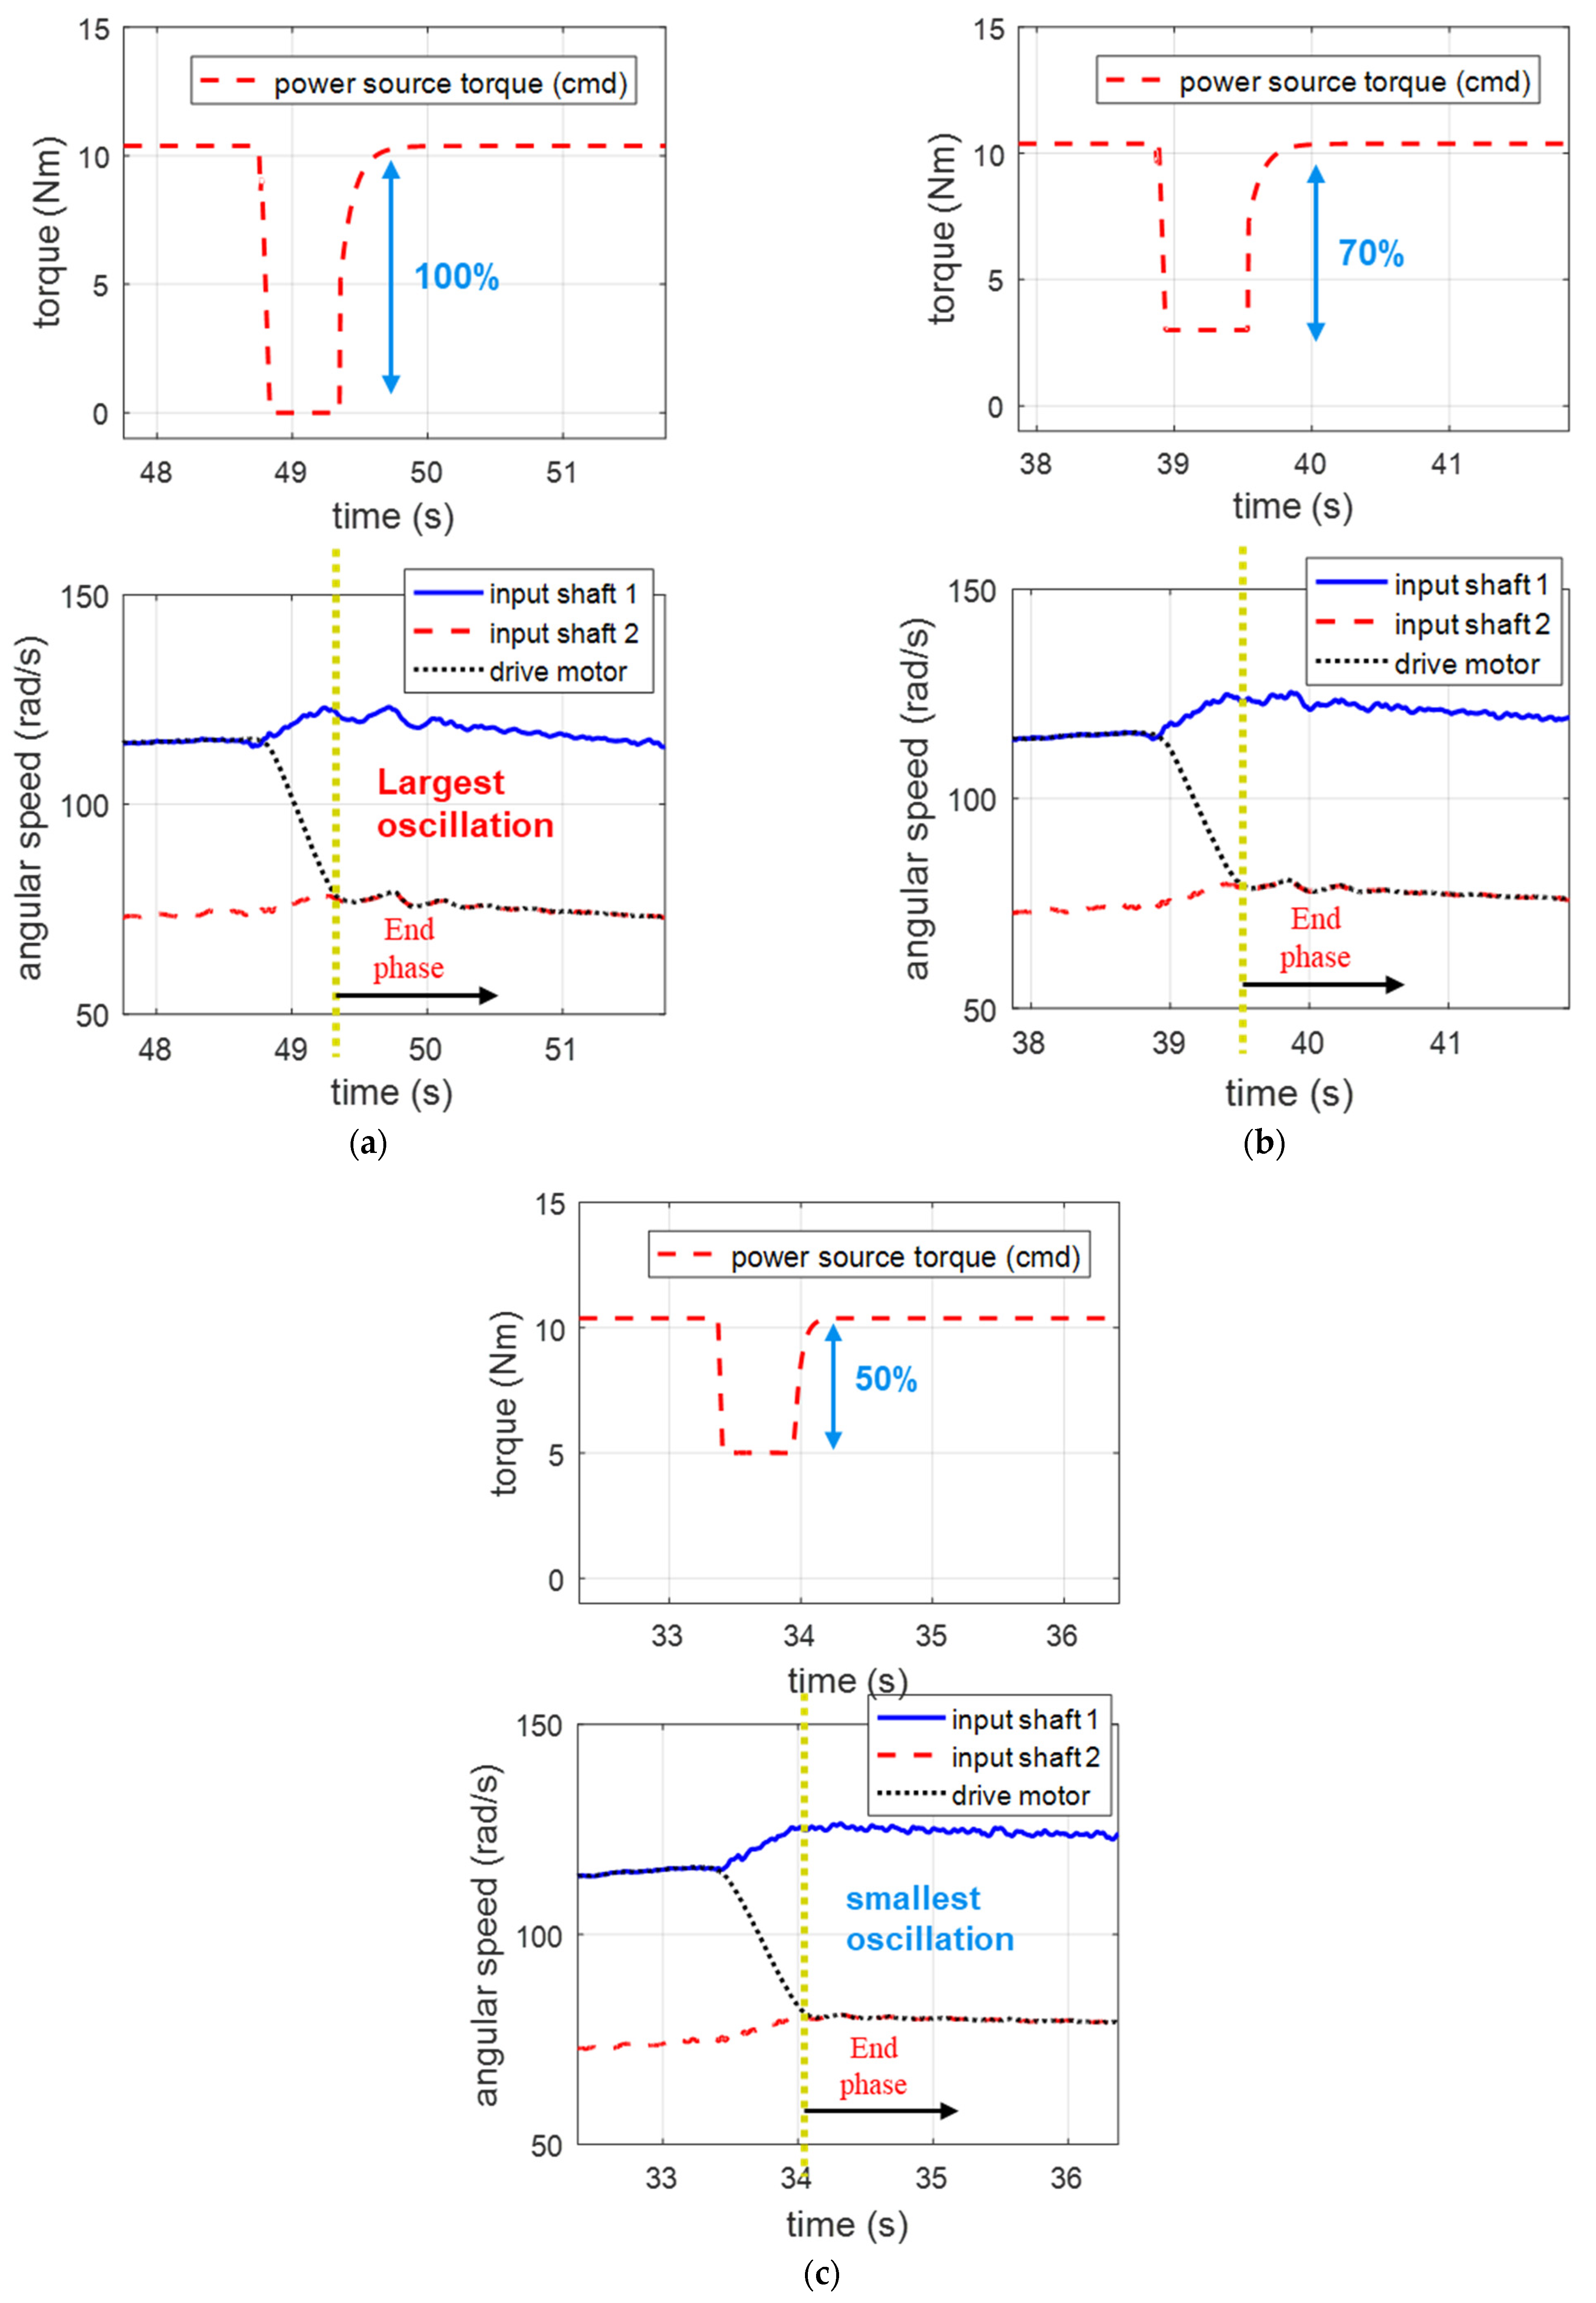
According to the inertia-phase control strategy outlined in Section 3.1, the input torque command is gradually reduced to nearly zero, whereas the position of the oncoming clutch is increased to facilitate rapid engagement during the inertia phase. Immediately before lock-up, the clutch position slightly decreased to mitigate lock-up oscillations. Following the inertia phase, the input torque command denoted as “power source (cmd)” in Figure 12b is promptly restored to its original value. However, it became evident that while the designed inertia-phase strategy achieved the desired shift time and effectively reduced the inertial torque overshoot, it did not effectively address the lock-up oscillations. The primary issue was the delayed torque response of the power source (“power source” in Figure 12b). Although a drive motor known for having a faster torque response than an engine was utilized, inherent time delays and phase lags in the torque control loop persisted. Consequently, the input torque reduction during the inertia phase was not promptly restored, resulting in undesirable vibrations. One potential solution for increasing the torque response speed is to limit the torque reduction. Additional experiments were conducted to explore the impact of limiting the input torque reduction. Figure 13 and Figure 14 illustrate the effects of varying the minimum input torque value and input torque recovery time on the lock-up oscillations, respectively. The same control strategy was applied to clutch 2, with only the input torque control of the drive motor varying during the experiment.
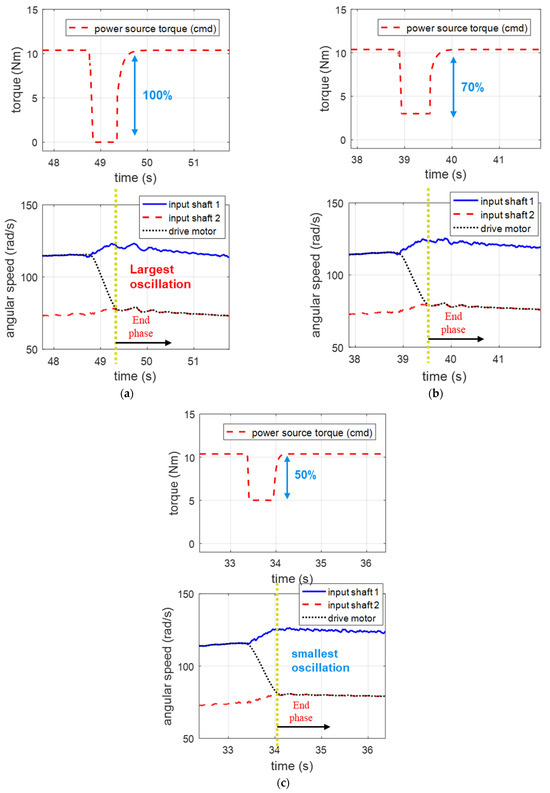
Figure 13.
Effects of input torque reduction on lock-up oscillation: (a) 100% reduction; (b) 70% reduction; and (c) 50% reduction.
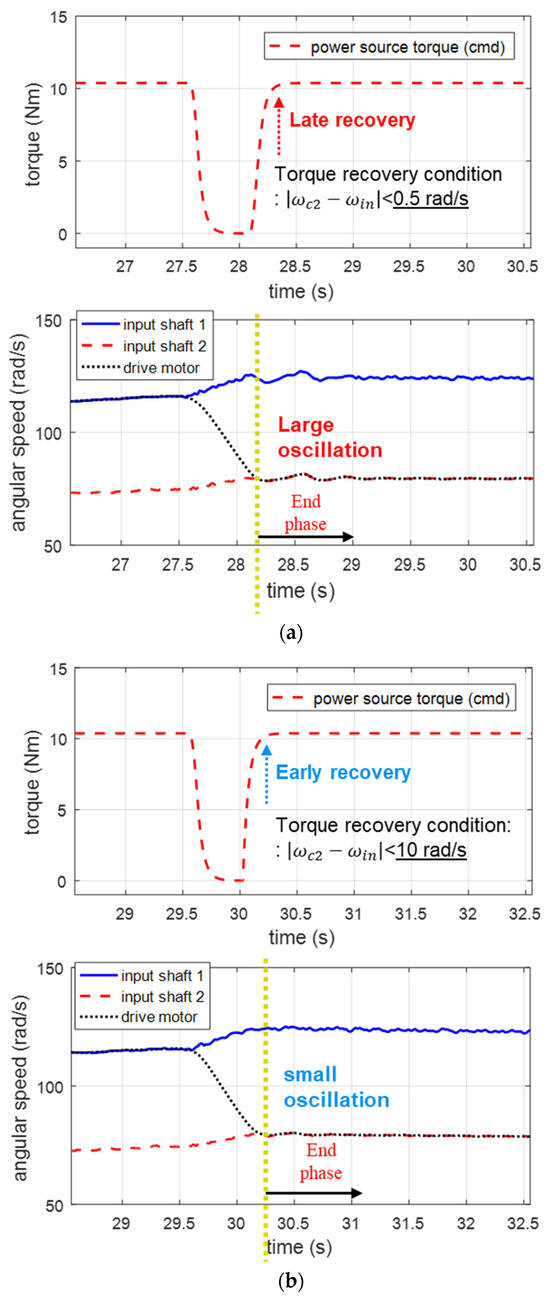
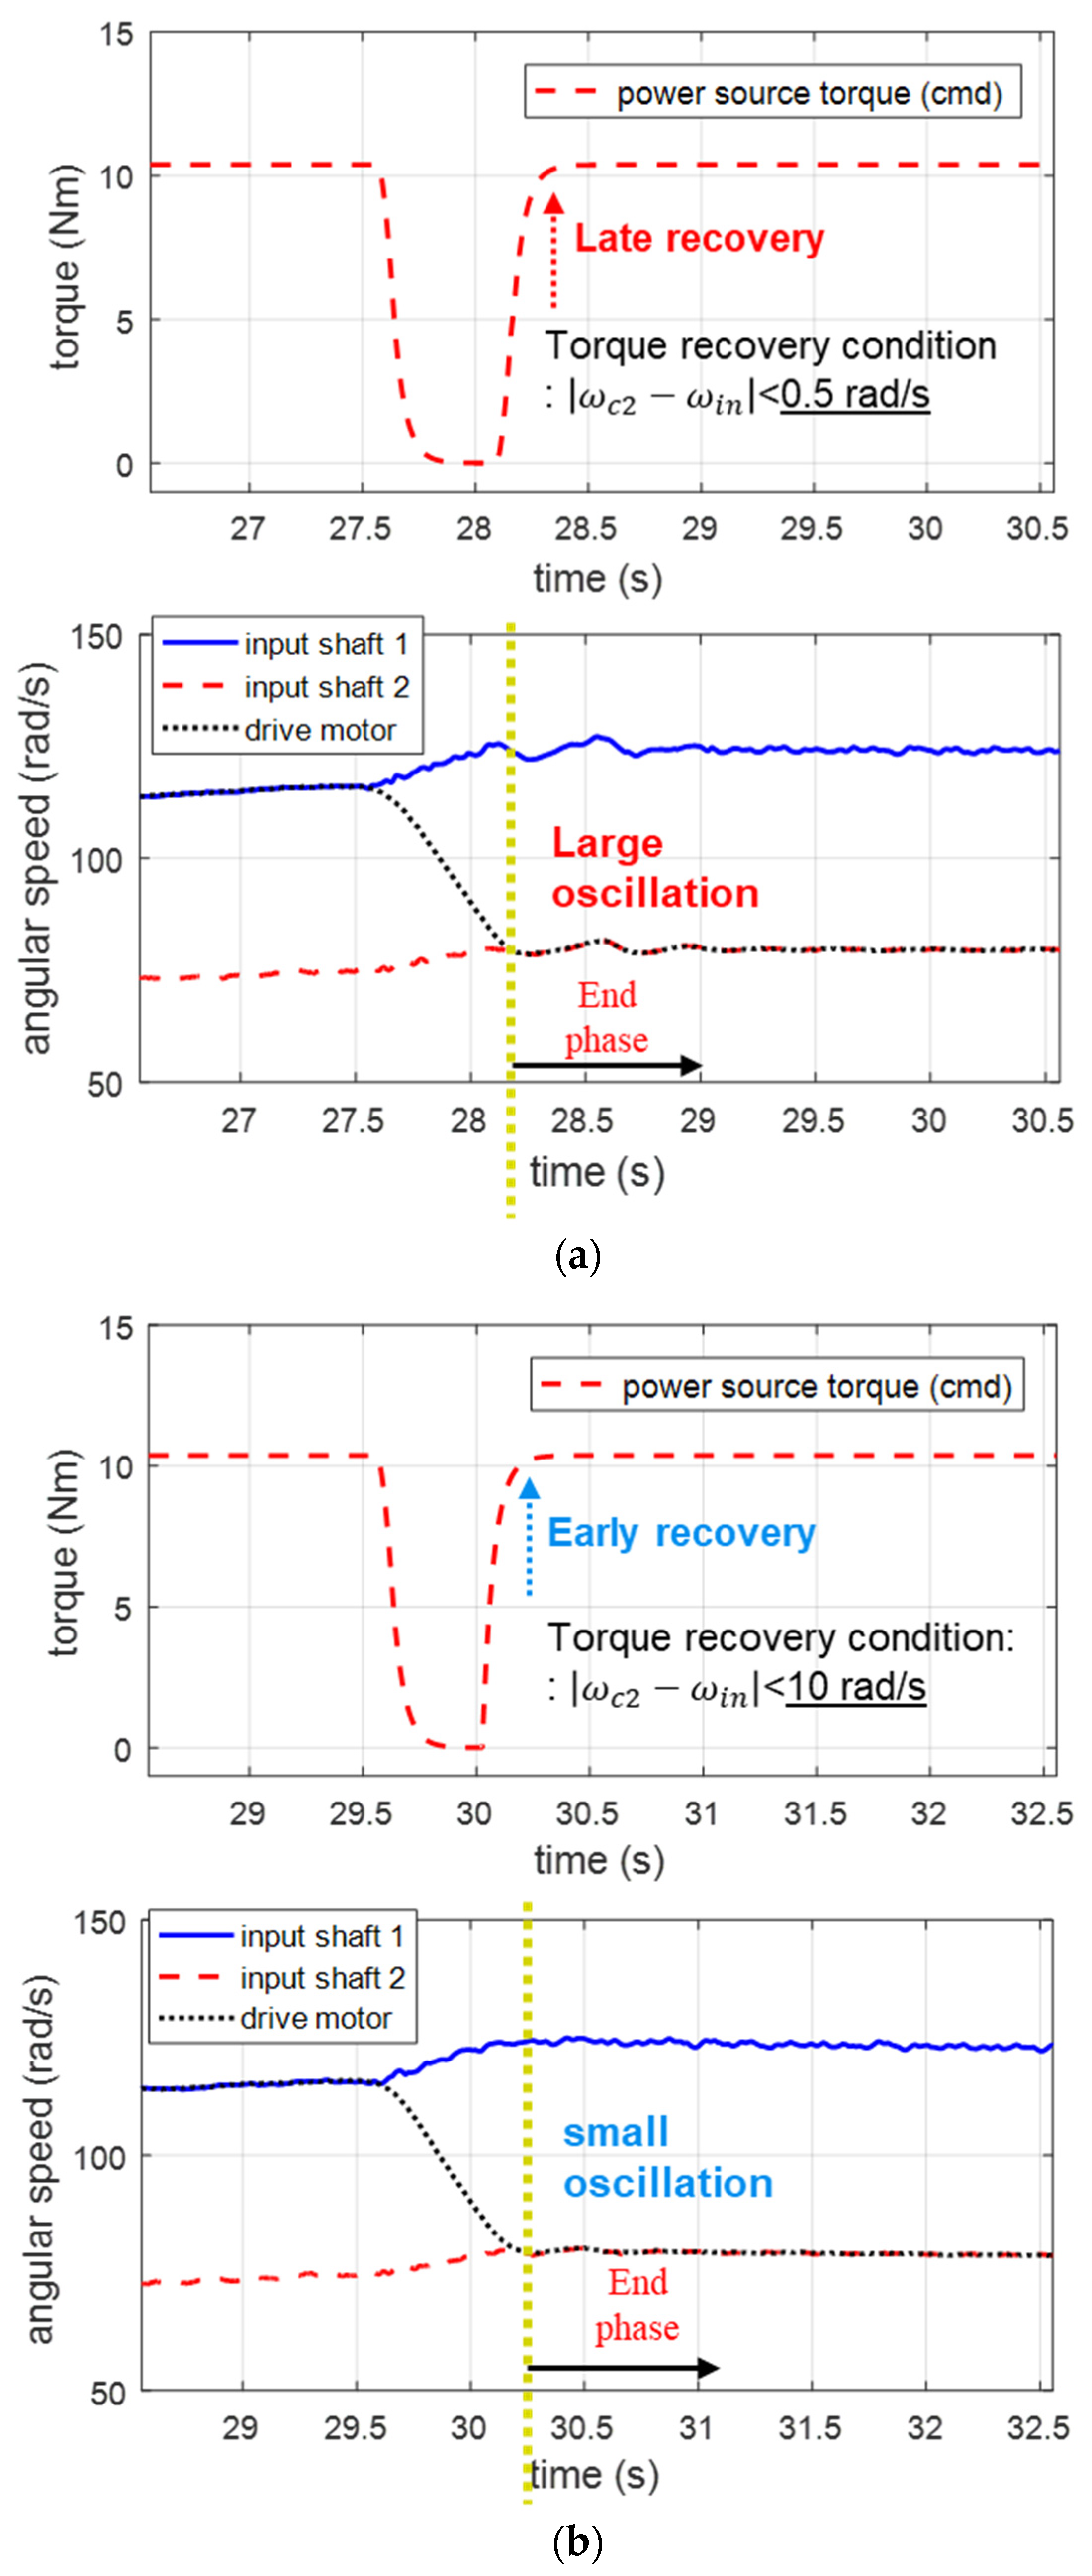
Figure 14.
Effects of the input torque recovery time at the lock-up on oscillation: (a) torque recovery condition: ; and (b) torque recovery condition: .
In Figure 13, as the amount of torque reduction decreases, the reduced torque is restored more rapidly to its original value at the conclusion of the inertia phase, mitigating the torque discontinuity and driveline oscillations during lock-up. However, limiting the input torque reduction has adverse effects on the shift time, as shown in Table 3. Figure 14 compares two cases with different time of turning off the power source control during the inertia phase. The results demonstrated that the early torque recovery case (turning off the power source control in the inertia phase if (rad/s)) exhibited much better performance in terms of the driveline vibrations because it considered the response time of the drive motor, as described in Table 4. Based on the observations, the inertia phase motor control is calibrated so that the amount of the torque reduction is limited to 80% and the motor control is deactivated when (rad/s), facilitating early recovery of the input torque at the end of the inertia phase.
Table 3.
Quantitative comparison of the results in Figure 13.
Table 4.
Quantitative comparison of the results in Figure 14.
3.2. Additional End-Phase Control
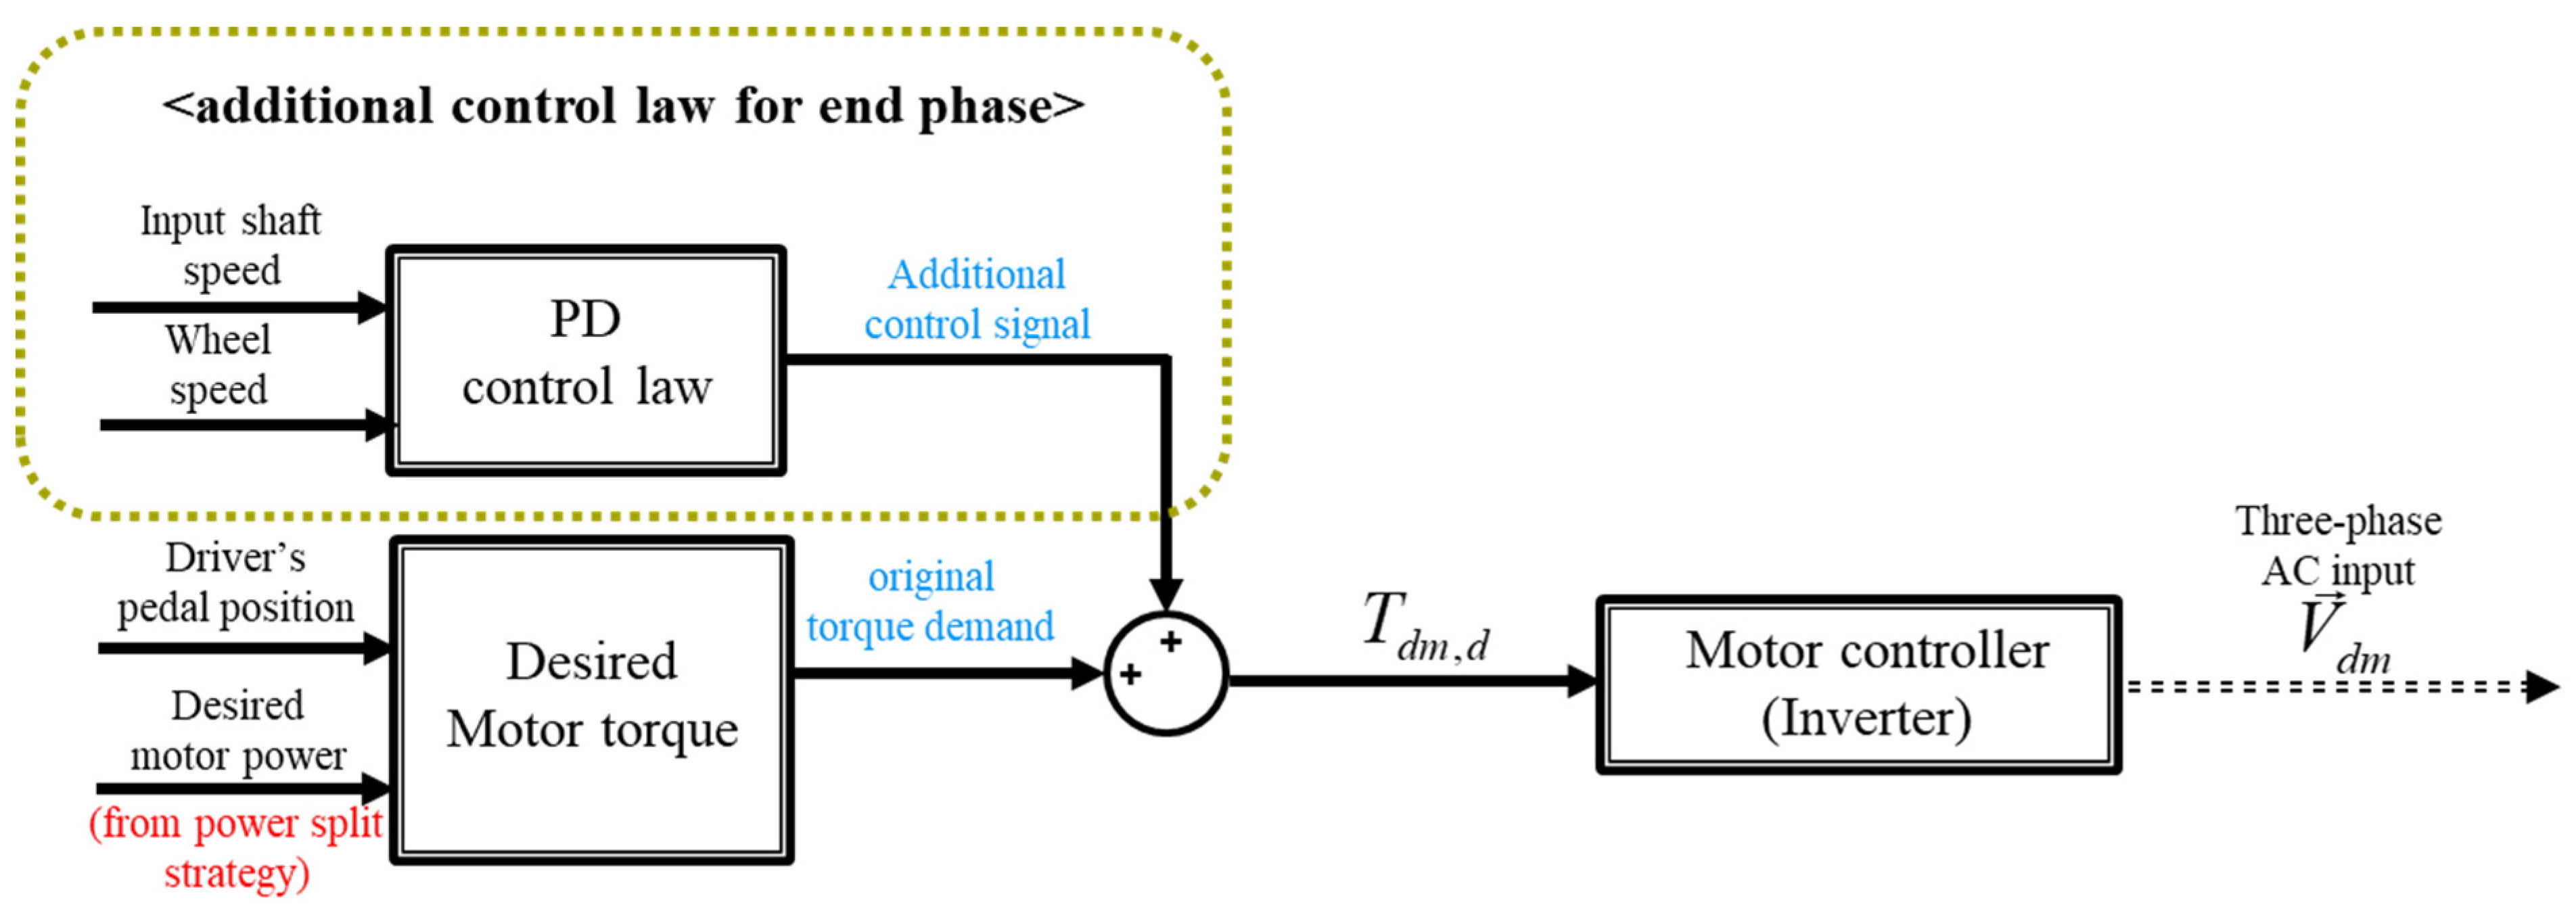
In this subsection, an additional control strategy for the end phase is introduced to address driveline vibrations that cannot be effectively managed solely through inertia-phase control. Theoretically, the inertia-phase control strategy is designed to effectively mitigate lock-up oscillations and torque overshoot during this phase. However, several factors may degrade the shift performance, such as unknown delays in actuators and sensors, along with external disturbances. To address the residual driveline vibrations in the end phase, a feedback control law was developed to minimize the difference between the transmission input speed multiplied by the gear ratios and the wheel speed, as depicted in Figure 15; thus, the lock-up oscillations were reduced. By utilizing the rapid torque response of the drive motor, a significant improvement in driveline oscillations at the start of the end phase can be achieved. As noted in the previous subsection, the drive motor may struggle to precisely track the desired torque during the inertia phase because of the substantial torque changes required. However, the dynamic response of the motor remains sufficiently rapid to regulate the torsional vibration in the end phase.
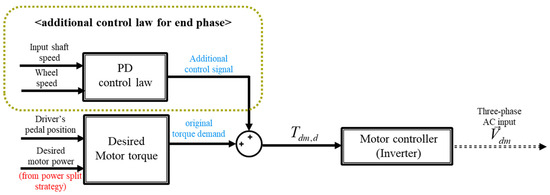
Figure 15.
End-phase control structure.
3.3. Experimental Validation
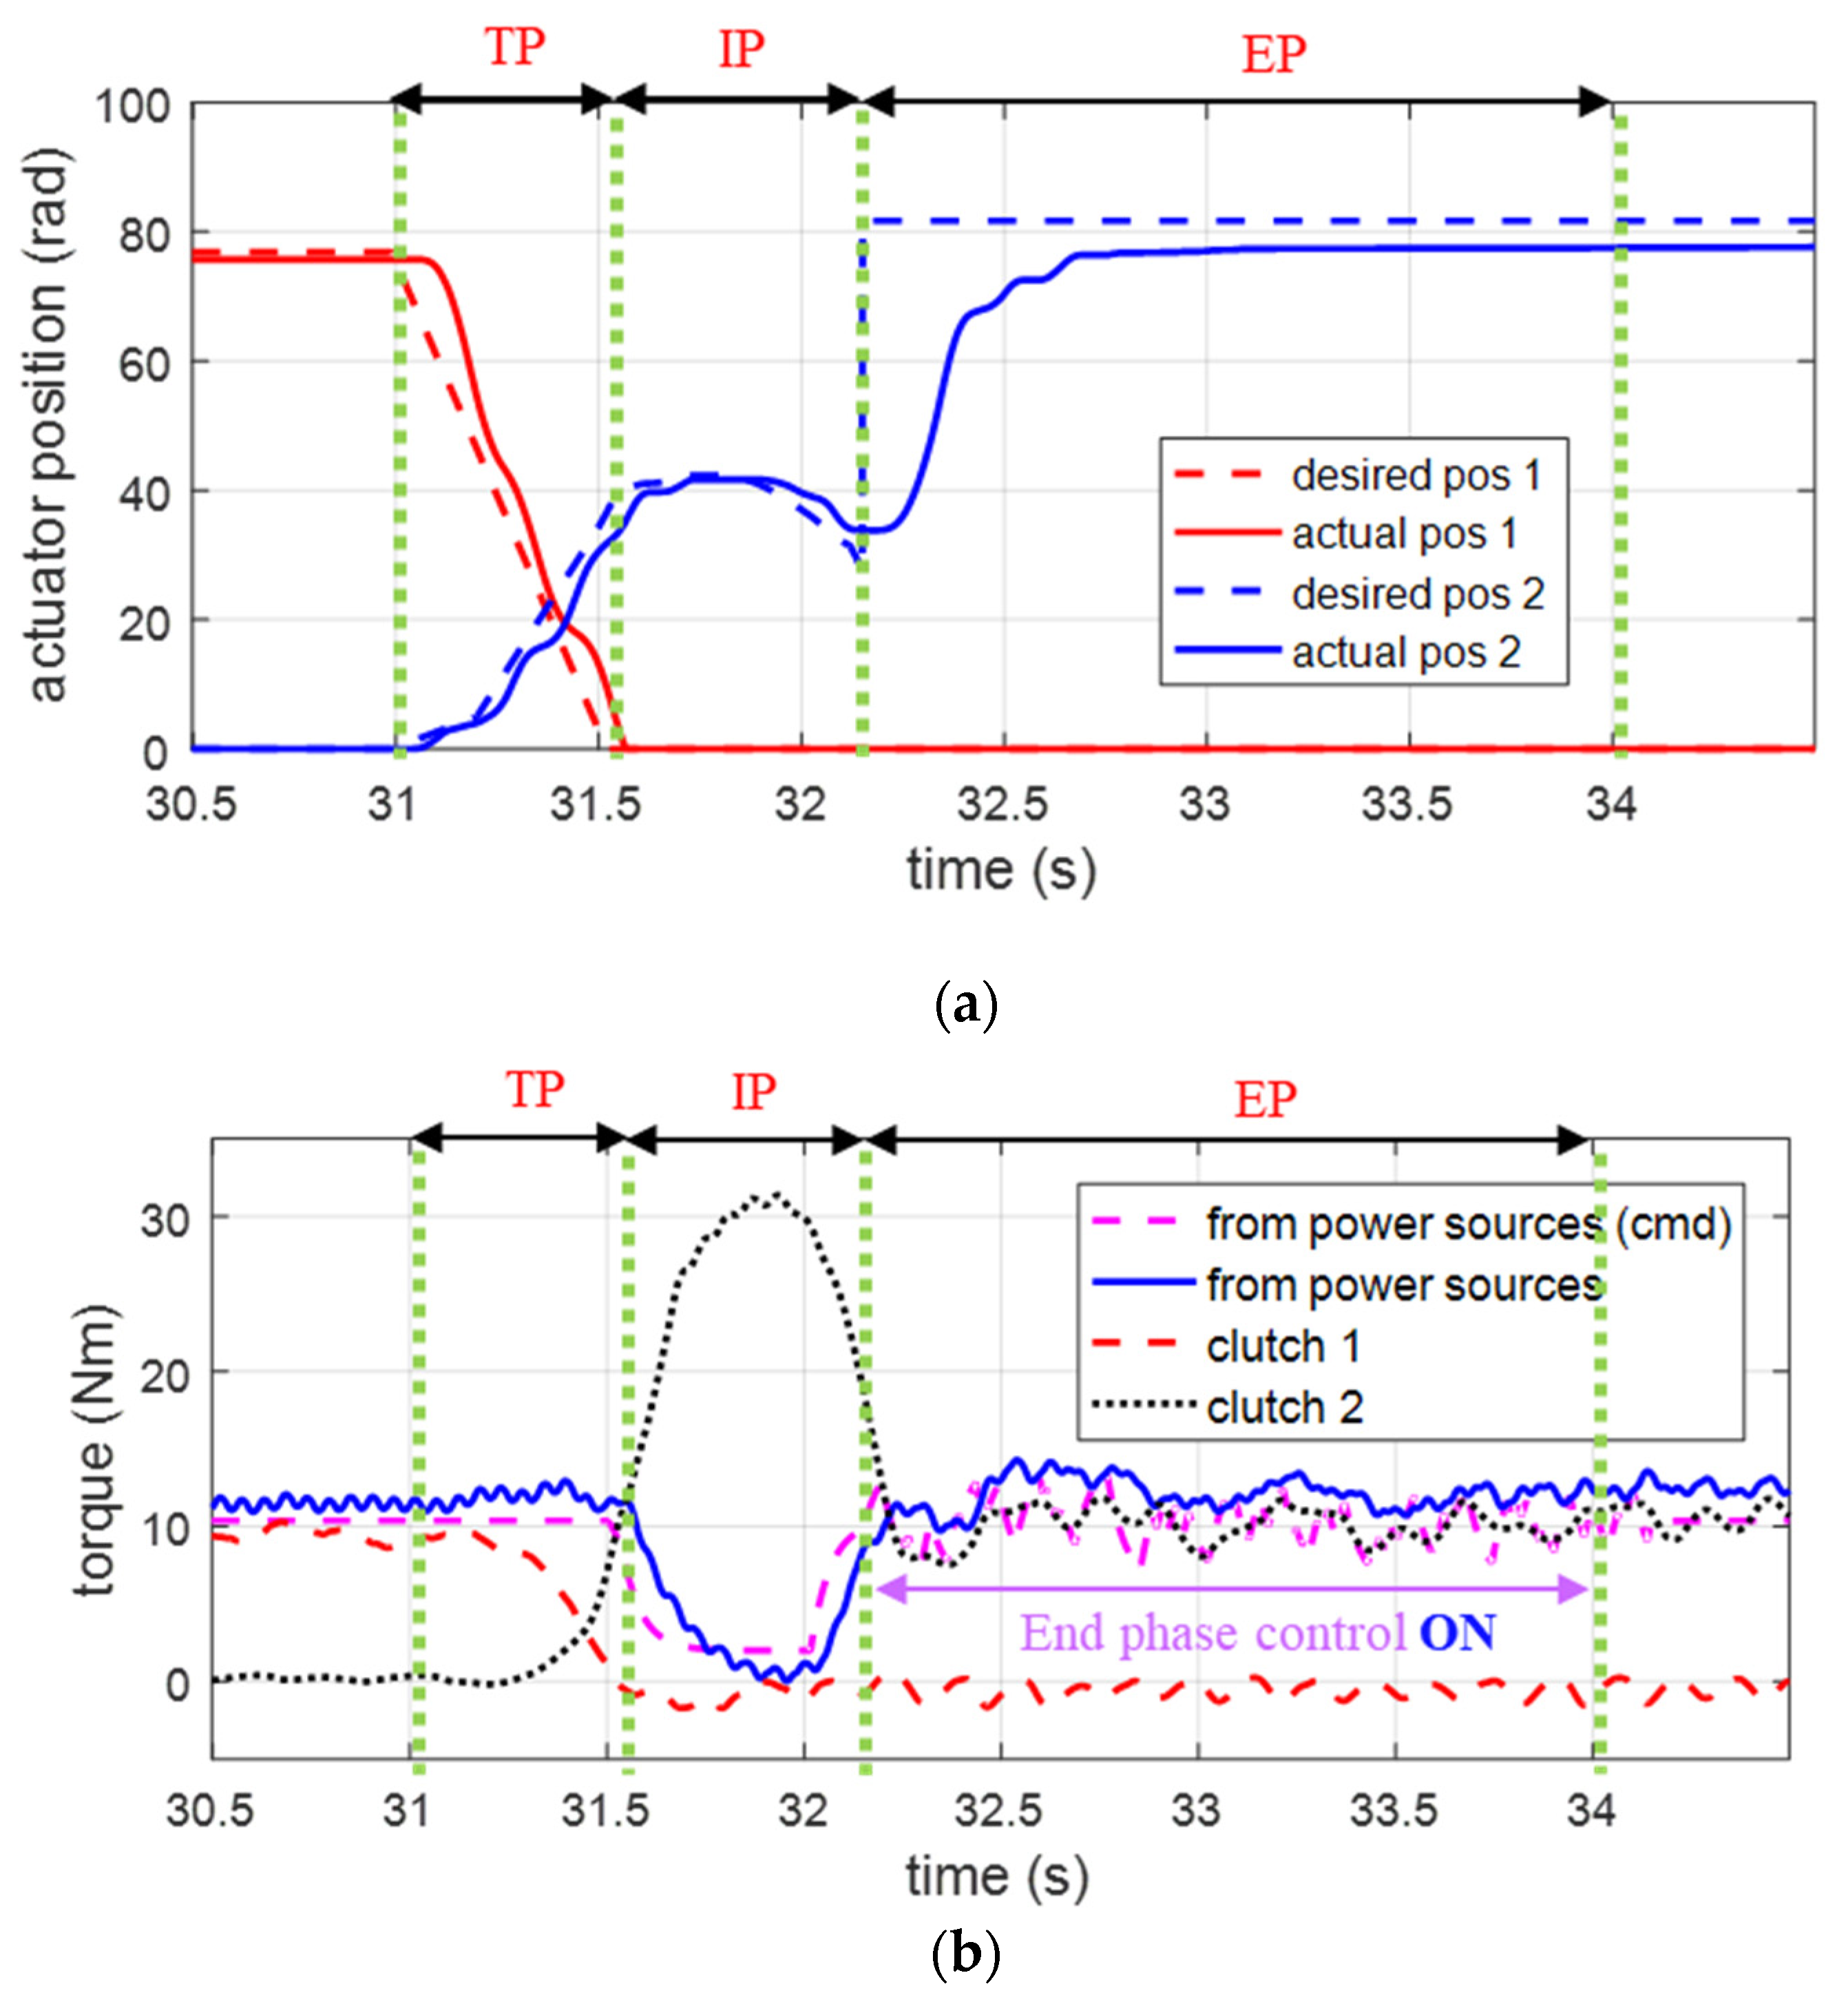
Experiments were conducted on a DCT driveline test bench to validate the proposed control strategy empirically. The control results are shown in Figure 16. Because the clutch control strategy was the same for both results in Figure 12 and Figure 16, they demonstrated comparable performances in terms of torque overshoot in inertia phase. However, the latter results exhibited far better driveline vibrations with the proposed drive motor control strategy. In Figure 16b, the drive-motor torque is reduced to near zero but quickly rebounds to its initial value upon the lock-up of clutch 2. Additionally, the drive motor control was activated during the end phase to attenuate any remaining lock-up oscillations. Consequently, the proposed approach exhibited significantly enhanced driveline vibrations during the gear shift compared with the outcomes shown in Figure 12. Thus, it was experimentally confirmed that the proposed control strategy is highly effective for clutch-to-clutch shift control in HEVs with a DCT.

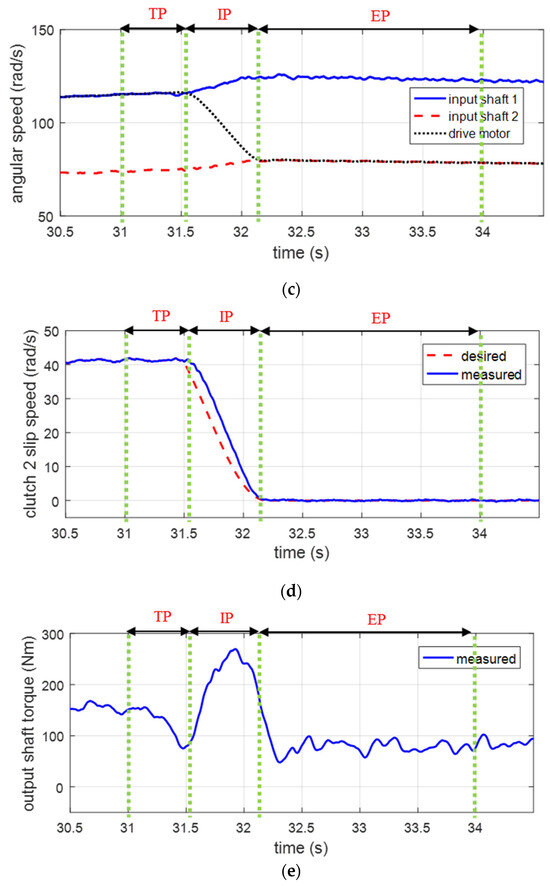
Figure 16.
Experimental validation of the proposed control strategy: (a) clutch actuator positions; (b) torques; (c) angular speeds; (d) slip speed of the oncoming clutch; and (e) output shaft torque.
4. Conclusions
The clutch-to-clutch shifts in electrified vehicles equipped with DCTs were investigated in detail, with a focus on minimizing driveline vibrations. Through theoretical analyses, simulations, and experiments, valuable insights into optimizing the shift quality of HEVs with DCTs were obtained. The proposed control strategy, which addresses the generation of reference trajectories for inertia-phase control, was confirmed to be effective for reducing driveline torsional vibrations during gear shifts with the aid of additional end-phase control. By addressing challenges such as inaccurate power-source control and residual driveline vibrations in the end phase, a comprehensive solution was developed for achieving smooth and rapid clutch-to-clutch shifts in HEVs with DCTs. The findings of this study provide valuable guidance for the development of shift control strategies in vehicles with clutches and can lead to improvements in overall vehicle drivability and shift quality. The future work will include refining the detailed control strategy for downshifts in electrified vehicles equipped with DCTs, building upon the analysis results presented in this study.
Funding
This research was supported by Sookmyung Women’s University Research Grants (3-2403-0005) and grants provided by the National Research Foundation of Korea (NRF) funded by the Korean government’s Ministry of Science and ICT (MSIT) (Grant No. RS-2023-00279679 and NRF-2022H1D8A3037394).
Data Availability Statement
The datasets presented in this article are not readily available because the data are part of an ongoing study. Requests to access the datasets should be directed to the corresponding author.
Acknowledgments
The author would like to thank Automotive Control Laboratory at KAIST for providing access to the experimental equipment.
Conflicts of Interest
The author declares no conflicts of interest. The funders had no role in the design of the study; in the collection, analyses, or interpretation of data; in the writing of the manuscript; or in the decision to publish results.
References
- Pisu, P.; Rizzoni, G. A comparative study of supervisory control strategies for hybrid electric vehicles. IEEE Trans. Control Syst. Technol. 2007, 15, 506–518. [Google Scholar] [CrossRef]
- Lin, C.; Peng, H.; Grizzle, J.W.; Kang, J. Power management strategy for a parallel hybrid electric truck. IEEE Trans. Control Syst. Technol. 2003, 11, 839–849. [Google Scholar]
- Zeng, X.; Wang, J. Optimizing the energy management strategy for plug-in hybrid electric vehicles with multiple frequent routes. IEEE Trans. Control Syst. Technol. 2017, 27, 394–400. [Google Scholar] [CrossRef]
- Zhang, Y.; Chen, X.; Zhang, X.; Tobler, W.; Jiang, H. Dynamic modeling of a dual-clutch automated lay-shaft transmission. J. Mech. Des. 2005, 127, 302–307. [Google Scholar] [CrossRef]
- Walker, P.D.; Zhang, N. Active damping of transient vibration in dual clutch transmission equipped powertrains: A comparison of conventional and hybrid electric vehicles. Mech. Mach. Theory 2014, 77, 1–12. [Google Scholar] [CrossRef]
- Walker, P.; Zhu, B.; Zhang, N. Powertrain dynamics and control of a two speed dual clutch transmission for electric vehicles. Mech. Syst. Signal Process. 2017, 85, 1–15. [Google Scholar] [CrossRef]
- Kim, S.; Choi, S.B. Cooperative control of drive motor and clutch for gear shift of hybrid electric vehicles with dual-clutch transmission. IEEE/ASME Trans. Mechatron. 2020, 25, 1578–1588. [Google Scholar] [CrossRef]
- Galvagno, E.; Velardocchia, M.; Vigliani, A. Dynamic and kinematic model of a dual clutch transmission. Mech. Mach. Theory 2011, 46, 794–805. [Google Scholar] [CrossRef]
- Liu, Y.; Qin, D.; Jiang, H.; Zhang, Y. Shift control strategy and experimental validation for dry dual clutch transmissions. Mech. Mach. Theory 2014, 75, 41–53. [Google Scholar] [CrossRef]
- Van Berkel, K.; Hofman, T.; Serrarens, A.; Steinbuch, M. Fast and smooth clutch engagement control for dual-clutch transmissions. Control Eng. Pract. 2014, 22, 57–68. [Google Scholar] [CrossRef]
- Gao, B.; Chen, H.; Li, J.; Tian, L.; Sanada, K. Observer-based feedback control during torque phase of clutch-to-clutch shift process. Int. J. Veh. Des. 2012, 58, 93–108. [Google Scholar] [CrossRef]
- Kim, D.; Peng, H.; Bai, S.; Maguire, J.M. Control of integrated powertrain with electronic throttle and automatic transmission. IEEE Trans. Control Syst. Technol. 2007, 15, 474–482. [Google Scholar] [CrossRef]
- Pettersson, M.; Nielsen, L. Gear shifting by engine control. IEEE Trans. Control Syst. Technol. 2000, 8, 495–507. [Google Scholar] [CrossRef]
- Goetz, M.; Levesley, M.C.; Crolla, D.A. Dynamics and control of gearshifts on twin-clutch transmissions. Proc. Inst. Mech. Eng. Pt. D J. Automob. Eng. 2005, 219, 951–963. [Google Scholar] [CrossRef]
- Walker, P.D.; Zhang, N.; Tamba, R. Control of gear shifts in dual clutch transmission powertrains. Mech. Syst. Signal Process. 2011, 25, 1923–1936. [Google Scholar] [CrossRef]
- Li, M.; Khonsari, M.; Yang, R. Dynamics analysis of torsional vibration induced by clutch and gear set in automatic transmission. Int. J. Automot. Technol. 2018, 19, 473–488. [Google Scholar] [CrossRef]
- Qu, J.; Shi, W.; Wang, J.; Chen, Z. Modeling and analysis of clutch nonlinear behavior in an automotive driveline for suppressing torsional vibration. Machines 2022, 10, 819. [Google Scholar] [CrossRef]
- Guo, D.; Ning, Q.; Ge, S.; Zhou, Y.; Luo, R. Dynamic analysis of gear rattling of a certain type of dual-clutch transmission. Machines 2022, 10, 805. [Google Scholar] [CrossRef]
- Brancati, R.; Pagano, S.; Rocca, E. Dynamic behaviour of an automotive dual clutch transmission during gear shift maneuvers. Appl. Sci. 2023, 13, 4828. [Google Scholar] [CrossRef]
- Liu, Y.; Qin, D.; Jiang, H.; Zhang, Y. A systematic model for dynamics and control of dual clutch transmissions. J. Mech. Des. 2009, 131, 061012. [Google Scholar] [CrossRef]
- Kim, S.; Choi, S. Control-oriented modeling and torque estimations for vehicle driveline with dual-clutch transmission. Mech. Mach. Theory 2018, 121, 633–649. [Google Scholar] [CrossRef]
- Oh, J.; Choi, S.B.; Chang, Y.J.; Eo, J.S. Engine clutch torque estimation for parallel-type hybrid electric vehicles. Int. J. Automot. Technol. 2017, 18, 125–135. [Google Scholar] [CrossRef]
- Crowther, A.; Zhang, N.; Liu, D.K.; Jeyakumaran, J.K. Analysis and simulation of clutch engagement judder and stick-slip in automotive powertrain systems. Proc. Inst. Mech. Eng. Pt. D J. Automob. Eng. 2004, 218, 1427–1446. [Google Scholar] [CrossRef]
- Kim, S.; Oh, J.; Choi, S. Gear shift control of a dual-clutch transmission using optimal control allocation. Mech. Mach. Theory 2017, 113, 109–125. [Google Scholar] [CrossRef]
- Li, G.; Görges, D. Optimal control of the gear shifting process for shift smoothness in dual-clutch transmissions. Mech. Syst. Signal Process. 2018, 103, 23–38. [Google Scholar] [CrossRef]
- Flash, T.; Hogan, N. The coordination of arm movements: An experimentally confirmed mathematical model. J. Neurosci. 1985, 5, 1688–1703. [Google Scholar] [CrossRef]
- Garofalo, F.; Glielmo, L.; Iannelli, L.; Vasca, F. Smooth Engagement for Automotive Dry Clutch. In Proceedings of the 40th IEEE Conference on Decision and Control, Orlando, FL, USA, 4–7 December 2001; pp. 529–534. [Google Scholar]
- McFarlane, D.; Glover, K. A loop-shaping design procedure using H/sub infinity/synthesis. IEEE Trans. Automat. Contr. 1992, 37, 759–769. [Google Scholar] [CrossRef]
- Kim, S.; Oh, J.J.; Choi, S.B. Driveline torque estimations for a ground vehicle with dual-clutch transmission. IEEE Trans. Veh. Technol. 2017, 67, 1977–1989. [Google Scholar] [CrossRef]


Disclaimer/Publisher’s Note: The statements, opinions and data contained in all publications are solely those of the individual author(s) and contributor(s) and not of MDPI and/or the editor(s). MDPI and/or the editor(s) disclaim responsibility for any injury to people or property resulting from any ideas, methods, instructions or products referred to in the content. |
© 2024 by the author. Licensee MDPI, Basel, Switzerland. This article is an open access article distributed under the terms and conditions of the Creative Commons Attribution (CC BY) license (https://creativecommons.org/licenses/by/4.0/).