Review

A Literature Review of Fault Detection and Diagnostic Methods in Three-Phase Voltage-Source Inverters

1
UNIROUEN/ESIGELEC/IRSEEM, 76801 Rouen, France
2
Faculty of Engineering, City University, Tripoli 1300, Lebanon
3
LaRGES, CRSI, Faculty of Engineering, Lebanese University, Tripoli 1300, Lebanon
*
Author to whom correspondence should be addressed.
Machines 2024, 12(9), 631; https://doi.org/10.3390/machines12090631
Submission received: 27 July 2024 / Revised: 18 August 2024 / Accepted: 19 August 2024 / Published: 9 September 2024
(This article belongs to the Section Machines Testing and Maintenance)

Abstract

:
This review paper offers a comprehensive examination of the various types of faults that occur in inverters and the methods used for their identification. The introductory segment investigates the internal component failures of voltage-source inverters (VSIs), examining their failure rates and the consequent effects on the overall system performance. Subsequently, this paper classifies and clarifies the potential malfunctions in components and sensors, placing particular emphasis on their frequency of occurrence and the severity of their impact. The examination encompasses issues associated with transistors, including open circuits, short circuits, gate firing anomalies, as well as failures in capacitors, diodes, and sensors. Following this, the paper delivers a comparative assessment of fault diagnosis techniques pertinent to each type of component, appraised against specific criteria. The concluding section encapsulates the findings for each fault category, delineates the fault detection and diagnosis (FDD) methodologies, analyzes the outcomes, and provides recommendations for future scholarly investigation.

1. Introduction

As a critical element within the electrical conversion chain, alongside its standalone applications, the demand for inverters continues to expand and is becoming increasingly significant across various sectors. Inverters are predominantly employed in residential and industrial sectors, such as production lines and green energy fields, in addition to being utilized in unmanned aerial vehicles (UAVs) [1] and electric vehicles (EVs) [2]. In industrial applications, inverters are mainly used for variable-speed AC drives, especially for running induction motors (IMs), where the estimated failure rate can vary according to the process and the number of components used with the inverter. Likewise, in the case of the green energy field, the inverter allows a bidirectional flow of current between the green energy source and either the grid or residential and standalone loads. Nevertheless, despite the implementation of cutting-edge technologies for power semiconductor devices [3,4] and advanced control algorithms [5,6,7], faults that can affect the reliability of the overall system and lead to cascading faults continue to manifest repeatedly and frequently unless a fault detection and diagnosis method is implemented. For example, in wind turbines, inverter failure rates vary between the onshore and offshore architecture [8] at rates of 27% and 8%, respectively. Additionally, for the solar photovoltaic sector, about 28% of the failures represent inverter faults [9]. Research on hydroelectric turbine systems has shown a failure rate of 27%, which includes the inverters and electrical equipment connected to the hydroelectric turbine systems [10]. Conversely, inverter failure accounts for approximately 12% of the total EV failures, primarily attributed to its reduced power requirements relative to the previously mentioned systems, in addition to the higher probability of failure of the mechanical parts within the vehicle due to collisions and various other factors [11]. A summary of inverter failure rates for each field is presented in Table 1, as well as their main impact on the system when they occur. Notably, inverter failures can lead to a partial or complete shutdown of the system unless proactive actions are taken through diagnosis, which can reduce downtimes and the repair time, improving the reliability and performance of the system and preventing a sudden interruption in the power flow, as in the case of renewable energy sources and EVs.
Recent research has concentrated on identifying faults in components and sensors to enhance dependability and reliability. Researchers suggest new ways of inverter fault diagnosis like FFT and evolutionary neural networks [12], root cause analysis for sensor faults, experimental validation of the fault models [13], as well as real-time fault detection strategies without extra sensors for multilevel converters [14]. These techniques are specifically engineered to identify and predict faults with a high degree of reliability, thereby preserving system integrity and minimizing operational downtime. Research has also focused on fault detection algorithms, which are pattern recognition-based and have been developed for cascade multilevel inverters that need only one sensor for automatic fault detection. These advancements represent the primary factors contributing to the exceptional reliability of inverters across a diverse range of applications.
To identify the open-circuit fault of a power semiconductor in the three-phase, a two-level, voltage-source inverter-fed permanent magnet synchronous machine (PMSM) diagnostic algorithm was presented in [15,16]. This approach can equally identify permanent and transient faults in power switches that may result from one or a combination of factors. This study evaluates newly developed methodologies for the diagnosis of power switch faults within voltage-source converters (VSCs). Among all the types of faults in VSIs, open-circuit fault diagnosis for voltage-source inverters is probably one of the most researched. This study introduces a methodology for detecting open-circuit faults in voltage-source inverters. It incorporates a structured neural network system implemented through machine learning to obtain a high level of precision for identifying faulty conditions. The system effectively identifies and specifies the various categories of adverse conditions present in power electronics inverters for electrical drives [17].
Previous review articles cover the topics of fault detection and diagnosis of electric motor drives and battery systems of electric vehicles. Some of these articles stress the significance of FDD for the safety and reliability of the EV. The electric motor drive and lithium-ion battery system are some of the components that are highly susceptible to different faults. If these faults are not diagnosed and corrected on time, they may cause failures and other disastrous incidents. This paper conducts a comparative analysis of the conventional model-based and signal-based fault detection and diagnosis (FDD) methodologies, encompassing data analytical techniques and machine learning approaches. Furthermore, it offers an extensive array of information that may be utilized in subsequent research endeavors within this domain [18]. Fault detection is important, especially for safety measures, fault tolerance, and device maintenance in power electronics systems. Compared to previous review articles, this review makes a significant contribution, as it introduces various fault detection methods and their importance in different applications, particularly in EVs [19].
The fault detection of sensors in voltage-source inverters is important for ensuring safety, as has been suggested in many papers. F. Mehmood studied sensor faults and modeled sensor faults in power electronics inverters [20] with the objective of assessing the influence of sensor faults on the power quality and ensuring the reliable operation of the system. The results showed how faults in the sensors impact the system in general. Techniques such as set-valued observers and fault detection algorithms have also been used to detect inverter sensor faults [21]. Fault diagnosis of electric vehicles and other inverter-based systems helps to improve the safety and performance of the system. The detection of faults enables the system to be corrected before faults may lead to failure. In EVs, health management systems and fault-tolerant control schemes using operational data enhance the continuous power feeding and optimum control of motors [22]. Similarly, in alternative systems that employ inverters, such as power converters and motors, fault detection serves to enhance the output and increase the lifespan of the system, thereby contributing to the enhanced stability of the overall system.
The types of inverters employed in EVs and renewable energy sources fall into five general categories:
  • Voltage-source inverters (VSI): This is already applied in the field of EVs and intelligent renewable energy systems because of its ease of implementation, robustness, and high speed.
  • Current-source inverters (CSI): CSIs are used only when a constant current output is required; nonetheless, the CSI is reasonable for certain motor drivers.
  • Impedance-source inverters (ZSI): This employs an alternate impedance network to step up the DC voltage before conversion, allowing optimal power extraction from low-voltage sources or sources such as photovoltaic panels.
  • Multilevel inverters: These inverters use several voltages to obtain a sinusoidal waveform to the best of their ability. They minimize harmonic distortion, increase overall efficiency, and improve the power quality.
  • Hybrid multilevel inverters: Hybrid multilevel inverters outperform VSIs and CSIs but have features from both. These have uses in medium-voltage drives and renewable energy systems.
In conclusion, although various types of inverters exist, the VSI remains the most preferred choice for EVs and renewable energy applications due to its reliability, robustness, controllability, and compliance with grid principles. Thus, when working with inverters, concentrating on VSIs will align with the modern development trends and recommendations.
Despite the existence of multiple scholarly articles that have concentrated on analyzing single fault types, such as switches [16,17], capacitors [18,19], sensor faults [20,21,22], and other power electronics faults [23,24,25], this review paper stands out by comprehensively covering six distinct fault types in depth, including the open switch, short switch, gate misfiring, anti-parallel diode, electrolytic capacitor, and sensor faults. Table 2 presents the characteristics of these faults, including the inverter output, symptoms, and thermal effects.
The extensive range of the presentation makes the review a key source that captures the complexity of inverter failures. By referencing multiple related studies from the past five years, the sole review paper that examines more than one type of fault is the study by Azra Malik, which covers only switch faults and electrolytic capacitor faults [26]. In addition to summarizing the current state of knowledge, this review also provides recommendations for future research activities; it directs others to search for more efficient and reliable inverter structures.
The total number of research articles reviewed during the last 5 years is summarized in Table 3, and the breakdown of the articles related to each type of fault is also included.
This paper consists of six sections; the second section addresses VSI faults and their system-wide effects. Section 3 classifies the fault detection and diagnosis methods and outlines the essential evaluation indicators for comparison. Section 4 presents and compares VSI fault detection and diagnosis approaches for each fault type. Section 5 interprets the results, concluding with Section 6.

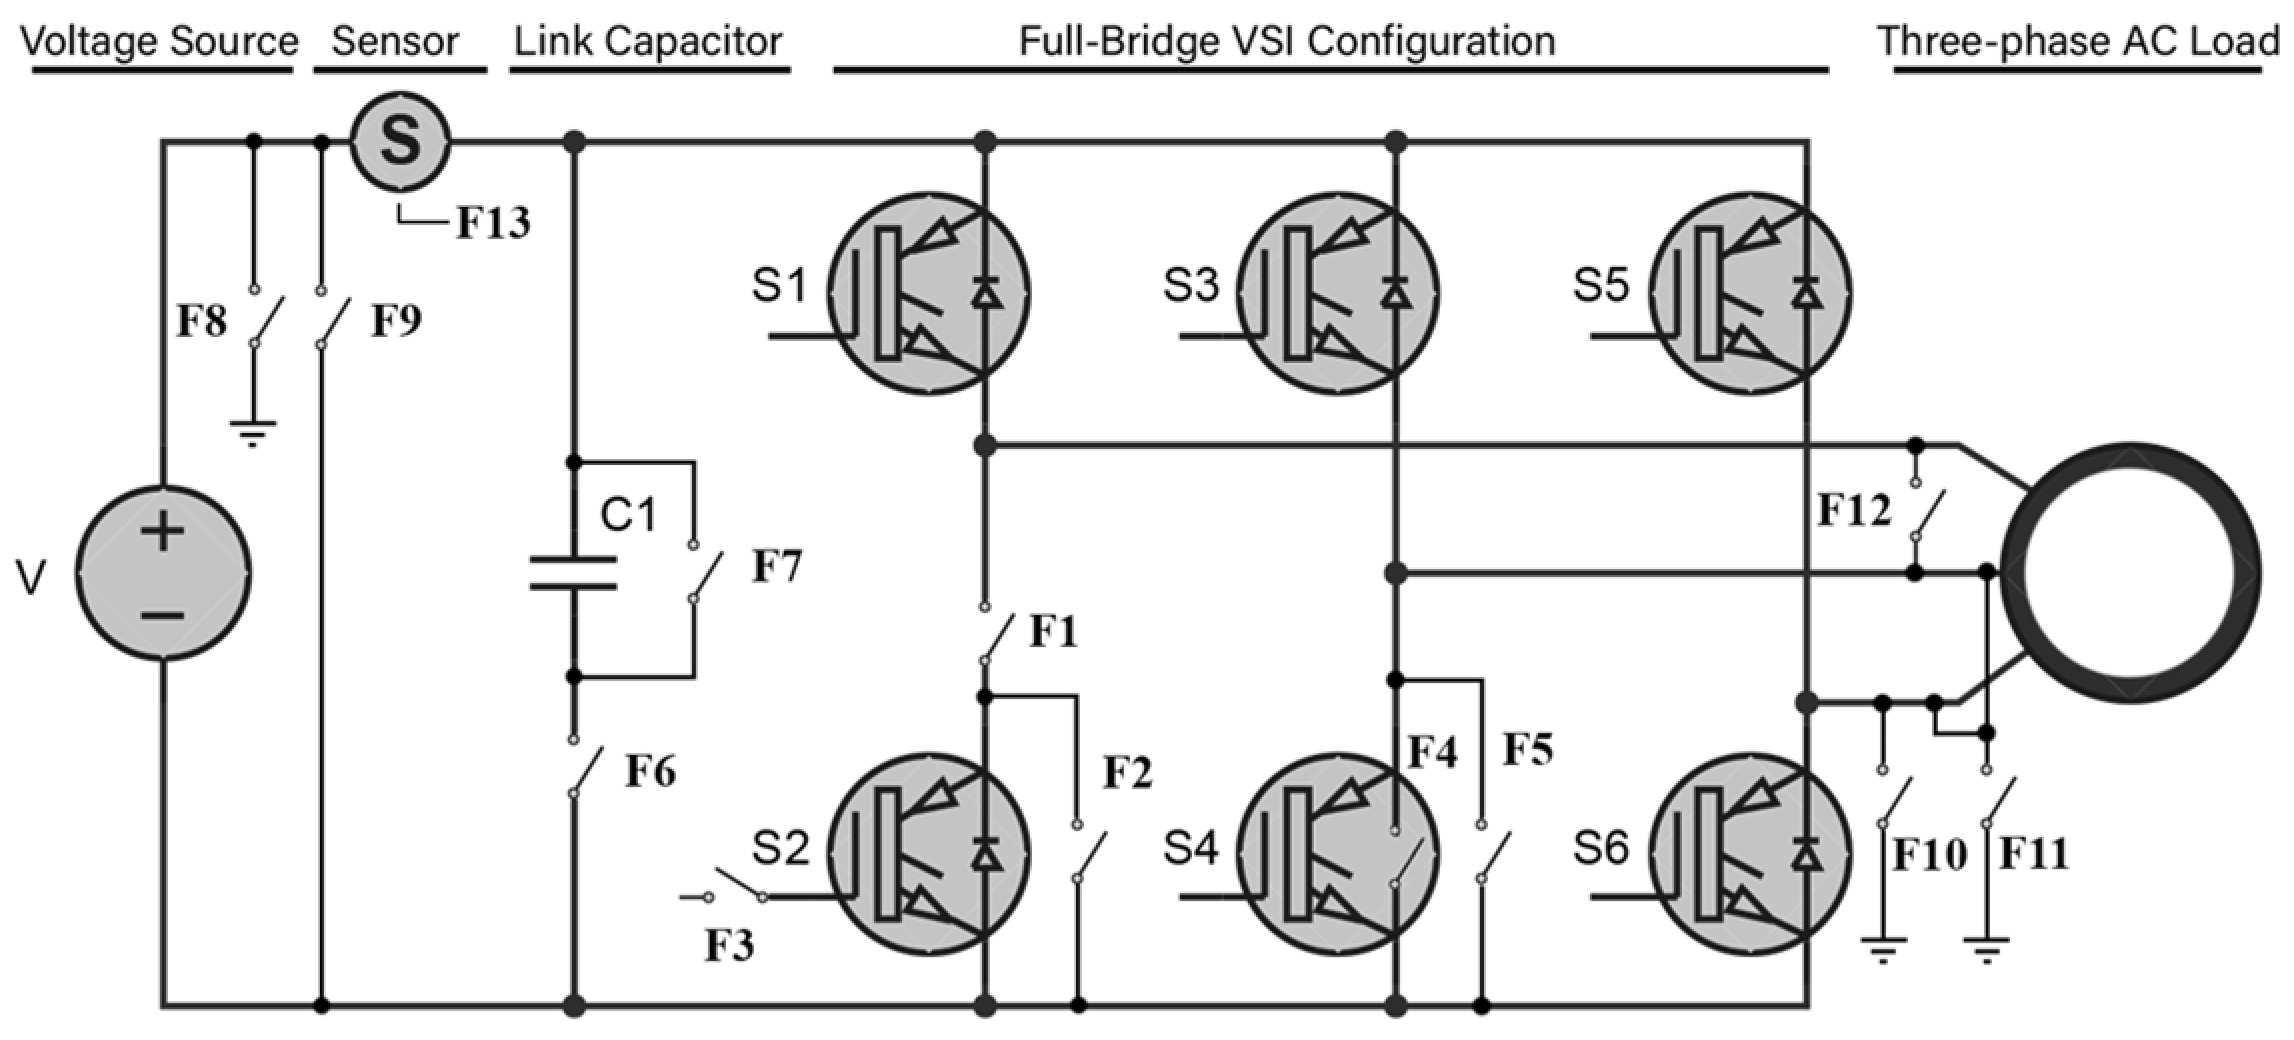
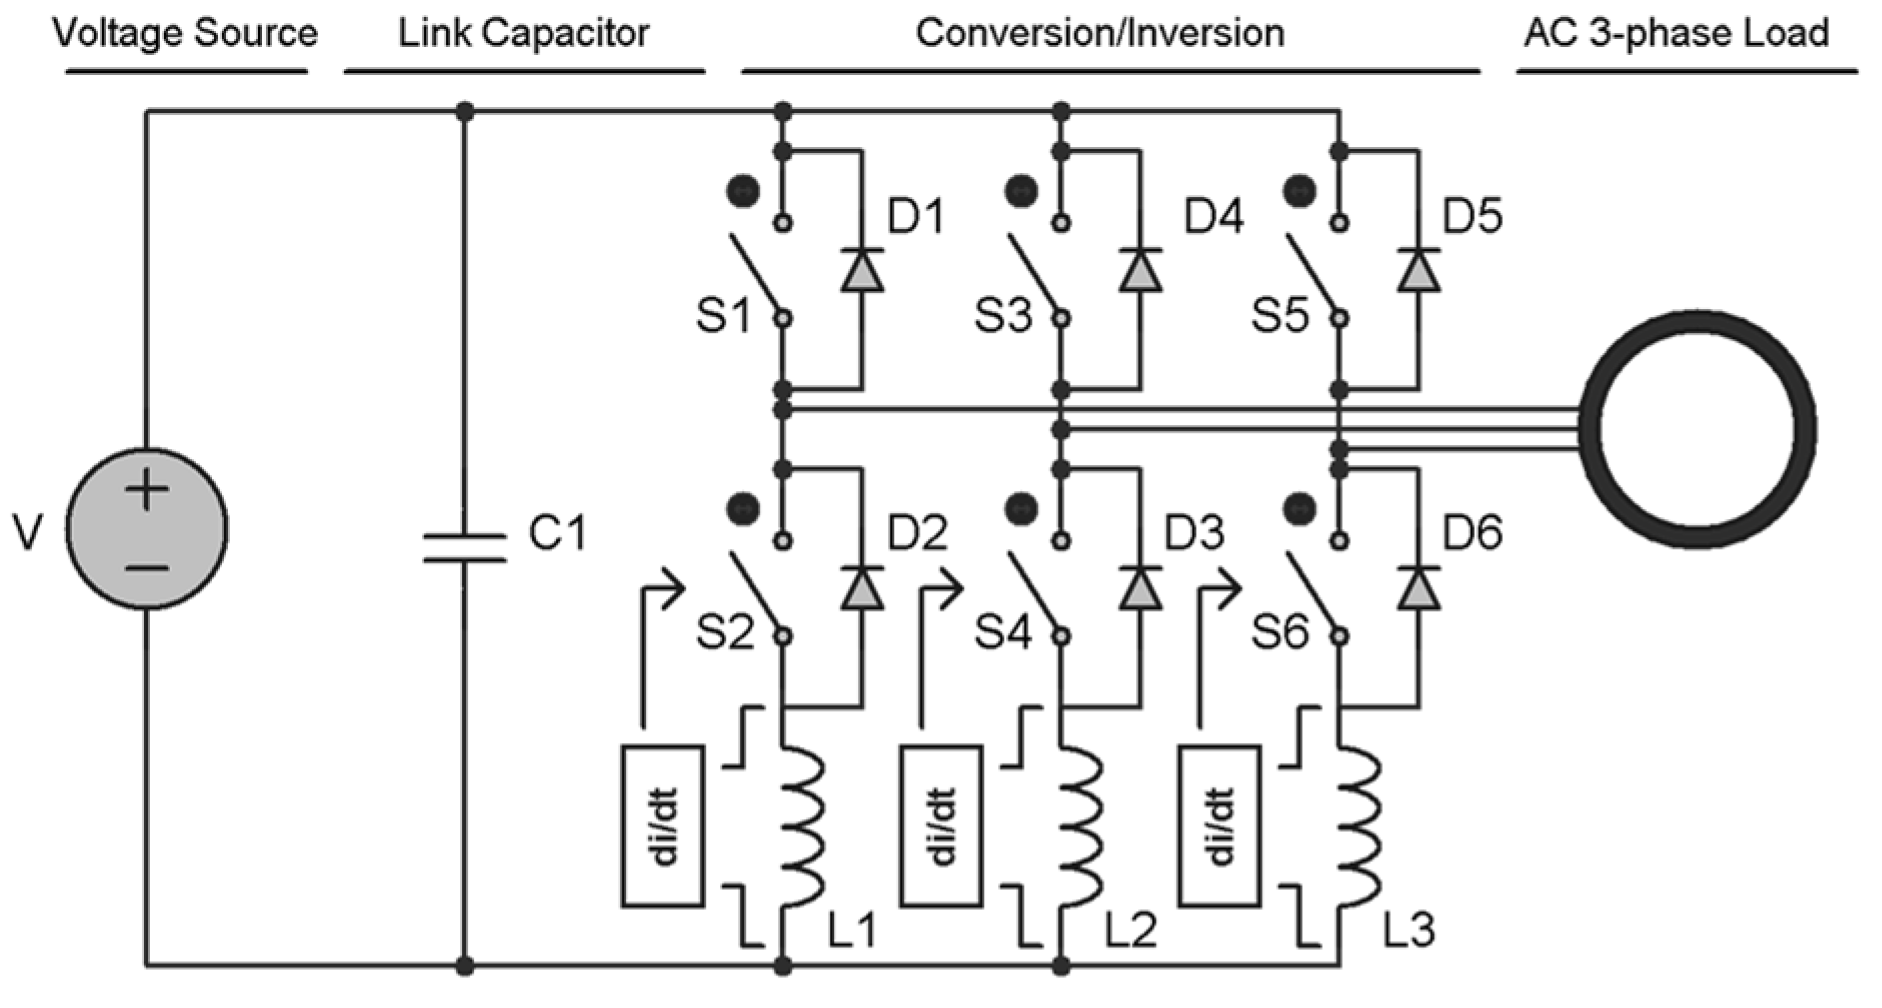
2. VSI Faults Overview

When developing an inverter to use in the previously mentioned application fields, some important considerations must be taken that facilitate a precise operation with optimal performance to guarantee the dependability of the inverter, particularly in applications associated with safety. The operating experience of the VSI states that the most vulnerable components are the power switches (semiconductors), electrolytic capacitors, and the printed circuit board (PCB). Locations of all the possible faults that can occur in the overall chain, including the DC source, VSI, and the AC three-phase load, are shown in Figure 1.
The statistical distribution for the failure rate in various parts of the VSI is represented in Figure 2 [83]. There are numerous factors that contribute to these faults; among them are the overheating of the power switches caused by overloading and control failure, as well as external causes such as mechanical accidents and the impacts on the overall structure of the inverter. According to the data chart in Figure 2, the reliability level of the VSI depends on the reliability values of each component.
In brief, the VSI’s component faults, including their fault cases, are as follows:

2.1. Power Switch

The most commonly used power switches in the VSI are either the insulated-gate bipolar transistor (IGBT) or the metal–oxide–semiconductor field-effect transistor (MOSFET). This particular type of fault has the potential to cause significant harm to the primary voltage source and the connected load unless appropriate precautions are implemented within a safe time for handling the voltage and current over-rating.
The three primary power switch fault cases are as follows:

2.1.1. Open Fault (F1) [83]

This can be caused by an open gate or collector (a drain for the MOSFET case) situation, which can be either internally inside the transistor resin body or externally, which will be located at the semiconductor terminals. Such a fault has an average impact on the overall system unless it is reconfigured rapidly.

2.1.2. Short Fault (F2) [84]

This can be caused by an internal or external short circuit between the collector and the emitter (a drain and source for the MOSFET case). This fault has a dangerous effect, which can lead to high short-circuit currents and may cause a sequential fault unless it is reconfigured rapidly.

2.1.3. Gate Misfiring (F3) [83]

The primary factor contributing to this specific type of fault is an open gate situation, thus losing the connection between the control circuit and the gate terminal, making it float in potential unless a pull-down resistor is incorporated at the gate terminal. It should be noted that gate misfiring has the same effect as an open-switch fault (F1).
Note that faults F1, F2, and F3 can be single or multiple fault cases, and they can occur at any switch (S1, S2, S3, S4, S5, and S6) with any location(s).

2.2. Anti-Parallel Diode

Old classical power transistors, such as IGBT and MOSFETS, do not include an internal anti-parallel diode between their power terminals. Nowadays, anti-parallel diodes are built in inside the transistor resin case. These diodes are required for the reverse-current path of the inductive/capacitive load and can also be used for regenerative loads, in addition to break-over high-voltage peaks protecting the transistor from damage [85]. Two main diode fault cases are as follows:

2.2.1. Open Fault (F4)

This type of fault may not affect the operation of the VSI but will increase the probability of the transistor being damaged by overvoltage spikes, especially when an inductive load is connected to the output of the inverter. Whereas the reverse-current path from regenerative loads will be disconnected.

2.2.2. Short Fault (F5)

Being short-circuited with a parallel connection with the transistor will lead to the same scenario as (F2).

2.3. Link Capacitor

Capacitors are the most sensitive components against high voltages and excessive heat. The primary function of capacitors is to smooth voltage ripples and filter higher frequencies, and in some cases, a branch of capacitors with an even number is used as a potential divider for the generation of a neutral point. The two predominant types of capacitor fault scenarios are as follows:

2.3.1. Open Fault (F6)

This fault can be caused by either a terminal being disconnected or a damaged semi-permeable layer between the two internal electrolytic aluminum films. It may not affect the operation of the VSI for a short time; rather, it has a future impact in addition to an unstable operation.

2.3.2. Short Fault (F7) [86]

In the case of an internal or external short-circuit connection between the two terminals of the capacitor, the short fault has a major effect on the main voltage source more than the inverter and the load.

2.4. Input Port

This type of fault is located at either the DC voltage source or the DC-link bus connecting between the DC source and the VSI input port. Two main fault cases are located at the input port and are as follows:

2.4.1. Single Line-Ground S.C. (F8)

This fault occurs when either the positive or the negative DC source terminal is short-circuited to the ground. This can result in a half-wave output generation of the VSI, thereby eliminating the complementary half-wave when the capacitor associated with its polarity experiences a short circuit.

2.4.2. Line-Line S.C. (F9)

When this occurs, it may only damage the DC voltage source and will cause a total shutdown of the VSI since there is no voltage potential across its input terminals, like (F7).

2.5. Output Port

This is located at the output three-phase terminals of the VSI, which is mainly caused by the load. Three fault cases are located at the output port and are as follows:

2.5.1. Single Line-Ground S.C. (F10)

This type of fault occurs when a short circuit occurs between one of the phase output terminals and the ground terminal. This fault can lead to an overcurrent and can damage the power switches if they are not reconfigured.

2.5.2. Double Line-Ground S.C. (F11)

This type of fault occurs when two of the output phase terminals are shorted (connected) with the ground terminal. This fault also acts the same as (F10).

2.5.3. Line-Line S.C. (F12)

This type of fault occurs when a short circuit occurs between two of the phase output terminals. This fault can lead to an excessive overcurrent, thus damaging the power switches.

2.6. Sensor (F13)

There are two primary objectives for the implementation of sensors in the VSI. The first objective is for overcurrent and fault detection within the protection framework. The second objective is related to control, especially for the closed-loop system. In the case of a sensor fault, a partial or complete malfunction will occur. Accordingly, if a faulty sensor has not been reconfigured and fixed, it may lead to cascading faults, particularly within the sensor-based data system [87]. There exist five principal categories of sensor faults, which are:

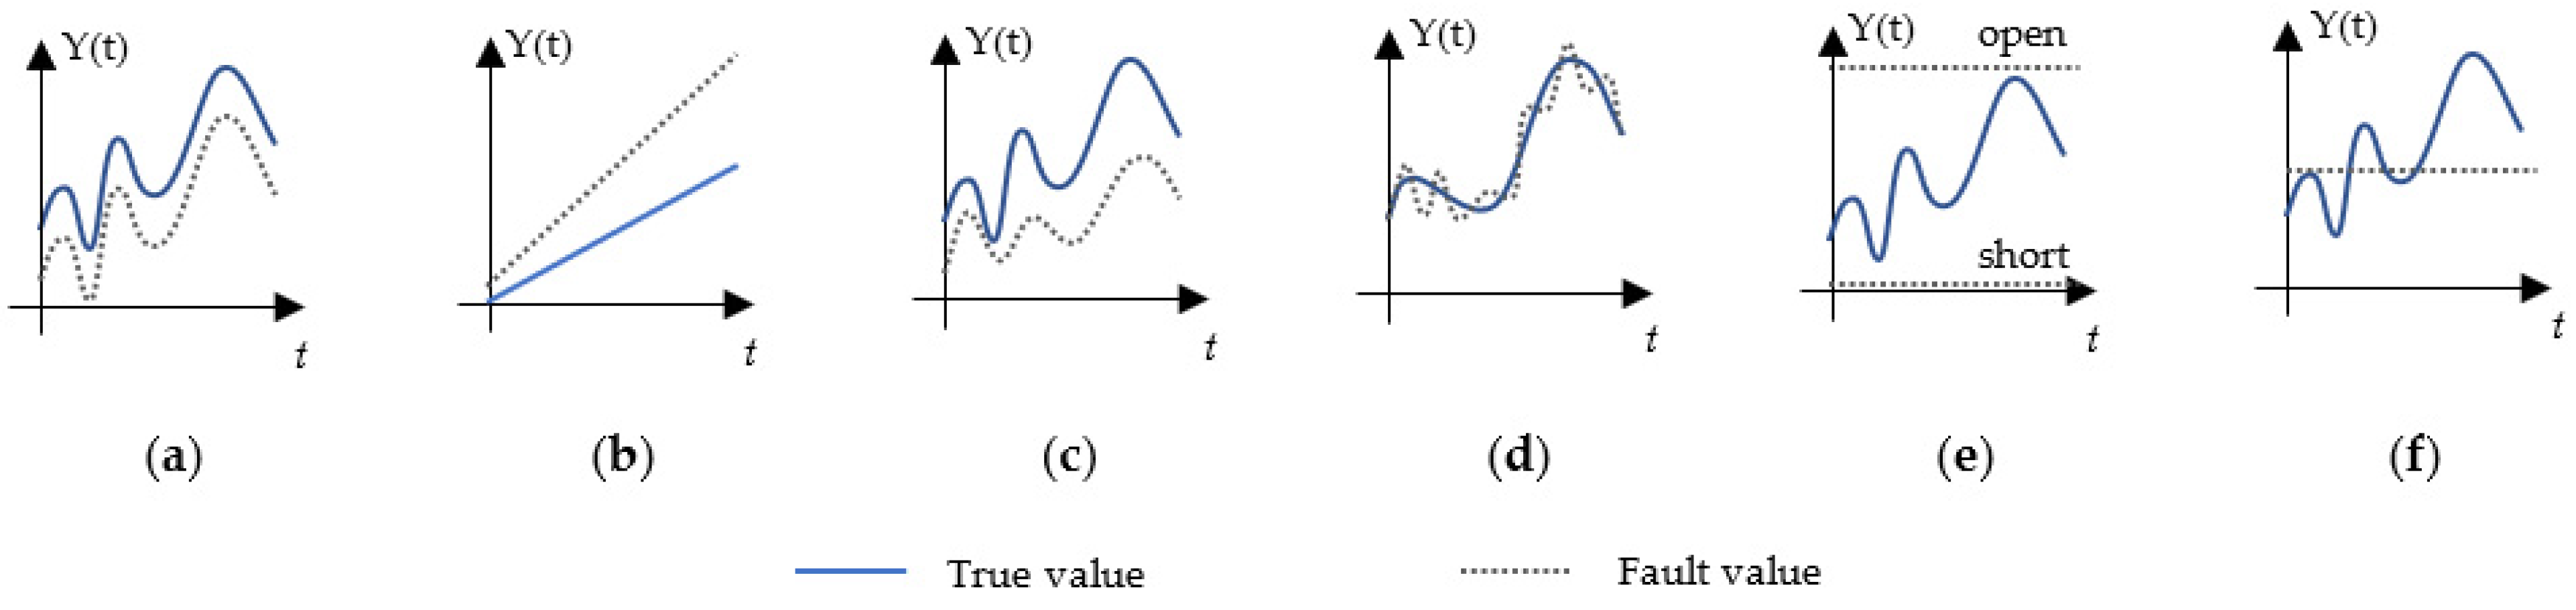
2.6.1. Bias Fault [87]

This is the more frequent and common fault sensor type, where its measured values are replaced by a constant value. The main cause of this type of fault is either the bias voltage or the bias current. It is represented graphically in Figure 3a.

2.6.2. Gain Fault [87]

This type of fault multiplies a constant positive real value ‘k’ by the amount of change delta ‘Δ’. Expressing it mathematically gives k × Δ. Consequently, a faulty sensor will not have a signal value equal to zero. This is represented graphically in Figure 3b.

2.6.3. Drift Fault [87]

This type of fault represents a time-dependent offset, indicating that the original default performance of the sensor deviates with a value that varies with time. This type of fault is not observed easily or identified rapidly, meaning that it needs an accurate and rapid detection algorithm followed by a reconfiguration procedure. It is represented graphically in Figure 3c.

2.6.4. Sensor Noise [87]

When the sensor is affected by the working environment or hardware noise, such as circuit elements, its output data will be noisy. It can also come from external causes like human or external interferences with the sensor’s data cable or the sensor itself. It is represented graphically in Figure 3d.

2.6.5. Short Circuit and Open Circuit [88]

Defective solder joints and disconnected terminals are the main causes of open-circuit faults. On the other hand, internal component faults or external short circuits at the sensor terminals will trigger short-circuit faults. It is represented graphically in Figure 3e.

2.6.6. Freezing [88]

When it has been freezing, a sensor generates a constant value instead of the real measured value. This type of fault can occur due to sudden changes in the system, such as transients in the current or voltage, or by capturing over-rated values that a sensor cannot withstand, such as overvoltage and overcurrent spikes or electromagnetic interferences. It is represented graphically in Figure 3f.
Table 4 illustrates the impact of each component fault on the efficiency and behavior of the VSI.
This paper shows that component and sensor faults have a major impact on the performance and characteristics of voltage-source inverters (VSIs). Switching devices, such as IGBTs and MOSFETs, are affected by poor layouts, and they can cause high switching losses, hence reducing the overall efficiency—a poor DC link capacitor results in a variation in the voltage. Inductor and transformer faults distort the output waveform and the level of harmonics. In gate drivers and control circuits, instabilities originate. Defects in the sensors for the voltage and current can cause problems in power electronic converter systems and the quality of the inverter power. For instance, the current or voltage readings can be off base, thus affecting the control precision and product quality. In general, they decrease productivity, distort waveforms, present safety hazards, and alter the behavior of the system. Fault detection and diagnosis must be accurate to ensure that the VSI performance is not compromised.

3. Evaluation Indicators of FDD Approaches

The fault detection and diagnosis (FDD) algorithms have been implemented in various systems for several decades. This process aims to develop and maintain a desirable performance in the field where it is involved, with its potential to improve the overall process task and the ability to avoid the severe failure that might occur afterward. The earliest FDD methods are designed to determine the main cause and identify the location of a fault after it occurs; these are known as basic and simple methods. With the development of artificial intelligence (AI) and automation technologies, FDD capabilities have improved. Consequently, the FDD methods can accomplish their tasks, even when integrated within intricate systems that employ advanced control strategies.
There are three basic tasks of FDD approaches, classified as follows:
(a)
Detection: This indicates that there is a fault in the system, in addition to the timing of its occurrence.
(b)
Isolation: This determines the type of fault and its location.
(c)
Identification: This determines the magnitude of the fault.
There are several indicators that are used for evaluating the effectiveness and performance of each of the FDD methods [89], which are as follows:
  • Robustness and Adaptability: The capability of performing a task without failure, covering a wide range of situations, and performing effectively, even with load variation, transients, and noisy environments. This is in addition to the adaptation when minor changes may occur in the system, including component degradation and external changes.
  • Computational Complexity: This is the complexity of the operation and the effort required by the algorithm for the detection and diagnosing processes. This mainly depends on the complication level of the mathematical functions and the decision-making operation.
  • Detection Speed: In general, the duration of fault detection is significantly influenced by the complexity of the algorithm. The faster the detection speed is, the better the FDD approach will be. The detection speed is an important indicator for selecting effective methods from those that need more time to detect fault occurrence.
  • False-Positive Rate (FPR): The FPR is a ratio of pure negative classes that have been classified and known to be negative or positive.
The FPR formula can be represented as:
F P R = F P F P + T N
where F P is the false positive, and T N is the true negative.
  • False-Negative Rate (FNR): the FNR is equivalent to the ratio of the actual positive fault detection (true positive) that has been classified by the system as negative (false negative).
The FNR formula can be represented as:
F N R = F N F N + T P
where F N is the false negative, and T P is the true positive.

4. VSI FDD Methods

In this section, a review of the latest and most efficient FDD methods will be investigated for each type of internal VSI component fault. After listing the FDD methods, a comparison will be performed between them based on the evaluation indicators. Finally, a brief conclusion will be derived according to the results obtained from the comparison table after each fault type.

4.1. Open Switch

For instance, there are 39 possibilities of an open-switch fault. Knowing that if the number of faulty switches exceeds four, the overall system will not function, with only one switch remaining in the circuit. All possible types of open faults, taking into consideration their ability to continuously operate with at least one path, are represented in Figure 4.
The open-switch fault methods are used for detection and diagnosis, and are as follows:

4.1.1. Spectrogram [27,28,90]

This approach employs time-frequency analysis, known scientifically as time-frequency distribution (TFD), to monitor inverter waveforms to detect, identify, and localize open-switch faults. Inverter waveforms are used for condition monitoring and include diagnosing parameters such as the instantaneous AC root mean square (RMS) output voltage (Vrms), instantaneous total waveform distortion (TWD), instantaneous total harmonic distortion (THD), and the instantaneous total non-harmonic distortion (TnHD). Immediately upon detecting any changes in these monitored parameters, a decision will be taken to isolate and reconfigure the faulty open switch after identifying and locating it. This methodology is capable of the early detection of open-switch faults; however, it necessitates substantial computational resources.

4.1.2. Current Trajectory Using Park’s Transform [29,30]

This type of method relies on the inverter’s current transformation using Park’s vector, also known as the d–q transformation, which is used to simplify the operations related to the three-phase current. After applying d–q transformation using Equations (1) and (2), the magnitude and phase angle will be represented as a current pattern with the shape of a perfect circle in normal conditions, as shown in Figure 5a. When an open-switch fault occurs, the magnitude and the angle will be changed, indicating and identifying the faulty switch according to its shape and angle, as shown in Figure 5b–g.
Accordingly, by using this method, the three output AC currents represented by (ia, ib, and ic) will be transformed into two-phase current values (id, iq) given as:
i d = 2 3 i a 1 6 i b 1 6 i b
i q = 1 2 ( i b i c )
This method can detect multiple open-switch faults using the magnitude of the phase angle with low computational complexity.

4.1.3. Normalized Load Current [31]

Unfortunately, the previously mentioned current transformation that uses Park’s vector is load-dependent, meaning that the detection process may be affected by load transients and load variations that may generate false alarms under these conditions. To overcome this issue, normalizing DC quantities can be used as a modification method to Park’s vector transformation, which can supply simplified information about the operation of the inverter. A diagnostic variable Dn with a normal value of ±1 for a normally operated inverter will be as given:
D n = i n ( k ) i n ( k )
where 〈⋯〉 is the evaluation of the average value over a period, n is the current phase (a, b, or c), and k is the sampling division.
This diagnostic variable will vary in a range between 0 and ±1 according to the faulty open-switch location.

4.1.4. Clark’s Transform [32]

This method is similar to Clark’s vector transformation; it normalizes the three-phase currents and transforms them into two absolute normalized currents. According to the sign and magnitude of the normalized current and assigning a fault diagnostic variable, the faulty switch can be localized and identified precisely.

4.1.5. Fuzzy Logic [33]

This approach employs fuzzy logic reasoning after the inverter phase currents have been transformed or normalized using any of the transformation approaches, such as Park’s vector, Clarks’ transformation, or Concordia transformation. All possible fault cases are simulated in real-life scenarios, where the fuzzy reasoning algorithm will then correlate the measurement of real-time inverter parameters with the pre-extracted fault cases for detecting and locating the faulty switch(es). This fuzzy rule-based method can easily identify several fault modes, including both single and multiple open-switch conditions.

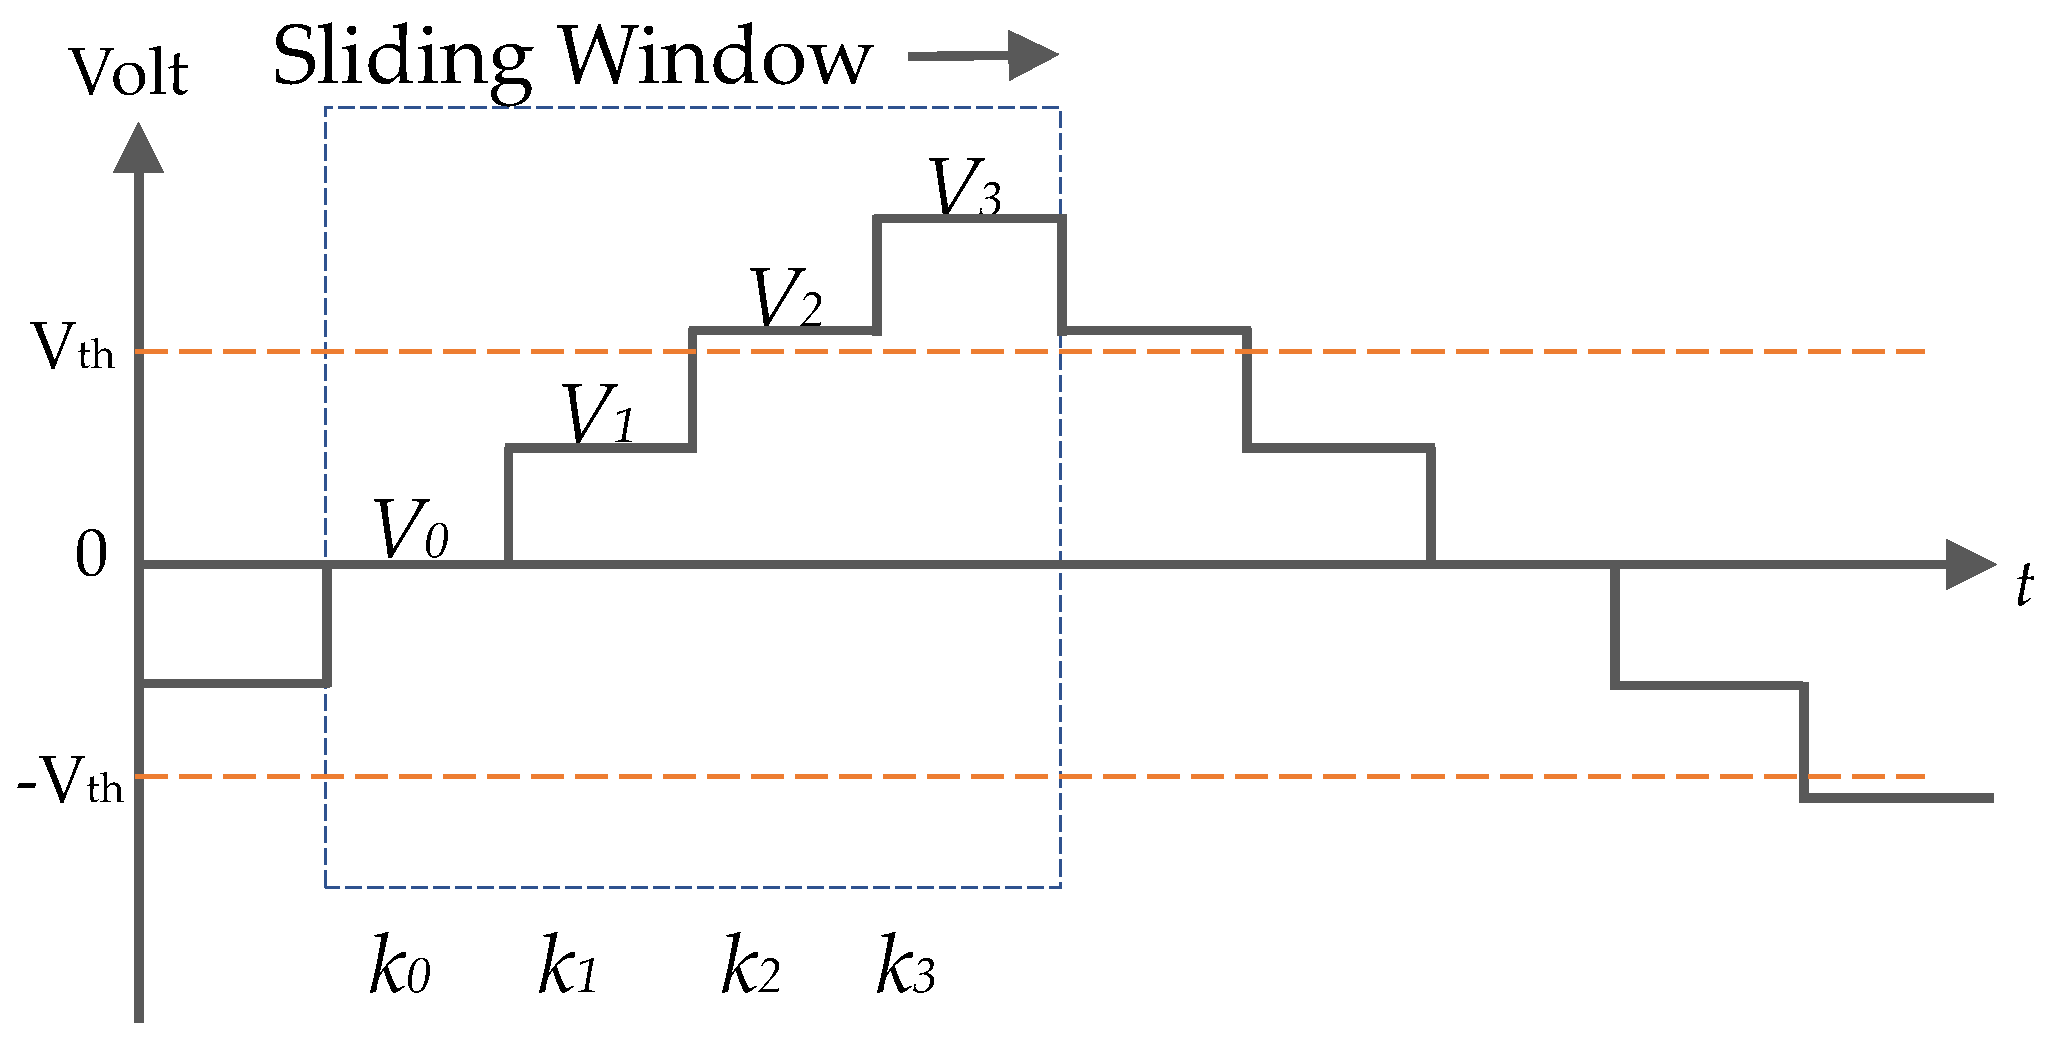
4.1.6. Sliding-Window Counting Based on Phase Voltages [34]

When an open-switch fault occurs, half of the phase-voltage waveform corresponding to the phase where the faulty switch is located will vanish. Figure 6 represents the working principle of the sliding-window counting method. This approach aims to carry out periodic measurements for each phase voltage (Vx) for each time sample, and these values will be compared with a pre-set threshold value (±Vth).
This procedure will run synchronously with the gate control signal pattern to set and increment the counter (k) for each corresponding phase-voltage level to avoid false alarms. In addition to the simplicity of the voltage measurement, the real benefit of using voltage-based approaches is that they are load-independent.

4.1.7. Artificial Neural Networks [35]

Similar to fuzzy logic, a neural network (NN) is considered a second-stage operation for fault detection and diagnosis. By employing contemporary transformation methodologies, including Clark’s transformation, Park’s vector, or Concordia transform, single and multiple open-switch faults are derived for the training of the NN. The neural network algorithm, embedded with the inverter, will capture the transformed values carrying its features for identifying and locating faulty switches. Figure 7 shows a general neural network schematic.

4.1.8. Wavelet-NF [36]

A sophisticated algorithm based on the integration of neural networks and the fuzzy logic system is used to identify and localize open-switch faults by analyzing the characteristics of the current waveforms. The adaptive neuro-fuzzy interference (ANFI) approach first captured current components for a normal operating condition in addition to the faulty scenarios as a training process. After that, it can be embedded into the VSI for detection and diagnostic purposes.

4.1.9. Model Reference Adaptive System (MRAS) [37]

This approach employs a model reference adaptive system with the real VSI without the need for additional sensors for the fault-diagnosing process. As a key metric, this technique analyzes the behavior of the current, where, in the healthy state, the average value of each phase current is zero. Conversely, when a switch is opened, the corresponding phase current will have a non-zero DC offset, which will be an indicator for identifying and localizing the faulty switch(es).
Table 5 is the final comparative table between the listed FDD approaches for open-switch faults.
In conclusion, the methods that focus on current behaviors decrease their efficiency and are partially undermined under a low current load. To strengthen the standard current transformation techniques, some strategies use modified normalizing current techniques, but these are also pegged on current volumes. Voltage-based methods are much better and less sensitive to current as compared to the current-based methods. Also, wavelet and artificial neuro-fuzzy algorithms improve fault identification and cost-effective decision-making. These are more advanced and smarter than simple algorithms, but they are time-consuming and need much work to be incorporated.

4.2. Short-Switch Fault

In this scenario, the total short-switch faults will have the same possibility cases as an open-switch fault, which is 39. Short-switch faults are more serious than open faults, and the faulty switches should be isolated rapidly before successive faults occur. It is important to note that an IGBT, under standard operational conditions, is capable of enduring a surge in current value for a duration of 10 µs [43]. Dealing with short-switch faults is more oriented toward the hardware-based techniques embedded in the VSI power and control circuits. The more popular reasons for this type of fault are as follows:
  • False gate triggering signal;
  • Sudden overcurrent value;
  • Overvoltage;
  • Damage in the anti-parallel internal or external diode;
  • Disturbance due to high dv/dt value.
The short-switch FDD methods are as follows:

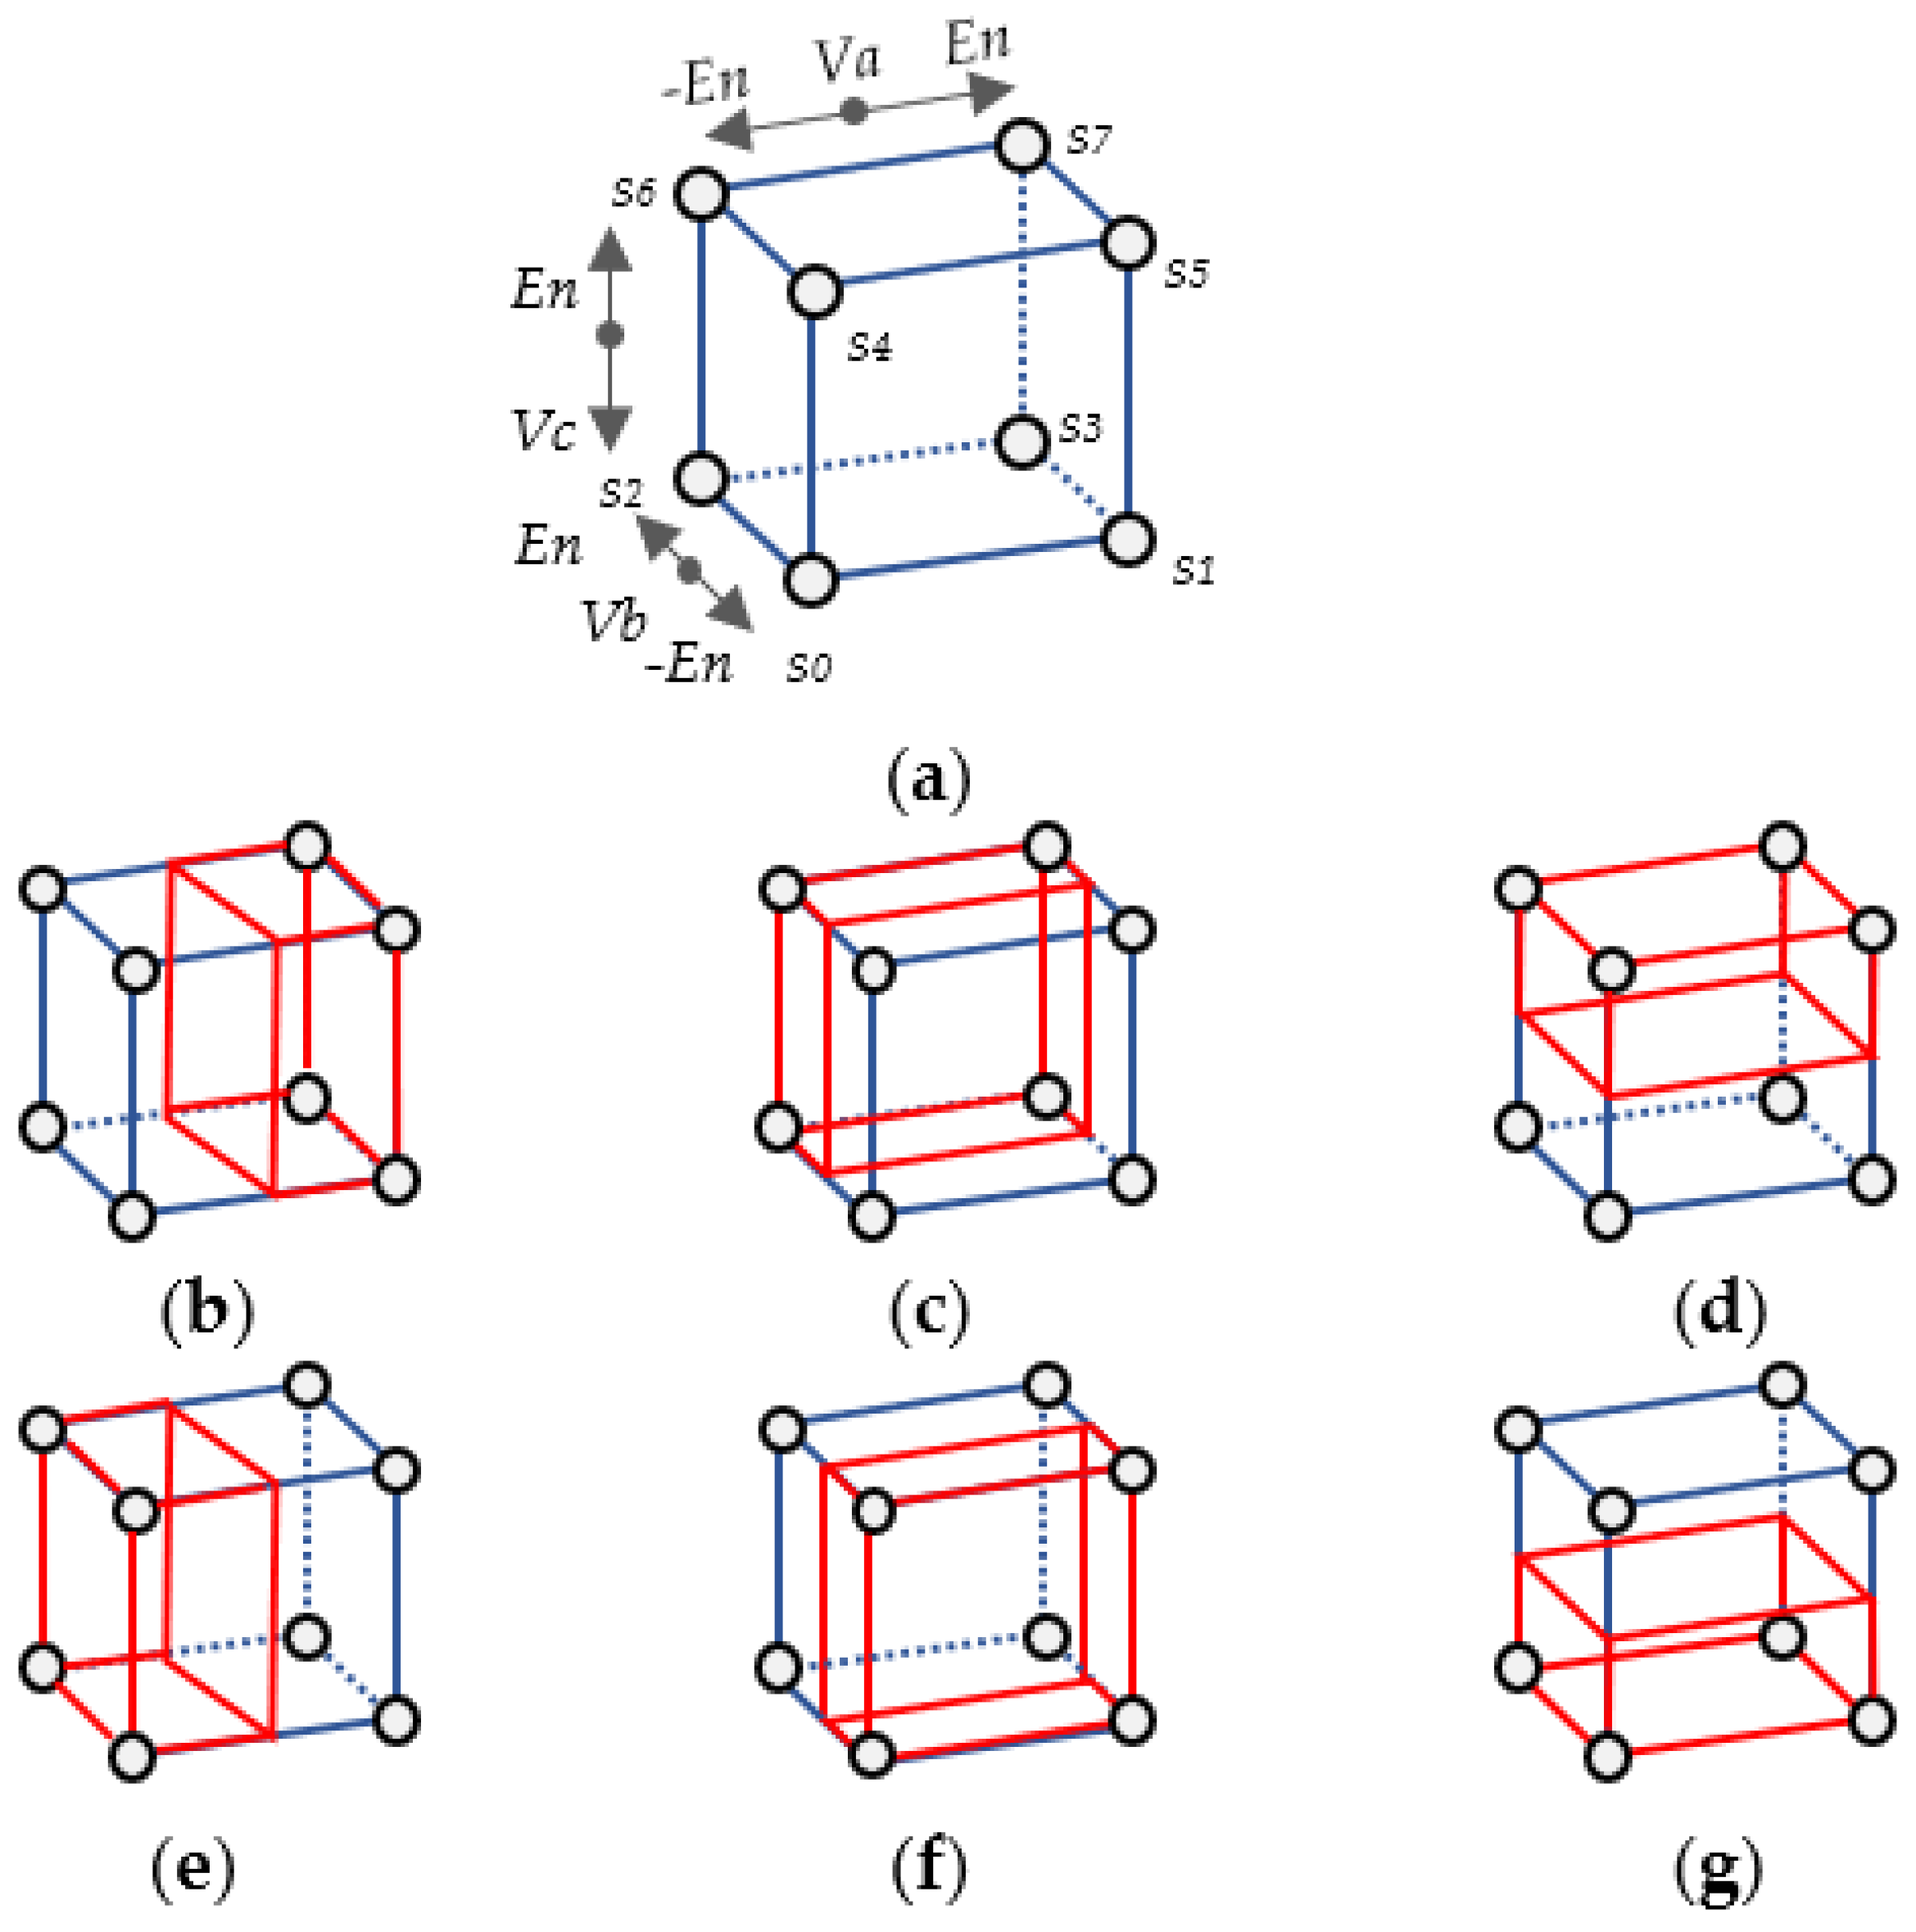
4.2.1. Voltage Space Patterns [44]

This approach evaluates the recorded output phase-voltage values within a voltage space projection (VSP), which is regarded as a domain devoid of time constraints. A normally operated VSI has a square state transition pattern when it is projected in voltage space, as shown in Figure 8a. At each corner, there is a switching state corresponding to all the switching patterns of the VSI. The three-phase voltages at the output port (Va, Vb, and Vc) are the three-dimensional axes of this cube. Potential (En) is the voltage difference between the voltage state when each switch is in the on-state and the neutral point of the inverter. En will have a positive value and a negative value depending on the state, taking the state s0 as a negative reference. When a short-switch fault occurs, the voltage levels on the cube’s sides change, indicating the faulty switch based on its shape and remaining components, as illustrated in Figure 8b–g.

4.2.2. S-Transform [45,46]

This method detects and identifies short-circuit switches using the time-frequency distribution (TFD). The inverter waveforms used for condition monitoring diagnose parameters such as the average current (I avg), instantaneous AC root mean square (RMS) output voltage (Vrms), instantaneous total waveform distortion (TWD), instantaneous total harmonic distortion (THD), and the instantaneous total non-harmonic distortion (TnHD). Upon the immediate detection of any alterations in the monitored parameters, a determination will be made to isolate and reconfigure the malfunctioning open switch, following its identification and localization. This methodology is capable of early detection of open-switch faults; however, it necessitates substantial computational resources.

4.2.3. di/dt Feedback Control [47]

This approach uses an extra series inductance positioned at each phase leg. Fault detection is based on the measured value of both the magnitude and the period of the di/dt-induced voltage waveform present across the inductor. A feedback control closed loop, as shown in Figure 9, will safely turn off the gate signal through the switch located at the faulty phase leg when sensing abnormal di/dt values. The detection and control algorithm can control the di/dt at the faulty leg to avoid a high inrush current that can lead to catastrophic consequences.

4.2.4. Gate Signal [48,49]

This approach systematically evaluates the switch gate voltage during the turn-on, on-state, and turn-off states. The FDD algorithm will analyze the magnitude and the pattern of the gate voltage during the transient condition, which will occur at the turn-on state. The subsequent phase will monitor the gate voltage when the switch is “ON”. Any regression in the voltage value will be extracted as abnormal behavior and will determine the degree of risk before making the decision. This method depends on the gate voltage value and is an indirect method for detecting the overcurrent as well as short circuits during a short time.

4.2.5. Transient Current [50,51]

This approach monitors the transient on-state current slope using an additional electronic circuit embedded with the VSI. The main concept of this method is to compare the switch transient current value with the threshold value according to the physical model parameter values of the switch used, either for IGBT or MOSFET. The parameter values of the physical model are established through a series of experiments and validated in real situations. The major advantage of this method is the early detection of the short-switch fault.

4.2.6. Bond Wire [52,53]

In any power transistor, there exists an internal bonding wire between the external device terminals and the internal layer of the semiconductor. As a result of elevated stress and overcurrent operations, in response to high temperatures, this wire will bend and cause plastic deformation on the outer surface of the device. Accordingly, monitoring the condition of the bond wire can provide early signs about the switch’s health conditions to avoid future failures. A variety of techniques are used for monitoring the condition of the bond wire. For example, a more popular technique monitors the change in the wire’s thermal resistance using a finite element method (FEM). Another technique monitors the difference in short-circuit current and how it is related to the bond wire fatigue. The advantage of using this method is the ability to predict switch faults as well as give information about the aging of the device. It can be observed from Table 6 that schemes for identifying and diagnosing short-switch faults using a current’s parameters are far more effective than those using voltage. The advantage of current-based techniques is that they are more directly related to the short-circuit current values and the enhanced detection of the fault, especially if the transient current is used for the diagnosis. One of the most important considerations in addressing short-switch faults is to have a way of restricting the current and, therefore, escalating the fault. The di/dt method is particularly beneficial for this purpose. Conversely, alternative FDD methods require additional strategies to manage fault currents during short circuits, as noted in [47,48].

4.3. Gate Misfiring Fault

Few types of research about gate misfiring faults in VSIs are recorded due to their indirect relationship with the main power circuit of the inverter, in addition to being a part of the control algorithm. There are three main types of gate misfiring faults:
  • Missing pulse;
  • Intermittent pulse;
  • Fire-through.
A traditional and basic VSI configuration where each of the transistor’s gates is directly connected to the control circuit without using a passive gate turn-off circuit, as illustrated in Figure 10a, exhibits a higher propensity for fault occurrence compared to a configuration that utilizes a passive gate turn-off circuit, as depicted in Figure 10b.
In this case, a missing gate signal fault (loss of pulse) [54] may cause an open-switch fault or a short-switch fault if the switch gate voltage is floating (not connecting). A fire-through gate fault occurs when it is fired at the wrong switching time and can cause a short circuit. Therefore, a gate misfiring fault has an indirect relation with either the open- or short-switch fault; thus, it can be detected and diagnosed using the methods that have been mentioned in the previous sections. Other gate faults include intermittent misfiring, characterized by a discontinuous gate signal. Both intermittent misfiring and fire-through faults adversely affect the performance of the DC–DC converter and VSI chain [55].
A real-time condition monitoring of gate intermittent misfiring algorithm was designed to detect gate loss signals for each of the switches used in the VSI [56]. Gate signals are represented by pulse functions, and the load was mathematically modeled and monitored for any parameter change and performance degradation. It depends mainly on the current trajectory of the inverter and the analysis of its magnitude and the orientation angle to detect and localize the switch that had a gate misfiring fault.

4.4. Anti-Parallel Diode Fault

This is also known as a backward diode, where it is directly linked in an anti-parallel terminal connection with the power switch. Almost all the current manufacturing processes for power transistors have a built-in anti-parallel diode within the same package. Consequently, when a diode is faulty, it will be regarded in the same manner as a defective switch and substituted with a fully operational component [57].

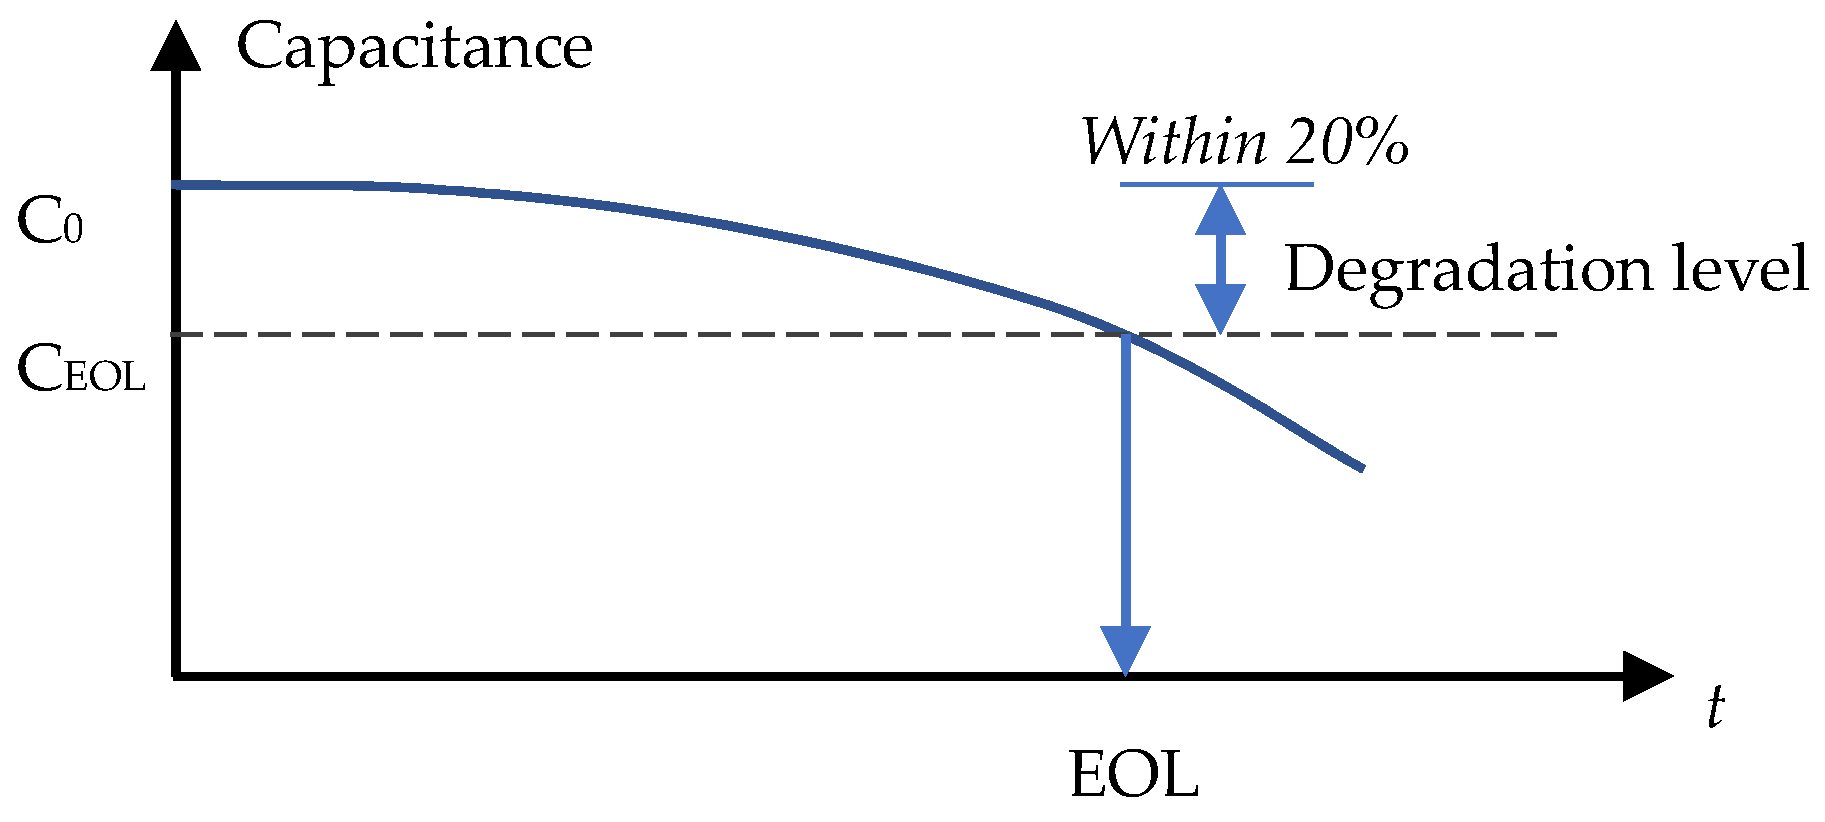
4.5. Electrolytic Capacitor Fault

The adoption of DC-link capacitors in power electronic converters is essential due to frequent faults, making them vital for fault diagnosis. There are two main possibilities for capacitor faults, which are the open and short faults. The majority of FDD approaches for capacitor faults focus on monitoring the prior indicators related to the internal parameters of the capacitor. These parameters represent the fundamental components essential for defining the attributes of the capacitor, including its physical state, equivalent series resistance (ESR) value, and equivalent capacitance (EC) value. After collecting information about these parameters, it will be provided as input data for the fault-diagnosing algorithm to be analyzed for fault detection or even fault prediction.
Despite the elevated incidence of capacitor faults, it remains an essential component that is adopted in all power electronic converters for several functions. These functions are as follows:
  • Voltage smoothing at the DC-link bus;
  • Filtering high-frequency components that can minimize the harmonics in the chain;
  • Maintaining steady voltage and current levels for the reliable and stable operation of the VSI.
As a result, the implementation of the FDD approach for capacitor faults will contribute to improving the overall performance and maintaining a balanced functioning. However, before listing the FDD approaches used for capacitor faults, it should be mentioned that the faults that occur in other components will have an impact on the reliability of the capacitor and may degrade its performance, such as short- and open-switch faults [58].
Fault diagnosis and life estimation of DC-link capacitor are as follows:

4.5.1. Evidence Reasoning Rule (ER) [59]

The evidence reasoning rule is a knowledge-based approach that establishes a correlation between a set of evidence and the main problem, thus providing a proper problem classification to be resolved effectively [60]. Then, the FDD approach adopted with the system will make the best decision concerning the faulty capacitor. The operational framework of this approach begins by collecting DC voltage samples over an interval of time to calculate the value of the peak–peak voltage (Vpp). Accordingly, using the peak–peak voltage value extracted and the ER rule method will provide the capacitor state, including the aging properties that can also be used for monitoring purposes. The process of capacitor aging may be regarded as a preemptive approach to mitigate the likelihood of faults by implementing the appropriate measures corresponding to the derived aging metrics.

4.5.2. Recursive Least Square (RLS) [61]

This method estimates the value of (ESR) of the capacitor by monitoring the change in the ratio of electrolyte volume (V) and initial volume (V0) with respect to the initial ESR value (ESR0) using Equation (4).
E S R E S R 0 = V 0 V 2
Note that a 40% loss of the electrolyte volume constitutes that the DC-link capacitor is faulty [62]. The RLS algorithm will be used as a fast and simple diagnosing method for the estimation of both ESR and EC, represented in Figure 11. In addition, an offline lifetime can be estimated using Equation (7), which relates the rated service life (Lr), the actual temperature (Ta), and the rated temperature (Tr) to the predicted service life (Lp). Eventually, for a long service life, the value of the ESR will increase, and the value of the EC will decrease, giving an indicator for life estimation as a prior step to prevent a future fault in the capacitor.
L p = L r · 2 ( T r T a ) 10

4.5.3. Thermal Modeling [63]

In this methodology, a quantitative finite element (FE) technique is used to identify the capacitor faults. The DC-link capacitor is modeled using heat-transfer thermal modeling software. Heat flux, along with the relevant operating temperature data, are extracted to be used by the diagnostic approach as input diagnostic parameters for identifying and analyzing capacitor faults.

4.5.4. Transient Current [64]
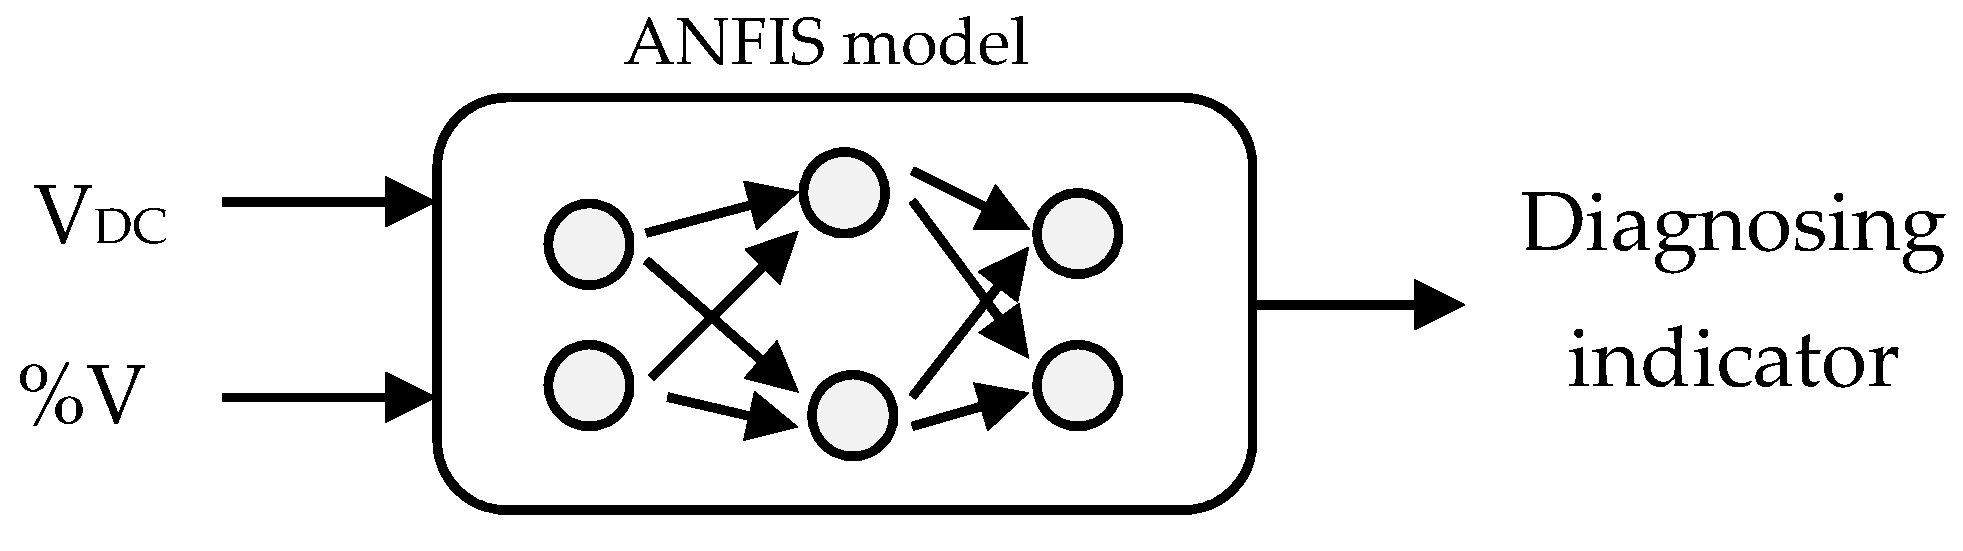
This method uses a mathematical analysis of the capacitor current when a short-circuit fault occurs. Using simulation platforms, system parameters—especially the transient current values and the voltage drop—are extracted by observing the behavior of the system under a short-circuit DC-link capacitor fault. The obtained simulation results will subsequently be utilized for the design and execution of the FDD methodology employed for the detection of capacitor faults.

4.5.5. ANFIS [65]

An adaptive neuro-fuzzy inference system is used for detecting and diagnosing capacitor aging faults. Diagnostic parameters for faulty capacitors are extracted and collected for use in the learning process in the establishment of the ANFIS model. As shown in Figure 12, the input parameters of the ANFIS model are related directly or indirectly to the state of the capacitor. In this case, voltage ripples, represented as (%V), and the DC-link voltage (VDC) are used as input parameters to the ANFIS model. The number of fuzzy rules (R) will be related to the number of model inputs (N) with the number of membership inputs (Mi) by the following:
R = M i N
where in this case, N = 2 and Mi = 2, then the output rule number R = 4 rules.

4.5.6. Capacitance Estimation Using ANN [66,67]

This methodology employs an artificial neural network (ANN) approach for estimating the value of the DC-link capacitor. Diagnostic parameters and variables are used to train the ANN algorithm based on the time-frequency domain to identify and detect capacitor faults [68]. Figure 13 represents the degradation of the capacitance value (C0) with respect to time until reaching the end-of-life (EOL) value. The EOL value can be considered as a threshold value for determining whether the capacitor is healthy or not. Taking the case of the VSI, the type of capacitor used is the electrolytic capacitor, where the accepted EOL threshold value is 20% of reduction in capacitance, or for the case of the ESR, the acceptable value should not reach over its double value [69].
Table 7 summarizes the performances of each of the discussed FDD approaches for electrolytic DC-link bus capacitors.
In general, nearly all methodologies focused on the detection and identification of defective capacitors rely on the assessment of internal physical attributes to determine the capacitor’s condition. Significantly, knowledge-based methods such as evidence reasoning and recursive least square techniques are easy to implement and have high speeds in detecting faults. However, methods employing the concepts of neural networks and neuro-fuzzy analysis algorithms are more flexible than other techniques because of their capability to learn through training. Hence, the selection of the FDD method for capacitor faults is as important as that of other VSI components to prevent other component faults that may result due to a faulty capacitor. A short-circuited capacitor can affect the VSI’s freewheeling diodes and power switches, as noted in [70].

4.6. Sensor Fault

All previously mentioned FDD approaches employed for each of the faults that occurred in the VSI predominantly rely on real-time measurement data, which is supplied by a network of sensors integrated within the primary inverter circuitry. Therefore, when studying each of these faults, it is considered that the sensor(s) are healthy and not affected or failed. The purpose of taking this measure is to isolate each fault from another and examine its effect on the VSI. Otherwise, when faults occur in the sensors, this can result in the performance degradation of the overall system as well as system instability, especially in a closed-loop system [71]. Typically, fault sensor fault detection and diagnosis (FDD) methodologies are classified into two primary categories: model-driven and signal-driven approaches. A model-based approach requires system identifications, such as the physical characteristics of the plant, to generate residual that will be used to diagnose the system changes. On the other hand, signal-based methods rely on system quality extraction for algorithmic decision-making.

4.6.1. Parity Space [72,73]

This method, instead of using a model for the VSI that depends on a system’s parameters, uses a set of parity equations needed for generating dynamic temporal redundancy system relations. The first step is the generation of system residuals, as shown in Equation (9), where delta (Δ) is the difference between two measured parameters successively. The resultant residual (rk) in (10) is then obtained by calculating the absolute value of the difference between two successive deltas.
Δ = y k y k 1
r k = Δ k Δ k 1
Each type of sensor fault will have a different residual result and will depend on the trained algorithm and pre-defined fault type by the adopted FDD method for the detection and identification step after residual extraction. The need for only successive measured values makes this method simple, in addition to its independence on system parameters. Eliminating the need for a model gives it an advantage over classical model-based approaches.

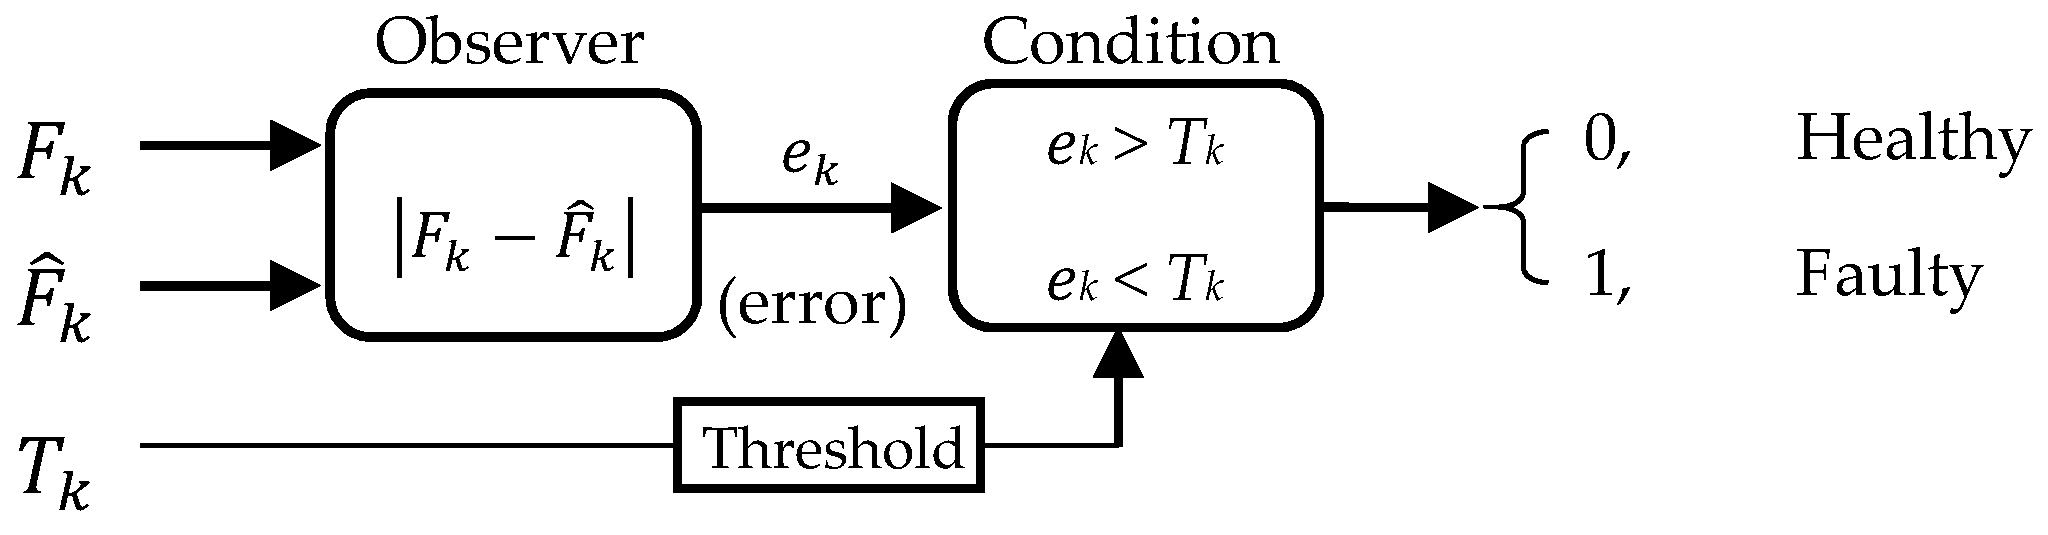
4.6.2. Observer [74,75]

This method depends on estimating the state of the residuals being established by the diagnosis algorithm. As shown in Figure 14, the observer model has two main inputs, (Fk) and ( F ^ k). Where Fk is the measured parameter by the sensor, and ( F ^ k) is the estimated parameter based on the real-time VSI operation and the other parameters that can be related to the parameter being estimated. The observer error (ek) is the difference between the measured and estimated values. As a result, the magnitude of the error will be used to determine if the corresponding sensor is faulty or not after it has been compared with a threshold value (Tk). The determination of the threshold value is influenced by various elements, including false alarm rates and the degree of robustness, as well as considerations of identifiability and sensitivity. To avoid false alarms and eliminate the effect of noisy signals as well as the transient effect, raising the value of the threshold is required, whereas to achieve sensitivity, the threshold value should be low. By taking a suitable threshold value that can satisfy both element factors, this method can be robust and effective for sensor fault diagnosis. Nevertheless, due to a fixed threshold value, the degree of robustness will decrease in the presence of system changes and component degradation.

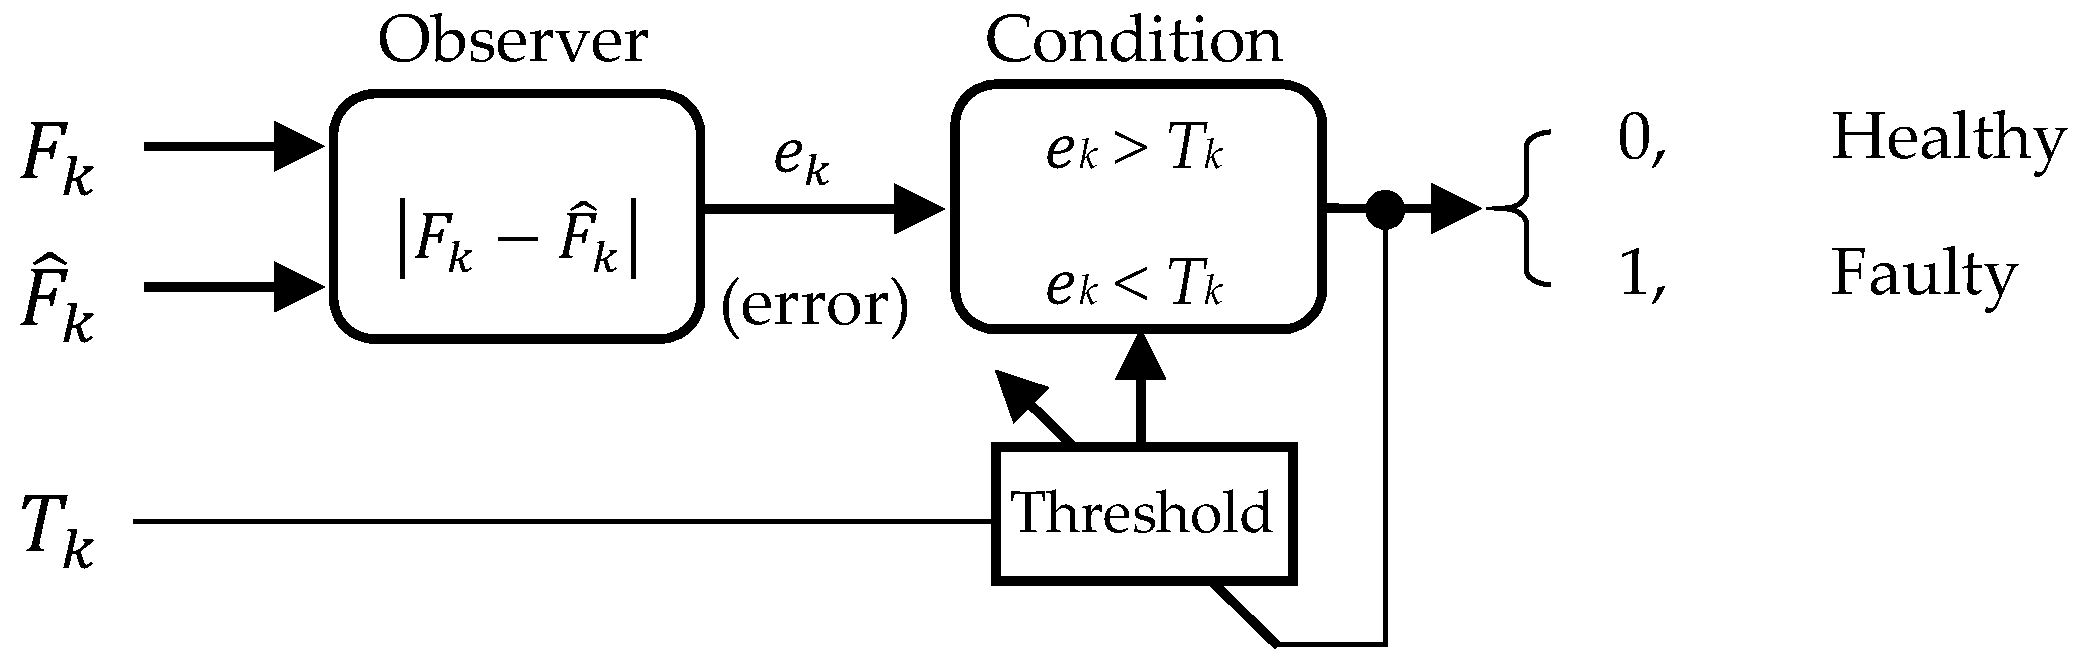
4.6.3. Adaptive Observer [76,77,78]

This method is a modified version of the basic observer-based approach. A feedback loop, as shown in Figure 15, was involved with the system, working exclusively on changing the value of the threshold for adaptation purposes. The benefit of using the modified observer scheme is to achieve more robustness against the system and VSI load changes, especially when it comes to dynamic loads, such as electric machines.

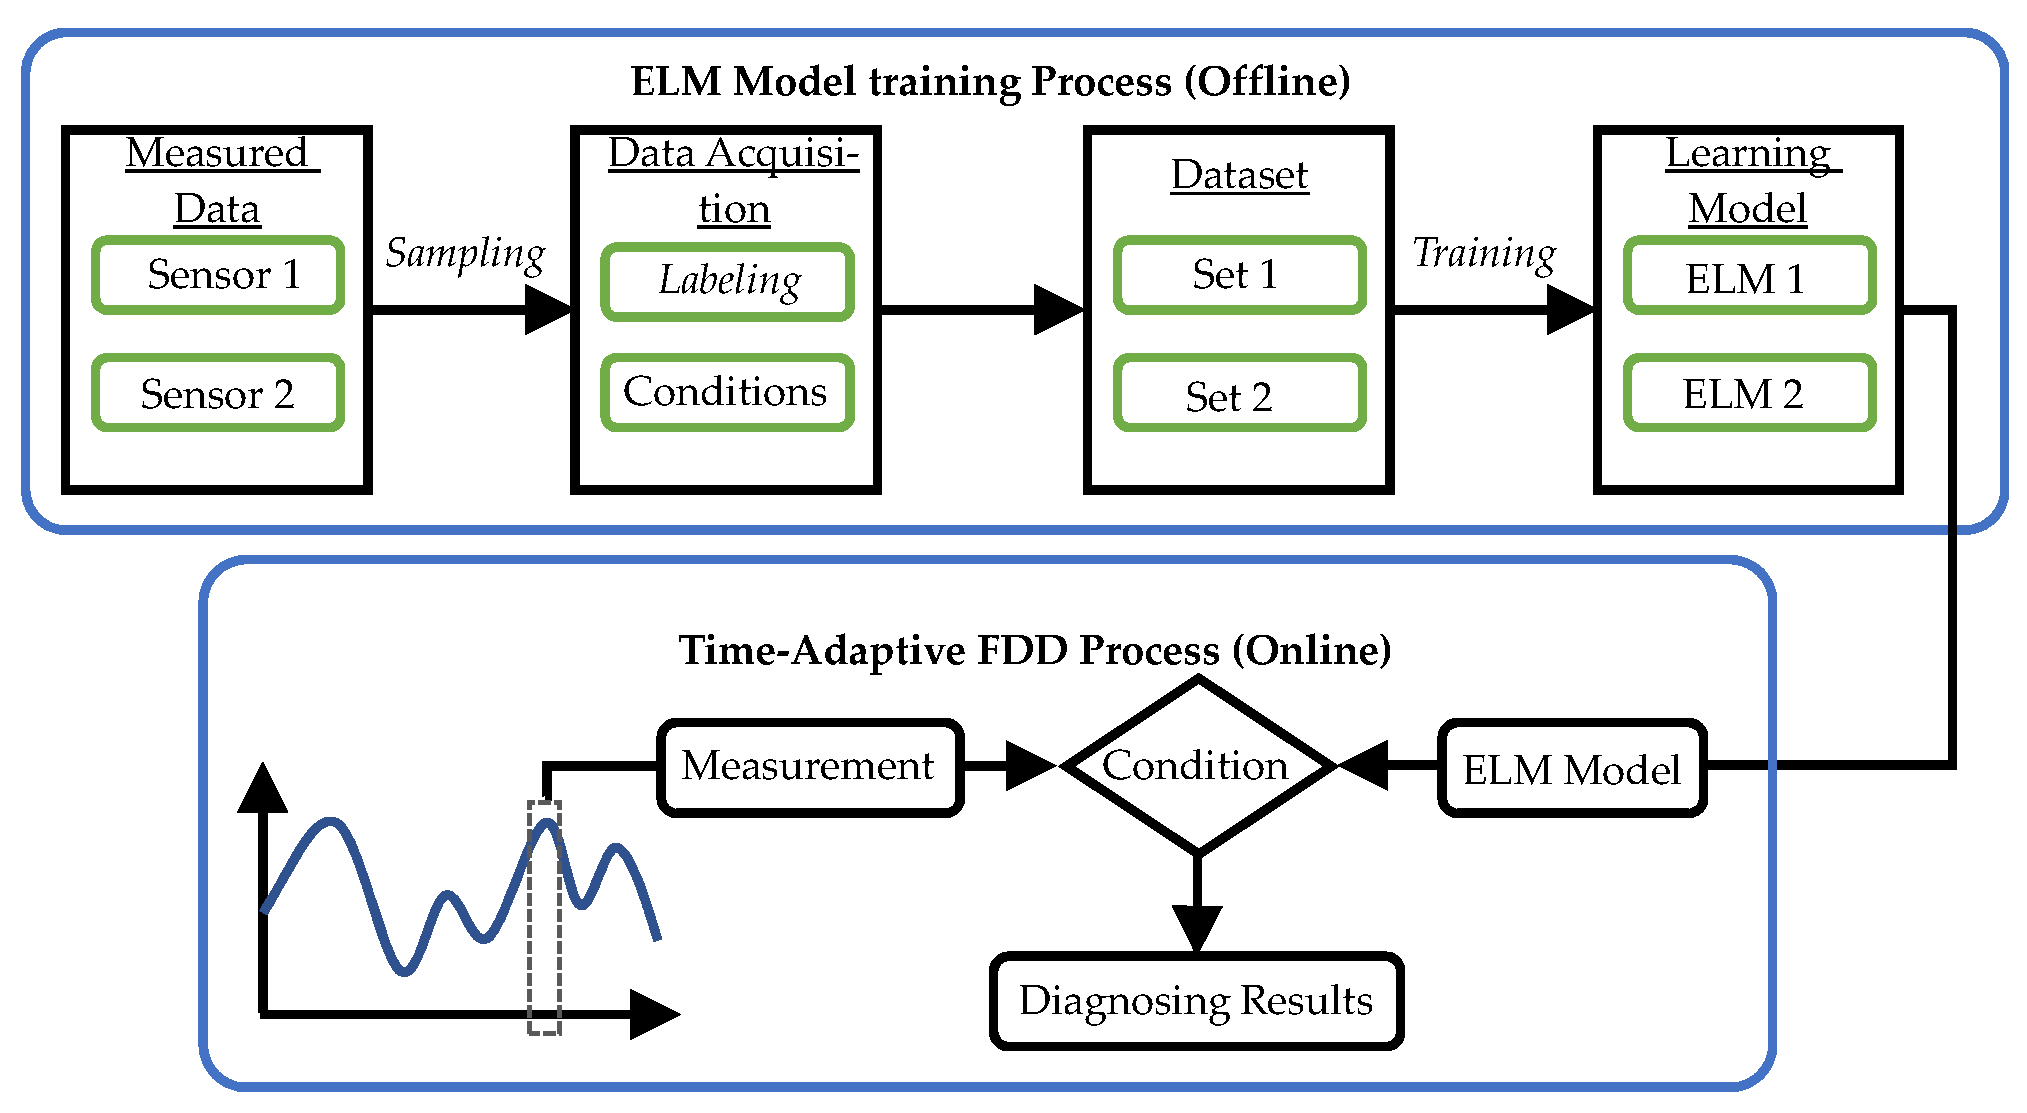
4.6.4. Time-Adaptive with ELM [79]

This method consists of four main categories of action that will be used for the training process of the extreme learning machine (ELM). The first one relies on collecting measured data from the sensor(s) used in the VSI at a definite sampling rate set by the data acquisition device. This data represents the real-time operation of the VSI under different conditions. The collected data will be used and labeled using a dataset table corresponding to each of the conditions being tried experimentally. The ELM algorithm will utilize the dataset table for the training process to identify and localize the faulty sensor. Figure 16 illustrates the comprehensive procedural steps of this methodology.
Significantly, the ELM has a phenomenal learning capability in short time spans, and has less computational complexity. The benefits of using a time-adaptive diagnosing approach are the ability to improve the overall accuracy as well as optimize the fault detection speed.

4.6.5. Extended Kalman Filter [80,81]

In general, the Kalman filter (KF) is a widely utilized algorithm that can be employed conveniently due to its compact scheme and its efficient function. When it comes to robustness, the Kalman filter plays a substantial role since it is a noise-independent algorithm and has the ability to predict future faults. An extended Kalman filter (EKF), on the other hand, is an extension of the KF, which uses linear approximations of models that are nonlinear through a process known as linearization. It can result in errors in the systems that are highly nonlinear because of the approximation that comes with linearization. On the other hand, the unscented Kalman filter UKF applies a deterministic sampling method to find the mean and covariance estimates with higher precision, compared to the EKF, without linearization, which makes it preferable for applications that involve highly nonlinear and noisy systems. In sensor fault detection and diagnosis, the UKF has superior performance in handling complex and nonlinear fault conditions. Nevertheless, the EKF can be employed for less complicated systems or in cases where computational time is a concern. In summary, although the EKF and UKF have their applications in sensor fault detection and diagnosis, due to nonlinearity and noise factors, the UKF is better placed in complicated and dynamic systems, as found in aircraft sensor fault management and multi-object tracking in autonomous driving. Concerning fault diagnoses, diagnostic metrics associated with system parameters are selected to identify and pinpoint defective sensors. The residual value(s) is(are) defined by the absolute value of the difference between the measured and the estimated values of the diagnostic parameters for determining an index factor. As a result, the diagnostic index will be used to identify and diagnose the faulty sensor(s).

4.6.6. Wavelet [82]

This method analyzes the wavelet behavior of the diagnosed system parameters, such as the output phase current, DC-link voltage, DC-link current, or other parameters related to the load that are connected at the output of the VSI. To identify sensor faults, harmonic components are extracted to determine the wavelet coefficients that will be used by the diagnostic algorithm. The wavelet coefficient is the difference value between the healthy and the faulty harmonic components. The strength of this method comes through the reliance on a single parameter. However, it is a load-dependent technique that can be affected by load transients and variations.
In summary, it can be inferred that, as illustrated in Table 8, the majority of the examined methodologies demonstrate favorable and practical applicability for sensor fault diagnoses. It is imperative to emphasize that both the extended Kalman filter (EKF) and the time-adaptive technique yield superior outcomes and are distinguished by their rapid detection capabilities and adaptability to system changes.

5. Results Interpretation

Initially, the fundamental category of the voltage-source inverter (VSI) was selected due to its extensive applicability across numerous applications, its ease of control, and its necessity for a specific type of power source for proper operation. Before listing the FDD approaches, there must be a model for the studied VSI that will provide clear and appropriate formulas and functions that relate to the input and output system variables such as voltage, current, frequency, etc. Models are evaluated and compared using various criteria. Additionally, a summary of the fault detection and diagnostic (FDD) methods was provided to clarify their classification.
In Figure 17, there is a noticeable steady trend of interest in the FDD techniques in the research papers in the past years. This may be due to the continuous concern about the component and sensor faults that are associated with voltage-source inverters (VSIs).
The efficient and existing FDD techniques are discussed and contrasted for the switch, diode, capacitor, and sensor faults. In the case of each of the mentioned types of component faults, several methods were described in a concise manner, and a comparison was made. Among the aforementioned fault detection and diagnosis (FDD) methodologies, the prevailing transformation techniques demonstrate encouraging outcomes for fault identification, characterized by reduced complexity and an enhanced detection rate, regardless of the fault type. However, these techniques exhibit diminished power density and are relatively less resilient when subjected to low current levels and transient conditions. Voltage-based methods are more robust since they do not depend on the load connected; however, they require some time to obtain an accurate voltage reading. The wavelet- and frequency-based techniques, however, require more computation in terms of time, and this can slow down the rate of fault detection—besides the fact that they cannot detect multiple faults unless an advanced signal-based algorithm is developed to analyze the complex wave components.
Moreover, decision-making techniques were applied after obtaining the diagnostic features, like neural network, fuzzy, neuro-fuzzy, and enhanced expert systems, which are trained offline to study the system’s characteristics and then detect and isolate the faults. These expert systems enhance the FDD methods by incorporating intelligence and improving their capabilities, as they can learn from a database of historical records related to VSI operations. In any case, each of the mentioned FDD methods for each of the components’ faults depends on the demand and the application that is suitable for it. It can be concluded that no method is superior, as the choice is contingent on the specific field and its requirements related to the characteristics of the FDD method(s) and their assessment indicators.

6. Conclusions

In summary, this manuscript presents comprehensive analyses of various subjects pertaining to the configuration of three-phase inverters and the methodologies employed for detecting potential malfunctions within their components.
We carried out this review with the aim of addressing three research inquiries as follows:
  • What is the basis on which various FDD methods can be compared?
  • Which of the FDD approaches are deemed to be most efficient for each type of fault?
  • What is the current literature in the field of FDD?
In this paper, we answer three specific research questions related to the application of FDD techniques for VSIs. First, we discuss the five main criteria that have been applied to the assessment of various FDD approaches. Second, we look at the most effective strategies for certain types of faults (the component and sensor faults, for instance) and compare and categorize them. After that, a conclusion is drawn that illustrates the best FDD approach types for each fault being covered in this review paper. This manuscript enhances the current body of knowledge regarding fault detection and diagnosis in voltage-source inverters (VSIs) through the comprehensive review provided. It offers an in-depth examination of the component malfunctions and sensor inaccuracies employed in fault diagnosis and their underlying mechanisms. This is useful for increasing the performance of a VSI design, as it provides a glimpse of the possible solutions when dealing with certain requirements. Researchers and practitioners across various domains, including renewable energy systems, electric vehicles, and other fields utilizing voltage-source inverters (VSIs), will greatly benefit from this research. This paper provides a link between the theoretical- and the application-oriented work, which promotes innovation and improves fault tolerance.

Author Contributions

Conceptualization, Y.A., G.H., H.A.S. and N.M.; methodology, Y.A. and G.H.; validation, Y.A., G.H., H.A.S. and N.M.; formal analysis, Y.A. and G.H.; investigation Y.A.; resources, Y.A.; original draft, Y.A.; review and editing, Y.A. and G.H.; visualization, Y.A.; supervision, G.H., H.A.S. and N.M.; project administration, G.H. and N.M. All authors have read and agreed to the published version of the manuscript.

Funding

This research received no external funding.

Conflicts of Interest

The authors declare no conflicts of interest.

References

  1. Thurlbeck, A.P.; Cao, Y. Analysis and Modeling of UAV Power System Architectures. In Proceedings of the 2019 IEEE Transportation Electrification Conference and Expo (ITEC), Detroit, MI, USA, 19–21 June 2019; IEEE: Piscataway, NA, USA, 2019. [Google Scholar]
  2. Islam, R.; Rafin, S.S.H.; Mohammed, O.A. Overview of Power Electronic Converters in Electric Vehicle Applications. In Proceedings of the 2023 Fourth International Symposium on 3D Power Electronics Integration and Manufacturing (3D-PEIM), Miami, FL, USA, 1–3 February 2023; pp. 1–7. [Google Scholar]
  3. Robles, E.; Matallana, A.; Aretxabaleta, I.; Andreu, J.; Fernández, M.; Martín, J.L. The role of power device technology in the electric vehicle powertrain. Int. J. Energy Res. 2022, 46, 22222–22265. [Google Scholar] [CrossRef]
  4. Liu, G.; Li, K.; Wang, Y.; Luo, H.; Luo, H. Recent advances and trend of HEV/EV-oriented power semiconductors–An overview. IET Power Electron. 2020, 13, 394–404. [Google Scholar] [CrossRef]
  5. Sadabadi, M.S.; Sharifzadeh, M.; Mehrasa, M.; Karimi, H.; Al-Haddad, K. Decoupled dq Current Control of Grid-Tied Packed E-Cell Inverters in Vehicle-to-Grid Technologies. IEEE Trans. Ind. Electron. 2023, 70, 1356–1366. [Google Scholar] [CrossRef]
  6. Bhattacharjee, S.; Halder, S.; Kundu, A.; Iyer, L.V.; Kar, N.C. Artificial Neural Network Based Improved Modulation Strategy for GaN–based Inverter in EV. In Proceedings of the 2020 IEEE Canadian Conference on Electrical and Computer Engineering (CCECE), London, ON, Canada, 30 August–2 September 2020; pp. 1–4. [Google Scholar]
  7. Tahir, S.; Wang, J.; Baloch, M.H.; Kaloi, G.S. Digital Control Techniques Based on Voltage Source Inverters in Renewable Energy Applications: A Review. Electronics 2018, 7, 18. [Google Scholar] [CrossRef]
  8. Dao, C.; Kazemtabrizi, B.; Crabtree, C. Wind turbine reliability data review and impacts on levelised cost of energy. Wind. Energy 2019, 22, 1848–1871. [Google Scholar] [CrossRef]
  9. Lillo-Bravo, I.; González-Martínez, P.; Larrañeta, M.; Guasumba-Codena, J. Impact of Energy Losses Due to Failures on Photovoltaic Plant Energy Balance. Energies 2018, 11, 363. [Google Scholar] [CrossRef]
  10. Behnert, M.; Bruckner, T. Causes and Effects of Historical Transmission Grid Collapses and Implications for the German Power System; Universit Leipzig, Institut Infrastruktur und Ressourcenmanagement (IIRM): Leipzig, Germany, 2018. [Google Scholar]
  11. Fan, Y.; Yan, W.; Xiao, L.; Wei, Z.; Sun, H. Investigation and analysis on traffic safety of low-speed electric vehicles. IOP Conf. Series: Mater. Sci. Eng. 2019, 688, 044055. [Google Scholar] [CrossRef]
  12. Prejbeanu, R.G. A Sensor-Based System for Fault Detection and Prediction for EV Multi-Level Converters. Sensors 2023, 23, 4205. [Google Scholar] [CrossRef]
  13. Yang, H.; Peng, Z.; Xu, Q.; Huang, T.; Zhu, X. Inverter fault diagnosis based on Fourier transform and evolutionary neural network. Front. Energy Res. 2023, 10, 1090209. [Google Scholar] [CrossRef]
  14. Cui, Y.; Tjernberg, L.B. Fault Diagnostics of Power Transformers Using Autoencoders and Gated Recurrent Units with Applications for Sensor Failures. In Proceedings of the 2022 17th International Conference on Probabilistic Methods Applied to Power Systems (PMAPS), Manchester, UK, 12–15 June 2022; pp. 1–5. [Google Scholar]
  15. Tian, X.; Xu, J.; Guo, H. Diagnosis Method for Power Switch Open-Circuit Fault of Triple Three-phase PMSM System in complex Operations. In Proceedings of the 2023 26th International Conference on Electrical Machines and Systems (ICEMS), Zhuhai, China, 5–8 November 2023; pp. 2141–2146. [Google Scholar]
  16. Gmati, B.; Jlassi, I.; El Khil, S.K.; Cardoso, A.J.M. Open-switch fault diagnosis in voltage source inverters of PMSM drives using predictive current errors and fuzzy logic approach. IET Power Electron. 2021, 14, 1059–1072. [Google Scholar] [CrossRef]
  17. Li, J.; Li, Y.; Huang, H.; Shi, R.; Luo, J.; Bao, H.; Ding, S.; Wang, J. A new Method of Open-Circuit Fault Diagnosis for Voltage-Source Inverter in UPS System. In Proceedings of the 2019 14th IEEE Conference on Industrial Electronics and Applications (ICIEA), Xi’an, China, 19–21 June 2019; pp. 856–860. [Google Scholar]
  18. Khaneghah, M.Z.; Alzayed, M.; Chaoui, H. Fault Detection and Diagnosis of the Electric Motor Drive and Battery System of Electric Vehicles. Machines 2023, 11, 713. [Google Scholar] [CrossRef]
  19. Gultekin, M.A.; Bazzi, A. Review of Fault Detection and Diagnosis Techniques for AC Motor Drives. Energies 2023, 16, 5602. [Google Scholar] [CrossRef]
  20. Mehmood, F.; Papadopoulos, P.M.; Hadjidemetriou, L.; Polycarpou, M.M. Modeling of Sensor Faults in Power Electronics Inverters and Impact Assessment on Power Quality. In Proceedings of the 2021 IEEE Madrid PowerTech, Madrid, Spain, 28 June–2 July 2021; pp. 1–6. [Google Scholar]
  21. Xu, Y.; Ge, X.; Shen, W. A Novel Set-Valued Sensor Fault Diagnosis Method for Lithium-Ion Battery Packs in Electric Vehicles. IEEE Trans. Veh. Technol. 2023, 72, 8661–8671. [Google Scholar] [CrossRef]
  22. Saha, S.; Kar, U. Signal-Based Position Sensor Fault Diagnosis Applied to PMSM Drives for Fault-Tolerant Operation in Electric Vehicles. World Electr. Veh. J. 2023, 14, 123. [Google Scholar] [CrossRef]
  23. Abubakar, A.; Jibril, M.M.; Almeida, C.F.; Gemignani, M.; Yahya, M.N.; Abba, S.I. A Novel Hybrid Optimization Approach for Fault Detection in Photovoltaic Arrays and Inverters Using AI and Statistical Learning Techniques: A Focus on Sustainable Environment. Processes 2023, 11, 2549. [Google Scholar] [CrossRef]
  24. Albert Alexander, S.; Srinivasan, M.; Sarathkumar, D.; Harish, R. Fault Detection and Diagnostics in a Cascaded Multilevel Inverter Using Artificial Neural Network. In Robotics, Control and Computer Vision. Lecture Notes in Electrical Engineering; Muthusamy, H., Botzheim, J., Nayak, R., Eds.; Springer: Singapore, 2023; Volume 1009. [Google Scholar]
  25. Aditya, A.; Priya, G.D.K.S. Inverter Fault Diagnosis with AI at Edge. In Recent Developments and the New Directions of Research, Foundations, and Applications. Studies in Fuzziness and Soft Computing; Shahbazova, S.N., Abbasov, A.M., Kreinovich, V., Kacprzyk, J., Batyrshin, I.Z., Eds.; Springer: Cham, Switzerland, 2023; Volume 422. [Google Scholar]
  26. Blaabjerg, F.; Wang, H.; Vernica, I.; Liu, B.; Davari, P. Reliability of Power Electronic Systems for EV/HEV Applications. Proc. IEEE 2021, 109, 1060–1076. [Google Scholar] [CrossRef]
  27. Ahmad, N.S.; Mustafa, M.; Abdullah, A.R.; Abidullah, N.; Bahari, N. Voltage Source Inverter Fault Detection System Using Time Frequency Distribution. Appl. Mech. Mater. 2015, 761, 88–92. [Google Scholar] [CrossRef]
  28. Abdullah, A.R.; Ahmad, N.S.; Shair, E.F.; Jidin, A. Open switch faults analysis in voltage source inverter using spectrogram. In Proceedings of the 2013 IEEE 7th International Power Engineering and Optimization Conference (PEOCO), Langkawi Island, Malaysia, 3–4 June 2013; pp. 438–443. [Google Scholar]
  29. Raj, N.; Mathew, J.; Jagadanand, G.; George, S. Open-transistor Fault Detection and Diagnosis Based on Current Trajectory in a Two-level Voltage Source Inverter. Procedia Technol. 2016, 25, 669–675. [Google Scholar] [CrossRef]
  30. Vu, H.G.; Trinh, T.C.; To, A.D. Spectral Analysis for Detection of Two-Switch Open-Circuit Fault in Voltage Source Inverter of Induction Motor Drive. In Proceedings of the 2023 Asia Meeting on Environment and Electrical Engineering (EEE-AM), Hanoi, Vietnam, 13–15 November 2023; pp. 1–5. [Google Scholar]
  31. Shen, Y.; Ma, Z.; Jin, N.; Guo, L. Open-circuit Fault Diagnosis Strategy Based on Current Reconstruction with A Single Current Sensor for Voltage Source Inverter. In Proceedings of the 2023 IEEE 6th International Electrical and Energy Conference (CIEEC), Hefei, China, 12–14 May 2023; pp. 3806–3811. [Google Scholar]
  32. Jian-Jian, Z.; Yong, C.; Zhang-Yong, C.; Anjian, Z.; Xu, L. Open-Switch Fault Diagnosis Method in Voltage-Source Inverters Based on Phase Currents. IEEE Access 2019, 7, 63619–63625. [Google Scholar] [CrossRef]
  33. Zhang, J.; Luo, H.; Zhao, J.; Wu, F. A Fuzzy-Based Approach for Open-transistor Fault Diagnosis in Voltage-Source Inverter Induction Motor Drives. Eur. Phys. J. Appl. Phys. 2015, 69, 20101. [Google Scholar] [CrossRef]
  34. Li, Z.; Wang, Y.; Ma, H.; Hong, L. Open-transistor faults diagnosis in voltage-source inverter based on phase voltages with sliding-window counting method. In Proceedings of the IECON 2016-42nd Annual Conference of the IEEE Industrial Electronics Society, Florence, Italy, 24–27 October 2016; pp. 435–440. [Google Scholar]
  35. Asghar, F.; Talha, M.; Kim, S.H. Neural Network Based Fault Detection and Diagnosis System for Three-Phase Inverter in Variable Speed Drive with Induction Motor. J. Control Sci. Eng. 2016, 2016, 1286318. [Google Scholar] [CrossRef]
  36. Sonawane, V.; Patil, S.B. Fuzzy Based Open Switch Fault Diagnosis of Three Phase Voltage Source Inverter. In Proceedings of the 2022 6th International Conference on Computing, Communication, Control and Automation (ICCUBEA), Pune, India, 26–27 August 2022; pp. 1–4. [Google Scholar]
  37. Jung, S.M.; Park, J.S.; Kim, H.W.; Cho, K.Y.; Youn, M.J. An MRAS-Based Diagnosis of Open-Circuit Fault in PWM Voltage-Source Inverters for PM Synchronous Motor Drive Systems. Power Electron. IEEE Trans. 2013, 28, 2514–2526. [Google Scholar] [CrossRef]
  38. Liu, C.; Kou, L.; Cai, G.W.; Zhou, J.N.; Meng, Y.Q.; Yan, Y.H. Knowledge-based and Data-driven Approach based Fault Diagnosis for Power-Electronics Energy Conversion System. In Proceedings of the 2019 IEEE International Conference on Communications, Control, and Computing Technologies for Smart Grids (SmartGridComm), Beijing, China, 21–23 October 2019; pp. 1–6. [Google Scholar]
  39. Bouchareb, I.; Lebaroud, A.; Cardoso, A.J.M.; Lee, S.B. Towards Advanced Diagnosis Recognition for Eccentricities Faults: Application on Induction Motor. In Proceedings of the 2019 IEEE 12th International Symposium on Diagnostics for Electrical Machines, Power Electronics and Drives (SDEMPED), Toulouse, France, 27–30 August 2019; pp. 271–282. [Google Scholar]
  40. Guo, H.; Guo, S.; Xu, J.; Tian, X. Power Switch Open-Circuit Fault Diagnosis of Six-Phase Fault Tolerant Permanent Magnet Synchronous Motor System Under Normal and Fault-Tolerant Operation Conditions Using the Average Current Park’s Vector Approach. IEEE Trans. Power Electron. 2021, 36, 2641–2660. [Google Scholar] [CrossRef]
  41. Guo, L.; Wang, K.; Wang, T. Open-Circuit Fault Diagnosis of Three-Phase Permanent Magnet Machine Utilizing Normalized Flux-Producing Current. IEEE Trans. Ind. Electron. 2024, 71, 3351–3360. [Google Scholar] [CrossRef]
  42. Alsarayreh, S.; Sütõ, Z. Fault Diagnosis Using Artificial Neural Network for Two-Level VSI in PMSM Drive System. In Proceedings of the 2023 International Conference on Electrical, Computer and Energy Technologies (ICECET), Cape Town, South Africa, 16–17 November 2023; pp. 1–6. [Google Scholar]
  43. Yang, Y.; Wu, Y.; Li, X.; Zhao, Z.; Zhou, J.; He, Z.; Cui, X.; Tang, G. Short-Circuit Behavior and Voltage Redistribution of IGBTs in Bridge Structures. IEEE Trans. Power Electron. 2023, 38, 3824–3833. [Google Scholar] [CrossRef]
  44. Muhammad, N.; Ridzuan, N.M. A Review of Fault Detection and Diagnosis Approaches for Photovoltaic Systems Using Voltage and Current Analysis. In Proceedings of the 2024 IEEE 4th International Conference in Power Engineering Applications (ICPEA), Pulau Pinang, Malaysia, 4–5 March 2024; pp. 25–30. [Google Scholar]
  45. Abdullah, A.R.; Ahmad, N.S.; Bahari, N.; Manap, M.; Jidin, A.; Jopri, M.H. Short-circuit switches fault analysis of voltage source inverter using spectrogram. In Proceedings of the 2013 International Conference on Electrical Machines and Systems (ICEMS), Busan, Republic of Korea, 26–29 October 2013. [Google Scholar]
  46. Manap, M.; Abdullah, A.R.; Saharuddin, N.Z.; Abidullah, N.A.; Ahmad, N.S.; Bahari, N. Voltage Source Inverter Switches Faults Analysis Using S-Transform. Int. J. Electron. Electr. Eng. 2016, 2, 157–161. [Google Scholar] [CrossRef]
  47. Huang, F.; Flett, F. IGBT Fault Protection Based on di/dt Feedback Control. In Proceedings of the 2007 IEEE Power Electronics Specialists Conference, Orlando, FL, USA, 17–21 June 2007. [Google Scholar]
  48. Flores, E.; Claudio, A.; Aguayo, J.; Hernandez, L. Fault Detection Circuit Based on IGBT Gate Signal. IEEE Lat. Am. Trans. 2016, 14, 541–548. [Google Scholar] [CrossRef]
  49. Li, X.; Xu, D.; Zhu, H.; Cheng, X.; Yu, Y.; Ng, W.T. Indirect IGBT Over-Current Detection Technique Via Gate Voltage Monitoring and Analysis. IEEE Trans. Power Electron. 2019, 34, 3615–3622. [Google Scholar] [CrossRef]
  50. Rodríguez-Blanco, M.A.; Vázquez-Pérez, A.; Hernández-González, L.; Golikov, V.; Aguayo-Alquicira, J.; May-Alarcón, M. Fault Detection for IGBT Using Adaptive Thresholds During the Turn-on Transient. IEEE Trans. Ind. Electron. 2015, 62, 1975–1983. [Google Scholar] [CrossRef]
  51. Rodriguez-Blanco, M.A.; Cervera-Cevallos, M.; Vazquez-Avila, J.L.; Islas-Chuc, M.S. Fault Detection Methodology for the IGBT Based on Measurement of Collector Transient Current. In Proceedings of the 2018 14th International Conference on Power Electronics (CIEP), Cholula, Mexico, 24–26 October 2018; pp. 44–48. [Google Scholar]
  52. Luo, D.; Lai, W.; Chen, M.; Xu, S.; Xiao, Y. A Fault Detection Method for IGBT Bond Wires Partial Lift off Based on Thermal Resistance Assessment. In Proceedings of the 2018 IEEE Region Ten Symposium (Tensymp), Sydney, Australia, 4–6 July 2018; pp. 135–139. [Google Scholar]
  53. Sun, P.; Gong, C.; Du, X.; Peng, Y.; Wang, B.; Zhou, L. Condition Monitoring IGBT Module Bond Wires Fatigue Using Short-Circuit Current Identification. IEEE Trans. Power Electron. 2017, 32, 3777–3786. [Google Scholar] [CrossRef]
  54. Chapter 14-UHVDC System Overvoltage and Insulation Coordination BT-UHV Transmission Technology; Academic Press: Cambridge, MA, USA, 2018; pp. 521–557.
  55. Yunus, A.S.; Masoum, M.A.S.; Siada, A.A. Impact of intermittent misfire and fire-through on the performance of full converter based WECS. In Proceedings of the 2012 22nd Australasian Universities Power Engineering Conference (AUPEC), Bali, Indonesia, 26–29 September 2012; pp. 1–5. [Google Scholar]
  56. Salankayana, S.K.; Chellammal, N.; Gurram, R. Diagnosis of Faults due to Misfiring of Switches of a Cascaded H-Bridge Multi-level Inverter using Artificial Neural Networks. Int. J. Comput. Appl. 2012, 41, 17–22. [Google Scholar]
  57. Ouyang, W.; Sun, P.; Xie, M.; Hu, Y.; Ma, X. A Gate Voltage Clamping Method to Improve the Short-Circuit Characteristic of SiC MOSFET. In Proceedings of the 2023 IEEE 2nd International Power Electronics and Application Symposium (PEAS), Guangzhou, China, 10–13 November 2023; pp. 287–292. [Google Scholar]
  58. Yao, F.; Wang, B.; Peng, Y.; Li, Z.-G. Reliability study on DC-link capacitor in fault states of VSI in elective vehicle. J. Eng. 2019, 2019, 2544–2550. [Google Scholar] [CrossRef]
  59. Liao, L.; Gao, H.; He, Y.; Xu, X.; Lin, Z.; Chen, Y.; You, F. Fault Diagnosis of Capacitance Aging in DC Link Capacitors of Voltage Source Inverters Using Evidence Reasoning Rule. Math. Probl. Eng. 2020, 2020, 5724019. [Google Scholar] [CrossRef]
  60. Xu, X.; Zheng, J.; Yang, J.-B.; Xu, D.-L.; Chen, Y.-W. Data classification using evidence reasoning rule. Knowl. Based Syst. 2017, 116, 144–151. [Google Scholar] [CrossRef]
  61. Yu, Y.; Zhou, T.; Zhu, M.; Xu, D. Fault Diagnosis and Life Prediction of DC-link Aluminum Electrolytic Capacitors Used in Three-phase AC/DC/AC Converters. In Proceedings of the 2012 Second International Conference on Instrumentation, Measurement, Computer, Communication and Control, Harbin, China, 8–10 December 2012; pp. 825–830. [Google Scholar]
  62. Suskis, P.; Zakis, J.; Suzdalenko, A.; Van Khang, H.; Pomarnacki, R. A Study on Electrolytic Capacitor Aging in Power Converters and Parameter Change Over the Lifespan. In Proceedings of the 2023 IEEE 10th Jubilee Workshop on Advances in Information, Electronic and Electrical Engineering (AIEEE), Vilnius, Lithuania, 27–29 April 2023; pp. 1–5. [Google Scholar]
  63. Teja, D.D.; Kumar, K.K. Induction Motor Drive Dc Link Capacitor Failure Analysis Using Thermal Modelling Approach. Int. J. Adv. Sci. Technol. 2020, 29, 7088–7097. [Google Scholar]
  64. Khelif, M.A.; Bendiabdellah, A.; Eddine Cherif, B.D. Short-circuit fault diagnosis of the DC-Link capacitor and its impact on an electrical drive system. Int. J. Electr. Comput. Eng. 2020, 10, 2807–2814. [Google Scholar] [CrossRef]
  65. Kamel, T.; Biletskiy, Y.; Chang, L. Capacitor aging detection for the DC filters in the power electronic converters using ANFIS algorithm. In Proceedings of the 2015 IEEE 28th Canadian Conference on Electrical and Computer Engineering (CCECE), Halifax, NS, Canada, 3–6 May 2015; pp. 663–668. [Google Scholar]
  66. Soliman, H.; Wang, H.; Blaabjerg, F. Capacitance estimation for dc-link capacitors in a back-to-back converter based on Artificial Neural Network algorithm. In Proceedings of the 2016 IEEE 8th International Power Electronics and Motion Control Conference (IPEMC-ECCE Asia), Hefei, China, 22–26 May 2016; pp. 3682–3688. [Google Scholar]
  67. Soliman, H.; Davari, P.; Wang, H.; Blaabjerg, F. Capacitance estimation algorithm based on DC-link voltage harmonics using artificial neural network in three-phase motor drive systems. In Proceedings of the 2017 IEEE Energy Conversion Congress and Exposition (ECCE), Cincinnati, OH, USA, 1–5 October 2017; pp. 5795–5802. [Google Scholar]
  68. Soliman, H.; Abdelsalam, I.; Wang, H.; Blaabjerg, F. Artificial Neural Network based DC-link capacitance estimation in a diode-bridge front-end inverter system. In Proceedings of the 2017 IEEE 3rd International Future Energy Electronics Conference and ECCE Asia (IFEEC 2017-ECCE Asia), Kaohsiung, Taiwan, 4–7 June 2017; pp. 196–201. [Google Scholar]
  69. Soliman, H.; Wang, H.; Gadalla, B.; Blaabjerg, F. Condition monitoring for DC-link capacitors based on artificial neural network algorithm. In Proceedings of the 2015 IEEE 5th International Conference on Power Engineering, Energy and Electrical Drives (POWERENG), Riga, Latvia, 11–13 May 2015; pp. 587–591. [Google Scholar]
  70. Sher, H.A.; Addoweesh, K.E.; Khan, Y. Effect of short circuited DC link capacitor of an AC–DC–AC inverter on the performance of induction motor. J. King Saud Univ. Eng. Sci. 2016, 28, 199–206. [Google Scholar] [CrossRef]
  71. Vavilov, O.A.; Korobkov, D.V.; Yurkevich, V.D. Two-Level Voltage Inverter: Parametric Synthesis of Filter and Controllers. In Proceedings of the 2022 IEEE 23rd International Conference of Young Professionals in Electron Devices and Materials (EDM), Altai, Russia, 30 June–4 July 2022; pp. 372–377. [Google Scholar]
  72. Shuai, M.; Yafeng, W.; Hua, Z. Parity-Space-Based FDI Approach for Advanced-Aeroengine Sensors. In Proceedings of the 2020 11th International Conference on Mechanical and Aerospace Engineering (ICMAE), Athens, Greece, 14–17 July 2020; pp. 140–144. [Google Scholar]
  73. Mouhssine, N.; Kabbaj, M.N.; Benbrahim, M.; Bekkali, C.E. Sensor fault detection of quadrotor using nonlinear parity space relations. In Proceedings of the 2017 International Conference on Electrical and Information Technologies (ICEIT), Rabat, Morocco, 15–18 November 2017; pp. 1–6. [Google Scholar]
  74. Jlassi, I.; Estima, J.O.; El Khil, S.K.; Bellaaj, N.M.; Cardoso, A.J.M. A Robust Observer-Based Method for IGBTs and Current Sensors Fault Diagnosis in Voltage-Source Inverters of PMSM Drives. IEEE Trans. Ind. Appl. 2017, 53, 2894–2905. [Google Scholar] [CrossRef]
  75. Yu, Y.; Zhao, Y.; Wang, B.; Huang, X.; Xu, D.G. Current Sensor Fault Diagnosis and Tolerant Control for VSI-Based Induction Motor Drives. IEEE Trans. Power Electron. 2018, 33, 4238–4248. [Google Scholar] [CrossRef]
  76. Xu, S.; Chen, X.; Yang, W.; Liu, F.; Chai, Y. Current Sensor Incipient Fault Diagnosis in PMSM Drive Systems Using Novel Interval Sliding Mode Observer. IEEE Trans. Instrum. Meas. 2024, 73, 3508211. [Google Scholar] [CrossRef]
  77. Tan, S.; De La Cruz, J.; Vasquez, J.C.; Guerrero, J.M. Sensor Faults Detection in DC Microgrids based on Unknown Input Observer. In Proceedings of the 2023 25th European Conference on Power Electronics and Applications (EPE’23 ECCE Europe), Aalborg, Denmark, 4–8 September 2023; pp. 1–8. [Google Scholar]
  78. Ho, C.M.; Ahn, K.K. Observer Based Adaptive Neural Networks Fault-Tolerant Control for Pneumatic Active Suspension With Vertical Constraint and Sensor Fault. IEEE Trans. Veh. Technol. 2023, 72, 5862–5876. [Google Scholar] [CrossRef]
  79. Gou, B.; Xu, Y.; Xia, Y.; Wilson, G.; Liu, S. An Intelligent Time-Adaptive Data-Driven Method for Sensor Fault Diagnosis in Induction Motor Drive System. IEEE Trans. Ind. Electron. 2019, 66, 9817–9827. [Google Scholar] [CrossRef]
  80. Ossig, D.L.; Kurzenberger, K.; Speidel, S.A.; Henning, K.-U.; Sawodny, O. Sensor Fault Detection Using an Extended Kalman Filter and Machine Learning for a Vehicle Dynamics Controller. In Proceedings of the IECON 2020 the 46th Annual Conference of the IEEE Industrial Electronics Society, Singapore, 18–21 October 2020; pp. 361–366. [Google Scholar]
  81. Lizarraga, A.; Begovich, O.; Ramirez, A. Concurrent Fault Diagnosis Based on an Extended Kalman Filter. In Proceedings of the 2021 18th International Conference on Electrical Engineering, Computing Science and Automatic Control (CCE), Mexico City, Mexico, 10–12 November 2021; pp. 1–6. [Google Scholar]
  82. Mitronikas, E.; Papathanasopoulos, D.; Athanasiou, G.; Tsotoulidis, S. Hall-effect sensor fault identification in brushless DC motor drives using wavelets. In Proceedings of the 2017 IEEE 11th International Symposium on Diagnostics for Electrical Machines, Power Electronics and Drives (SDEMPED), Tinos, Greece, 29 August–1 September 2017; pp. 434–440. [Google Scholar]
  83. Priya, Y.K.; Kumar, M.V. Analysis of various switch faults of the Three level Neutral point clamped inverter feeding induction motor drive. In Proceedings of the 2016 2nd International Conference on Advances in Electrical, Electronics, Information, Communication and Bio-Informatics (AEEICB), Chennai, India, 27–28 February 2016; pp. 580–586. [Google Scholar]
  84. Houchati, M.; Ben-Brahim, L.; Gastli, A.; Meskin, N. Fault detection in modular multilevel converter using principle component analysis. In Proceedings of the 2018 IEEE 12th International Conference on Compatibility, Power Electronics and Power Engineering (CPE-POWERENG 2018), Doha, Qatar, 10–12 April 2018; pp. 1–6. [Google Scholar]
  85. Chavan, S.B.; Chavan, M.S. Simulation paradigm to study circuit performance in presence of component level fault. Indian J. Sci. Technol. 2020, 13, 3983–3993. [Google Scholar] [CrossRef]
  86. de Alencar, G.T.; Santos, R.C.D.; Neves, A. A fault recognition method for transmission systems based on independent component analysis and convolutional neural networks. Electr. Power Syst. Res. 2024, 229, 110105. [Google Scholar] [CrossRef]
  87. Zhu, Y.; Feng, L.; Yang, R.; Luo, H.; Du, K. Inverter Open Circuit and Current Sensor Fault Diagnosis Based on SAE-CNN-BiLSTM. In Proceedings of the 2023 6th International Conference on Robotics, Control and Automation Engineering (RCAE), Suzhou, China, 3–5 November 2023; pp. 383–387. [Google Scholar]
  88. Adamczyk, M.; Orlowska-Kowalska, T. Analysis of stator current reconstruction method after current sensor faults in vector-controlled induction motor drives. In Proceedings of the 2022 IEEE 20th International Power Electronics and Motion Control Conference (PEMC), Brasov, Romania, 25–28 September 2022; pp. 101–106. [Google Scholar]
  89. Mohammadi, F.; Saif, M. A Multi-Stage Hybrid Open-Circuit Fault Diagnosis Approach for Three-Phase VSI-Fed PMSM Drive Systems. IEEE Access 2023, 11, 137328–137342. [Google Scholar] [CrossRef]
  90. Venkatasubramanian, V.; Rengaswamy, R.; Yin, K.; Kavuri, S.N. A review of process fault detection and diagnosis: Part I: Quantitative model-based methods. Comput. Chem. Eng. 2003, 27, 293–311. [Google Scholar] [CrossRef]
Figure 1. VSI fault locations.
Machines 12 00631 g001
Figure 2. Failure rates of VSI internal components.
Machines 12 00631 g002
Figure 3. Sensor fault types: (a) bias, (b) gain, (c) drift, (d) noise, (e) short and open, (f) freezing.
Machines 12 00631 g003
Figure 4. All open/short-switch fault possibilities.
Machines 12 00631 g004
Figure 5. Current trajectory: (a) normal conditions, (b,c) fault at phase b, (d,e) fault at phase a, and (f,g) fault at phase c.
Machines 12 00631 g005
Figure 6. Sliding-window process based on phase voltage.
Machines 12 00631 g006
Figure 7. General schematic of artificial neural network.
Machines 12 00631 g007
Figure 8. State representations in VSP: (a) healthy mode, (b) S1 is short, (c) S3 is short, (d) S5 is short, (e) S2 is short, (f) S4 is short, and (g) S6 is short.
Machines 12 00631 g008
Figure 9. Short-switch fault detection using di/dt feedback control.
Machines 12 00631 g009
Figure 10. Gate firing configurations: (a) floating gate and (b) using turn-off circuit.
Machines 12 00631 g010
Figure 11. Approximated electrolytic capacitor model.
Machines 12 00631 g011
Figure 12. Input and output of the ANFIS model.
Machines 12 00631 g012
Figure 13. Capacitor degradation capacitance value.
Machines 12 00631 g013
Figure 14. Schematic of a sensor fault observer-based FDD method.
Machines 12 00631 g014
Figure 15. Simplified schematic of a sensor fault-adaptive observer-based FDD method.
Machines 12 00631 g015
Figure 16. Fault detection and diagnosis structure using ELM algorithm.
Machines 12 00631 g016
Figure 17. Distribution by year of the component and sensor FDD articles used.
Machines 12 00631 g017
Table 1. Inverter failure rates and impact for different fields.
FieldImpactFrequency of Occurrence
Variable AC drives (Industry)
Production process interruption
Reduce torque and motor efficiency
Damage to motor winding
-
Wind energy
Energy loss
Power flow interruption
Damage to generator winding
27% (onshore)
8% (offshore)
Solar energy
Energy loss
Power flow interruption
Damage to the panels
28%
Hydroelectric
Energy loss
Power flow interruption
Damage to generator winding
27%
Electric vehicles
Damage to motor winding
Damage to the battery pack
12%
Table 2. Characteristics of each internal VSI fault.
Fault TypeInverter OutputSymptomsThermal Effects
Power Switch Open Reduced or completely interrupted output power Phase imbalance or complete failure to deliver power Other components may be subjected to higher stress
Short This leads to a dangerous
surge in current
Sudden loss of power
or blowing of fuses
Rapid heating of the shorted switch and nearby components
Gate
Misfiring
Unstable output
voltage or current
Fluctuating voltage, noise,
or harmonic distortion
Overheating of the switches and thermal stress on the VSI
Diode Open Poor filtering and higher
ripple in the output voltage
Increased harmonic distortion and voltage instabilityStress other components thermally, leading to overheating
Short Immediate failure
or shutdown
Sudden shutdown or damage to surrounding componentsRapid and excessive heating of the capacitor and its surroundings
Link
Capacitor
Open Incomplete or asymmetric
output
Increased voltage ripple and potential phase imbalanceIncreased thermal stress on other components
Short Potential failure or
shutdown of the inverter
Loss of output power
or damage to the circuit
Excessive heating due to high current flow
PCB Can cause open circuits, short
circuits, or intermittent
connections
Random failures, depending on the fault’s nature and locationCreate localized hotspots, potentially leading to further damage or component failure
Sensor Incorrect operation, leading to unstable outputUnstable operation, incorrect voltage, or current levelsDepending on the fault’s nature
Table 3. Research articles reviewed and their breakdown with respect to each type of fault.
Fault TypeNumberPercentage
Open Switch [27,28,29,30,31,32,33,34,35,36,37,38,39,40,41,42]1529.4%
Short Switch [43,44,45,46,47,48,49,50,51,52,53]1019.6%
Gate misfiring [54,55,56]24%
Anti-parallel Diode [57]12%
Electrolytic Capacitor [58,59,60,61,62,63,64,65,66,67,68,69,70]1223.5%
Sensor [71,72,73,74,75,76,77,78,79,80,81,82]1121.5%
Total51100%
Table 4. Impact of each internal VSI fault.
Fault Type Impact
Power Switch Open
Reduced overall efficiency
Reduction in the mean torque (machine load)
Presence of pulsating torque (machine load)
Unipolar half-wave increases copper loss
Short
Overcurrent that may damage the voltage source
Gate Misfiring
May have the same effect as open- and short-switch faults
Malfunctioning in the VSI
Diode Open
May damage the power switch at higher voltage peak values
No path for the reverse current back to the source (regenerative loads)
Short
Overcurrent that may damage the voltage source
Link Capacitor Open
Increase noise and high-frequency components
Unstable operation
Higher voltage peaks and ripples
Short
Voltage source damage and shutdown
PCB
Increase in the leakage current
Open or short solder junction points
Sensor
Loss in control feedback signal
Partial or complete malfunctioning
Loss of overcurrent triggering
Table 5. Comparison of open-switch FDD methods.
FDD MethodFDD FamilyRobustnessComputational ComplexityDetection SpeedMultiple Fault DetectionNonlinear SystemsAdaptability with Changes
Spectrogram [27,28]
(Time-Frequency)
Qualitative
History-based
AverageHigh [38]Average
(20 ms) [39]
FalseTrueLow
Park’s Transform [29,30]Qualitative
History-based
Vulnerable at low currentsAverageSlow
(>20 ms) [40]
TrueTrueAverage
Normalizing Current [31]Qualitative
History-based
Vulnerable at low currentsAverageAverage
(18.4 ms) [41]
TrueTrueAverage
Clark’s Transform [32]Qualitative
History-based
Vulnerable at low currentsAverageFast
(4 ms) [32]
TrueTrueAverage
Fuzzy Logic [33]Qualitative
History-based
GoodAverageAverage
(<20 ms) [33]
TrueTrue if trainedHigh
Sliding-Window Counting (Phase Voltages) [34]Qualitative
History-based
GoodLowFast
(4.96 ms) [34]
True if modifiedTrueLow
ANN [35]Quantitative
History-based
GoodAverageSlow
(46 ms) [42]
TrueTrue if trainedHigh
Wavelet-ANFI [36]Quan. and Qual.
History-based
GoodAverageSlow
(t not available)
TrueTrue if trainedHigh
MRAS [37]Quantitative
Model-based
GoodAverageFast
(0.91 ms) [37]
TrueTrueHigh
Table 6. Comparison of short-switch FDD methods.
FDD MethodFDD FamilyRobustnessComputational ComplexityDetection SpeedMultiple Fault DetectionNonlinear SystemsAdaptability
with Changes
Voltage Space Patterns [44]Qualitative
History-based
LowAverageFast
(2 ms) [44]
FalseTrueLow
S-Transform [45,46]Qualitative
History-based
AverageHigh Average
(20 ms) [45]
FalseTrueLow
di/dt Feedback Control [47]Qualitative
History-based
AverageHighVery Fast
(0.5 µs) [47]
TrueTrueHigh
Gate Signal [48,49]Qualitative
History-based
LowLowVery Fast
(100–150 ns) [48]
(0.5–0.6 µs) [49]
TrueTrueHigh
Transient Current [50,51]Qualitative
Model-based
AverageAverageVery Fast
(0.25 µs) [51]
TrueTrueAverage
Bond Wire [52,53]Qualitative
Model-based
HighAverageVery Fast
(2–5 µs) [53]
TrueTrueAverage
Table 7. Comparison of capacitor FDD methods.
FDD MethodFDD FamilyRobustnessComputational ComplexityEstimation ErrorMultiple Fault
Detection
Nonlinear SystemsAdaptability with Changes
ER [59]Qualitative
History-based
HighLow6.25–18.75% [59]TrueTrueAverage
RLS [61]Quantitative
Model-based
HighLow0% [61]TrueTrueAverage
Thermal Modeling [63]Qualitative
Model-based
HighAverageUsed to monitor capacitors and avoid faultsTrueTrueAverage
Transient Current [64]Qualitative
History-based
AverageAverageUsed for instant capacitor faultsTrueTrueAverage
ANFIS [65]Quan. and Qual.
History-based
HighHigh6.5% [65]True (more than one ANFIS is required)True if trainedHigh
ANN [66,67,68,69]Quantitative
Model-based
HighAverage0.35–0.4% [66]
1.2–1.3% [67]
True (more than one ANN is required)True if trainedHigh
Table 8. Comparison of sensor FDD methods.
FDD MethodFDD FamilyRobustnessComputational ComplexityDetection SpeedMultiple Fault DetectionNonlinear SystemsAdaptability with Changes
Parity Space [72,73]Quantitative
Model-based
HighAverageAverageTrueTrueAverage
Observer [74,75]Quantitative
Model-based
LowLowAverageTrueFalseLow
Adaptive Observer [76,77,78]Quantitative
Model-based
AverageAverageAverageTrueTrueHigh
Time-Adaptive with ELM [79]Qualitative
History-based
HighAverageFastTrueTrueHigh
EKF [80,81]Quantitative
Model-based
HighAverageFastTrueTrueHigh
Wavelet [82]Qualitative
History-based
AverageHighAverageFalseTrueLow
Disclaimer/Publisher’s Note: The statements, opinions and data contained in all publications are solely those of the individual author(s) and contributor(s) and not of MDPI and/or the editor(s). MDPI and/or the editor(s) disclaim responsibility for any injury to people or property resulting from any ideas, methods, instructions or products referred to in the content.

