
The Tightening and Untightening Modeling and Simulation of Bolted Joints


Abstract
1. Introduction
2. Analytical Model
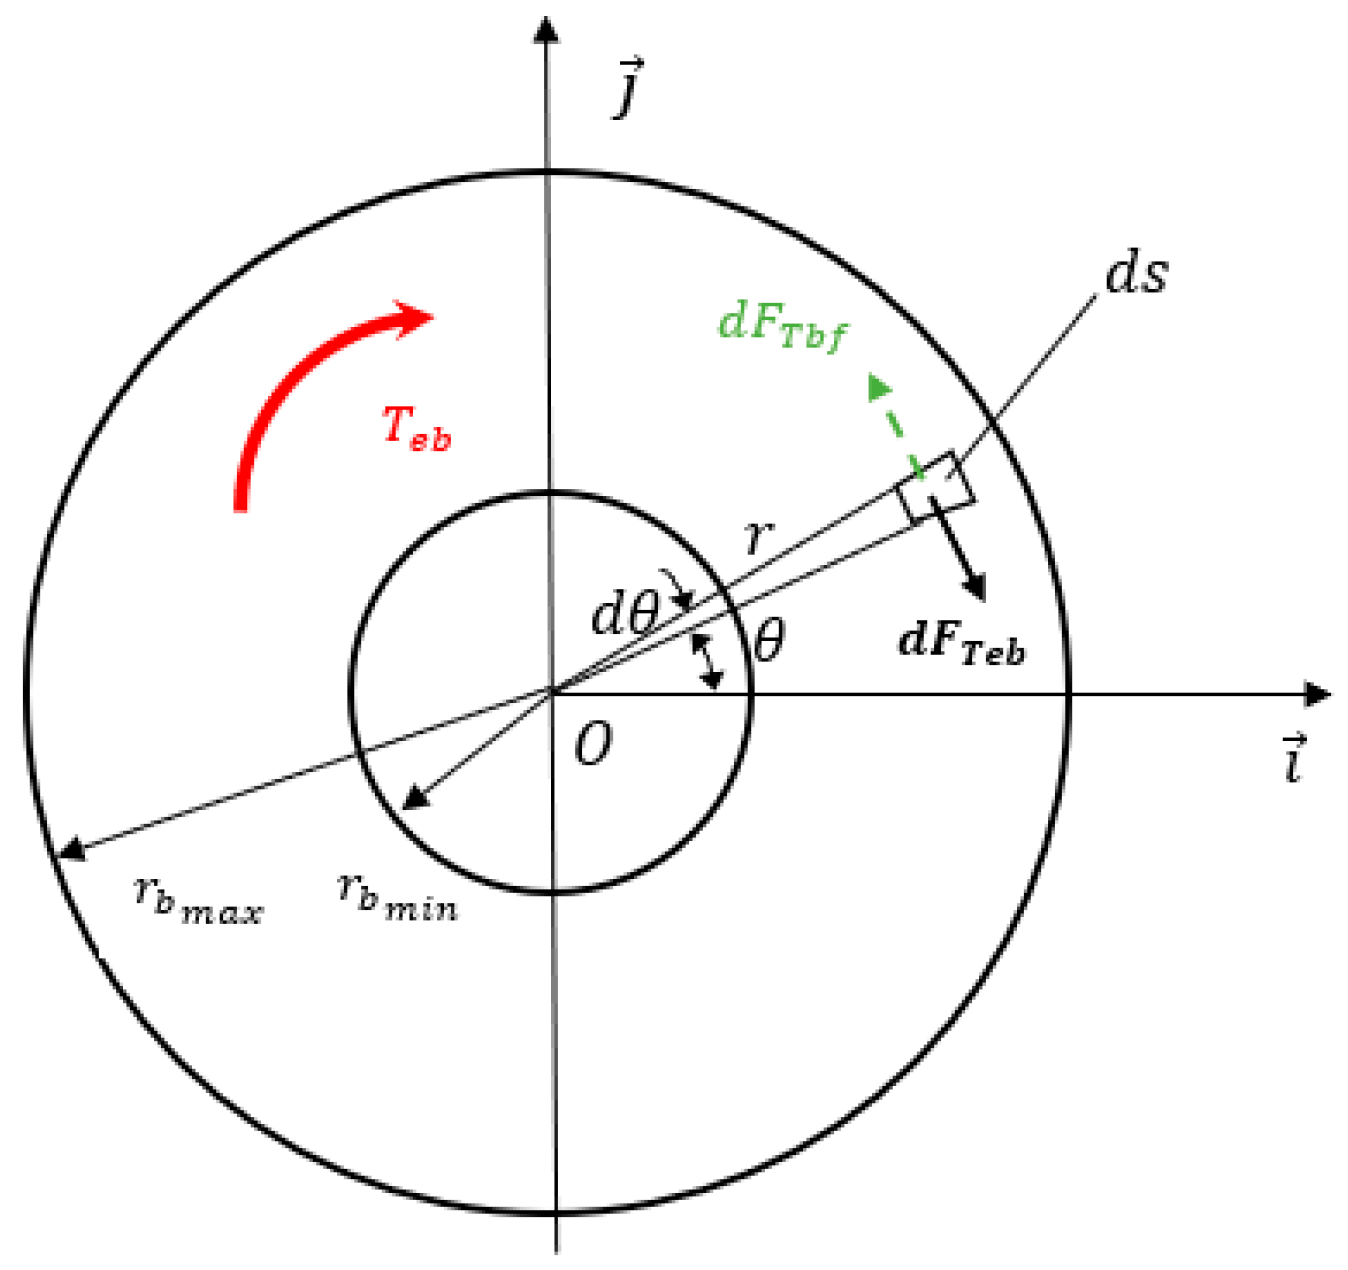
2.1. Underhead Bearing Friction Torque
2.2. Thread Friction and Pitch Torques
2.3. Stiffness of Joint
2.3.1. Bolt Stiffness
2.3.2. Stiffness of Threaded Connection
2.3.3. Stiffness of Clamped Members
2.4. Angle of Nut Rotation
2.5. Nut Factor
3. Finite Element Model
Constraints
4. Results and Discussion
5. Conclusions
Author Contributions
Funding
Data Availability Statement
Conflicts of Interest
Correction Statement
References
- Li, L.; Yun, Q.-Q.; Tian, H.-F.; Cai, A.-J.; Cao, A.-Y. Investigation into the contact characteristics of rough surfaces with surface tension. J. Braz. Soc. Mech. Sci. Eng. 2019, 41, 343. [Google Scholar] [CrossRef]
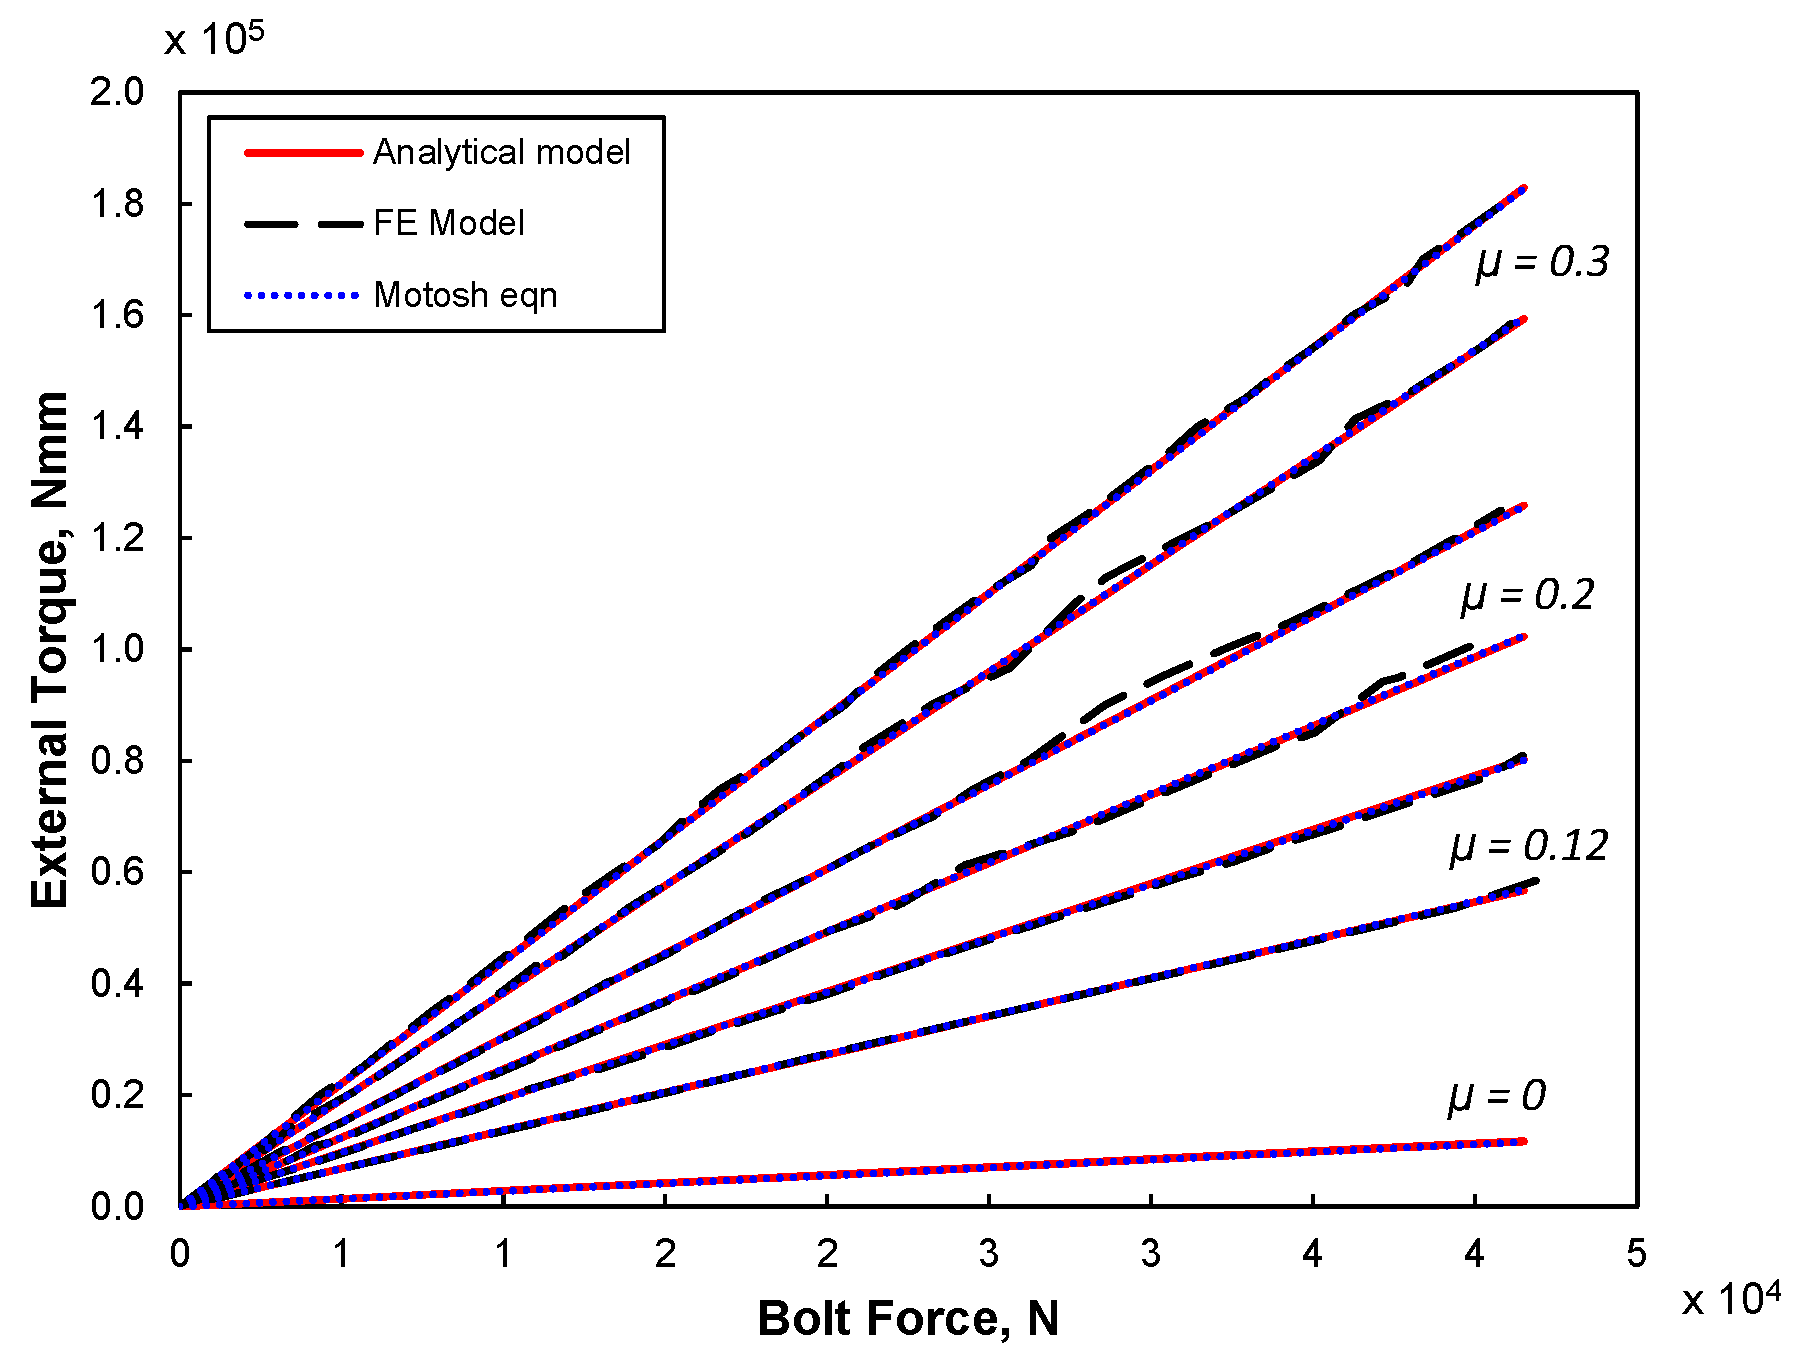
- Motosh, N. Development of design charts for bolts preloaded up to the plastic range. ASME J. Eng. Ind. 1976, 98, 849–851. [Google Scholar] [CrossRef]
- Bickford, J.H. An Introduction to the Design and Behavior of Bolted Joints, 3rd ed.; Marcel Dekker: New York, NY, USA, 1995. [Google Scholar]
- Juvinall, R.C.; Marshek, K.M. Fundamentals of Machine Component Design, 3rd ed.; Wiley: New York, NY, USA, 2000. [Google Scholar]
- Kogut, L.; Etsion, I. A Static friction model for elastic-plastic contacting rough surfaces. J. Tribol. 2004, 126, 34–40. [Google Scholar] [CrossRef]
- Nassar, S.A.; Yang, X. Torque-angle formulation of threaded fastener tightening. J. Mech. Des. 2008, 130, 024501. [Google Scholar] [CrossRef]
- Nassar, S.A.; Zaki, A.M. Effect of coating thickness on the friction coefficients and torque-tension relationship in threaded fasteners. J. Tribol. 2009, 131, 021301. [Google Scholar] [CrossRef]
- Nassar, S.A.; Barber, G.C.; Dajun, Z. Bearing friction torque in bolted joints. Tribol. Trans. 2005, 48, 69–75. [Google Scholar] [CrossRef]
- Nassar, S.A.; Matin, P.H.; Barber, G.C. Thread friction torque in bolted joints. J. Press. Vessel Technol. 2005, 127, 387–393. [Google Scholar] [CrossRef]
- Izumi, S.; Yokoyama, T.; Iwasaki, A.; Sakai, S. Three-dimensional finite element analysis of tightening and loosening mechanism of threaded fastener. Eng. Fail. Anal. 2005, 12, 604–615. [Google Scholar] [CrossRef]
- Huang, J.; Guo, L.S. The research on the torque-tension relationship for bolted joints. Key Eng. Mater. 2011, 486, 242–245. [Google Scholar] [CrossRef]
- Fukuoka, T. Finite element simulation of tightening process of bolted joint with a tensioner. J. Press. Vessel Technol. 1992, 114, 433–438. [Google Scholar] [CrossRef]
- Jiang, Y.; Chang, J.; Lee, C.-H. An experimental study of the torque-tension relationship for bolted joints. Int. J. Mater. Prod. Technol. 2001, 16, 417–429. [Google Scholar] [CrossRef]
- Liu, Z.; Zheng, M.; Yan, X.; Zhao, Y.; Cheng, Q.; Yang, C. Changing behavior of friction coefficient for high strength bolts during repeated tightening. Tribol. Int. 2020, 151, 106486. [Google Scholar] [CrossRef]
- Zou, Q.; Sun, T.S.; Nassar, S.A.; Barber, G.C.; Gumul, A.K. Effect of lubrication on friction and torque-tension relationship in threaded fasteners. Tribol. Trans. 2007, 50, 127–136. [Google Scholar] [CrossRef]
- Grabon, W.A.; Osetek, M.; Mathia, T.G. Friction of threaded fasteners. Tribol. Int. 2018, 118, 408–420. [Google Scholar] [CrossRef]
- Fernando, A.; Lee, J.; Pokharel, T.; Gad, E. Improvements to torque versus tension relationship considering nut dilation effects. Proc. Inst. Mech. Eng. Part C J. Mech. Eng. Sci. 2022, 236, 3578–3594. [Google Scholar] [CrossRef]
- Jiang, K.; Liu, Z.; Wang, Y.; Tian, Y.; Zhang, C.; Zhang, T. Effects of different friction coefficients on input torque distribution in the bolt tightening process based on the energy method. J. Tribol. 2022, 144, 071203. [Google Scholar] [CrossRef]
- Zhang, J.; Feng, J.; Li, W.; Liao, R. Improving torque-tension relationship in bolted joints: Accurate threaded surface representation and pressure distribution considerations. Mech. Based Des. Struct. Mach. 2024, 1–21. [Google Scholar] [CrossRef]
- Fort, V.; Bouzid, A.-H.; Gratton, M. Analytical modeling of self-loosening of bolted joints subjected to transverse loading. J. Press. Vessel Technol. 2019, 141, 031205. [Google Scholar] [CrossRef]
- Meyer, G.; Strelow, D. Simple diagrams aid in analyzing forces in bolted joints. Assem. Eng. 1972, 15, 28–33. [Google Scholar]
- Sawa, T.; Maruyama, K. On the deformation of the bolt head and nut in a bolted joint. Bull. JSME 1976, 19, 203–211. [Google Scholar] [CrossRef]
- Rousseau, R.I.; Bouzid, A.-H.; Zhao, Z. Accurate Evaluation of Bolt and Clamped Members Stiffnesses of Bolted Joints. In Proceedings of the ASME Pressure Vessels and Piping Conference, Virtual, 18 October 2021. [Google Scholar] [CrossRef]
- Zhang, D.; Gao, S.; Xu, X. A new computational method for threaded connection stiffness. Adv. Mech. Eng. 2016, 8, 1–9. [Google Scholar] [CrossRef]
- BS 3643: Part 2; ISO Metric Screw Threads. Limits and Tolerances for Fine Pitch Threads (Constant Pitch Series). BSI: Singapore, 1981. [CrossRef]
- ANSYS Inc. Ansys Workbench 19.1; Version 2019; [Computer Program]; ANSYS Inc.: Canonsburg, PA, USA, 2019. [Google Scholar]
- ASME. Boiler and Pressure Vessel Code, Section II, Part A: Materials Specifications, ASTM A193/A193M—Standard Specification for Alloy-Steel and Stainless Steel Bolting for High-Temperature or High-Pressure Service and Other Special Purpose Applications, Latest ed.; ASTM International: West Conshohocken, PA, USA, 2024. [Google Scholar]
- ASME. Boiler and Pressure Vessel Code, Section II, Part A: Materials Specifications, ASTM A285/A285M—Standard Specification for Pressure Vessel Plates, Carbon Steel, Low- and Intermediate-Tensile Strength, Latest ed.; ASTM International: West Conshohocken, PA, USA, 2017. [Google Scholar]
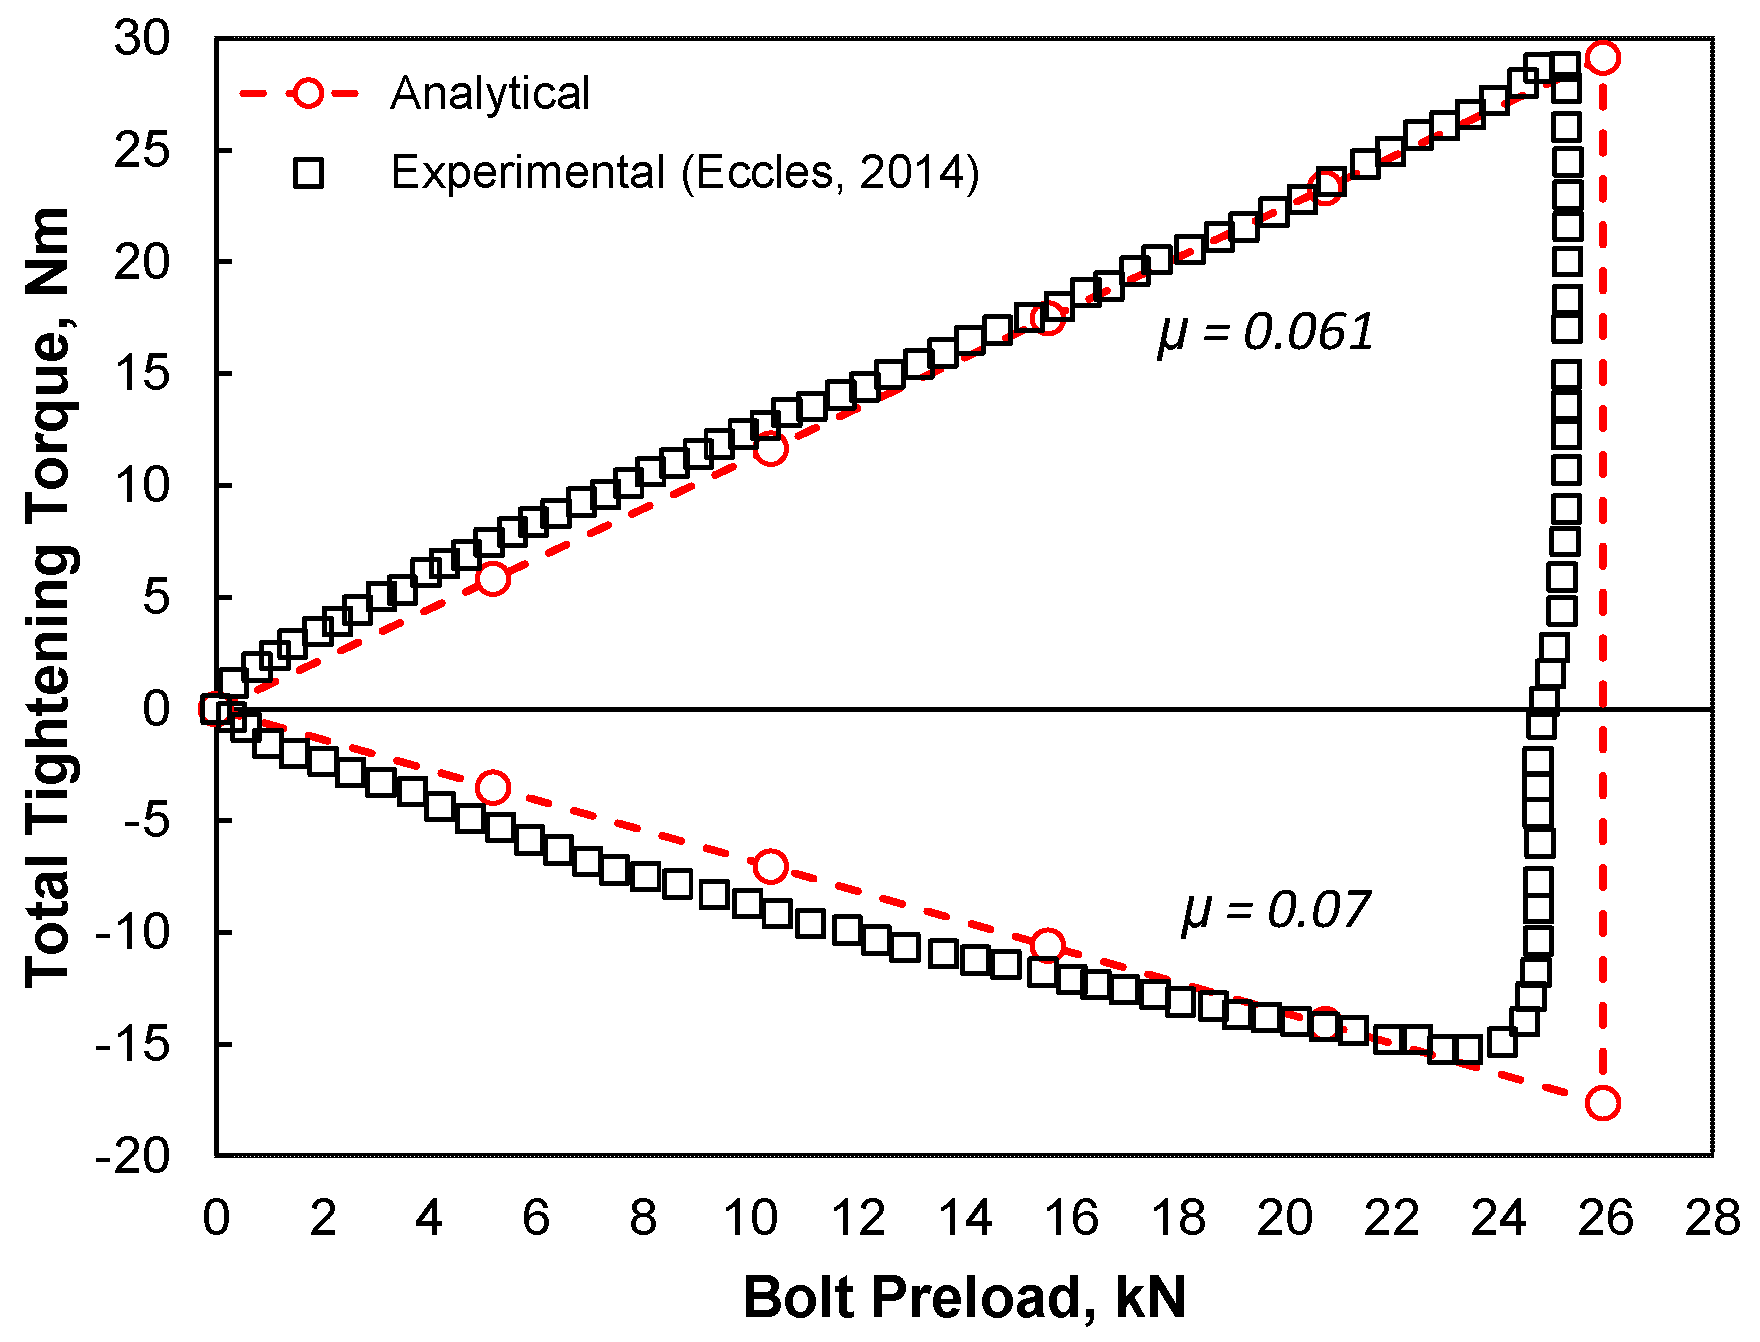
- Eccles, W. A New Approach to the Checking of the Tightness of Bolted Connections. In Proceedings of the Lubrication, Maintenance and Tribotechnology (LUBMAT), Manchester, UK, 25–27 June 2014. [Google Scholar]


| Material Properties | Bolt and Nut (SA-193 B7) | Clamped Member (SA-285 Gr C) |
|---|---|---|
| Ultimate tensile strength [MPa] | 860 | 450 |
| Yield strength [MPa] | 720 | 205 |
| Young’s Modulus [GPa] | 206.8 | 206.8 |
| Poisson’s ratio | 0.3 | 0.3 |
| Tightening | Untightening | |||||
|---|---|---|---|---|---|---|
| Torques | Analytical | FE | Percentage Difference (%) | Analytical | FE | Percentage Difference (%) |
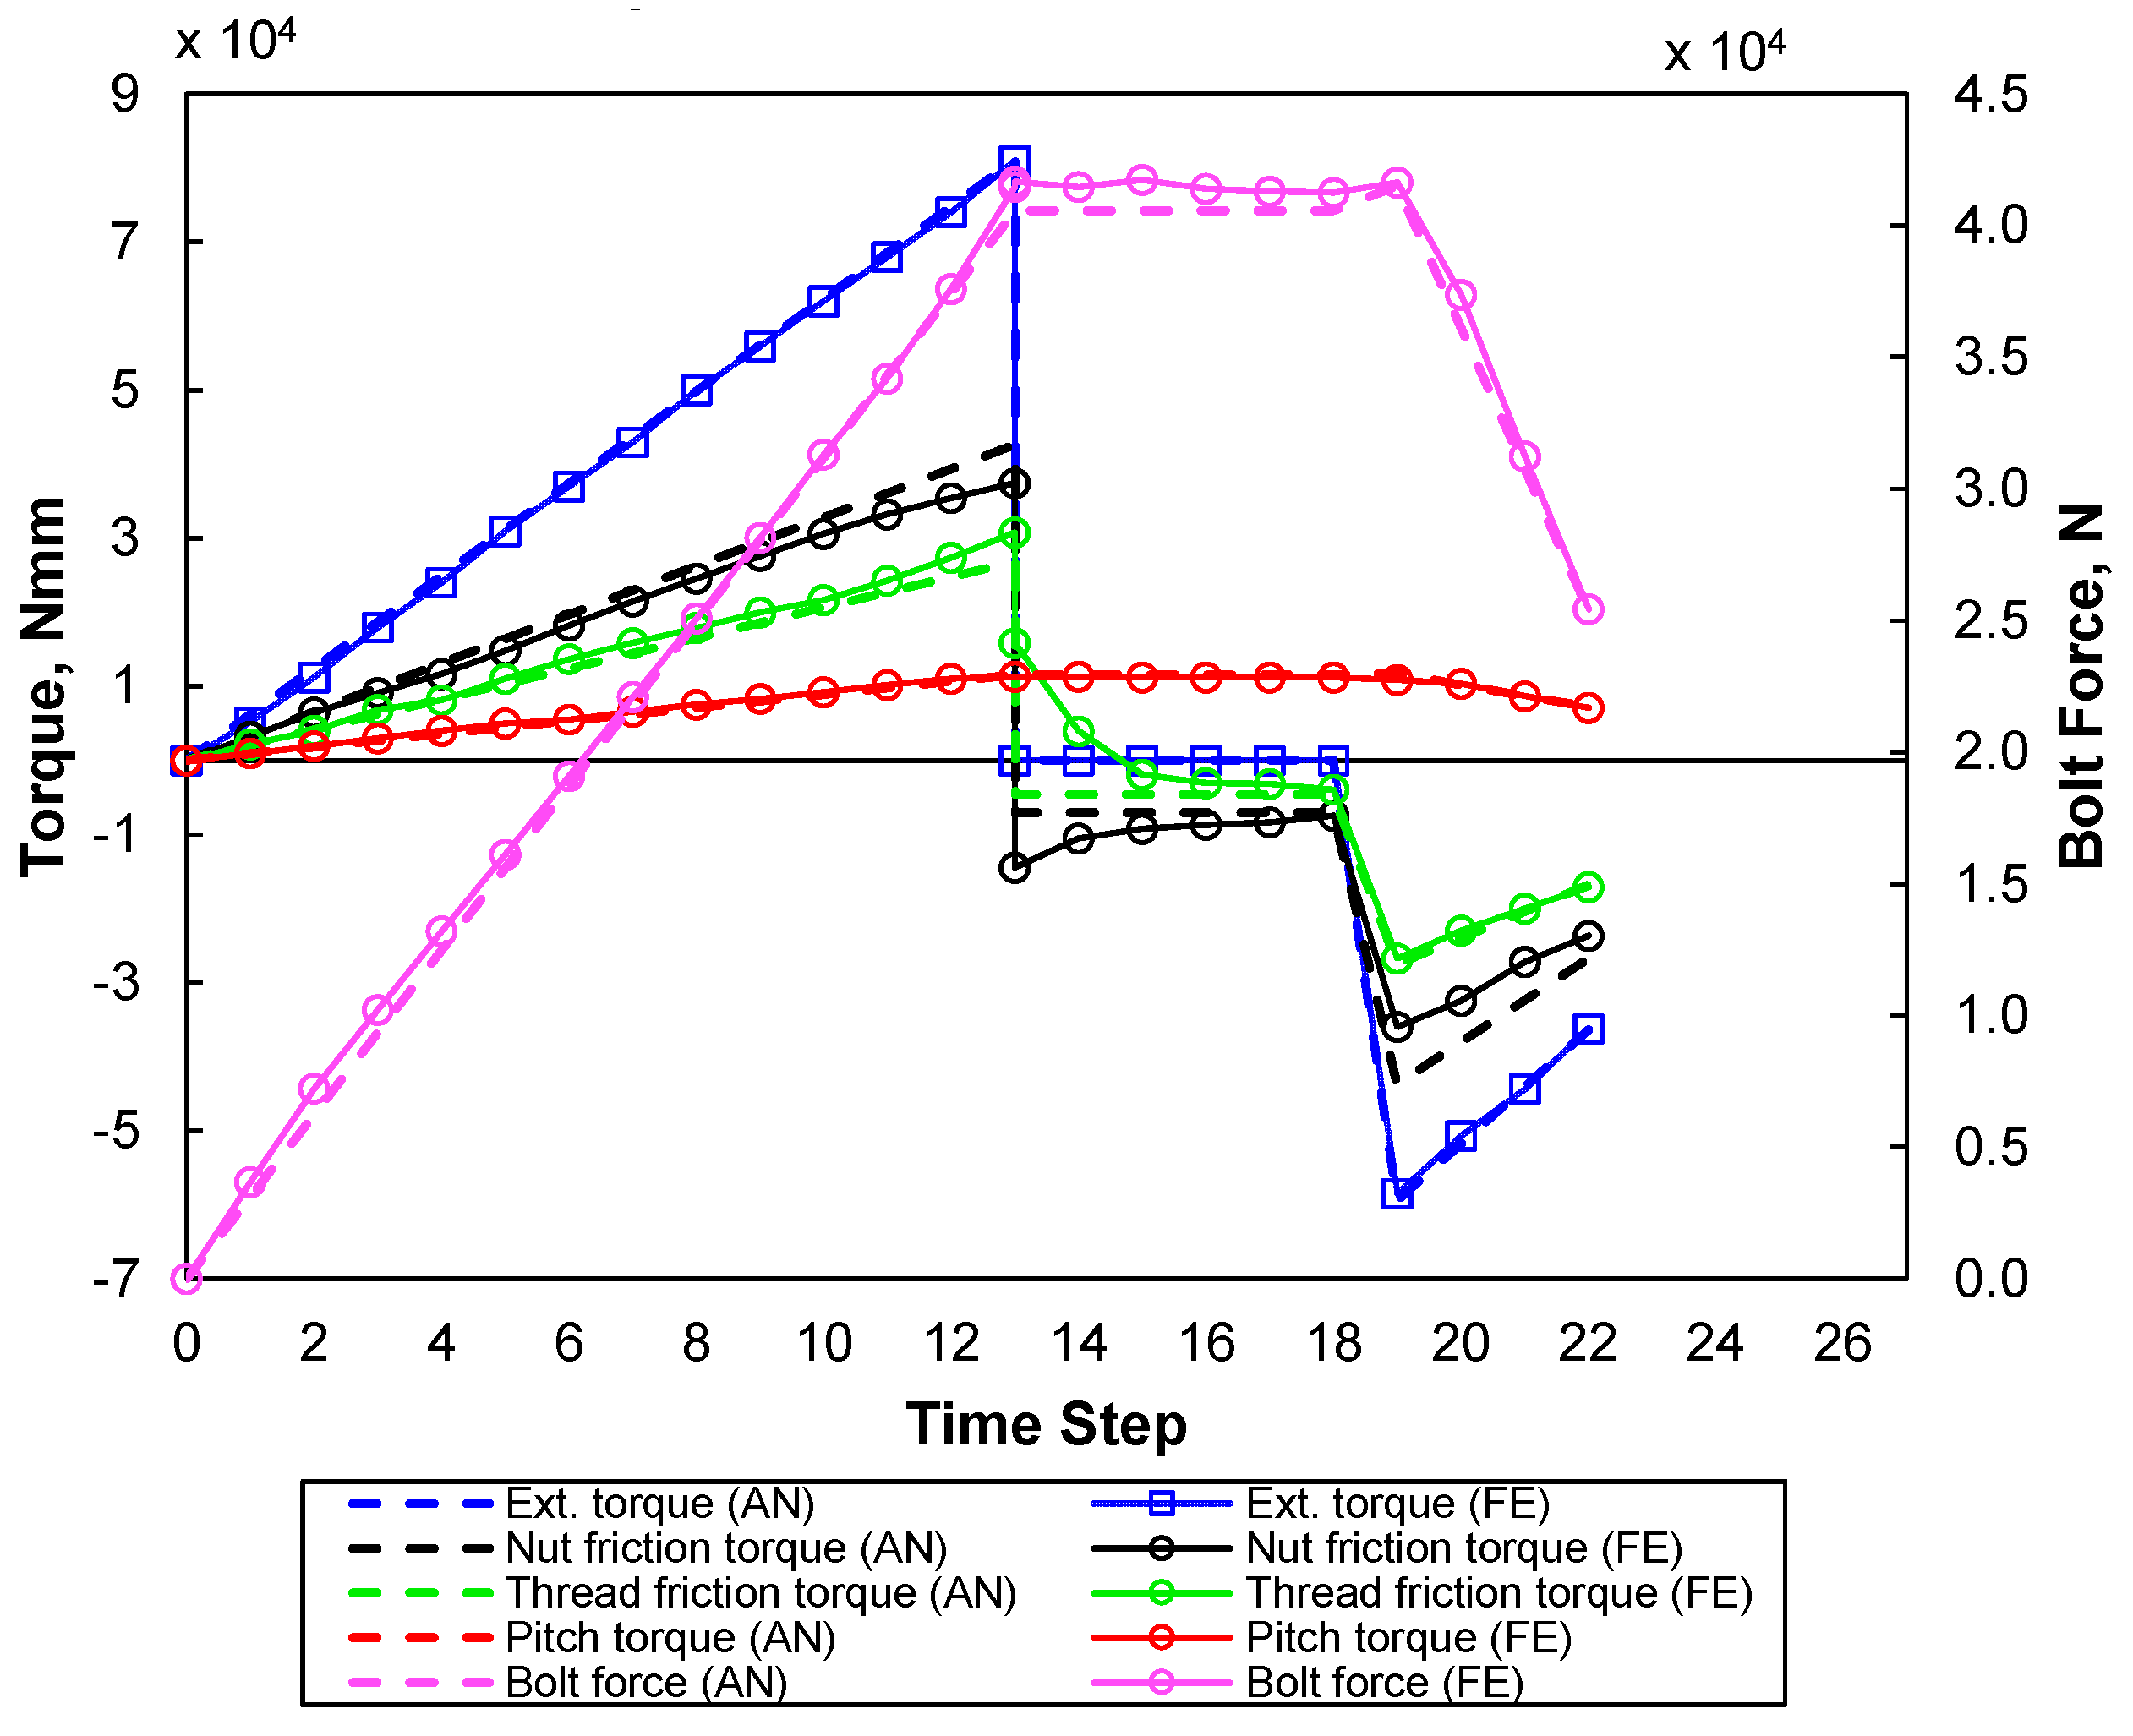
| Te | 81,083 | 81,000 | 0.1 | 59,474 | 58,479 | 1.7 |
| Tb | 42,708 | 37,476 | 14 | 26,719 | 23,697 | 12.7 |
| Tt | 26,894 | 30,813 | 12.7 | 16,828 | 17,075 | 1.5 |
| Tp | 11,487 | 11,344 | 0.9 | 7188 | 7138 | 0.7 |
Disclaimer/Publisher’s Note: The statements, opinions and data contained in all publications are solely those of the individual author(s) and contributor(s) and not of MDPI and/or the editor(s). MDPI and/or the editor(s) disclaim responsibility for any injury to people or property resulting from any ideas, methods, instructions or products referred to in the content. |
© 2024 by the authors. Licensee MDPI, Basel, Switzerland. This article is an open access article distributed under the terms and conditions of the Creative Commons Attribution (CC BY) license (https://creativecommons.org/licenses/by/4.0/).
Share and Cite
Rousseau, R.I.; Bouzid, A.-H. The Tightening and Untightening Modeling and Simulation of Bolted Joints. Machines 2024, 12, 654. https://doi.org/10.3390/machines12090654
Rousseau RI, Bouzid A-H. The Tightening and Untightening Modeling and Simulation of Bolted Joints. Machines. 2024; 12(9):654. https://doi.org/10.3390/machines12090654
Chicago/Turabian StyleRousseau, Rashique Iftekhar, and Abdel-Hakim Bouzid. 2024. "The Tightening and Untightening Modeling and Simulation of Bolted Joints" Machines 12, no. 9: 654. https://doi.org/10.3390/machines12090654
APA StyleRousseau, R. I., & Bouzid, A.-H. (2024). The Tightening and Untightening Modeling and Simulation of Bolted Joints. Machines, 12(9), 654. https://doi.org/10.3390/machines12090654