Article

Data Acquisition and Chatter Recognition Based on Multi-Sensor Signals for Blade Whirling Milling

School of Mechanical Engineering, Shandong University, Jinan 250061, China
*
Author to whom correspondence should be addressed.
Machines 2025, 13(3), 206; https://doi.org/10.3390/machines13030206
Submission received: 23 January 2025 / Revised: 26 February 2025 / Accepted: 28 February 2025 / Published: 2 March 2025
(This article belongs to the Special Issue Advances in Noises and Vibrations for Machines)

Abstract

:
Bladed components are essential in engines and propulsion systems, but their thin structures, complex geometries, and significant material removal rates during machining make them challenging to manufacture. This study investigates the chatter phenomenon in blade whirling milling, a promising method for improving machining efficiency. Multi-sensor signals, including vibration and acoustic emission signals, are collected during roughing and finishing machining. Time-domain, frequency-domain, and time-frequency features are extracted, filtered, and fused using principal component analysis (PCA) to retain relevant information while ensuring computational efficiency. The features are then input into an MLGRU-based chatter recognition model, incorporating a self-attention mechanism (SAM) for enhanced performance. The experimental results show that the proposed model achieves an average recognition accuracy of 89.16%, with a response time within 0.4 s, reflecting its effectiveness and timeliness in chatter detection. The findings also validate that the blade edge regions are more prone to chatter, especially during rough machining, due to their lower rigidity and greater sensitivity to external excitations.

1. Introduction

Bladed components have long been a key topic in manufacturing owing to their critical role in engines and propulsion systems. These components are inherently challenging to fabricate due to their complex geometries, thin structures, and high material removal rates in machining operations, making them a significant focus in the manufacturing domain. Typically, sophisticated machine tools with computer numerical control (CNC) are essential to their manufacture. Five-axis CNC machining with end mills is a well-established way to produce components of this kind [1]. However, the associated high costs of machinery and labor, along with relatively low efficiency, make it a costly way and limit its application in small- and medium-sized enterprises.
To lower the machining cost of certain bladed components, one of the proposed solutions is the adoption of the whirling milling process [2]. Whirling milling [3], also called whirling [4] or thread whirling [5], is the most productive method for producing helical surfaces such as those associated with worms and screws. Although whirling milling is primarily used for threaded parts, recent studies show that, with appropriate cutting tools and motion trajectories, it is feasible to produce the curved surfaces of certain blades on a CNC whirling machine tool. While the whirling milling method significantly improves the machining efficiency of certain bladed components, it also shows that the machining of blades is highly susceptible to chatter [6,7,8], which would aggravate the tool wear process and damage the surface quality of the machined part [9]. Therefore, online chatter detection [10,11,12] is necessary in order that chatter suppression can be applied in time to keep the cutting process stable.
Chatter is a self-excited vibration phenomenon in the cutting process that can significantly affect surface quality and result in a redistribution of frequency and energy, typically caused by an interaction between the cutting tool and the workpiece. Research methods for chatter detection can be divided into two categories: one is model-based [13,14], and the other is data-driven. The data-driven methods often cover signal processing and pattern recognition techniques. In recent years, chatter detection has been a research focus in machining processes, with a wide range of methodologies developed to monitor and suppress it. Data-driven methods, such as those utilizing time-domain, frequency-domain, and time-frequency features, have been widely adopted for online monitoring of milling operations [15]. A stability control system for turning was developed by Frumusanu [16], which dynamically adjusts the cutting edge setting angle, feed rate, and cutting speed based on real-time cutting force monitoring, effectively preventing chatter onset and optimizing machining performance. Munoa et al. [17] explores advanced signal processing techniques for chatter detection in high-speed machining. Li et al. [18] discusses the application of machine learning techniques for improving chatter prediction in milling. Chatter suppression techniques have also evolved, with methods like adaptive control and variable speed control being commonly used to minimize vibrations. A more recent study focuses on the role of cutting tool dynamics in mitigating chatter during high-precision milling operations [19]. A crucial aspect of machining bladed components is the feed rate control, particularly when using curved toolpaths, which are common in whirling milling [20,21]. Wang et al. [22] comprehensively reviewed the state of the art in machining chatter detection methods, detailing the experimental data acquisition techniques (such as sensors), signal processing methods (time-domain, frequency-domain, and time-frequency domain approaches), and the process of feature extraction and classification decision-making. Navarro-Devia et al. [23] present a thorough review of the advancements in chatter detection, particularly in milling processes. Their work outlines the use of various sensors for signal acquisition, signal processing methods such as time-frequency domain approaches, and feature extraction techniques for chatter detection. Despite the substantial amount of work carried out in chatter detection, suppression, and feed rate control, there remain significant gaps in adapting these techniques to whirling milling for bladed components. The novelty of this paper lies in the integration of multi-sensor signals for chatter detection in the specific context of blade whirling milling.
In this paper, data are acquired from the blade whirling milling using multi-sensor signals, and the time-domain, frequency-domain, and time-frequency features are extracted from the signals. The features are then subjected to selection and fusion, validating the applicability and timeliness of the proposed chatter recognition model in actual blade whirling milling processes. The scope of this paper is to present an advanced approach to chatter detection in the specific context of blade whirling milling. This study aims to integrate multi-sensor signals for chatter detection. The proposed model is validated in real-world blade whirling milling processes, with a focus on its potential applicability, timeliness, and efficiency in suppressing chatter during machining. This research holds significant potential for the future realization of more precise chatter monitoring and control.

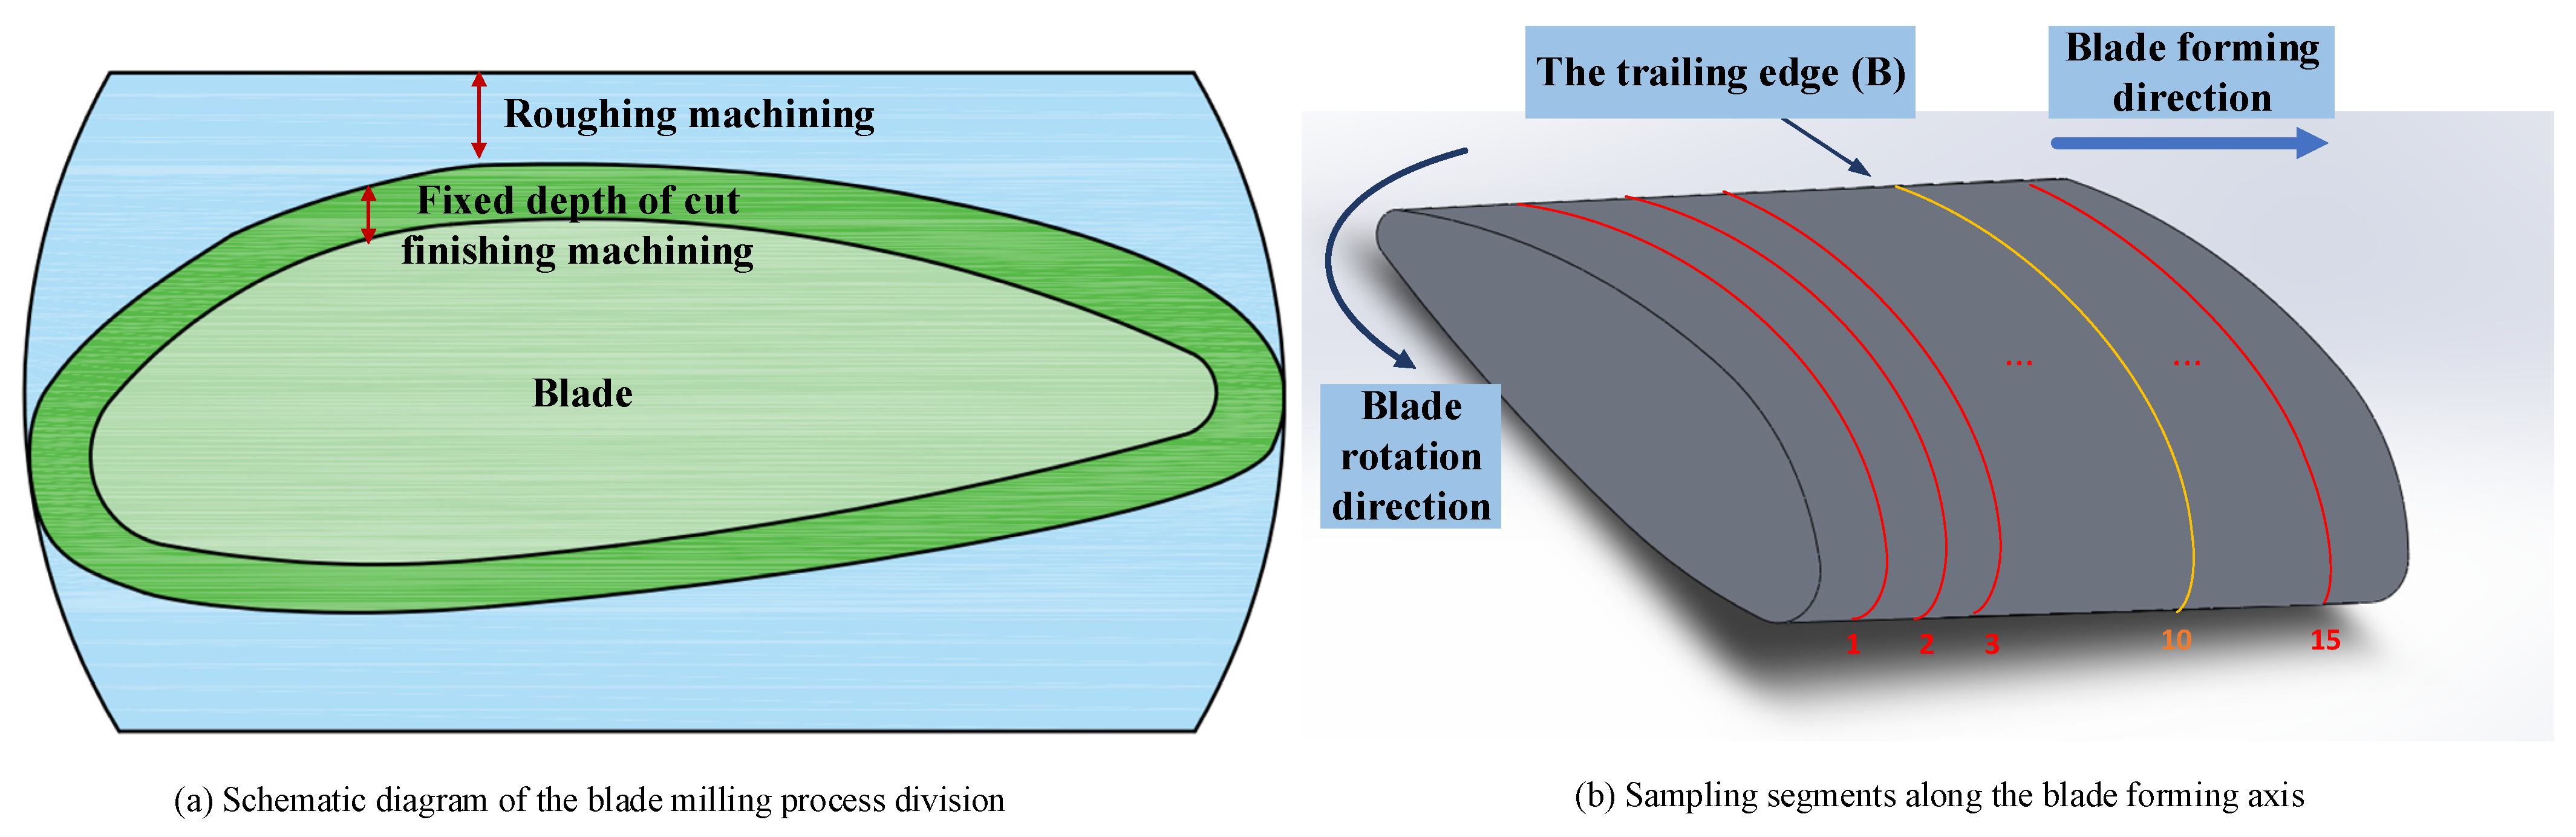
2. Overview of the Whirling Milling Process of Blades

The blade whirling operation is performed on a CNC whirling machine that contains at least a rotational axis C for the workpiece and two linear axes X and Z for the cutter’s feeding motion [24]. The whirling machine is basically a CNC turning center with a whirling attachment (also called whirling unit, or whirling head) mounted in place of the turret and tool holders. The whirling unit, however, differs from that of a typical thread whirling machine in that: (a) inserts with curved cutting edges are employed instead of form cutters (the cutter profile is designed based on the workpiece profile); (b) the inserts are mounted on the outside instead of the inside of the tool ring.
In the machining process as shown in Figure 1, the tool ring carrying the inserts (referred to as the cutting tool hereafter) rotates at a high speed, providing the primary cutting movement. The workpiece (blank) is clamped in the chuck and slowly rotates around the spindle (C-axis), while the cutting tool moves in a linear feed along the X and Z directions. The center O 1 of the cutting tool keeps in the same horizontal plane as the rotational axis of the workpiece. To realize the three-axis machining of the blade, the radial feed in the X direction must comply with the angular position of the workpiece to keep the spinning cutting tool engaged with the curved surface of the blade. The feed motion in the Z direction corresponds to the rotational speed of the workpiece to form the entire blade. This does not only greatly improve the machining efficiency of the blade, but also reduces the requirements for machine tools, shortens the lead time, and lowers the costs.
Due to the uneven surface of the blade, cutting thickness varies over time, often accompanied by a significant material removal rate in CNC machining. As a whole, the work is prone to vibration during the machining process due to its thickness and poor rigidity. Nonetheless, there is a significant difference in thickness between the back and edge regions. The blade surface can be divided into four regions: the middle parts of the upper surface (A), the trailing edge (B), the middle part of the lower surface (C), and the leading edge (D). Theoretically, regions B and D, with their thinner profiles, lower rigidity, and greater distance from the blade’s rotational center, are more sensitive to external excitations and thus more prone to chatter. In contrast, regions A and C, which feature greater thickness and smaller curvature variations, exhibit higher rigidity and consequently more stable machining behavior.
In actual blade machining, chatter is often accompanied by intense vibrations and a deterioration in surface quality, typically occurring in areas with significant curvature changes and reduced thickness, such as regions A and C. The chatter process is generally characterized by increased vibration amplitude and a shift towards higher frequencies.

3. Data Acquisition

3.1. Experimental Setup

This experiment employs a CK6163E-3000 external whirling milling machine from GSK CNC Equipment Co., Ltd., Guangzhou, China (Figure 2), with the relevant parameters summarized below. The workpiece material is 5052-H112 aluminum alloy, with the raw material dimensions being 100 mm × 60 mm × 30 mm, which was processed from a 100 mm × 60 mm bar stock. The external whirling milling cutter [25] used in the experiment is shown in the lower left of Figure 2, equipped with six rhombic milling inserts (DCMT11T304-DM), each with a cutting edge radius of 0.4 mm. The rotational diameter of the mounted insert tips is 125 mm.
The machine tool is equipped with a C-axis speed range of 0–25 r/min and a cutting speed range of 25–1000 r/min. It supports a maximum workpiece diameter of ϕ630 mm on the bed and ϕ320 mm on the tool holder, with a maximum workpiece length of 3000 mm. The repeated positioning accuracy is 0.012 mm for the X-axis and 0.015 mm for the Z-axis. The tool holder allows a maximum lateral travel of 300 mm (X-axis), while the saddle provides a maximum travel of 3000 mm (Z-axis). The minimum feed increment is 0.001 mm for both axes, and the feed range extends from 1 to 300 mm/min for the X-axis and 1–3000 mm/min for the Z-axis. Additionally, the spindle bore taper is 1:20, and the machine operates with a GSK980TDi CNC system.
The signal acquisition hardware consists of an accelerometer (1A102E), an acoustic emission sensor (8152C1), and a high-speed universal data acquisition system from ELSYS. Considering that the vibrations of the tool and workpiece differ in each direction from others, this study employs a triaxial accelerometer to analyze the chatter state in different directions. The sensitivities of the accelerometer in the X, Y, and Z directions are all 9.8 mV/g, with a response frequency range of 1 to 10 kHz. The sensitivity of the acoustic emission sensor is 48 V/(m/s), and the response frequency range is 100 to 900 kHz.
The accelerometer is firmly attached to the fixture with adhesive, ensuring continuous machining so as to prevent the data transmission lines from tangling and the sensor from detaching, as the workpiece must keep rotating during the whirling milling process of the blade. To enhance signal intensity and quality, the sensors are positioned as close as possible to the cutting zone. The magnetic acoustic emission sensor is placed on the whirling unit near the cutting area, considering that the workpiece (5052-H112) aluminum alloy is non-magnetic.

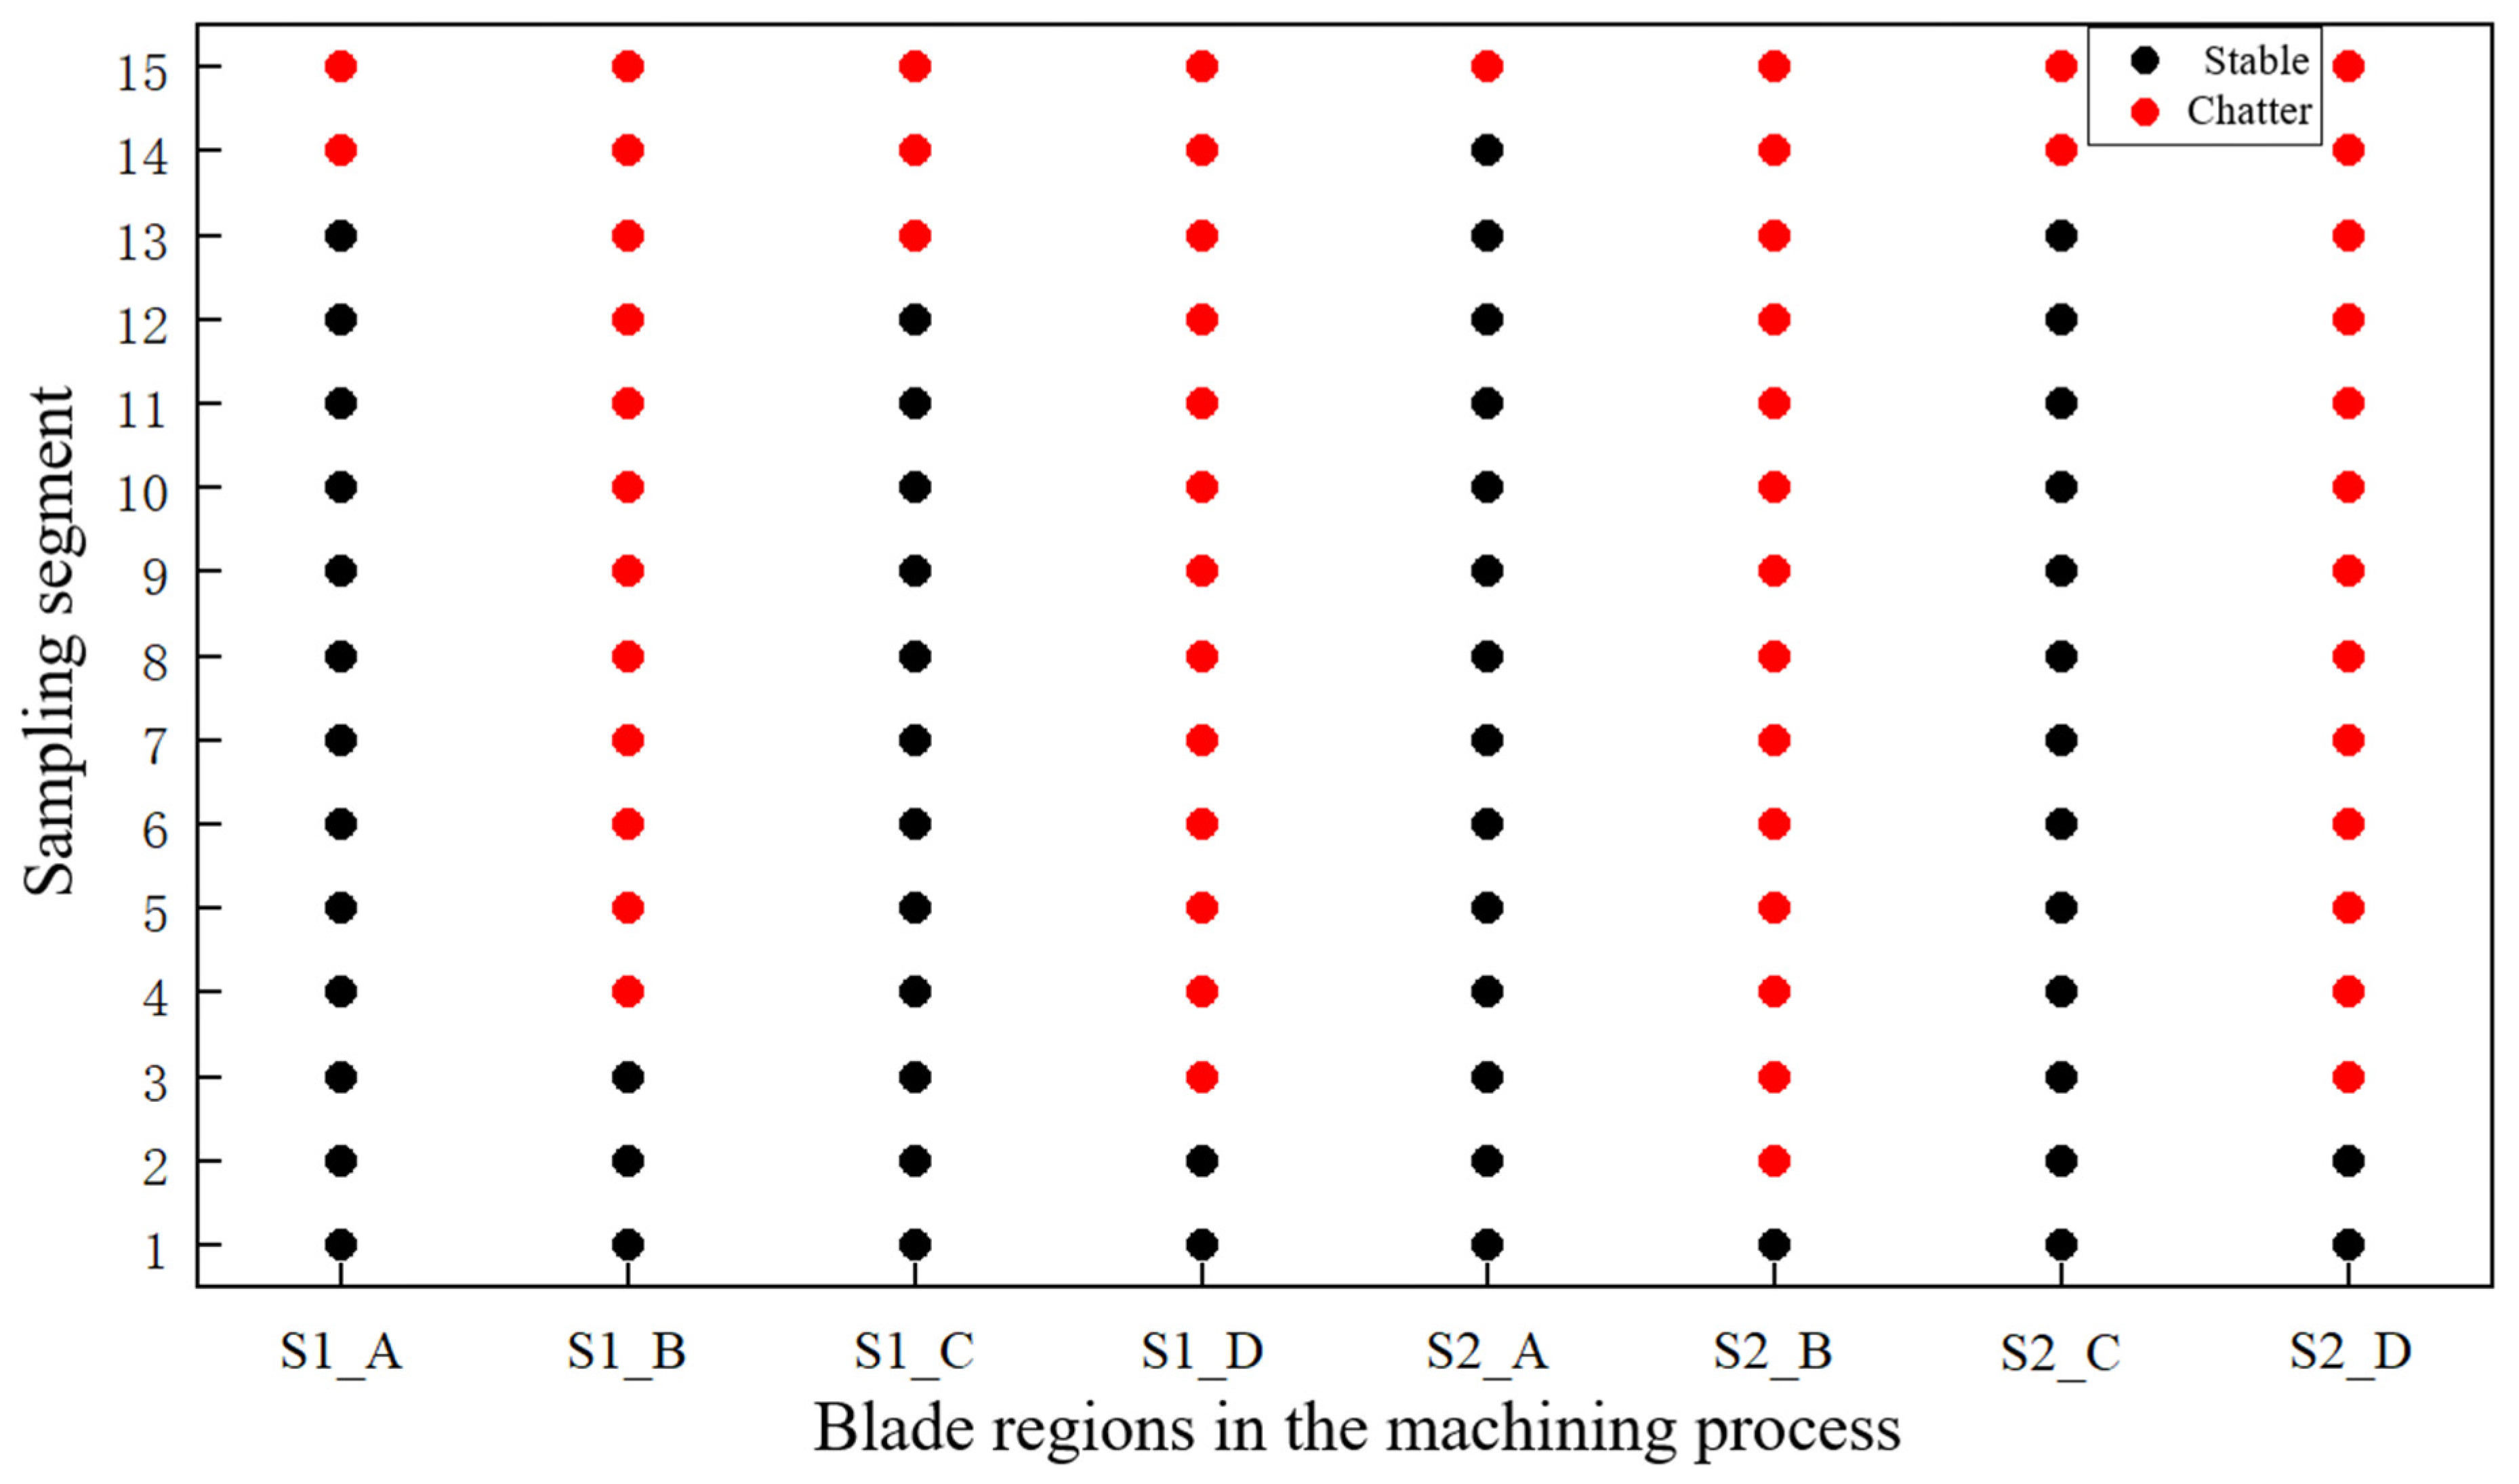
3.2. Experimental Cuts and Data Acquisition

The whirling milling process of the blade is generally divided into two stages: roughing machining and finishing machining. In this study, the cutting experiment is also carried out in two stages as shown in Figure 3a. The roughing operation starts with the raw workpiece as shown in Figure 4a and leaves an allowance of 3 mm, then the finishing operation follows to produce the blade surface, as shown in Figure 4b. The cutting conditions derived from the experience of previous experiments are given in Table 1. Considering that cutting parameters have a significant impact on the vibration of the blade, the milling state in each operation is analyzed by varying the feed rate in this experiment. Specifically, for sampling segments 1–15 in each stage, the feed rate in the X direction is set sequentially to 10, 20, …, 150 mm/min.
Considering that milling operations can take several hours due to the multiple steps involved and possible post-processing required to ensure accuracy and quality, 15 sampling segments are evenly distributed along the workpiece’s axial direction (Z-axis). Repeated sampling at each stage helps to minimize the impact of external factors, such as environmental influences, on the experimental results. The distance between each sampling segment is 5 mm, and the sampling duration for each segment matches the time that it takes for the workpiece to complete one full rotation.
The specific steps for the whirling milling and signal acquisition experiment are shown in Figure 5.
Step 1: Prepare the 3D model of the blade to be machined and import it into the CAM software UG 12.0. Set the entry and exit points, as well as the toolpath, to obtain the spatial trajectory of the tool contact points during the machining process. Generate the CNC program that is suitable for the experimental machine tool after processing.
Step 2: Prepare the cutting tool and workpiece. Install the accelerometer and acoustic emission sensor on the pin at one end of the machine tool, ensuring that the acoustic emission sensor is positioned as close as possible to the cutting area on the milling head platform. Setup the parameters for the data acquisition system, such as sensor sensitivity and a sampling frequency of 20 kHz.
Step 3: Begin the roughing machining of the blade blank after tool setting, and adjust the machining parameters according to Table 1. During the whirling milling process, adjust the feed rate in the X direction to the corresponding value for that segment when the tool reaches the sampling segment. Start multi-signal data acquisition, with the sampling duration equal to the time required for the workpiece to complete one full rotation around the C-axis. Restore the X-direction feed rate to 100 mm/min and stop data acquisition after sampling. When the tool reaches the next sampling segment (the tool moves 5 mm in the Z-direction), repeat the data acquisition process until a preliminary blade shape is achieved.
Step 4: Replace the worn tool used in roughing machining and proceed with finishing the machining. Adjust the machining parameters according to Table 1 and follow the same procedure as in Step 3 for data acquisition.
Finally, label the data that were acquired from roughing and finishing machining as S1 and S2, respectively, and save them for further analysis.

4. Chatter Recognition Validation

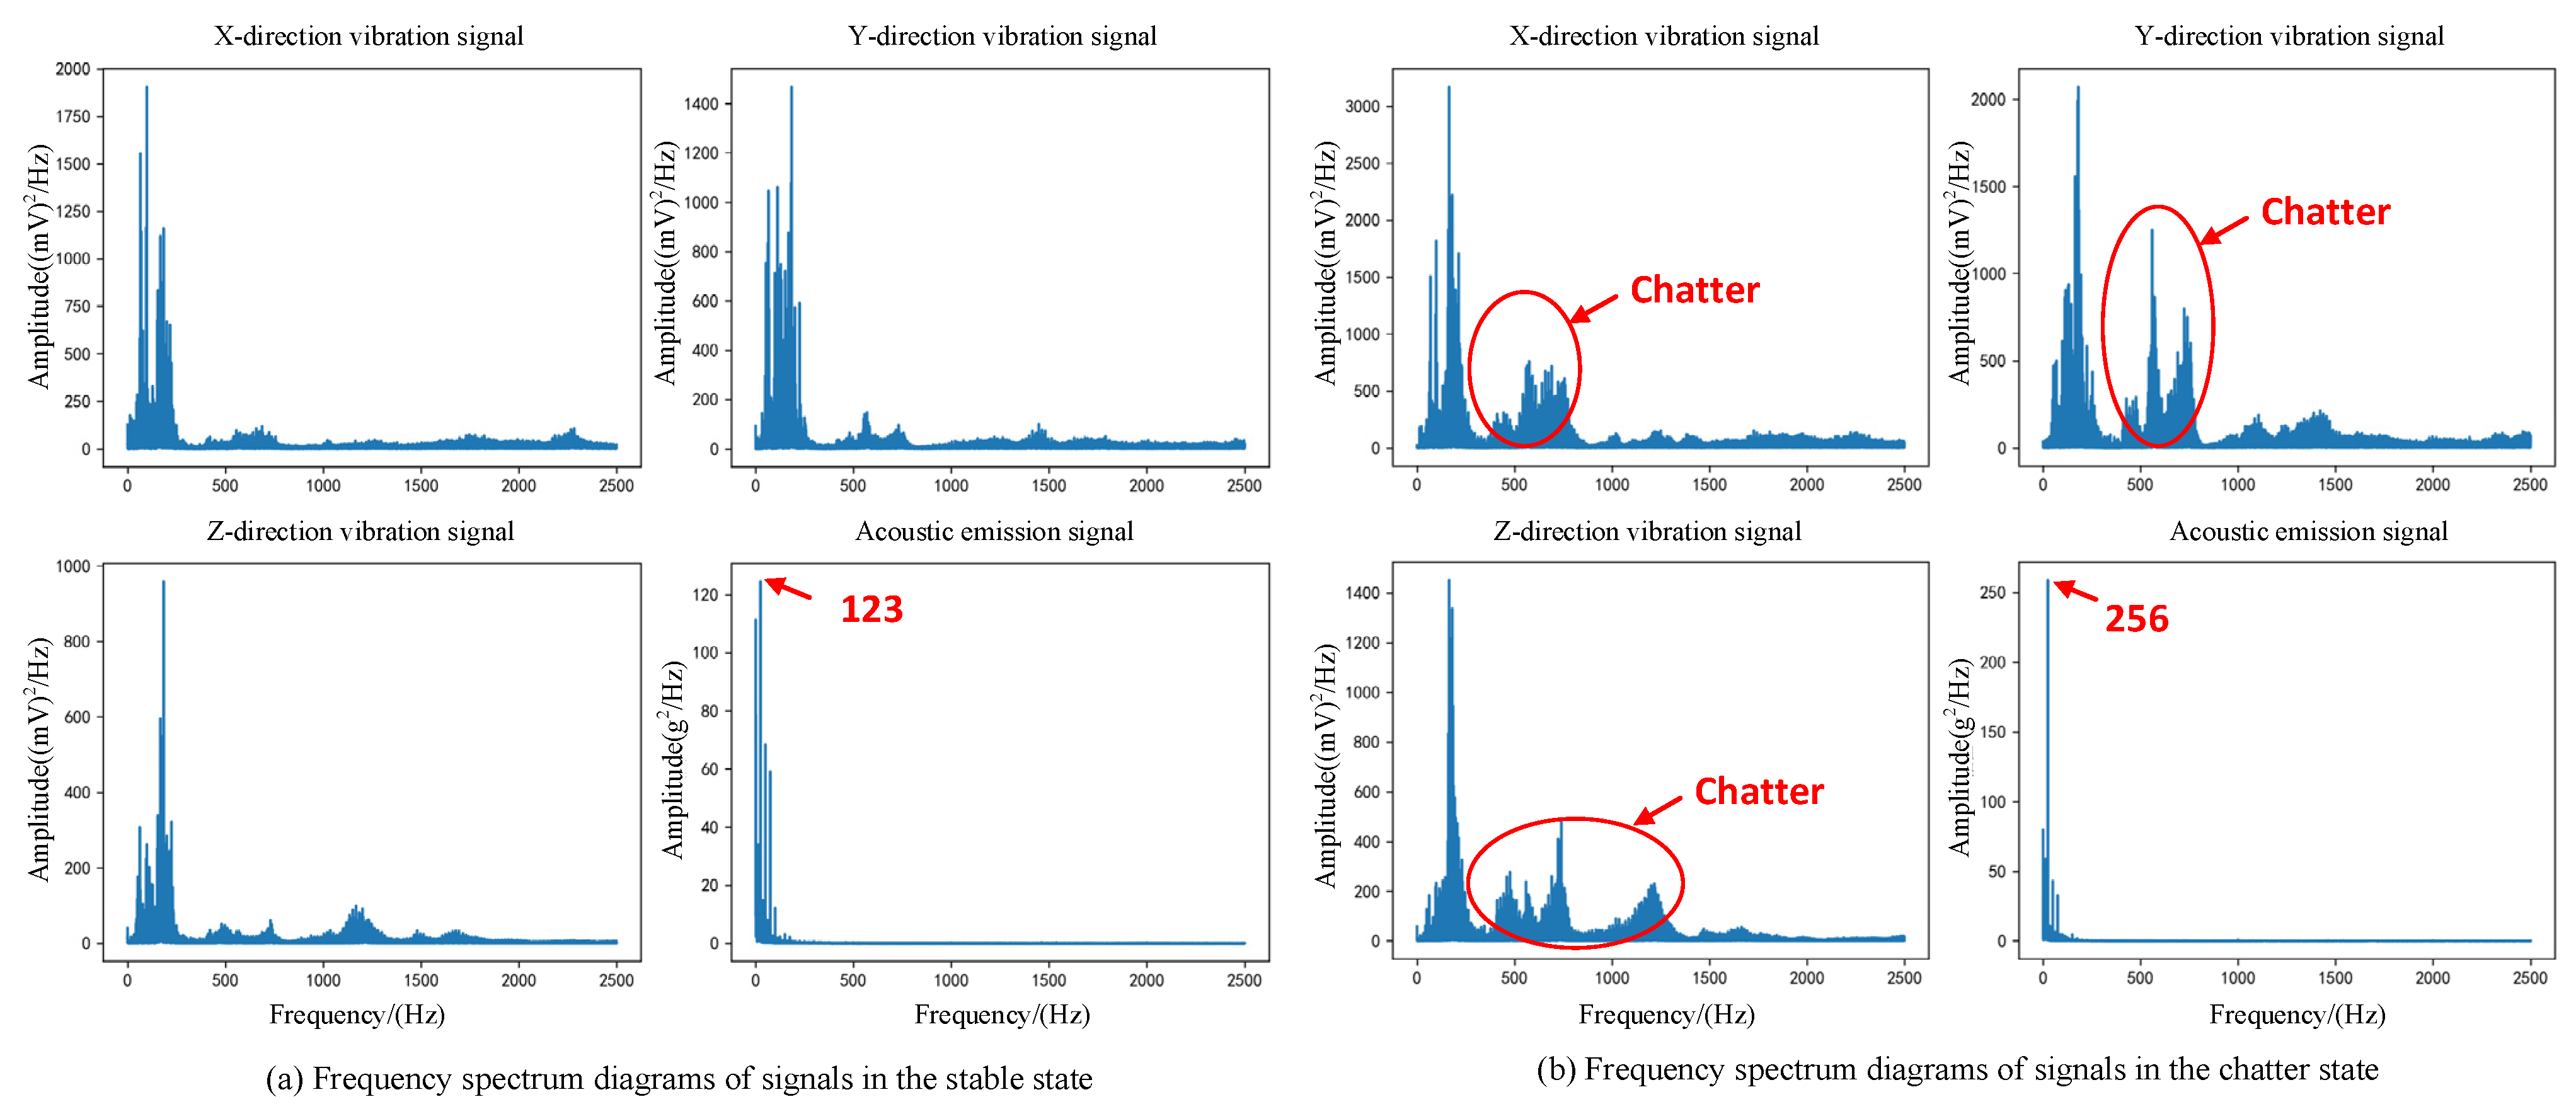
4.1. Multi-Signal Feature Selection and Fusion

Based on the dataset obtained from the milling experiments, six time-domain and frequency-domain features are extracted for each signal. These features include time-domain indicators such as peak value, standard deviation, kurtosis factor, and margin factor, as well as frequency-domain indicators like centroid frequency and mean square frequency. To achieve finer frequency division and better frequency resolution, a three-level wavelet packet decomposition is performed, with the db3 wavelet basis function selected. For each signal, the energy features of the eight node signals are calculated according to Equations (1) and (2), resulting in the energy feature set E = E 1 , E 2 , E 3 , , E 8 .
x j + 1 , ( 2 i 1 ) = k = h k [ x j , i ( 2 t k ) ] x j + 1 , ( 2 i ) = k = g k [ x j , i ( 2 t k ) ]
E x j , i = x j , i ( t ) 2 d t
where g ( k ) and h ( k ) represent the impulse response functions of the high-pass and low-pass filters, respectively, and x j , i denotes the wavelet coefficient at the j -th layer and i -th node.
The time-domain, frequency-domain, and wavelet packet node energy features (time-frequency domain) of the sensor signals during the milling operations change with different milling conditions. However, not all features are highly correlated with the chatter state. Using all features as inputs to the model may lead to information redundancy, which reduces computational efficiency and increases the risk of overfitting, ultimately degrading the model’s performance. Therefore, it is crucial to effectively monitor the milling state to extract the relevant information that is associated with workpiece chatter. In this study, the extracted signal features are first filtered, and then principal component analysis (PCA) is used to integrate the selected features. This approach improves the efficiency and performance of the chatter detection model, and also retains the information that is most relevant and highly correlated with both milling states.
By extracting all time-domain features, frequency-domain features, and wavelet packet node energy features from a single sensor, a feature matrix can be constructed as follows: F = f 1 , f 2 , f 3 , , f 14 , where f 1 , f 2 , f 3 , · · · , f 14 represent the six time-domain and frequency-domain features, including peak value, standard deviation, margin factor, kurtosis factor, centroid frequency, and mean square frequency, as well as the eight node signal energy features E 1 , E 2 , E 3 , , E 8 . If all features are directly used as inputs to the model, it may lead to information redundancy, thereby reducing the computational efficiency. To improve the computational efficiency, features are selected by setting an accuracy threshold of 60%, removing some underperforming features. A threshold of 60% accuracy is applied to improve computational efficiency and select features, resulting in the remaining 42 features, which are as follows: F x = f 1 , f 2 , f 5 , , f 14 , F y = f 1 , f 2 , f 5 , f 6 , , f 14 , F z = f 1 , f 2 , f 5 , f 6 , f 8 , f 14 , and F a e = f 1 , f 2 , f 3 , f 4 , f 10 , f 11 , f 14 .
Next, PCA is applied to fuse these features, selecting those that better represent chatter information. For the X-direction vibration signal, after feature selection, the 12-dimensional feature set F x = f 1 , f 2 , f 5 , , f 14 is transformed into a lower-dimensional space using PCA, yielding the principal components. In this study, the seven eigenvalues corresponding to the cumulative contribution rate greater than 95% are selected and denoted as F p x = f p x 1 , f p x 2 , f p x 3 , , f p x 7 . PCA is similarly applied to the features of other sensors, and the principal components with a cumulative contribution rate greater than 95% are selected. The resulting feature sets are as follows: F p y = f p y 1 , f p y 2 , f p y 3 , , f p y 6 , F p z = f p z 1 , f p z 2 , f p z 3 , , f p z 7 , and F p _ a e = f p _ a e 1 , f p _ a e 2 , f p _ a e 3 .

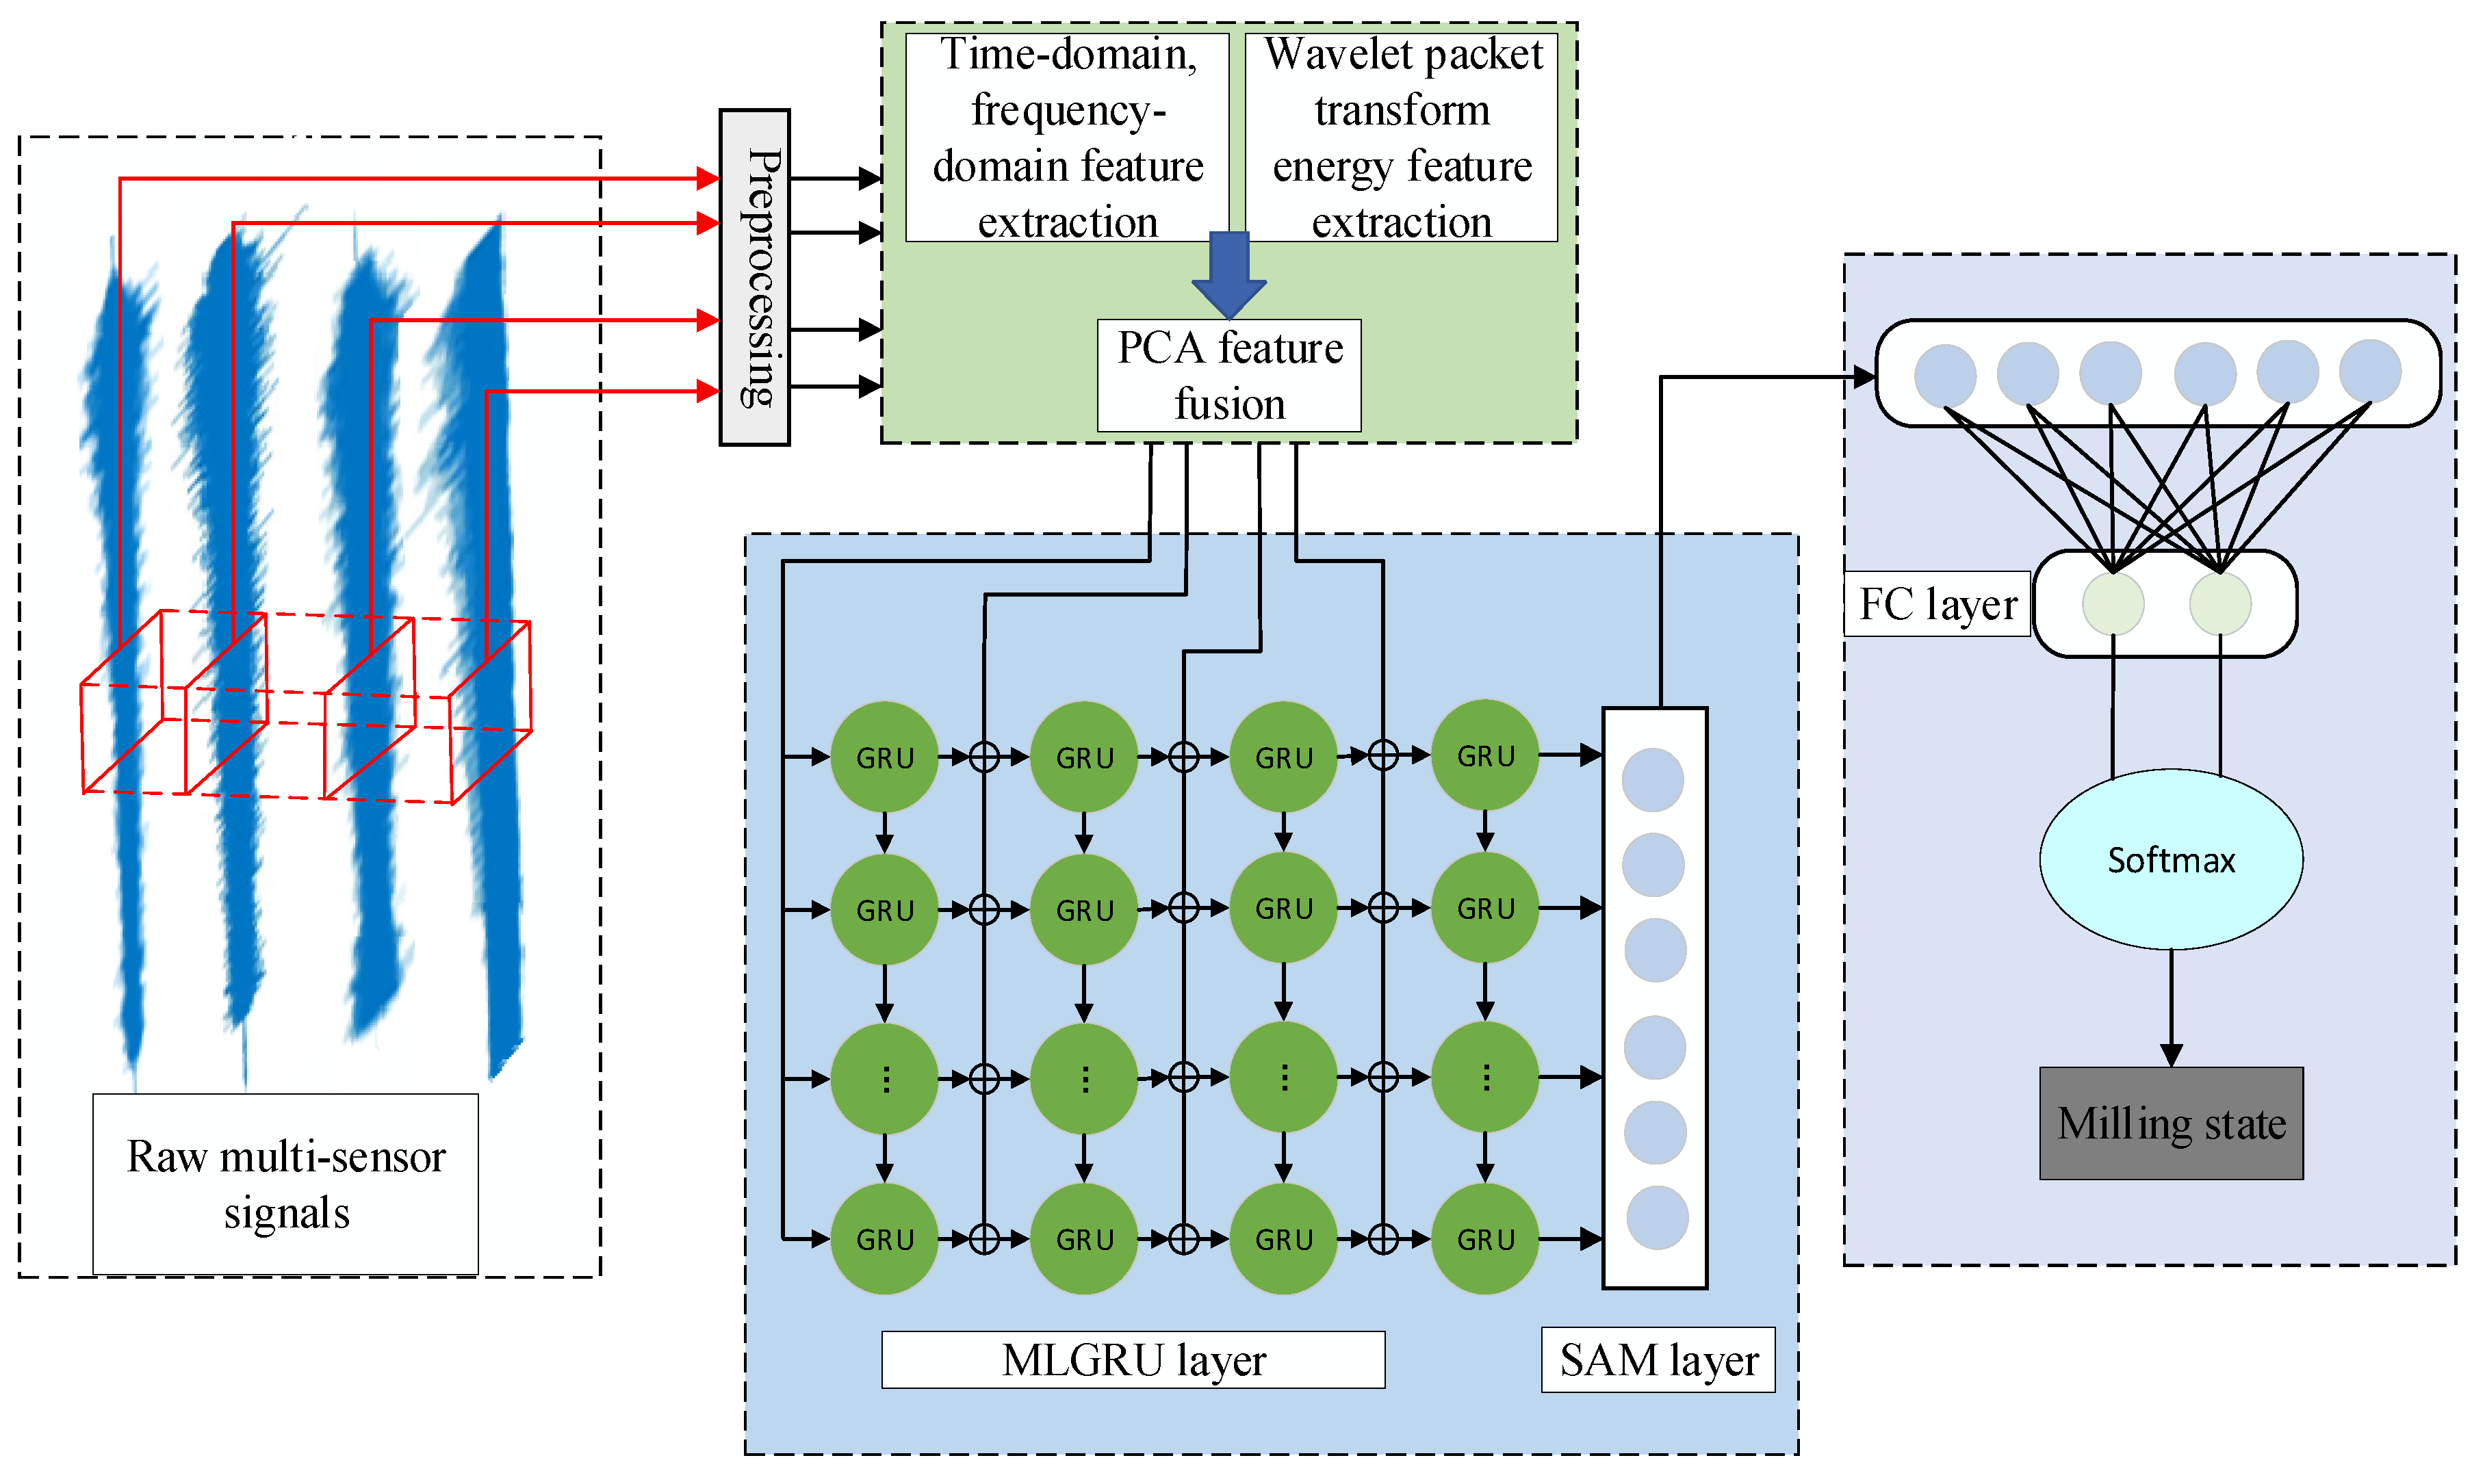
4.2. Chatter Recognition Model Based on PCA-MLGRU-SAM

In this study, a chatter recognition model based on multi-layer gated recurrent units (MLGRU) and principal components analysis (PCA) is employed, which uses deep networks to obtain from the sensor in-depth information related to the milling state of the workpiece [26]. Multi-source sensor signals collected during the machining process are first fused according to signal type and then used as inputs for a multi-layer GRU (Gated Recurrent Unit) to train a model that capable of detecting and identifying milling states.
Six chatter recognition models are compared to validate the superiority of the proposed PCA-MLGRU-SAM model in feature fusion and deep network structure. These include traditional machine learning models (SVM, BPNN), deep learning models (CNN, GRU), and hybrid models incorporating multi-layer RNNs (PCA-MLLSTM and PCA-MLGRU-SAM). Compared to SVM and BPNN, which use conventional feature fusion methods and achieve an average recognition accuracy of approximately 82%, deep learning-based models demonstrate superior performance. In particular, the proposed PCA-MLGRU-SAM model achieves an average recognition accuracy of 91.15%. This model effectively extracts temporal features through multi-layer GRUs and optimizes feature selection using PCA dimensionality reduction and a self-attention mechanism (SAM), enhancing its capability to perceive chatter states. Furthermore, an analysis of training and testing time indicates that PCA-MLGRU-SAM maintains high accuracy while reducing computational time compared to PCA-MLLSTM, achieving a favorable balance between recognition accuracy and computational efficiency. Therefore, the proposed model exhibits significant advantages in multi-sensor chatter recognition tasks and meets the real-time requirements for online detection.
The proposed chatter recognition model comprises four main components, as shown in Figure 6. The original signal is sliced and each segment is labeled for classification, completing the preprocessing step at the initial stage. The preprocessed data are then split into training and testing sets, which serve as input for the model. Subsequently, time-domain, frequency-domain, and wavelet packet transform features of the multi-sensor signals are analyzed to select key features that represent the milling state.
The specific process of the algorithm is as follows: First, the time-domain, frequency-domain, and wavelet packet transform-based node energy features of the vibration signals, as well as the acoustic emission signals, are calculated, resulting in feature vectors. Then, the optimal feature value of each feature vector is computed to determine the corresponding recognition accuracy. Features with poor performance are filtered out. Next, PCA is applied to fuse the features, and the principal components with a cumulative contribution rate greater than 95% are selected to construct the feature datasets for each sensor. These feature datasets are then input into the MLGRU network to extract deep information and temporal features. The key information is further extracted through the self-attention mechanism layer (SAM layer). Finally, the milling state is identified through the fully connected layer (FC layer) and Softmax classifier.

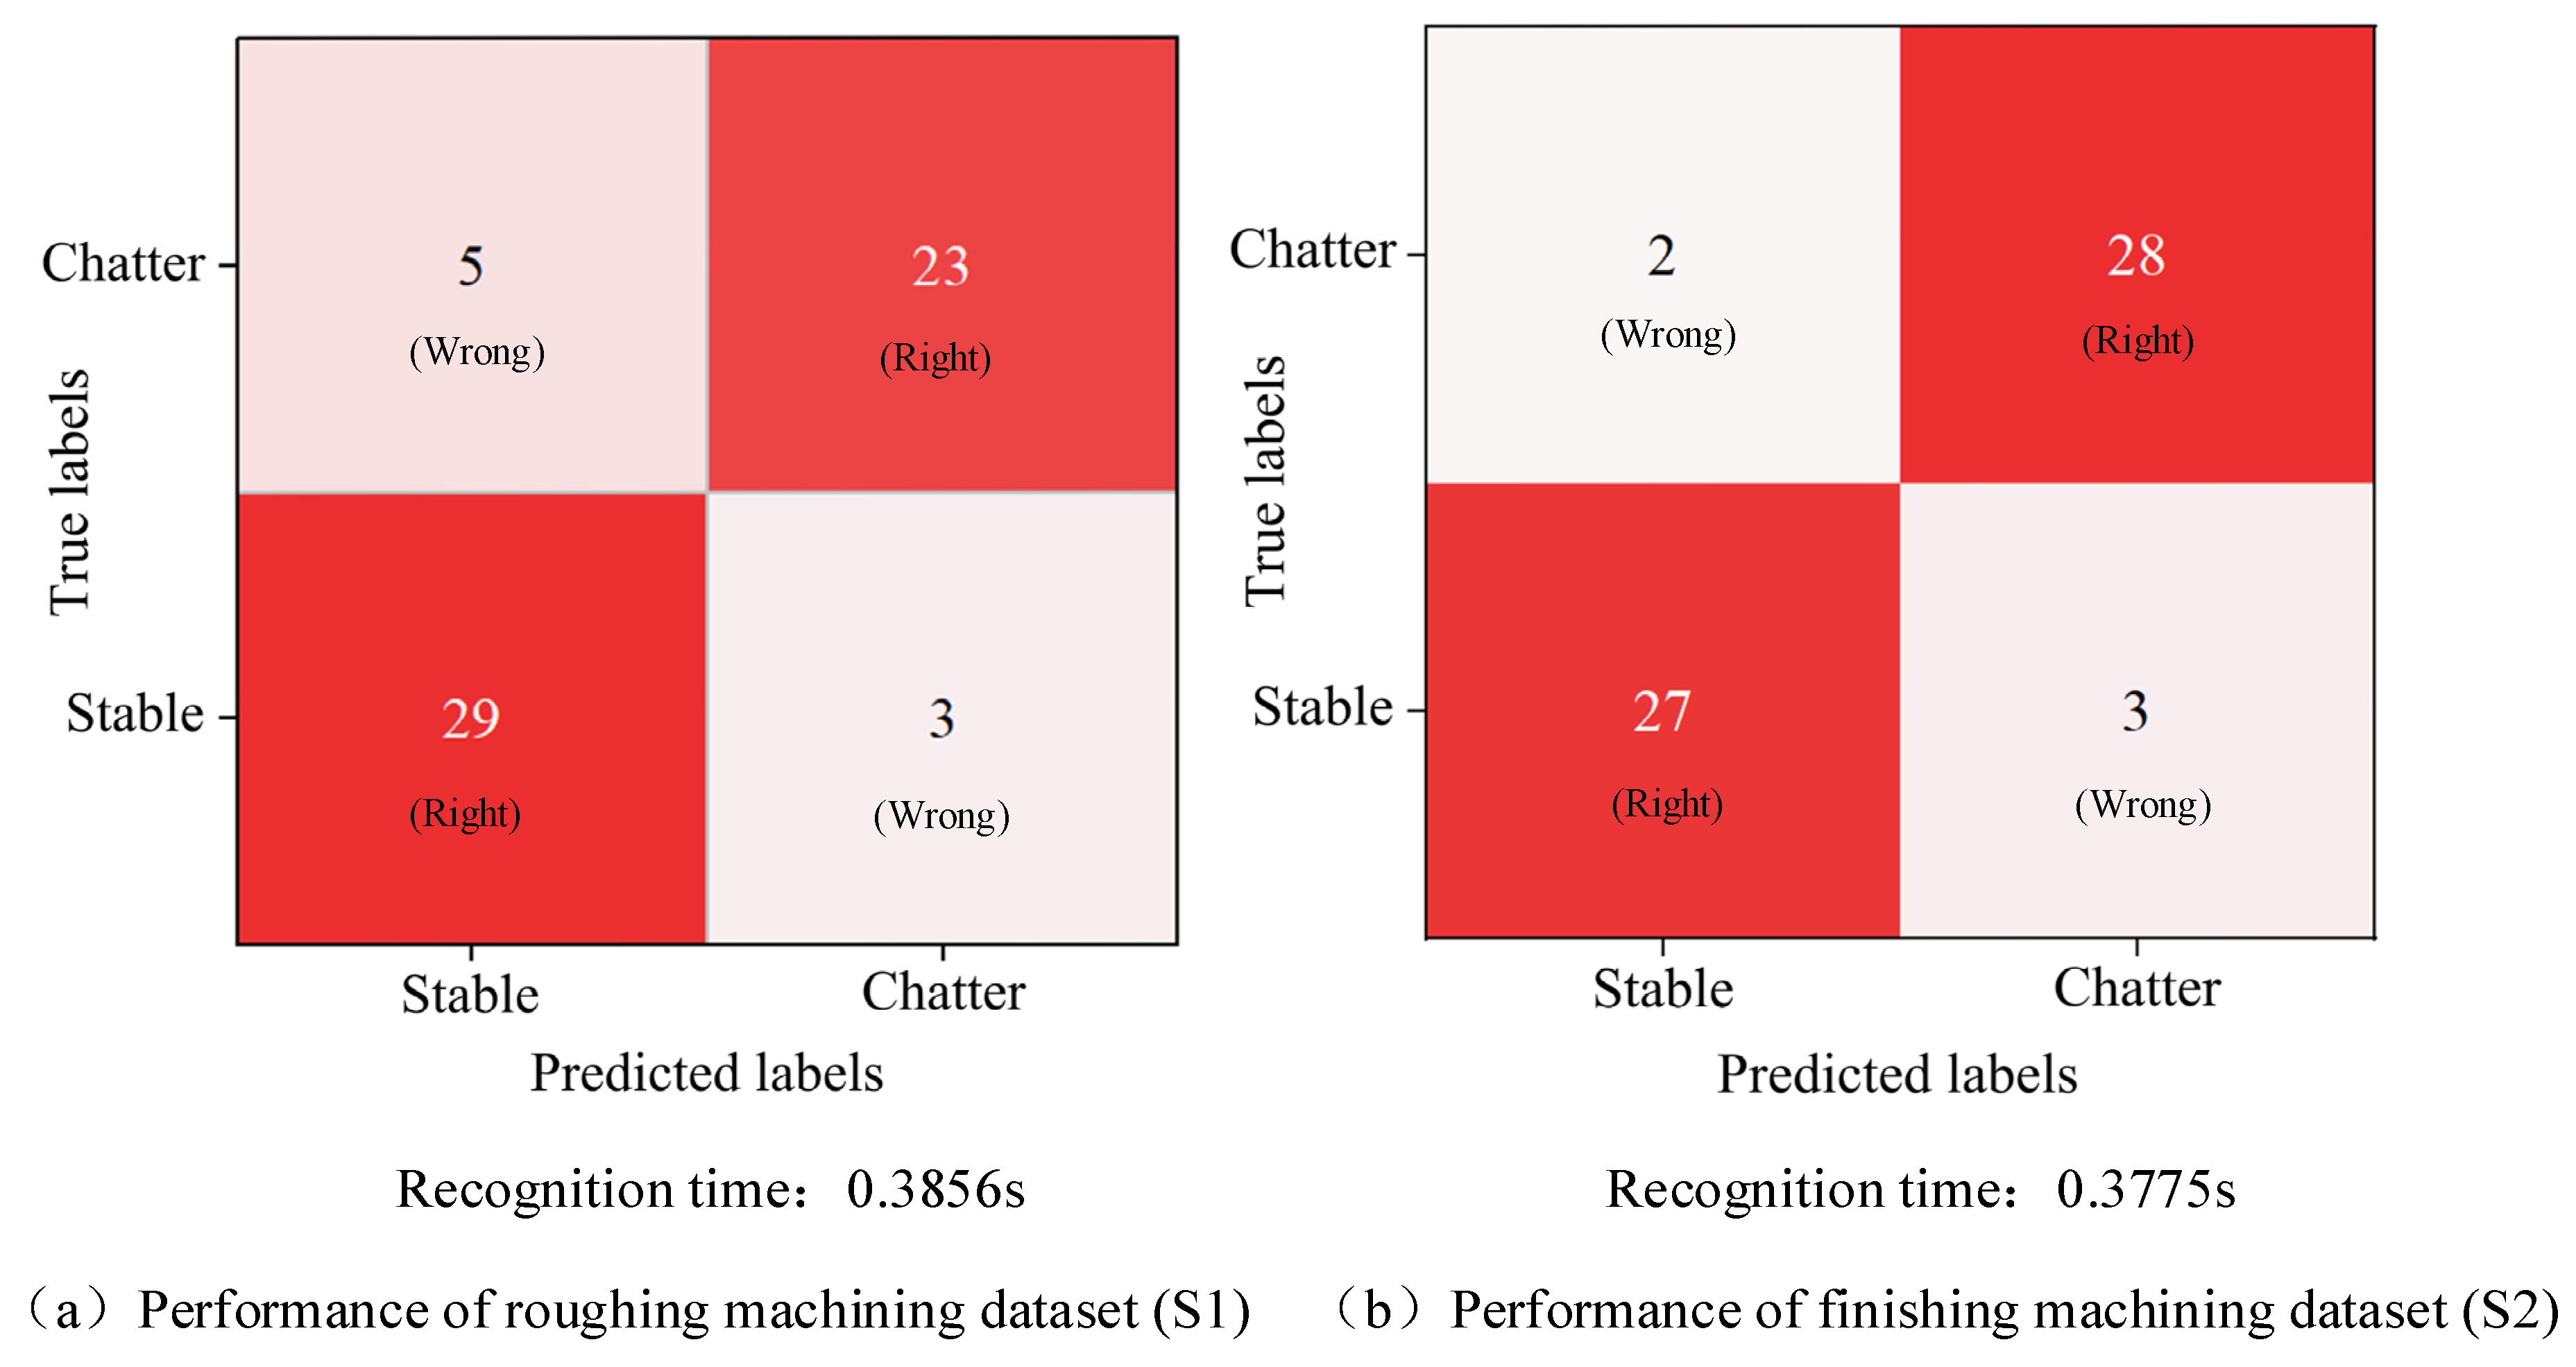
4.3. Chatter Recognition Result Analysis

This study analyzes experimental data from the 10th sampling segment of the roughing machining process. Figure 7 provides the time-domain plots of vibration signals in different directions and the acoustic emission signal near the trailing edge (Figure 3), while Figure 8 illustrates the FFT spectra of these signals for both machining states. Each section of the blade (A, B, C, D) is sampled 15 times; 60 data samples are obtained for both roughing and finishing machining operations. Based on the surface condition of the formed blade and the signal characteristics, the raw signals from each sampling are classified into segments representing either stable or chatter states. Because the lengths of the data segments from these states vary and the machining state differs for each blade section in every sample, signal segments of equal length are extracted for each state type. Figure 9 illustrates the distribution of sample states.
The time-domain plots reveal that vibration signal amplitudes in all directions are low in the stable state but increase significantly in the chatter state. The acoustic emission signal displays periodic variations in the stable state but lacks any discernible pattern in the chatter state. A further comparison of the frequency spectra shows that the frequency bands of vibration signals in the chatter state shift significantly and include continuous high-frequency components. In contrast, the acoustic emission signal in the chatter state exhibits low-frequency components with higher amplitudes. Significant changes are observed in the spectral characteristics in the chatter state (Figure 8b). The X-direction vibration signal presents additional peaks around specific frequency ranges, indicating chatter-induced vibrations resulting from regenerative effects. Similarly, the Y-direction vibration signal exhibits two prominent peaks. One of the peaks corresponds to the natural frequency of the machine-tool-workpiece system. The second peak is likely associated with the regenerative effect of chatter. During whirling milling, the delayed cutting force interaction between the tool and workpiece introduces self-excited vibrations, which manifest as periodic oscillations at a characteristic chatter frequency. In the Z-direction vibration signal, increased amplitude and new frequency components further confirm the presence of chatter, indicating multi-directional oscillations.
The blade edge regions (B, D) are more prone to chatter in the same machining process. As the sampling sequence progresses (the feed increases), the likelihood of chatter also grows. During roughing machining, the chatter at the blade edge begins at lower feed rates compared to finishing machining. This is mainly due to the significant material removal in roughing machining, which causes greater changes in overall rigidity, making the blade more susceptible to chatter. The analysis results are consistent with the earlier conclusion. The observations and analysis during the machining process confirm that the blade edge regions (B, D) are more prone to chatter.
From the data collected above, 60 data samples are obtained for both roughing and finishing machining operations, with each sample containing four-channel sensor signals and the corresponding milling state. The X, Y, and Z-axis accelerometer signals, as well as the acoustic emission signal, are sequentially selected as the raw data. The optimized feature matrix is obtained and used as the input to the MLGRU-SAM network after feature extraction, selection, and PCA-based feature fusion.
Due to the unequal sequence lengths of data segments from two different states and the fact that the machining conditions vary across different parts of the blade within a sampling segment, it is necessary to extract equal-length segments for each type. The duration of each extracted signal segment is 2 s. Each sample has a time series length of 40,000 sampling points after segmentation. A subsequence of length of 3000 sampling points is randomly selected from each sample to reduce the computational load and enable timely detection. The hardware, software conditions, and hyperparameters [27] used are kept consistent with those in the model training experiment to ensure the validity and reliability of the experiment. The obtained samples are input into the model, and the state recognition is performed following the steps outlined in Section 4.2, resulting in the recognition outcomes. The machining state identified by the chatter recognition model is checked against the actual machining state to verify the accuracy of the recognition. By calculating the accuracy, the performance of the chatter recognition model is validated. The performance of the chatter recognition model on the actual blade whirling milling experimental data are shown in Figure 10a,b.
Figure 10a presents the roughing machining and Figure 10b presents the finishing machining. The horizontal axis represents the predicted labels, while the vertical axis represents the true labels. The values in each cell indicate the number of classified instances. The 60 samples are input into the model for detection, and the results are checked against the actual outcomes. If the model’s prediction matches the actual result, it is considered correct; otherwise, it is incorrect. Using the recognition accuracy from Equation (3), the following results are obtained: For the 60 data samples of roughing machining data (S1), the model correctly classifies 52 cases and misclassifies 8 cases (for those samples that are actually stable, 29 are correctly identified and 3 are incorrectly identified as chatter state. For those samples that are actually chatter, 23 are correctly identified and 5 are incorrectly identified as stable state), and the accuracy of the recognition model is 86.66%; for the 60 data samples of finishing machining data (S2), the model correctly classifies 55 cases and misclassifies 5 cases (for those samples that are actually stable, 27 are correctly identified and 3 are incorrectly identified as chatter state. For those samples that are actually chatter, 28 are correctly identified and 2 are incorrectly identified as stable state), and the recognition accuracy reaches 91.67%; the average recognition accuracy for both operations is 89.16%. As shown in Figure 10, the time spent on state prediction for both process signal datasets is controlled within 0.4 s, which further verifies the timeliness of the recognition model. Overall, the objective data demonstrate that the proposed chatter recognition model performs well in the validation experiment. The multi-sensor feature extraction capability of the proposed MLGRU deep network based on PCA feature fusion and SAM contributes to its excellent performance in the actual machining experiments. This also further proves the adaptability and timeliness of the chatter recognition model under actual blade whirling milling conditions.
m e a n = i = 1 n T P + T N T P + F N + F P + T N i
where T P represents the number of positive samples correctly predicted as positive, F P is the number of negative samples incorrectly predicted as positive, T N is the number of negative samples correctly predicted as negative, F N is the number of positive samples incorrectly predicted as negative, and n denotes the number of times the classifier is trained and tested on all samples.

5. Conclusions

This study designed a practical blade whirling milling experiment for chatter detection, validating the effectiveness and transferability of the MLGRU chatter recognition model based on PCA multi-feature fusion and the self-attention mechanism. Multi-sensor signals collected during the two-step experimental process were used for feature extraction, feature selection, and fusion in the time domain, frequency domain, and time-frequency domain. The signal characteristics of various blade states were analyzed, and a validation dataset for the proposed model was constructed. The results showed that the average recognition accuracy of the chatter recognition model on the actual experimental data reaches an impressive 89.16%, with an average response time of less than 0.4 s. This demonstrated the applicability and timeliness of the proposed chatter recognition model for actual blade whirling milling, highlighting its practical value for chatter detection during blade milling.
This paper proposed a multi-sensor data acquisition strategy for whirling milling, with an effective chatter recognition model that combines PCA-based multi-feature fusion with deep learning, and validated its effectiveness through actual machining experiments. It provided a solid foundation for real-time chatter monitoring. Future work will focus on achieving real-time chatter detection in whirling milling processes and developing effective suppression strategies to further enhance machining stability and quality.

Author Contributions

Conceptualization, R.L.; methodology, Z.Z.; software, X.L. and Z.Z.; validation, X.L. and Z.Z.; formal analysis, X.L. and Z.Z.; investigation, Z.Z.; resources, Z.Z.; data curation, X.L. and Z.Z.; writing—original draft preparation, X.L. and Z.Z.; writing—review and editing, X.L. and Z.Z.; supervision, R.L. All authors have read and agreed to the published version of the manuscript.

Funding

This research was financially supported by the National Natural Science Foundation of China (NSFC, Grant NO. 52275494) and the Natural Science Foundation of Shandong Province, China (Grant No. ZR2021ME078).

Data Availability Statement

The original contributions presented in the study are included in the article. Further inquiries can be directed to the corresponding author.

Conflicts of Interest

The authors declare no conflicts of interest.

References

  1. Jia, Z.; Ma, J.; Song, D.; Wang, F.; Liu, W. A review of contouring-error reduction method in multi-axis CNC machining. Int. J. Mach. Tools Manuf. 2018, 125, 34–54. [Google Scholar] [CrossRef]
  2. Zhang, Z.; Li, H.; Liu, X.; Zhang, W.; Meng, G. Chatter mitigation for the milling of thin-walled workpiece. Int. J. Mech. Sci. 2018, 138, 262–271. [Google Scholar] [CrossRef]
  3. Han, L.; Liu, R.; Liu, X. Modal parameter determination and chatter prediction for blade whirling: A comparative study based on symmetric and asymmetric FRF. Adv. Manuf. 2021, 9, 145–159. [Google Scholar] [CrossRef]
  4. Zanger, F.; Sellmeier, V.; Klose, J.; Bartkowiak, M.; Schulze, V. Comparison of modeling methods to determine cutting tool profile for conventional and synchronized whirling. Procedia Cirp. 2017, 58, 222–227. [Google Scholar] [CrossRef]
  5. Omirou, S.; Charalambides, M.; Chasos, C. Advanced CNC thread milling: A comprehensive canned cycle for efficient cutting of threads with fixed or variable pitch and radius. Int. J. Adv. Manuf. Technol. 2024, 133, 2219–2233. [Google Scholar] [CrossRef]
  6. Liu, C.; He, Y.; Li, Y.; Wang, Y.; Wang, L.; Wang, S.; Wang, Y. Predicting residual properties of ball screw raceway in whirling milling based on machine learning. Measurement 2021, 173, 108605. [Google Scholar] [CrossRef]
  7. Botak, Z.; Pisačić, K.; Horvat, M.; Tomić, T. Determination of Optimal Machining Parameters Based on Roughness and Vibration Measurements of Pieces Produced by Whirling on a Lathe Machine. Machines 2024, 12, 328. [Google Scholar] [CrossRef]
  8. Merticaru, V.; Nagîț, G.; Dodun, O.; Merticaru, E.; Rîpanu, M.I.; Mihalache, A.M.; Slătineanu, L. Influence of Machining Conditions on Micro-Geometric Accuracy Elements of Complex Helical Surfaces Generated by Thread Whirling. Micromachines 2022, 13, 1520. [Google Scholar] [CrossRef]
  9. Qin, F.; Cao, H.; Tao, G.; Yi, H.; Chen, Z. Recent Progress of Chatter Detection and Tool Wear Online Monitoring in Machining Process: A Review and Future Prospects. Int. J. Precis. Eng. Manuf. Green Technol. 2024, 143, 106840. [Google Scholar] [CrossRef]
  10. Wan, S.; Li, X.; Yin, Y.; Hong, J. Milling chatter detection by multi-feature fusion and Adaboost-SVM. Mech. Syst. Signal Process. 2021, 156, 107671. [Google Scholar] [CrossRef]
  11. Zhang, P.; Gao, D.; Hong, D.; Lu, Y.; Wu, Q.; Zan, S.; Liao, Z. Improving generalisation and accuracy of on-line milling chatter detection via a novel hybrid deep convolutional neural network. Mech. Syst. Signal Process. 2023, 193, 110241. [Google Scholar] [CrossRef]
  12. Ding, L.; Sun, Y.; Xiong, Z. Online chatter suppression in turning by adaptive amplitude modulation of spindle speed variation. J. Manuf. Sci. Eng. 2018, 140, 121003. [Google Scholar] [CrossRef]
  13. Lu, Y.; Ma, H.; Sun, Y.; Song, Q.; Liu, Z.; Xiong, Z. An interpretable anti-noise convolutional neural network for online chatter detection in thin-walled parts milling. Mech. Syst. Signal Process. 2024, 206, 110885. [Google Scholar] [CrossRef]
  14. Liu, C.; Zhu, L.; Ni, C. Chatter detection in milling process based on VMD and energy entropy. Mech. Syst. Signal Process. 2018, 105, 169–182. [Google Scholar] [CrossRef]
  15. Sun, L.; Huang, X.; Zhao, J.; Wang, X.; Ma, M. An intelligent chatter detection method for high-speed milling under variable tool-workpiece systems and cutting parameters. Mech. Syst. Signal Process. 2025, 224, 111960. [Google Scholar] [CrossRef]
  16. Frumusanu, G.R.; Constantin, I.C.; Marinescu, V.; Epureanu, A. Development of a stability intelligent control system for turning. Int. J. Adv. Manuf. Technol. 2013, 64, 643–657. [Google Scholar] [CrossRef]
  17. Munoa, J.; Beudaert, X.; Dombovari, Z.; Altintas, Y.; Budak, E.; Brecher, C.; Stepan, G. Chatter suppression techniques in metal cutting. CIRP Ann. 2016, 65, 785–808. [Google Scholar] [CrossRef]
  18. Li, Z.; Song, Q.; Jin, P.; Liu, Z.; Wang, B.; Ma, H. Chatter suppression techniques in milling processes: A state of the art review. Chin. J. Aeronaut. 2024, 37, 1–23. [Google Scholar] [CrossRef]
  19. Perrelli, M.; Cosco, F.; Gagliardi, F.; Mundo, D. In-process chatter detection using signal analysis in frequency and time-frequency domain. Machines 2021, 10, 24. [Google Scholar] [CrossRef]
  20. Krajnik, P.; Kopač, J. Modern machining of die and mold tools. J. Mater. Process. Technol. 2004, 157, 543–552. [Google Scholar] [CrossRef]
  21. Vavruska, P.; Pesice, M.; Zeman, P.; Kozlok, T. Automated feed rate optimization with consideration of angular velocity according to workpiece shape. Results Eng. 2022, 16, 100762. [Google Scholar] [CrossRef]
  22. Wang, W.K.; Wan, M.; Zhang, W.H.; Yang, Y. Chatter detection methods in the machining processes: A review. J. Manuf. Process. 2022, 77, 240–259. [Google Scholar] [CrossRef]
  23. Navarro-Devia, J.H.; Chen, Y.; Dao, D.V.; Li, H. Chatter detection in milling processes—A review on signal processing and condition classification. Int. J. Adv. Manuf. Technol. 2023, 125, 3943–3980. [Google Scholar] [CrossRef]
  24. Han, L.; Liu, R.; Liu, X.; Feng, J. Theoretical modeling and chatter prediction for the whirling process of airfoil blades with consideration of asymmetric FRF and material removal. Int. J. Adv. Manuf. Technol. 2020, 106, 2613–2628. [Google Scholar] [CrossRef]
  25. Feng, J.; Liu, R.; Li, Y. Adapting whirling process for CNC manufacture of bespoke screws with variable pitch and diameters. Int. J. Manuf. Res. 2020, 15, 357–370. [Google Scholar] [CrossRef]
  26. Zhu, Z.; Liu, R. An MLGRU and SAM-based Approach to Milling Chatter Detection using Multi-sensor Data. Eng. Res. Express, 2024; accepted. [Google Scholar] [CrossRef]
  27. Akl, A.; El-Henawy, I.; Salah, A.; Li, K. Optimizing deep neural networks hyperparameter positions and values. J. Intell. Fuzzy Syst. 2019, 37, 6665–6681. [Google Scholar] [CrossRef]
Figure 1. Schematic of whirling milling for bladed components.
Machines 13 00206 g001
Figure 2. Experimental setup for blade milling.
Machines 13 00206 g002
Figure 3. Sampling schematic of the blade whirling milling process.
Machines 13 00206 g003
Figure 4. Workpiece blank and formed blade.
Machines 13 00206 g004
Figure 5. Flowchart of the signal acquisition experiment.
Machines 13 00206 g005
Figure 6. Overall structure of the recognition model.
Machines 13 00206 g006
Figure 7. Time-domain plots of signals.
Machines 13 00206 g007
Figure 8. Frequency spectra of signals.
Machines 13 00206 g008
Figure 9. Distribution of machining states for sampling segments and blade sections.
Machines 13 00206 g009
Figure 10. Performance of the chatter recognition model on the experimental dataset.
Machines 13 00206 g010
Table 1. Selection of roughing and finishing machining parameters.
Spindle Speed (rpm)Cutting Depth (mm)Feed Rate (mm/min)Lubrication MethodCutting Method
Roughing Machining10000.3–0.910, 20, 30, …, 150Cutting FluidWhirling Milling
Finishing Machining10000.310, 20, 30, …, 150Cutting FluidWhirling Milling
Disclaimer/Publisher’s Note: The statements, opinions and data contained in all publications are solely those of the individual author(s) and contributor(s) and not of MDPI and/or the editor(s). MDPI and/or the editor(s) disclaim responsibility for any injury to people or property resulting from any ideas, methods, instructions or products referred to in the content.

