Abstract
Ensuring the reliability of induction motors is essential for industrial applications, as motor failures can lead to unplanned downtime and significant financial losses. Motor current signature analysis (MCSA) has emerged as an effective and non-intrusive technique for diagnosing motor health, particularly for monitoring bearing conditions, which account for a significant percentage of motor failures. However, the MCSA technique can only assess the status of the bearings: whether they are healthy or unhealthy. Regular maintenance activities are necessary to avoid unplanned downtime due to bearing failure. Furthermore, this analysis cannot help proactively replace the bearings before they fail. Therefore, this research develops a predictive maintenance framework by integrating motor current signature analysis with machine learning techniques to estimate the remaining useful life (RUL) of induction motor bearings. The methodology involves analyzing historical motor current data using trajectory analysis and fast Fourier transform (FFT) to extract relevant health indicators. analysis identifies deviations in motor behavior, whereas FFT detects harmonics that indicate potential faults. A machine learning model is employed to classify the health status of motor bearings and estimate their RUL based on extracted signal features. This approach effectively differentiates healthy from faulty bearings, enabling proactive maintenance to reduce failures and boost efficiency.
1. Introduction
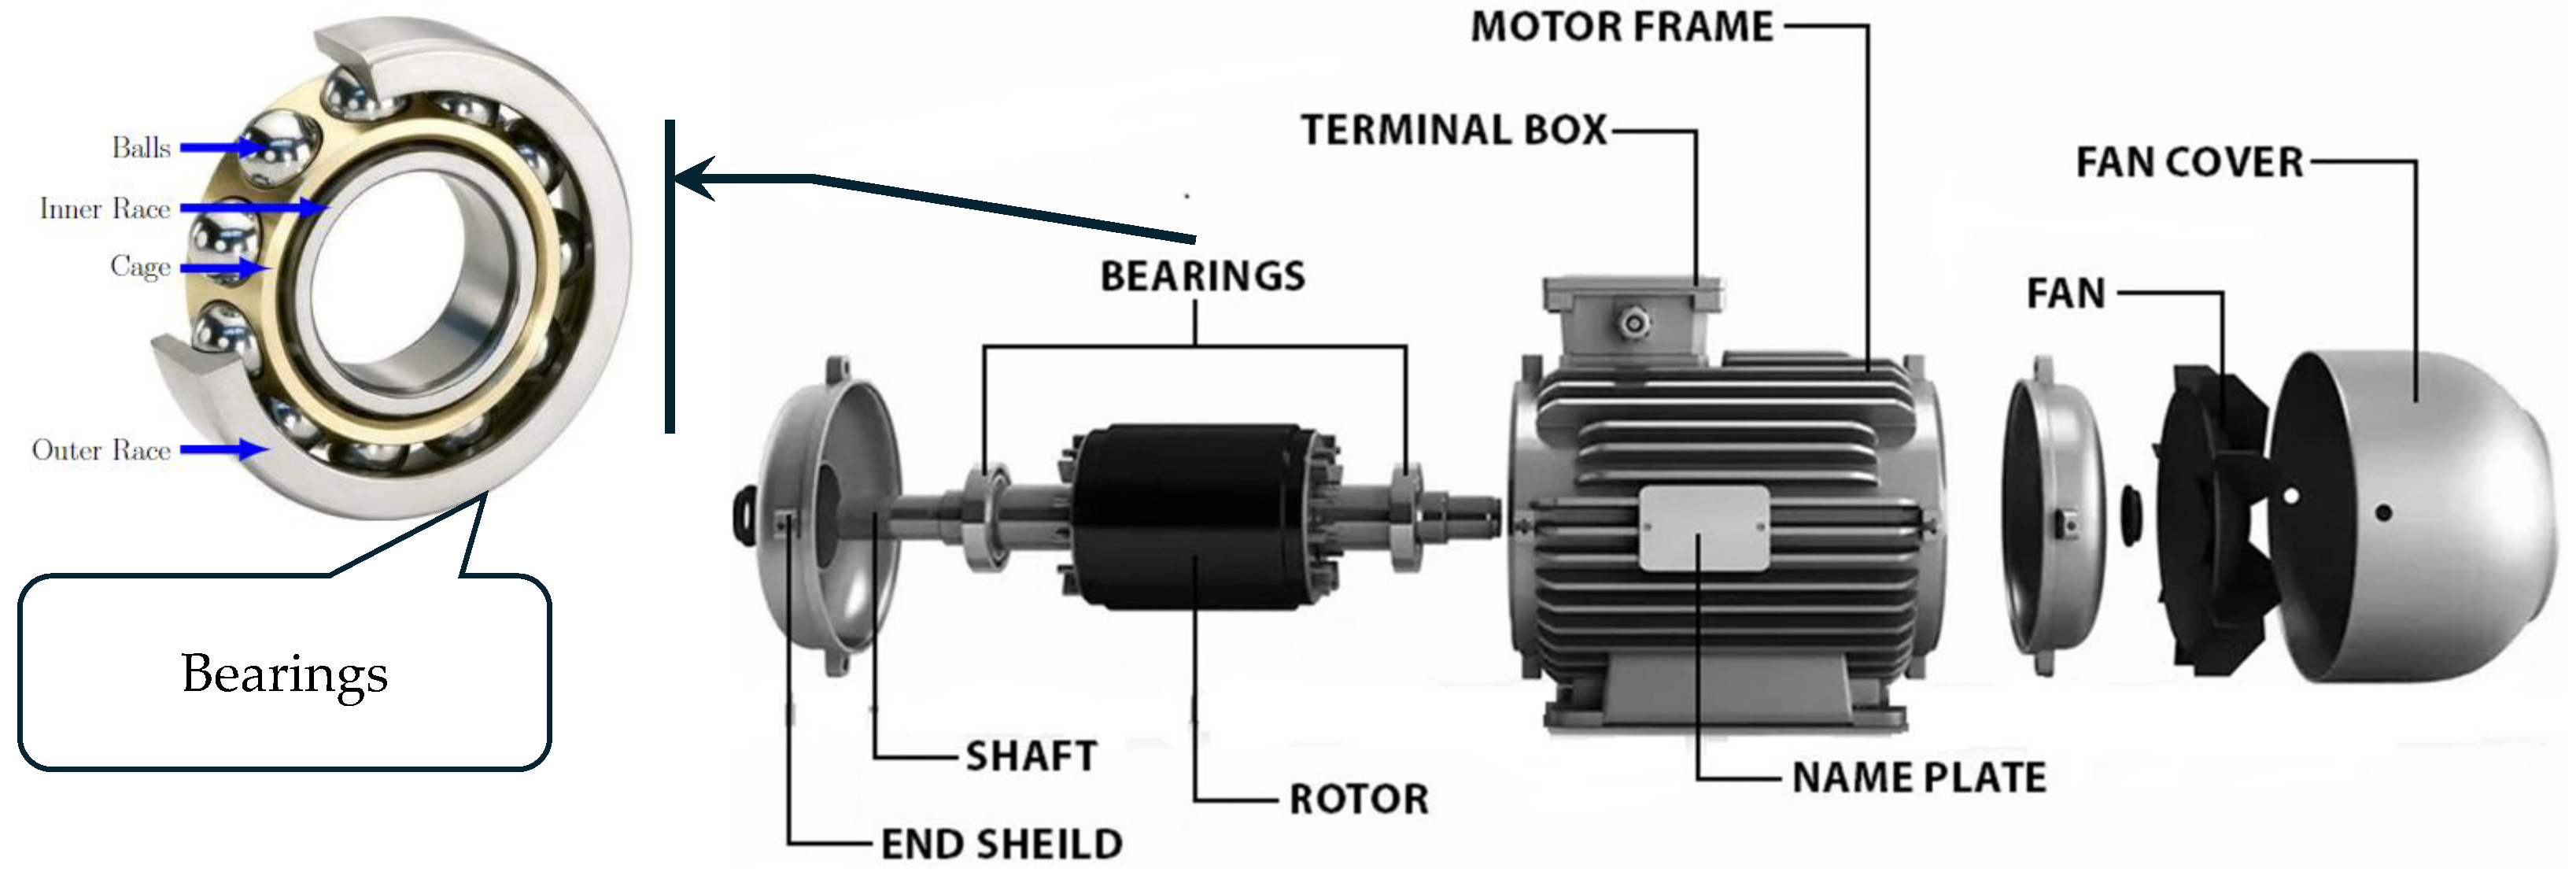
Induction motors, as shown in Figure 1, are commonly employed in various industrial applications due to their efficiency, robustness, and low maintenance requirements. However, bearing failures can significantly diminish reliability, often leading to costly motor breakdowns [1,2,3,4]. Consequently, effective condition monitoring is essential. According to a recent study [5], the common causes of bearing failure include inadequate lubrication, contamination, fatigue, misalignment, and mechanical overload. If these issues are not addressed proactively, they can cause faster wear and lead to unexpected motor stoppages. Conventional methods, such as temperature monitoring, acoustic emission, and vibration analysis, are frequently used; however, they often require additional sensors to function appropriately [6,7]. These methods can be unreliable due to the high costs and environmental sensitivity associated with the sensors [8]. Therefore, the predictive maintenance of induction motors in industrial settings is critical and faces several challenges. Among these challenges are integrating multiple sensors into a cohesive monitoring system, the need for real-time data processing, and managing data quality issues [9]. Recent studies suggest that motor current signature analysis (MCSA) offers a cost-effective and non-intrusive alternative for diagnosing and predicting faults in induction motors [10]. Despite its advantages, MCSA’s effectiveness is hampered by its reliance on reactive responses to malfunctions.
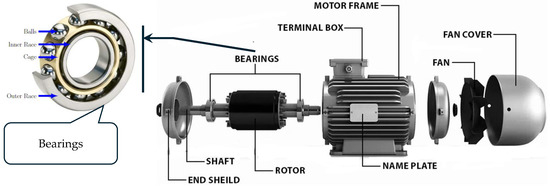
Figure 1.
Internal architecture of three-phase induction motor.
Among the traditional diagnostic techniques, vibration analysis has been extensively adopted to identify mechanical faults in rotating machinery. It involves measuring and interpreting vibrational signals to detect anomalies in bearing components. Another commonly employed approach is vibration analysis for diagnosing bearing faults. Authors [11] demonstrated the efficacy of time-domain and frequency-domain features in identifying localized defects. However, the accuracy of vibration analysis heavily depends on correct sensor placement and can be affected by external noise as well as structural resonances. Furthermore, the need for additional accelerometers or specialized sensors increases systemtcost and complexity [6,7,8]. Researchers have proposed advanced signal processing techniques like the wavelet Transform (WT) to overcome these limitations. Unlike Fourier-based methods, wavelets offer time-frequency localization, enabling the detection of non-stationary and transient fault features [12]. By decomposing signals at multiple resolutions, wavelets help isolate fault-related frequency components. In particular, the choice of the mother wavelet significantly influences feature extraction quality, and many studies have integrated wavelet analysis with machine learning classifiers for robust fault diagnosis. For instance, [13] conducted Gabor-wavelet-based analysis of motor current signals to detect bearing faults, emphasizing the potential of time-frequency techniques in current-based diagnostics.
Similarly, Schoen et al. [14] explored stator-current-based monitoring techniques, highlighting their potential to detect early-stage motor bearing failures. Another widely used method is infrared thermography, which researchers have investigated [15] to detect thermal variations using thermal images caused by faulty bearings. In addition to these methods, researchers have presented wavelet transform techniques for bearing fault diagnosis. Another promising approach is motor current signature analysis (MCSA), which leverages the stator current to infer mechanical and electrical faults without requiring additional sensors [10]. It is cost-effective and non-intrusive, making it attractive for industrial applications. However, the traditional MCSA is often reactive, identifying faults only after they have occurred. In [13], the authors applied Gabor analysis to extract fault features from motor current signals, further demonstrating the feasibility of MCSA for bearing fault detection. Given the critical role of induction motors in industry, any operational failure can lead to severe consequences. Moreover, accurately detecting faults in the often noisy and vibrating environments in which these motors operate remains a significant challenge.
As a solution, predicting the remaining useful life (RUL) of induction motor bearings is essential for maintaining operational efficiency and controlling unexpected failures [16]. By leveraging machine learning methods to extract significant patterns from motor current signals, it is possible to accurately predictthe bearings’ RUL, enabling preventative maintenance and reducing downtime. Therefore, in recent studies, machine learning and artificial intelligence have enabled data-driven methods to diagnose faults and predict induction motor bearings’ RUL. In [17], the authors employed Support Vector Machines (SVMs) for the fault classification of rotating machinery, proving their effectiveness in differentiating fault conditions. Furthermore, combining SVM with improved algorithms, including multiscale fuzzy entropy, improves fault diagnosis capabilities, especially in complex systems like elevators [18]. Researchers [19] presented SVMs for classifying different fault conditions using various features and highlighted the effectiveness of SVMs in classifying various fault conditions in rotating machinery. The paper discussed using SVMs for the fault classification of rotating equipment bearings, increased accuracy through variational mode decomposition for feature extraction and the grey wolf optimization algorithm for parameter optimization, and achieved superior performance compared to conventional methods [20]. Similarly, the authors of [21] investigated feature extraction methods for MCSA-based fault diagnosis and showed that the frequency-domain analysis of current signals can effectively identify early-stage bearing faults. In a paper, [22] proposed a weighted frequency-domain energy operator spectral method for extracting incipient fault features in rolling bearings and highlighted the importance of frequency-domain analysis in identifying early-stage faults amidst noisy vibration signals.
Numerous methodologies have been developed to predict the RUL, including similarity-based, threshold-based, survival, and machine-learning-based models. Similarity-based models estimate the RUL by comparing the current behavior of a system with that of similar systems that have already failed, relying on historical data and appropriate similarity measures. Researchers [23] employed a pattern-matching technique to predict the RUL of aircraft engines, demonstrating the effectiveness of similarity measures in forecasting remaining life by leveraging historical performance data. Threshold-based models, on the other hand, set predefined thresholds for key parameters that signal when a system is approaching failure. The authors of [24] proposed a Bayesian approach using threshold models, which integrates the uncertainty in degradation and offers a probabilistic approach to maintenance decision making, particularly when degradation patterns follow known trajectories. Survival models, also known as reliability models, predict the time until failure by analyzing the distribution of failure times. These models are beneficial when failure processes are uncertain or environmentally variable. In [25], a similarity-based survival model was used for RUL prediction, emphasizing the utility of survival analysis to estimate system lifespans probabilistically.
Artificial neural networks (ANNs) and deep learning models have further enhanced the accuracy of fault prediction [26]. The authors of [27] explored different diagnostic techniques and highlighted the role of artificial neural networks in increasing the robustness of fault detection systems. In recent years, researchers [28] introduced a novel method that integrates a convolutional block attention module with a convolution neural network and a long short-term memory (LSTM) model for RUL prediction, which enhanced feature extraction, and temporal learning, achieving significant results in prediction errors compared to conventional methods. The authors of [13] integrated the deep learning models with time-frequency domain feature extraction to enhance MCSA-based fault detection. Meanwhile, [21] investigated emerging diagnostic trends and highlighted the importance of data-driven methods in predictive maintenance. Even with these advancements, challenges remain in enhancing the ability of machine learning models, handling noisy current signals, and selecting optimal features for classification. Another example of an advanced deep learning approach is the Shrinkage Mamba Relation Network (SMRN). In [29], the authors employed an SMRN, an advanced architecture enhanced with out-of-distribution data augmentation, to detect and localize faults in rotating machinery under zero-fault data conditions with out-of-distribution (OOD) data augmentation
The above literature shows that machine learning approaches offer significant advantages in analyzing complex current signals and capturing hidden degradation patterns that conventional methods might overlook [30]. While prior research has demonstrated the effectiveness of vibration analysis and MCSA for fault detection, these methods primarily provide reactive insights rather than predictive capabilities. The existing methods also often require additional hardware, such as vibration sensors, increasing the complexity and cost of implementation.
Motivated by the above literature, this paper develops a predictive model that combines the MCSA framework with machine learning techniques to analyze induction motors’ historical and current signature data. The model will facilitate the estimation of bearings’ RUL to enhance proactive maintenance and operational reliability. The key contributions of this research are outlined below:
- A robust predictive model was designed to estimate the Health Index (HI) and RUL of induction motors to provide intuitive insights into the motor’s health and remaining lifespan, enabling better decision making for maintenance.
- The performance of the developed model was tested on datasets collected from 52 motors across three cogeneration power plants in Malaysia, demonstrating its effectiveness in accurately predicting motor health and failure risks, thereby enhancing reliability and operational efficiency.
By addressing a critical challenge in industrial maintenance, accurate sensorless RUL prediction, this study provides a practical and scalable solution to improve motor reliability and reduce unexpected failures.
The remaining sections of this manuscript are structured as follows: Section 2 outlines the methodologies utilized for monitoring motor health, including Park’s Vector Technique, fast Fourier transform analysis, and remaining useful life estimation, all of which contribute to effective fault detection and predictive maintenance strategies. Section 3 details the data collection procedures and provides an overview of the dataset used for predictive modeling. Section 4 presents the analysis conducted on the health of induction motors through trajectory analysis, FFT analysis, and RUL estimation. This study assessed three plants’ conditions and the expected lifespan of 52 motors. Finally, Section 5 concludes the manuscript with a summary of the findings, their implications for industrial applications, and recommendations for future research directions in predictive maintenance for induction motors.
2. Methodology
This section presents the methodologies employed for monitoring motor health, including Park’s Vector technique, fast Fourier transform analysis, and remaining useful life estimation, ensuring comprehensive fault detection and predictive maintenance strategies.
2.1. Park’s Vector Technique
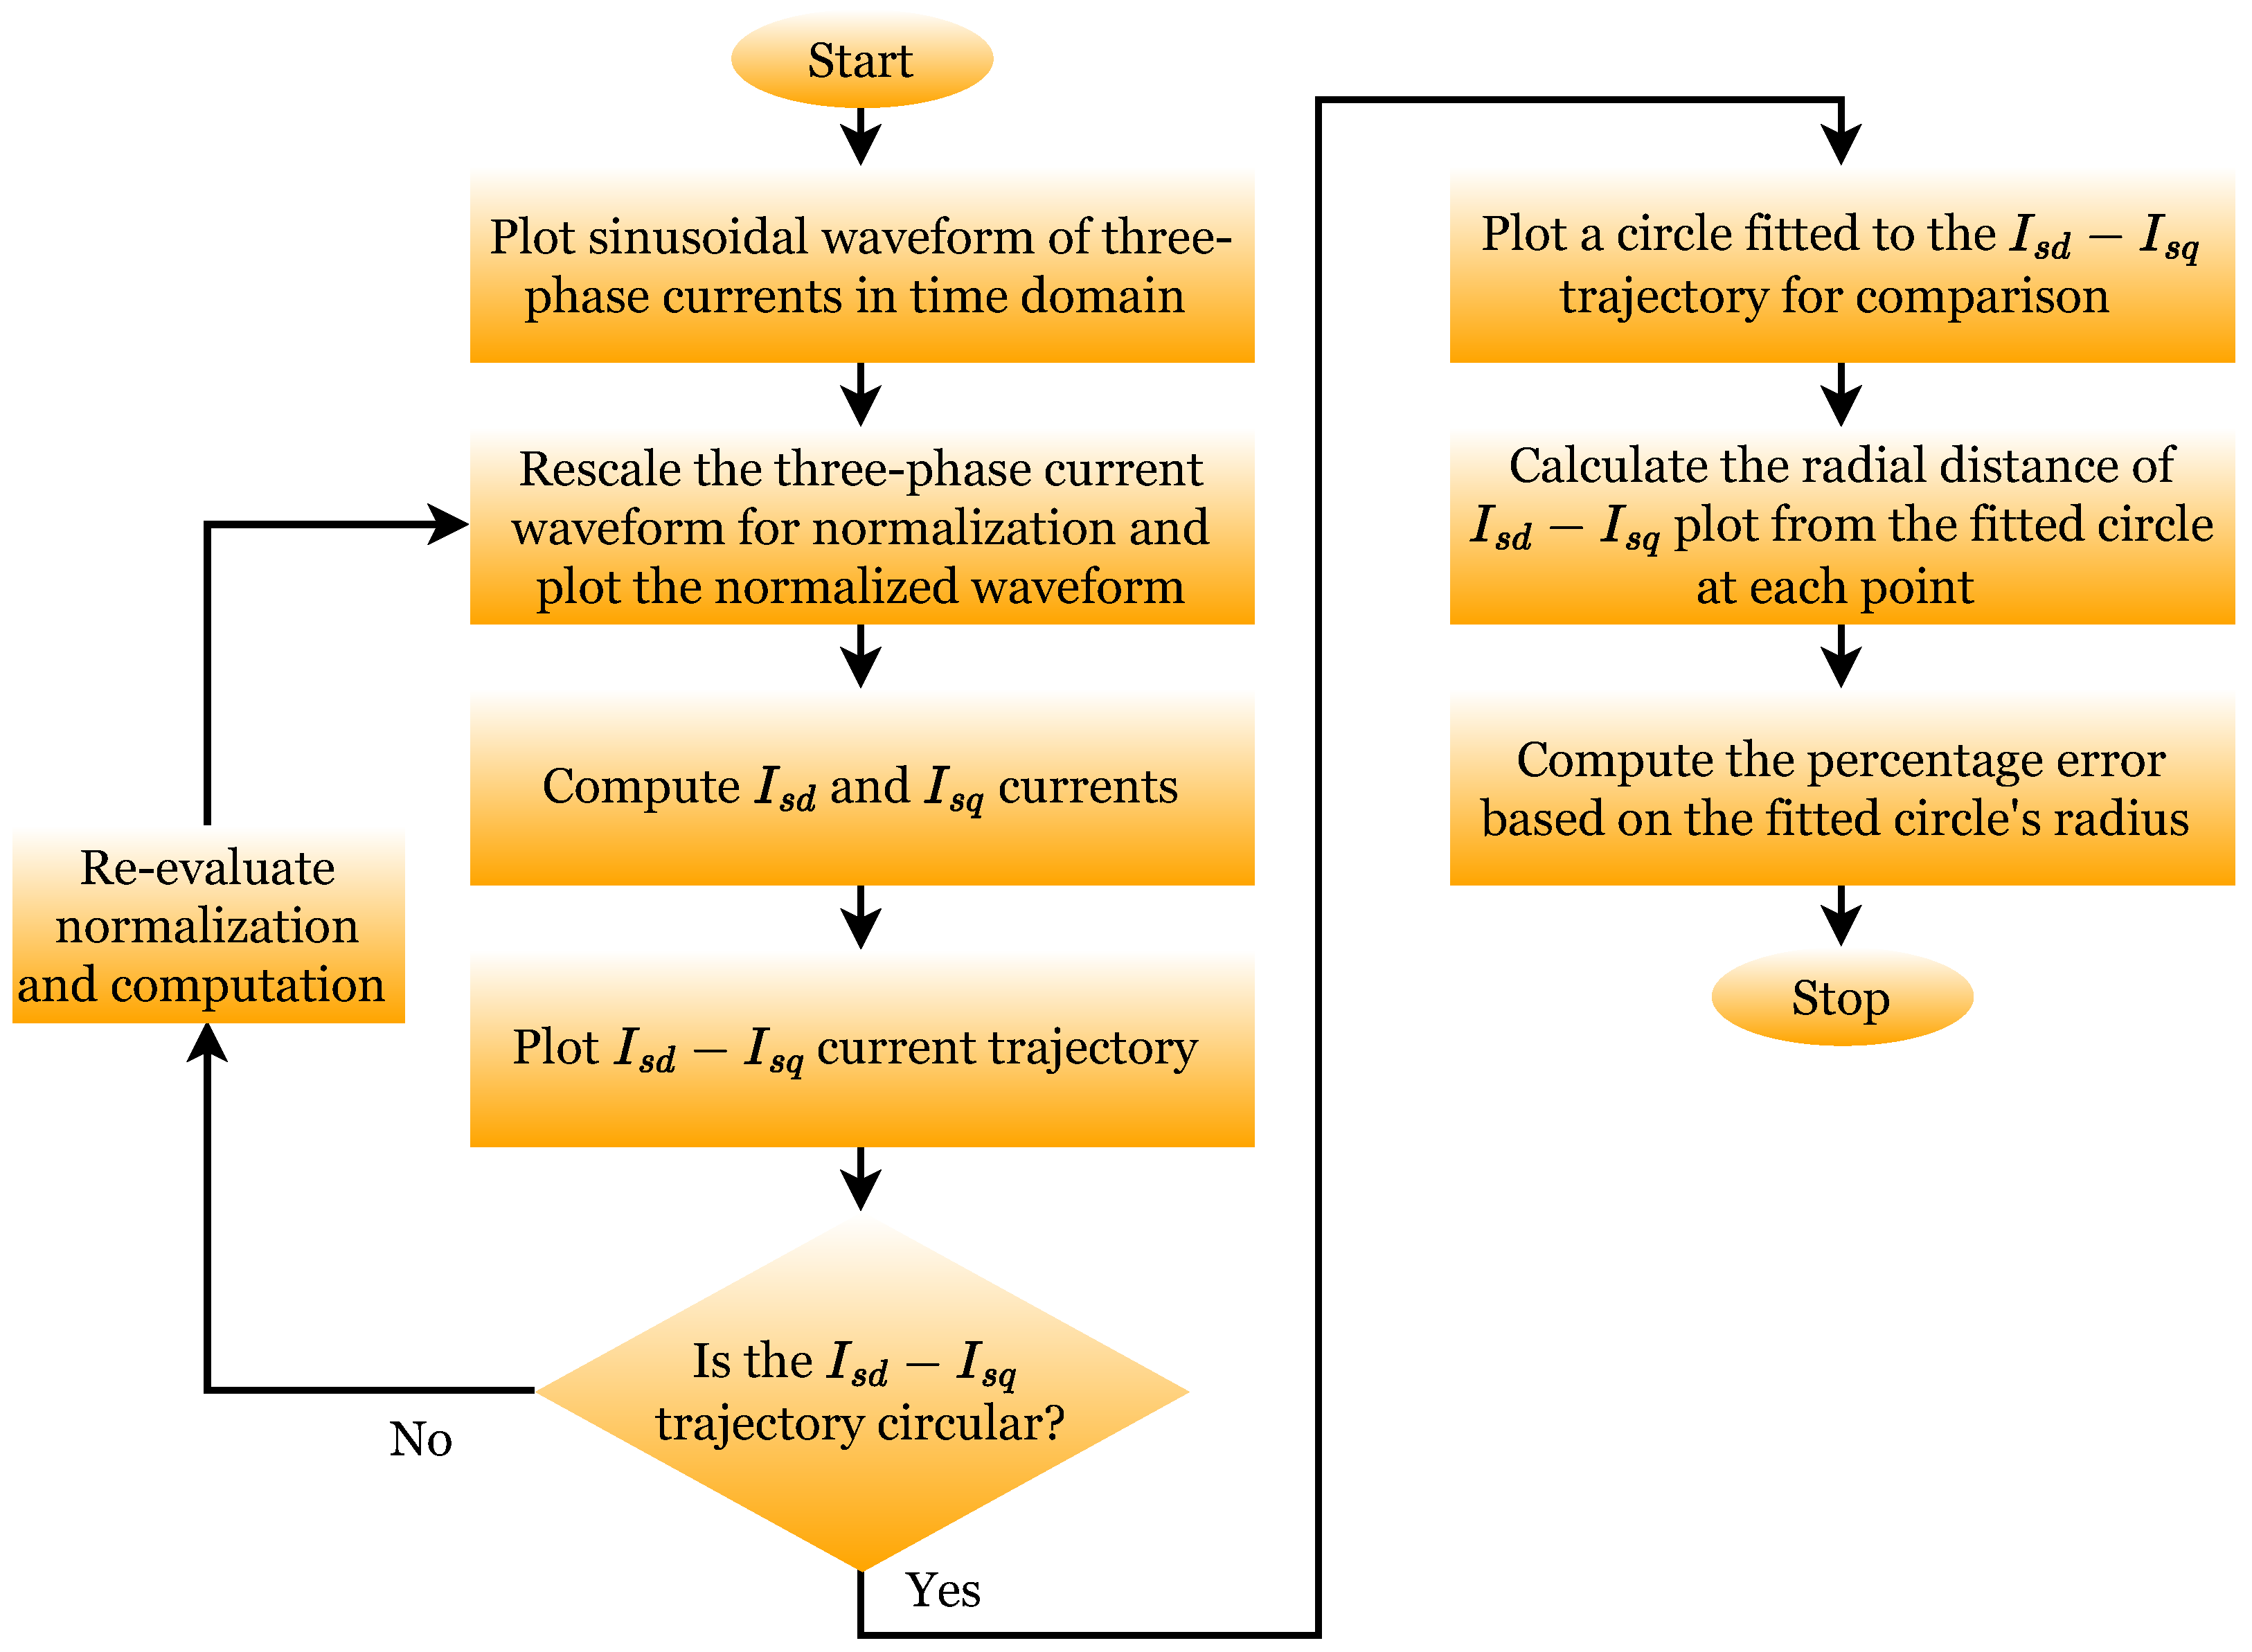
Park’s Vector methodology, also known as analysis, involves the study of three-phase stator currents using the orthogonal components such as the (direct current) − (quadrature current) transformation technique to monitor motor health. The flowchart of this technique is shown in Figure 2. As shown in the figure, initially, the maximum current readings in each phase, denoted as , , and , are acquired, normalized, and visualized to identify the motor faults. The and components are computed using Clarke’s transformation, which converts the three-phase currents into a two-dimensional space for easier analysis, as expressed in the following equations [31,32]:

Figure 2.
Flowchart of analysis.
The above formula shows that the computation of involves contributions from , , and , while is calculated based on the differences between and . This transformation preserves essential information about the motor’s status, even though the dimensionality is reduced. These components are then plotted over time to examine fluctuations and detect faults. The trajectory is plotted, where a circular shape indicates a healthy motor, while any deviations from the expected trajectory indicate possible faults. The best-fit circle is computed to quantify these deviations, with the percentage error calculated for each trajectory point using [33]
where r is the radial distance of the plot at each point, and represents the fitted circle’s radius. The mean percentage error quantitatively assesses the motor’s condition. This systematic approach provides early fault detection and enhances predictive maintenance strategies by integrating transformation, trajectory analysis, and best-fit circle computations.
2.2. Fast Fourier Transform (FFT) Technique
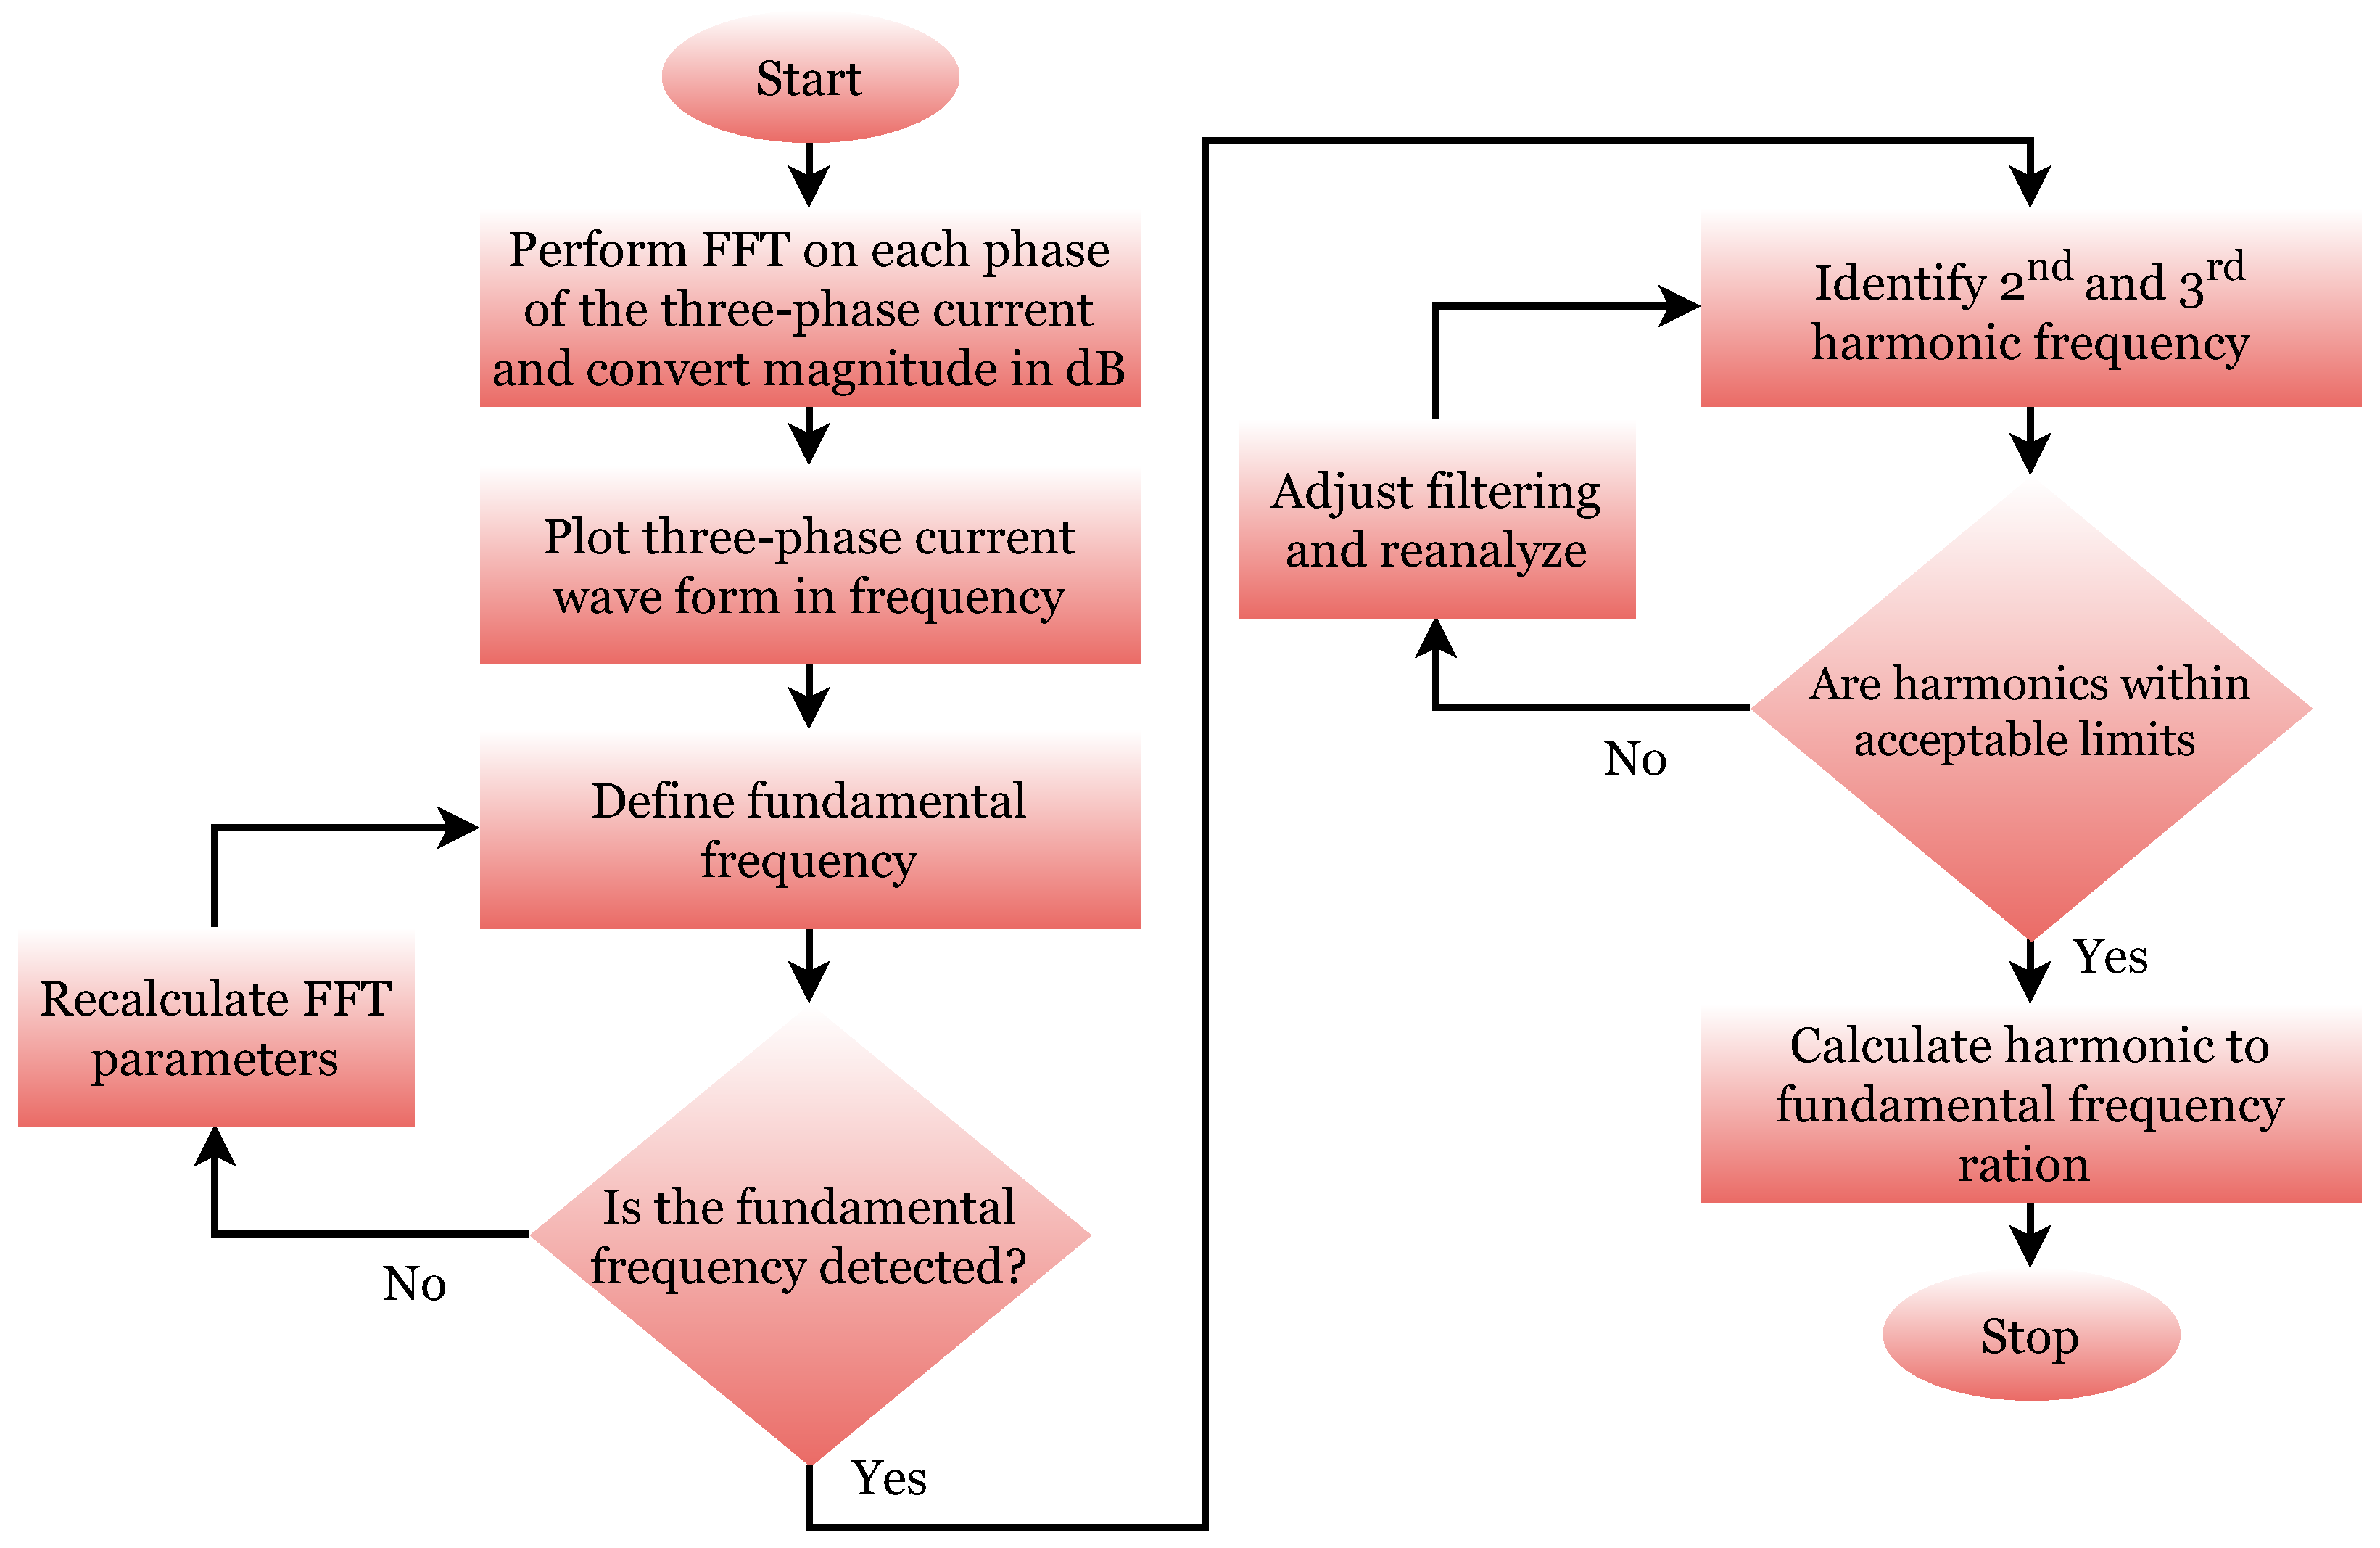
The FFT technique is applied to evaluate motor performance and identify potential faults using the induction motor current data in the frequency domain. The flowchart of this technique is shown in Figure 3. As shown in the flowchart, initially, three-phase current data, represented as , , and , are acquired and pre-processed. A sampling frequency, , is defined to establish the frequency range for the FFT analysis. The transformation of time-domain current signals into the frequency domain is then performed using the FFT algorithm, mathematically represented as [34,35]:
where represents the frequency-domain representation, denotes the discrete-time current signal, and N is the total number of samples. The computed FFT output provides the frequency spectrum, exhibiting the amplitude and phase of the motor current at different frequencies. To improve interpretability, a single-sided amplitude spectrum is derived as follows [35]:
where only the positive half of the spectrum or single-sided amplitude spectrum is considered due to its symmetry. The amplitude values are then converted into decibels (dB) using [34]
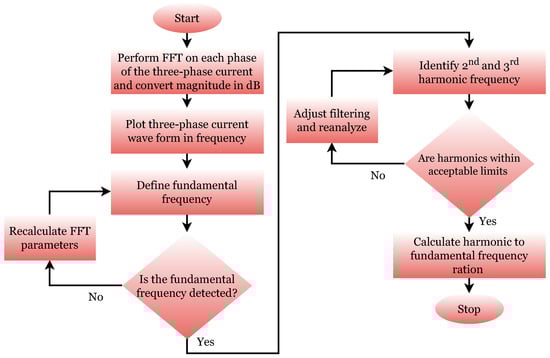
Figure 3.
Flowchart of FFT analysis.
This representation enables the identification of significant frequency components, including the fundamental operating frequency and its harmonics. Harmonic analysis is conducted by extracting the fundamental frequency and its harmonics, which allows for evaluating the energy distribution. The harmonic-to-fundamental ratio (HFR) is calculated as follows [36]:
where and represent the amplitude of the harmonic and fundamental frequencies, respectively. High HFR values indicate electrical imbalances or bearing faults. Thus, FFT-based frequency analysis provides a complete diagnostic tool for induction motor health monitoring, enabling early fault detection and predictive maintenance.
2.3. Remaining Useful Life (RUL) Estimation Technique
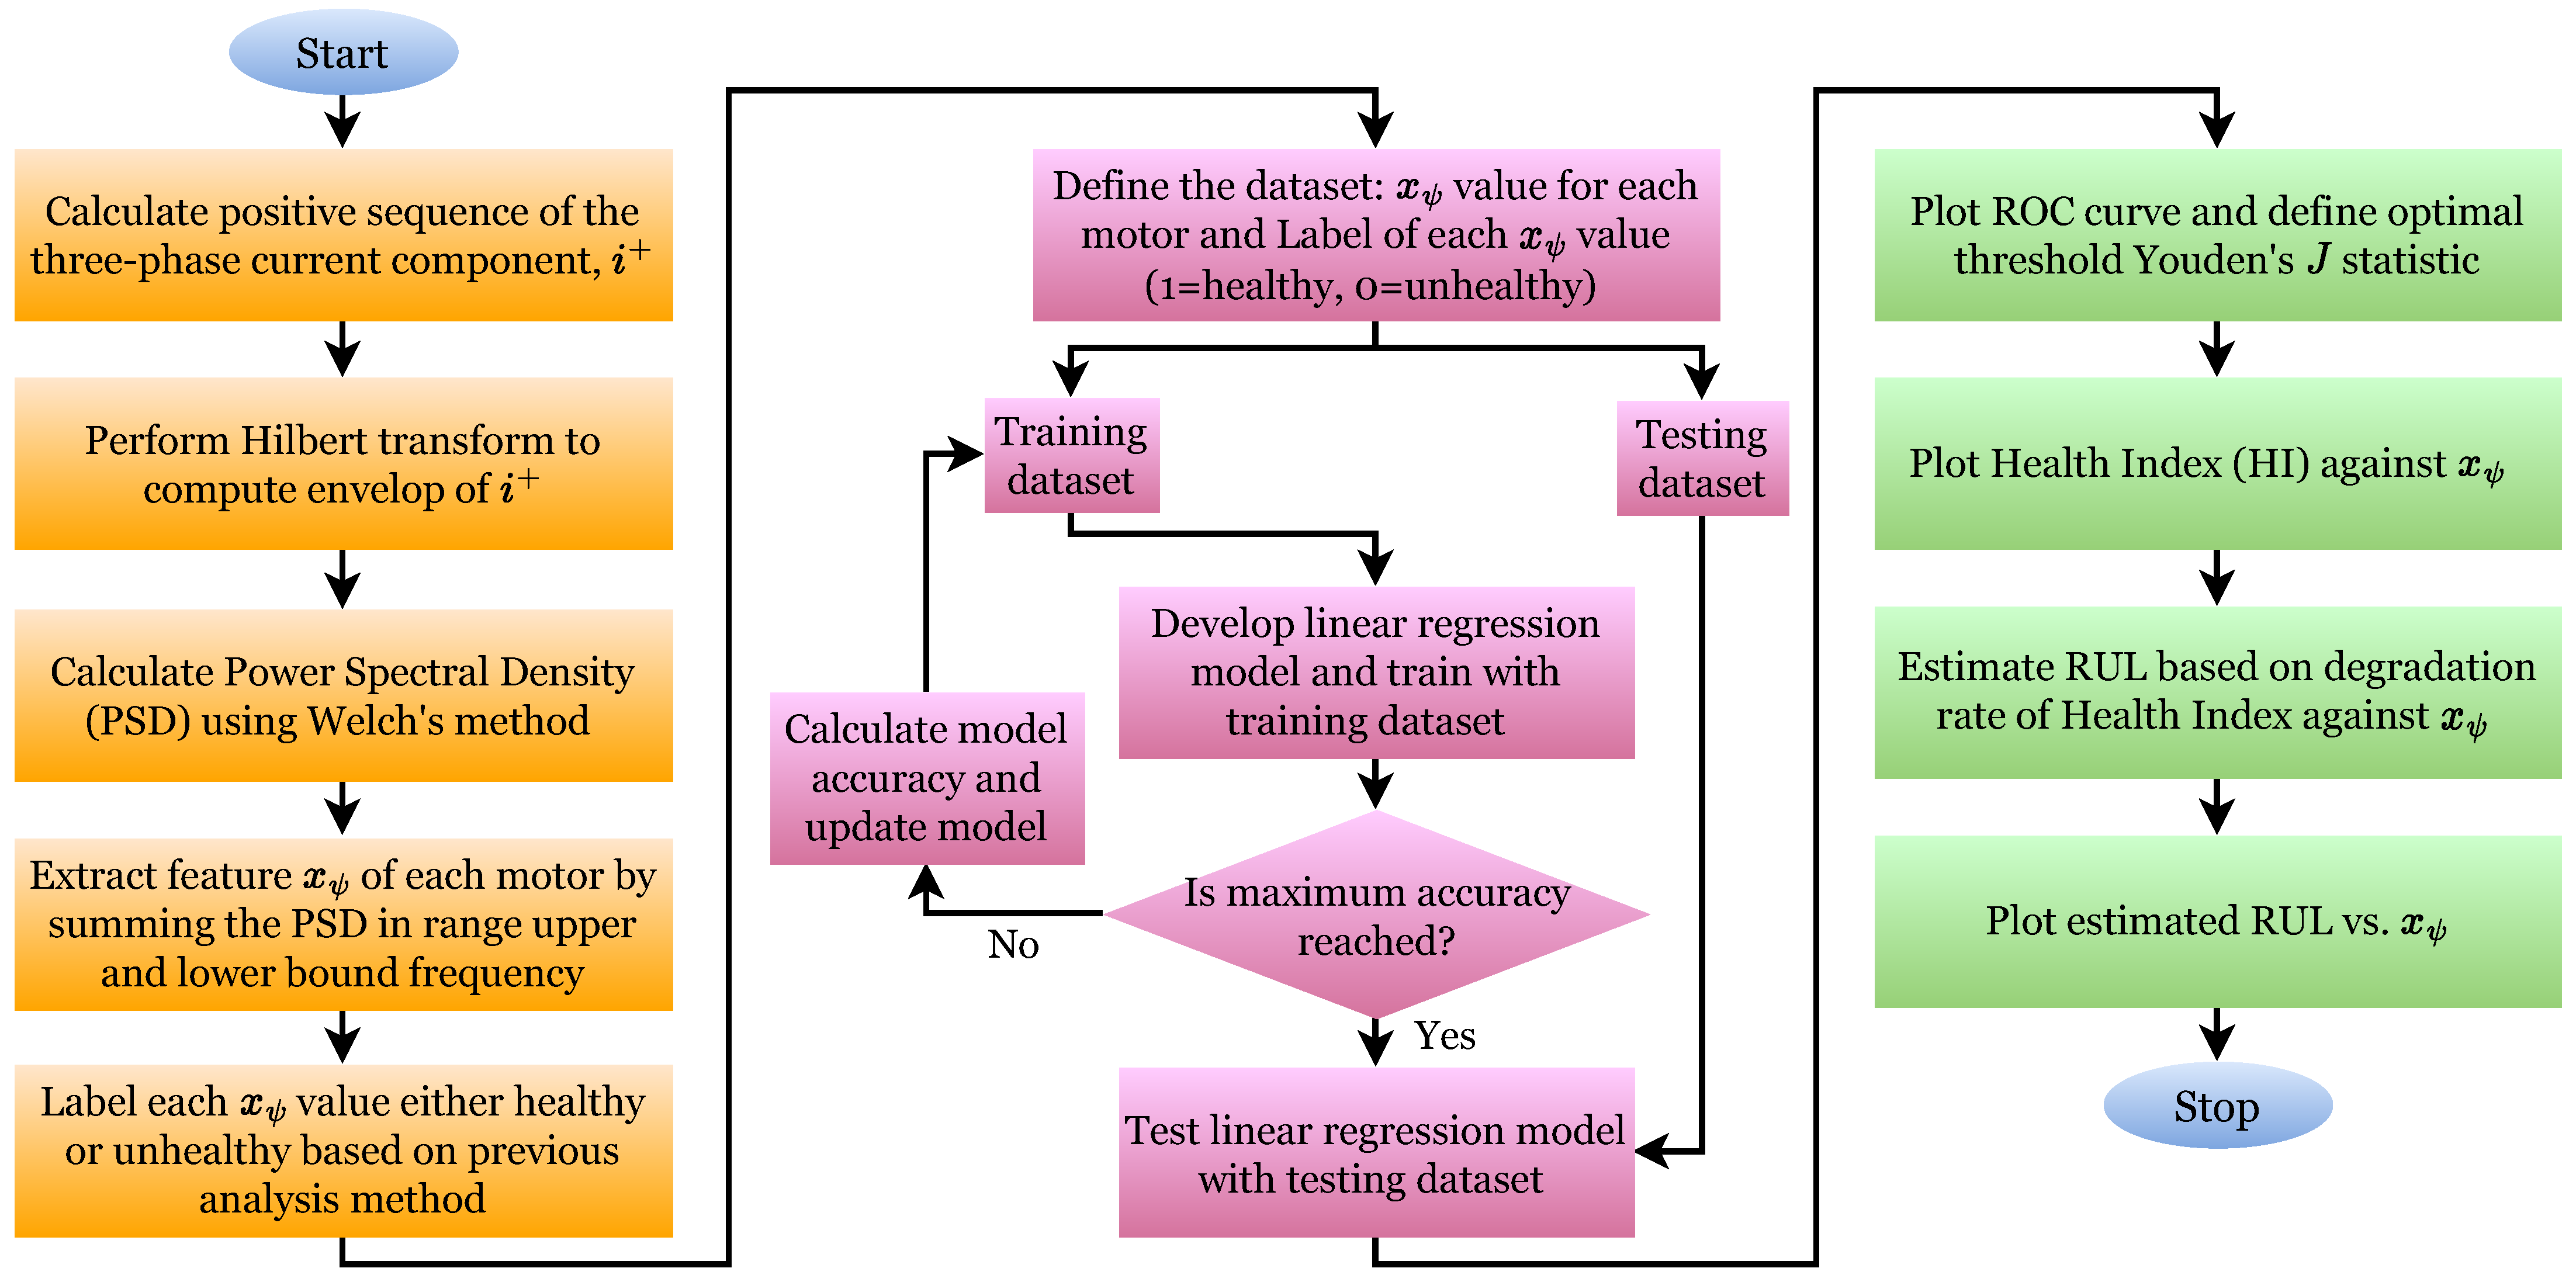
The Health Index (HI) and remaining useful life (RUL) are estimated systematically, including feature extraction and machine-learning-based prediction. The flowchart of this technique is shown in Figure 4. As shown in the flowchart, initially, the three-phase stator current data, represented as , , and , were obtained from an Excel dataset, with each column representing the phase current measurements. The relevant current data were extracted for further processing.

Figure 4.
Flowchart of RUL estimation analysis.
The positive-sequence current component is computed by transforming the three-phase current data into symmetrical components to evaluate the electrical condition of an induction motor. This transformation involves an inverse matrix transformation, where the three-phase currents are initially converted into direct, quadrature, and zero-sequence components. From these components, the complex positive- and negative-sequence currents are obtained through another transformation matrix, allowing the isolation of the positive-sequence current. This significant component represents a balanced sinusoidal waveform, reflecting the motor’s electrical health.
The Hilbert transform is applied to obtain the envelope of signal and extract the relevant diagnostic features. This transformation allows for the computation of instantaneous amplitude variations, which facilitates the detection of modulations associated with motor faults. Welch’s method estimates the envelope’s power spectral density (PSD) after extraction. This approach involves segmenting the envelope signal and applying a window function to each segment, then averaging the Fourier transform’s square magnitudes. The resulting PSD provides valuable information on the signal’s frequency components, facilitating effective feature extraction.
The critical feature is extracted by summing the PSD values within a specified frequency range, represented as the lower bound and upper bound [37]:
This feature acts as a key indicator of motor health. The extracted values of are categorized based on the previous analysis, with healthy motors labeled 1 and unhealthy motors labeled 0. The labeled dataset was subsequently divided into training and testing to maintain a balanced representation of both health conditions. A logistic regression model was developed and trained using a training dataset, with as the input feature and the health labels as the target variable. The model is used to predict the probability of an unhealthy motor, resulting in a quantitative HI. The receiver operating characteristic (ROC) curve is used for determining the optimal decision threshold, and the model’s internal workings, such as the feature extraction from the three-phase stator current data and the calculation of the Health Index and RUL, are detailed in Figure 4. The optimal decision threshold is determined using Youden’s J statistic, which maximizes model accuracy.
A smooth interpolation of the HI values across is conducted to produce a graphical representation of the motor’s health status. Finally, the RUL is calculated based on the degradation of HI. The degradation rate D is determined as the absolute difference between the HI and the failure threshold [38]:
The RUL is inversely proportional to the degradation rate, which is the time remaining until the motor reaches a critical failure threshold determined using [38]
Therefore, the RUL is visualized as a function to provide an intuitive understanding of the motor’s lifespan. Integrating these analytical steps establishes a comprehensive framework for motor health assessment and predictive maintenance.
3. Data Acquisition
Data acquisition is essential because it is the foundation for subsequent analysis, providing an overview of the dataset for predictive modeling. The dataset was collected using a Fluke 435 Power Quality Analyzer (Everett, WA, USA) from three cogeneration power plants in Malaysia: CGPP-A, CGPP-B, and CGPP-C. The data spanned over 10 min for each motor, with current measurements sampled every two seconds, ensuring high temporal resolution and accuracy for detecting fault precursors and assessing motor performance over different operational periods. A block diagram showing the data collection process from the various three-phase induction motors is shown in Figure 5.
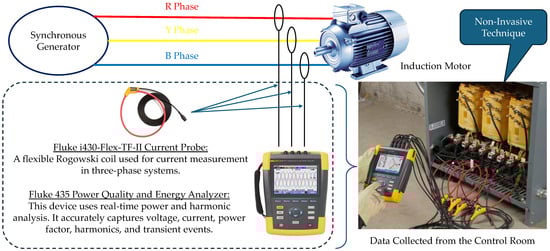
Figure 5.
Data acquisition from various induction motors using Fluke 435 Power Quality and Energy Analyzer.
Figure 5 presents the setup used for the non-intrusive data acquisition from the induction motors. A Fluke 435 Series II Power Quality and Energy Analyzer was used to capture and analyze the voltage and current waveforms from the three-phase systems. It provided advanced features such as harmonic analysis, energy monitoring, and transient event detection, making it well suited for motor diagnostics and predictive maintenance. The analyzer also featured a measurement category rating of CAT IV 600V/CAT III 1000V, with a reading accuracy of ±0.5%. It offered a sampling rate of up to 200 kHz and had sufficient memory for the long-term logging of power quality parameters. The current signals from the R, Y, and B phases were measured using Fluke i430-Flexi-TF-II flexible current probes (Everett, WA, USA), which utilized Rogowski coil technology. These probes offered a wide current range (0.5 A to 6000 A), broad bandwidth (3 Hz to 10 kHz), and flexible design for easy installation in tight spaces. The current probes were clamped around each phase conductor without interrupting motor operation, enabling a fully non-intrusive measurement process. Data were collected directly from the control room to ensure operator safety. This setup provided high-quality current signals that were later processed using trajectory analysis, FFT, and machine learning techniques for estimating the RUL of the motor bearings.
Each plant contributed unique data, particularly the minimum and maximum stator current values for each phase. This information from the dataset offered valuable insights into the operational load of each motor and allowed faults to be identified. The CGPP-A dataset includes detailed records for 19 motors, capturing high-resolution motor performance data. Current values were recorded continuously in two-second intervals, generating 1876 readings per phase. This extensive data collection enabled a comprehensive analysis of the recording’s minimum and maximum current values. Additionally, the root mean square (RMS) of the current measurements was used to detect slight variations or fluctuations, which indicate potential current imbalances, winding faults, phase imbalances, or bearing degradation.
Similarly, the CGPP-B plant dataset contains data from 21 motors, while the CGPP-C plant dataset includes information on 12 motors. Table 1 lists these 52 motors with their motor IDs collected from the three plants. These datasets contain the minimum and maximum current values for each phase, accurately representing the full load distribution of each motor. The operational range of each motor was determined to identify the normal and peak load conditions by analyzing this collected dataset. During the data acquisition process at each plant, instantaneous current values and trend patterns were captured over a brief collection period. As a result, this helped identify irregular patterns that indicated motor degradation. Since all three datasets follow a consistent format, comparative analysis across the plants is more efficient in understanding the operational conditions and workload effects on motor performance.

Table 1.
List of 52 three-phase induction motors and their motor IDs from three different plants.
4. Results and Discussion
This section discusses the results of the analysis performed on the health of the induction motors using trajectory analysis, FFT analysis, and RUL estimation. This study evaluated the condition and lifespan of the motors at the three plants: CGPP-A, CGPP-B, and CGPP-C.
4.1. Park’s Vector Technique
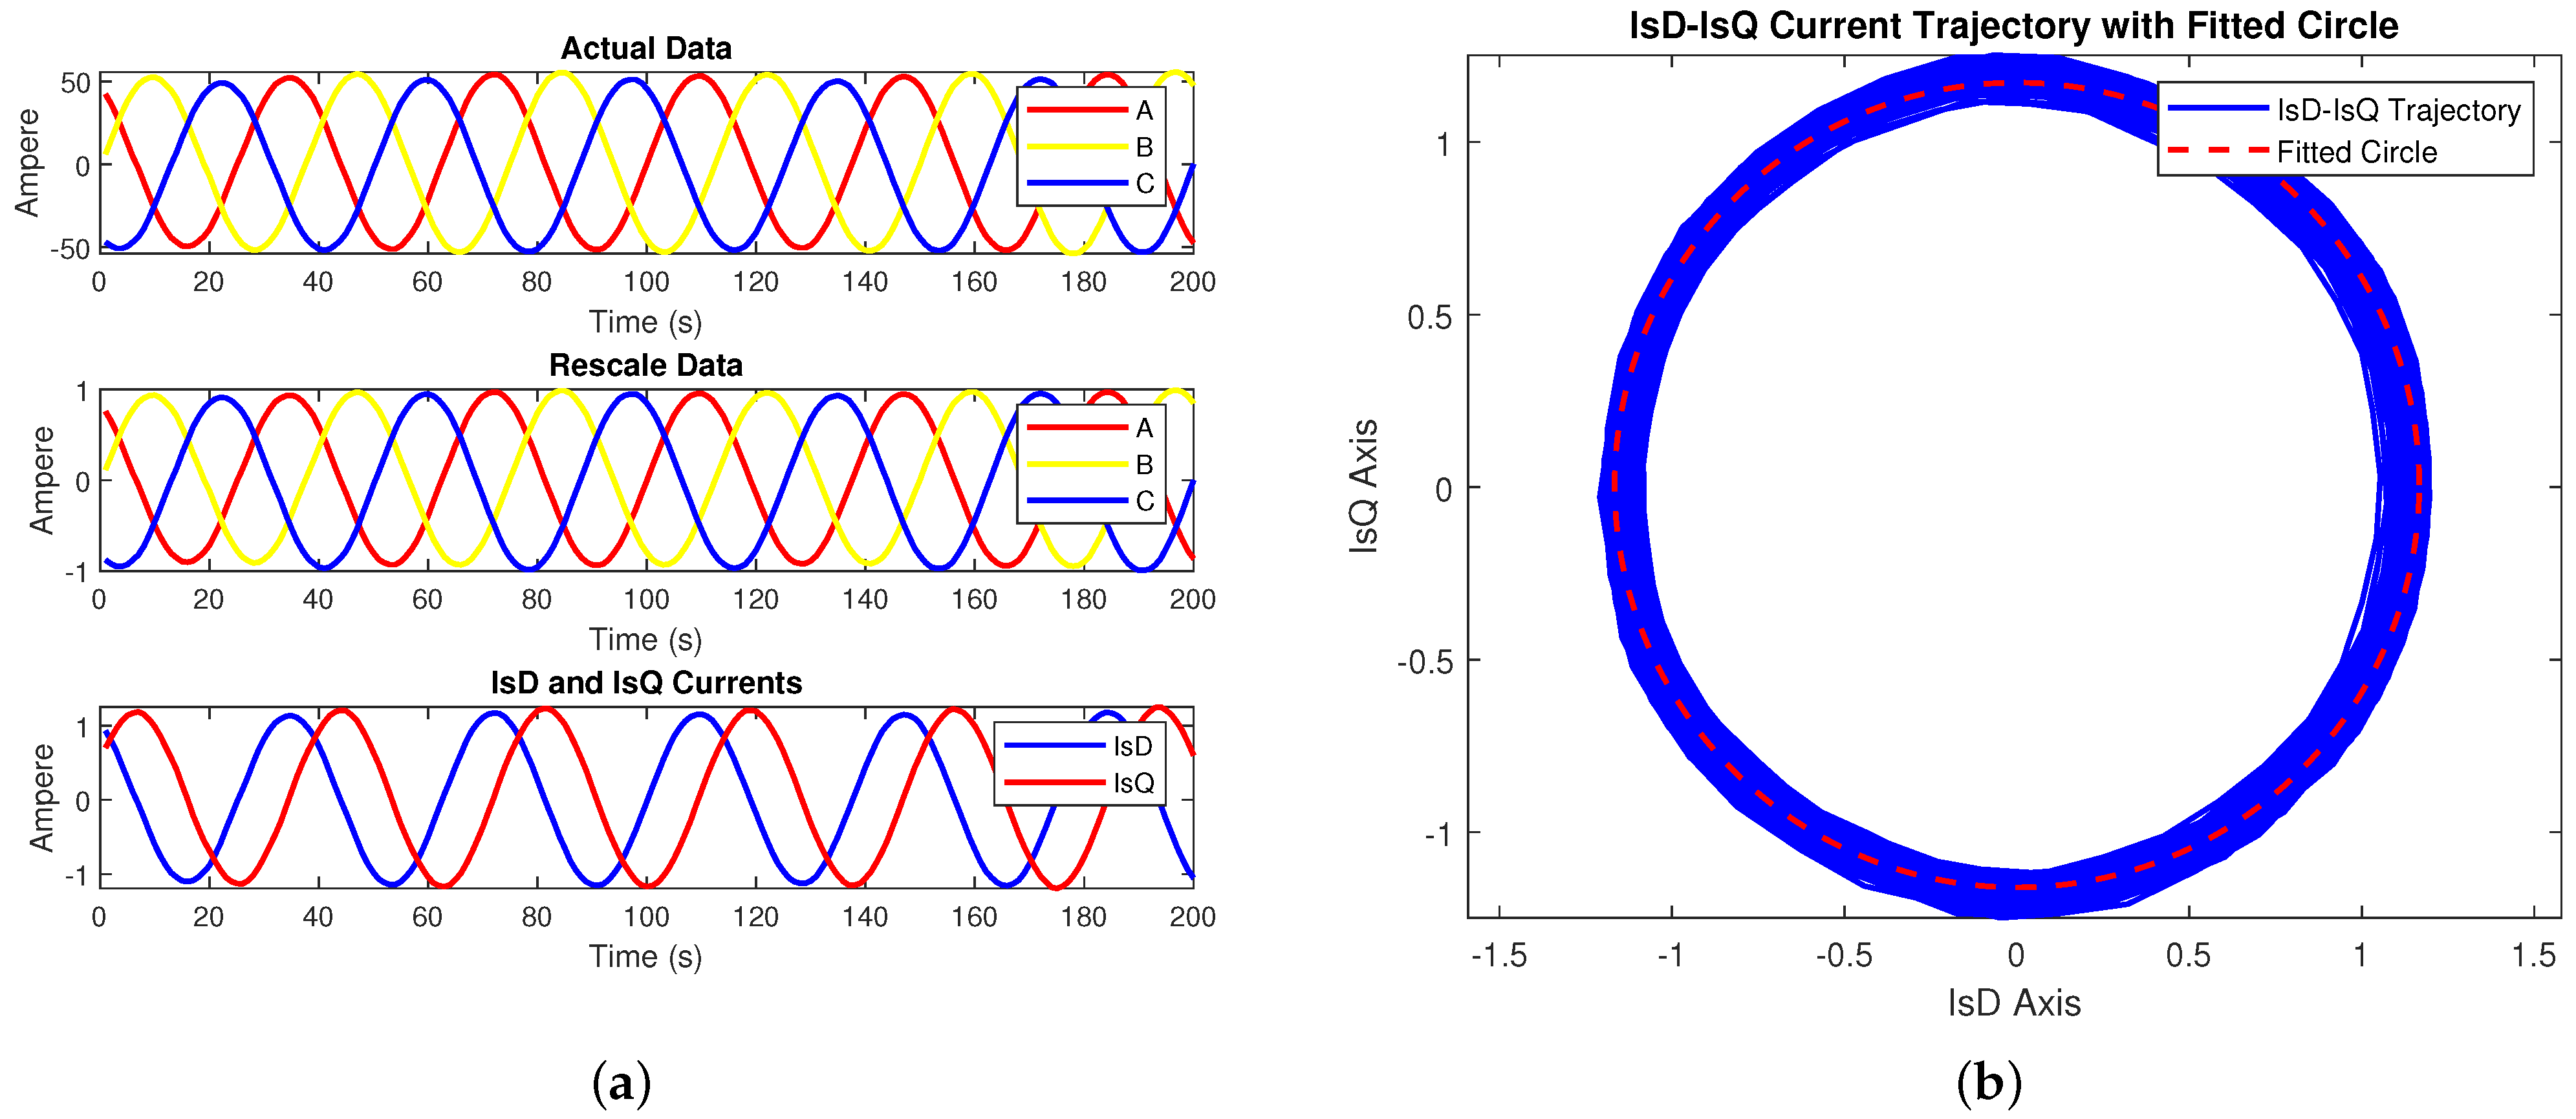
As given in Section 2.1 and Figure 2, this section presents the current trajectory analysis and presents the time-domain waveforms as well as the corresponding current trajectory plot. As an example case, Figure 6a displays the transformation of the 3- currents of motor ID “E22802-01”, including , , and , into their IsD and IsQ components with actual data, rescaled data for standardization, and the currents essential for motor condition assessment. Figure 6b shows the trajectory against a reference circle, where the near-circular shape indicates a healthy motor with minimal distortion.
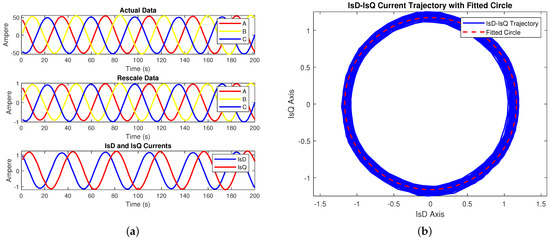
Figure 6.
trajectory analysis of motor ID “E22802-01”. (a) Sinusoidal current waveforms and IsD and IsQ currents and (b) trajectory.
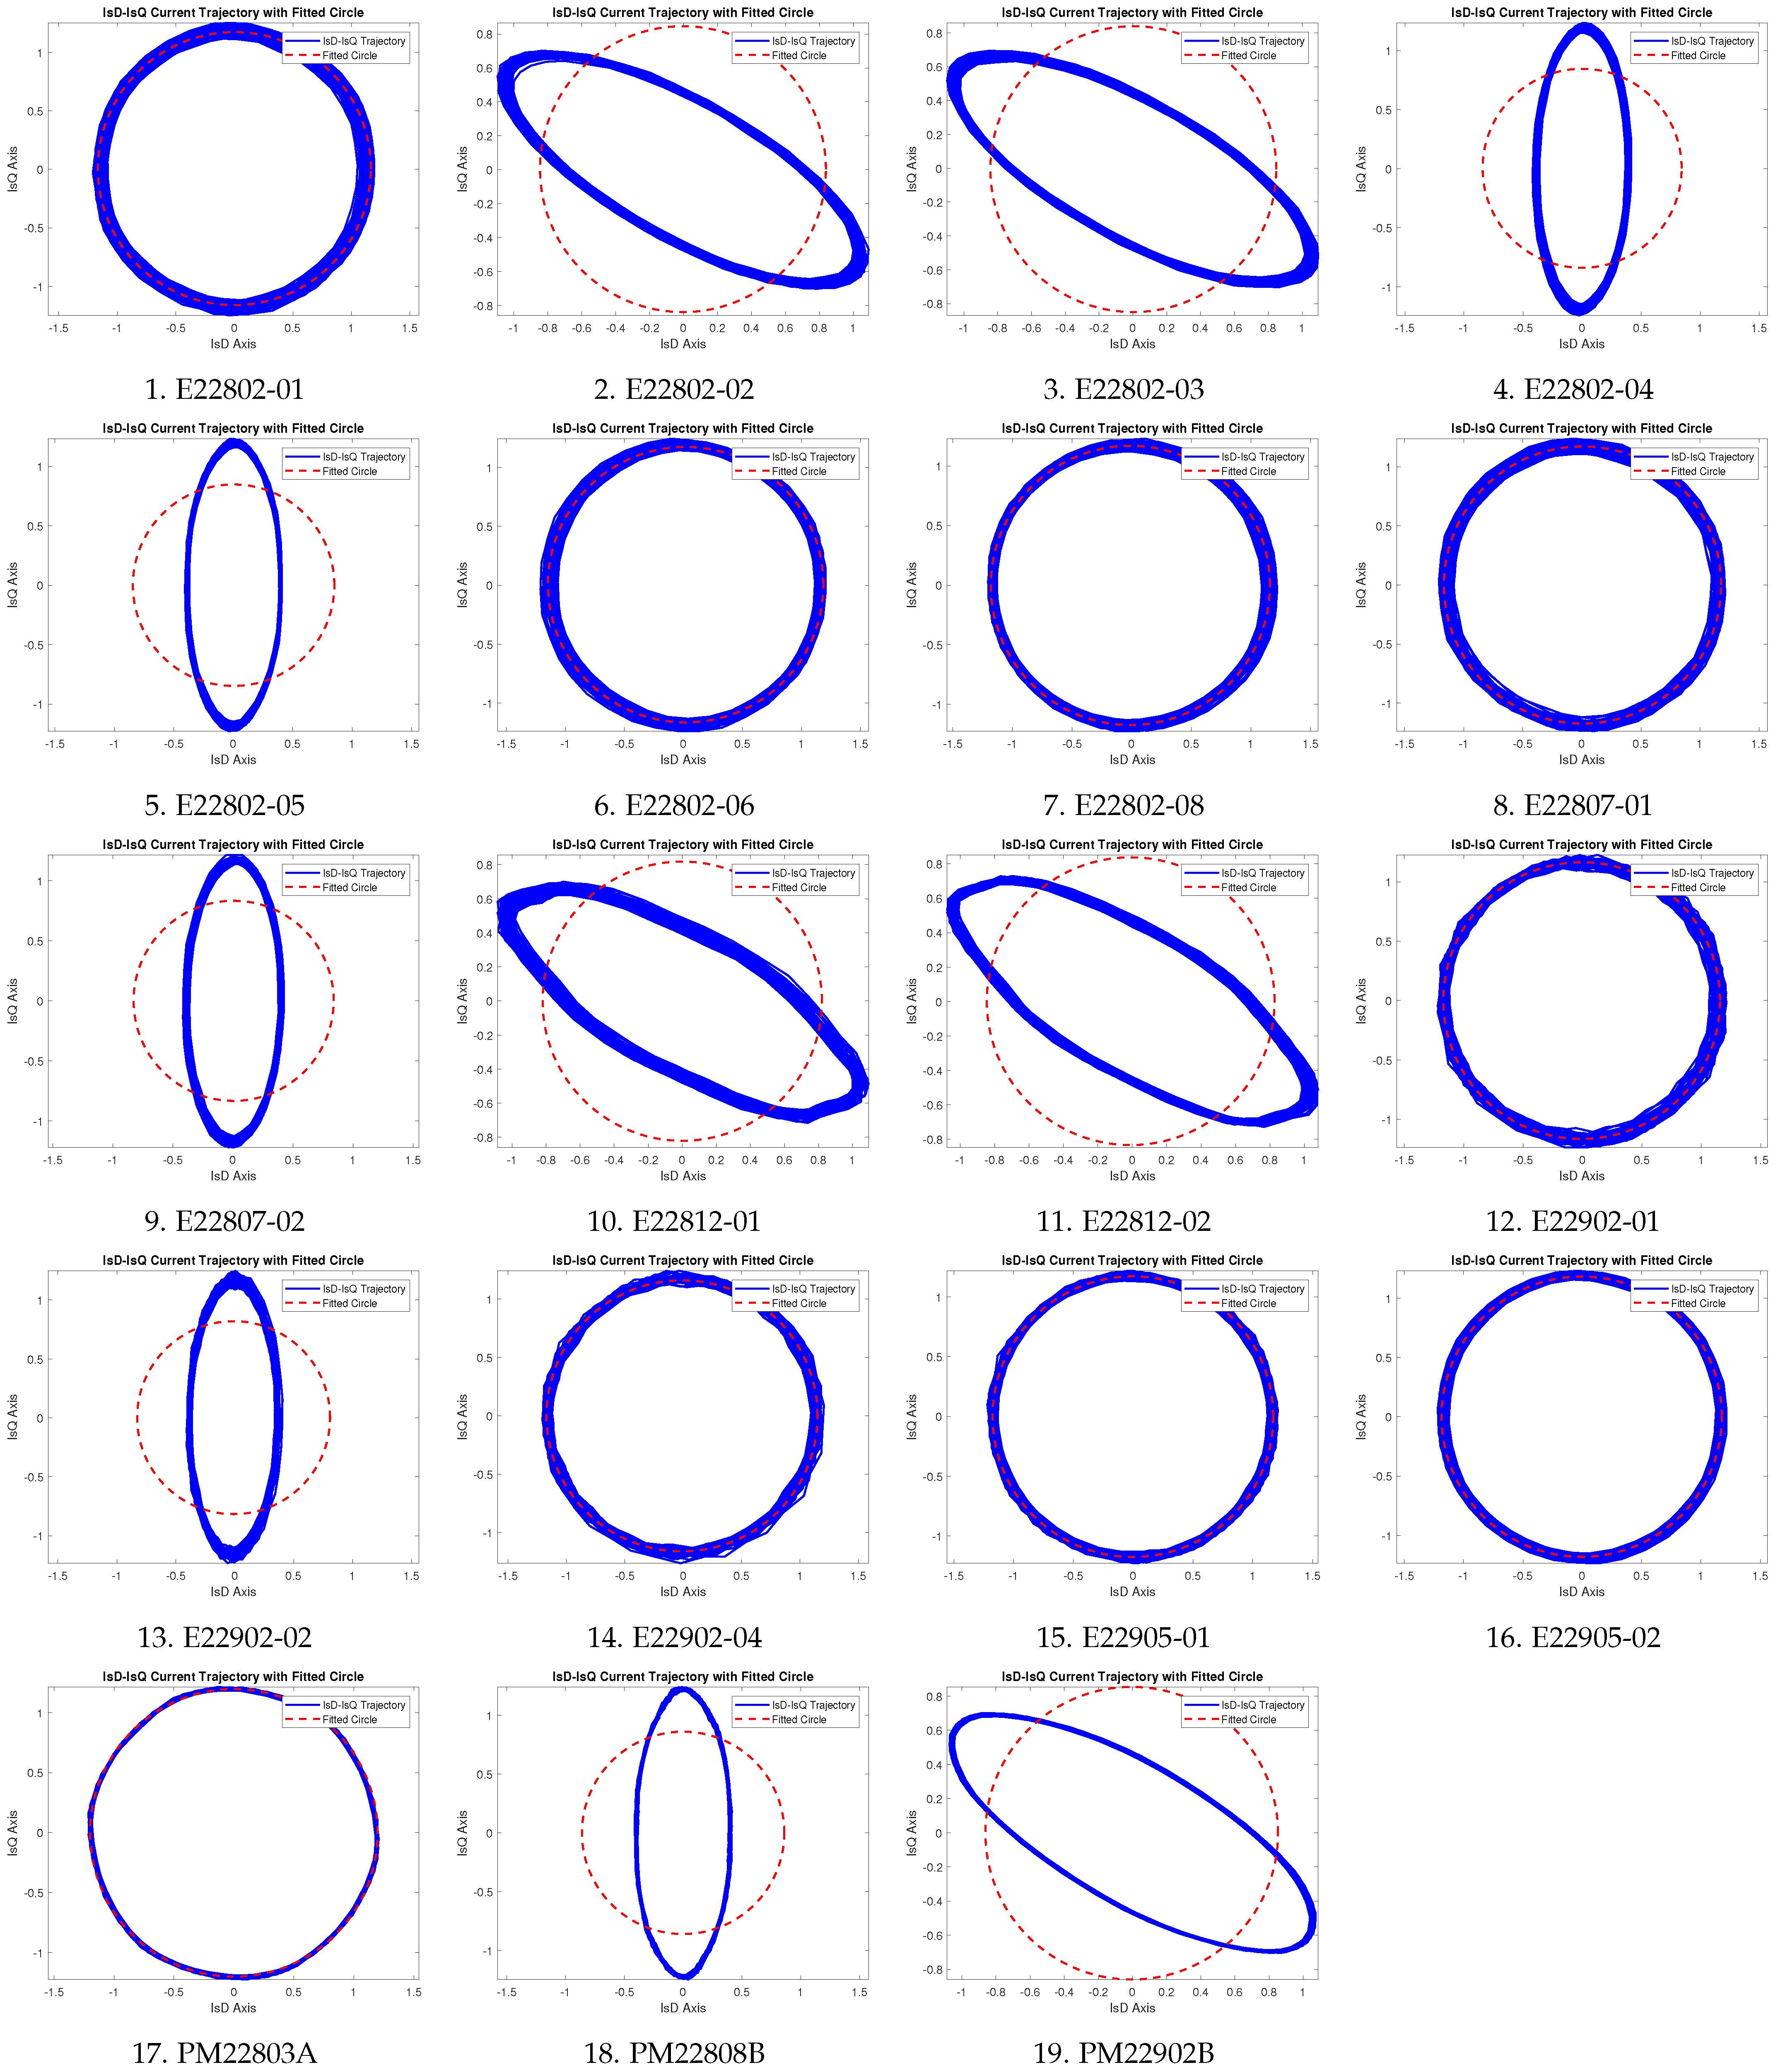
The visualization in Figure 6 provides a foundation for analyzing variations in current trajectories across different motors of CGPP-A plant, as shown in Figure 7, and Table 2 provides a comprehensive evaluation of the health condition of the induction motors using Park’s Vector technique. Each motor’s trajectory is plotted against a reference circle to assess the deviations from an ideal circular pattern, with the percentage deviation presented in the accompanying table. Motors with a low value exhibit nearly circular trajectories, indicating minimal distortion and healthy operation. Examples of such motors include E22802-01 with a deviation of , E22802-06 with , E22807-01 with , E22902-01 with , E22905-01 with , E22905-02 with , and PM22803A with the lowest deviation of , signifying the best operational condition. In contrast, motors with moderate deviations between 25 and 30% exhibit elliptical or distorted trajectories, suggesting potential stator or rotor imbalances. These motors include E22802-02 and E22802-03, both showing a deviation of , E22802-04 with , E22802-05 with , E22807-02 with , E22812-01 with , E22812-02 with , E22902-02 with , PM22808B with , and PM22902B with . Motors with deviations close to , such as E22902-02 with , exhibit severe distortion, indicating critical faults requiring immediate attention. The results highlight the effectiveness of analysis in detecting anomalies in motor performance, allowing for preventative maintenance strategies to prevent unexpected failures, reduce downtime, and extend the overall operational lifespan of motors.
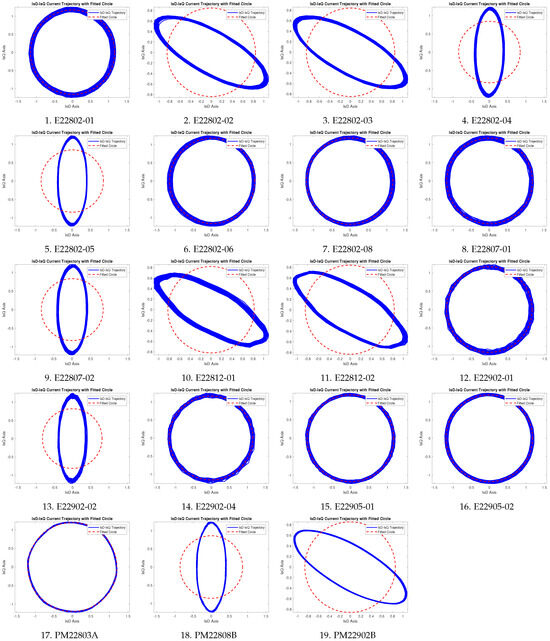
Figure 7.
trajectory analysis of 19 motors at CGPP-A plant.
Table 2.
Performance of 52 motors at CGPP-A, CGPP-B, and CGPP-C plants using analysis.
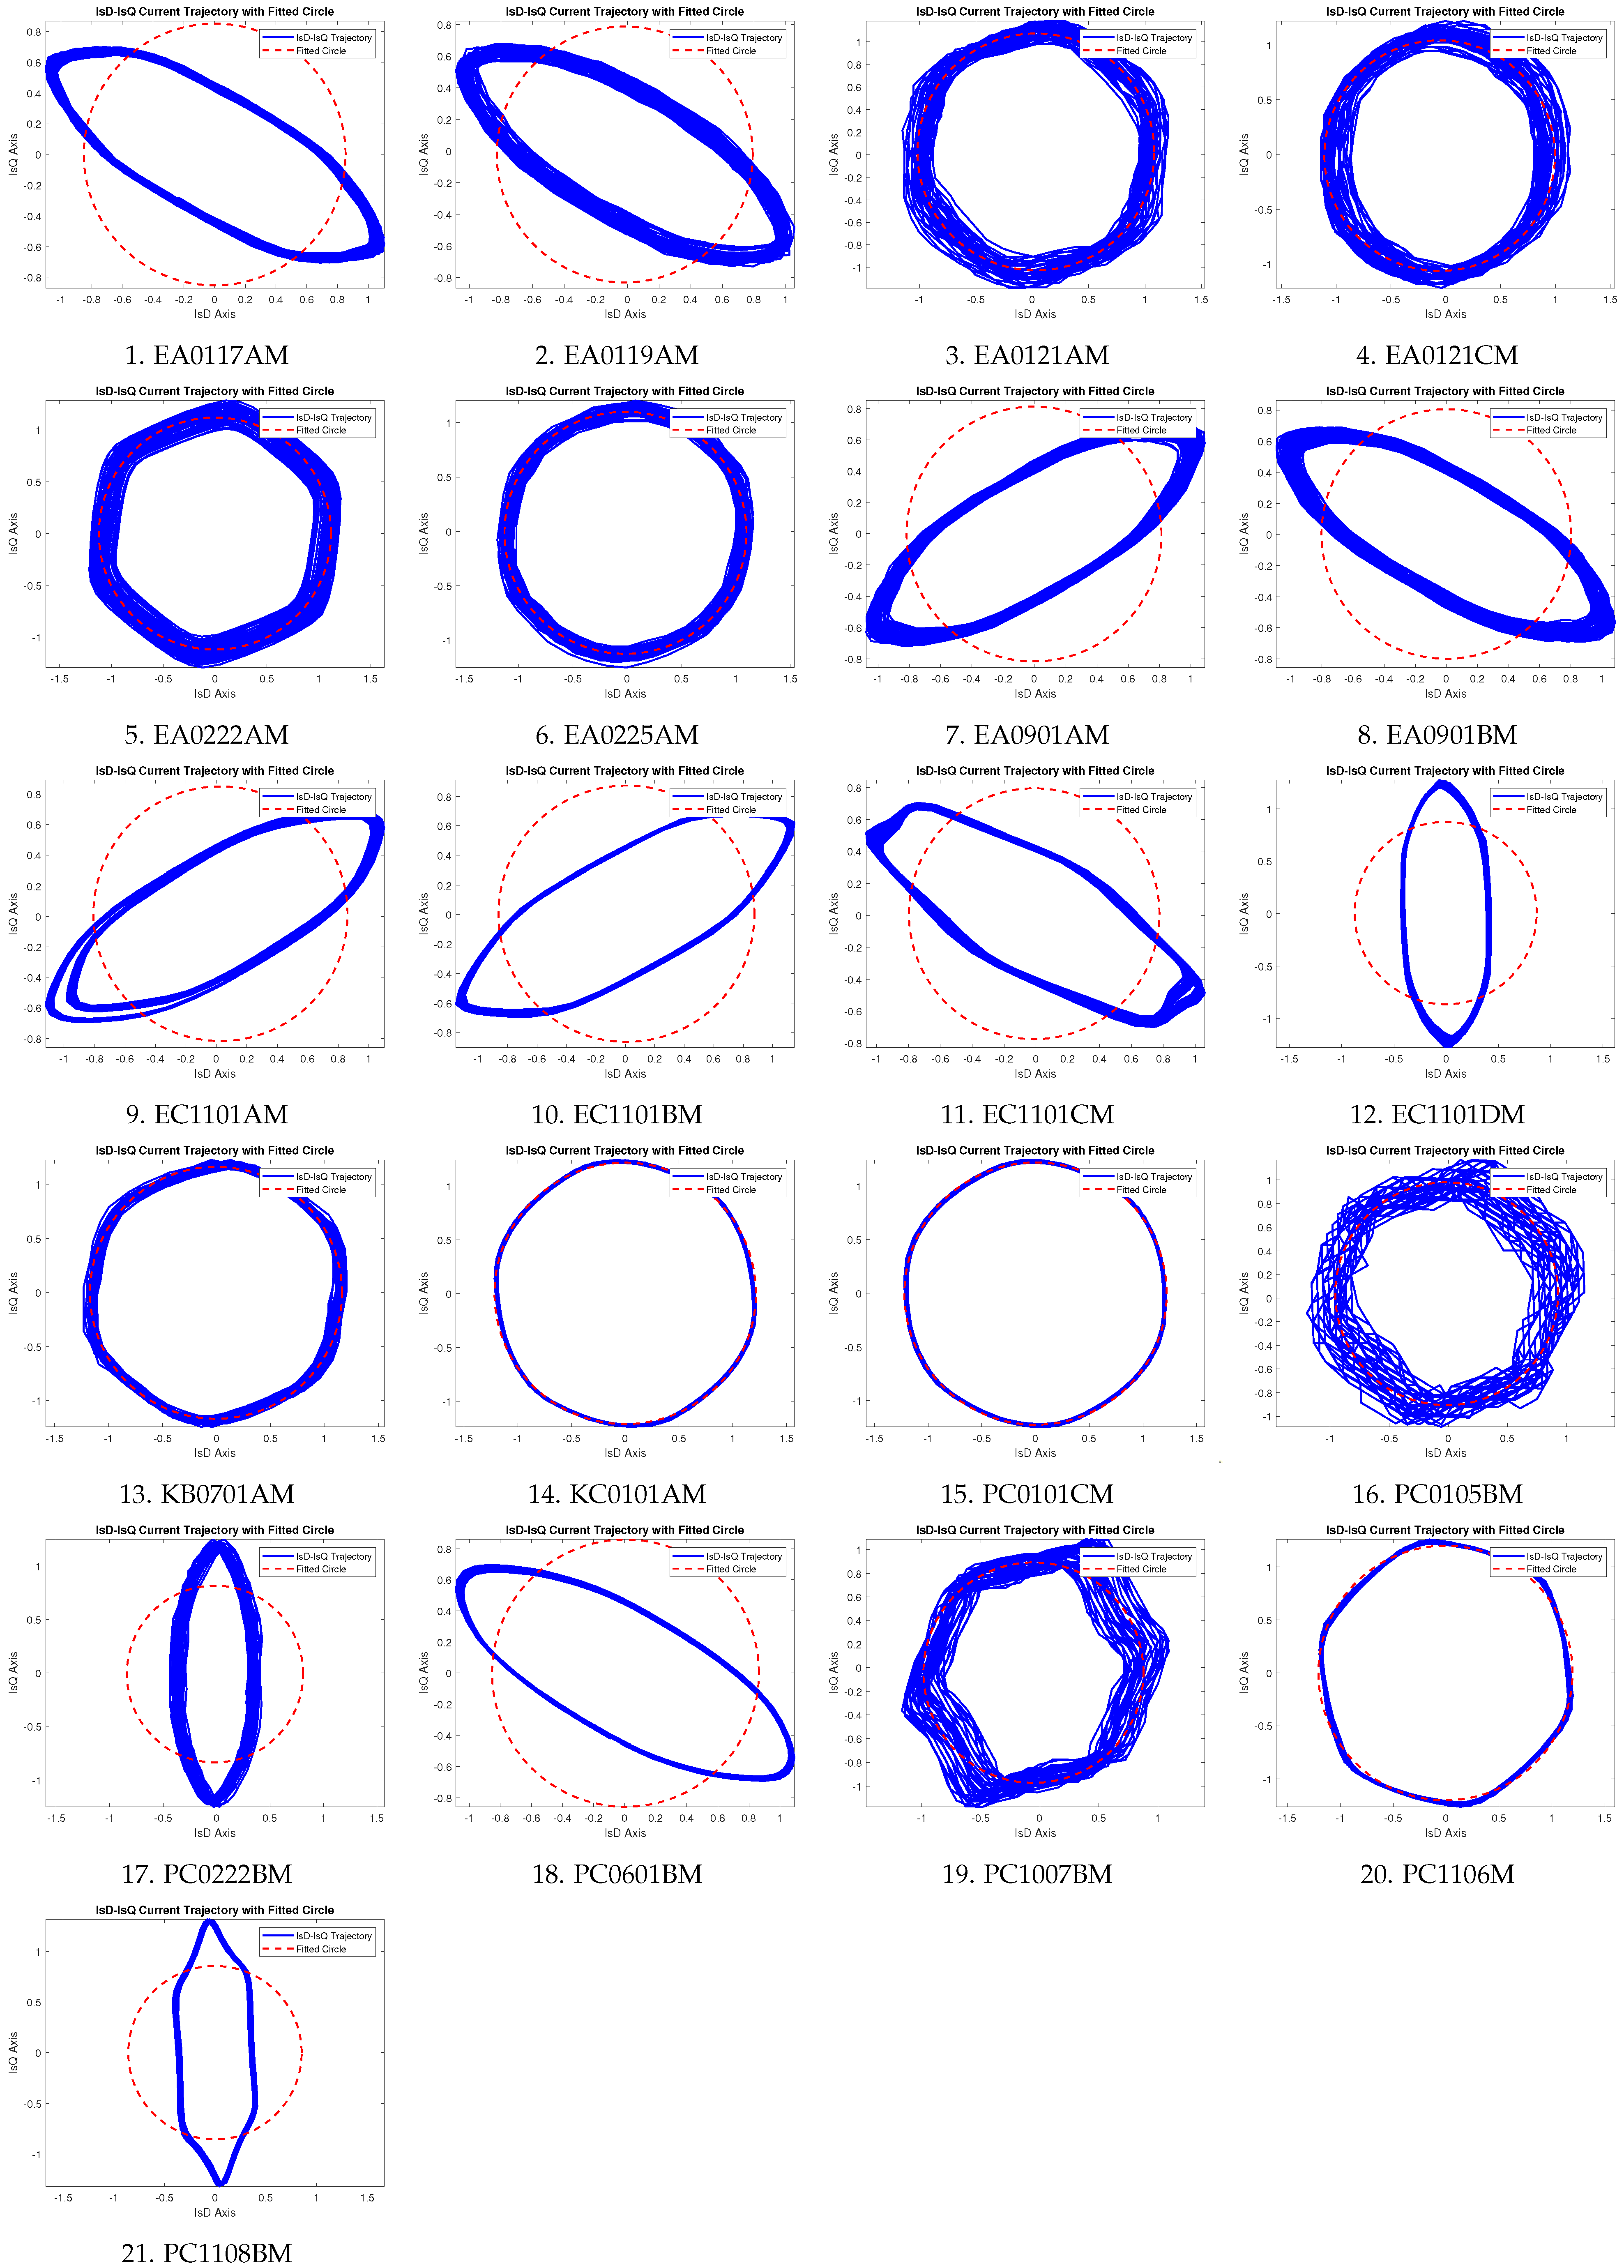
Similarly, Figure 8 presents the 21 motor trajectories obtained using analysis for the CGPP-B plant. Near-circular patterns are associated with minimal electrical distortion and proper functioning, while elliptical trajectories indicate potential internal faults, such as stator winding issues. The health condition of each motor is further quantified by the percentage deviation delta from the ideal reference circle, as detailed in Table 2. Motors such as PC0101CM with a deviation of , KC0101AM with , and KB0701AM with have low deviation, suggesting excellent operational health. Motors with moderate deviation, such as EA0121AM with , EA0222AM with , and PC1007BM with , exhibit minor anomalies that may require monitoring. However, several motors exhibit high deviations above , indicating serious distortions in current trajectories. These include EC1101CM with , PC0222BM with , EC1101AM with , and EA0901AM with . Such deviations are visualized in Figure 8 as significantly extended ellipses, indicating potential critical faults that require immediate maintenance.
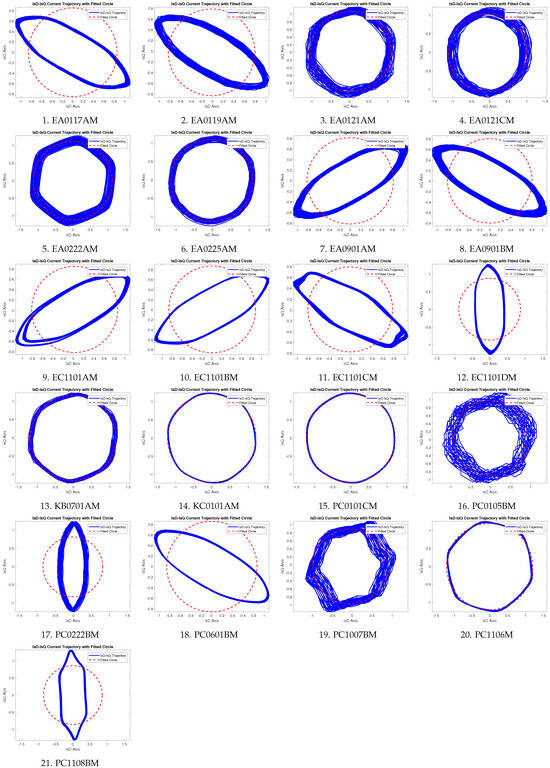
Figure 8.
trajectory analysis of 21 motors at CGPP-B plant.
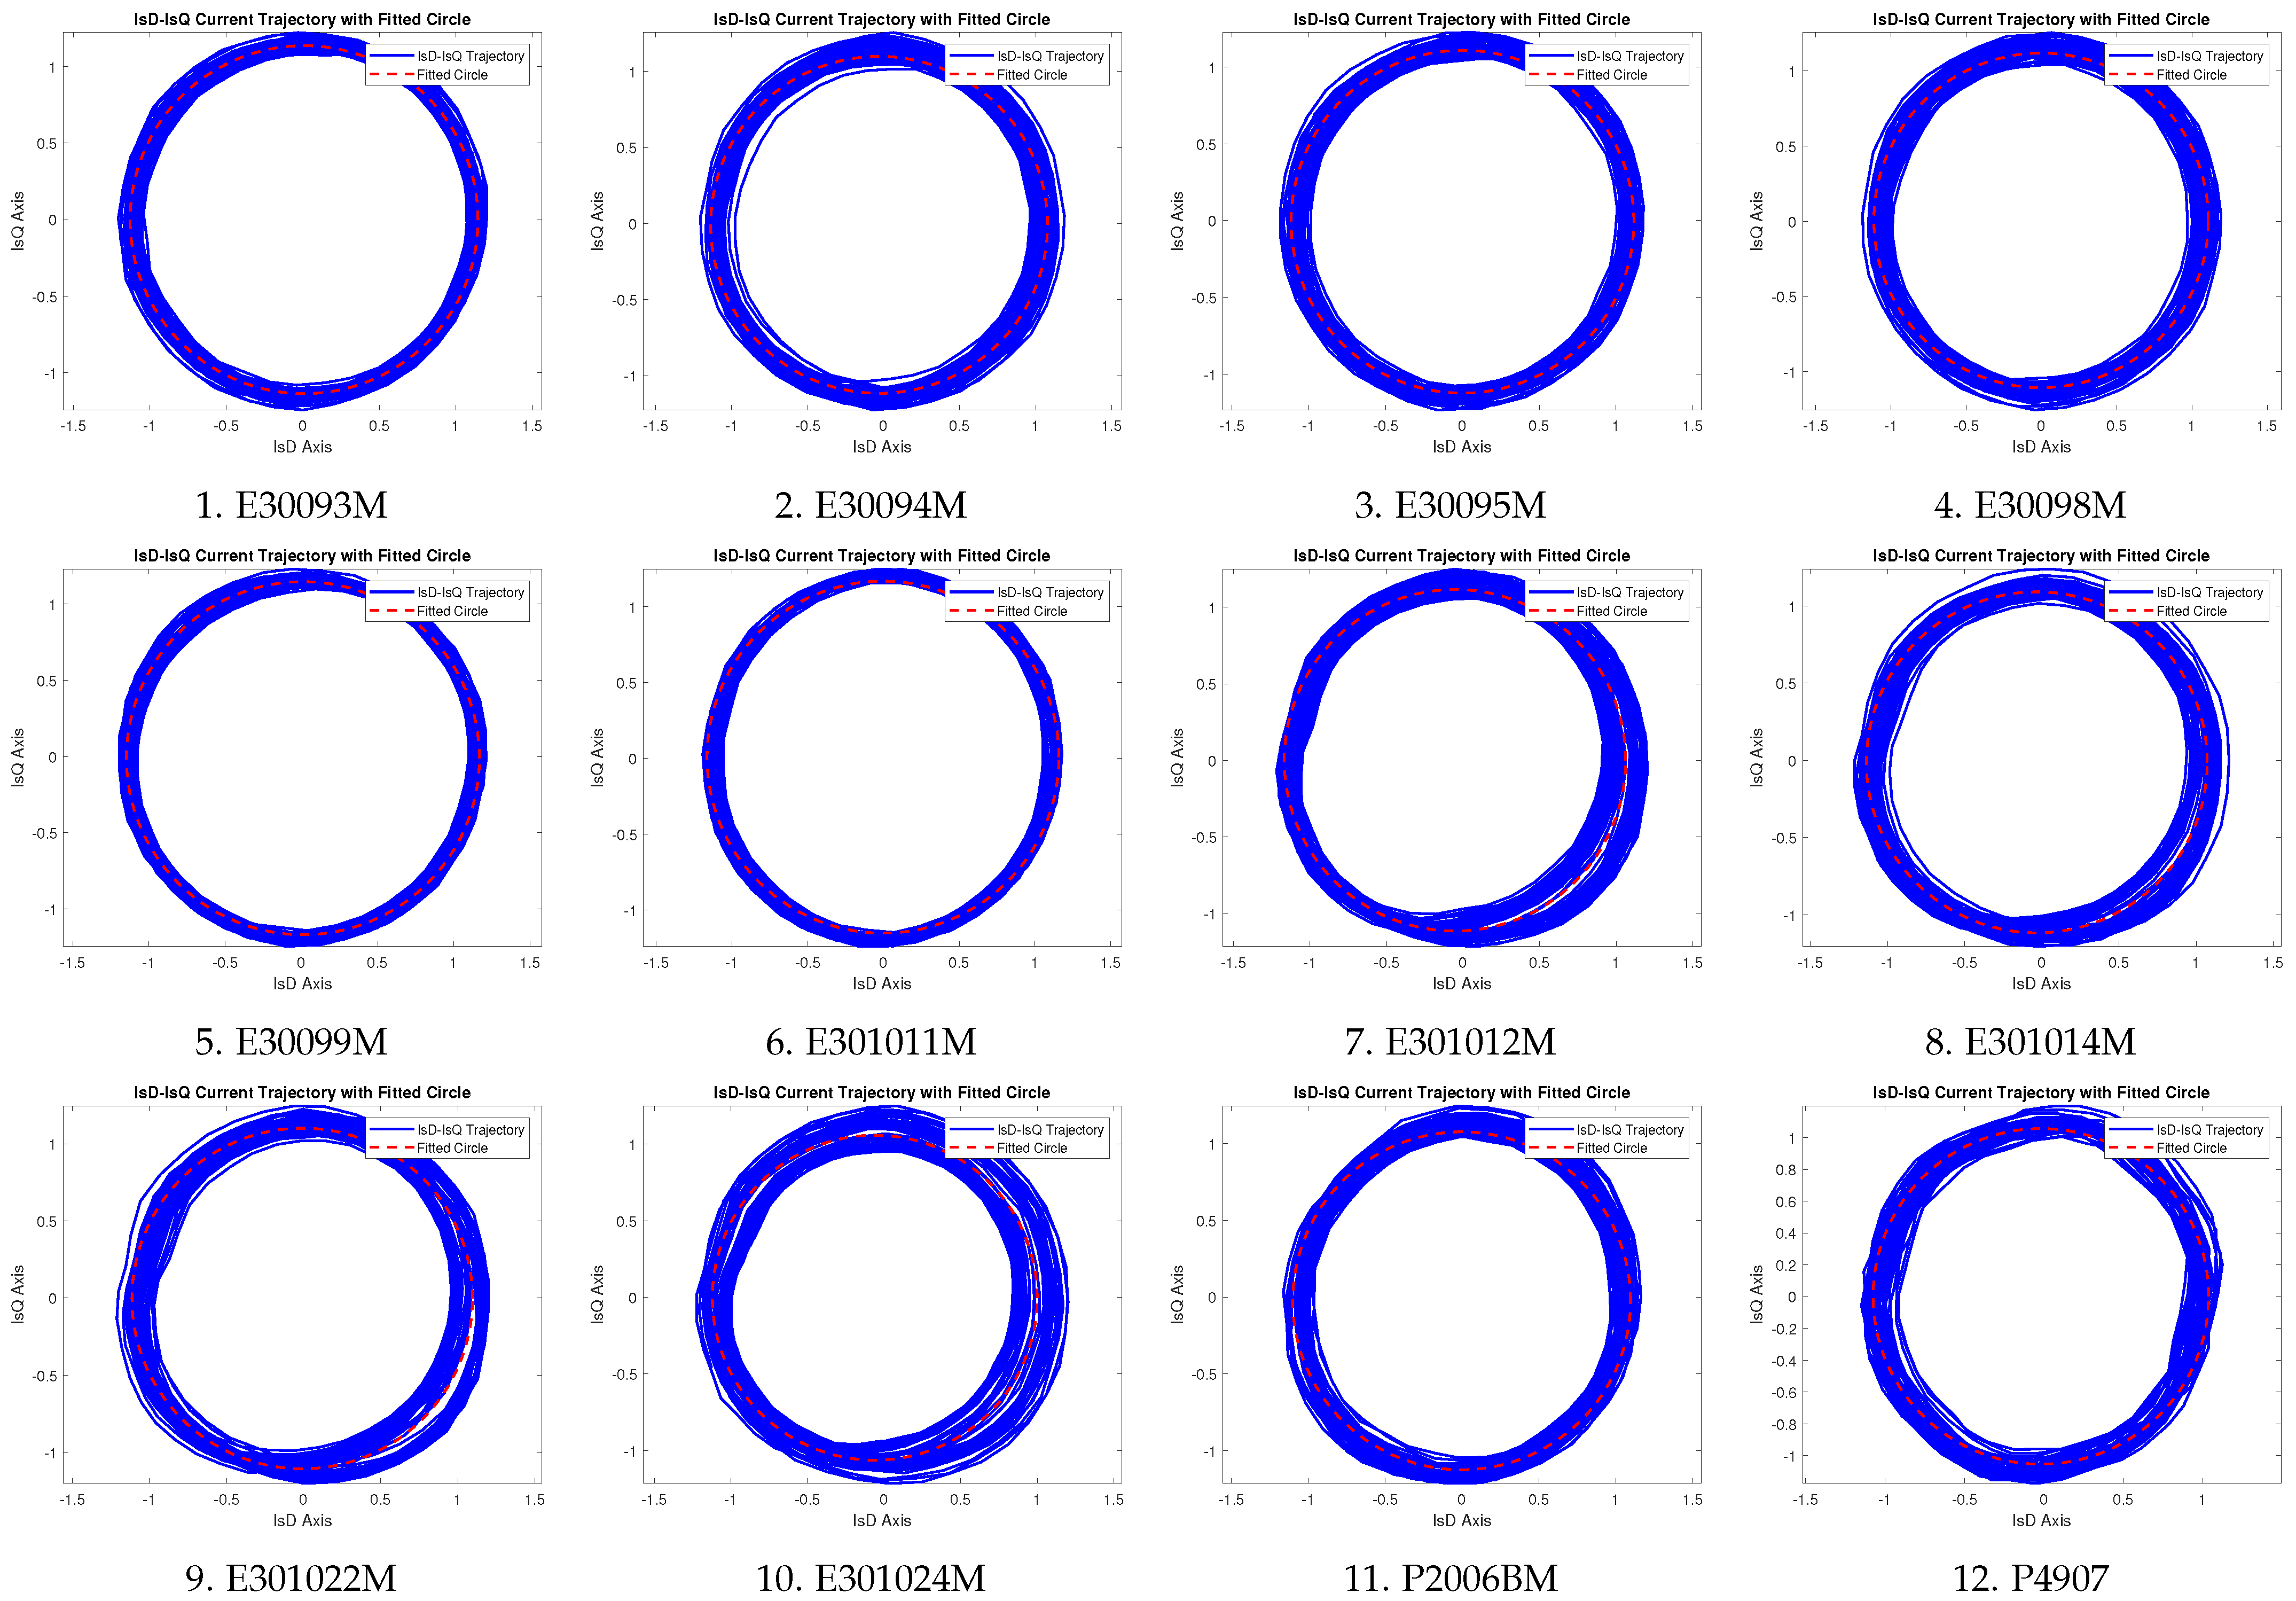
Furthermore, Figure 9 shows the current trajectories of 12 motors from the third plant, CGPP-C. The deviation from the ideal reference circle, represented as the delta in Table 2, was used to assess the electrical health of each motor. Very low deviations were recorded for motors such as E30099M at , E301011M at , and E30093M at , indicating that their operational conditions were excellent. Slightly higher deviations, yet still within an acceptable range, were noted for motors such as E30095M at , E30098M at , and P2006BM at , representing normal behavior with minor distortion. Relatively higher deviation values were exhibited by motors E301024M at and E301012M at . However, these values are below the mark and do not reflect significant fault conditions. As shown in Figure 9, no motor was found to display a highly distorted elliptical trajectory, and, thus, no critical faults were identified among the CGPP-C motors.

Figure 9.
trajectory analysis of 12 motors at CGPP-C plant.
4.2. Fast Fourier Transform (FFT) Technique
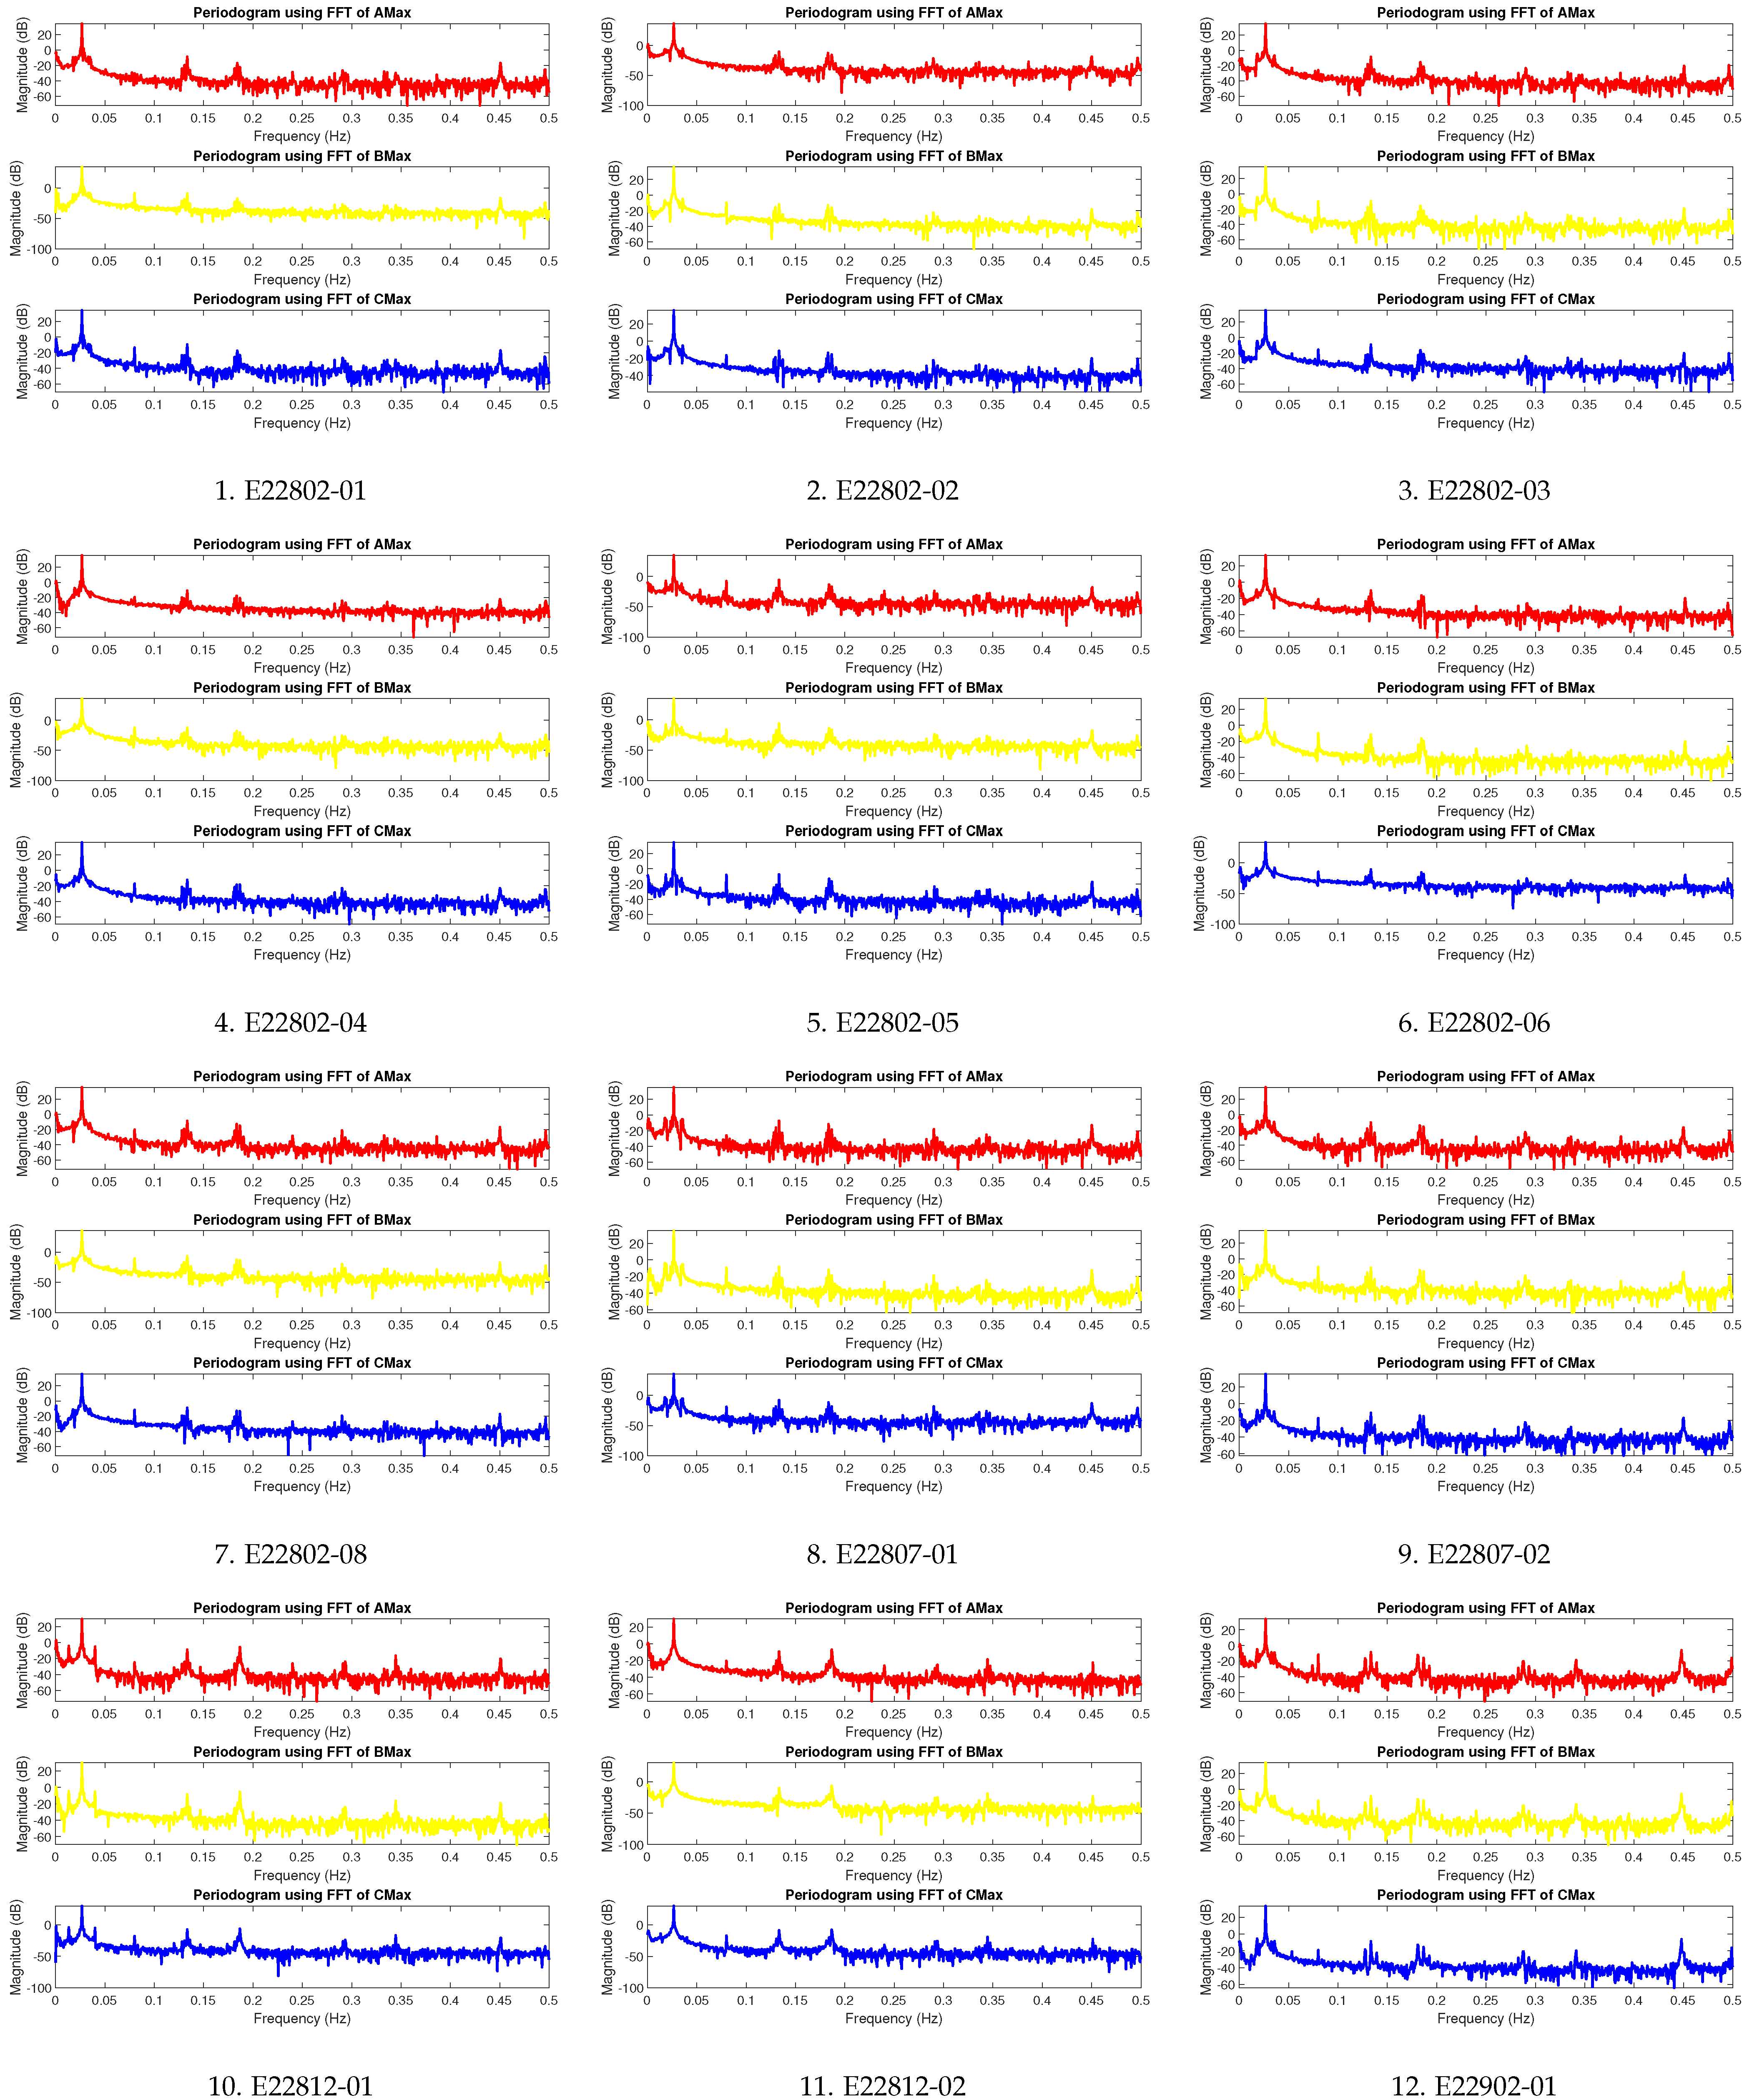
This section provides an analysis using the FFT technique, as outlined in Section 2.2 and illustrated in Figure 3. Firstly, this method examined the current signal characteristics of the 19 induction motors operating at the CGPP-A plant. The aim was to predict potential electrical faults by evaluating the second and third harmonic components in each motor’s three-phase current waveform. The motors numbered from E22802-01 to PM22902B, with spectral results shown in Figure 10, were evaluated numerically, as shown in Table 3. Each motor’s FFT spectrum was examined for abnormal harmonic content, mainly focusing on the second and third harmonics in phases A, B, and C. The HTF ratio was calculated using the harmonic magnitudes to quantify the distortion level and assess the motor condition. The healthy motors, including E22905-01, PM22803A, PM22902B, and E22807-01, had low third harmonic amplitudes across all three phases, with HTF values ranging from to . These values indicated minimal distortion, suggesting these motors were in good operational condition. Moderately distorted motors such as E22812-02, E22902-02, and PM22808B exhibited slightly elevated third harmonic components of up to in the three phases. Though not critical, these HTF values point to incipient issues, such as the early stages of winding degradation. The fault-prone motors, including E22802-05, were identified as the most severely affected, exhibiting the highest third harmonic magnitude of in phase A and in phase C. This analysis suggests electrical imbalances, which could have resulted from insulation degradation, winding asymmetry, or loose connections. The comparative harmonic analysis in Figure 10 clearly distinguishes the spectral profiles of healthy and potentially faulty motors.
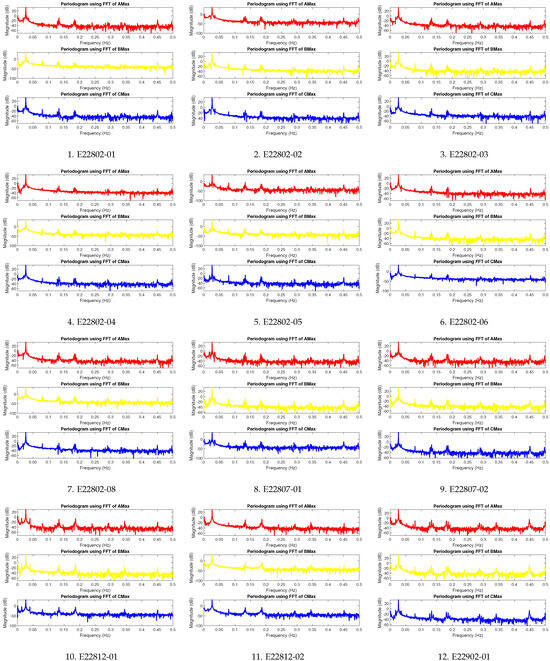
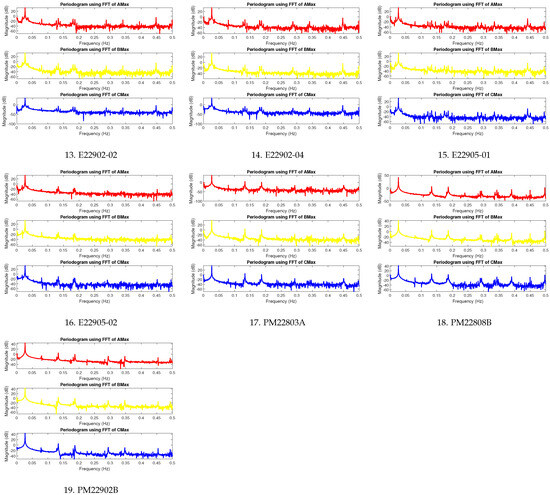
Figure 10.
FFT trajectory analysis of 19 motors at CGPP-A plant.
Table 3.
Performance analysis of 52 motors at CGPP-A, CGPP-B, and CGPP-C plants using FFT technique.
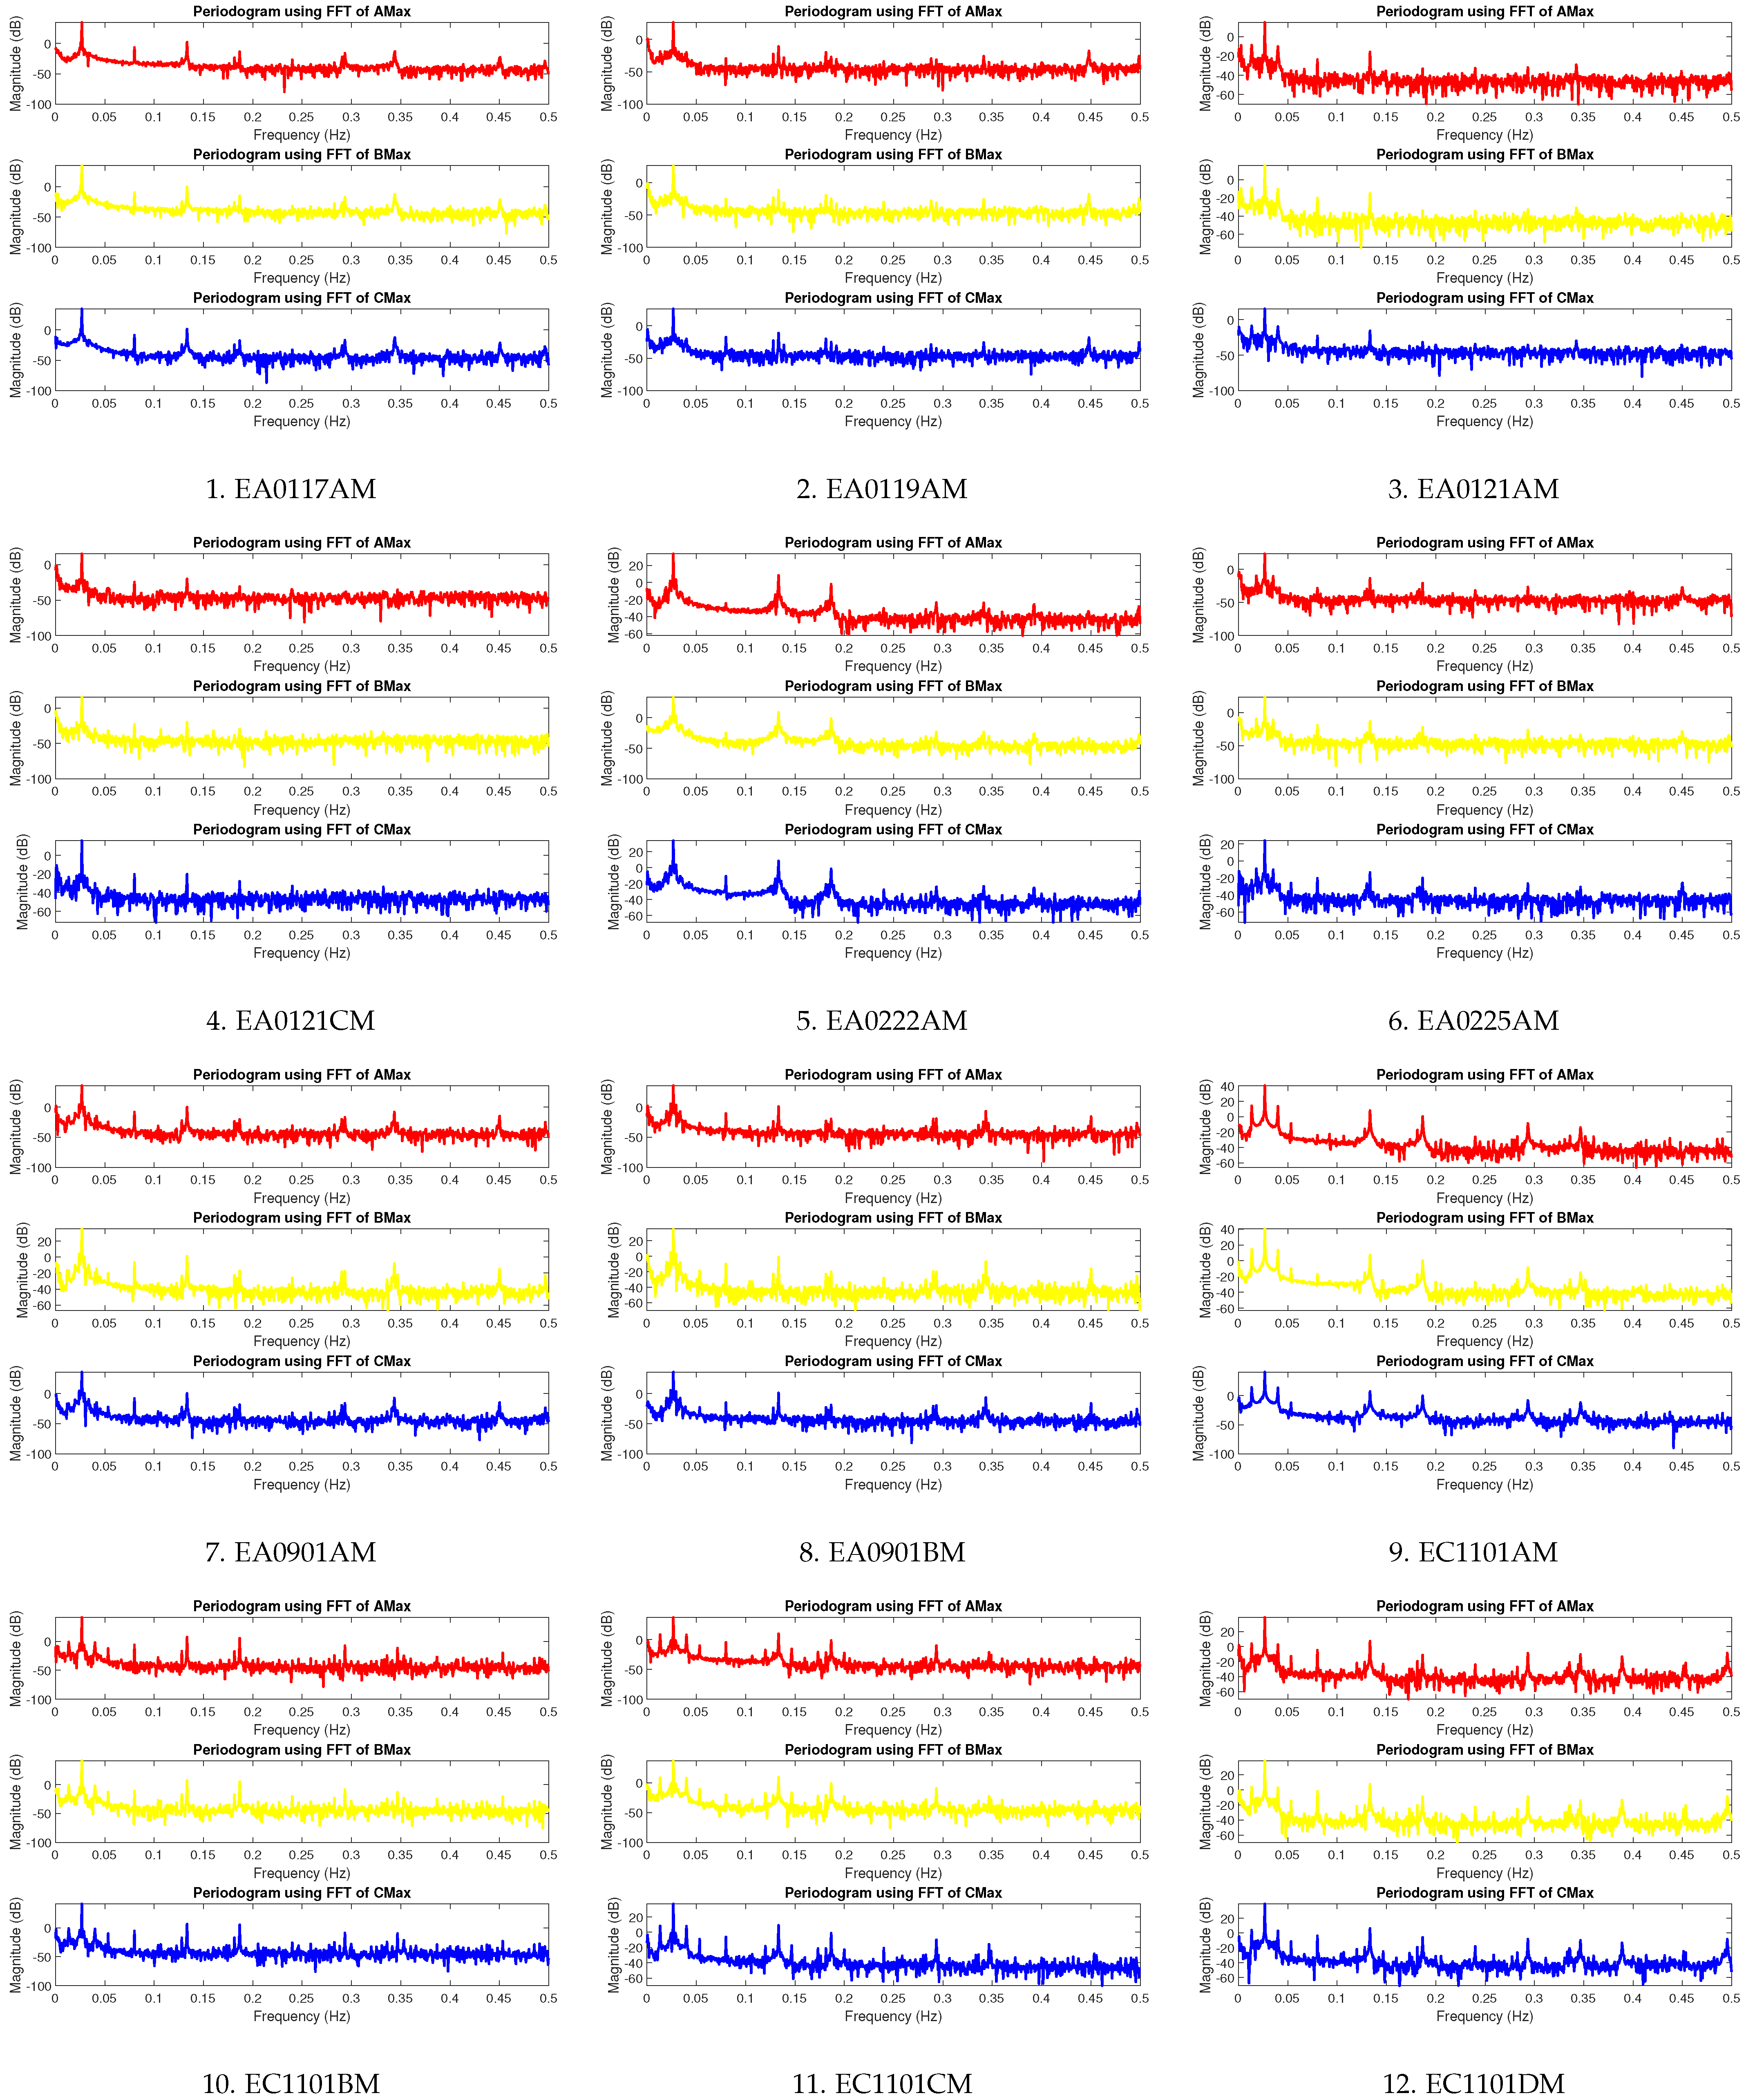
Similarly, the FFT analysis of all 21 motors at the CGPP-B plant highlighted a range of harmonic behaviors across the system, as shown in Table 3 and Figure 11. Motor EA0117AM demonstrated excellent performance, with harmonic-to-fundamental ratios of in phase A, in phase B, and in phase C, indicating extremely clean signal characteristics. EA0217BM remained well balanced, though phase A showed a slightly higher second harmonic at , compared to in phase B and in phase C. EA0317CM maintained a good profile, with ratios of in phase A, in phase B, and in phase C. EA0418AM showed consistent third harmonic values with in phase A, in phase B, and in phase C, all of which remained low. Motor EA0518BM stood out with highly suppressed harmonic components, just in phase A, in phase B, and in phase C. EA0618CM, though generally clean, had a slightly higher distortion in phase A at , while phases B and C were at and , respectively. Motor EA0719AM had an increase in harmonic content, especially in phases A and C at and , respectively, with phase B maintained at . EA0819BM displayed similar behavior, with elevated ratios of in phase A, in phase B, and in phase C. For EA0919CM, the third harmonic content in phase C reached , while phases A and B were and . EA1020AM showed low distortion levels across all phases, with in phase A, in phase B, and in phase C.
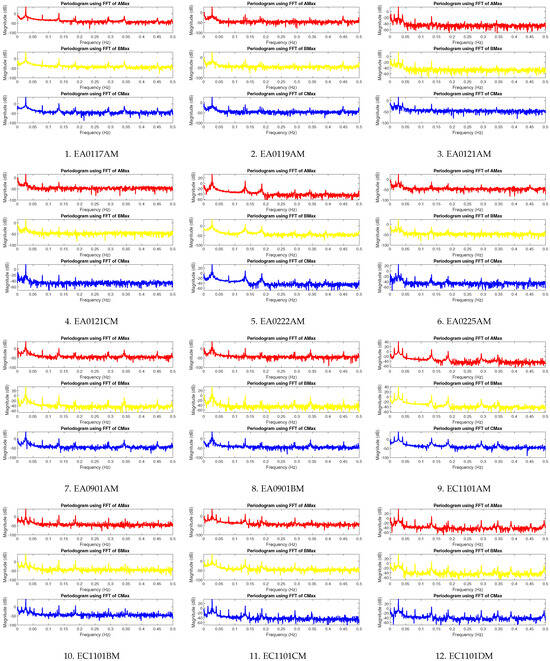
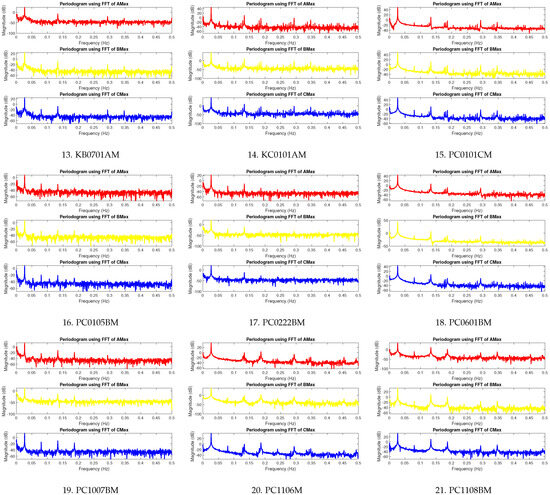
Figure 11.
FFT trajectory analysis of 21 motors at CGPP-B plant.
PC0101CM had moderate distortion, with in phase A, in phase B, and in phase C. PC0102AM showed the highest distortion in phase A at , followed by in phase B and in phase C. PC0103BM remained moderate with in phase A, in phase B, and in phase C. Motor PC0104CM operated with harmonics of in phase A, in phase B, and in phase C. However, PC0105BM exhibited severe distortion, registering in phase A, in phase B, and in phase C, indicating potential resonance or s fault condition that requires immediate attention. PC1007BM also had a high harmonic profile, with in phase A, in phase B, and in phase C, confirming a stressed operating condition. PC1008CM had moderate distortion with in phase A, in phase B, and in phase C. Motors PC1101AM and PC1102BM showed consistent performance. PC1101AM had in phase A, in phase B, and in phase C, while PC1102BM recorded in phase A, in phase B, and in phase C. PC1103CM and PC1104AM demonstrated relatively balanced operation, with PC1103CM at , , and , and PC1104AM at , , and across phases A, B, and C, respectively. Finally, PC1108BM exhibited excellent harmonic suppression, with ratios of in phase A, in phase B, and in phase C, confirming stable and healthy motor behavior.
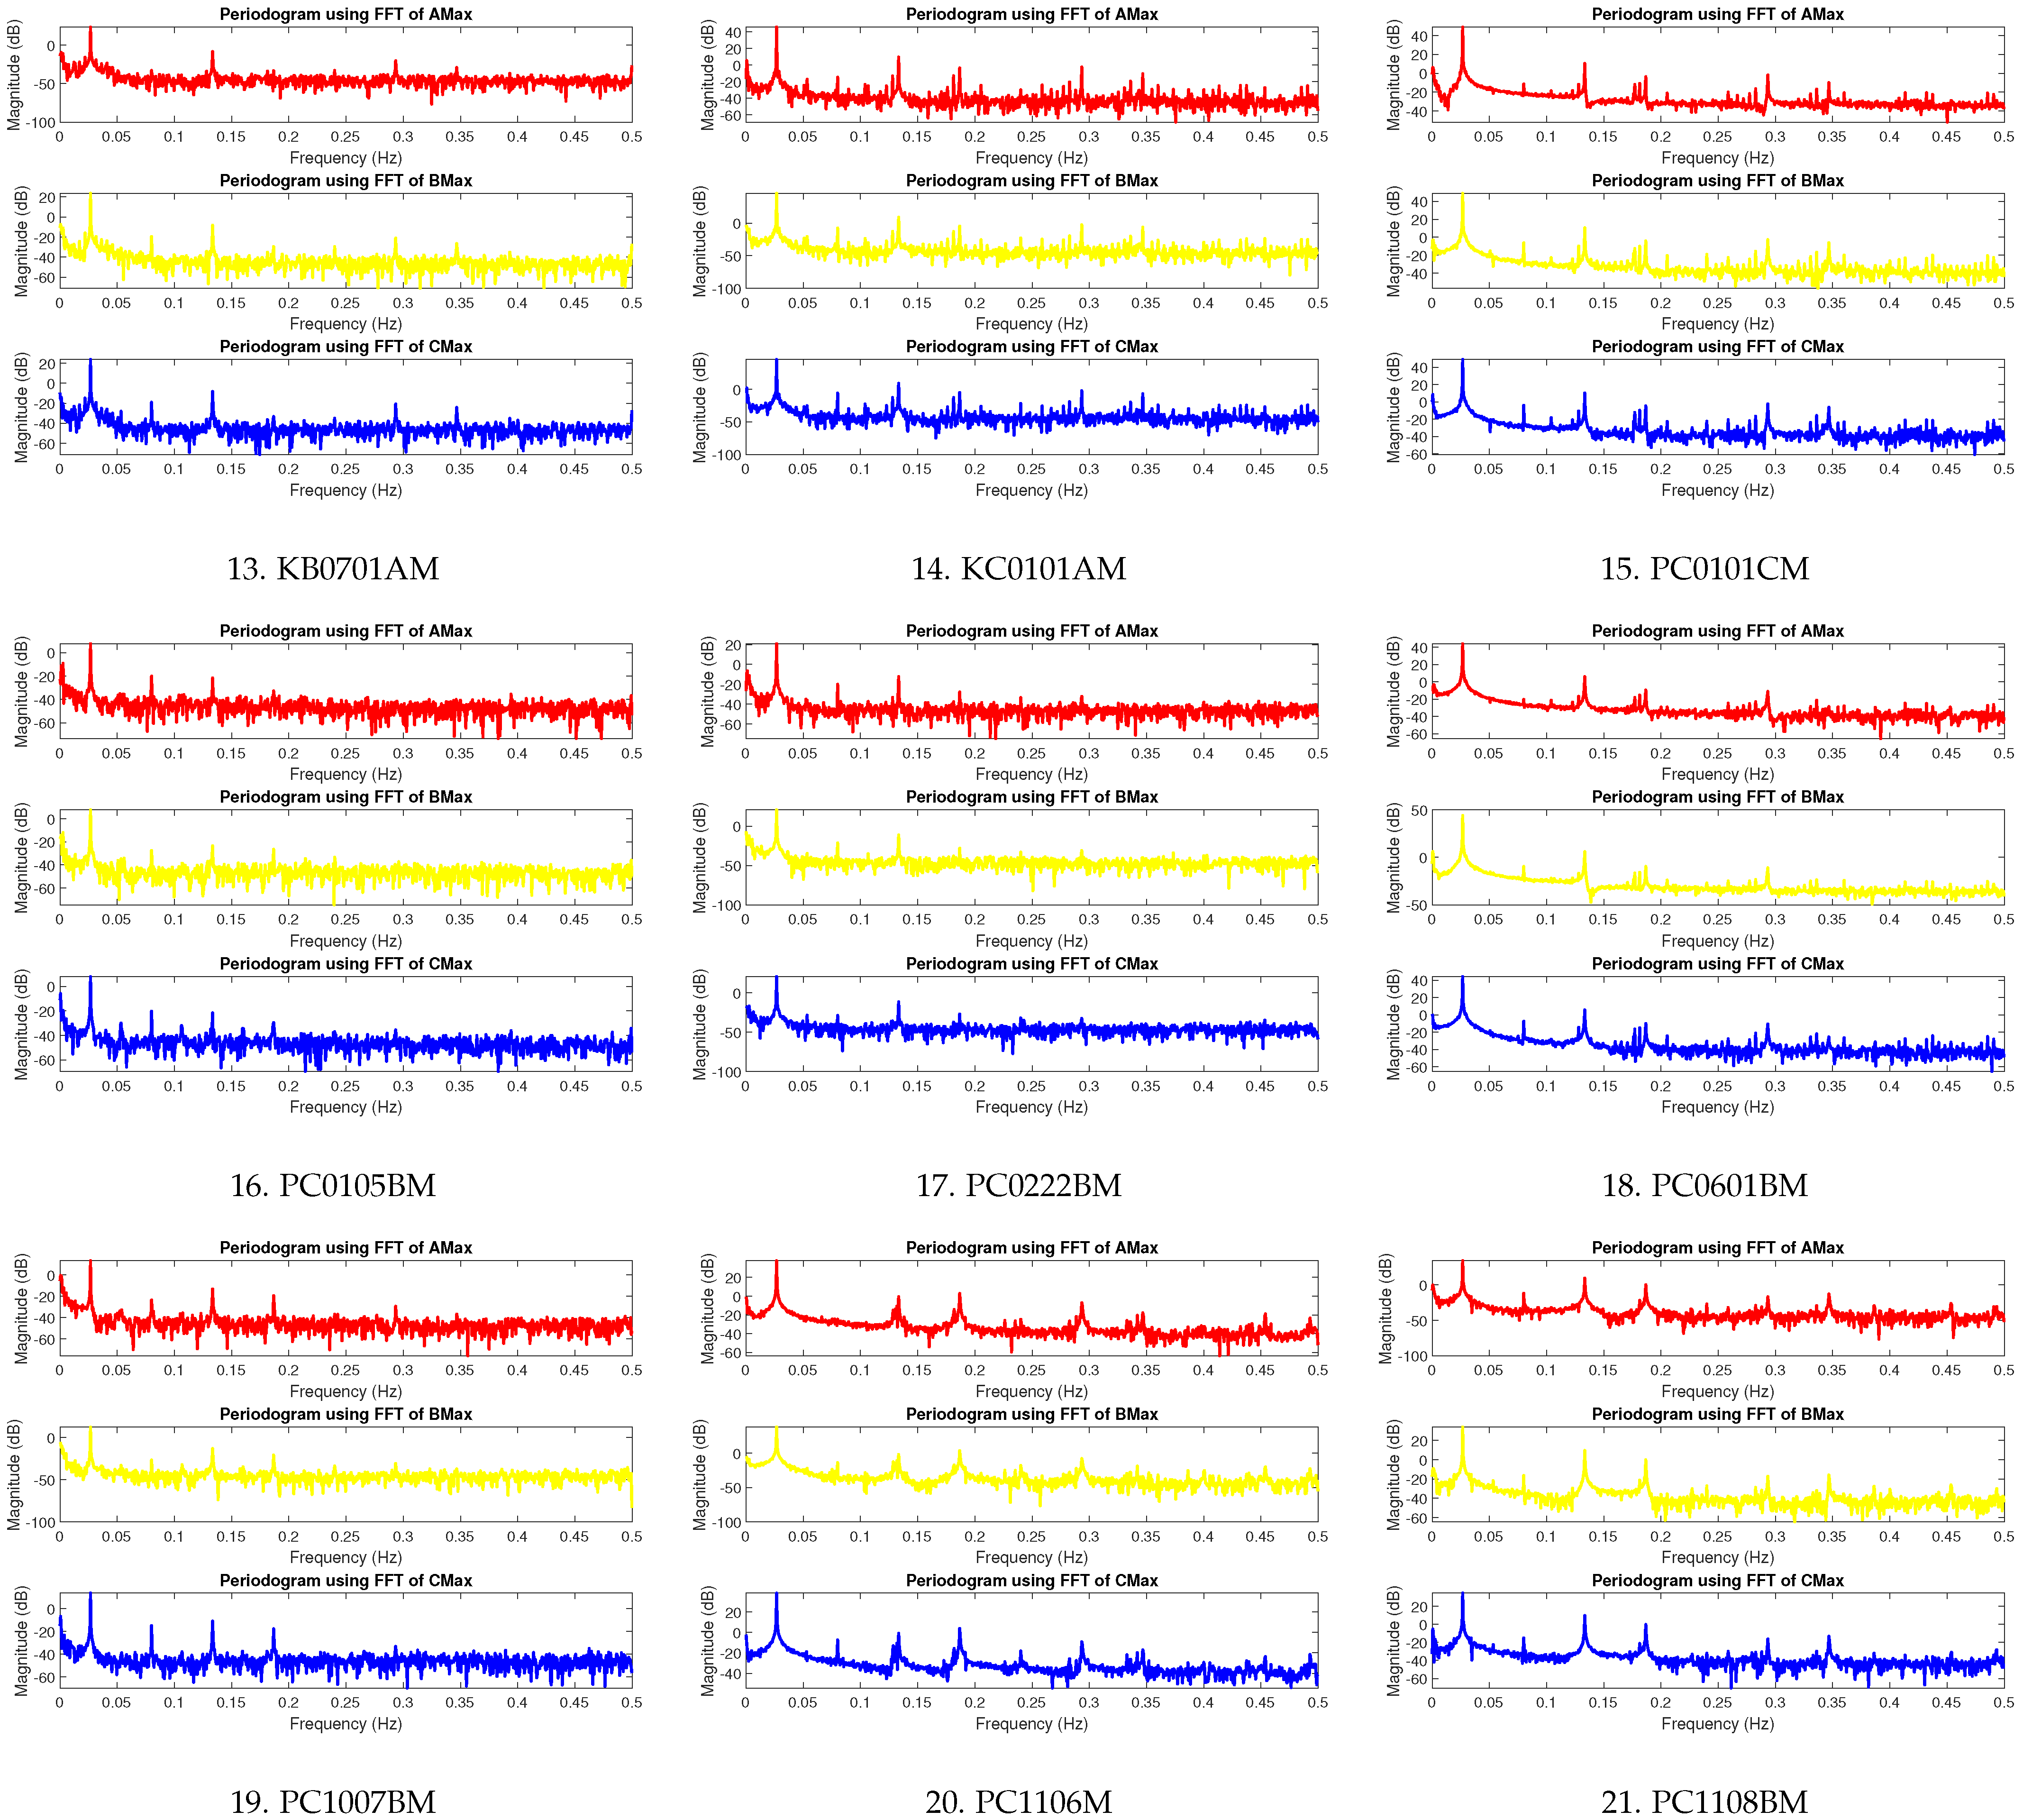
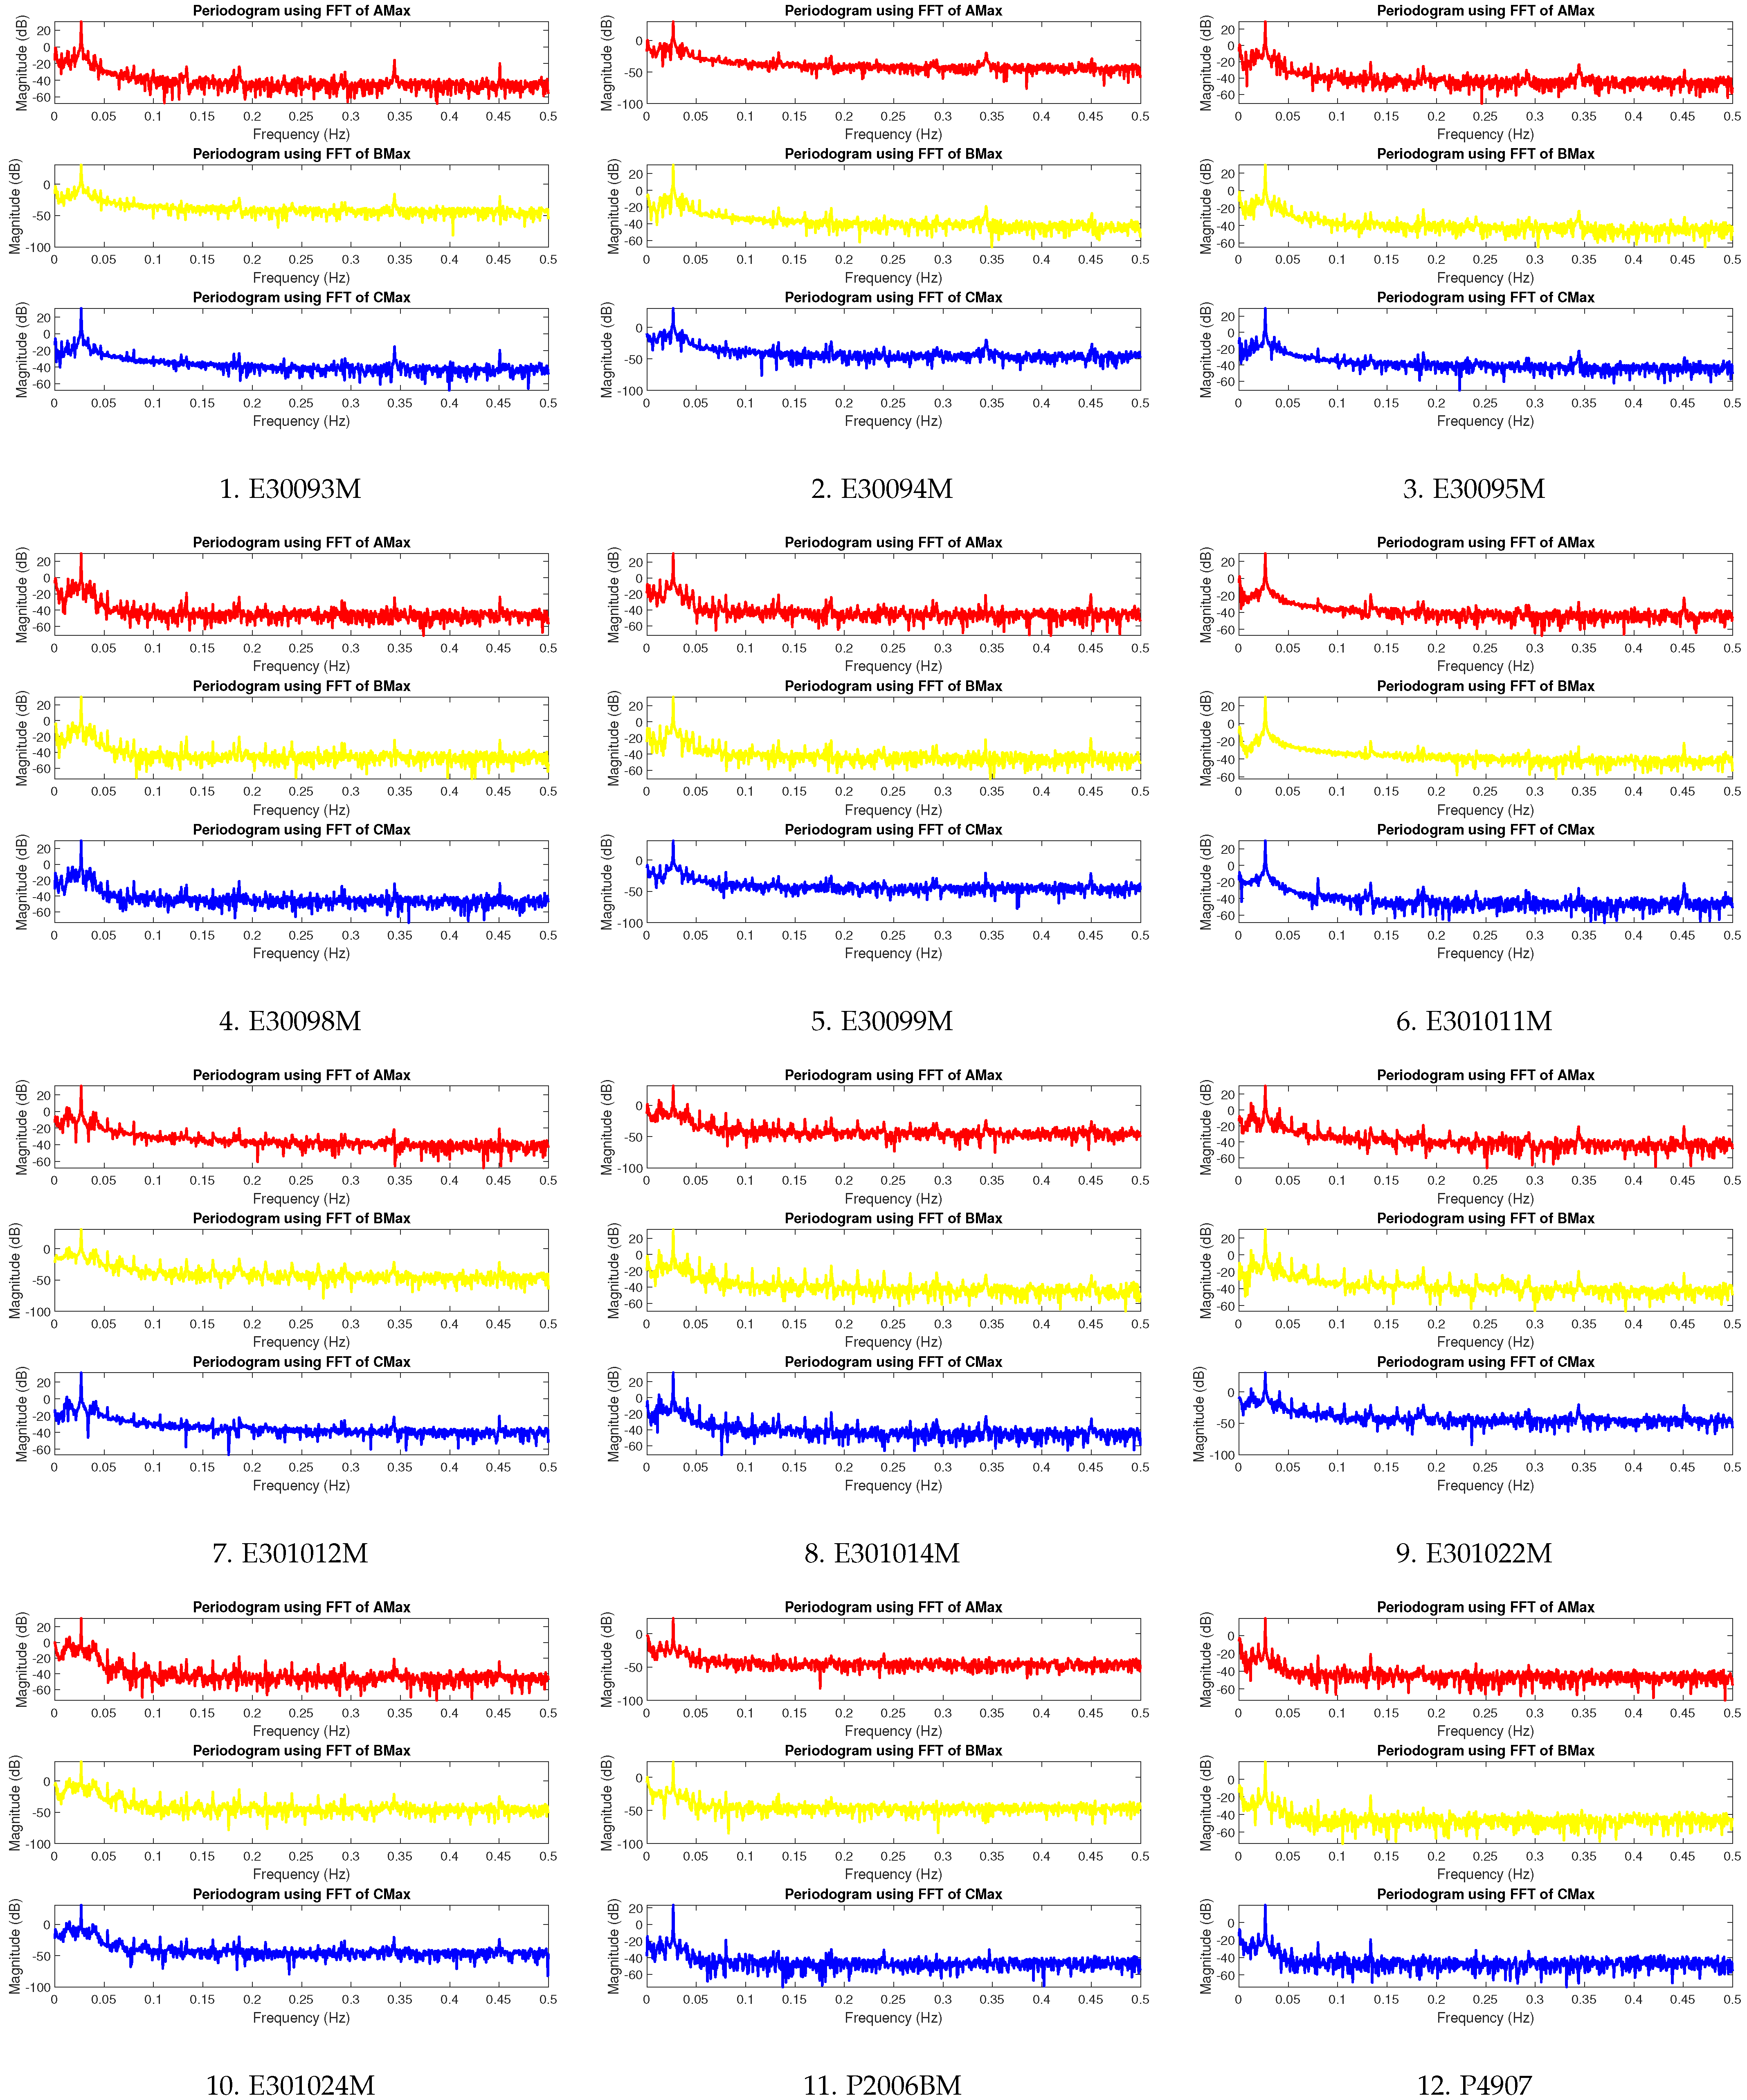
In addition, the FFT analysis of the 12 motors in the CGPP-C plant showed varying levels of harmonic distortion across phases A, B, and C, indicating various operating conditions and potential electrical stress, as presented in Table 3 and Figure 12. Motor E30093M had a low harmonic content, with harmonic-to-fundamental ratios of in phase A, in phase B, and in phase C. Phases A and B were relatively balanced. In contrast, phase C showed slightly elevated distortion. Motor E30094M displayed a slight imbalance, where phase A had a higher distortion at , compared to in phase B and in phase C. The increase in phase C indicated minor asymmetry in the current waveform. In motor E30095M, the harmonic content remained moderate, with phase A at , phase B at , and phase C at . This motor maintained a fair harmonic profile with no extreme peaks. Motor E30098M behaved similarly to E30094M, with harmonic ratios of in phase A, in phase B, and in phase C. The distortion in phase C appeared to be more prominent, which could require periodic monitoring. E30099M recorded lower harmonic values across all phases, with in phase A, in phase B, and in phase C, indicating a healthy signal with minor harmonic disturbances. Motor E301011M operated with good harmonic suppression in phases A and B, recording and , respectively, while phase C showed a spike at , which could warrant closer inspection. E301012M presented higher harmonic distortion in all phases, with in phase A, in phase B, and in phase C. The elevated values suggested this motor could be under significant harmonic stress. Similarly, E301014M had harmonic ratios of in phase A, in phase B, and in phase C, reflecting strong imbalance and higher levels of waveform distortion. Motor E301022M showed the highest distortion, with in phase A, in phase B, and in phase C, indicating poor harmonic performance and potentially degraded operating conditions. E301024M followed the same trend, with in phase A, in phase B, and in phase C. The harmonic burden on phase C was quite high and could require harmonic filtering or mitigation. Motor P2006BM showed moderate values, with in phase A, in phase B, and in phase C. Though not extreme, periodic monitoring was advised to ensure stability. Finally, motor P4907 demonstrated good performance overall, with low harmonic content in phase A at . However, phases B and C were higher at and , respectively, suggesting localized harmonic injection or imbalance.
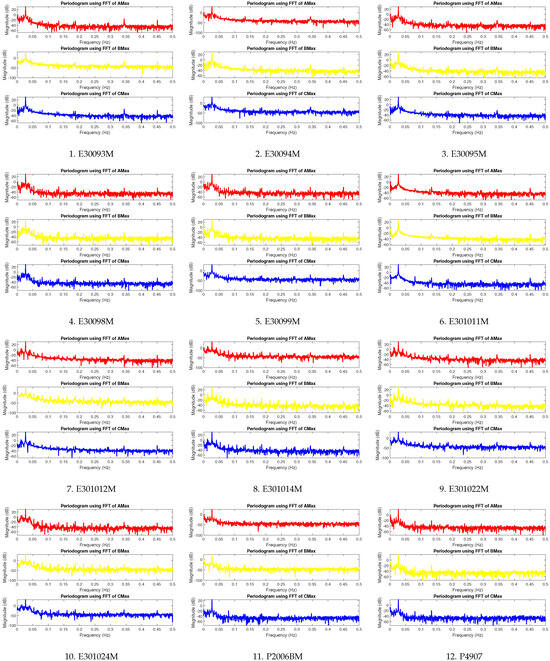
Figure 12.
FFT trajectory analysis of 12 motors at CGPP-C plant.
4.3. Remaining Useful Life (RUL) Estimation Technique
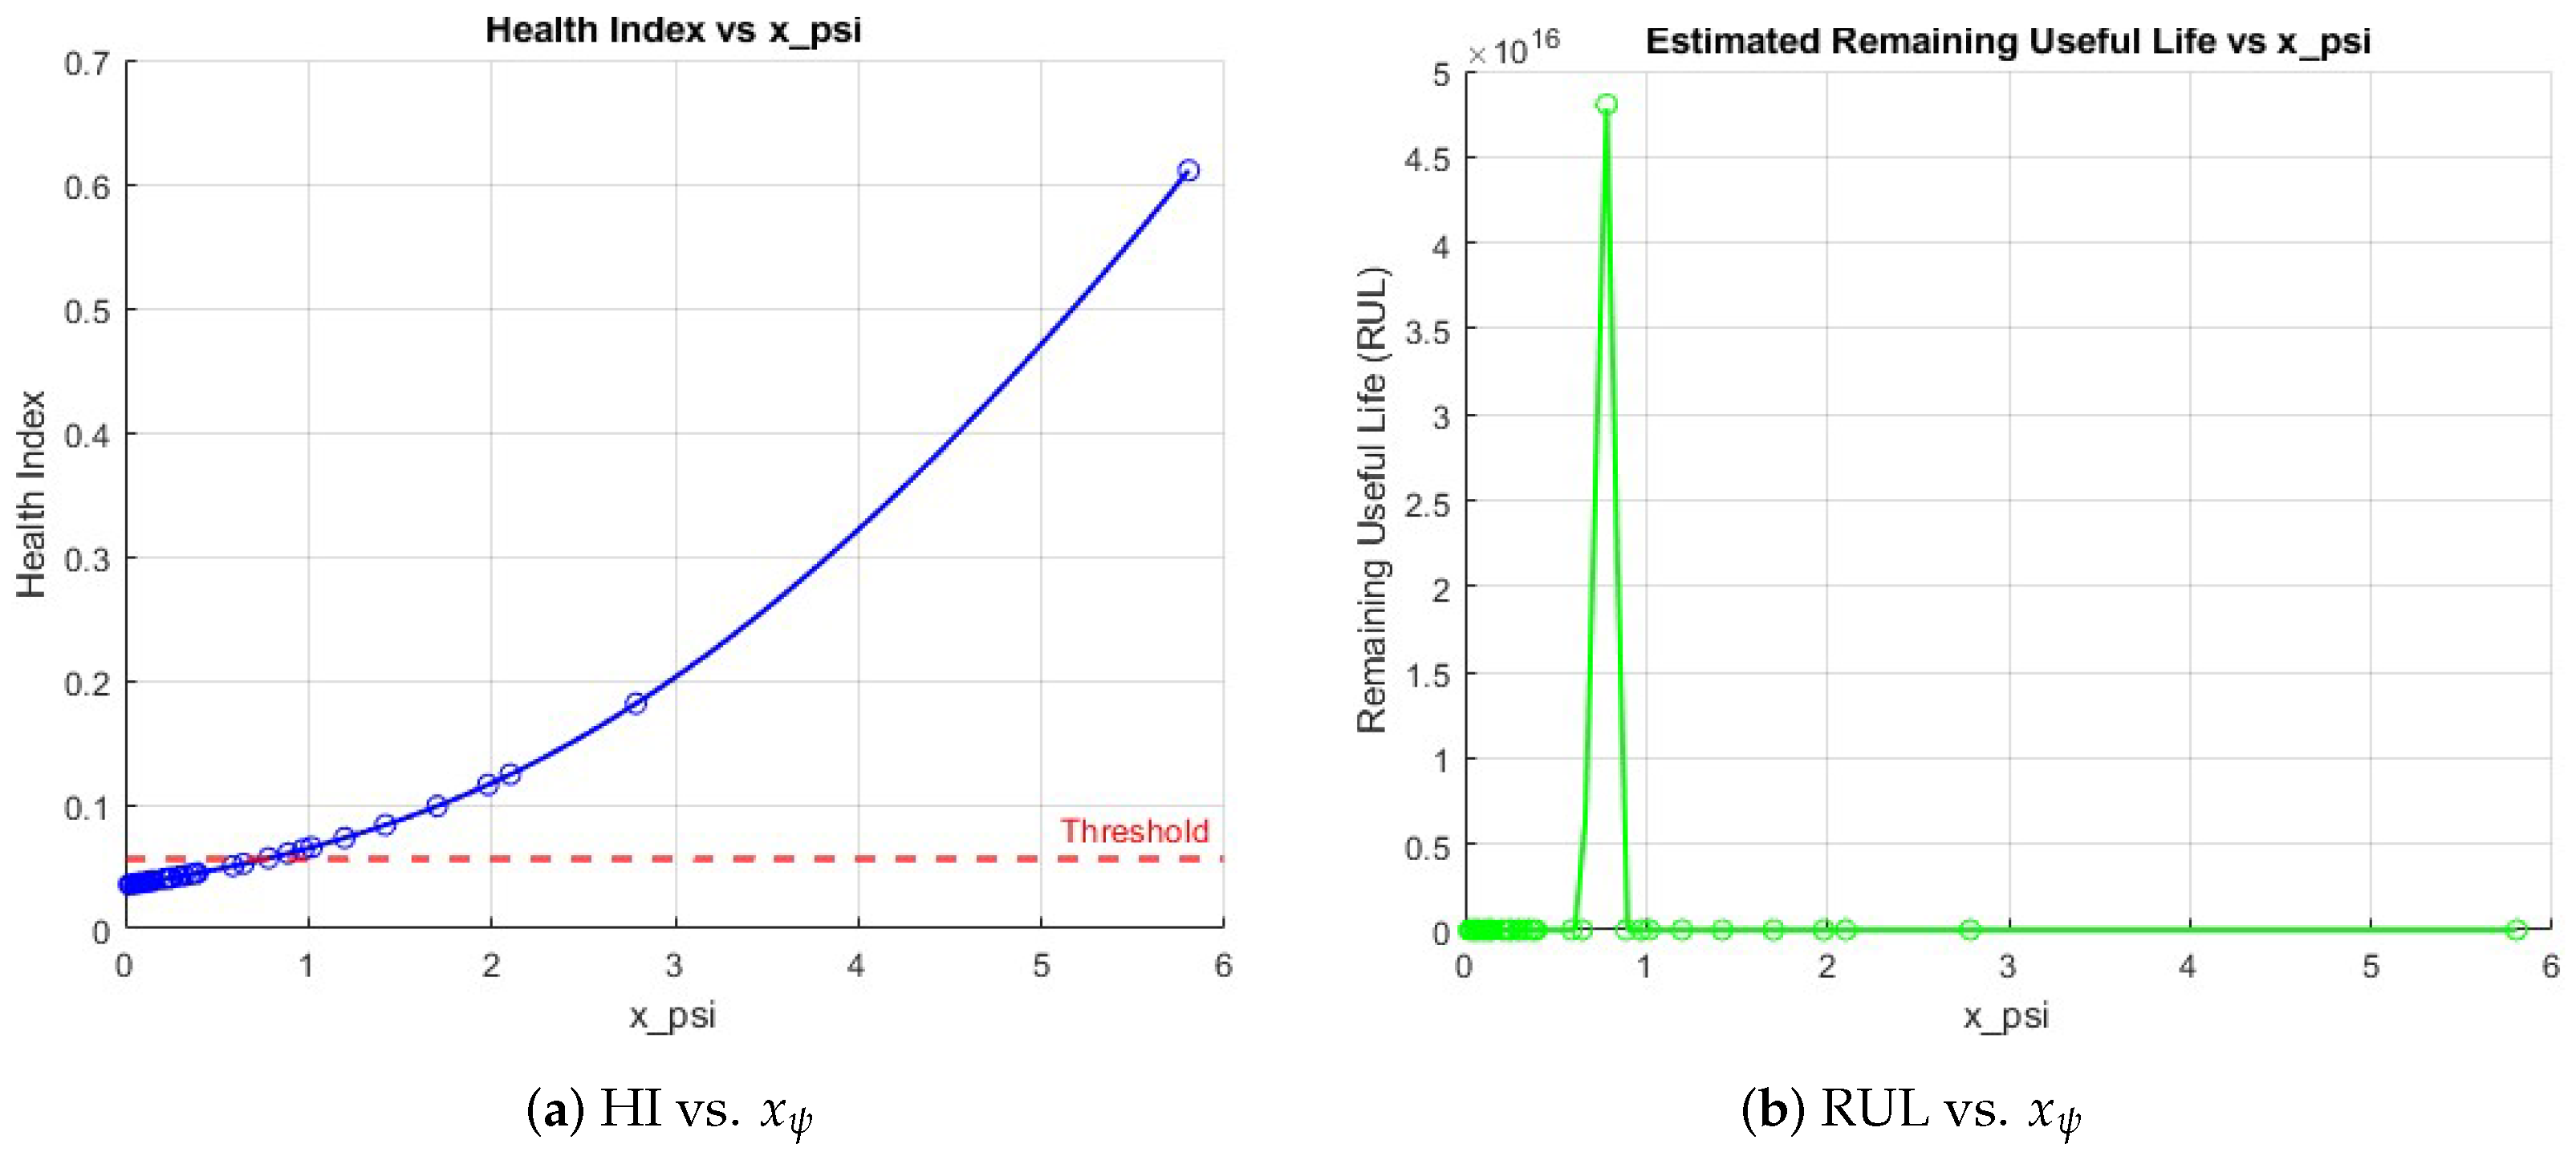
This section provides an analysis using the RUL estimation technique, as outlined in Section 2.3 and illustrated in Figure 4. The motor health assessment at the CGPP-A plant, encompassing 19 motors, was performed using the -based HI and RUL estimation framework illustrated in Figure 4. This analysis successfully captured varying degrees of degradation across the motor fleet. As illustrated in Figure 13, a critical HI threshold was identified at . The motors with values below this threshold, such as E22802-01 to E22802-06, E22812-01, E22812-02, and E22905-02, demonstrated HI values ranging from to and corresponding RUL estimates of approximately 30 to 56 days, indicating these units remained in a relatively healthy condition with early signs of wear. Additionally, motors like E22807-01 and PM22803A showed higher values of and , close to the threshold, yet had long RULs of 112 and 556 days, respectively, reinforcing their operational reliability. In contrast, motors such as E22902-01, E22902-04, PM22902B, PM22808B, and E22905-01 exceeded the critical HI threshold with values from to . They exhibited drastically reduced RULs (as low as 15 days), indicating severe degradation and the need for urgent maintenance actions. Motor E22905-01 was classified as healthy by FFT analysis but early degradation was revealed via analysis, underlining the value of integrating multiple diagnostic approaches. Figure 13a confirms the increasing trend in HI concerning , while Figure 13b highlights the inverse relationship of RUL with , barring a few anomalies. The data presented in Table 4 support these findings and demonstrate the utility of the -based HI and RUL approach in providing reliable insights for preventative maintenance, ultimately helping to avert unexpected equipment failures in industrial settings.
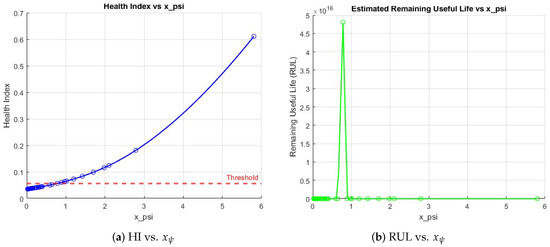
Figure 13.
Performance according to HI and RUL estimation with respect to .
Table 4.
Performance analysis of 52 motors at CGPP-A, CGPP-B, and CGPP-C plants using HI and RUL estimation.
Similarly, the health status of the motors at the CGPP-B plant was assessed using the -based HI and RUL framework, as presented in Table 4. Across the 21 motors, varying levels of degradation were observed. HI values below the critical threshold indicated that motors such as EA0117AM, EA0119AM, EA0121AM, EA0121CM, EA0222AM, and EA0225AM had been operating under healthy conditions, with estimated RULs ranging from 29 to 41 days. Moderate wear was reflected by motors EA0901AM and EA0901BM, which were associated with RULs of 54 and 47 days, respectively. Elevated and HI values were identified for motors EC1101AM and EC1101BM. However, these motors were still considered reliable due to their high RUL estimates of 199 and 90 days. Motors EC1101CM, EC1101DM, and KB0701AM were also within healthy operational margins. In contrast, motors KC0101AM and PC0101CM were identified as being in critical condition, as they exhibited significantly high values of and and HI values of and , with extremely low RULs of 9 and 3 days, respectively. Strongly healthy conditions were observed for motors PC0105BM, PC0222BM, and PC1007BM, each showing minimal degradation. Developing signs of fault were identified in PC0601BM, with an value of and a moderate RUL of 32 days. Motor PC1106M waas characterized by an extended RUL of 159 days despite its relatively high value of , indicating good resilience. Furthermore, the PC1108BM has been assessed to be in stable operating condition. This analysis demonstrates the effectiveness of the -based HI and RUL method in identifying degradation levels and supporting preventative maintenance strategies.
Also, Table 4 presents the HI and RUL estimations for motors at the CGPP-C plant using the -based degradation metric. A total of 12 motors from this plant were analyzed. Motors E30093M, E30099M, E301012M, E301014M, and E301022M were assigned similar values ranging from to , with HI values close to and estimated RULs around 34 days. Motors E30094M, E30095M, and E30098M showed slightly lower values between and , resulting in RUL estimates of approximately 32 days, suggesting moderate degradation. For motor E301011M, an of and an HI of yielded an RUL of 33 days, while motor E301024M, with of , reached an RUL of 34 days. The lowest values of and were recorded for motors P2006BM and P4907, respectively, corresponding to RUL estimates of 29 days. Overall, healthy or moderately degraded conditions were identified across the motors without indicating severe deterioration. The -based approach effectively facilitated HI and RUL estimation in assessing motor performance and condition at CGPP-C.
4.4. Comparative Analysis
A comparative analysis of motor health across the three plants, including CGPP-A, CGPP-B, and CGPP-C, is presented in Table 5. Diagnostic techniques such as trajectory analysis and FFT analysis were considered alongside each motor’s estimated RUL in days. In the case of CGPP-A, 19 motors were evaluated. Neither nor FFT analysis offered diagnostic insights for the motors in this plant. However, PM22803A and PM22808B demonstrated signs of degradation through FFT, and PM22803A was diagnosed using both techniques, with an RUL as high as 556 days, indicating good health. A similar observation was made for E22905-01 using FFT, with an RUL of 112 days. The rest of the motors showed no significant indications and possessed moderate to low RUL values ranging between 15 and 56 days, suggesting either moderate degradation or nearing the end of operational life. The CGPP-B plant included 21 motors. KC0101AM and PC0101CM were successfully assessed using both and FFT analysis, reflecting higher RULs of 190 and 184 days, respectively. One additional motor, PC0601BM, was analyzed using FFT alone, suggesting localized mechanical faults. Notable features were not identified for the remaining motors with either method, with RUL estimates ranging from 29 to 90 days for most, while EC1101AM stood out with a significantly higher RUL of 199 days, possibly indicating excellent operational condition. For the CGPP-C plant, 12 motors were examined, but none of them showed identifiable degradation features through or FFT analysis. Despite this, the RUL estimations remained relatively uniform, ranging from 29 to 34 days. This consistency indicated a stable but moderately aged condition for these motors, which had not yet progressed to stages of severe degradation detectable through spectral or trajectory-based methods. This comparative analysis showed that while some motors across the plants benefitted from early fault detection using signal processing techniques, many still required more advanced health assessment strategies to predict subtle signs of degradation and optimize maintenance schedules.
Table 5.
Performance comparison of 52 motors at CGPP-A, CGPP-B, and CGPP-C plants using , FFT, and RUL estimation techniques.
5. Conclusions
This paper proposes a comprehensive predictive maintenance framework to estimate the RUL of induction motor bearings by integrating MCSA, trajectory analysis, and FFT with machine learning techniques. The approach enables early fault detection and degradation tracking by extracting and analyzing key features from three-phase stator current signals. The analysis of trajectories provided an effective visualization of the changes in motor behavior, with any deviations from a nearly circular pattern suggesting wear on the bearings. Additionally, using FFT-based harmonic analysis confirmed the detection of specific fault frequencies, contributing to greater diagnostics confidence. The HI developed from these features facilitated precise classification of the bearings’ health status. Logistic regression was used to predict the probability of bearing degradation, and the RUL was estimated using degradation trends in the HI, which offered a quantitative basis for scheduling maintenance activities. The results demonstrated a strong correlation with known motor health states and highlighted the potential of this technique in real-time industrial applications. The proposed approach offers a non-intrusive, data-driven, and computationally efficient solution for motor fault diagnosis and prognosis compared to existing methods. Future work includes applying advanced ML/DL models, expanding fault modes, and testing in diverse industries to enhance system robustness.
Author Contributions
Conceptualization, K.B. and R.I.; methodology, N.Z.Z. and B.R.; software, N.Z.Z.; validation, N.Z.Z., K.B., and B.R.; formal analysis, N.Z.Z. and M.O.; investigation, N.Z.Z. and M.O.; resources, B.R. and R.I.; data curation, R.I. and M.O.; writing—original draft preparation, N.Z.Z. and B.R.; writing—review and editing, K.B. and M.O.; visualization, K.B. and B.R.; supervision, K.B. and R.I.; project administration, K.B. and R.I.; funding acquisition, K.B. and R.I. All authors have read and agreed to the published version of the manuscript.
Funding
This research was funded by the Murata Science and Education Foundation, grant number 015ME0-386.
Data Availability Statement
The data presented in this study are available on request from the corresponding author.
Acknowledgments
The authors thank Universiti Teknologi PETRONAS and the Vellore Institute of Technology for allowing their facilities to be used for this study.
Conflicts of Interest
The authors declare no conflicts of interest.
Abbreviations
The following abbreviations are used in this manuscript:
| ANN | Artificial Neural Network |
| FFT | Fast Fourier Transform |
| HFR | Harmonic-to-Fundamental Ratio |
| HI | Health Index |
| LSTM | Long Short-Term Memory |
| MCSA | Motor Current Signature Analysis |
| PSD | Power Spectral Density |
| RMS | Root Mean Square |
| ROC | Receiver Operating Characteristic Curve |
| RUL | Remaining Useful Life |
| SMRN | Shrinkage Mamba Relation Network |
| SVM | Support Vector Machine |
| WT | Wavelet Transform |
References
- Ferreira, F.J.; Baoming, G.; de Almeida, A.T. Reliability and operation of high-efficiency induction motors. In Proceedings of the 2015 IEEE/IAS 51st Industrial & Commercial Power Systems Technical Conference (I&CPS), Calgary, AB, Canada, 5–8 May 2015; pp. 1–13. [Google Scholar]
- Neupane, D.; Seok, J. Bearing fault detection and diagnosis using case western reserve university dataset with deep learning approaches: A review. IEEE Access 2020, 8, 93155–93178. [Google Scholar] [CrossRef]
- Hoang, D.T.; Kang, H.J. A survey on deep learning based bearing fault diagnosis. Neurocomputing 2019, 335, 327–335. [Google Scholar] [CrossRef]
- Zhang, S.; Zhang, S.; Wang, B.; Habetler, T.G. Deep learning algorithms for bearing fault diagnostics—A comprehensive review. IEEE Access 2020, 8, 29857–29881. [Google Scholar] [CrossRef]
- Pastukhov, A.; Timashov, E. Procedure for simulation of stable thermal conductivity of bearing assemblies. Adv. Eng. Lett. 2023, 2, 58–63. [Google Scholar] [CrossRef]
- Delvecchio, S.; Bonfiglio, P.; Pompoli, F. Vibro-acoustic condition monitoring of Internal Combustion Engines: A critical review of existing techniques. Mech. Syst. Signal Process. 2018, 99, 661–683. [Google Scholar] [CrossRef]
- Lu, H.; Nemani, V.P.; Barzegar, V.; Allen, C.; Hu, C.; Laflamme, S.; Sarkar, S.; Zimmerman, A.T. A physics-informed feature weighting method for bearing fault diagnostics. Mech. Syst. Signal Process. 2023, 191, 110171. [Google Scholar] [CrossRef]
- Abid, A.; Khan, M.T.; Iqbal, J. A review on fault detection and diagnosis techniques: Basics and beyond. Artif. Intell. Rev. 2021, 54, 3639–3664. [Google Scholar] [CrossRef]
- Vanchinathan, K.; Valluvan, K.R.; Gnanavel, C.; Gokul, C.; Albert, J.R. An improved incipient whale optimization algorithm based robust fault detection and diagnosis for sensorless brushless DC motor drive under external disturbances. Int. Trans. Electr. Energy Syst. 2021, 31, e13251. [Google Scholar] [CrossRef]
- AlShorman, O.; Irfan, M.; Abdelrahman, R.B.; Masadeh, M.; Alshorman, A.; Sheikh, M.A.; Saad, N.; Rahman, S. Advancements in condition monitoring and fault diagnosis of rotating machinery: A comprehensive review of image-based intelligent techniques for induction motors. Eng. Appl. Artif. Intell. 2024, 130, 107724. [Google Scholar] [CrossRef]
- McInerny, S.A.; Dai, Y. Basic vibration signal processing for bearing fault detection. IEEE Trans. Educ. 2003, 46, 149–156. [Google Scholar] [CrossRef]
- Rafiee, J.; Tse, P.; Harifi, A.; Sadeghi, M. A novel technique for selecting mother wavelet function using an intelli gent fault diagnosis system. Expert Syst. Appl. 2009, 36, 4862–4875. [Google Scholar] [CrossRef]
- Riera-Guasp, M.; Pineda-Sánchez, M.; Pérez-Cruz, J.; Puche-Panadero, R.; Roger-Folch, J.; Antonino-Daviu, J.A. Diagnosis of induction motor faults via Gabor analysis of the current in transient regime. IEEE Trans. Instrum. Meas. 2012, 61, 1583–1596. [Google Scholar] [CrossRef]
- Schoen, R.R.; Habetler, T.G.; Kamran, F.; Bartfield, R. Motor bearing damage detection using stator current monitoring. IEEE Trans. Ind. Appl. 2002, 31, 1274–1279. [Google Scholar] [CrossRef]
- Lopez-Perez, D.; Antonino-Daviu, J. Application of infrared thermography to failure detection in industrial induction motors: Case stories. IEEE Trans. Ind. Appl. 2017, 53, 1901–1908. [Google Scholar] [CrossRef]
- Kumar, S.; Raj, K.K.; Cirrincione, M.; Cirrincione, G.; Franzitta, V.; Kumar, R.R. A Comprehensive Review of Remaining Useful Life Estimation Approaches for Rotating Machinery. Energies 2024, 17, 5538. [Google Scholar] [CrossRef]
- Widodo, A.; Yang, B.S. Support vector machine in machine condition monitoring and fault diagnosis. Mech. Syst. Signal Process. 2007, 21, 2560–2574. [Google Scholar] [CrossRef]
- Pan, Y.; Chen, Y.; Fei, X.; Wang, K.; Fang, T.; Wang, J. Intelligent Fault Diagnosis for Rotating Mechanical Systems: An Improved Multiscale Fuzzy Entropy and Support Vector Machine Algorithm. Algorithms 2024, 17, 588. [Google Scholar] [CrossRef]
- Huynh, H.H.; Min, C.H. Rotating Machinery Fault Detection Using Support Vector Machine via Feature Ranking. Algorithms 2024, 17, 441. [Google Scholar] [CrossRef]
- Deng, J.; Liu, Y.; Li, Z. Fault Diagnosis of Rotating Equipment Bearings Based on VMD-MSGWO-SVM. In Proceedings of the 2024 3rd Conference on Fully Actuated System Theory and Applications (FASTA), Shenzhen, China, 10–12 May 2024; pp. 614–619. [Google Scholar]
- Henao, H.; Capolino, G.A.; Fernandez-Cabanas, M.; Filippetti, F.; Bruzzese, C.; Strangas, E.; Pusca, R.; Estima, J.; Riera-Guasp, M.; Hedayati-Kia, S. Trends in fault diagnosis for electrical machines: A review of diagnostic techniques. IEEE Ind. Electron. Mag. 2014, 8, 31–42. [Google Scholar] [CrossRef]
- Jiang, W.; Jiang, H.; Yao, R.; Mu, M.; Liu, Y. A weighted frequency domain energy operator spectral method based on soft thresholding fast iterative filtering for rolling bearing incipient fault feature extraction. Struct. Health Monit. 2025, 14759217241306723. [Google Scholar] [CrossRef]
- Zhou, J.; Yang, J.; Xiang, S.; Qin, Y. Remaining useful life prediction methodologies with health indicator dependence for rotating machinery: A comprehensive review. IEEE Trans. Instrum. Meas. 2025, 74, 3528519. [Google Scholar] [CrossRef]
- Zhang, X.; Kang, J.; Jin, T. Degradation modeling and maintenance decisions based on Bayesian belief networks. IEEE Trans. Reliab. 2014, 63, 620–633. [Google Scholar] [CrossRef]
- Wang, T.; Yu, J.; Siegel, D.; Lee, J. A similarity-based prognostics approach for remaining useful life estimation of engineered systems. In Proceedings of the 2008 international conference on prognostics and health management, Denver, CO, USA, 6–9 October 2008; pp. 1–6. [Google Scholar]
- Wen, L.; Li, X.; Gao, L.; Zhang, Y. A new convolutional neural network-based data-driven fault diagnosis method. IEEE Trans. Ind. Electron. 2017, 65, 5990–5998. [Google Scholar] [CrossRef]
- Bellini, A.; Filippetti, F.; Tassoni, C.; Capolino, G.A. Advances in diagnostic techniques for induction machines. IEEE Trans. Ind. Electron. 2008, 55, 4109–4126. [Google Scholar] [CrossRef]
- Sun, B.; Hu, W.; Wang, H.; Wang, L.; Deng, C. Remaining Useful Life Prediction of Rolling Bearings Based on CBAM-CNN-LSTM. Sensors 2025, 25, 554. [Google Scholar] [CrossRef] [PubMed]
- Chen, Z.; Huang, H.Z.; Deng, Z.; Wu, J. Shrinkage mamba relation network with out-of-distribution data augmentation for rotating machinery fault detection and localization under zero-faulty data. Mech. Syst. Signal Process. 2025, 224, 112145. [Google Scholar] [CrossRef]
- Avci, O.; Abdeljaber, O.; Kiranyaz, S.; Hussein, M.; Gabbouj, M.; Inman, D.J. A review of vibration-based damage detection in civil structures: From traditional methods to Machine Learning and Deep Learning applications. Mech. Syst. Signal Process. 2021, 147, 107077. [Google Scholar] [CrossRef]
- Muthukumaran, S.; Rammohan, A.; Sekar, S.; Maiti, M.; Bingi, K. Bearing fault detection in induction motors using line currents. ECTI Trans. Electr. Eng. Electron. Commun. 2021, 19, 209–219. [Google Scholar]
- Zarei, J.; Poshtan, J. An advanced Park’s vectors approach for bearing fault detection. Tribol. Int. 2009, 42, 213–219. [Google Scholar] [CrossRef]
- Wei, L.; Rong, X.; Wang, H.; Yu, S.; Zhang, Y. Method for identifying stator and rotor faults of induction motors based on machine vision. Math. Probl. Eng. 2021, 2021, 6658648. [Google Scholar] [CrossRef]
- Lin, H.C.; Ye, Y.C. Reviews of bearing vibration measurement using fast Fourier transform and enhanced fast Fourier transform algorithms. Adv. Mech. Eng. 2019, 11, 1687814018816751. [Google Scholar] [CrossRef]
- Strömbergsson, D.; Marklund, P.; Berglund, K.; Larsson, P.E. Bearing monitoring in the wind turbine drivetrain: A comparative study of the FFT and wavelet transforms. Wind Energy 2020, 23, 1381–1393. [Google Scholar] [CrossRef]
- Proakis, J.G. Digital Signal Processing: Principles Algorithms and Applications; Pearson Education India: Noida, India, 2001. [Google Scholar]
- Randall, R. Vibration-Based Condition Monitoring: Industrial, Aerospace and Automotive Applications; John Wiley & Sons: Hoboken, NJ, USA, 2011. [Google Scholar]
- Sikorska, J.Z.; Hodkiewicz, M.; Ma, L. Prognostic modelling options for remaining useful life estimation by industry. Mech. Syst. Signal Process. 2011, 25, 1803–1836. [Google Scholar] [CrossRef]


Disclaimer/Publisher’s Note: The statements, opinions and data contained in all publications are solely those of the individual author(s) and contributor(s) and not of MDPI and/or the editor(s). MDPI and/or the editor(s) disclaim responsibility for any injury to people or property resulting from any ideas, methods, instructions or products referred to in the content. |
© 2025 by the authors. Licensee MDPI, Basel, Switzerland. This article is an open access article distributed under the terms and conditions of the Creative Commons Attribution (CC BY) license (https://creativecommons.org/licenses/by/4.0/).