Article

A Novel Algorithm to Detect Broken Bars in Induction Motors

by
Mateus Ventura Souza
,
José Claudeni Oliveira Lima
,
Alexandre Magno Pinto Roque
and
Douglas Bressan Riffel
*
Mechanical Engineering Department, Federal University of Sergipe, São Cristóvão 49100-000, SE, Brazil
*
Author to whom correspondence should be addressed.
Machines 2021, 9(11), 250; https://doi.org/10.3390/machines9110250
Submission received: 28 September 2021 / Revised: 22 October 2021 / Accepted: 22 October 2021 / Published: 26 October 2021
(This article belongs to the Section Electrical Machines and Drives)

Abstract

:
A new algorithm is proposed in order to detect and quantify partially broken bars in induction motors during start-up without load. In the qualification process, no threshold is used. It uses the principle of the harmonic generated by the broken bar in the stator current, it should vary with the slip to confirm the failure and provide more security in the diagnosis. A severity index is also proposed, based on the maximum peaks of the Teager energy operator of the Gaussian filter applied in the stator current signal. Experimental data were used to validate the algorithm, comparing rotors manufactured with one partially bar, one failed bar, and two completely failed bars, arranged in a variety of ways. The results show that the algorithm qualifies correctly the faulty bar, even for a partially broken bar. In the quantification phase, the severity index of the fault shows the higher sensibility in comparison to the state-of-the-art. Its value for a 3 HP motor is: 8.837 × 10⁻¹⁰ for a healthy rotor, 2.553 × 10⁻⁸ for a partially broken bar, and 4.058 × 10⁻⁷ for one broken bar.

1. Introduction

The squirrel-cage induction motor is one of the most reliable machines used in the industry. Nevertheless, it is subject to electric and mechanical failures, which can lead to motor efficiency reduction and, in more severe cases, it can cause unscheduled downtimes, resulting in serious maintenance costs and economic losses. One way to improve its reliability is the quality control direct in the industry, in the production line, by a reliable real-time test to qualify and quantify its severity.
The detection of broken bars is relevant because 10% to 12% of the failures that occur in a squirrel-cage induction motor are located in its rotor [1,2]. When the rotor has a broken bar, or even an increase in its electrical resistance, the distribution of the magnetic flux becomes asymmetrical [3]. This generates harmonics in the stator current with a well-defined characteristic frequency of each failure. The most relevant harmonic component is the left side band and, as seen in several papers, it is given by the formula [4]:
f L S B = f ( 1 2 s )
where f L S B is the first harmonic lower sideband (LSB) generated due to the rotor bar’s failure, f is the frequency of the motor supply and s is the slip.
Among the existing techniques for broken bar detection, techniques based on the motor current signal analysis (MCSA) gain strength due to the simplicity of measurement [5,6]. The currents can be measured both at steady state and start-up. The techniques that use the motor stator current in steady state have some restrictions, such as [7]:
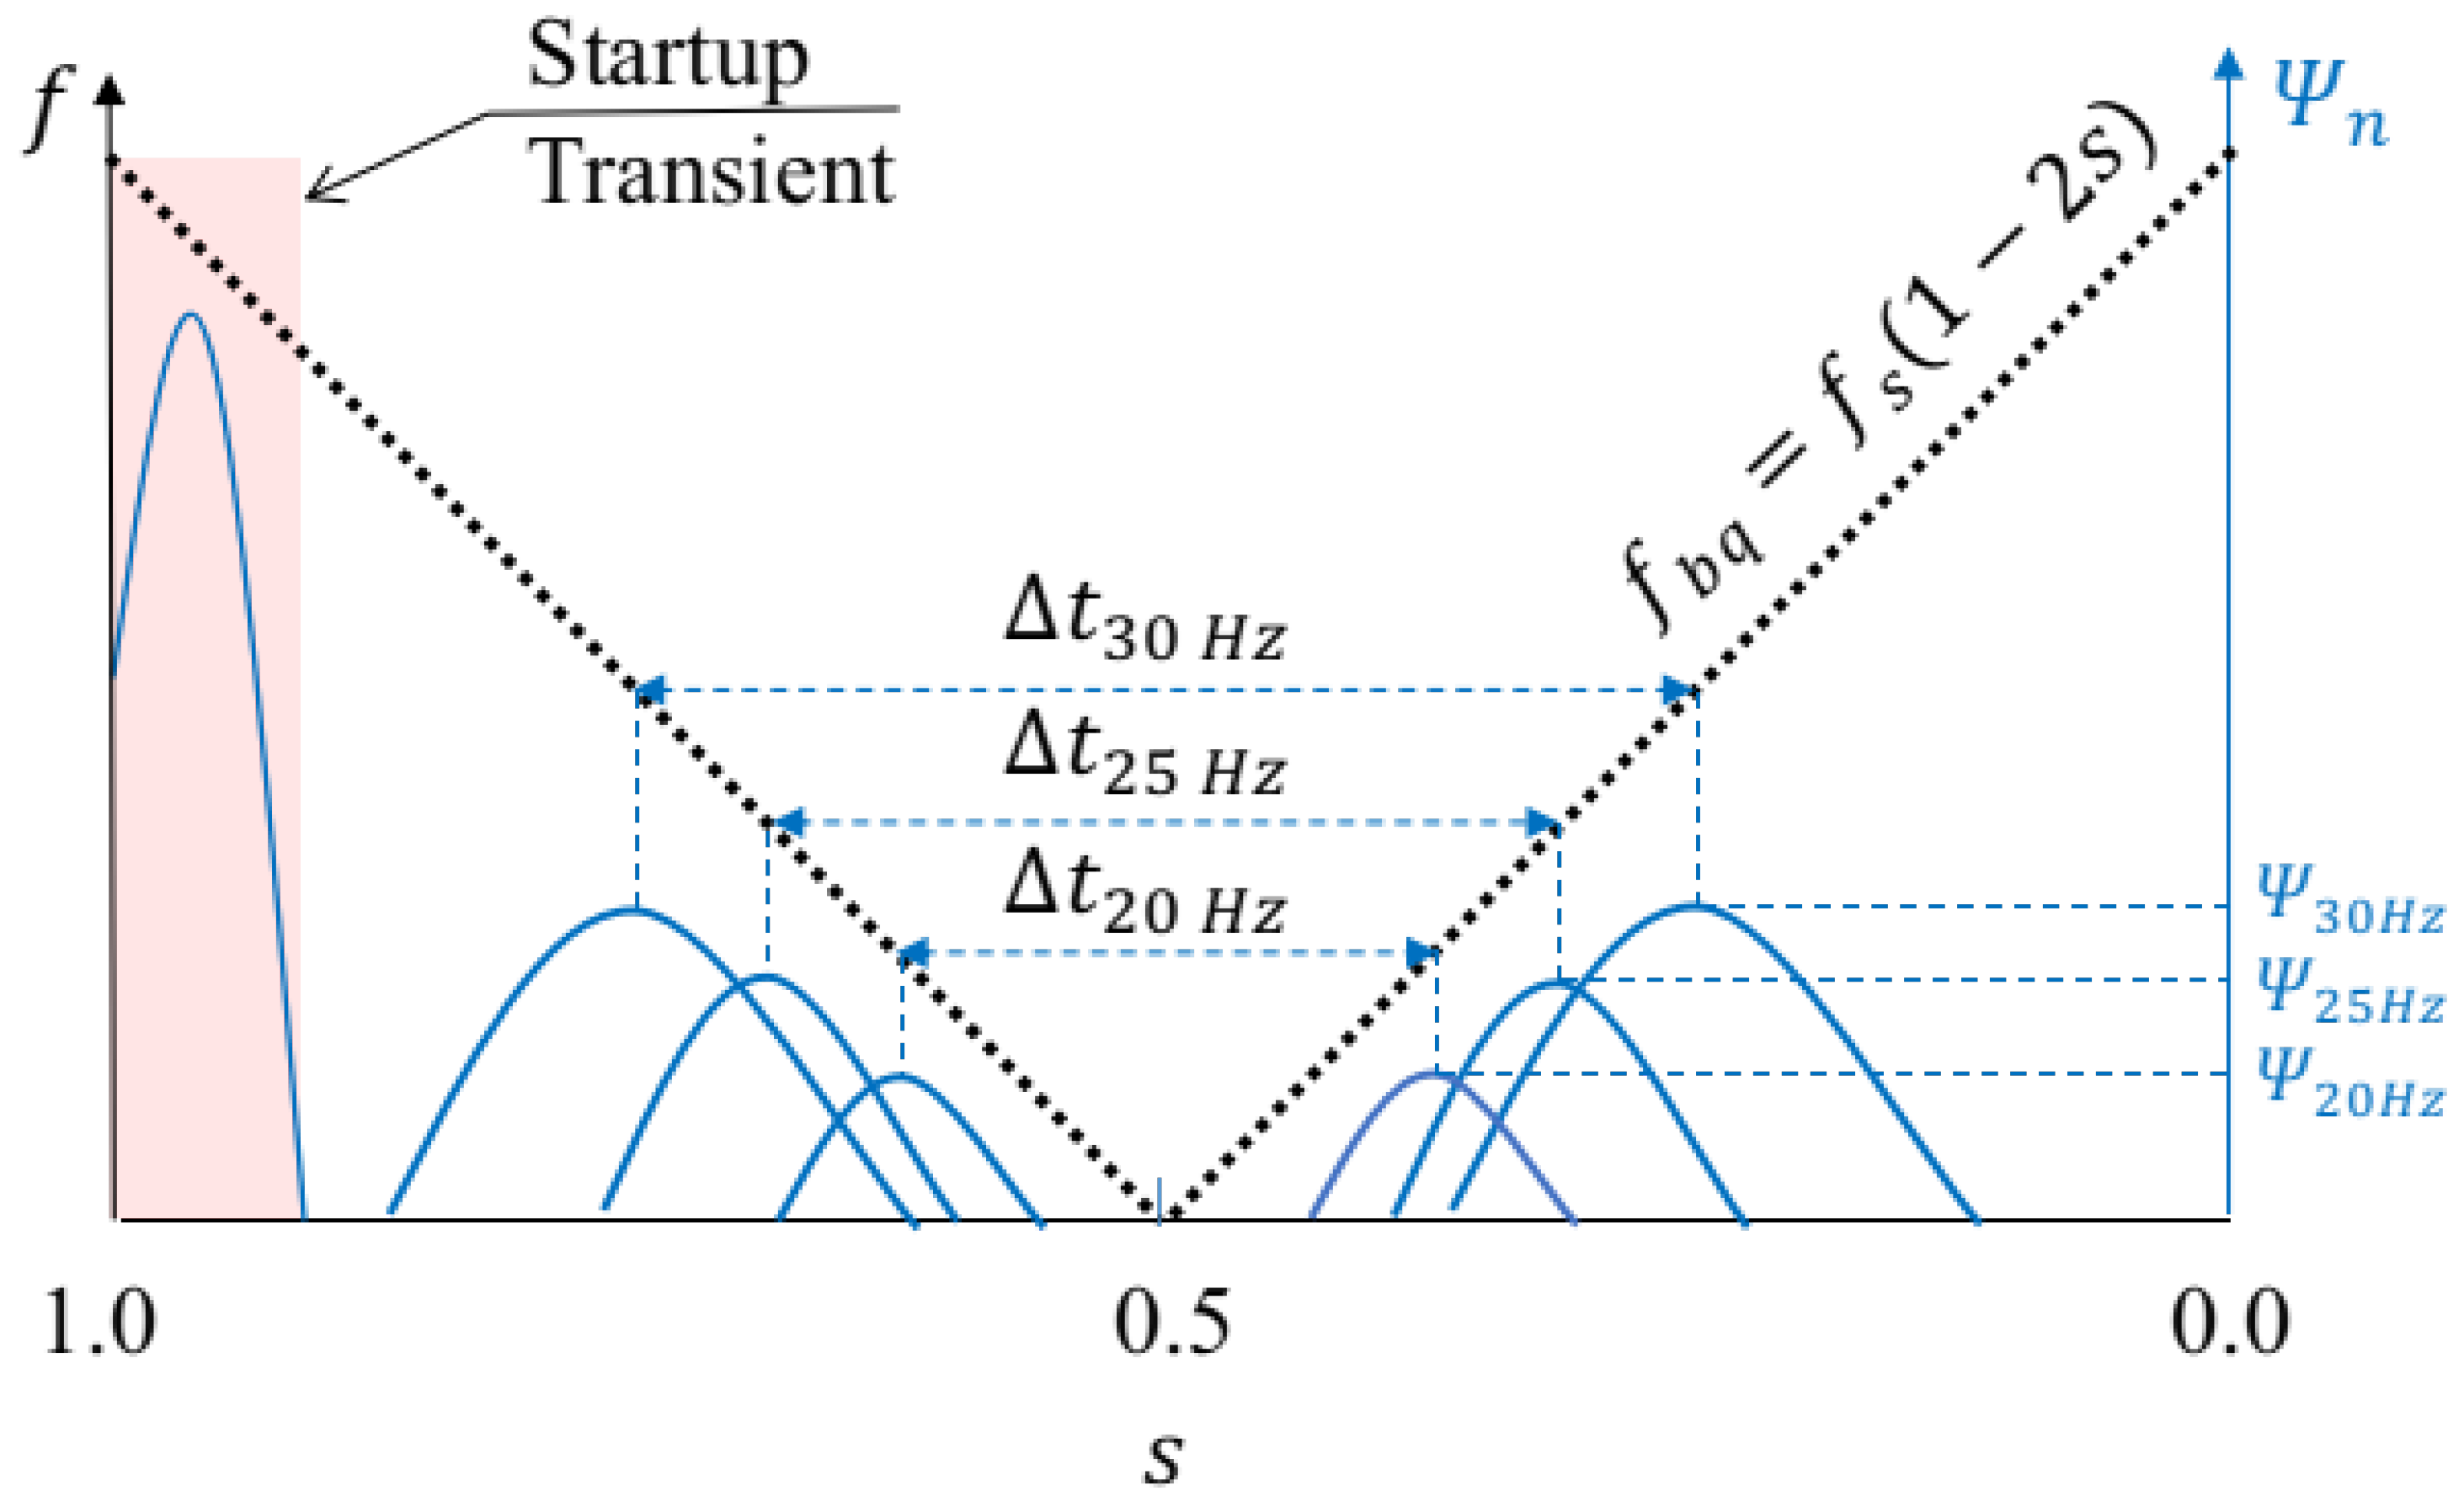
  • The speed of the machine must be constant and known;
  • The stator fundamental frequency must be constant;
  • The load must be constant;
  • The load should be as high as possible in order to separate the broken bar frequency from the fundamental one.
One way to overcome these restrictions is to use techniques to analyze the start-up current, as it would have a high signal-to-noise ratio and high slip, which implies that spectral components can be more easily separated [8].
The traditional signal processing techniques used to analyze the measured current are the short-time Fourier transform (STFT) [9,10] and Wavelet transform (WT) [5,11]. Among other transforms, some high-resolution techniques are also used, such as the rotational invariance techniques (ESPRIT) and multiple signal classification (MUSIC) [12]. Moreover, some transforms are proposed specifically to this application, such as the adaptive slope transform [13] and the dragon transform [14].
In all cases, basically, we sought to analyze whether the characteristic oscillation of the left side band is present in the start-up signal. Sometimes the other harmonics are measured to confirm the diagnosis. Knowing the frequency of the failure [5] and the slip of the rotor, it can be predicted when each frequency range will appear at the start-up. Therefore, this study employs a Gaussian bandpass filter and the Teager energy operator for the stator current measured during start-up to qualify and quantify the broken bar failures.
In an effort to develop a technique for automating the detection process, some classifiers [15,16], neural networks [17], and even image processing techniques are used [18]. Another option is the statement of a severity index [3,14,19,20,21,22]. The qualification is done, normally, by a threshold based on the same index used to quantify [22], but it is highly dependent on the sensibility of the index. [23] highlighted some limitations of the state-of-the-art of electrical monitoring, such as false indications, low sensitivity, and difficulty of inaccurate interpretation. Therefore, in this paper, the physical behavior of the broken bar frequency is used in the qualification process and a highly-sensitivity severity index is established.
Many studies have conducted analyses of the broken bars by simulation, or experimentally, doing the failure manually [24]. To better validate the proposed algorithm, the experimental tests will be made in rotors manufactured by the WEG Electric Corporation, especially for this study. No drilling holes were done in the cage.
The structure of the paper is as follows: Section 2 highlight some details of the Teager Energy Operator used to quantify the faulty current; details of the experiment are shown in Section 3; an algorithm is proposed in Section 4 to qualify and quantify broken bars; the results of this algorithm are presented in the qualification (Section 5.1) and quantification (Section 5.2). Finally, in Section 5.2.1,the available severity indexes were compared and showed that the proposed severity index has the higher sensitivity nowadays, and the conclusions are summarized in Section 6.

2. Teager Energy Operator

The Teager Energy operator is defined as,
Ψ ( x ( t ) ) = x ˙ ( t ) 2 x ( t ) x ¨ ( t )
in a continuous case (where x ˙ means the first derivative of x and x ¨ means the second derivative of x), for the discrete case:
Ψ [ x ( n ) ] = x [ n ] 2 x ( n 1 ) · x ( n + 1 )
In traditional signal processing literature, when it comes to the energy of a signal, it is common to refer to the square of the signal magnitude as a representation of energy. A common alternative is the use of the discrete Fourier transform of the signal, in which the square of the amplitude of the calculated transform frequency samples is assumed to be the energy of the respective frequency components. Therefore, a 10 Hz unit signal has the same energy as a 100 Hz signal, even though the energy required to generate the 100 Hz signal is much greater than the energy required to generate the 10 Hz signal [25].
The Teager Energy Operator or Teager-Kaiser operator calculates the energy of a signal, based not only on the amplitude, but on the frequency of the signal. As shown by [25], let x n be the samples of a signal representing the motion of an oscillatory body. Therefore,
x n = A cos ( Ω n + ϕ )
in which Ω is the digital frequency of the signal in radians/sample and is given by:
Ω = 2 π f f s
where f is the analog frequency and f s is the sampling frequency and ϕ is an arbitrary initial phase in radians. Considering three equally spaced sampled points:
x n = A cos ( Ω n + ϕ ) x n + 1 = A cos ( Ω ( n + 1 ) + ϕ ) x n 1 = A cos ( Ω ( n 1 ) + ϕ )
using trigonometric identities, it comes to:
( x n + 1 ) · ( x n 1 ) = x n 2 A 2 sin ( ω )
The Equation (7) is only valid for sampling frequencies at least four times higher than the analog frequency. For small amounts of ω , sin ( Ω ) = Ω , then by limiting the Ω < π 4 , where:
A 2 Ω 2 = x n 2 ( x n + 1 ) · ( x n 1 )
Equation (8) provides a good measurement of the oscillating signal when its sampling is greater than eight times the oscillation frequency of the signal. Therefore, this expression is a simple form for the algorithm to obtain the energy measurement of any simple component of the signal.
Ψ [ x ( n ) ] = x n 2 ( x n + 1 ) · ( x n 1 ) = A 2 sin 2 ( Ω ) A 2 Ω 2
here Ψ [ x ( n ) ] is the output of the algorithm and x n is the analyzed signal. From this expression, it appears that the energy is independent of the initial phase, ϕ , of the oscillation and is able to respond very quickly in two sampling moments for changes in amplitude (A) and in frequency ( Ω ).

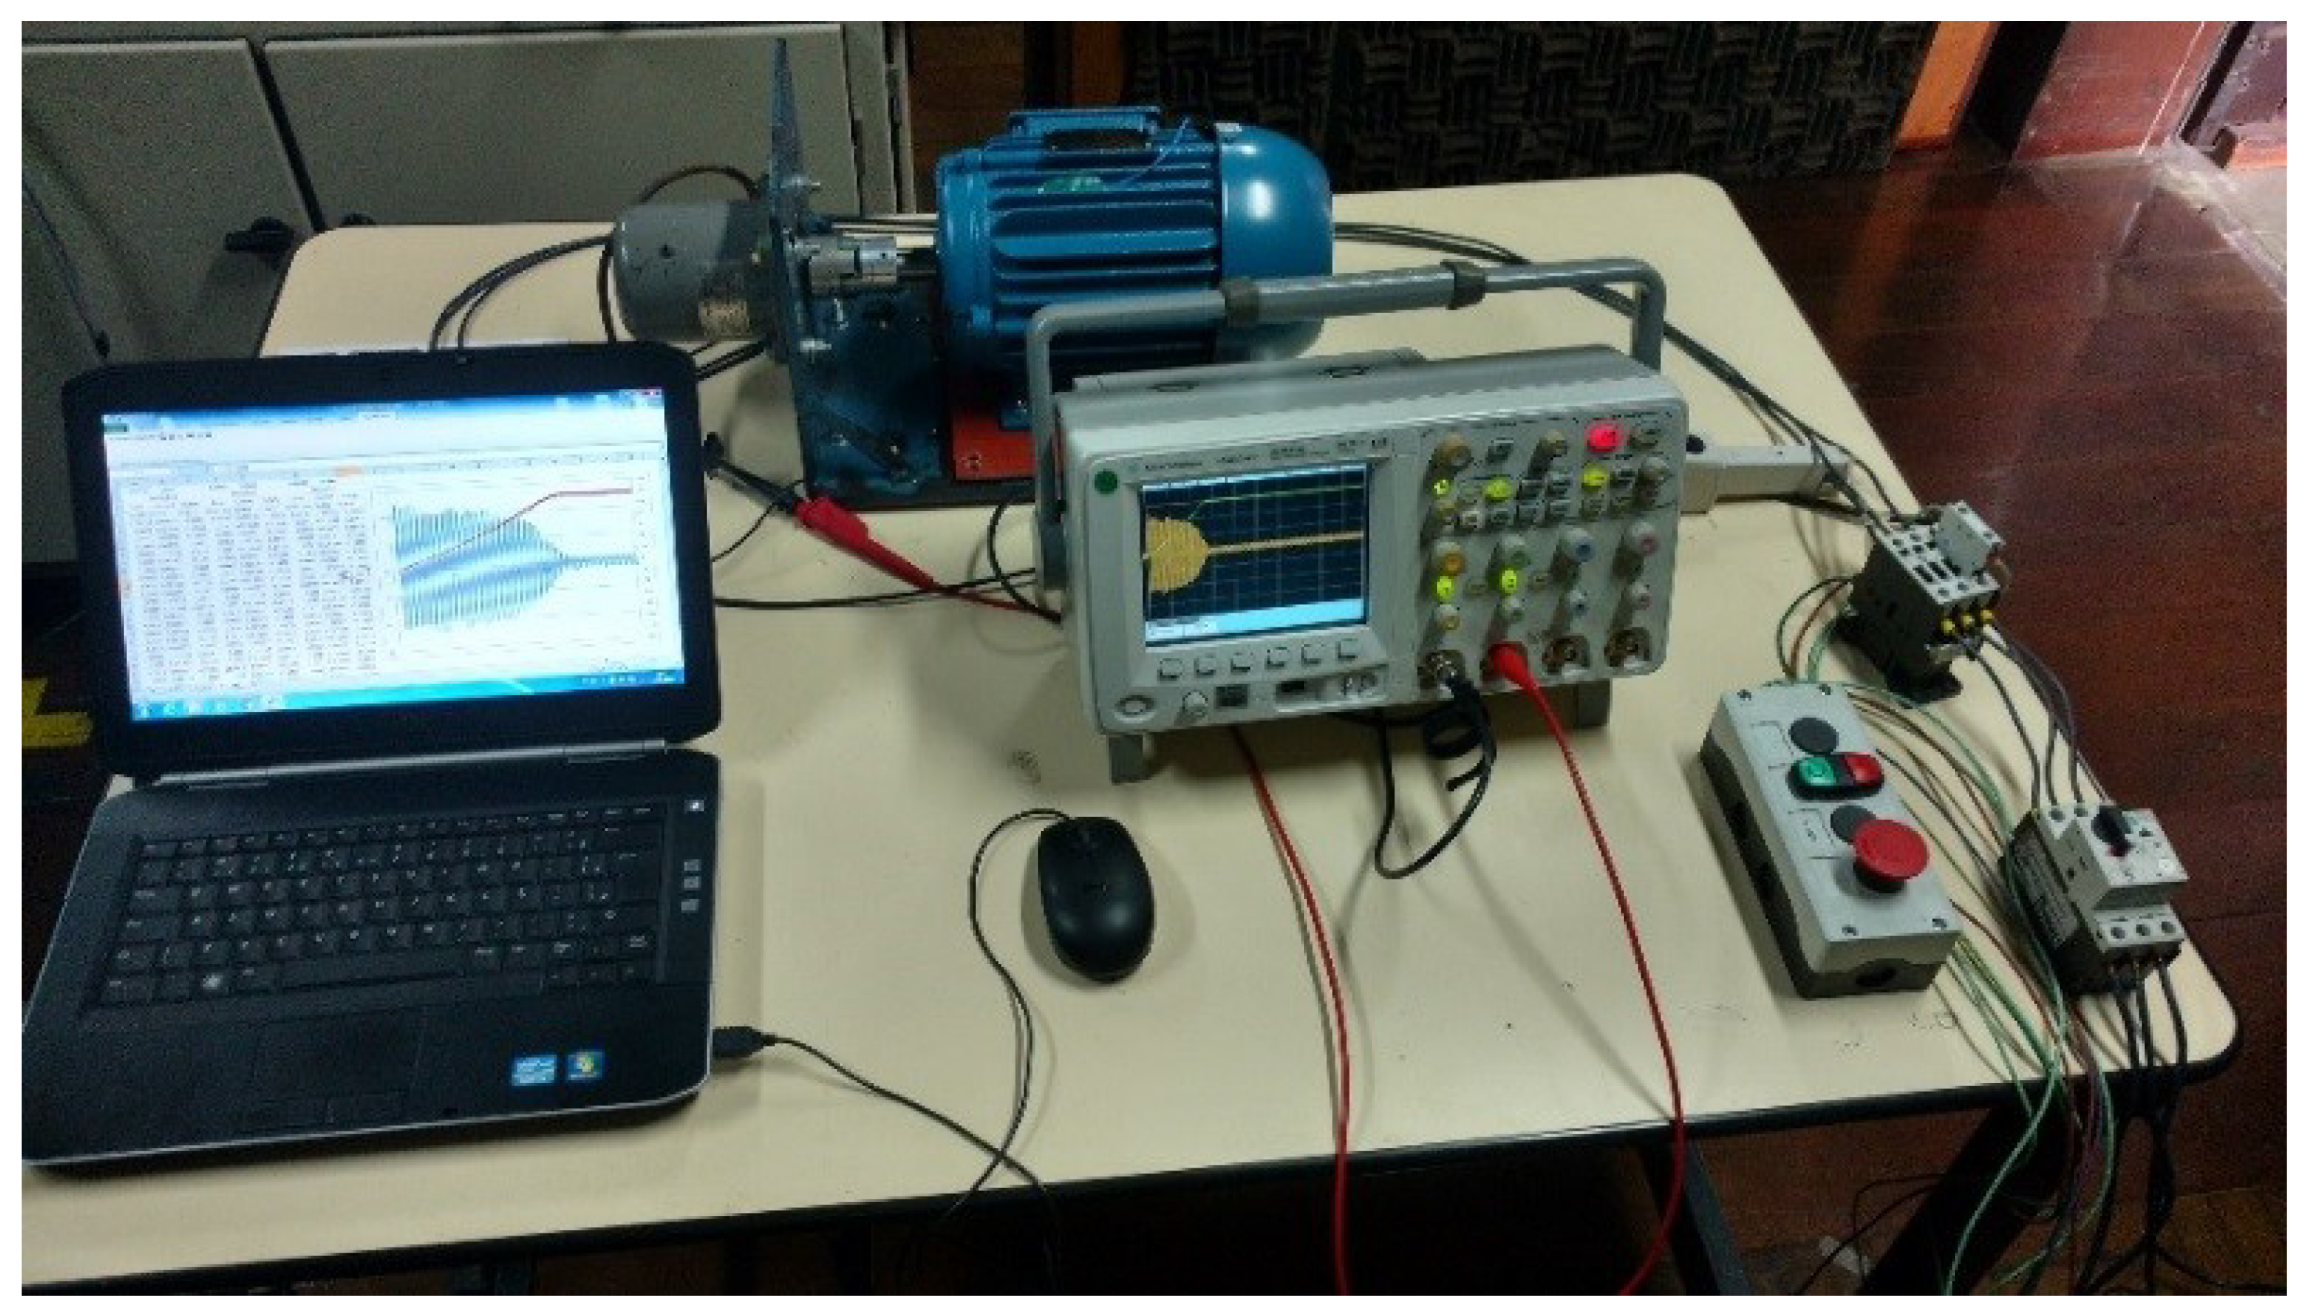
3. Experimental Setup

The experiments (Figure 1) were performed with a W22 motor, 3 HP, 220 V, 4 poles, 60 Hz, of the IEC 90L frame, and with six different rotors, manufactured specifically for this experiment by WEG Electric Corporation. The squirrel-cage rotors with aluminum bars (Figure 2) were manufactured under the following conditions:
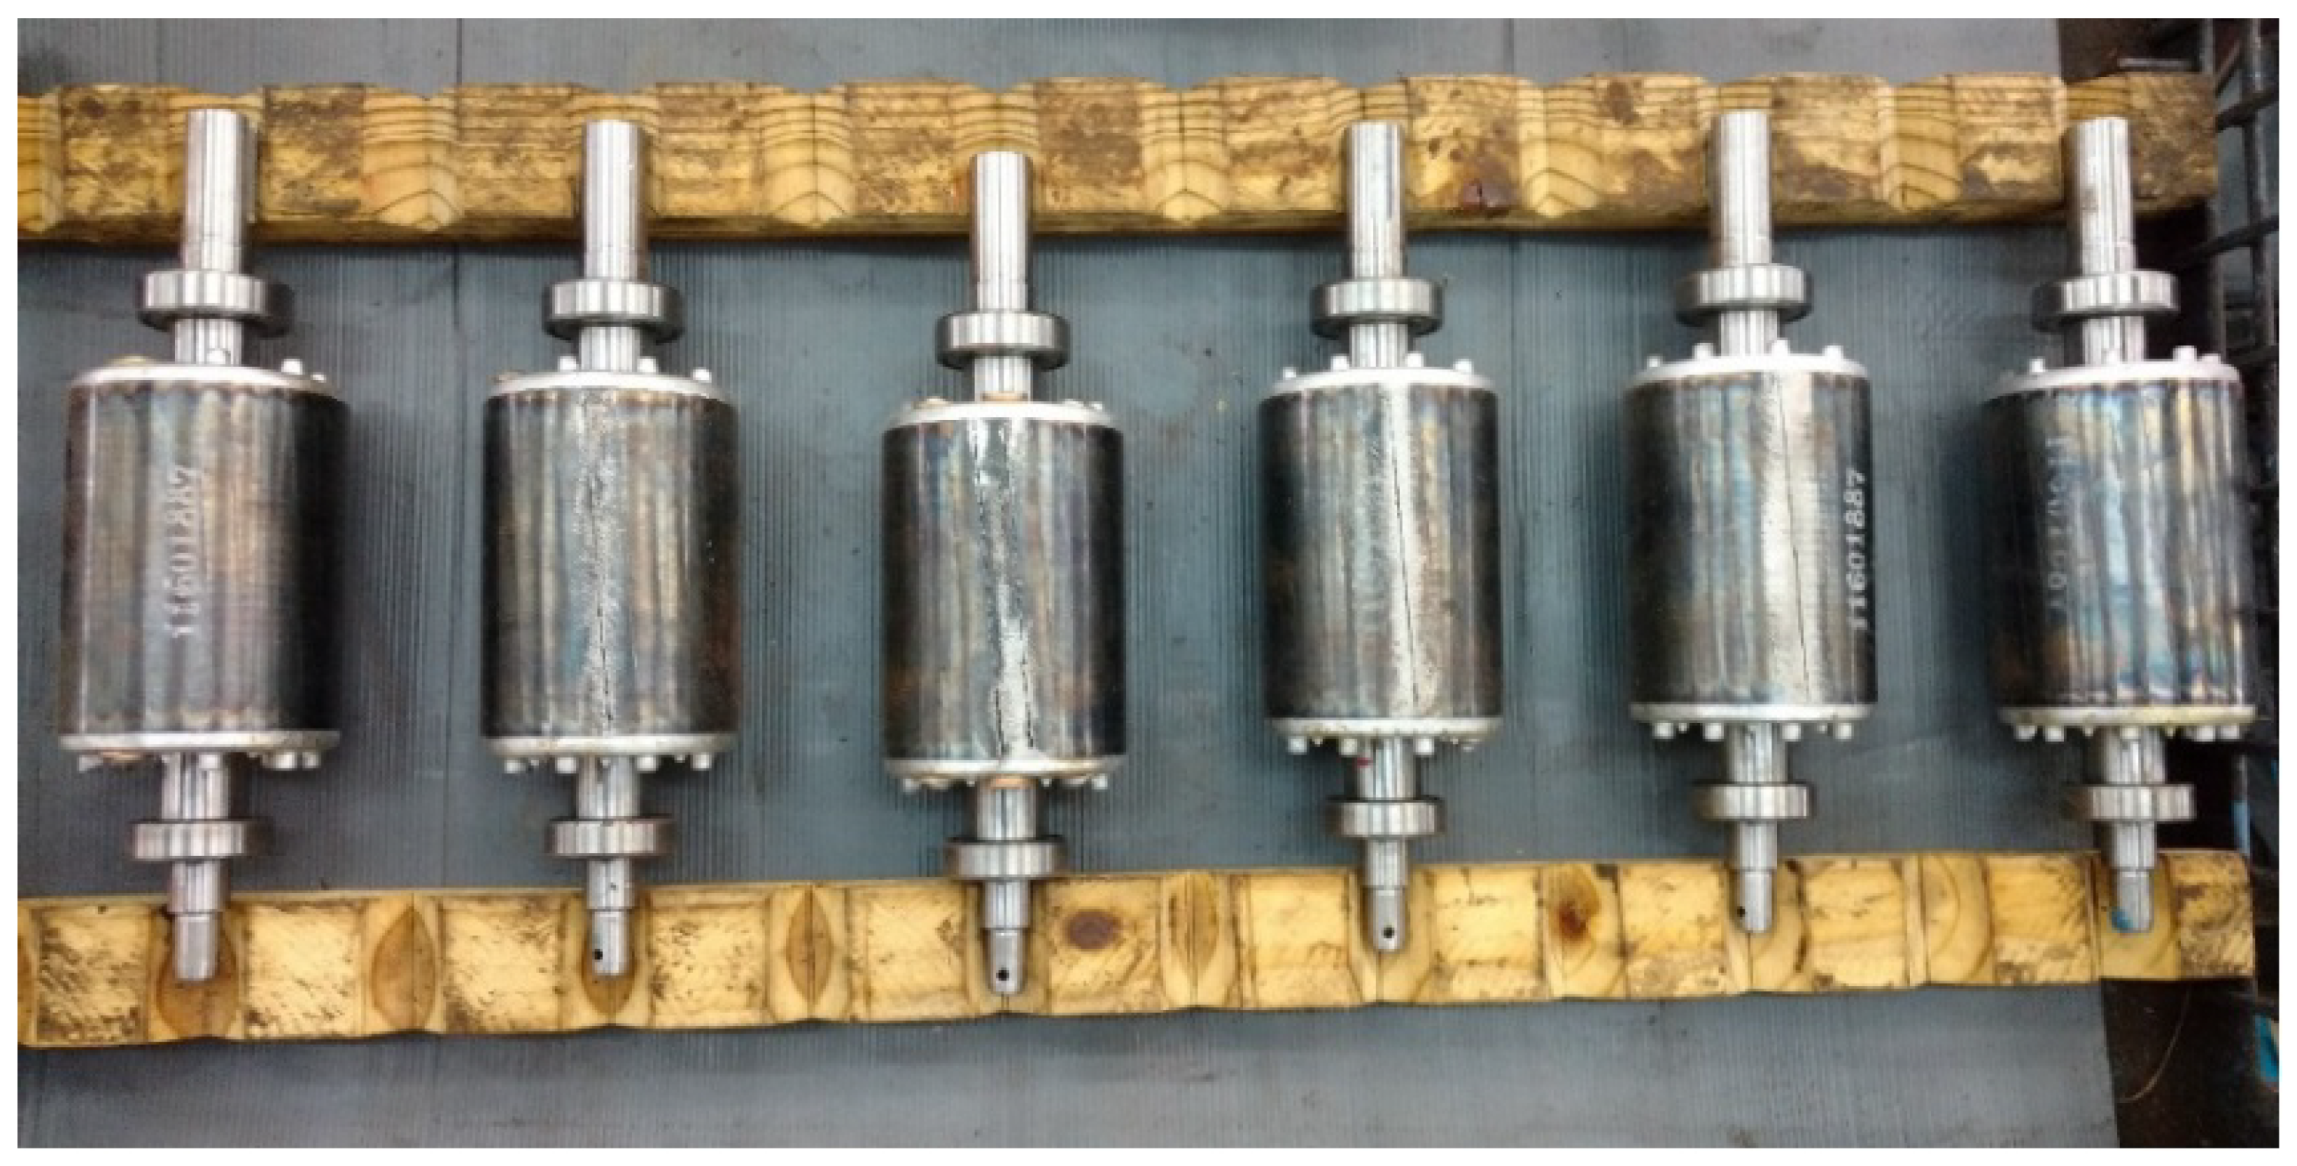
  • Rotor without failure (HEALTHY);
  • Rotor with one bar partially broken (½ BAR);
  • Rotor with one bar completely failed (1 BAR);
  • Rotor with 2 bars totally failed, geometrically separated by 180 (2 BAR 180);
  • Rotor with 2 bars totally failed, geometrically separated by 90 (2 BAR 90);
  • Rotor with 2 adjacent bars totally failed (2 BAR).
To manufacture the failures, refractory ceramics were inserted, preventing the passage of aluminum through the rotor groove during the injection process. In this way, the magnetic circuit of the rotor was not altered through any type of hole or machining.
Measurements were performed using a 4-channel non-isolated 100 MHz oscilloscope, with 2 Gsa/s (model: DSO5014A—Agilent Technologies) and an Agilent 1146A AC/DC current probe, with a capacity of 0 to 70 Arms (100 A at peak) and output 10 mV/A or 100 mV/A. All measurements were made with a sampling frequency of 5000 ksa/s ( f s = 5 kHz).
During a direct start-up with no-load, the transient time of the motor is too short to measure low frequencies. It is recommended that the start-up time should be increased until at least ten periods of the center frequency of the Gaussian filter. For this study, a Diesel generator, isolated from the grid, was used to drive the motor at a lower voltage (90 V-60 Hz) with low THD (total harmonic distortion). The start-up takes 0.7 s, allowing 14 periods of 20 Hz harmonic (Figure 3).
The current and voltage were measured in each coil/phase. The current signal is normalized by the nominal steady state root mean square (RMS) value.

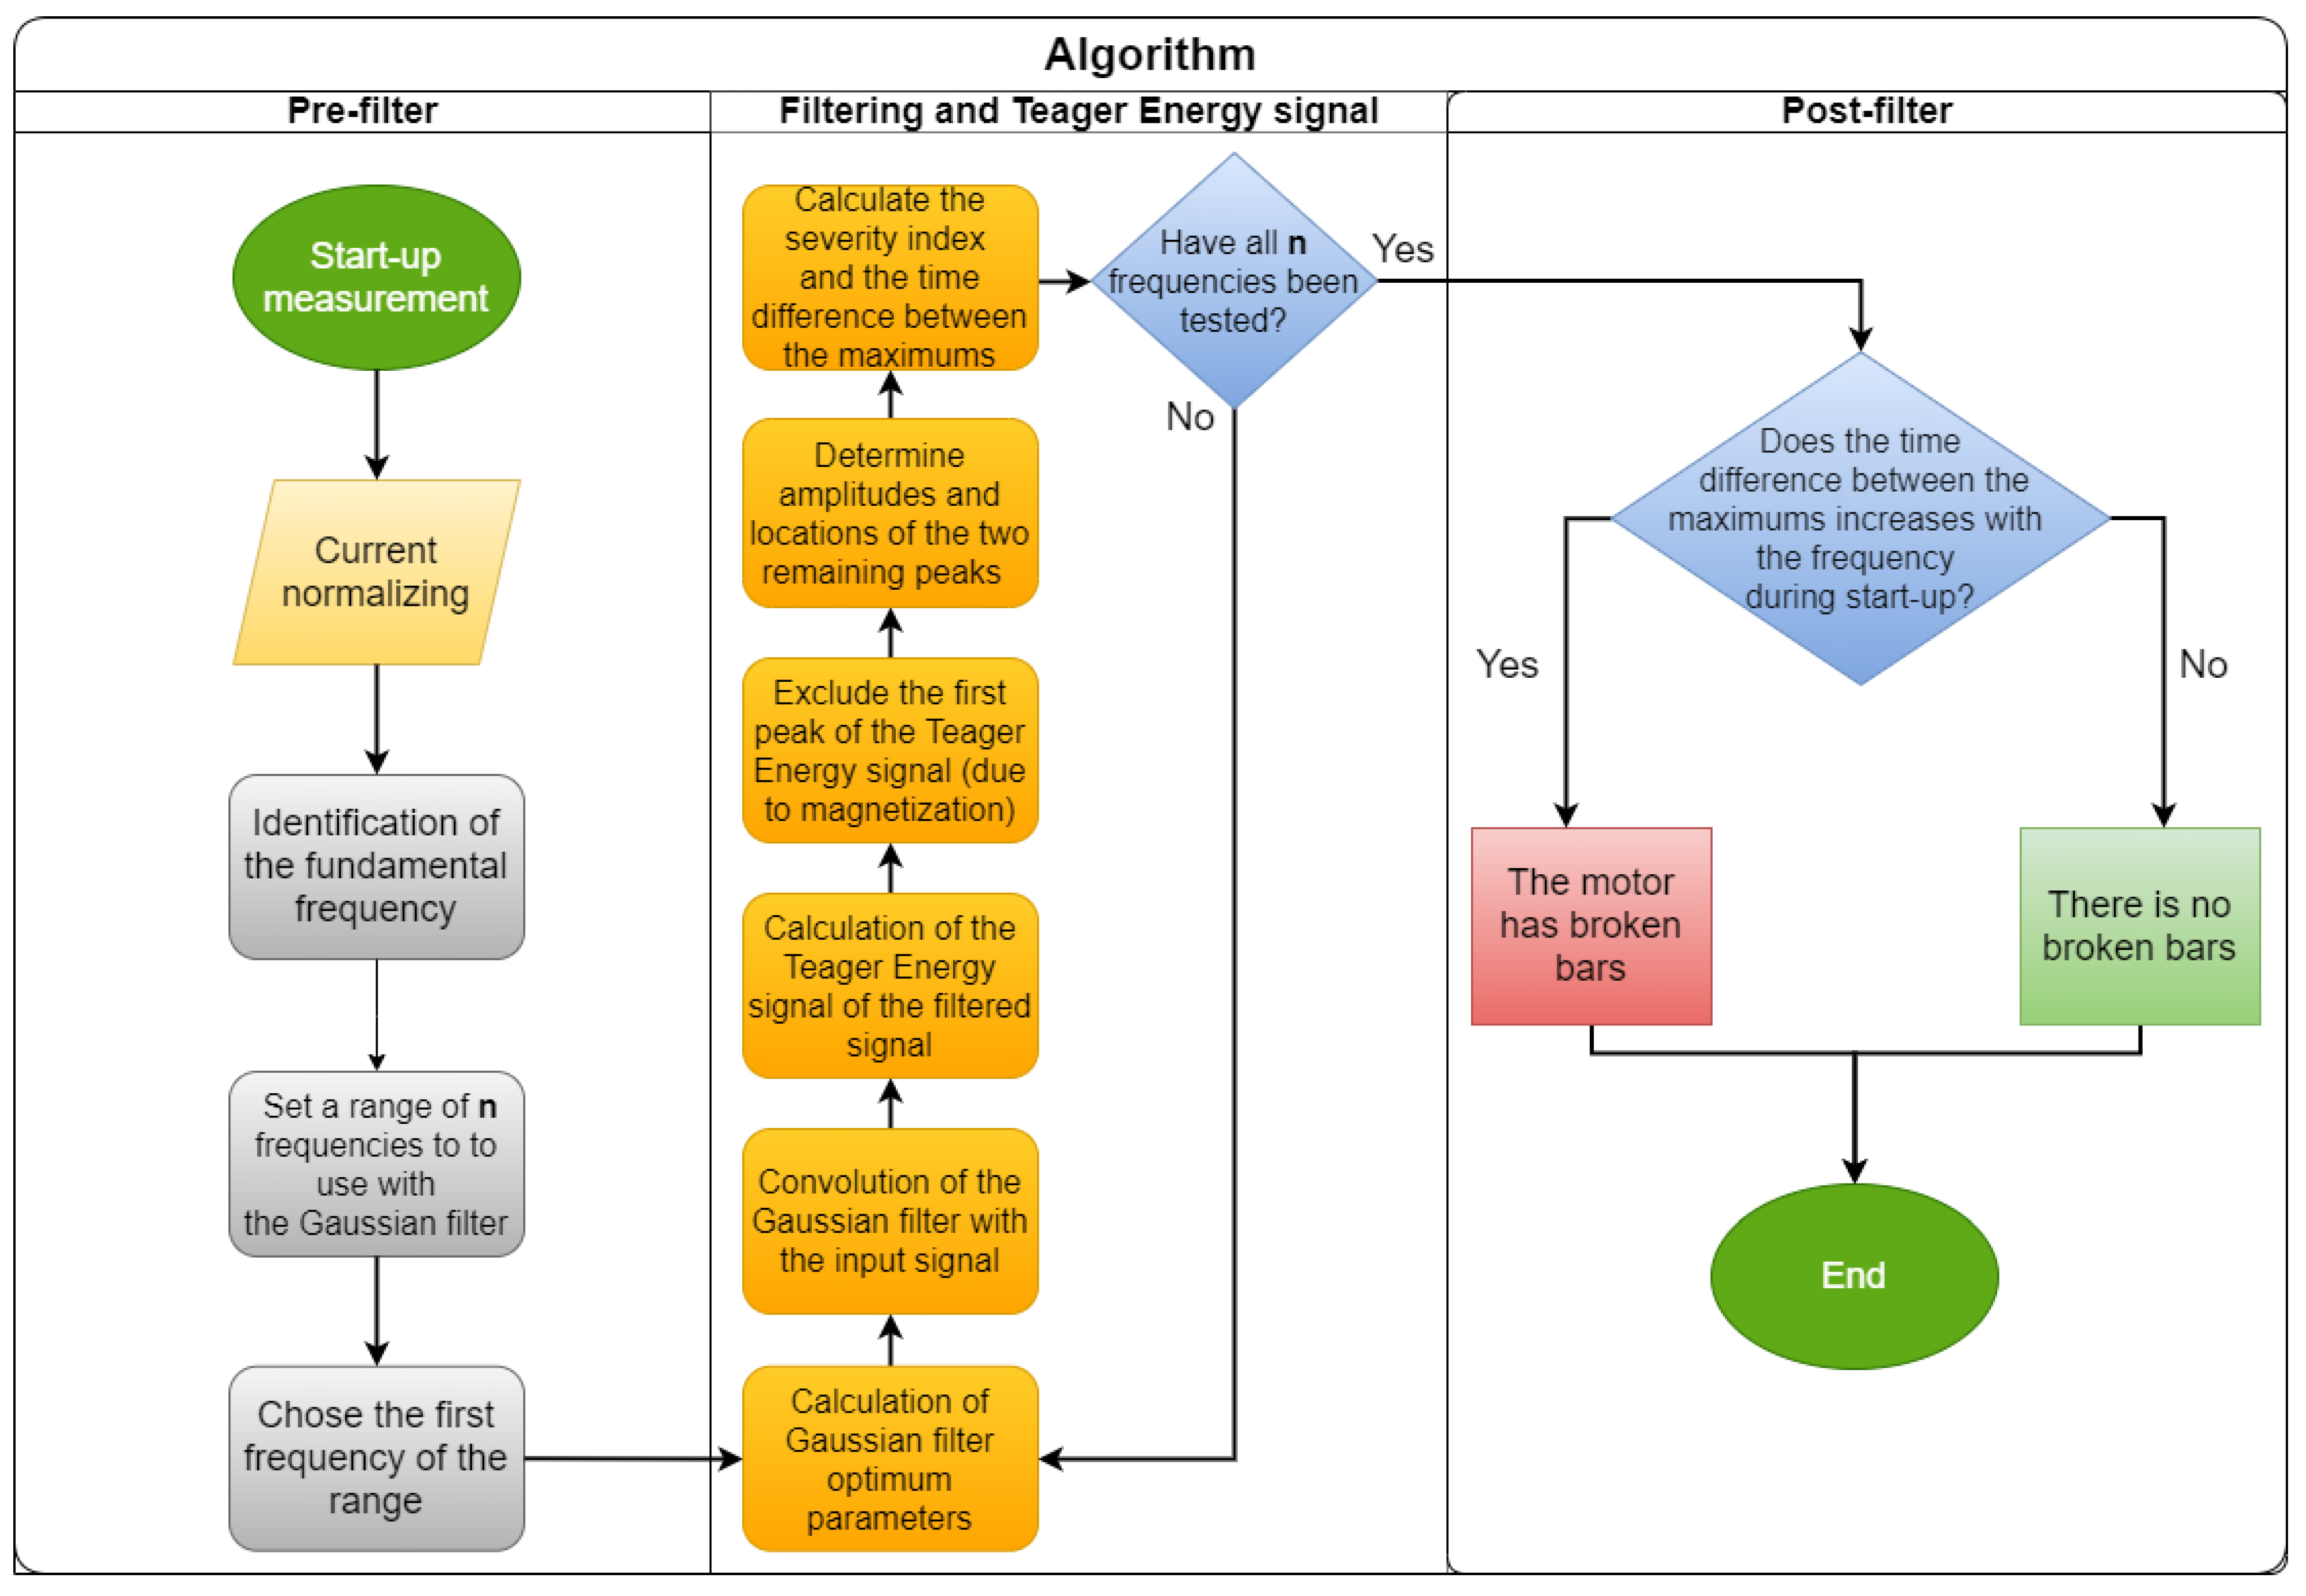
4. Algorithm Development

A flowchart of the algorithm is shown in Figure 4. It starts normalizing the measured current by its nominal RMS value, identifying the fundamental frequency and defining the frequency range to apply the filter.
Analyzing the harmonic generated by the broken bar (Figure 5), it is observed that, during the start, the frequency of the fault starts very close to the fundamental, decays to zero ( s = 0.5 ), and then it goes back to close values to fundamental when it reaches the permanent regime.
Based on [5], the range chosen for analysis is 20–30 Hz for a fundamental frequency of 60 Hz. For 50 Hz, the suggested range is 15–25 Hz.
In addition, for signal analysis, a Gaussian digital filter modulated in a central frequency f 0 with a standard deviation σ was used, as follows:
G ( t ) = 1 2 π σ e t 2 2 σ 2 sin ( 2 π f 0 t )
It is observed that the lower the value of the standard deviation, the more intense the signal is. However, the digital Gaussian filter always has a spectral leakage (spectral power in undesired frequencies). To minimize this leakage, the duration of the Gaussian pulse should be, at least, six periods of the centralized frequency ( 6 · 1 f 0 ) truncated at ± 3 σ (99.73%). Thus, the optimal standard deviation value ( σ ) is equal to the period, and it is different for each centralized frequency:
σ = 1 f 0
In order to analyze the severity of the fault, the Teager energy operator will be used in the result of the convolution of the current signal by the Gaussian digital filter. Only for comparison, Figure 6 shows the energy in each sample time. It is possible to see that the energy of the signal is oscillating and it has a lot of local maximum values.
The adopted Teager energy operator, on the other hand, increases the energy of the signal that contains the fault, since the operator is sensitive to oscillations, which represents the signals of the harmonic characteristics of the fault. After that, the frequency is changed and it is observed whether the temporal deviation occurs as expected by the equation of the failure as a function of the slip variation.
Applying Equation (3) in the current signal, the Teager energy is shown in Figure 7. The first maximum of Ψ is due to the magnetization of the motor and it should not be considered for broken bars diagnosis. If a partially broken bar exists, two more maximums will be shown during start-up. The qualification process makes use of the ‘time difference’ (Figure 7) between them to diagnose the failure. These time differences should increase with the increasement of the frequency filtered, as shown in Figure 8.

5. Results

The current measurements, applying the proposed algorithm with a Gaussian filter centered at 20, 25, and 30 Hz (half of the fundamental) and an optimal standard deviation Equation (11), are shown in Figure 9.
The Rotor HEALTHY, without failure (Figure 9), presents values in the order of 10 10 , except by one strange peak found in 20 Hz. For the results of a full broken bar, the Teager energy is three orders of magnitude above, and for a partially broken bar, Rotor ½ BAR, is in between. It is important to note that the value itself is not used for qualification; however, the fact of the ‘time difference’ between the maximums should be directly proportional to the filtered frequency, as shown in Figure 8.
The intensity of the Teager energy increases with severity of the fault, showing good sensitivity. It is higher for two broken bars at 90 ° (Rotor 2 BAR) than to others with two broken bars, to the one with one, and even smaller for a partially broken bar (Rotor ½ BAR), as shown in Figure 9. Furthermore, it is also observed that rotors with full broken bars present Teager energy peaks with a similar amplitude. On the other hand, in Rotor ½ BAR, where the bar is partially faulted, the peaks have very different amplitudes, which can be greater both before and after half of the nominal angular velocity.

5.1. Qualification

Based on the proposed algorithm (Figure 4), the ‘time difference’ between the Ψ maximums should increase with the filtered frequency during start-up to qualify a broken bar. Visually, this can be seen in Figure 8. However, this can be more easily observed numerically in the results, where Table 1 organizes by rotor condition and filtered frequency ( f 0 ). Taking the discrete sample time of the first ( t m a x 1 ) and the second ( t m a x 2 ) maximum of the Teager operator energy, it is possible to compute the ‘time difference’ between them: Δ t 2 1 = ( t m a x 2 t m a x 2 ) . It can be noted that, except in Rotor HEALTHY, the ‘time difference’ ( Δ t 2 1 ) increases with the filtered frequency, which means that there is difference between the resistances of the bars. Even for Rotor ½ BAR, which only has a partially broken bar, this condition is valid.

5.2. Quantification

Once the failure is identified, the next step is to quantify the severity using the average value between the two maximums of the Teager energy. As described in [5], the best center frequency of the Gaussian filter ( f 0 ) to choose is half of the fundamental frequency ( f 0 = f / 2 ). Table 2 brings the results organized by the rotor condition, highlighting the value of the first ( Ψ m a x 1 ) and of the second ( Ψ m a x 2 ) maximums. The severity index is defined as the mean Teager energy value: Ψ ¯ = ( Ψ m a x 1 + Ψ m a x 2 ) / 2 . It is observed in the table that the value of Ψ ¯ increases with the severity of the failure, increasing correctly in the sequence: HEALTHY—½ BAR—1 BAR—2 BAR 180—2 BAR 90—2 BAR. The values that were found with one failed bar are in the range of 10 7 , rising to 10 6 for two bars. On the other hand, when it comes to a partially damaged bar, two orders of magnitude ( 10 8 ) get dropped. In the case of Rotor HEALTHY, the value found was even lower: about two thousand times lower than that computed with a failed bar, giving good sensitivity for this severity index. Allied to this, the qualification condition proved that this rotor does not have failed bars, suggesting that even this meager value should be disregarded.

5.2.1. Benchmarking

A basic principle of severity indexes is their capacity to measure the fault and provide a correlation between the value and its severity. One key characteristic to choose the better index is its sensitivity, which gives more accuracy to the diagnostic. A comparison between the available indexes was done, using the published data, by the ratio between the value found for one broken bar and a healthy rotor. The half broken bar, normally done by machining, cannot be used in this case due to its divergence of conditions in each experiment. Table 3 shows that the proposed algorithm has the best severity index in terms of sensitivity, closely followed by [14]. The other indexes are relatively distant.

6. Conclusions

In this paper, an algorithm was proposed to diagnose broken bars in three-phase induction motors. To analyze the measured stator current, a Gaussian filter with an optimal standard deviation at a centralized frequency was used. To measure the severity of the fault, the Teager energy operator was applied to the filtered signal. During start-up, a first maximum appears due to the magnetization of the motor, then, two more maximums will be shown if there is a fault. There is a ‘time difference’ between the Ψ maximums, and it is used to qualify the fault. It should increase with an increasement in the filtered frequency. A severity index is also proposed and compared to the state-of-the-art, in terms of index sensitivity. Finally, to validate the algorithm, measurements were carried out in a healthy rotor, a partially broken bar, a broken bar, and two completely broken bars arranged in a variety of ways (adjacent, 90 and 180 ).
The results show that the algorithm qualifies correctly the faulty bar, even for a partially broken bar. For the Rotor HEALTHY—without failure—the mean Teager energy ( Ψ ¯ ) results in a value 459 times lower than a completely broken bar and, moreover, it fails in the qualification test proposed by the algorithm. Evaluating the detection of the most critical case, when the bar is not completely interrupted, the Ψ ¯ is 29 times higher than the healthy rotor and it passes in the qualification test.
The proposed severity index (the value of Ψ ¯ ) increases with the magnitude of the failure, increasing in the right sequence: one partially broken bar, one broken bar, two totally failed bars at 180 , two totally failed bars at 90 , and two adjacent totally failed bars. Another important result is that the severity index has the higher sensitivity in comparison with the state-of-the-art.
The proposed algorithm shows efficiency in qualifying and quantifying even partially broken bars. It mitigates considerably the computational cost, because it is a simpler filter with well-defined parameters, which provides it with the possibility of automatizing the entire process. It has already been used, for example, as a quality test in a production line.

Author Contributions

Conceptualization and formal analysis, D.B.R. and M.V.S.; methodology, supervision, project administration and funding acquisition, D.B.R.; validation, D.B.R. and J.C.O.L.; data curation, M.V.S.; writing—original draft preparation, M.V.S. and A.M.P.R.; writing—review and editing, D.B.R. and J.C.O.L. All authors have read and agreed to the published version of the manuscript.

Funding

This research was funded by Financiadora de Estudos e Projetos (FINEP) grant number 0114021600. The APC was funded by Coordenação de Aperfeiçoamento de Pessoal de Nível Superior—Brasil (CAPES)—Finance Code 001. The Conselho Nacional de Desenvolvimento Científico e Tecnológico (CNPq) funded a scholarship.

Institutional Review Board Statement

Not applicable.

Informed Consent Statement

Not applicable.

Data Availability Statement

Not applicable.

Acknowledgments

The authors would like to thank the WEG Electric Corporation, especially Eng. Daniel Schmitz.

Conflicts of Interest

The authors declare no conflict of interest.

References

  1. Penman, J.; Stavrou, A. Broken rotor bars: Their effect on the transient performance of induction machines. IEE Proc. Electr. Power Appl. 1996, 143, 449–457. [Google Scholar] [CrossRef]
  2. Thomson, W.T.; Fenger, M. Current signature analysis to detect induction motor faults. IEEE Ind. Appl. Mag. 2001, 7, 26–34. [Google Scholar] [CrossRef]
  3. Bellini, A.; Filippetti, F.; Franceschini, G.; Tassoni, C.; Kliman, G.B. Quantitative evaluation of induction motor broken bars by means of electrical signature analysis. IEEE Trans. Ind. Appl. 2001, 37, 1248–1255. [Google Scholar] [CrossRef]
  4. Deleroi, W. Der Stabbruch im Käfiǵläufer eines Asynchronmotors. Arch. Für Elektrotechnik 1984, 67, 91. [Google Scholar] [CrossRef]
  5. Riera-Guasp, M.; Antonino-Daviu, J.A.; Roger-Folch, J.; Molina Palomares, P.M. The use of the wavelet approximation signal as a tool for the diagnosis of rotor bar failures. IEEE Trans. Ind. Appl. 2008, 44, 716–726. [Google Scholar] [CrossRef] [Green Version]
  6. Baranov, G.D.; Nepomuceno, E.G.; Vaganov, M.A.; Ostrovskii, V.Y.; Butusov, D.N. New spectral markers for broken bars diagnostics in induction motors. Machines 2020, 8, 6. [Google Scholar] [CrossRef] [Green Version]
  7. Douglas, H.; Pillay, P.; Ziarani, A.K. Broken rotor bar detection in induction machines with transient operating speeds. IEEE Trans. Energy Convers. 2005, 20, 135–141. [Google Scholar] [CrossRef]
  8. Watson, J.F.; Paterson, N.C. Improved techniques for rotor fault detection in three-phase induction motors. In Proceedings of the Conference Record of 1998 IEEE Industry Applications Conference, Thirty-Third IAS Annual Meeting (Cat. No. 98CH36242), St. Louis, MO, USA, 12–15 October 1998; Volume 1, pp. 271–277. [Google Scholar]
  9. Burriel-Valencia, J.; Puche-Panadero, R.; Martinez-Roman, J.; Sapena-Bano, A.; Pineda-Sanchez, M. Short-Frequency Fourier Transform for Fault Diagnosis of Induction Machines Working in Transient Regime. IEEE Trans. Instrum. Meas. 2017, 66, 432–440. [Google Scholar] [CrossRef] [Green Version]
  10. Gyftakis, K.N.; Spyropoulos, D.V.; Arvanitakis, I.; Panagiotou, P.A.; Mitronikas, E.D. Induction motors torque analysis via frequency extraction for reliable broken rotor bar detection. In Proceedings of the 2020 International Conference on Electrical Machines (ICEM), Gothenburg, Sweden, 23–26 August 2020; pp. 1468–1474. [Google Scholar] [CrossRef]
  11. Sinha, A.K.; Hati, A.S.; Benbouzid, M.; Chakrabarti, P. Ann-based pattern recognition for induction motor broken rotor bar monitoring under supply frequency regulation. Machines 2021, 9, 87. [Google Scholar] [CrossRef]
  12. Morinigo-Sotelo, D.; Romero-Troncoso, R.D.J.; Panagiotou, P.A.; Antonino-Daviu, J.A.; Gyftakis, K.N. Reliable Detection of Rotor Bars Breakage in Induction Motors via MUSIC and ZSC. IEEE Trans. Ind. Appl. 2018, 54, 1224–1234. [Google Scholar] [CrossRef]
  13. Pons-Llinares, J.; Riera-Guasp, M.; Antonino-Daviu, J.A.; Habetler, T.G. Pursuing optimal electric machines transient diagnosis: The adaptive slope transform. Mech. Syst. Signal Process. 2016, 80, 553–569. [Google Scholar] [CrossRef]
  14. Fernandez-Cavero, V.; Pons-Llinares, J.; Duque-Perez, O.; Morinigo-Sotelo, D. Detection of Broken Rotor Bars in Nonlinear Startups of Inverter-Fed Induction Motors. IEEE Trans. Ind. Appl. 2021, 57, 2559–2568. [Google Scholar] [CrossRef]
  15. Lizarraga-Morales, R.A.; Rodriguez-Donate, C.; Cabal-Yepez, E.; Lopez-Ramirez, M.; Ledesma-Carrillo, L.M.; Ferrucho-Alvarez, E.R. Novel FPGA-based methodology for early broken rotor bar detection and classification through homogeneity estimation. IEEE Trans. Instrum. Meas. 2017, 66, 1760–1769. [Google Scholar] [CrossRef]
  16. Abid, A.; Khan, M.T.; Lang, H.; De Silva, C.W. Adaptive system identification and severity index-based fault diagnosis in motors. IEEE/ASME Trans. Mechatronics 2020, 24, 1628–1639. [Google Scholar] [CrossRef]
  17. Valtierra-Rodriguez, M.; Rivera-Guillen, J.R.; Basurto-Hurtado, J.A.; Jesus De-Santiago-Perez, J.; Granados-Lieberman, D.; Amezquita-Sanchez, J.P. Convolutional neural network and motor current signature analysis during the transient state for detection of broken rotor bars in induction motors. Sensors 2020, 20, 3721. [Google Scholar] [CrossRef] [PubMed]
  18. Lopez-Ramirez, M.; Ledesma-Carrillo, L.M.; Garcia-Guevara, F.M.; Munoz-Minjares, J.; Cabal-Yepez, E.; Villalobos-Pina, F.J. Automatic Early Broken-Rotor-Bar Detection and Classification Using Otsu Segmentation. IEEE Access 2020, 8, 112624–112632. [Google Scholar] [CrossRef]
  19. Concari, C.; Franceschini, G.; Tassoni, C. Monitoring of rotor cage conditions in induction machines by instantaneous reactive power and current space vector’s reactive component. In Proceedings of the 2009 IEEE International Symposium on Diagnostics for Electric Machines, Power Electronics and Drives, Cargese, France, 31 August–3 September 2009; pp. 1–7. [Google Scholar] [CrossRef]
  20. Didier, G.; Ternisien, E.; Caspary, O.; Razik, H. Fault detection of broken rotor bars in induction motor using a global fault index. IEEE Trans. Ind. Appl. 2006, 42, 79–88. [Google Scholar] [CrossRef] [Green Version]
  21. Janeiro, F.M.; Martins, J.F.; Pires, V.F.; Ramos, P.M.; Pires, A.J. Induction Motor Broken Bars Online Detection. In Proceedings of the 2008 IEEE Instrumentation and Measurement Technology Conference, Victoria, BC, Canada, 12–15 May 2008; Volume 2, pp. 2137–2140. [Google Scholar] [CrossRef]
  22. El-Dine Atta, M.E.; Ibrahim, D.K.; Gilany, M.I. Broken Bar Faults Detection under Induction Motor Starting Conditions Using the Optimized Stockwell Transform and Adaptive Time-Frequency Filter. IEEE Trans. Instrum. Meas. 2021, 70, 3518110. [Google Scholar] [CrossRef]
  23. Lee, S.B.; Stone, G.C.; Antonino-Daviu, J.; Gyftakis, K.N.; Strangas, E.G.; Maussion, P.; Platero, C.A. Condition Monitoring of Industrial Electric Machines: State of the Art and Future Challenges. IEEE Ind. Electron. Mag. 2020, 14, 158–167. [Google Scholar] [CrossRef]
  24. Didier, G.; Ternisien, E.; Caspary, O.; Razik, H. A new approach to detect broken rotor bars in induction machines by current spectrum analysis. Mech. Syst. Signal Process. 2007, 21, 1127–1142. [Google Scholar] [CrossRef] [Green Version]
  25. Kaiser, J.F. On a simple algorithm to calculate the ‘energy’ of a signal. In Proceedings of the International Conference on Acoustics, Speech, and Signal Processing, Albuquerque, NM, USA, 3–6 April 1990; Volume 1, pp. 381–384. [Google Scholar] [CrossRef]
  26. Bellini, A.; Filippetti, F.; Franceschini, F.; Sobczyk, T.J.; Tassoni, C. Diagnosis of induction machines by d-q and i.s.c. rotor models. In Proceedings of the 2005 5th IEEE International Symposium on Diagnostics for Electric Machines, Power Electronics and Drives, Vienna, Austria, 7–9 September 2005; pp. 7–9. [Google Scholar] [CrossRef]
Figure 1. Test bench setup.
Machines 09 00250 g001
Figure 2. Rotors with controlled failures, manufactured especially for the study.
Machines 09 00250 g002
Figure 3. Measured startup current for the rotor with one bar partially broken (½ BAR).
Machines 09 00250 g003
Figure 4. Algorithm flowchart.
Machines 09 00250 g004
Figure 5. Broken Rotor bar’s failure frequency and Teager Energy filtered at different frequencies as a function of the slip.
Machines 09 00250 g005
Figure 6. Energy of the rotor with one broken bar—1 BAR (filter centered at f 0 = 30 Hz).
Machines 09 00250 g006
Figure 7. Teager energy of the rotor with one broken bar—1 BAR (filter centered at f 0 = 30 Hz).
Machines 09 00250 g007
Figure 8. Teager energy at different frequencies (Rotor 2 BAR).
Machines 09 00250 g008
Figure 9. Teager Energy of all rotors (filter centered at f 0 = 20, 25 and 30 Hz).
Machines 09 00250 g009
Table 1. Interval between Teager energy maximums.
Rotor f 0 t max 1 (s) t max 2 (s) Δ t 2 1 (s)
HEALTHY200.2500.6900.439
HEALTHY250.2200.2800.064
HEALTHY300.2800.4600.186
½ BAR200.2700.4200.158
½ BAR250.2500.4500.197
½ BAR300.1800.4700.284
1 BAR200.2800.4500.178
1 BAR250.2300.4800.247
1 BAR300.2000.5000.296
2 BAR 180200.2400.4800.244
2 BAR 180250.2300.5000.271
2 BAR 180300.2000.5200.324
2 BAR 90200.2600.4800.226
2 BAR 90250.2300.5000.274
2 BAR 90300.2100.5300.316
2 BAR200.2700.4900.219
2 BAR250.2300.5100.277
2 BAR300.2100.5400.330
Table 2. Teager energy maximums at f 0 = 30 Hz.
Rotor Ψ max 1 Ψ max 2 Ψ ¯
HEALTHY8.249 × 10−109.424 × 10−108.837 × 10⁻¹⁰
½ BAR5.835 × 10−94.523 × 10−82.553 × 10−8
1 BAR4.169 × 10−73.948 × 10−74.058 × 10−7
2 BAR 1801.515 × 10−61.413 × 10−61.464 × 10−6
2 BAR 901.625 × 10−61.402 × 10−61.514 × 10⁻⁶
2 BAR2.572 × 10−62.369 × 10−62.471 × 10−6
Table 3. Severity Index Benchmark.
RankOne Broken BarHealthySensitivity (abs)Reference
14.058 × 10−78.837 × 10−10459This Paper
2−126 dB−100 dB398Ref. [14]
35473222.924.6Ref. [22]
40.04350.002021.8Ref. [20]
510.0812.5Ref. [26]
Publisher’s Note: MDPI stays neutral with regard to jurisdictional claims in published maps and institutional affiliations.

