Abstract
Titanium is widely used in biomedical components. As a promising advanced manufacturing process, electropolishing (EP) has advantages in polishing the machined surfaces of material that is hard and difficult to cut. This paper presents the fabrication of a titanium microchannel using the EP process. The Taguchi method was adopted to determine the optimal process parameters by which to obtain high surface quality using an L9 orthogonal array. The Pareto analysis of variance was utilized to analyze the three machining process parameters: applied voltage, concentration of ethanol in an electrolyte solution, and machining gap. In vitro experiments were conducted to investigate the fouling effect of blood on the microchannel. The result shows that an applied voltage of 20 V, an ethanol concentration of 20 vol.%, and a machining gap of 10 mm are the optimum machining parameters by which to enhance the surface quality of a titanium microchannel. Under the optimized machining parameters, the surface quality improved from 1.46 to 0.22 μm. Moreover, the adhesion of blood on the surface during the fouling experiment was significantly decreased, thus confirming the effectiveness of the proposed method.
1. Introduction
Electropolishing (EP) is a finishing process that removes material from a metal based on an anodic dissolution process, which was invented by M. Faraday in the 19th century [1]. EP is commonly used as a non-conventional final machining process and is commercially applied in the medical, automobile, and petroleum industries [2,3]. EP has many merits compared to other non-conventional machining techniques, such as negligible tool wear, a higher material removal rate, and the ability to fabricate complex shapes [4,5,6]. During the EP process, DC voltage is applied in between the tool (cathode) and the workpiece (anode). An electrolyte solution is supplied and fills the machining gap to finish the flow current and dissolve the workpiece [7]. In EP, the material removal rate is determined by electrical properties, electrolyte properties, and material properties [8,9].
EP is not only intended for the final machining process but can also be used to fabricate complex shapes on hard materials, considering its nature of non-physical contact between the tool and the workpiece. EP is considered superior amongst other mechanical polishing techniques, especially for the polishing of material that is hard and difficult to machine, such as titanium and its alloys [10].
Titanium has been widely used in numerous biomedical applications due to its chemical inertness and biocompatibility [11]. Owing to titanium’s particular mechanical and thermal properties, non-conventional machining methods such as the wire electrical discharge machine (Wire EDM) are required for the roughing operation of titanium [12]. However, the wire EDM machining process is based on an electrothermal erosion method to remove the materials; therefore, the occurrence of thermal stress and micro-cracks on the machined surface is inevitable [13]. Khosrozadeh et al. [14] found that a high thermal gradient in the EDM process produces significant changes in surface integrity, such as the appearance of a recast layer, residual stress, and the reduction of corrosion resistance on the machined workpiece. Chalisgaonkar et al. [15] presented the feed-forward back propagation using neural network modeling technique to predict the surface quality of pure titanium workpieces machined by WEDM. The microstructure analysis showed that more craters are formed with an increase in discharge energy.
Thus, EP is further selected as a finishing operation for the advanced manufacturing process owing to its non-thermal machining characteristics. However, EP also deals with many challenges in micromachining, especially microfabrication with high surface quality.
Mitchell-Smith et al. [16] developed an electrochemical machining technique by adjusting the angle between the nozzle and the workpiece surface to achieve a mirror-like finish of a microstructure. Zou et al. [17] worked on producing a high machining quality of microholes in electrochemical micromachining by using a non-conductive material as a mask on the machined surface. The result showed that the non-conductive mask was able to decrease the stray corrosion by reducing the stray current, resulting in the improvement of machining quality.
Zhan et al. [18] fabricated a low-surface-roughness microstructure (Ra 53.6 nm) using gas-assisted electrochemical micromachining. This method was performed by utilizing a gas-shielding electrode tool and evoking a local electrolyte flow at the gap between the tool and the workpiece for better flushing, resulting in higher surface quality. Sharma et al. [19] investigated the effect of pulse voltage waveforms in the microfabrication of kerf profiles in wire electrochemical micromachining. The experimental results showed that the surface roughness of the machined kerf was improved from 1.43 to 0.44 µm by changing the frequency of the voltage pulse from 100 to 200 kHz. Bi et al. [20] investigated the fabrication of pure nickel microstructures, concentrating on different types of machining indicators. Based on the experimental result, a rounded edge with high surface quality was obtained by increasing the pulse period and feed rate.
In EP, the electrolyte properties should be closely controlled so as to produce a good quality machined surface [21,22,23]. Deng et al. [24] used NaCl-ethylene glycol as an electrolyte solution to print out a circuit heat exchanger fluid channel on titanium plates. The result noted that the etched titanium channels gave lower average surface roughness than the conventional methods. NaCl containing ethylene glycol solution was also used as an electrolyte to improve the performance of electrochemical machining in fabricating microfeatures on titanium [25].
Ao et al. [26] used a water-free electrolyte in the electrochemical micromachining process by adding ethanol into a glycol-NaCl electrolyte solution to improve the machining quality. The introduction of 20 vol.% of ethanol successfully improved the surface quality without affecting the machining accuracy. Electrolyte chemistry can also be utilized to meet the desired specific purpose. A 40 ethylene glycol:1 TiCl4 electrolyte was used in single-step anodic dissolution to transform a bright-finish titanium surface into a patterned matte surface [27].
However, it is impossible to obtain an optimal surface quality through those few combinations of machining parameters. Therefore, in this work, an attempt has been made to optimize the EP parameters to improve the surface roughness of the machined surface. EP was used to polish a complex design of a microfluidic channel, as shown in Figure 1. Previously, we developed a microfluidic channel for a microdialysis device [28]. The microdialysis device consisted of a microfluidic channel and a polymeric membrane that works as a separation membrane during the blood filtration process. Microdialysis works within the range of human blood pressure, exempting the dialysis fluid and pump, thus leading to the miniaturization and simplicity of the dialysis system. This device has the potential to be used in hemofiltration systems for fully implantable dialysis therapy.
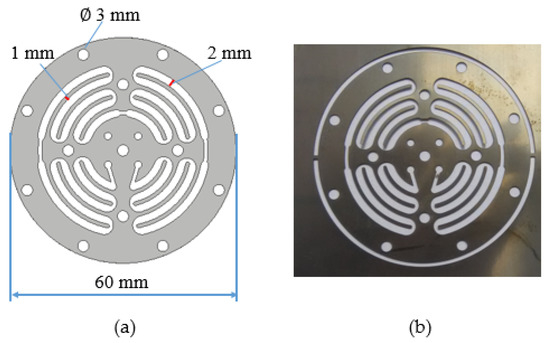
Figure 1.
Microfluidic channel. (a) Design of microfluidic channel; (b) microfluidic channel fabricated using wire EDM (rough machining).
The main machining parameters were: applied voltage, concentration of ethanol in the electrolyte solution, and machining gap, which were used and optimized using the Taguchi statistical method. An in vitro test using bovine blood was conducted to determine the effect of surface quality on fouling and blood coagulation.
2. Experimental Design
Conventional experimental design methods are difficult to use. If there are many machining parameters, a large number of experiments need to be conducted. The Taguchi method proposes a reduction in experimental trials in order to optimize and analyze the parameter that is responsible for quality outputs, such as surface roughness [29,30,31]. Taguchi used a design of orthogonal arrays to investigate the whole of the main parameter by only carrying out a small number of experimental trials. To minimize the variations in the quality of output, Taguchi processed the repetition results into another value that consisted of the calculation of the signal-to-noise (S/N) ratio that integrates several repetitions into one performance measure that represents the amount of variation that occurs [29,32]. The highest S/N ratio simultaneously reduces the effect of noise and optimizes the response [33,34].
In this study, Taguchi’s orthogonal array was employed to ensure the optimum EP process for the three main parameters: applied voltage, ethanol concentration, and machining gap. In the EP process, lower values of surface roughness are preferable for maintaining a high polish quality; therefore, the smaller-the-better ratio was selected, which can be calculated as follows (Equation (1)):
The for the smaller-the-better ratio is calculated using the following equation [31]:
where is the observations of quality characteristics under different noises, and is the number of experiments.
2.1. Material and Methods
Pure titanium (99.5%) and 316L stainless steel (SS 316L) sheets (Nilaco Corp., Tokyo, Japan), with a size of 150 70 0.2 mm, were used as a workpiece (anode) and tool electrode (cathode), respectively. Table 1, Table 2 and Table 3 present the mechanical properties of pure titanium and SS 316L and the chemical properties of SS 316L, respectively. A DC power supply (GPS-3030D, GWInstek, New Taipei, Taiwan) was used to deliver the applied voltage and current at a maximum rating of 30 V and 3 A, respectively. For the electrolyte solution, NaCl powder (Merck) was dissolved in ethylene glycol (Merck & Co., Inc., Kenilworth, NJ, United States) to form a 1 M electrolyte solution. In addition, ethanol (Merck & Co., Inc., New Jersey, United States) was introduced to the electrolyte solution at different concentrations. Commercial polyethersulfone (PES) membranes with a molecular weight cut-off of 10 kDa were used as a separation membrane for the in vitro test. A digital microscope (AM4515T, Dino-lite, New Taipei, Taiwan) at a magnification rate of 500×–550× was used to capture the surface textures of the sidewall of the microfluidic channel. The machined surface was measured using a Surfcom 120A stylus profilometer that has a 5 µm stylus tip radius. The parameters used in the measurement for the stylus technique were: a cut-off wavelength of 0.80 mm, a measurement length of 1.5 mm, and a vertical and horizontal magnification of 5000 and 50, respectively. The surface quality characteristics, arithmetic average (), and peak to valley depth () [29,35] were examined with reference to the contribution of the machining parameters. Each experiment was repeated three times to ensure valid results, and the surface roughness value was acquired from the average of three measurement readings.

Table 1.
Mechanical properties of pure titanium.
Table 2.
Mechanical properties of SS 316L.
Table 3.
Chemical properties of SS 316L.
The fabrication of the microfluidic channel was divided into two steps. First, we prepared the design of the microfluidic channels (Figure 1a) and rough-machined them using a wire EDM machine (Figure 1b). In the second step, we finished the machining of the microfluidic channels, utilizing the EP process with different combinations of machining parameters.
Figure 2 illustrates a schematic diagram of the experimental setup. A titanium sheet as a workpiece was placed in between SS 316L sheets. Experiments were conducted under an electrolyte solution, and the machining process was fixed to 5 min. Based on the preliminary experiments, a machining time of 5 min was enough to fully polish the titanium microchannel.
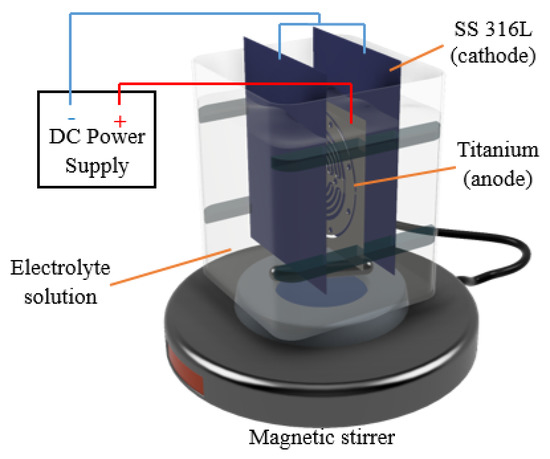
Figure 2.
Experimental setup for the EP process.
Prior to the EP process, the microchannel on the titanium was fabricated by means of the wire EDM machine. By utilizing the machining parameters given in Table 4, the surface roughness () of the microchannel produced was 1.46 µm.
Table 4.
Machining parameters (wire EDM).
2.2. Configuration of Experimental Factors and Their Levels
The optimal polishing process parameters for fabricating a microchannel on a titanium sheet were determined using the Taguchi method. The three main factors were: applied voltage, machining gap, and concentrations of ethanol in the electrolyte solution, which were selected in this study and designated as factors A, B, and C for the process parameters. The factors and their levels are specified in Table 5.
Table 5.
Factors and levels of the EP machining parameters.
In this research, the appropriate levels for each factor were configured to cover a range of interests. The levels of the factors for the experiments were determined based on the preliminary study results. An L9 orthogonal array was selected to conduct the matrix experiment for the three-level factors of EP process, as presented in Table 6.
Table 6.
Configuration of EP machining parameters.
Applied voltage is considered a qualitative parameter, and it has three levels: 15, 20, and 25 V. The concentration of ethanol in the electrolyte solution consisted of three levels, with 15 vol.% as the first level, 20 vol.% as the second, and 25 vol.% as the third. For the machining gap, which is the distance between the cathode and anode, the first, second, and third levels were a machining gap of 15, 20, and 25 mm, respectively.
2.3. Pareto ANOVA
This study utilized the Pareto analysis of variance (ANOVA), which is a simplified ANOVA method, to analyze the results of the parameter design. This analysis method does not require an ANOVA table and does not use an F-test. It is a quick and easy method by which to analyze the results of the parameter design. The Pareto ANOVA technique of analysis is suitable for engineers and industrial practitioners.
3. Results and Discussion
Table 7 summarizes the results of surface roughness from three repetitions and the S/N ratio of each L9 orthogonal array after the matrix of nine experiments had been executed. Figure 3 shows the surface textures of the microfluidic channel sidewall that were electropolished using nine different machining combinations of the EP process. The average S/N ratio level for each factor, as shown in Table 8, can be obtained by the numerical values listed in Table 7. The average S/N ratio for each level and the separate effects of each factor, commonly called main effects, are shown as a graph in Figure 4.
Table 7.
Surface roughness and S/N ratio.
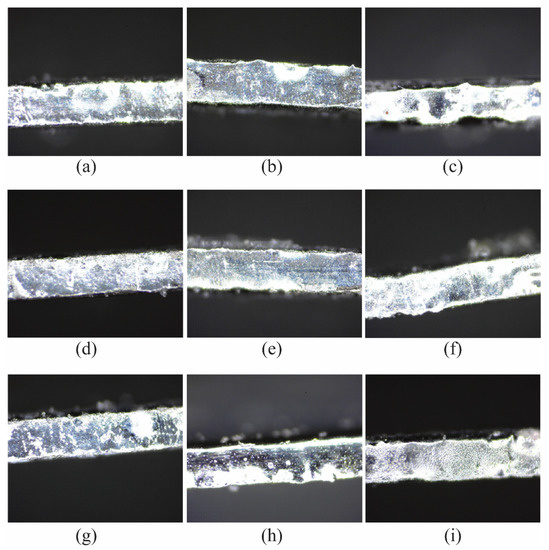
Figure 3.
Surface texture of the sidewall of the microfluidic channel EP process with (a) 15 V, 15 vol.%, 10 mm; (b) 15 V, 20 vol.%, 20 mm; (c) 15 V, 25 vol.%, 30 mm; (d) 20 V, 15 vol.%, 20 mm; (e) 20 V, 20 vol.%, 30 mm; (f) 20 V, 25 vol.%, 10 mm; (g) 25 V, 15 vol.%, 30 mm; (h) 25 V, 20 vol.%, 10 mm; (i) 25 V, 25 vol.%, 20 mm.
Table 8.
Average S/N ratio by factor levels (dB).
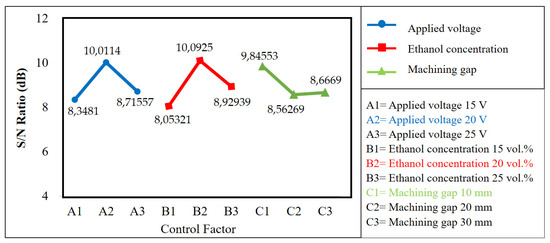
Figure 4.
The optimal levels based on the results of surface roughness produced by EP.
The average S/N ratio of the levels (1, 2, and 3) for each factor (A, B, and C), as shown in Table 8 and Figure 4, was obtained based on the calculation below:
Average S/N ratio A1:
Similarly, through were calculated using the values in Table 7.
3.1. Combination of Optimal Levels for Each Factor and Verification Test
The aim of this study is to reduce surface roughness by determining the optimal level for each factor, which can be determined by the level that has the highest S/N ratio value. Figure 4 shows that the optimum combination of each factor is A2B2C1. This means that the optimal levels are A2 (applied voltage of 20 V), B2 (ethanol concentration of 20 vol.%), and C1 (machining gap of 10 mm). The three values permit a significant effect on improving the surface quality.
Figure 5 shows the result of the Pareto ANOVA for the surface roughness of the EP process.
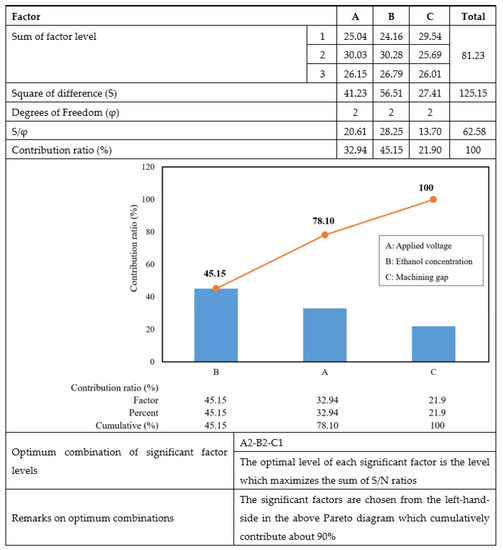
Figure 5.
Pareto ANOVA analysis for surface roughness produced by EP.
The sum of factors A, B, and C for levels 1, 2, and 3, as presented in Figure 5, was acquired from the calculation below:
Sum of factor level A1:
Similarly, A2 through C3 are also the summation of the respective S/N ratios in Table 7.
In the Pareto ANOVA analysis, the significant factors are chosen from the left-hand side diagram, and the summation value should exceed 90%. However, the sum of the first and second factors, which were ethanol concentration and applied voltage, respectively, was only 78.1%. Consequently, it was necessary to consider the last factor, the machining gap, as a significant machining parameter in the EP process. Thus, the machining conditions were set as: applied voltage at 20 V, ethanol concentration of 20 vol.%, and machining gap of 10 mm.
Verification experiments were conducted to determine the repeatability of the utilization of the optimal combination of machining parameters. Using the optimum machining parameters to fabricate microfluidic channels (Table 9), the average surface roughness value obtained was 0.22 , the lowest amongst the results presented in Table 7. It could then be determined that the combination of the levels for each factor is valid and arranged as the optimal machining parameters for EP in fabricating microchannels on titanium sheets. By utilizing the optimum parameters in EP, the surface roughness of microfluidic channels was improved by up to 85% compared to that produced by the wire EDM machine. Figure 6 summarizes the surface roughness produced by wire EDM and EP with different machining parameters.
Table 9.
Optimal conditions for the EP process.
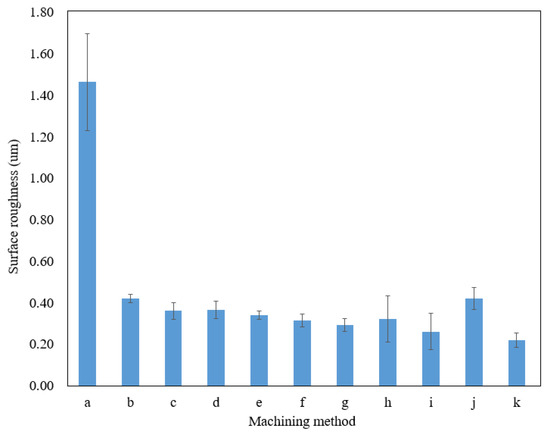
Figure 6.
The surface roughness of the sidewall on a microfluidic channel of different machining methods and parameters. (a) Wire EDM; (b) 15 V, 15 vol.%, 10 mm; (c) 15 V, 20 vol.%, 20 mm; (d) 15 V, 25 vol.%, 30 mm; (e) 20 V, 15 vol.%, 20 mm; (f) 20 V, 20 vol.%, 30 mm; (g) 20 V, 25 vol.%, 10 mm; (h) 25 V, 15 vol.%, 30 mm; (i) 25 V, 20 vol.%, 10 mm; (j) 25 V, 25 vol.%, 20 mm; (k) 20 V, 20 vol.%, 10 mm (optimum parameters).
Apart from the measurement of the average parameter (Ra), the average maximum height of the profile (Rz) of the sidewall surface was also measured. Figure 7 presents the Rz value of the sidewall surface. As presented in Figure 7, the optimum parameter of EP provides the lowest Rz value compared to the other machining parameters. The average value of the peak-to-valley height on the surface machined by EP at optimum parameters was decreased up to 83% compared to the surface machined by wire EDM.
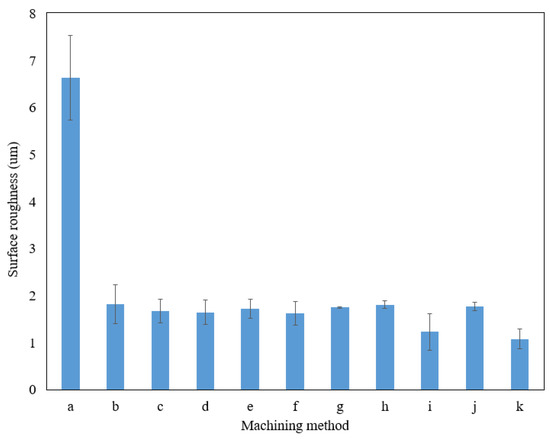
Figure 7.
Rz value of the sidewall on a microfluidic channel of different machining methods and parameters. (a) Wire EDM; (b) 15 V, 15 vol.%, 10 mm; (c) 15 V, 20 vol.%, 20 mm; (d) 15 V, 25 vol.%, 30 mm; (e) 20 V, 15 vol.%, 20 mm; (f) 20 V, 20 vol.%, 30 mm; (g) 20 V, 25 vol.%, 10 mm; (h) 25 V, 15 vol.%, 30 mm; (i) 25 V, 20 vol.%, 10 mm; (j) 25 V, 25 vol.%, 20 mm; (k) 20 V, 20 vol.%, 10 mm (optimum parameters).
3.2. Effect of Ethanol Concentration on Surface Roughness
Figure 5 shows that the concentration of ethanol in the ethylene glycol-NaCl solution is a significant factor (45.15%) in improving surface quality. During the EP of titanium, when utilizing ethylene glycol-NaCl without the presence of an electrolyte solution, the process generated titanium oxide, resulting in poor surface roughness and color changing on the surface [36]. According to Equation (2), during the EP process, Ti4+ ions react with Cl− to create titanium tetrachloride (TiCl4) in the electrolyte solution [37].
Ti4+ + 4Cl 🡪 TiCl4
TiCl4 comes in the form of a sticky yellow liquid attached to the titanium surface. It is difficult to remove and dissolve in high-viscosity ethylene glycol. Therefore, the introduction of ethanol decreases the viscosity of the electrolyte solution. On the other hand, the polarity of ethanol is lower than that of the ethylene glycol molecules that benefit from removing the deposited TiCl4 from the titanium surface. However, a high concentration of ethanol in the electrolyte solution entirely removes the TiCl4 layer, leading to dissolution reactions on the surface, resulting in a poor surface finish [38]. This result is in accordance with Wang et al.’s finding [27], where TiCl4 (99%) in ethylene glycol induced a major change in the anodic dissolution reaction of titanium by converting a bright fine-finish surface into a dimple pattern surface.
3.3. Effect of Applied Voltage on Surface Roughness
Figure 5 shows that the applied voltage is a significant factor (35.95%) in improving surface quality. In the EP process, as shown in Figure 8, the etching reaction initially started at a low voltage (A to B area); as the voltage and current density linearly increased, the pitting reactions (range D to E) were activated. The region between points C to D is the area where the EP occurred and where the current density was relatively stable even when the voltage increased; therefore, the region at points C to D (20 V) is the optimal applied voltage for the EP process. In region D to E (above 20 V), higher voltages will further increase the current density. As a result, it produces a defect on the titanium surface. Therefore, in order to achieve low surface roughness, EP should be performed in the region at points C to D [39].
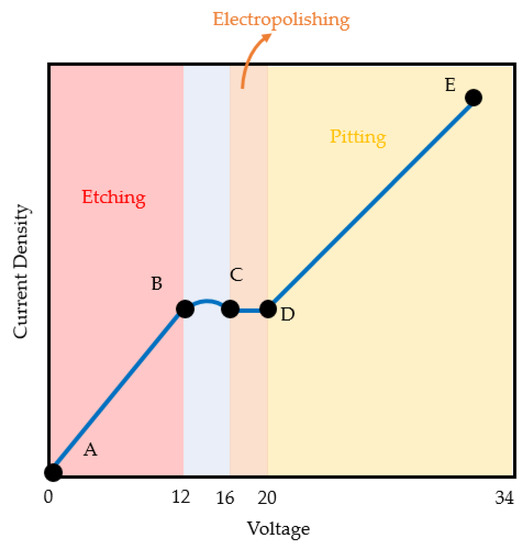
Figure 8.
Polarization curve of current density and voltage in the EP process.
3.4. Effect of Machining Gap on Surface Roughness
From Figure 5, it can be seen that the machining gap is the least significant factor (21.9%) in improving the surface quality of titanium. In general, surface quality improves as the machining gap becomes smaller. However, this statement also depends on the applied density of the current. At a high current density, narrowing the machining gap will create an electro-discharge mark on the surface. However, at low current density, widening the machining gap will induce a melting–fusion process during EP and further generate bumps on the workpiece surface [40]. A suitable machining gap must be carefully chosen when running EP on titanium.
3.5. Microfluidic Fouling Experiments
For the fouling experiment, a microfluidic device (Figure 9a) was assembled from one sheet of commercial PES membrane and clamped between two sheets of a titanium layer, as illustrated in Figure 9b. Polydimethylsiloxane (PDMS) layers and acrylic plates were used as a sealer and cover for the microfluidic device. The microfluidic channel of titanium layers for this fouling experiment was fabricated using wire EDM and EP. For the EP, the optimum parameters that were validated in the verification experiments were used to polish the microchannel. A micropump was used to introduce bovine blood into the microfluidic channel. The fouling experiments were conducted for 7 days.
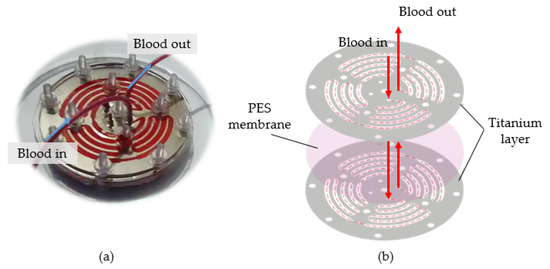
Figure 9.
Fouling experiment. (a) Microfluidic channel; (b) structure of the microfluidic channel.
Figure 10 shows the surface of the microfluidic channel before and after the fouling experiments using wire EDM and EP. As can be seen from Figure 10b, a bloodstain appeared on the microfluidic surface machined by wire EDM. In contrast, the surface of the microfluidic channel processed by EP using the optimum machining parameters showed a bloodstain-free appearance. The microscale structures and topological surfaces influence the adhesion behaviors of cells and platelets [41]. Thus, surface roughness plays a significant role in determining the biological environment response to unknown material [42]. In addition, discharge energy in the wire EDM process caused a rough surface and porous structure on the microfluidic channel that allowed the establishment of contact of the blood, resulting in a bloodstain on the surface [43,44].
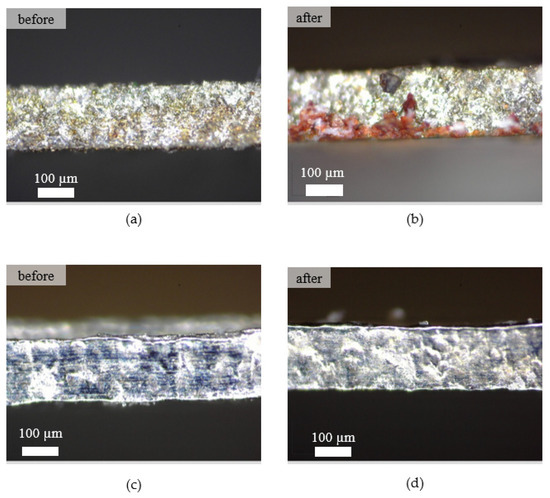
Figure 10.
Surface texture of the machined surface. (a) Wire EDM before the fouling experiment, (b) wire EDM after the fouling experiment, (c) EP before the fouling experiment, (d) EP after the fouling experiment.
4. Conclusions
The EP of a microfluidic channel on a titanium sheet has been systematically investigated. The Taguchi method was applied on an L9 orthogonal array, in which nine experiments were conducted at different combinations of machining parameters. The S/N ratio of the quality characteristics of arithmetic average roughness (Ra) was analyzed using the ‘smaller-the-better’ criteria. The optimum polishing parameter level that correlates with the level of the maximum S/N ratio was determined. The following conclusions from the experimental work are drawn:
- Through the Pareto ANOVA and from the percentages of the contribution of the microfluidic channel produced to surface roughness, the ethanol concentration in the electrolyte solution was proved to be the most significant EP process parameter, followed by applied voltage and machining gap.
- The optimum factor level combinations by which to achieve high surface quality of the microfluidic channel were an applied voltage of 20 V, the addition of ethanol at a concentration of 20 vol.%, and a machining gap of 10 mm.
- Utilizing the optimum factor level combinations for the verification test, the percentage improvement of surface roughness of the microfluidic channel was 85%.
- In vitro experiments confirmed that surface machined by the optimum machining parameters significantly lessened the biofouling on the sidewall of the microfluidic channel.
Author Contributions
Conceptualization, G.S.P., M.M., and M.A.S.; methodology, G.S.P., M.M., and M.A.S.; validation, M.M., M.A.S., and G.S.P.; formal analysis, M.A.S.; investigation, M.A.S. and M.M.; resources, M.A.S. and M.M.; data curation, M.A.S.; writing—original draft preparation, G.S.P. and M.A.S.; writing—review and editing, G.S.P., M.M., T.S., and N.M.; visualization, G.S.P., T.S., and M.A.S.; supervision, G.S.P., M.M., and N.M.; project administration, M.A.S. and G.S.P.; funding acquisition, G.S.P., M.M., and N.M. All authors have read and agreed to the published version of the manuscript.
Funding
The authors disclosed receipt of the following financial support for the research, authorship, and/or publication of this article: This work was partially supported by Gadjah Mada University, Ministry of Education and Culture, Republic of Indonesia and the APC was funded by Hibah Riset Mandat Kolaborasi Mitra Luar Negeri, Airlangga University (Grant NO: 789/UN3.15/PT/2021).
Institutional Review Board Statement
Not applicable.
Informed Consent Statement
Not applicable.
Data Availability Statement
Not applicable.
Conflicts of Interest
The authors declare no conflict of interest.
References
- McGeough, J.A. Principles of Electrochemical Machining; CRC Press: Boca Raton, FL, USA, 1974. [Google Scholar]
- Jeykrishnan, J.; Ramnath, B.V.; Elanchezhian, C.; Akilesh, S. Parametric analysis on Electro-chemical machining of SKD-12 tool steel. Mater. Today Proc. 2017, 4, 3760–3766. [Google Scholar] [CrossRef]
- Prihandana, G.S.; Mahardika, M.; Nishinaka, Y.; Ito, H.; Kanno, Y.; Miki, N. Electropolishing of Microchannels and its Application to Dialysis System. Procedia CIRP 2013, 5, 164–168. [Google Scholar] [CrossRef][Green Version]
- Rajurkar, K.P.; Sundaram, M.M.; Malshe, A.P. Review of electrochemical and electrodischarge machining. Procedia CIRP 2013, 6, 13–26. [Google Scholar] [CrossRef]
- Prihandana, G.S.; Mahardika, M.; Sar, S.; Hamdi, M.; Wong, Y.S.; Mitsui, K. Workpiece vibration aided nano-graphite powder suspended dielectric fluid in micro-electrical discharge machining (μ-EDM) processes. In Proceedings of the 5th International Conference on Leading Edge Manufacturing in 21st Century, LEM 2009, Osaka, Japan, 2–4 December 2009. [Google Scholar]
- Sar, S.; Prihandana, G.S.; Mahardika, M.; Hamdi, M.; Mitsui, K. Simple model of micro-electrical discharge machining. In Proceedings of the 5th International Conference on Leading Edge Manufacturing in 21st Century, LEM 2009, Osaka, Japan, 2–4 December 2009. [Google Scholar]
- Joshi, S.S.; Marla, D. Electrochemical Micromachining; Elsevier: Amsterdam, The Netherlands, 2014. [Google Scholar]
- Khundrakpam, N.; Brar, G.S.; Devi, M.B. Optimizing the process parameters of ECM using Taguchi method. Mater. Today Proc. 2020, 26, 1373–1379. [Google Scholar] [CrossRef]
- Setyawan, M.A.; Mahardika, M.; Sriani, T.; Prihandana, G.F.; Miki, N. Precision Electropolishing on Fabricating SS 316L Microchannel—A Taguchi Approach. Int. J. Eng. Appl. 2021, 9, 209–216. [Google Scholar] [CrossRef]
- Shimakura, M. Efficient polishing method of titanium. Soc. Titan. Alloy. Dent. 2007, 5, 32. [Google Scholar]
- Cai, C.; Zhao, X.; Yang, L.; Wang, R.; Qin, Q.; Chenc, D.; Zhang, E. A novel biomedical titanium alloy with high antibacterial property and low elastic modulus. J. Mater. Sci. Technol. 2021, 81, 13–25. [Google Scholar] [CrossRef]
- Klocke, F.; Zeis, M.; Klink, A.; Veselovac, D. Technological and economical comparison of roughing strategies via milling, sinking-EDM, wire-EDM and ECM for titanium- and nickel-based blisks. CIRP J. Manuf. Sci. Technol. 2013, 6, 198–203. [Google Scholar] [CrossRef]
- Zahiruddin, M.; Kunieda, M. Comparison of energy and removal efficiencies between micro and macro EDM. CIRP Ann. Manuf. Technol. 2012, 61, 187–190. [Google Scholar] [CrossRef]
- Khosrozadeh, B.; Shabgard, M. Effects of hybrid electrical discharge machining processes on surface integrity and residual stresses of Ti-6Al-4V titanium alloy. Int. J. Adv. Manuf. Technol. 2017, 93, 1999–2011. [Google Scholar] [CrossRef]
- Chalisgaonkar, R.; Kumar, J.; Pant, P. Prediction of machining characteristics of finish cut WEDM process for pure titanium using feed forward back propagation neural network. Mater. Today Proc. 2020, 25, 592–601. [Google Scholar] [CrossRef]
- Mitchell-Smith, J.; Speidel, A.; Clare, A.T. Advancing electrochemical jet methods through manipulation of the angle of address. J. Mater. Process. Technol. 2018, 255, 364–372. [Google Scholar] [CrossRef]
- Zou, H.; Yue, X.; Luo, H.; Liu, B.; Zhang, S. Electrochemical micromachining of micro hole using micro drill with non-conductive mask on the machined surface. J. Manuf. Process. 2020, 59, 366–377. [Google Scholar] [CrossRef]
- Zhan, S.; Zhao, Y. Intentionally-induced dynamic gas film enhances the precision of electrochemical micromachining. J. Mater. Process. Technol. 2021, 291, 117049. [Google Scholar] [CrossRef]
- Sharma, V.; Patel, D.S.; Agrawal, V.; Jain, V.K.; Ramkumar, J. Investigations into machining accuracy and quality in wire electrochemical micromachining under sinusoidal and triangular voltage pulse condition. J. Manuf. Process. 2021, 62, 348–367. [Google Scholar] [CrossRef]
- Bi, X.; Zeng, Y.; Qu, N. Wire electrochemical micromachining of high-quality pure-nickel microstructures focusing on different machining indicators. Precis. Eng. 2020, 61, 14–22. [Google Scholar] [CrossRef]
- Lee, E.S.; Shin, T.H. An evaluation of the machinability of nitinol shape memory alloy by electrochemical polishing. J. Mech. Sci. Technol. 2011, 25, 963–969. [Google Scholar] [CrossRef]
- Mwangi, J.M.; Nguyen, L.T.; Bui, V.D.; Berger, T.; Zeidler, H.; Schubert, A. Nitinol manufacturing and micromachining: A review of processes and their suitability in processing medical-grade nitinol. J. Manuf. Process. 2019, 38, 355–369. [Google Scholar] [CrossRef]
- Anasane, S.; Bhattacharyya, B. Experimental investigation on suitability of electrolytes for electrochemical micromachining of titanium. Int. J. Adv. Manuf. Technol. 2016, 86, 2147–2160. [Google Scholar] [CrossRef]
- Deng, T.; Zhu, Z.; Li, X.; Ma, T.; Wang, Q. Experimental study on electrochemical etching for titanium printed circuit heat exchanger channels. J. Mater. Process. Technol. 2020, 282, 116669. [Google Scholar] [CrossRef]
- Liu, W.; Zhang, H.; Luo, Z.; Zhao, C.; Ao, S.; Gao, F.; Sun, Y. Electrochemical micromachining on titanium using the NaCl-containing ethylene glycol electrolyte. J. Mater. Process. Technol. 2018, 255, 784–794. [Google Scholar] [CrossRef]
- Ao, S.; Li, K.; Liu, W.; Qin, X.; Wang, T.; Dai, Y.; Luo, A. Electrochemical micromachining of NiTi shape memory alloy with ethylene glycol–NaCl electrolyte containing ethanol. J. Manuf. Process. 2020, 53, 223–228. [Google Scholar] [CrossRef]
- Wang, J.; Torres-Sanchez, C.; Borgman, J.M.; Zani, L.; Conway, P.P. Template-free, microscale dimple patterning of pure titanium surface through anodic dissolution using non-aqueous ethylene glycol-TiCl4 electrolytes. Surf. Coat. Technol. 2020, 404, 126555. [Google Scholar] [CrossRef]
- To, N.; Sanada, I.; Ito, H.; Prihandana, G.S.; Morita, S.; Kanno, Y.; Miki, N. Water-Permeable Dialysis Membranes for Multi-Layered Microdialysis System. Front. Bioeng. Biotechnol. 2015, 3, 70. [Google Scholar] [CrossRef]
- Sheshadri, R.; Nagaraj, M.; Lakshmikanthan, A.; Chandrashekarappa, M.P.G.; Pimenov, D.Y.; Giasin, K.; Prasad, R.V.S.; Wojciechowski, S. Experimental investigation of selective laser melting parameters for higher surface quality and microhardness properties: Taguchi and super ranking concept approaches. J. Mater. Res. Technol. 2021, 14, 2586–2600. [Google Scholar] [CrossRef]
- Kishore Kumar, M.S.; Gurudatt, B.; Reddappa, H.N.; Suresh, R. Parametric Optimization of Cutting Parameters for Micro-Machining of Titanium Grade-12 Alloy Using Statistical Techniques. Int. J. Lightweight Mater. Manuf. 2022, 5, 74–83. [Google Scholar]
- Verma, V.; Sahu, R. Process parameter optimization of die-sinking EDM on Titanium grade—V alloy (Ti6Al4V) using full factorial design approach. Mater. Today Proc. 2017, 4, 1893–1899. [Google Scholar] [CrossRef]
- Koyee, R.D.; Eisseler, R.; Schmauder, S. Application of Taguchi coupled Fuzzy Multi Attribute Decision Making (FMADM) for optimizing surface quality in turning austenitic and duplex stainless steels. Measurement 2014, 58, 375–386. [Google Scholar] [CrossRef]
- Selvaraj, D.P.; Chandramohan, P.; Mohanraj, M. Optimization of surface roughness, cutting force and tool wear of nitrogen alloyed duplex stainless steel in a dry turning process using Taguchi method. Measurement 2014, 49, 205–215. [Google Scholar] [CrossRef]
- Tajima, K.; Hironaka, M.; Chen, K.; Nagamatsu, Y.; Kakagawa, H.; Kozono, Y. Electropolishing of CP titanium and its alloys in an alcoholic solution-based electrolyte. Dent. Mater. J. 2008, 27, 258–265. [Google Scholar] [CrossRef]
- Said, M.; Eng, C.W.; Hixon, A.E.; Marks, N.E. Quantifying surface roughness on UO2 fuel pellets using optical techniques. Forensic Sci. Int. 2020, 316, 110470. [Google Scholar] [CrossRef]
- Kumar, S.P.L. Experimental investigations and empirical modeling for optimization of surface roughness and machining time parameters in micro end milling using Genetic Algorithm. Measurement 2018, 124, 386–394. [Google Scholar] [CrossRef]
- Godlewska, E.; Mitoraj, M.; Leszczynska, K. Hot corrosion of Ti-6Al-8Ta (at. %) intermetallic alloy. Corros. Sci. 2014, 78, 63–70. [Google Scholar] [CrossRef]
- Yuzhakov, V.V.; Chang, H.; Miller, A.E. Pattern formation during electropolishing. Phys. Rev. B 1997, 56, 12608–12624. [Google Scholar] [CrossRef]
- Kim, D.; Son, K.; Sung, D.; Kim, Y.; Chung, W. Effect of added ethanol in ethylene glycol-NaCl electrolyte on titanium Electropolishing. Corros. Sci. 2015, 98, 494–499. [Google Scholar] [CrossRef]
- Lee, E.-S. Machining Characteristics of the Electropolishing of Stainless Steel (STS316L). Int. J. Adv. Manuf. Technol. 2000, 16, 591–599. [Google Scholar] [CrossRef]
- Milner, K.R.; Snyder, A.J.; Siedlecki, C.A. Sub-micron texturing for reducing platelet adhesion to polyurethane biomaterials. J. Biomed. Mater. Res. A 2006, 76, 561–570. [Google Scholar] [CrossRef] [PubMed]
- Xu, L.-C.; Bauer, J.W.; Siedlecki, C.A. Proteins, platelets, and blood coagulation at biomaterial interfaces. Colloids Surf B Biointerfaces 2014, 124, 49–68. [Google Scholar] [CrossRef] [PubMed]
- Strnad, J.; Strnad, Z.; Šestak, J.; Urban, K.; Povýšil, C. Bio-activated titanium surface utilizable for mimetic bone implantation in dentistry—Part III: Surface characteristics and bone-implant contact formation. J. Phys. Chem. Solids 2007, 68, 841–845. [Google Scholar] [CrossRef]
- Eliasa, C.N.; Oshidab, Y.; Henrique, J.; Limad, C.; Muller, C.A. Relationship between surface properties (roughness, wettability and morphology) of titanium and dental implant removal torque. J. Mech. Behav. Biomed. Mater. 2008, 1, 234–242. [Google Scholar] [CrossRef] [PubMed]


Publisher’s Note: MDPI stays neutral with regard to jurisdictional claims in published maps and institutional affiliations. |
© 2021 by the authors. Licensee MDPI, Basel, Switzerland. This article is an open access article distributed under the terms and conditions of the Creative Commons Attribution (CC BY) license (https://creativecommons.org/licenses/by/4.0/).