Abstract
To reduce cavitation-induced pressure fluctuations in a mixed-flow pump under impeller inflow distortion, the dynamic pressure signal at different monitoring points of a mixed-flow pump with a dustpan-shaped inlet conduit under normal and critical cavitation conditions was collected using high-precision digital pressure sensors. Firstly, the nonuniformity of the impeller inflow caused by inlet conduit shape was characterized by the time–frequency-domain spectra and statistical characteristics of pressure fluctuation at four monitoring points (P4–P7) circumferentially distributed at the outlet of the inlet conduit. Then, the cavity distribution on the blade surface was captured by a stroboscope. Lastly, the characteristics of cavitation-induced pressure fluctuation were obtained by analyzing the time–frequency-domain spectra and statistical characteristic values of dynamic pressure signals at the impeller inlet (P1), guide vanes inlet (P2), and guide vanes outlet (P3). The results show that the flow distribution of impeller inflow is asymmetric. The pav values at P4 and P6 were the smallest and largest, respectively. Compared with normal conditions, the impeller inlet pressure is lower under critical cavitation conditions, which leads to low pav, and a main frequency amplitude at P1. In addition, the cavity covered the whole suction side under H = 13.6 m and 15.5 m, which led the and dominant frequency amplitude of pressure fluctuation at P2 and P3 under critical cavitation to be higher than that under normal conditions.
1. Introduction
A mixed-flow pump has the characteristics of large flow rate, high efficiency, and moderate head; hence, it is widely used in agricultural irrigation, regional water transfer, and drainage [1,2,3]. In practical engineering, inlet conduits matched with mixed-flow pumps are mainly divided into the elbow type, bell type, and dustpan type. Compared with bell-shaped and elbow-shaped inlet conduits, dustpan-shaped inlet conduits can ensure the flow pattern of impeller inflow under low excavation depth [4,5] (which can reduce civil costs); therefore, its application is becoming more and more extensive. However, cavitation-induced pressure fluctuation has always restricted improvement in the operation stability of mixed-flow pumps [6,7,8]. In addition, the particularity of the dustpan-shaped inlet conduit could cause impeller inflow distortion, which would further strengthen the cavitation-induced pressure fluctuation of mixed flow pump. Therefore, the cavitation performance is one of the key indicators in the design of a mixed-flow pump with a dustpan-type inlet conduit.
Cavitation-induced pressure fluctuation has always been a hot research issue in the field of pumps. Sun et al. [9] used the CFD method to investigate the cavitation–vortex–pressure fluctuation interaction, and they found that the distribution of pressure fluctuation intensity changes with the cavitation development and the cavitation–vortex–pressure fluctuation interaction. Kim [10] used an accelerometer to study the cavitation instability of a cryogenic pump in water and liquid oxygen environments. The results showed that the critical cavitation number in the water environment was higher at a large flow rate. Meng et al. [11] numerically analyzed the effect of the impeller–tongue interaction on transient cavitation flow. The periodic fluctuation of the cavity structure was mainly due to the backflow resulting from the impeller–tongue interaction. In the research field of an axial-flow pump, Zhang [12] found that the cavity was located on the suction side in a slanted axial-flow pump, and that the cavity shedding had a great influence on hydraulic performance, according to a numerical simulation and visual experiments. Liu. et al. [13] numerically compared the transient flow characteristics of axial-flow multiphase pumps under normal and cavitation conditions. The pressure fluctuation amplitude and transient radial force of the impeller were intensified by cavitation instability. Shen [14] explored the cavitation structure caused by tip leakage flow in an axial-flow pump, and the distribution of the cavity area fraction and axial velocity fraction profiles at different cavitation numbers and flow rates were obtained. In the field of cavitation fault diagnosis, many studies have proven that the degree of cavitation inside a pump can be detected by extracting the statistical features of the motor current signal [15,16], suction pressure signal [17], and noise signal [18].
To date, most studies on the cavitation inside pumps was based on uniform impeller inflow. Since the backflow phenomenon is prone to occur near the suction side of high-specific-speed impeller [19,20] due to the strong centrifugal force effect on internal fluid. Distorted inflow could promote the development of backflow vortices [21] and, thus, lead to a decrease in hydraulic performance and an increase in flow-induced force fluctuation [22]. Furthermore, impeller inflow distortion could cause the cavity near the suction side to show a non-axisymmetric pattern (asymmetric cavitation) [23], which would aggravate the cavitation instability. In large vertical pump stations, the shape of the inlet conduit usually has a significant effect on the uniformity of the impeller inflow [24]. However, there are only a few studies on cavitation-induced pressure fluctuation under distorted inflow caused by an inlet condui in the pumps. Li [25] experimentally studied the cavitation-induced pressure fluctuation inside an axial-flow pump under different cavitation states and distorted inflow caused by an elbow inlet conduit. The frequency domain results of pressure fluctuation based on Fourier transform have shown that the main frequency amplitude at the guide vane outlet increases with the increase of net positive suction head (NPSH).
In this study, the high-precision digital pressure sensor was applied to investigate the cavitation-induced pressure fluctuation of a mixed-flow pump under distorted impeller inflow caused by a dustpan-type inlet conduit. The main parameters of the pump are described in Section 2. The test bench and experimental method are introduced in Section 3. All measurement results are presented in Section 4. Firstly, the performance characteristics curves and critical net positive suction head (NPSHc) value of the mixed-flow pump are described. Then, the pressure fluctuation at the outlet of the inlet conduit was obtained to analyze the distorted inflow characteristics. Lastly, a comparison of the dynamic state characteristics of pressure fluctuation at the impeller inlet, the guide vanes inlet, and the guide vanes outlet was obtained under critical cavitation and normal conditions.
2. Research Model
2.1. Main Parameters of Mixed-Flow Pump
The research model was a vertical mixed-flow pump consisting of a dustpan-type inlet conduit, mixed-flow impeller, mixed-flow guide vanes, and elbow outlet conduit, as shown in Figure 1. The geometric parameters of the mixed-flow pump can be seen in Table 1. According to the engineering requirements, the performance of a mixed-flow pump can be characterized by three main operating points (maximum head point, design head point, and minimum head point); detailed information for the research model is shown in Table 2.
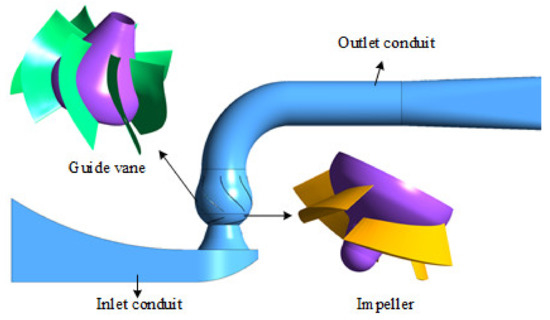
Figure 1.
Vertical mixed-flow pump with dustpan-type inlet conduit.

Table 1.
Geometric parameters of mixed-flow pump.
Table 2.
Engineering operating parameters of mixed-flow pump.
2.2. Test Bench and Experimental Instrument
In order to obtain the performance characteristics, critical cavitation values, and pressure fluctuation of the mixed-flow pump with a dustpan-type inflow conduit, a high-precision hydraulic machinery test bench was applied in this study. As shown in Figure 2, the test bench was segmented into upper and lower segments. The height of the upper segment was 4.6 m, and the vacuum pump, surge tank, vertical mixed-flow pump, pump motor, intelligent differential pressure sensor, and torque meter were located in this segment. The lower segment was −2.6 m high, and the electromagnetic flowmeter and auxiliary pump were located in this segment. The effective volume of the buck of water of the test bench was 120 m3. To reduce the interference of alternating current signal to the measurement system, the digital direct current speed regulating system was adopted. The models, measuring ranges, and measurement accuracies of the experimental instruments are shown in Table 3. The total measurement uncertainty of the test bench was mainly determined by the systematic uncertainty. In the mixed flow pump test bench, the systematic uncertainty generally refers to the measurement uncertainty of hydraulic efficiency.
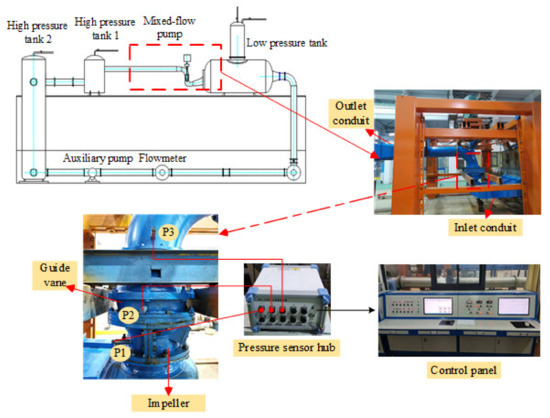
Figure 2.
Structure of the test bench.
Table 3.
The parameters of the main test instruments.
The hydraulic efficiency of the mixed-flow pump was calculated using Equations (1)–(3) [26,27]. Therefore, the measurement uncertainty of head EH, flow EQ and shaft power EP determine the efficiency measurement uncertainty.
where , , and are the shaft power, pump head, and pump efficiency, and are the rotation speed and torque, and are the outlet total pressure and inlet total pressure of the pump, is the mass flowrate, and g is the gravitational acceleration. is the liquid density.
According to Table 3, the measurement uncertainty of flow is 0.2%. The measurement uncertainty of head , torque and rotation speed are both 0.1%, and thus the shaft power measurement uncertainty is 0.14% by . Finally, the system uncertainty can be determined as by .
2.3. Experiment Method
The test bench used a computer acquisition and processing system to monitor the current signals of flow, differential pressure, torque, and rotation speed of the mixed-flow pump. The maximum sampling period and frequency can reach 10 s and 1000 Hz, respectively, and all acquisition results were the average value over one sampling period.
The evaluation indicator of the cavitation characteristics of the mixed-flow pump was net positive suction head (NPSH), which was calculated using Equation (4) [28,29]:
where is the average liquid velocity of the pressure-measuring section at the inlet of the mixed-flow pump, is the liquid vaporization pressure.
The cavitation test was mainly divided into three steps. Firstly, the performance characteristic parameters of the mixed-flow pump under normal working conditions were established. Then, the NPSH of the experiment system was gradually reduced by increasing the vacuum at the inlet of the pump, and the performance characteristic parameters under different NPSH conditions were recorded. During vacuum pumping, the rotation speed and flow rate of the pump were maintained stable. Finally, NPSH with a 3% head reduction was defined as NPSHc. When 1.5 NPSHc ≥ NPSH ≥ 1.1 NPSHc, the operating state of mixed-flow pump was defined as normal condition because the hydraulic performance remained stable from 1.5 NPSHc to 1.1 NPSHc. When 1.1 NPSHc > NPSH > NPSHc, the operating state of the mixed-flow pump was defined as a moderately developed cavitation state. When NPSH = NPSHc, the operating state of the mixed-flow pump was defined as critical cavitation state. When NPSH < NPSHc, the operating state of the mixed-flow pump was defined as cavitation state.
In order to obtain the distribution of cavities inside the impeller of the mixed-flow pump under normal and critical cavitation conditions, a transparent glass observation window was installed at the impeller shell. In addition, the stroboscope is a source of light emitted with controlled frequency. When the flashing frequency is the same as the rotating frequency of the impeller, the rotating impeller is in a static state in the observation window due to the visual persistence effect of the eyes. Therefore, a stroboscope and a high-definition camera were used to capture the cavitation bubble distribution inside the observation window, as shown in Figure 3.
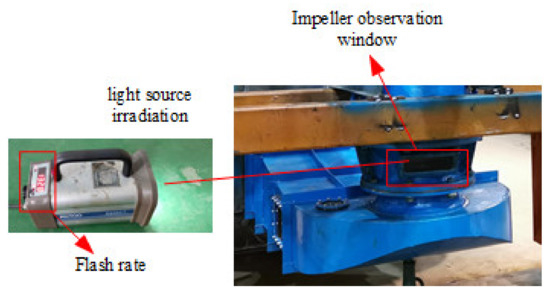
Figure 3.
The stroboscopic instrumentation used for visual observation of cavitation inside the impeller.
The dynamic state characteristics of the mixed-flow pump at different locations were measured using seven high-precision digital pressure sensors at the monitoring points shown in Figure 4. The digital pressure sensor can output a digital standard signal of relative pressure by detecting changes in resistance. The sampling time was 6 s, and the sampling frequency was 1000 Hz. In order to monitor the nonuniformity of the impeller inflow caused by dustpan-shaped inlet conduit, monitoring points P1, P2, P3, and P4 were evenly and circumferentially placed at the outlet of the inlet conduit. In addition, monitoring points P5, P6, and P7 were located at the impeller inlet, guide vanes inlet, and guide vanes outlet, respectively, so as to compare the pressure fluctuation of the mixed-flow pump under normal and critical cavitation conditions.
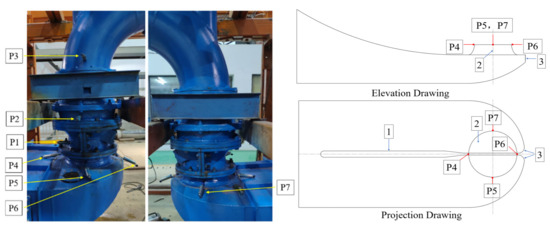
Figure 4.
Installation diagram of monitoring points: 1—partition; 2—suction tube cone; 3—Inlet elbow wall.
3. Results and Discussion
3.1. Hydraulic Performance and Critical Cavitation Values of Mixed-Flow Pump
The performance characteristics of the mixed-flow pump were obtained as shown in Figure 5. The design head operating point (H = 13.6 m) corresponded to the highest-efficiency operating point (), where the internal flow pattern was the most stable. The minimum head operating point (H = 5.6 m) was outside the high-efficiency area of the mixed-flow pump, where the internal flow pattern is unstable. The highest head operating point was located in the high-efficiency operating area of the mixed-flow pump, where the flow stability was intermediate between the designed head operating point and the lowest head operating point.
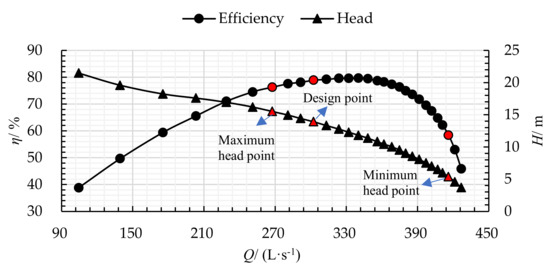
Figure 5.
Performance characteristic curves of mixed−flow pump.
Table 4 shows the NPSHC of the mixed-pump under different head conditions. The analysis in Figure 4 revealed that the design head point and the maximum head point were both within the high-efficiency operating range of the mixed-flow pump; hence, the NPSHC of these two points was low, with no obvious difference between them. However, the efficiency corresponding to the lowest head point was very low; thus, the NPSHC at this point was significantly higher than that at the highest and design head points.
Table 4.
Experimental data of NPSHc of mixed-flow pump.
3.2. Characteristics of Impeller Inflow Distortion
In order to analyze the nonuniformity of impeller inflow caused by the dustpan-shaped inlet conduit, four high-precision digital pressure sensors (P4, P5, P6, P7) were positioned uniformly and circumferentially at the outlet of the dustpan-type inlet conduit, as shown in Figure 3. In this study, the statistical characteristic values, time-domain spectra and time–frequency-domain spectra of relative pressure signal at the monitoring points were used as evaluation criteria to analyze the nonuniformity of impeller inflow in the mixed-flow pump.
The statistical characteristic values were calculated as follows:
where is the time-averaged value of relative pressure, and N is the data series length. is the peak-to-peak value of relative pressure. is the total number of cycles of pressure fluctuation in sampling time. and are the maximum and minimum relative pressure in the jth cycle, respectively.
Figure 6a and Figure 7a shows the time-domain spectra of relative pressure signal and at the four monitoring points under normal conditions. Under three characteristic head conditions, the pressure at the four monitoring points were all different, indicating that the velocity distribution at the outlet of the dustpan-shaped inlet conduit was non-axisymmetric. As the internal flow pattern tended to be turbulent with an increase in head, the pressure at each monitoring point increased with the increase in head. In addition, the cross-sectional area of the flow passage under the suction tube cone gradually decreased along the P4–P5–P6/P4–P7–P6 direction, resulting in a gradual increase in the internal fluid velocity and impact force. Therefore, the at P6 was highest, whereas the at P4 was lowest. Figure 6b and Figure 7b shows the time-domain spectrum of relative pressure and at the four monitoring points under critical cavitation conditions. As the inlet pressure of the mixed-flow pump under critical cavitation conditions was lower than that under normal conditions, the pressure at all four monitoring points was lower. The flow passage area under the suction tube cone was not affected by the cavity; therefore, the distribution of pav at the four monitoring points under critical cavitation conditions was the same as that under normal conditions. The pressure at the four monitoring points were different, and the at P6 and P4 were the highest and lowest.
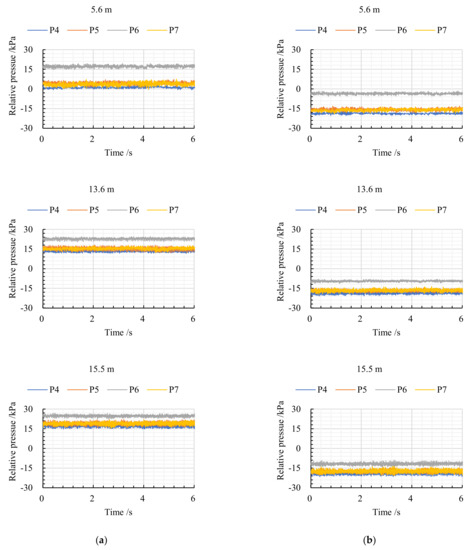
Figure 6.
The time−domain spectra of relative pressure signal at P4, P5, P6, and P7 under (a) normal condition and (b) critical cavitation condition.
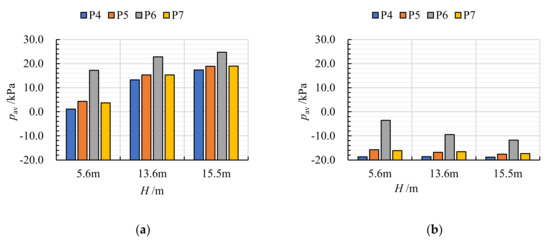
Figure 7.
The time−averaged value of relative pressure signal at P4, P5, P6, and P7 under (a) normal conditions, and (b) critical cavitation conditions.
Figure 8a shows the of relative pressure signal (used to characterize the intensity of pressure fluctuation) at the four monitoring points under normal conditions. The at the four monitoring points was mainly affected by the structure of the inlet flow conduit and the pre-rotation effect of the impeller. P4 and P6 were located above the partition and the inlet elbow wall, respectively, which could effectively stabilize the flow state and prevent the formation of vortices. Therefore, the values at P4 and P6 were lower than those at P5 and P7, under all flow rate. Figure 8b shows the of relative pressure at the four monitoring points under critical cavitation conditions. Because of this, the cavity could change the impeller passage, resulting in a stronger impeller pre-rotation effect. Therefore, the at P4, which was the most affected by the pre-rotation effect, had a significant upward trend under all flow rates. In addition, the change of the flow field structure causes the distribution of under critical cavitation condition to be different from that under normal condition. Under H = 5.6 m, at P5 and P6 are the highest and lowest, respectively. Under H = 13.6 m, at P6 and P7 are the lowest and highest, respectively. Under H = 15.5 m, at P5 and P7 are the lowest and highest, respectively.
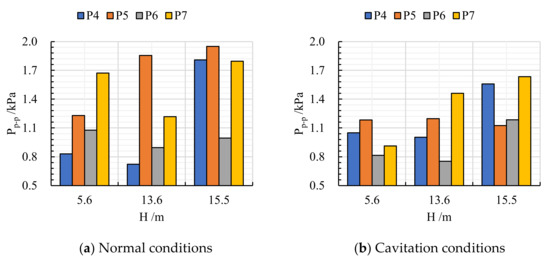
Figure 8.
The of relative pressure signal at P4, P5, P6, and P7 under (a) normal conditions, and (b) critical cavitation conditions.
The time–frequency-domain spectra of relative pressure signal was obtained using the continuous wavelet transform based on discrete sampling [30]:
where , and are the scale dilation, time index and frequency index, respectively. stands for discrete Fourier transform of . represents the complex conjugate of , which is the Fourier transform of mother wavelet . and stand for sampling interval, data series length and angular frequency (when , ; when , ). In addition, is a normalization factor which can normalized energy at each scale.
Figure 9 shows the time–frequency-domain spectra of relative pressure signal at P4, P5, P6, and P7 under normal conditions. The wavelet amplitude is a dimensionless coefficient. The fn is the shaft frequency and the f/fn was the dimensionless frequency coefficient (multiple of shaft frequency). As shown in Figure 3, the shape of the inlet flow conduit was not axially symmetrical; however, bilateral symmetry, resulting in a rotor–stator interaction between the inlet flow conduit and the rotating shaft with an interference frequency of two times the shaft frequency. The rotor–stator interaction between the baffle plate and the rotating impeller could cause an interference frequency of one times the shaft frequency. The impeller pre-rotation effect could cause an interference frequency of four times the shaft frequency. Therefore, the high-amplitude frequencies can be seen in f/fn = 1, 2 and 4. However, the distribution of frequency amplitudes in f/fn = 1, 2 and 4 were different under three head. Under H = 5.6 m, the discontinuous high-amplitude frequencies can be seen between f/fn = 0 and 2. The amplitude in f/fn =4 at P4 was the highest and that at P1 was the lowest. Under H = 13.6 m, the discontinuous high-amplitude frequencies can be seen between f/fn = 0 and 2. The amplitude in f/fn =4 at P2 was the highest and that at P1 was the lowest. Under H = 15.5 m, the discontinuous high-amplitude frequencies can be seen between f/fn = 0 and 2. The amplitude in f/fn =4 at P1 and P2 were higher than that at P3 and P4.
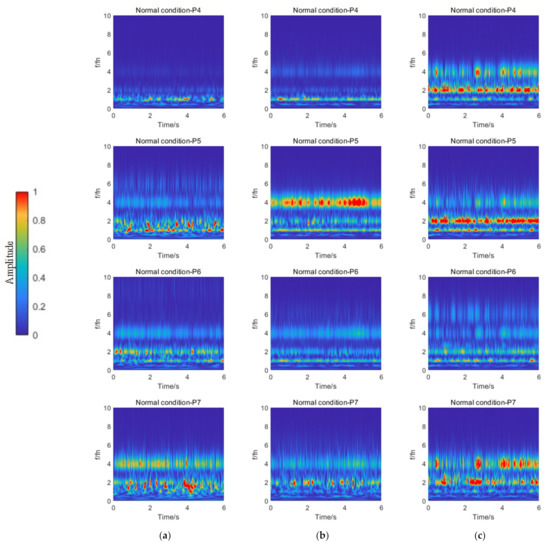
Figure 9.
Time–frequency-domain spectra of relative pressure signal at the outlet of the inlet flow conduit under (a) H = 5.6 m, (b) H = 13.6 m, and (c) H = 15.5 m (normal conditions).
Figure 10 shows the time–frequency-domain spectra of relative pressure signal at P4, P5, P6, and P7 under critical cavitation conditions. Similar to normal conditions, the inlet flow conduit -rotating shaft interface, the baffle plate-rotating shaft interface and impeller pre-rotation could cause three kinds of interference frequency of two, one and four times shaft frequency. Under H = 5.6 m, the discontinuous high-amplitude frequencies can be seen between f/fn = 0 and 2. The amplitude in f/fn = 4 at P2 is the highest and that at P1 is the lowest. Under H = 13.6 m, the discontinuous high-amplitude frequencies at P1 and P4 can be seen between f/fn = 0 and 2. The amplitude in f/fn = 4 at P4 is the highest and that at P1 and P3 are low. Under H = 15.5 m, the discontinuous high-amplitude frequencies can be seen between f/fn = 0 and 2. The amplitude in f/fn = 4 at P1 and P4 are higher than that at P2 and P3.
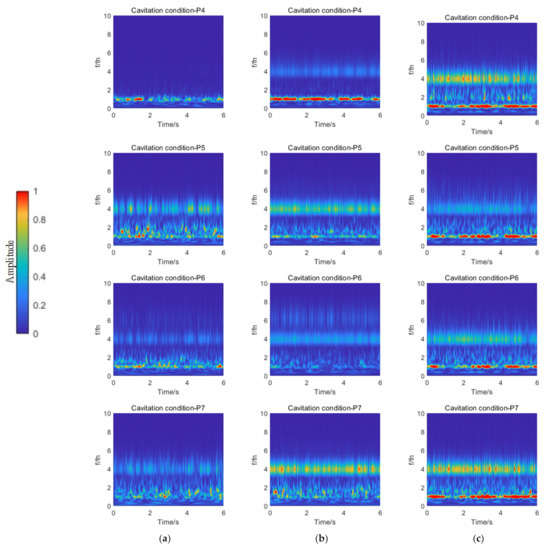
Figure 10.
Time–frequency-domain spectra of relative pressure signal at the outlet of the inlet flow conduit under (a) H = 5.6 m, (b) H = 13.6 m, and (c) H = 15.5 m (critical cavitation conditions).
3.3. Comparative Analysis of Pressure Fluctuation under Normal and Critical Cavitation Conditions
In order to deeply explore the cavitation-induced pressure fluctuation of the mixed-flow pump under impeller inflow distortion, this section compares and analyzes the transient characteristics of the pressure fluctuation at three monitoring points under normal and critical cavitation conditions.
There was a local low pressure near the suction side of the impeller under critical cavitation conditions, thus producing cavities which could change the direction of internal fluid flow, decrease the impeller performance, and increase internal vibration. Therefore, a stroboscope was used to obtain the distribution of cavities in the impeller under normal and critical cavitation conditions, as shown in Figure 11. Under normal conditions (1.5 NPSHc ≥ NPSH ≥ 1.1 NPSHc), although there are a few cavities inside the impeller, the hydraulic performance (efficiency, head) of the mixed-flow pump and cavity volume could remain stable from 1.5 NPSHc to 1.1 NPSHc. When H = 5.5 m, a few cavities will be generated at the leading edge due to the flow separation vortex. When H = 13.6 m and 15.5 m, there were a few cavities on the back of the blade due to the tip leakage vortex. In addition, the volume of cavities near the blade surface under critical cavitation conditions was significantly larger than that under normal conditions. The cavities were mainly located in the middle of the suction side and leading edge under H = 5.6 m, whereas the cavities covered almost the entire suction side under H = 5.6 m and 15.5 m.
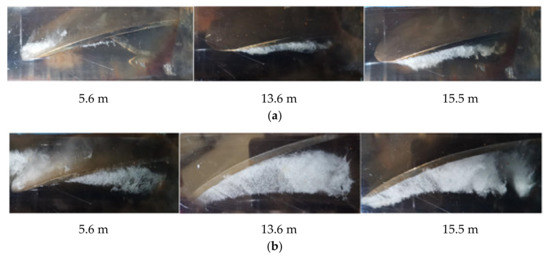
Figure 11.
The distribution of cavities in impeller under (a) normal conditions, and (b) critical cavitation conditions.
Figure 12 and Figure 13 show the comparison of time-domain spectra of relative pressure signal and under normal and critical cavitation conditions. The pressure at the three monitoring points all increased with the increase in head. In addition, the inlet pressure of the mixed-flow pump under critical cavitation conditions was lower than that under normal conditions; hence, the pressure at the three monitoring points under critical cavitation conditions were significantly smaller than those under normal conditions.
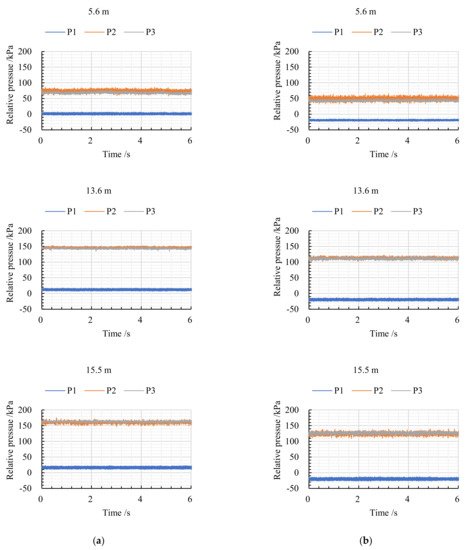
Figure 12.
The time-domain spectra of relative pressure signal at P1, P2 and P3 under (a) normal condition and (b) critical cavitation condition.
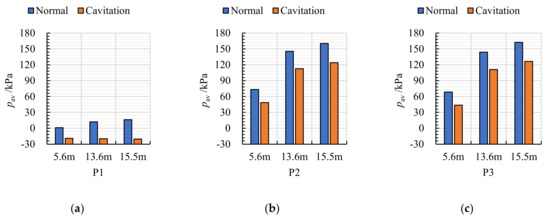
Figure 13.
The time−averaged values of relative pressure signal under normal and critical cavitation conditions at (a) P1, (b) P2, and (c) P3.
Figure 14 shows the comparison of of relative pressure signal under normal and cavitation conditions. P1 was located at the impeller inlet; it is not affected by the cavitation barrier effect, and the impeller inlet pressure under critical cavitation conditions was lower than the that under normal conditions. Therefore, the at P1 under critical cavitation conditions was lower than that under normal conditions. The blocking effect of cavities will worsen the flow pattern inside the impeller, so at P2 under critical cavitation conditions was greater than that under normal conditions. The at P3 under critical cavitation conditions was higher than that under normal conditions, with H = 13.6 m and 15.5 m.
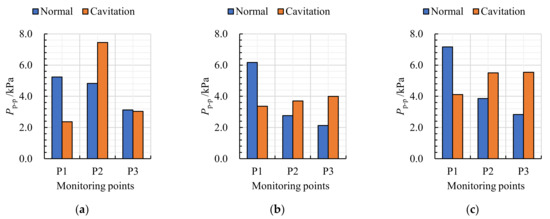
Figure 14.
The of relative pressure signal under normal and critical cavitation conditions at (a) P1, (b) P2, and (c) P3.
Figure 15 shows the time–frequency-domain spectra of relative pressure signal at H = 5.6 m. The main frequencies of pressure frequency at P1 were in f/fn = 4. The continuity and amplitude of the main frequency under critical cavitation conditions were lower than that under normal conditions. The main frequencies of pressure frequency at P2 were in f/fn = 4 and the discontinuous high-amplitude frequency can be seen between f/fn = 12 and 18. The amplitude of these discontinuous frequencies under critical cavitation conditions was higher than that under normal condition. In addition, the discontinuous main frequency at P3 can be found between f/fn = 6 and 12. However, the cavity did not significantly affect the main frequency amplitude at P3.
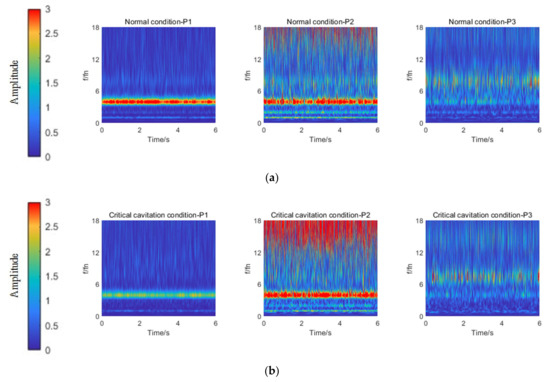
Figure 15.
Time–frequency-domain spectra of relative pressure signal at H = 5.6 m at monitor points P1, P2, and P3 under (a) normal conditions, and (b) critical cavitation conditions.
Figure 16 and Figure 17 show the time–frequency-domain spectra of relative pressure signal at H = 13.6 m and 15.5 m, respectively. The main frequencies of pressure fluctuation at P1 were both in f/fn = 4, under H = 13.6 m and 15.5 m. The cavity was mainly located on the suction side, which did not affect the impeller pre-rotation effect. Therefore, there was no significant difference in the dominant frequency amplitude at P1 under critical cavitation and normal conditions. The main frequencies of pressure fluctuation at P2 were in f/fn = 4 under H = 13.6 m and 15.5 m. The blocking effect of the cavity led to disordered flow in the impeller, so the main frequencies under critical cavitation conditions is higher than that under normal conditions. In addition, the discontinuous high-amplitude frequencies can be found between f/fn = 6 and 12, under critical cavitation conditions. The discontinuous main frequencies at P3 were in f/fn = 8, under H = 13.6 m and 15.5 m. Since the blocking effect of the cavity also led to disordered flow in the guide vanes, the cavities caused the main frequency amplitude to increase.
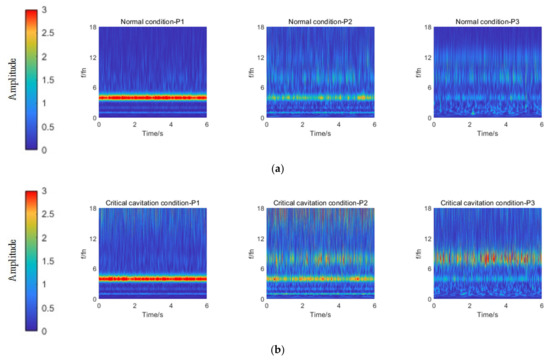
Figure 16.
Time–frequency-domain spectra of relative pressure signal at H = 13.6 m at monitor points P1, P2, and P3 under (a) normal conditions, and (b) critical cavitation conditions.
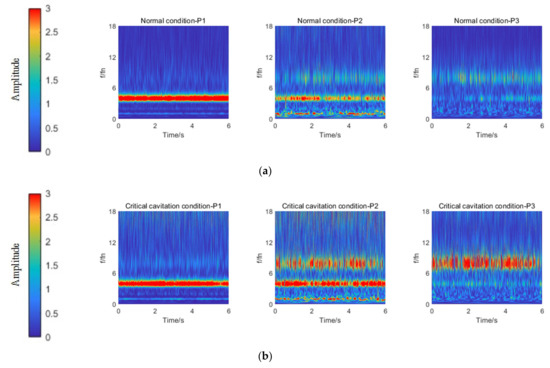
Figure 17.
Time–frequency-domain spectra of relative pressure at H = 15.5 m at monitor points P1, P2, and P3 under (a) normal conditions, and (b) critical cavitation conditions.
4. Conclusions
In this paper, the cavitation-induced pressure fluctuation of a mixed-flow pump under impeller inflow distortion caused by the dustpan-shaped inlet conduit were studied using high-precision dynamic pressure sensors and the cavity near the impeller surface was obtained using a stroboscope. The main conclusions were as follows:
- Because the flow area under the suction tube cone along the direction of P4–P5–P6 or P4–P7–P6 decreased gradually, pav at P4 was the lowest, whereas pav at P6 was the highest. The at P5, P6, P7 under critical cavitation conditions were lower than that under normal conditions.
- Pressure fluctuation at P4–P7 was affected by the impeller pre-rotation, baffle–rotating shaft interface, and inlet conduit–rotating shaft interface. Therefore, the main frequency amplitude of pressure fluctuation at the outlet of the inlet conduit was asymmetric.
- Under H = 5.6 m, the cavity occurred at the front of the pressure side and the middle of the suction side under critical cavitation conditions, which resulted in a weakening of the impeller pre-rotation effect. Under H = 13.6 m and 15.5 m, the cavity almost covered the entire suction side under critical cavitation conditions, which resulted in an increase in Sp at P2 and P3 due to the deterioration of internal flow.
- Under H = 5.6 m, the amplitude of four times the shaft frequency at P1 under critical cavitation conditions was significantly higher than that under normal conditions. Under H = 13.6 m and 15.5 m, the amplitudes of four times and eight times the shaft frequency at P2 and P3 under critical cavitation conditions were significantly higher than those under normal conditions.
These research results can provide a reference for the optimization of operation stability of a mixed-flow pump with a dustpan-shaped inlet conduit.
Author Contributions
Conceptualization, H.Z. and Y.Z.; methodology, H.Z. and Y.Z.; software, H.Z and F.M.; validation, F.M.; formal analysis, H.Z.; investigation, H.Z. and Y.Z.; resources, Y.L.; data curation, H.Z and Y.L.; writing—original draft preparation, H.Z.; writing—review and editing, F.M.; visualization, F.M.; supervision, F.M.; project administration, Y.L.; funding acquisition, Y.L. All authors have read and agreed to the published version of the manuscript.
Funding
This research was funded by Industry-University-Research Collaboration of Jiangsu Province, grant number BY2020373.
Institutional Review Board Statement
Not applicable.
Informed Consent Statement
Not applicable.
Data Availability Statement
Not applicable.
Conflicts of Interest
The authors declare no conflict of interest.
Nomenclature
| g (m/s2) | Gravitational acceleration |
| H (m) | Head of mixed-flow pump |
| M (N·m) | Torque |
| Data series length | |
| NPSH (m) | Net positive suction head |
| NPSHc (m) | Critical net positive suction head |
| (r/min) | Rotation speed |
| (kPa) | Time-averaged value of pressure fluctuation |
| (Pa) | Inlet total pressure |
| (Pa) | Outlet total pressure |
| (Pa) | Liquid vaporization pressure |
| (kPa) | Peak to peak values |
| (kPa) | maximum relative pressure in the jth |
| (kPa) | minimum relative pressure in the jth |
| (kg/s) | Mass flowrate |
| (m/s) | Average liquid velocity |
| (%) | Efficiency of mixed-flow pump |
| (kg/m3) | Liquid density |
References
- Kim, S.; Kim, Y.-I.; Kim, J.-H.; Choi, Y.-S. Design optimization for mixed-flow pump impeller by improved suction performance and efficiency with variables of specific speeds. J. Mech. Sci. Technol. 2020, 34, 2377–2389. [Google Scholar] [CrossRef]
- Bing, H.; Cao, S. Experimental study of the influence of flow passage subtle variation on mixed-flow pump performance. Chin. J. Mech. Eng. 2014, 27, 615–621. [Google Scholar] [CrossRef]
- Zhao, B.; Xie, Y.; Liao, W.; Han, L.; Fu, Y.; Huang, Z. Adaptability analysis of second generation vortex recognition method in internal flow field of mixed-flow pumps. J. Mech. Eng. 2020, 56, 216–223. [Google Scholar]
- Gao, C.; Sun, L.; Dong, X. Influence of the width of dustpan-shaped inlet conduit on flow characteristics. Yellow River 2020, 42, 91–96, 104. (In Chinese) [Google Scholar]
- Zheng, Y.; Li, Y.; Hu, X.; Yang, P.; Wang, Y. Profile optimization of dustpan-shaped inlet conduit in pumping station based on orthogonal test. Yangtze River 2021, 52, 123–126, 157. (In Chinese) [Google Scholar]
- Kim, S.; Kim, Y.-I.; Kim, J.-H.; Choi, Y.-S. Three-objective optimization of a mixed-flow pump impeller for improved suction performance and efficiency. Adv. Mech. Eng. 2019, 11, 1687814019898969. [Google Scholar] [CrossRef]
- Zhu, D.; Tao, R.; Xiao, R. Anti-cavitation design of the symmetric leading-edge shape of mixed-flow pump impeller blades. Symmetry 2019, 11, 46. [Google Scholar] [CrossRef]
- Suh, J.W.; Yang, H.M.; Kim, Y.I.; Lee, K.Y.; Kim, J.H.; Joo, W.G.; Choi, Y.S. Multi-objective optimization of a high efficiency and suction performance for mixed-flow pump impeller. Eng. Appl. Comput. Fluid Mech. 2019, 13, 744–762. [Google Scholar] [CrossRef]
- Sun, W.; Tan, L. Cavitation-vortex-pressure fluctuation interaction in a centrifugal pump using bubble rotation modified cavitation model under partial load. J. Fluids Eng. 2020, 142, 051206. [Google Scholar] [CrossRef]
- Kim, D.-J.; Sung, H.J.; Choi, C.-H.; Kim, J.-S. Cavitation instabilities of an inducer in a cryogenic pump. Acta Astronaut. 2017, 132, 19–24. [Google Scholar] [CrossRef]
- Meng, L.; He, M.; Zhou, L.; Yang, J.; Wang, Z.; Karney, B. Influence of impeller-tongue interaction on the unsteady cavitation behavior in a centrifugal pump. Eng. Comput. 2016, 33, 171–183. [Google Scholar] [CrossRef]
- Zhang, R.; Chen, H.-X. Numerical analysis of cavitation within slanted axial-flow pump. J. Hydrodyn. 2013, 25, 663–672. [Google Scholar] [CrossRef]
- Liu, X.; Hu, Q.; Wang, H.; Jiang, Q.; Shi, G. Characteristics of unsteady excitation induced by cavitation in axial-flow oil–gas multiphase pumps. Adv. Mech. Eng. 2018, 10, 1687814018771260. [Google Scholar] [CrossRef]
- Shen, X.; Zhang, D.; Xu, B.; Ye, C.; Shi, W. Experimental and numerical investigation of tip leakage vortex cavitation in an axial flow pump under design and off-design conditions. Proc. Inst. Mech. Eng. Part A J. Power Energy 2021, 235, 70–80. [Google Scholar] [CrossRef]
- Sun, H.; Si, Q.; Chen, N.; Yuan, S. HHT-based feature extraction of pump operation instability under cavitation conditions through motor current signal analysis. Mech. Syst. Signal Process. 2020, 139, 106613. [Google Scholar] [CrossRef]
- Sun, H.; Luo, Y.; Yuan, S.; Yin, J. Hilbert spectrum analysis of unsteady characteristics in centrifugal pump operation under cavitation status. Ann. Nucl. Energy 2018, 114, 607–615. [Google Scholar] [CrossRef]
- Li, X.; Yu, B.; Ji, Y.; Lu, J.; Yuan, S. Statistical characteristics of suction pressure signals for a centrifugal pump under cavitating conditions. J. Therm. Sci. 2017, 26, 47–53. [Google Scholar] [CrossRef]
- Černetič, J. The use of noise and vibration signals for detecting cavitation in kinetic pumps. Proc. Inst. Mech. Eng. Part C J. Mech. Eng. Sci. 2009, 223, 1645–1655. [Google Scholar] [CrossRef]
- Toyokura, T.; Kubota, N. Studies on back-flow mechanism of turbomachines: Part 1, back-flow mechanism to the suction side of axial-flow impeller blades. Jpn. Soc. Mech. Eng. 1968, 11, 147–156. [Google Scholar] [CrossRef][Green Version]
- Toyokura, T.; Kubota, N.; Akaike, S. Studies on back-flow mechanism of turbomachines: (Part 2, back-flow to the suction side of mixed-flow impeller blades). Bull. JSME 1969, 12, 215–223. [Google Scholar] [CrossRef]
- Cao, P.; Zhu, R.; Yin, G. Spike-type disturbances due to inlet distortion in a centrifugal pump. Renew. Energy 2021, 165, 288–300. [Google Scholar] [CrossRef]
- Van Esch, B.P.M. Performance and radial loading of a mixed-flow pump under non-uniform suction flow. J. Fluids Eng. 2009, 131, 051101. [Google Scholar] [CrossRef]
- Tani, N.; Yamanishi, N.; Tsujimoto, Y. Influence of flow coefficient and flow structure on rotational cavitation in inducer. J. Fluids Eng. 2012, 134, 021302. [Google Scholar] [CrossRef]
- Li, Y.; Lu, R.; Zhang, H.; Deng, F.; Yuan, J. Improvement of intake structures in a two-way pumping station with experimental analysis. Appl. Sci. 2020, 10, 6842. [Google Scholar] [CrossRef]
- Li, Y.; Chen, C.; Pei, J.; Wang, W.; Wu, T. Experiment on pressure fluctuation of axial flow pump system under different cavitation conditions. Trans. Chin. Soc. Agric. Mach. 2018, 49, 158–164. (In Chinese) [Google Scholar]
- Bashiri, M.; Derakhshan, S.; Shahrabi, J. Design optimization of a centrifugal pump using particle swarm optimization algorithm. Int. J. Fluid Mach. Syst. 2019, 12, 322–331. [Google Scholar] [CrossRef]
- Wang, Y.; Huo, X. Multiobjective optimization design and performance prediction of centrifugal pump based on orthogonal test. Adv. Mater. Sci. Eng. 2018, 2018, 6218178. [Google Scholar] [CrossRef]
- Tao, R.; Xiao, R.; Yang, W.; Wang, F.; Liu, W.; Chou, J.-H. Optimization for cavitation inception performance of pump-turbine in pump mode based on genetic algorithm. Math. Probl. Eng. 2014, 2014, 234615. [Google Scholar] [CrossRef]
- Liu, L.; Zhu, B.; Bai, L.; Liu, X.; Zhao, Y. Parametric design of an ultrahigh-head pump-turbine runner based on multiobjective optimization. Energies 2017, 10, 1169. [Google Scholar] [CrossRef]
- Pavesi, G.; Cavazzini, G.; Ardizzon, G. Time–frequency characterization of the unsteady phenomena in a centrifugal pump. Int. J. Heat Fluid Flow 2008, 29, 1527–1540. [Google Scholar] [CrossRef]
Publisher’s Note: MDPI stays neutral with regard to jurisdictional claims in published maps and institutional affiliations. |
© 2021 by the authors. Licensee MDPI, Basel, Switzerland. This article is an open access article distributed under the terms and conditions of the Creative Commons Attribution (CC BY) license (https://creativecommons.org/licenses/by/4.0/).