
Colocalization Analysis of Lipo-Deoxyribozyme Consisting of DNA and Protic Catalysts in a Vesicle-Based Protocellular Membrane Investigated by Confocal Microscopy

 , , , and
Abstract
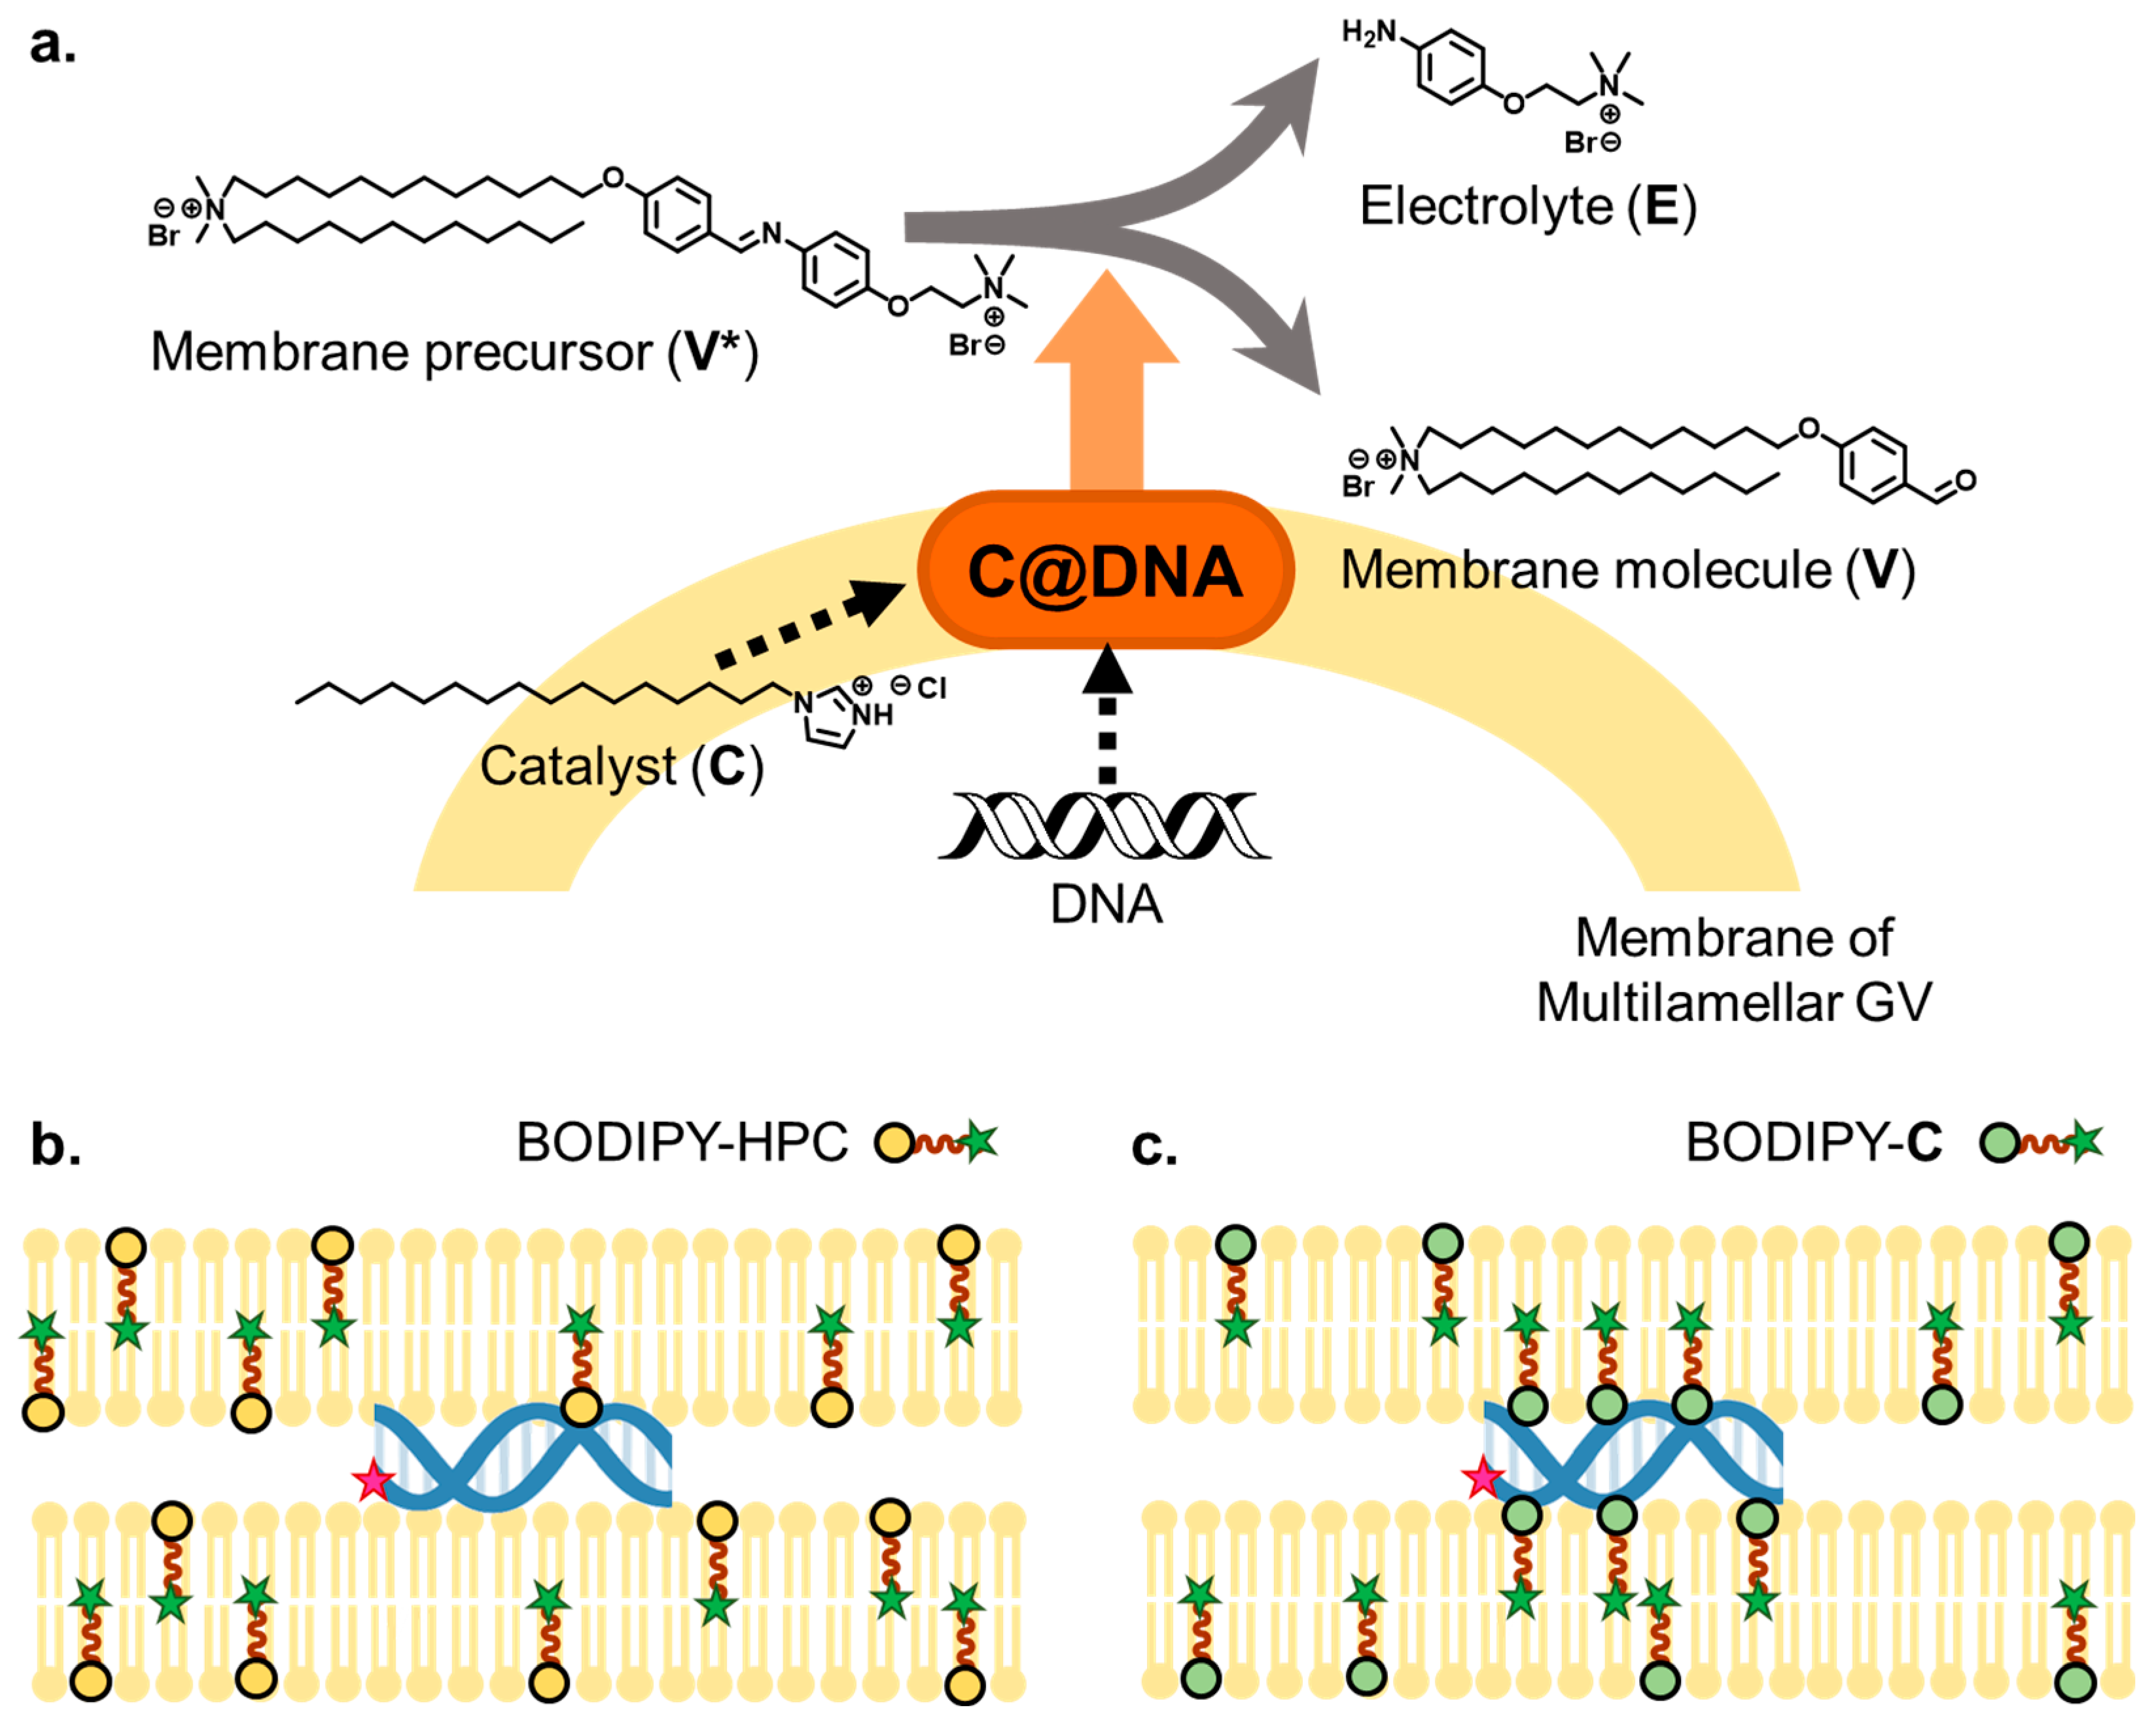
:1. Introduction
2. Materials and Methods
2.1. Materials
2.2. Preparation of GV Containing PCR Reagents with and without Cationic Lipid V
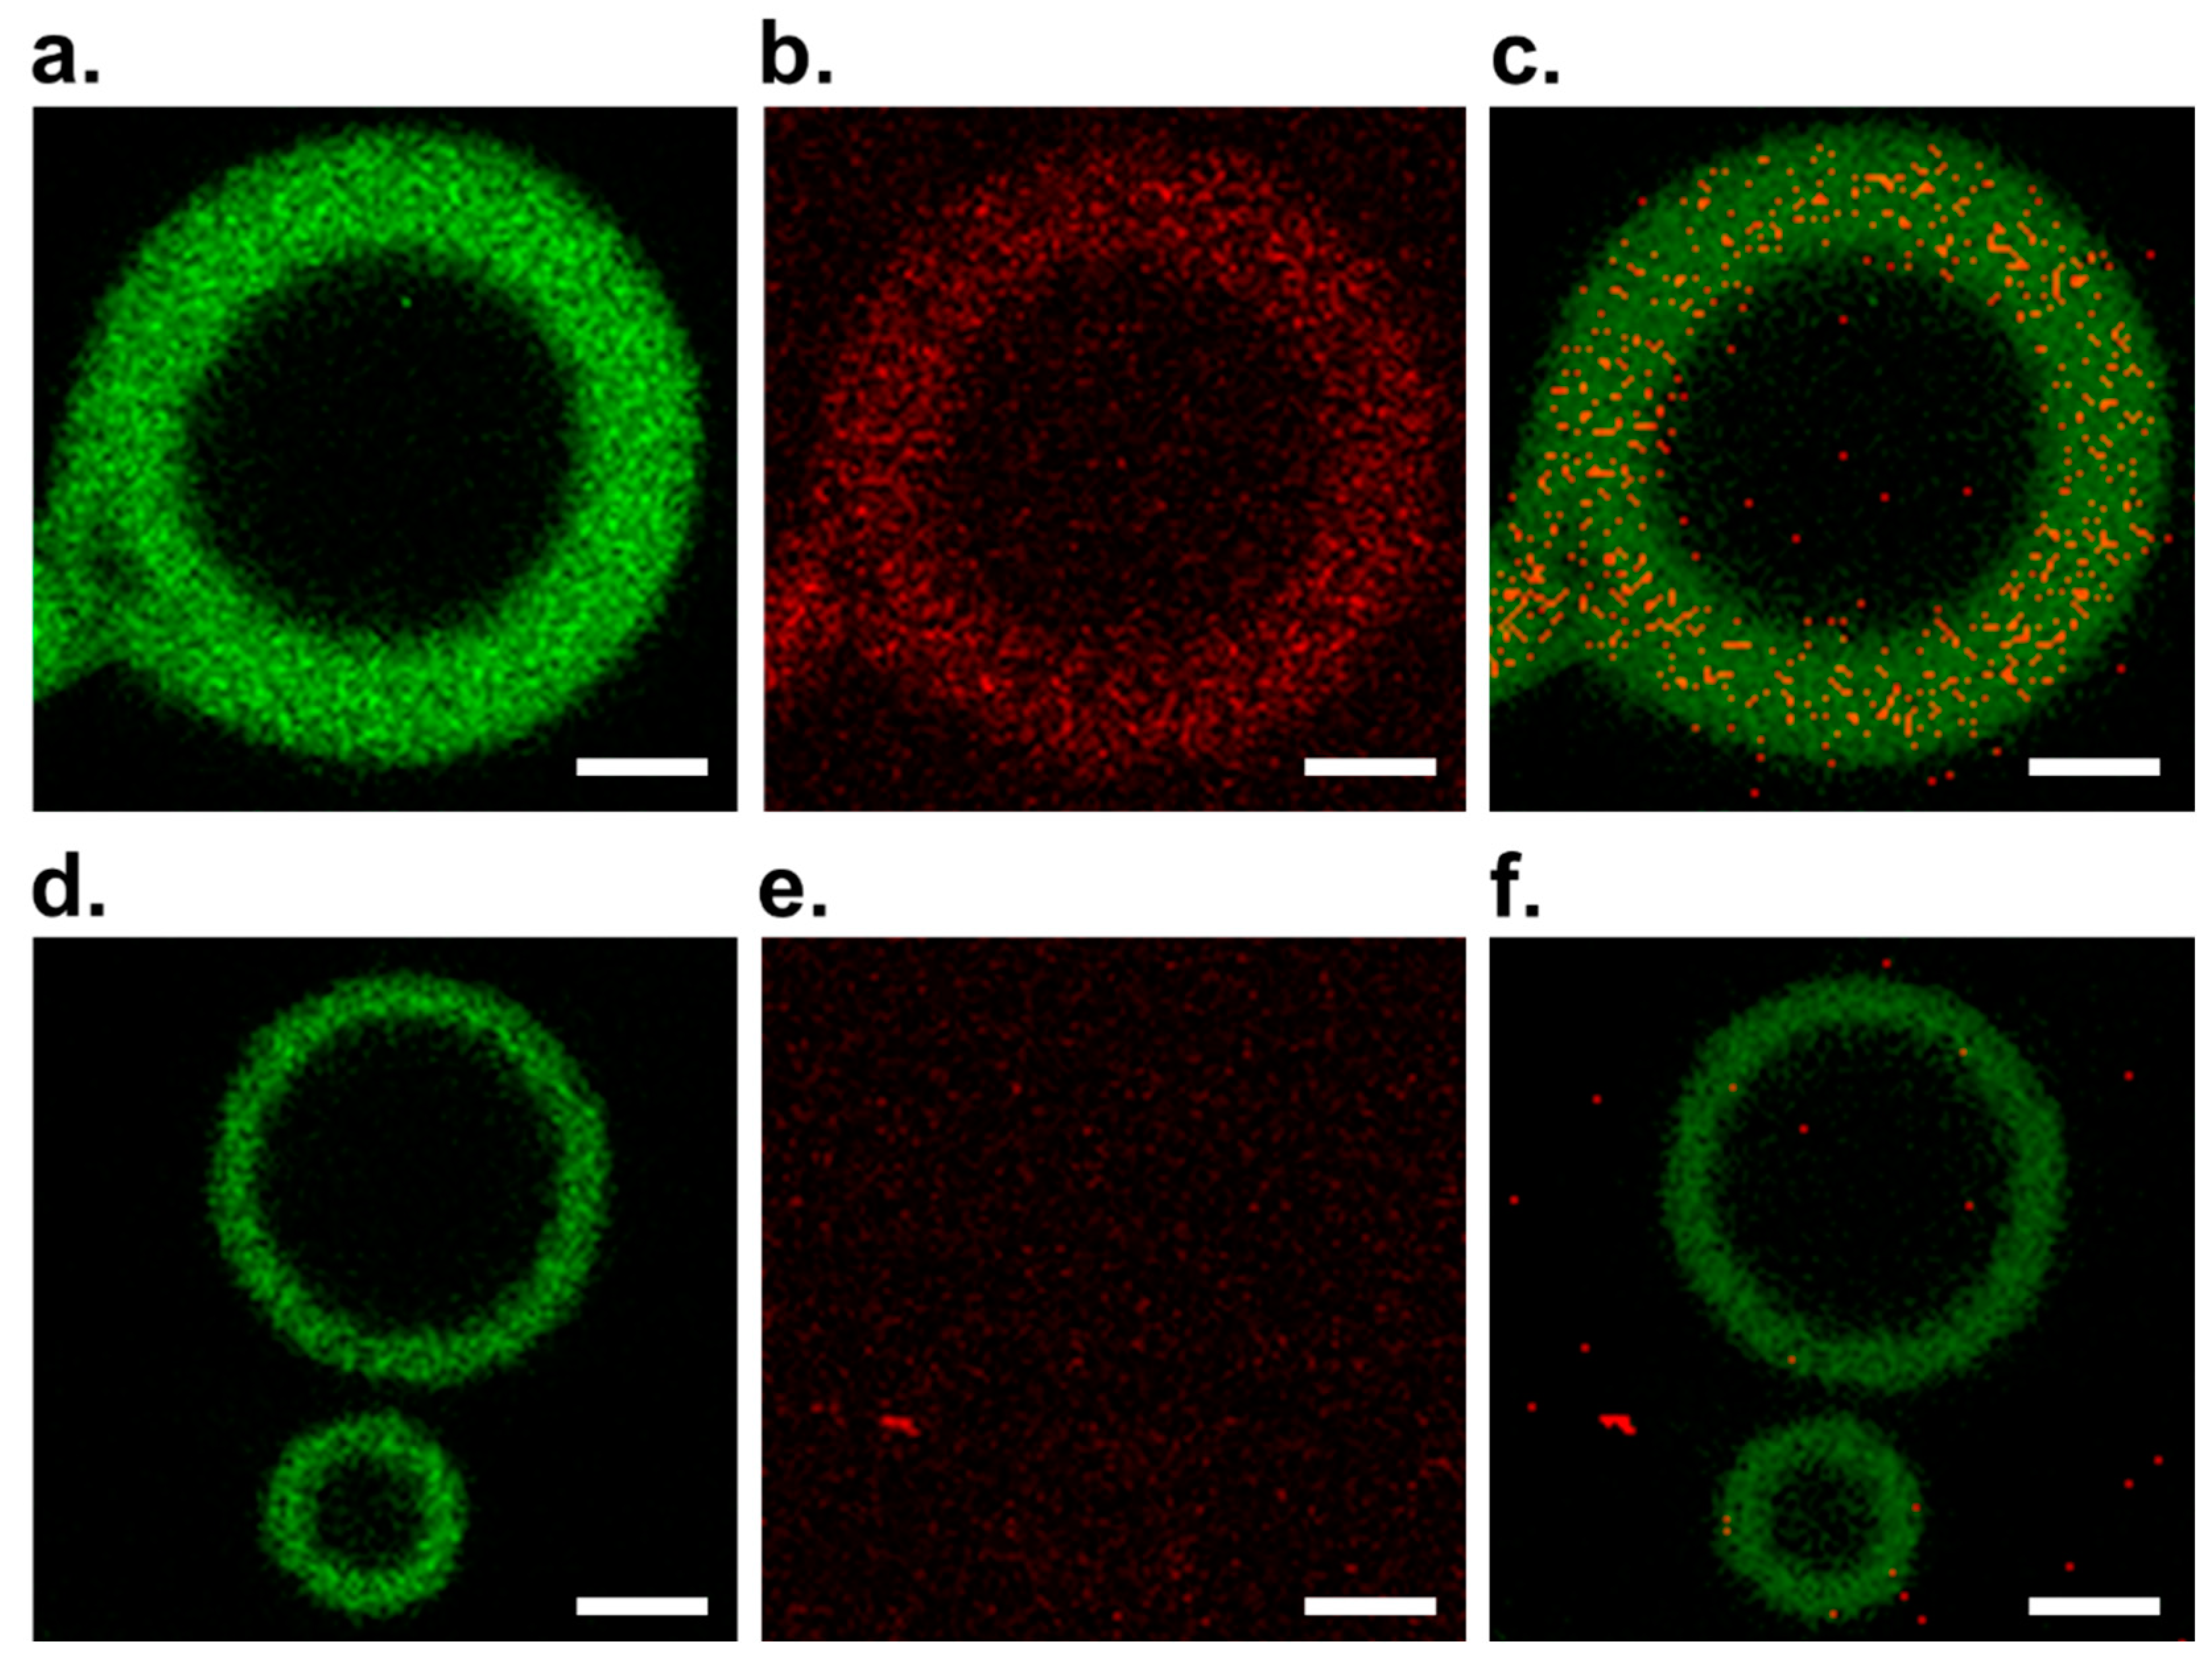
2.3. Confocal Observation of DNA Tagged with Texas Red in GV with and without Cationic Membrane Lipid V
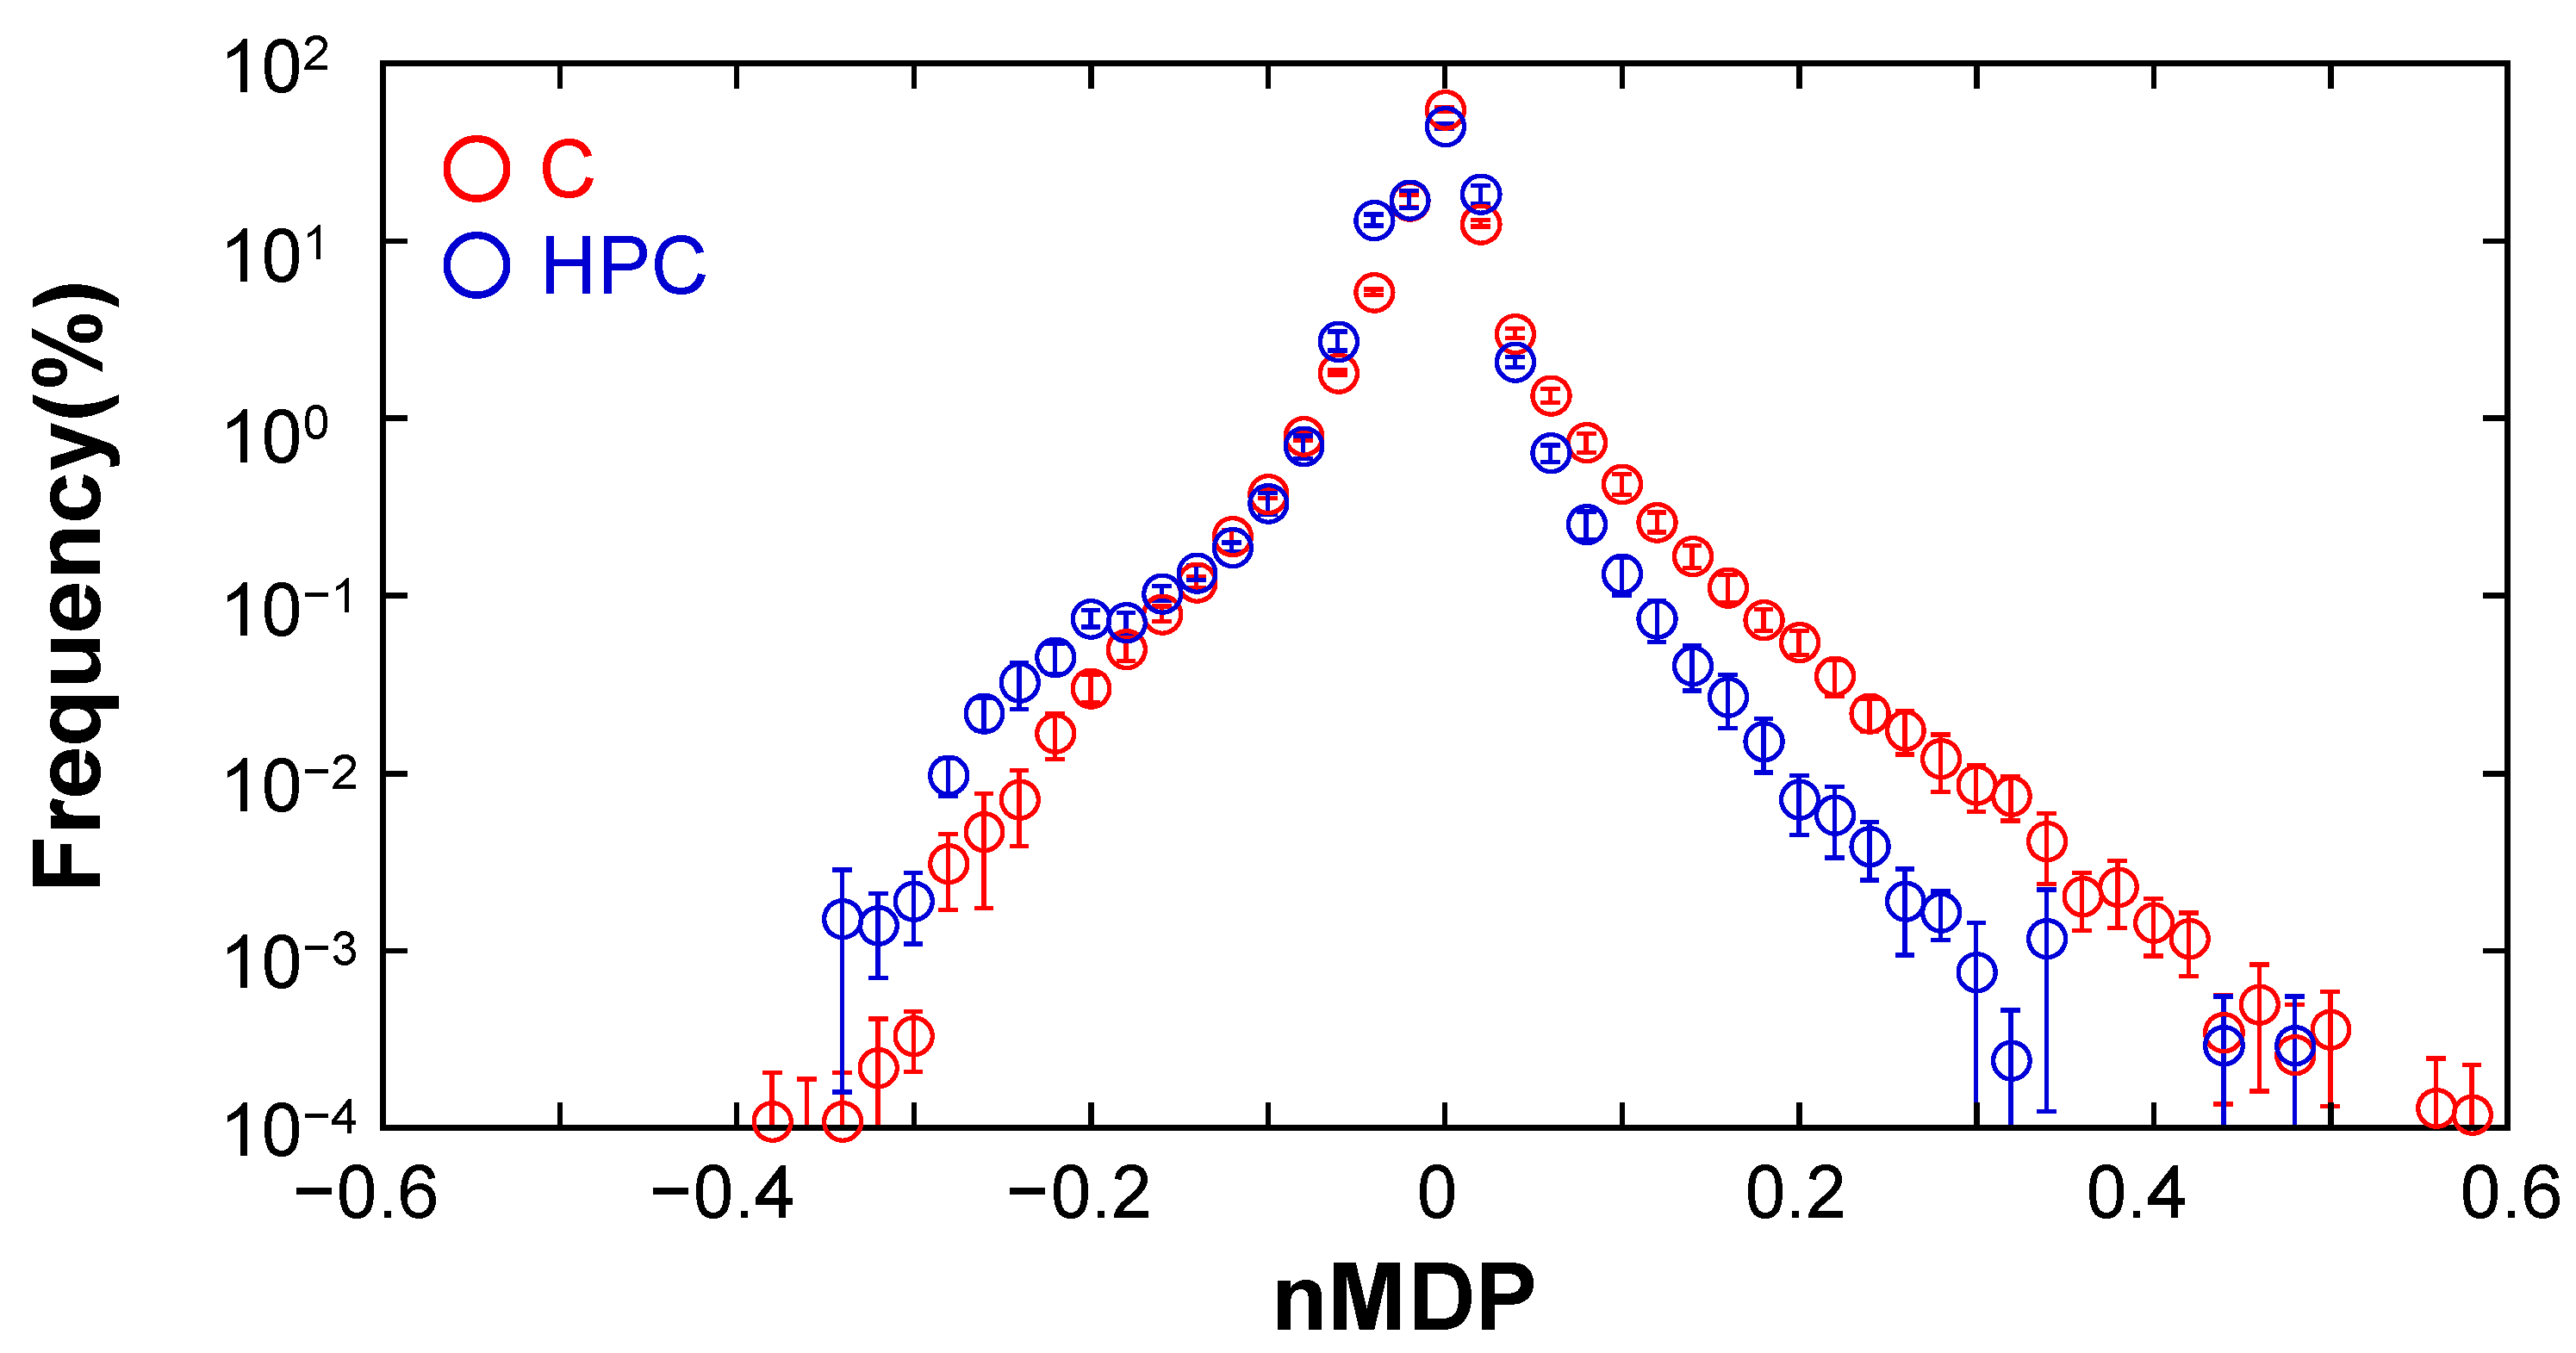
2.4. Colocalization Analysis Method
3. Results
3.1. Observation of DNA in GV Membrane Containing V by Confocal Microscopy
3.2. Elucidation of the Formation of C@DNA in GV Membrane Using Colocalization Analysis
4. Discussion
Supplementary Materials
Author Contributions
Funding
Institutional Review Board Statement
Informed Consent Statement
Data Availability Statement
Conflicts of Interest
References
- Rasmussen, S.; Chen, L.; Nilsson, M.; Abe, S. Bridging nonliving and living matter. Artif. Life 2003, 9, 269–316. [Google Scholar] [CrossRef] [PubMed]
- Kurihara, K.; Matsuo, M.; Yamaguchi, T.; Sato, S. Synthetic approach to biomolecular science by cyborg supramolecular chemistry. Biochim. Biophys. Acta (BBA) Gen. Subj. 2018, 1862, 358–364. [Google Scholar] [CrossRef] [PubMed]
- Stano, P. Is research on “Synthetic Cells” moving to the next level? Life 2019, 9, 3. [Google Scholar] [CrossRef] [PubMed] [Green Version]
- Segré, D.; Ben-Eli, D.; Deamer, D.W.; Lancet, D. The lipid world. Orig. Life Evol. Biosph. 2001, 31, 119–145. [Google Scholar] [CrossRef] [PubMed]
- Szostak, J.W.; Bartel, D.P.; Luisi, P.L. Synthesizing life. Nature 2001, 409, 387–390. [Google Scholar] [CrossRef] [PubMed]
- Dzieciol, A.J.; Mann, S. Designs for life: Protocell models in the laboratory. Chem. Soc. Rev. 2012, 41, 79–85. [Google Scholar] [CrossRef] [PubMed]
- Schrum, J.P.; Zhu, T.F.; Szostak, J.W. The origins of cellular life. Cold Spring Harb. Perspect. Biol. 2010, 2, a002212. [Google Scholar] [CrossRef] [Green Version]
- Janout, V.; Lanier, M.; Regen, S.L. Molecular umbrellas. J. Am. Chem. Soc. 1996, 118, 1573–1574. [Google Scholar] [CrossRef]
- Barton, P.; Hunter, C.A.; Potter, T.J.; Webb, S.J.; Williams, N.H. Transmembrane signalling. Angew. Chem. 2002, 114, 4034–4037. [Google Scholar] [CrossRef]
- Matsuo, M.; Hirata, Y.; Kurihara, K.; Toyota, T.; Miura, T.; Suzuki, K.; Sugawara, T. Environment-sensitive intelligent self-reproducing artificial cell with a modification-active lipo-deoxyribozyme. Micromachines 2020, 11, 606. [Google Scholar] [CrossRef]
- Mohanan, G.; Nair, K.S.; Nampoothiri, K.M.; Bajaj, H. Engineering bio-mimicking functional vesicles with multiple compartments for quantifying molecular transport. Chem. Sci. 2020, 11, 4669–4679. [Google Scholar] [CrossRef] [Green Version]
- Lopez, A.; Fayolle, D.; Fiore, M.; Strazewski, P. Chemical Analysis of Lipid Boundaries after Consecutive Growth and Division of Supported Giant Vesicles. iScience 2020, 23, 101677. [Google Scholar] [CrossRef] [PubMed]
- Kindt, J.T.; Szostak, J.W.; Wang, A. Bulk self-assembly of giant, unilamellar vesicles. ACS Nano 2020, 14, 14627–14634. [Google Scholar] [CrossRef]
- Ivanov, I.; Castellanos, S.L.; Balasbas, S., III; Otrin, L.; Marušič, N.; Vidaković-Koch, T.; Sundmacher, K. Bottom-Up Synthesis of Artificial Cells: Recent Highlights and Future Challenges. Annu. Rev. Chem. Biomol. Eng. 2021, 12, 287–308. [Google Scholar] [CrossRef] [PubMed]
- Bhattacharya, A.; Brea, R.J.; Devaraj, N.K. De novo vesicle formation and growth: An integrative approach to artificial cells. Chem. Sci. 2017, 8, 7912–7922. [Google Scholar] [CrossRef] [Green Version]
- Wang, A.; Szostak, J.W. Lipid constituents of model protocell membranes. Emerg. Top. Life Sci. 2019, 3, 537–542. [Google Scholar] [PubMed]
- Lopez, A.; Fiore, M. Investigating prebiotic protocells for a comprehensive understanding of the origins of life: A prebiotic systems chemistry perspective. Life 2019, 9, 49. [Google Scholar] [CrossRef] [PubMed] [Green Version]
- Dimova, R.; Marques, C. The Giant Vesicle Book; CRC Press: Boca Raton, FL, USA, 2019. [Google Scholar]
- Kurihara, K.; Tamura, M.; Shohda, K.; Toyota, T.; Suzuki, K.; Sugawara, T. Self-reproduction of supramolecular giant vesicles combined with the amplification of encapsulated DNA. Nat. Chem. 2011, 3, 775–781. [Google Scholar] [CrossRef] [PubMed]
- Matsuo, M.; Kan, Y.; Kurihara, K.; Jimbo, T.; Imai, M.; Toyota, T.; Hirata, Y.; Suzuki, K.; Sugawara, T. DNA Length-dependent Division of a Giant Vesicle-based Model protocell. Sci. Rep. 2019, 9, 6916. [Google Scholar] [CrossRef] [Green Version]
- Cech, T.R.; Bass, B.L. Biological catalysis by RNA. Annu. Rev. Biochem. 1986, 55, 599–629. [Google Scholar] [CrossRef]
- Breaker, R.R.; Joyce, G.F. A DNA enzyme with Mg2+-dependent RNA phosphoesterase activity. ACS Chem. Biol. 1995, 2, 655–660. [Google Scholar] [CrossRef] [Green Version]
- Fagone, P.; Jackowski, S. Membrane phospholipid synthesis and endoplasmic reticulum function. J. Lipid Res. 2009, 50, S311–S316. [Google Scholar] [CrossRef] [Green Version]
- Lagace, T.A.; Ridgway, N.D. The role of phospholipids in the biological activity and structure of the endoplasmic reticulum. Biochim. Biophys. Acta (BBA) Mol. Cell Res. 2013, 1833, 2499–2510. [Google Scholar] [CrossRef] [Green Version]
- Vance, J.A.; Devaraj, N.K. Membrane Mimetic Chemistry in Artificial Cells. J. Am. Chem. Soc. 2021, 143, 8223–8231. [Google Scholar] [CrossRef]
- Takakura, K.; Toyota, T.; Sugawara, T. A novel system of self-reproducing giant vesicles. J. Am. Chem. Soc. 2003, 125, 8134–8140. [Google Scholar] [CrossRef] [PubMed]
- Yamada, K.; Toyota, T.; Takakura, K.; Ishimaru, M.; Sugawara, T. Preparation of BODIPY probes for multicolor fluorescence imaging studies of membrane dynamics. New J. Chem. 2001, 25, 667–669. [Google Scholar] [CrossRef]
- Schindelin, J.; Arganda-Carreras, I.; Frise, E.; Kaynig, V.; Longair, M.; Pietzsch, T.; Preibisch, S.; Rueden, C.; Saalfeld, S.; Schmid, B. Fiji: An open-source platform for biological-image analysis. Nat. Methods 2012, 9, 676–682. [Google Scholar] [CrossRef] [PubMed] [Green Version]
- Jaskolski, F.; Mulle, C.; Manzoni, O.J. An automated method to quantify and visualize colocalized fluorescent signals. J. Neurosci. Methods 2005, 146, 42–49. [Google Scholar] [CrossRef] [PubMed]
- Bolte, S.; Cordelières, F.P. A guided tour into subcellular colocalization analysis in light microscopy. J. Microsc. 2006, 224, 213–232. [Google Scholar] [CrossRef] [PubMed]
- Gorlewicz, A.; Krawczyk, K.; Szczepankiewicz, A.A.; Trzaskoma, P.; Mulle, C.; Wilczynski, G.M. Colocalization Colormap—An ImageJ Plugin for the Quantification and Visualization of Colocalized Signals; Springer: Berlin/Heidelberg, Germany, 2020. [Google Scholar]
- Leaver, M.; Dominguez-Cuevas, P.; Coxhead, J.; Daniel, R.; Errington, J. Life without a wall or division machine in Bacillus subtilis. Nature 2009, 457, 849–853. [Google Scholar] [CrossRef] [PubMed]
- Mercier, R.; Kawai, Y.; Errington, J. Excess membrane synthesis drives a primitive mode of cell proliferation. Cell 2013, 152, 997–1007. [Google Scholar] [CrossRef] [Green Version]
- Chen, X.; Wang, Y.; Zhang, X.; Liu, C. Advances in super-resolution fluorescence microscopy for the study of nano-cell interactions. Biomater. Sci. 2021, 9, 5484–5496. [Google Scholar] [CrossRef] [PubMed]


| Additives (mL) | Concentration (mM) | mol% | |
|---|---|---|---|
| POPC | 77.2 | 10 | 77.3 |
| V | 16.8 | 2.5 | 4.21 |
| C | 33.6 | 2.5 | 8.41 |
| DSPE-1K | 67.2 | 0.25 | 1.68 |
| Chol. | 33.6 | 2.5 | 8.41 |
| BP-HPC/BP-C | 1 | 0.1 | 0.01 |
| Additives (mL) | Concentration (mM) | mol% | |
|---|---|---|---|
| POPC | 77.2 | 10 | 80.68 |
| C | 33.6 | 2.5 | 8.778 |
| DSPE-1K | 67.2 | 0.25 | 1.756 |
| Chol | 33.6 | 2.5 | 8.778 |
| BP-HPC | 1 | 0.1 | 0.01 |
| Additives (mL) | Initial Concentration (mM) | Final Concentration (mM) | |
|---|---|---|---|
| Water | 348 | - | - |
| KOD buff. | 50 | - | - |
| MgSO4 aq. | 20 | 25 | 0.499 |
| dNTPs aq. | 40 | 8 | 0.319 |
| TR-primer | 14 | 10 | 0.140 |
| Reverse-primer | 14 | 10 | 0.140 |
| Template DNA | 5 | 10 | 0.050 |
| KOD aq. | 10 | - | - |
| Volume of Additives (µL) | |
|---|---|
| Deionized Water | 430 |
| 10×KOD-plus-Buffer | 50 |
| 100 mM CaCl2 aq | 5 |
| 1 U/µL DNase I | 15 |
Publisher’s Note: MDPI stays neutral with regard to jurisdictional claims in published maps and institutional affiliations. |
© 2021 by the authors. Licensee MDPI, Basel, Switzerland. This article is an open access article distributed under the terms and conditions of the Creative Commons Attribution (CC BY) license (https://creativecommons.org/licenses/by/4.0/).
Share and Cite
Hirata, Y.; Matsuo, M.; Kurihara, K.; Suzuki, K.; Nonaka, S.; Sugawara, T. Colocalization Analysis of Lipo-Deoxyribozyme Consisting of DNA and Protic Catalysts in a Vesicle-Based Protocellular Membrane Investigated by Confocal Microscopy. Life 2021, 11, 1364. https://doi.org/10.3390/life11121364
Hirata Y, Matsuo M, Kurihara K, Suzuki K, Nonaka S, Sugawara T. Colocalization Analysis of Lipo-Deoxyribozyme Consisting of DNA and Protic Catalysts in a Vesicle-Based Protocellular Membrane Investigated by Confocal Microscopy. Life. 2021; 11(12):1364. https://doi.org/10.3390/life11121364
Chicago/Turabian StyleHirata, Yuiko, Muneyuki Matsuo, Kensuke Kurihara, Kentaro Suzuki, Shigenori Nonaka, and Tadashi Sugawara. 2021. "Colocalization Analysis of Lipo-Deoxyribozyme Consisting of DNA and Protic Catalysts in a Vesicle-Based Protocellular Membrane Investigated by Confocal Microscopy" Life 11, no. 12: 1364. https://doi.org/10.3390/life11121364