Article

De Novo Transcriptome Profiling of Brain Tissue from the Annual Killifish Nothobranchius guentheri

by
Zulfiia G. Guvatova
1,*,†,
Maria S. Fedorova
1,†,
Yulia S. Vershinina
1,
Elena A. Pudova
1,
Anastasiya V. Lipatova
1,
Vsevolod V. Volodin
1,
Natalya S. Gladysh
1,
Artemiy T. Tokarev
1,
Alexey B. Kornev
2,
Vladislav S. Pavlov
1,
Ildar R. Bakhtogarimov
1,
Evgeny Y. Krysanov
3,
Alexey A. Moskalev
1,
George S. Krasnov
1 and
Anna V. Kudryavtseva
1,*
1
Center for Precision Genome Editing and Genetic Technologies for Biomedicine Engelhardt Institute of Molecular Biology, Russian Academy of Sciences, 119991 Moscow, Russia
2
Institute of Problems of Chemical Physics of Russian Academy of Sciences, 142432 Chernogolovka, Russia
3
A.N. Severtsov Institute of Ecology and Evolution, Russian Academy of Sciences, 119991 Moscow, Russia
*
Authors to whom correspondence should be addressed.
Equal contribution.
Life 2021, 11(2), 137; https://doi.org/10.3390/life11020137
Submission received: 15 January 2021 / Revised: 5 February 2021 / Accepted: 8 February 2021 / Published: 11 February 2021
(This article belongs to the Special Issue Genomic and Transcriptomic Alterations in Cancer and Aging)

Abstract

:
Nothobranchius is a genus of small annual killifish found in Africa. Due to the relatively short lifespan, as well as easy breeding and care, Nothobranchius fish are becoming widely used as a vertebrate model system. Studying the genome and transcriptome of these fish is essential for advancing the field. In this study, we performed de novo transcriptome assembly of brain tissues from Nothobranchius guentheri using Trinity. Annotation of 104,271 potential genes (with transcripts longer than 500 bp) was carried out; for 24,967 genes (53,654 transcripts), in which at least one GO annotation was derived. We also analyzed the effect of a long-term food supplement with Torin 2, second-generation ATP-competitive inhibitor of mTOR, on the gene expression changes in brain tissue of adult N. guentheri. Overall, 1491 genes in females and 249 genes in males were differently expressed under Torin 2-supplemented diet. According to the Gene Set Enrichment Analysis (GSEA), the majority of identified genes were predominantly involved in the regulation of metabolic process, dendritic spine maintenance, circadian rhythms, retrotransposition, and immune response. Thus, we have provided the first transcriptome assembly and assessed the differential gene expression in response to exposure to Torin 2, which allow a better understanding of molecular changes in the brain tissues of adult fish in the mTOR pathway inhibition.

1. Introduction

Over the past decades, teleost fish due to experimental advantages in a laboratory setting has become a valuable vertebrate model for many fields of scientific research, including gerontology. Several age-related changes, including weakening immune system, increasing tumor risk, disruption of circadian rhythms, and alterations in locomotor activity, have been observed in widely known members of infraclass Teleostei, such as Danio rerio (zebrafish) and Oryzias latipes (medaka) [1,2,3]. However, despite the similarities between the biology of aging in fish and mammals, zebrafish and medaka have a strong regenerative ability and possible indeterminate growth [4]. In particular, the applicability of these species as a brain aging model has been questioned due to their ability to extensive adult neurogenesis and neuronal regeneration [5].
African annual fish of the genus Nothobranchius, so-called killifish, inhabit temporary pools filled during the monsoon season and are characterized by an extremely short life span. Nothobranchius fish is a novel promising model organism for aging research which reproduces many typical aspects of vertebrate brain aging, such as gliosis and decline of neurogenic activity in adults [6,7]. Another interesting feature of killifish in the context of comparative aging studies is the difference in the maximum life expectancy between species that could be associated with adaptation to different rain cycles in habitats [8]. Nothobranchius furzeri is the most investigated Nothobranchius species due to its shortest life span among the vertebrates. There are assembled genome and transcriptomes for several tissues of N. furzeri, including the brain [9]. Age-dependent changes in the brain transcriptome of N. furzeri have been recently described by Baumgart et al. [7]. On the other hand, not much is known about another Nothobranchius species, such as N. guentheri, which is considered the longest living species among the genus. The maximum laboratory life span described for N. guentheri was 2 years and 3 months [8], which is still much shorter compared to other popular vertebrate fish models, such as zebrafish with an average lifespan of 3 and a half years or medaka with a lifespan of around 4 years. One of the earliest fish models for aging research, N. guentheri, is responsive to pharmacological and lifestyle interventions and demonstrates changes in the expression of some age-related markers [10,11,12,13]. However, the changes taking place at the transcriptome level are not clearly understood.
In the present study, we performed de novo transcriptome assembly and analyzed the gene expression profile of brain tissue from adult N. guentheri. In addition, we were interested in studying the effect of a long-term food supplement with Torin 2 on the gene expression changes in the brain of N. guentheri. The mechanistic target of rapamycin (mTOR) is a highly evolutionarily preserved serine/threonine kinase. As a core component of two large functionally distinct multiprotein complexes termed mTORC1 (mTOR Complex 1) and mTORC2 (mTOR Complex 2), this kinase plays diverse roles in many cellular processes. Acting as a nutrient and energy sensor, mTORC1 promotes cell growth, ribosomal biogenesis, translation, and lipid synthesis in response to growth factors and nutrients. In addition, mTORC2 has been shown to regulate the cell survival and actin cytoskeleton organization [14]. In the brain, mTOR-regulated pathways are involved, among others, in specific processes, such as axonal sprouting, axonal regeneration, dendritic spine growth, and synaptic plasticity. Dysregulation of mTOR signaling is associated with the onset and progression of a broad range of brain disorders, including tumor, epilepsy, dementia, traumatic brain injury, and stroke [15,16]. Torin 2 is a highly selective, second generation ATP-competitive inhibitor of mTOR, that inhibits mTORC1-dependent T389 phosphorylation on serine/threonine kinase S6K. Unlike classical mTOR inhibitors, such as rapalogs, Torin 2 affects both mTORC1 and mTORC2 activity [17,18] and has a superior pharmacokinetic profile [19]. Our findings could contribute to better understanding transcriptomic changes associated with the inhibition of mTOR signaling in the adult brain using a novel vertebrate model, N. guentheri.

2. Materials and Methods

2.1. Fish Diet and Maintenance

The eggs of N. guentheri Zanzibar TAN 14-02 were obtained from a commercial supplier (Peter Covar, Brno, Czech Republic) and bred in the Center for Precision Genome Editing and Genetic Technologies for Biomedicine at the Engelhardt Institute of Molecular Biology. All N. guentheri experiments were carried out in accordance with the recommendations described in the Guide for the Care and Use of Laboratory Animals [20] and were approved by the Ethics Committee of the A.N. Severtsov Institute of Ecology and Evolution Russian Academy of Sciences (Experimental Research Regulatory Comission of Institute of Ecology and Evolution A.N. Severtsov, approval number 27, 9/10/2019). Torin 2 was synthesized and kindly provided by the Institute of Problems of Chemical Physics of Russian Academy of Sciences.
All the fish were bred under identical conditions after hatching. The fish were kept at 27 °C under 14:10 h day:night regime in a 1X E3 solution. To prepare an E3 stock solution (60X), 174 g NaCl, 8 g KCl, 29 g CaCl2, and 48.9 g MgCl2·6H2O were dissolved in 10 L distilled water. A week after hatching, the larvae were moved into the individual 1.5 L tanks. The feeding of fish larvae was carried out two times per day with newly hatched brine shrimp Artemia salina. At the age of sexual maturity (6 weeks), the fish were divided into experimental and control groups. The experimental group was switched to an experimental diet prepared as follows: An agarose gel (0.8%) containing Artemia salina nauplii and 1 mM Torin 2 was passed through a sieve with a mesh of approximately 1 mm2 for grinding. Each fish of the experimental group was fed twice a day with a freshly prepared experimental diet, so that the daily ration contained Torin 2 dose of 30 mg/kg of body weight. The uneaten agarose gel pieces were removed 30 min after addition to keep the water clean. Similarly, the control group was fed with shredded agarose gel pieces containing only Artemia salina nauplii.

2.2. RNA Isolation, Library Preparation, and Transcriptome Sequencing

Transcriptomic analysis was performed using N. guentheri at the age of 10 weeks. Thirty control (15 males and 15 females) and 33 experimental (18 males and 15 females) fish were prepared. Brains were dissected and stored at −80 °C until the RNA extraction. Experiments were performed at least in five replicates for each experimental variant. For convenience, the sample names were abbreviated (for example, NGF1E means N. guentheri, females, 1st replicate, experimental fish).
Total RNA was isolated from the pooled brain tissue samples (three brains per replicate) using the MagNA Pure Compact RNA Isolation Kit on a MagNA Pure Compact Instrument (Roche, Basel, Switzerland) according to the manufacturer’s protocol. The quantity of RNA was assessed using a Qubit®2.0 Fluorometer (Thermo Fisher Scientific, Waltham, MA, USA); quality control was carried out using a NanoDrop® ND-1000 spectrophotometer (NanoDrop Technologies Inc., Wilmington, DE, USA) and Agilent 2100 Bioanalyzer (Agilent Technologies, Santa Clara, CA, USA). The A260/A280 ratios of RNA samples were 1.8–2.0. The RNA integrity number (RIN) of each sample was not less than 8.0.
For the cDNA library preparation, we used an Illumina TruSeq RNA Library Prep Kit v2 (low-throughput protocol) according to the manufacturer’s guidelines. The mRNA molecules containing poly(A) tails were isolated from 1 μg of total RNA by the poly-T oligo-attached magnetic beads, fragmented, and primed for cDNA synthesis. The first strand cDNA synthesis was performed using SuperScript® II Reverse Transcriptase (Thermo Fisher Scientific, Waltham, MA, USA) and random primers. Then, cDNA was converted into the double-stranded (ds)cDNA and purified by AMPure XP beads. For the creation of blunt ends on the dscDNA, the end-repair reaction was performed. A single “A” nucleotide was added to the 3′ ends to avoid the ligation of blunt ends during the adapter ligation reaction. After the adapter ligation with RNA Adapter Indexes, supplied in the kit, the PCR (15 cycles) was performed to amplify the amount of DNA in the library. The concentration of the 21 obtained cDNA libraries was evaluated using a Qubit®2.0 Fluorometer. The quality was checked on an Agilent 2100 Bioanalyzer using a High Sensitivity DNA chip (Agilent Technologies). The cDNA libraries were normalized to 4 nM, pooled together in equal volumes, and sequenced with 75 bp single-end reads on the NextSeq 500 System (Illumina, San Diego, CA, USA). We obtained on average 25 million reads for each library. The sequencing data are available at the NCBI Sequence Read Archive (project ID PRJNA661435).

2.3. NGS Data Processing

The transcriptome assembly was performed with Trinity 2.9.0 [21] using Illumina reads derived from all 21 RNA-Seq libraries. The longest ORFs were predicted using TransDecoder 5.5.0. The annotation of assembled transcripts and ORFs was performed using the Trinotate 3.2.0 pipeline based on blastx/blastp mappings against UniProt and HMMER homology search against Pfam databases. From here, possible gene names, KEGG, and GO annotations were derived. The completeness of the transcriptome assembly was assessed with BUSCO 4.0.6 (in transcriptome mode) using four datasets: Eukaryota, metazoa, vertebrata, and actinopterygii (odb10).
Next, Illumina reads were mapped to the assembled transcripts using a bowtie2 [22] and quantified with RSEM [23]. The derived read counts per gene and per transcript were compared between the treatment and control groups with an edgeR Bioconductor package [24], separately for males and females, and pooled sex. The significance of differences observed between the two groups (control fish/Torin 2 treated fish) was assessed using a quasi-likelihood F-test and non-parametric Mann-Whitney U test (when the size of the groups allowed for this). Next, the Benjamini-Hochberg adjustment for multiple testing was applied to p-values to calculate the false discovery rate (FDR). The differences between groups were considered statistically significant if FDR was <0.05 and their magnitude was at least two-fold (|LogFC| ≥ 1). The GO enrichment analyses were performed using the goseq Bioconductor package. The KEGG pathway visualization was done using the pathview Bioconductor package.

3. Results

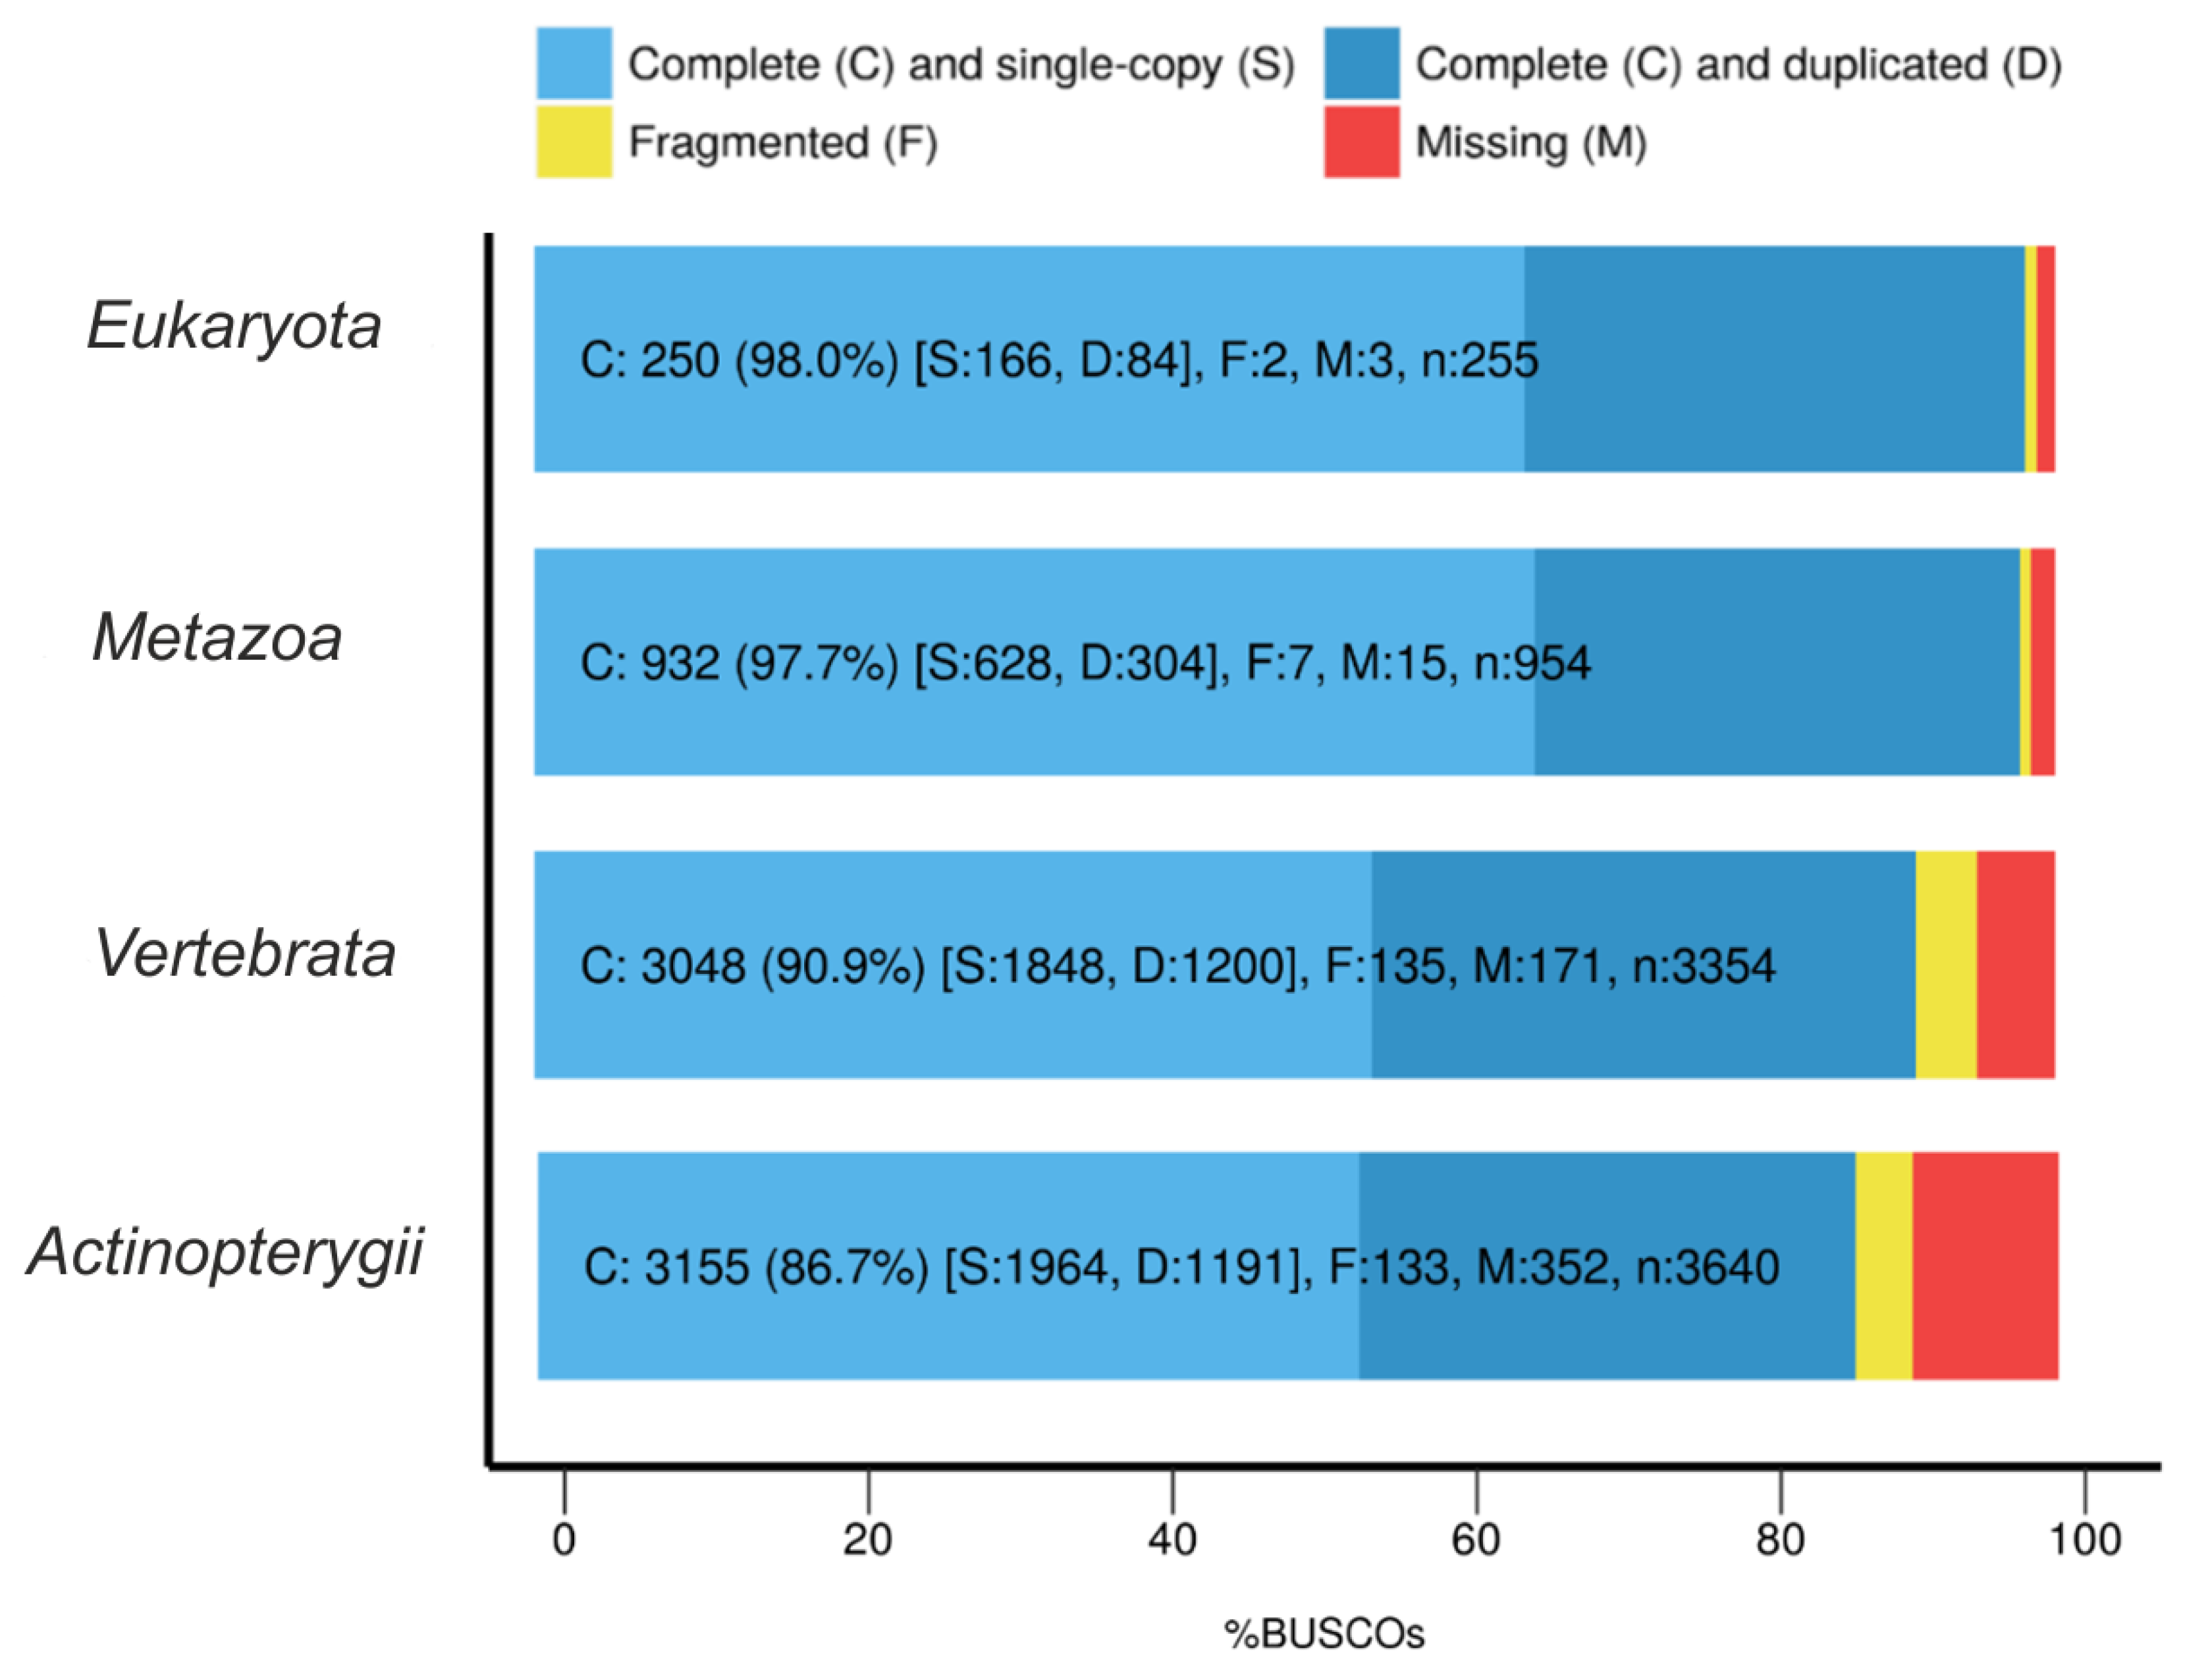
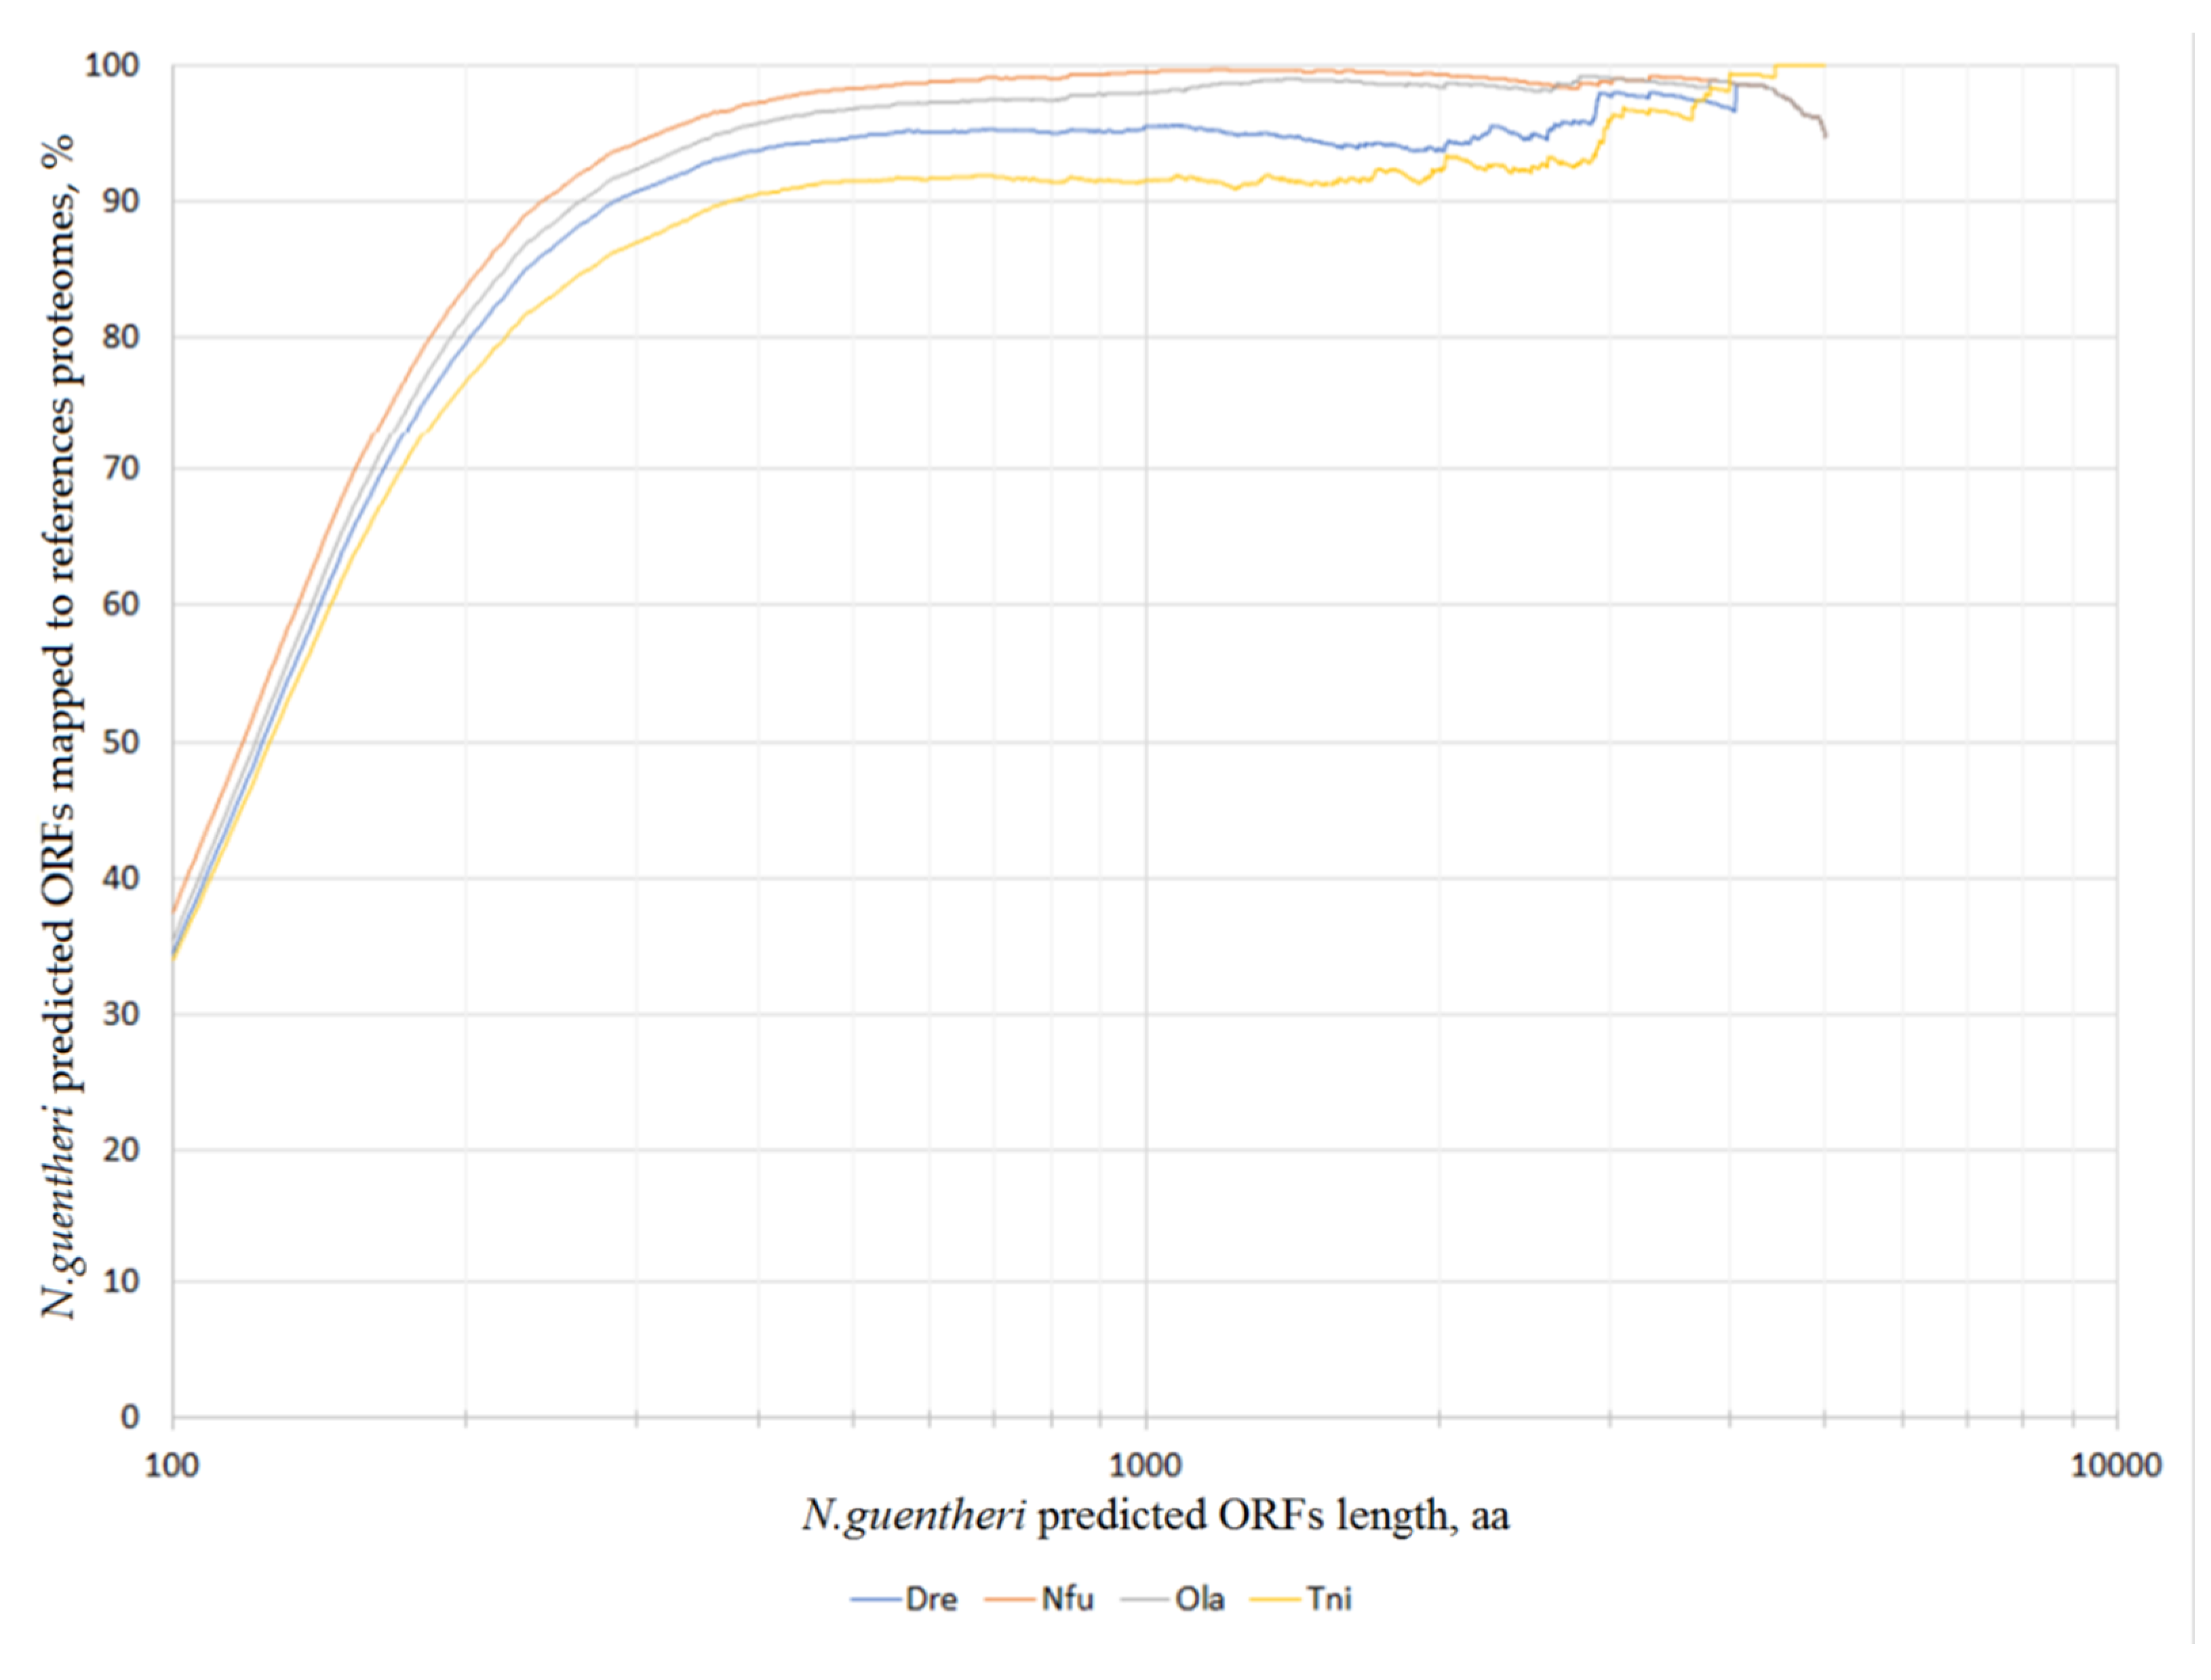
3.1. De Novo Transcriptome Assembly

A total of 536 million single-end Illumina reads (approximately 41 Gbases) were obtained from the 21 libraries derived from the samples of the male and female N. guenteri brain tissues. After trimming reads with trimmomatic, they were passed to the Trinity assembler. A total of 352,297 transcripts (i.e., contigs) corresponding to 288,989 potential genes (i.e., contig clusters) have been assembled. General assembly statistics are presented in Table 1.
The total number of genes with transcripts longer than 500 bp was 104,271. The largest assembled transcript size was 27,376 bp. The average GC content was approximately 47%. It is possible that such excess number of contigs (especially short) is due to the active transcription of intergenic spacers, intronic regions, including antisense or long non-coding RNAs. Possibly, they cannot be completely assembled even with such a high coverage (41 Gb), and are fragmented into several contigs. Indeed, from Figure 1 we see that most of the contigs are less than 500 bp (see also Table 1). Only 19% of contigs are >1000 bp and, therefore, can contain open reading frames (ORFs) encoding for proteins > 330 aa long.
The completeness of the transcriptome assembly was evaluated by BUSCO [25]. The derived values were different when using different reference BUSCO datasets (Figure 2). For the high-level datasets (Eukaryota and Metazoa), the completeness was found at 98%, but for the Vertebrata and Actinopterygii (ray-finned fish) datasets, the completeness was significantly less—only 91 and 87%, respectively. This is quite expected and most possibly due to the fact that we only used one tissue for the transcriptome assembly. High-level BUSCO datasets (Eukaryota and Metazoa) mostly include more conservative and “basic” genes compared to the Vertebrata and Actinopterygii datasets. As a rule, these genes are more constitutively expressed regardless of the tissue type (for example, housekeeping genes are both highly conservative and highly expressed in various tissues).
Thus, single-end Illumina sequencing was sufficient to obtain a de novo transcriptome of brain N.guentheri with reasonable quality for the following analysis.
Next, using blastp, we mapped the predicted protein sequences to the proteomes of four different fish species (belonging to different orders), whose genomes are available in the NCBI database [26]: Danio rerio (zebrafish), Oryzias latipes (Japanese medaka), Tetraodon nigroviridis (spotted green pufferfish), and Nothobranchius furzeri (turquoise killifish). The mapping statistics (depending on a minimal encoded protein length) is shown in Figure 3. Without setting a threshold for the minimal protein length, only 30% of ORF translations have an homology in the reference proteomes. However, as the threshold increases to 250–300 aa, about 90–95% of the proteins find their blast hits. For the most closely related species, N. furzeri, the percentage of ORFs with protein homology reaches 99% (with a threshold length of about 700 aa). This is quite expected, since this organism belongs to the same genus as the subject of the present study. In second place is O. latipes, and in third place is D. rerio, despite the fact that the last one is a popular model organism with a well-annotated genome. T. nigroviridis ranks fourth, this may be linked to a lower quality of the genome assembly or annotation.

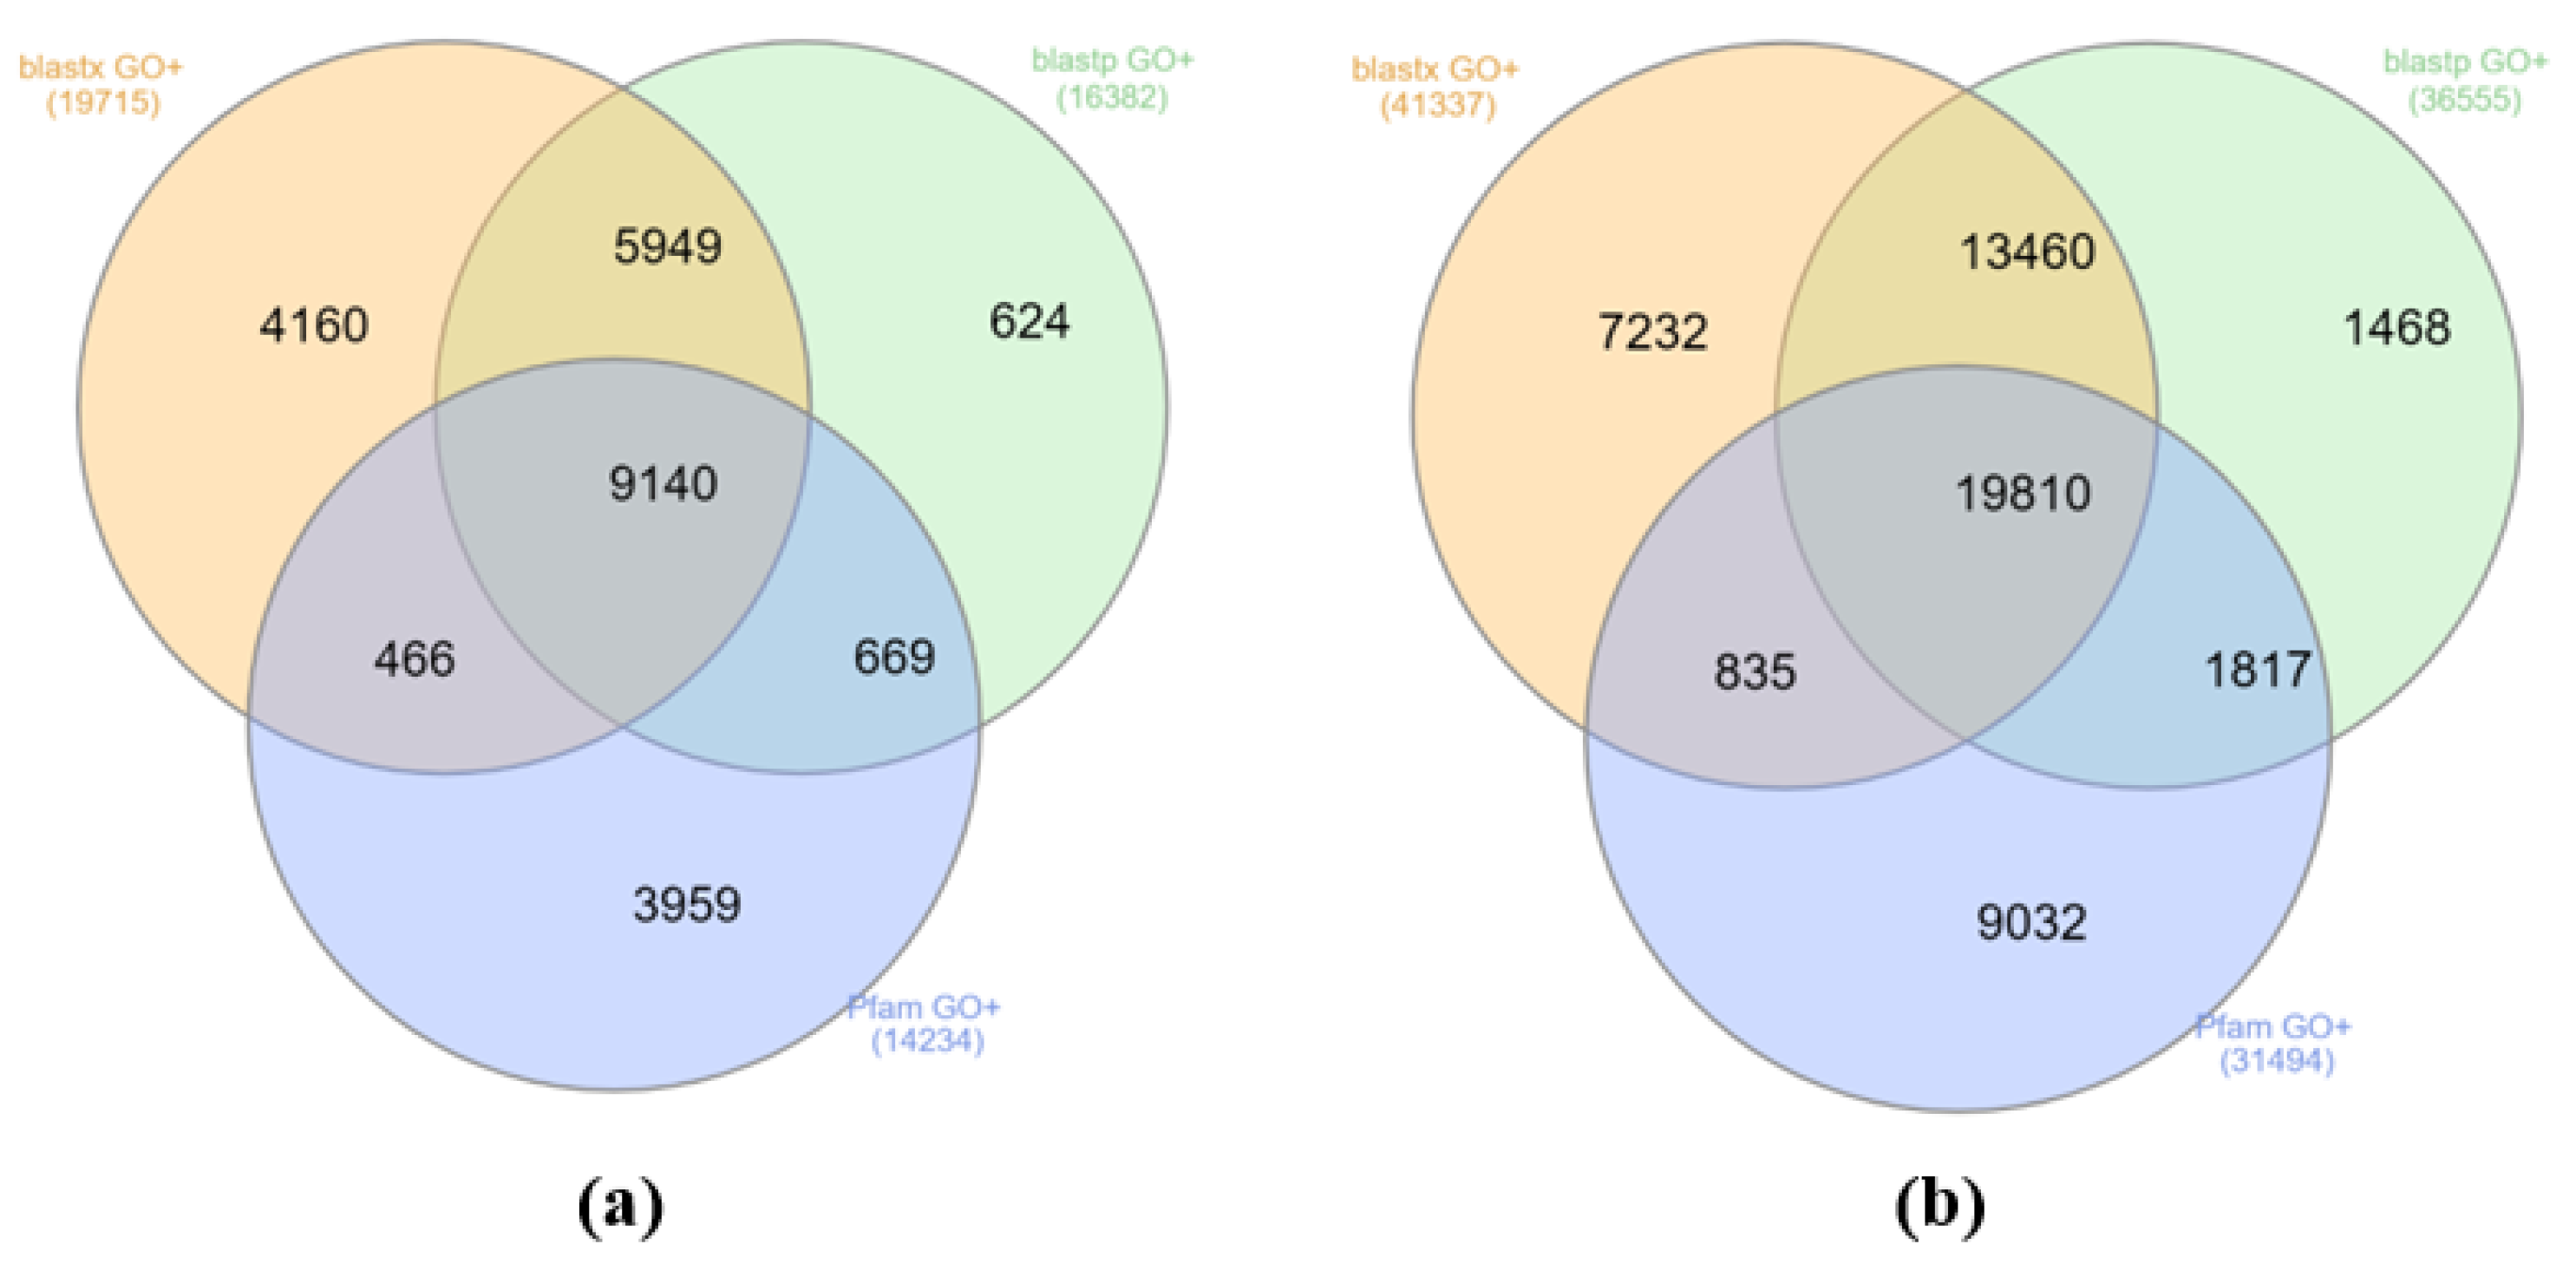
3.2. Transcriptome Annotation

Using TransDecoder (http://transdecoder.github.io, last accessed on 10 February 2021), for 352,297 transcripts we found 163,185 ORFs with an average translated length of 271.1 aa, while the maximum length was 8786 aa. Of these, 115,024 proteins (70.5%) begin with a start codon and have a stop codon at the end (e.g., are completed), 26,294 proteins (16.1%) are under-assembled at the 5′-end of the transcript (do not have methionine at the beginning), 11,585 proteins (7.1%) do not have a stop codon (are most possibly under-assembled in the 3′-tail of the transcript), 10,281 proteins (6.3%) have neither one nor the other.
Among the 352,298 potential transcripts, which correspond to 288,989 potential genes, for 10,990 genes (5392 transcripts) there were at least one valid homology in the Pfam database [27], 10,151 genes (5672 transcripts) were successfully mapped against UniProt [28] with blastx [29], and 10,517 genes (5239 transcripts) were mapped with blastp [29].
Additionally, 23,924 genes (52,566 transcripts) were mapped against the eggNOG database, 15,084 genes were assigned with the Kyoto Encyclopedia of Genes and Genomes (KEGG; including 3130 pathways from D. rerio, 18,884—KEGG Orthology pathways), 31,817 corresponding transcripts were assigned with KEGG (including 6712 pathways from D. rerio, 41,560—KEGG Orthology pathways). For 24,967 genes (53,654 transcripts), they were derived with at least one Gene Ontology (GO) annotation based on UniProt mapping or Pfam-A search (Figure 4).
Figure 4 shows that all three search methods complement each other. Only for 36% the genes homology was detected by all three search methods at once. In general, blastx proved to be a more informative tool compared to blastp, since the search for blastx resulted in approximately 20% more homologies among UniProt compared to blastp. However, some of the homologies (2–3%) were detected only by blastp.
Moreover, 24,967 transcripts matched at least one GO term in the three major categories that were considered: Biological processes, molecular functions, and cellular components (Supplementary file 1).

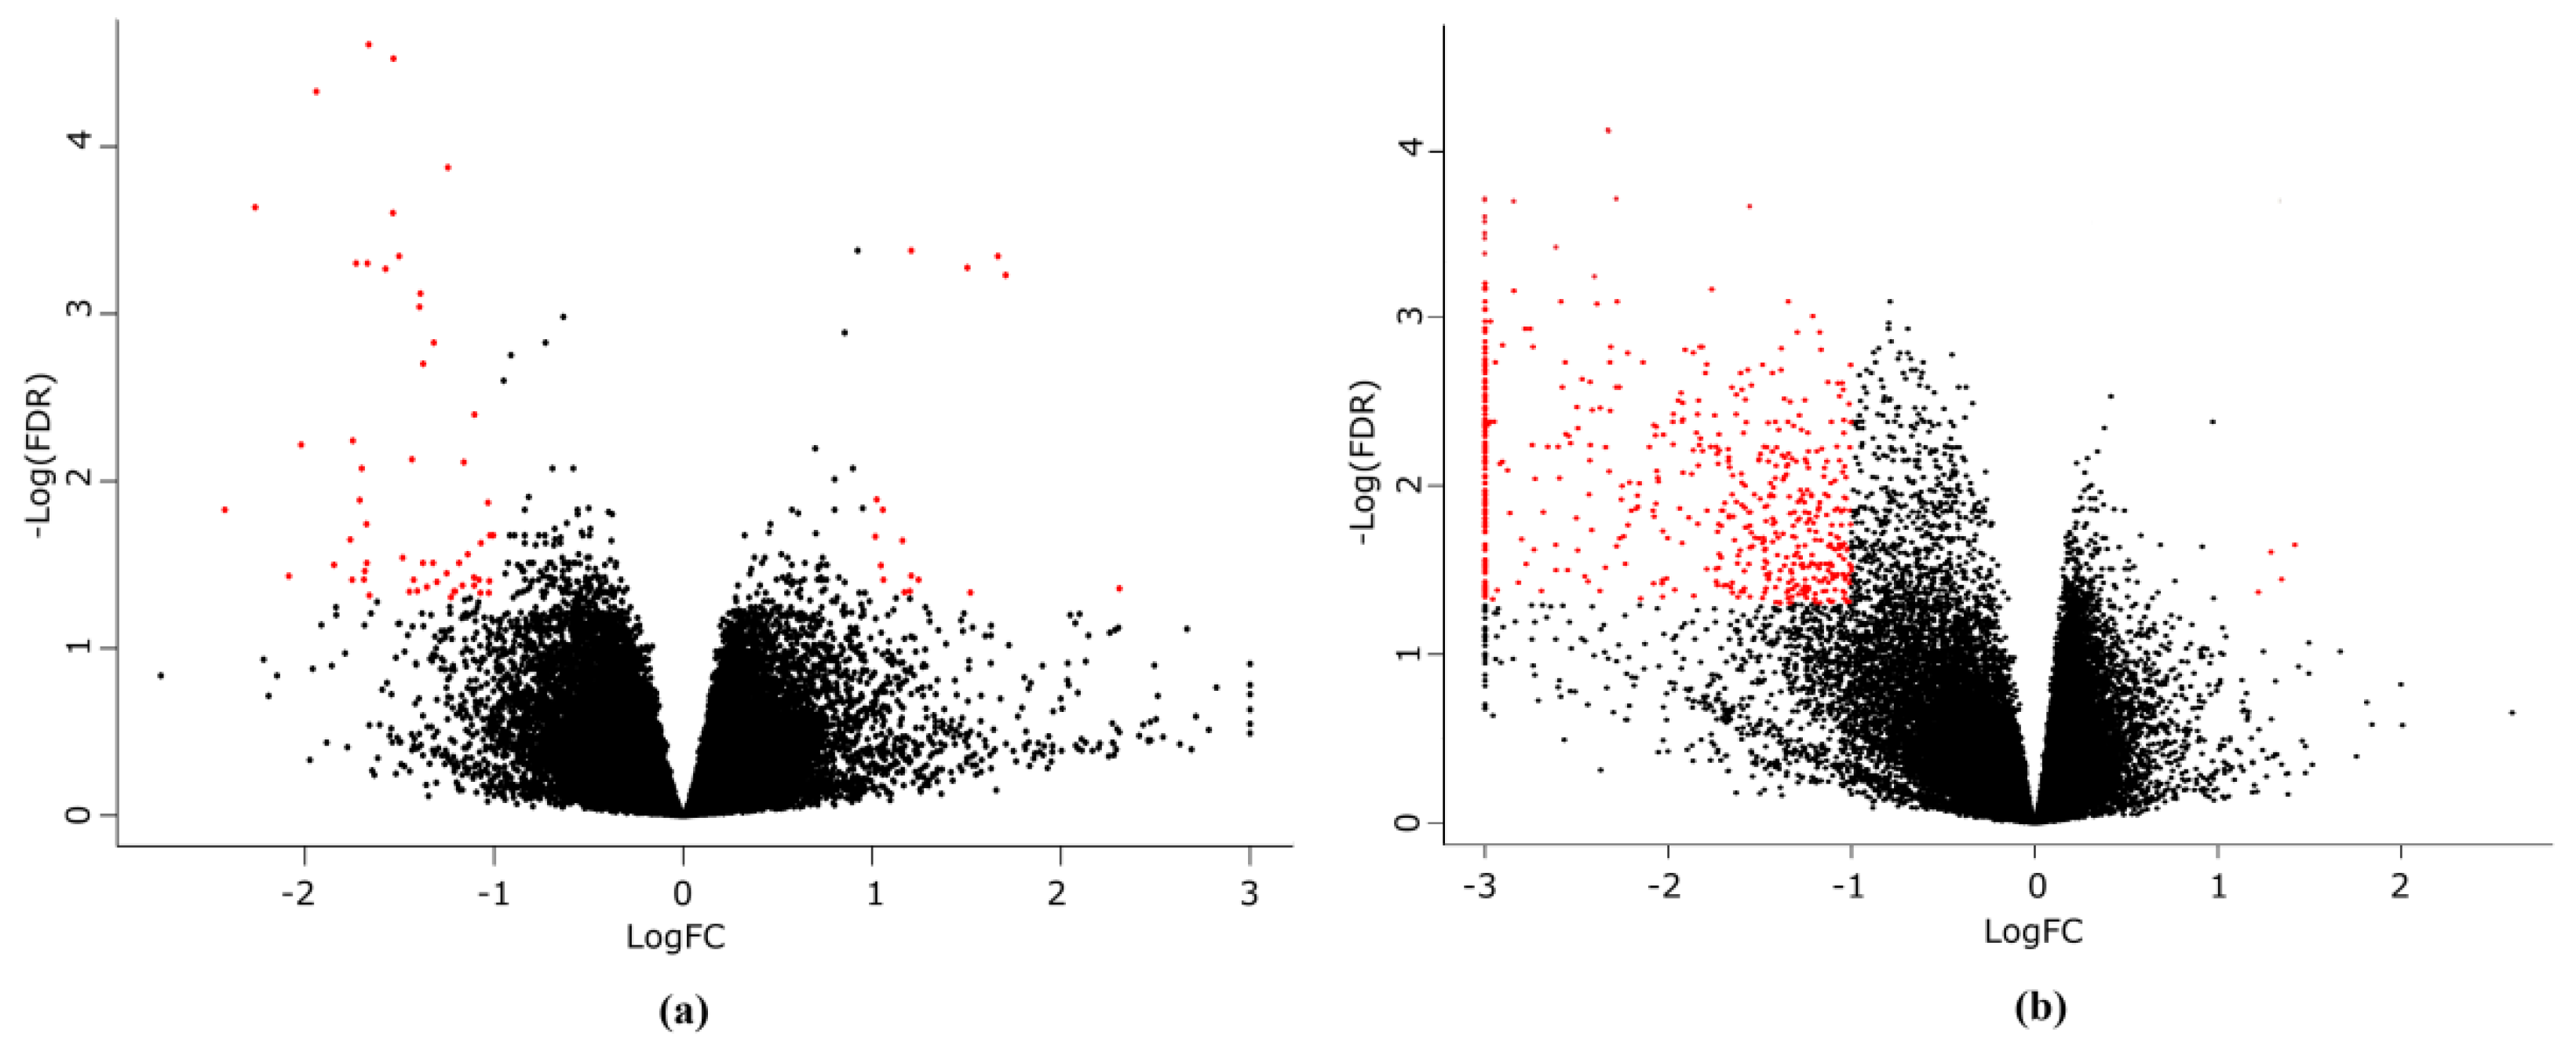
3.3. Gene Expression Changes Associated with the Torin 2 Treatment

Next, we analyzed the effects of the Torin 2 treatment on the brain transcriptome of N. guentheri. Separate comparisons within males and females groups demonstrated that the changes in gene expression profiles caused by Torin 2 are much more pronounced in females than in males (Figure 5, Supplementary file 2). A total of 1491 transcripts (FDR < 0.05) showed differential expression in females in response to a diet with Torin 2 (363 of them had a BLAST hit in the UniProt database), while only 279 differentially expressed transcripts (108 of them had a BLAST hit in the UniProt database) were detected in males.
Among the differentially expressed genes (DEGs) in males that passed the statistical significance (FDR < 0.05) and |LogFC| ≥ 1 thresholds, we detected a variety of genes involved in the regulation of the circadian rhythm such as RORB, NFIL3, NR1D1, CIPC, DBP, BHE41, and TEF. The Torin 2 treatment also altered the expression of several genes associated with the immune response (DRA, HMR1, and HG2A) and proteolytic processes (CATS and CATK). The list of genes with a significantly changed expression in males is provided in Table 2.
In females, Torin 2 most influenced the expression of genes associated with mobile elements (RTL1, PEG10, PO22, LITD1, and YTX1/2). Most of these genes were downregulated under the Torin 2 diet. Moreover, specifically in females, the genes encoding for BED-type zinc finger domain-containing proteins (ZBED1, ZBED4, and ZBED9), which are mostly related to cell proliferation and originate from domesticated hAT DNA transposons and contribute to the regulation of various function in vertebrates, were downregulated in the Torin 2 treated group [30,31]. In addition, among the downregulated genes, we observed genes encoding the members of the protocadherin gene cluster (PCDB1, PCDHGA, PCDHGB, PCDHD2, and PCDHGC). The list of genes with significantly changed expression in females that passed the FDR < 0.05 threshold are provided in Table 3.
Predictably, many DEGs in response to the Torin 2 treatment were highly enriched in GO terms associated with the translation and cellular metabolism, including macromolecule, protein, and RNA metabolic processes. The gene set enrichment analysis also revealed alterations in “DNA binding” and “regulation of dendritic spine maintenance” GO terms. In males, we observed the downregulation of MHC protein complex genes, while in females, no statistically significant changes in this pathway were found. In females, several genes related to the regulation of muscle adaptation and multiple pathways associated with transposition were decreased. A complete list of enriched GO terms and direction of the changes in gene expression are presented in Supplementary file 2.
Surprisingly, we revealed that the top DEGs made up several hundred genes that do not have UniProt annotations and mostly have short transcripts <1000 bp. These genes were characterized by a high expression in control females, slightly lower—in control males, and very low (up to ten times lower)—in Torin 2 treated males and females. Compared to the annotated genes, they had a lower, but not much, “absolute” level of expression (average LogCPM was 4.3 for unannotated top DEGs and 5.4 for annotated ones).

4. Discussion

Neural tissues are characterized by extremely high metabolic requirements in comparison with other tissues [32,33]. The mTOR signaling, involved in controlling the balance between anabolic and catabolic processes, plays a critical role in maintaining the homeostasis of brain cells [15,34]. On the one hand, the mTOR activity is essential to neurogenesis, dendrite formation, synaptic formation, and plasticity [35]. Downregulation of mTOR signaling has been found in several models of the CNS neuron injury [15]. On the other hand, over-activation of mTOR complexes leads to a neurodevelopmental disorder, such as tuberous sclerosis (TS) and several neurodegenerative diseases, including Alzheimer’s, Parkinson’s, and Huntington’s diseases [36,37,38]. In these cases, the mTOR inhibition seems to be a reasonable strategy for treating brain pathologies. Previous studies of several models of neurodegenerative disorders have demonstrated that neuroprotective actions of mTOR inhibitors can be a result from the activation of autophagic processes and lysosomal biogenesis [39,40,41].
In the current work, we found that the Torin 2 treatment led to a slight increase in the expression of ATG9A, ATG2A, ATG16, ATG4B, ATG12, SQSTM1, and ULK1 genes involved in autophagy and affected the activity of lysosomal proteases. A significant increase in the expression of cathepsins family genes (CATS and CATK) was also observed. Cathepsin K, encoded by the CATK, is a lysosomal cysteine protease which has been widely studied in the context of bone resorption [42]. Cathepsin K has been also shown to be present in the brain parenchyma and choroid plexus [43,44]. A deficiency in this cysteine protease leads to learning and memory deficits and can be associated with pathophysiology of schizophrenia and related neuropsychiatric disorders [44,45]. Cathepsin S encoded by the CATS, is a microglia-specific cysteine protease which is involved in the antigen presentation and is essential for the brain immune response [46]. Indeed, among the genes, in the expression which was altered in response to the Torin 2 treatment, we identified that HG2A, HMR1, and DRA were related to the major histocompatibility complex class II (MHC II). Moreover, the pathway enrichment analysis revealed the modulation of antigen processing and presentation, and NF-kappa B signaling pathway. Although the brain is regarded as an immuno-privileged site due to the muted inflammatory response, there is an accumulated evidence that immune signaling at the brain barriers may be contributing normal as well as pathological processes [47]. It was previously shown that the treatment with the mTOR inhibitor rapamycin not only promotes CD8 memory T cells development, but also improves the quality of memory CD8 T cells [48,49,50]. Our findings are consistent with Xu et al., who showed that this effect may be mediated by an increased autophagy activity due to the inhibition of the mTOR pathway [51]. However, in the present work, we observed that the effect of Torin 2 was strongly gender-specific.
Surprisingly, we found that the Torin 2 treatment led to a decrease in the expression of many genes involved in the transposition of transposable elements (TEs). Accumulating evidence suggests that TEs can be transcribed and mobilized both in the developing brain and during adult neurogenesis [52,53]. Aberrant TE activation, in particular, activation of LINE-1, has been hypothesized to be a cause of somatic mosaicism in the brain and can be involved in the pathogenesis of both neurodevelopmental and neurodegenerative disorders, such as cerebellar ataxia, Rett syndrome, schizophrenia, and depression [54,55].
Our results also imply the role of Torin 2 in the regulation of dendritic spine maintenance. Dendritic spines are the structures critical for synaptic plasticity and behavior [56]. The members of the γ-Protocadherin (Pcdh) gene cluster involved in dendritic spine growth and neuronal dynamics were downregulated. Protocadherins are essential for the function of specific cell-cell neural connections and contribute to the survival of multiple neuronal cell types [57,58,59]. According to recent research, the loss of Pcdhs in cortical neurons does not affect their survival or result in reduced synaptic density, but severely reduces dendritic arborization [60].

5. Conclusions

In conclusion, the present study provides the first brain transcriptomic view of adult fish N. guentheri. In addition, owing to the fundamental role of mTOR in the functioning of brain cells, we assessed the transcriptomic profile in the brain tissue of fish N. guentheri under modulation of the mTOR pathway using the mTOR inhibitor Torin 2. Our results show that a long-term food supplement with Torin 2 leads to changes in the expression of many genes involved in the regulation of dendritic spine maintenance, various metabolic processes, circadian rhythms, transposition, autophagy, and immune response. However, the effect of Torin 2 was strongly gender-specific. Thus, the results of the study allow a better understanding of the possible molecular mechanisms in vertebrate brains. Moreover, considering species-specific differences in the genus of Nothobrancius, obtained RNA-Seq data can be further used in comparative aging research.

Supplementary Materials

The following are available online at https://www.mdpi.com/2075-1729/11/2/137/s1. Supplementary file 1: GO classification of transcripts (genes) from N. guentheri brain tissue; Supplementary file 2: The list of enriched pathways (p-value for gene ontology GSEA < 0.05) of differentially expressed genes associated with the Torin 2 treatment in females and males of Nothobranchius guentheri.

Author Contributions

Conceptualization, Z.G.G. and A.V.K.; methodology, M.S.F. and A.B.K.; software, G.S.K.; validation, N.S.G., A.T.T., and V.V.V.; formal analysis, I.R.B. and G.S.K.; investigation, Z.G.G.; resources, Y.S.V. and A.B.K.; data curation, A.V.L. and E.A.P.; writing—original draft preparation, M.S.F.; writing—review and editing, Z.G.G.; visualization, V.S.P.; supervision, M.S.F.; project administration, A.A.M.; funding acquisition, E.Y.K. and A.V.K. All authors have read and agreed to the published version of the manuscript.

Funding

This work was supported by the Ministry of Science and Higher Education of the Russian Federation, grant no. 075-15-2019-1660.

Institutional Review Board Statement

All the N. guentheri experiments were carried out in accordance with the recommendations described in the Guide for the Care and Use of Laboratory Animals [20] and approved by the Ethics Committee of the A.N. Severtsov Institute of Ecology and Evolution Russian Academy of Sciences (Experimental Research Regulatory Comission of Institute of Ecology and Evolution A.N. Severtsov, approval number 27, 9/10/2019).

Informed Consent Statement

Not applicable.

Data Availability Statement

NCBI sequence read archive (project ID PRJNA661435).

Acknowledgments

This work was performed using the equipment(s) at EIMB RAS “Genome” center (http://www.eimb.ru/rus/ckp/ccu_genome_c.php).

Conflicts of Interest

The authors declare no conflict of interest.

References

  1. Dilan Celebi-Birand, B.E.; Ozdemir, A.T.; Kafaligonul, H.; Adams, M. Zebra Aging Models and Possible Interventions. In Recent Advances in Zebrafish Researches; Bozkurt, Y., Ed.; IntechOpen: London, UK, 2018; Volume 1. [Google Scholar]
  2. Ding, L.; Kuhne, W.W.; Hinton, D.E.; Song, J.; Dynan, W.S. Quantifiable biomarkers of normal aging in the Japanese medaka fish (Oryzias latipes). PLoS ONE 2010, 5, e13287. [Google Scholar] [CrossRef] [PubMed]
  3. Conn, P.M. Conn’s Handbook of Models for Human Aging SECOND EDITION Preface. In Conn’s Handbook of Models for Human Aging, 2nd ed.; Academic Press Inc.: Cambridge, MA, USA, 2018; p. Xvii. [Google Scholar]
  4. Matrone, G.; Tucker, C.S.; Denvir, M.A. Cardiomyocyte proliferation in zebrafish and mammals: Lessons for human disease. Cell. Mol. Life Sci. Cmls 2017, 74, 1367–1378. [Google Scholar] [CrossRef] [Green Version]
  5. Schmidt, R.; Strahle, U.; Scholpp, S. Neurogenesis in zebrafish—From embryo to adult. Neural Dev. 2013, 8, 3. [Google Scholar] [CrossRef] [PubMed] [Green Version]
  6. Kelmer Sacramento, E.; Kirkpatrick, J.M.; Mazzetto, M.; Baumgart, M.; Bartolome, A.; Di Sanzo, S.; Caterino, C.; Sanguanini, M.; Papaevgeniou, N.; Lefaki, M.; et al. Reduced proteasome activity in the aging brain results in ribosome stoichiometry loss and aggregation. Mol. Syst. Biol. 2020, 16, e9596. [Google Scholar] [CrossRef]
  7. Baumgart, M.; Groth, M.; Priebe, S.; Savino, A.; Testa, G.; Dix, A.; Ripa, R.; Spallotta, F.; Gaetano, C.; Ori, M.; et al. RNA-seq of the aging brain in the short-lived fish N. furzeri—conserved pathways and novel genes associated with neurogenesis. Aging Cell 2014, 13, 965–974. [Google Scholar] [CrossRef] [PubMed]
  8. Lucas-Sanchez, A.; Almaida-Pagan, P.F.; Mendiola, P.; de Costa, J. Nothobranchius as a model for aging studies. A review. Aging Dis. 2014, 5, 281–291. [Google Scholar] [CrossRef]
  9. Reichard, M.; Polacik, M. Nothobranchius furzeri, an ‘instant’ fish from an ephemeral habitat. eLife 2019, 8. [Google Scholar] [CrossRef] [PubMed]
  10. Wang, X.; Shang, X.; Luan, J.; Zhang, S. Identification, expression and function of apolipoprotein E in annual fish Nothobranchius guentheri: Implication for an aging marker. Biogerontology 2014, 15, 233–243. [Google Scholar] [CrossRef]
  11. Liu, C.; Wang, X.; Feng, W.; Li, G.; Su, F.; Zhang, S. Differential expression of aging biomarkers at different life stages of the annual fish Nothobranchius guentheri. Biogerontology 2012, 13, 501–510. [Google Scholar] [CrossRef] [PubMed]
  12. Yu, X.; Li, G. Effects of resveratrol on longevity, cognitive ability and aging-related histological markers in the annual fish Nothobranchius guentheri. Exp. Gerontol. 2012, 47, 940–949. [Google Scholar] [CrossRef]
  13. Dong, Y.; Cui, P.; Li, Z.; Zhang, S. Aging asymmetry: Systematic survey of changes in age-related biomarkers in the annual fish Nothobranchius guentheri. Fish Physiol. Biochem. 2017, 43, 309–319. [Google Scholar] [CrossRef] [PubMed]
  14. Saxton, R.A.; Sabatini, D.M. mTOR Signaling in Growth, Metabolism, and Disease. Cell 2017, 168, 960–976. [Google Scholar] [CrossRef] [PubMed] [Green Version]
  15. Bockaert, J.; Marin, P. mTOR in Brain Physiology and Pathologies. Physiol. Rev. 2015, 95, 1157–1187. [Google Scholar] [CrossRef] [PubMed]
  16. Ryskalin, L.; Lazzeri, G.; Flaibani, M.; Biagioni, F.; Gambardella, S.; Frati, A.; Fornai, F. mTOR-Dependent Cell Proliferation in the Brain. Biomed. Res. Int. 2017, 2017, 7082696. [Google Scholar] [CrossRef]
  17. Schenone, S.; Brullo, C.; Musumeci, F.; Radi, M.; Botta, M. ATP-competitive inhibitors of mTOR: An update. Curr. Med. Chem. 2011, 18, 2995–3014. [Google Scholar] [CrossRef]
  18. Bonazzi, S.; Goold, C.P.; Gray, A.; Thomsen, N.M.; Nunez, J.; Karki, R.G.; Gorde, A.; Biag, J.D.; Malik, H.A.; Sun, Y.; et al. Discovery of a Brain-Penetrant ATP-Competitive Inhibitor of the Mechanistic Target of Rapamycin (mTOR) for CNS Disorders. J. Med. Chem. 2020, 63, 1068–1083. [Google Scholar] [CrossRef] [PubMed]
  19. Wang, C.; Wang, X.; Su, Z.; Fei, H.; Liu, X.; Pan, Q. The novel mTOR inhibitor Torin-2 induces autophagy and downregulates the expression of UHRF1 to suppress hepatocarcinoma cell growth. Oncol. Rep. 2015, 34, 1708–1716. [Google Scholar] [CrossRef] [Green Version]
  20. Garber, J.C.; Barbee, R.W. Guide for the Care and Use of Laboratory Animalsl: Eighth Edition; The National Academies Press: Washington, DC, USA, 2011. [Google Scholar] [CrossRef]
  21. Grabherr, M.G.; Haas, B.J.; Yassour, M.; Levin, J.Z.; Thompson, D.A.; Amit, I.; Adiconis, X.; Fan, L.; Raychowdhury, R.; Zeng, Q.; et al. Full-length transcriptome assembly from RNA-Seq data without a reference genome. Nat. Biotechnol. 2011, 29, 644–652. [Google Scholar] [CrossRef] [Green Version]
  22. Langmead, B.; Salzberg, S.L. Fast gapped-read alignment with Bowtie 2. Nat. Methods 2012, 9, 357–359. [Google Scholar] [CrossRef] [Green Version]
  23. Li, B.; Dewey, C.N. RSEM: Accurate transcript quantification from RNA-Seq data with or without a reference genome. BMC Bioinform. 2011, 12, 323. [Google Scholar] [CrossRef] [Green Version]
  24. Robinson, M.D.; McCarthy, D.J.; Smyth, G.K. edgeR: A Bioconductor package for differential expression analysis of digital gene expression data. Bioinformatics 2010, 26, 139–140. [Google Scholar] [CrossRef] [Green Version]
  25. Waterhouse, R.M.; Seppey, M.; Simao, F.A.; Manni, M.; Ioannidis, P.; Klioutchnikov, G.; Kriventseva, E.V.; Zdobnov, E.M. BUSCO Applications from Quality Assessments to Gene Prediction and Phylogenomics. Mol. Biol. Evol. 2018, 35, 543–548. [Google Scholar] [CrossRef] [PubMed] [Green Version]
  26. Sayers, E.W.; Agarwala, R.; Bolton, E.E.; Brister, J.R.; Canese, K.; Clark, K.; Connor, R.; Fiorini, N.; Funk, K.; Hefferon, T.; et al. Database resources of the National Center for Biotechnology Information. Nucleic Acids Res. 2019, 47, D23–D28. [Google Scholar] [CrossRef] [Green Version]
  27. El-Gebali, S.; Mistry, J.; Bateman, A.; Eddy, S.R.; Luciani, A.; Potter, S.C.; Qureshi, M.; Richardson, L.J.; Salazar, G.A.; Smart, A.; et al. The Pfam protein families database in 2019. Nucleic Acids Res. 2019, 47, D427–D432. [Google Scholar] [CrossRef] [PubMed]
  28. UniProt, C. UniProt: A worldwide hub of protein knowledge. Nucleic Acids Res. 2019, 47, D506–D515. [Google Scholar] [CrossRef] [Green Version]
  29. Madden, T.L. The BLAST sequence analysis tool. In NCBI Handbook; McEntyre, J.O., Ed.; National Library of Medicine: Bethesda, MD, USA, 2005. [Google Scholar]
  30. Kroj, T.; Chanclud, E.; Michel-Romiti, C.; Grand, X.; Morel, J.B. Integration of decoy domains derived from protein targets of pathogen effectors into plant immune receptors is widespread. New Phytol. 2016, 210, 618–626. [Google Scholar] [CrossRef]
  31. Hayward, A.; Ghazal, A.; Andersson, G.; Andersson, L.; Jern, P. ZBED evolution: Repeated utilization of DNA transposons as regulators of diverse host functions. PLoS ONE 2013, 8, e59940. [Google Scholar] [CrossRef] [Green Version]
  32. Jha, M.K.; Morrison, B.M. Glia-neuron energy metabolism in health and diseases: New insights into the role of nervous system metabolic transporters. Exp. Neurol. 2018, 309, 23–31. [Google Scholar] [CrossRef]
  33. Wallace, R. High metabolic demand in neural tissues: Information and control theory perspectives on the synergism between rate and stability. J. Theor. Biol. 2016, 409, 86–96. [Google Scholar] [CrossRef] [PubMed]
  34. Kim, J.; Guan, K.L. mTOR as a central hub of nutrient signalling and cell growth. Nat. Cell Biol. 2019, 21, 63–71. [Google Scholar] [CrossRef]
  35. LiCausi, F.; Hartman, N.W. Role of mTOR Complexes in Neurogenesis. Int. J. Mol. Sci. 2018, 19, 1544. [Google Scholar] [CrossRef] [Green Version]
  36. Swiech, L.; Perycz, M.; Malik, A.; Jaworski, J. Role of mTOR in physiology and pathology of the nervous system. Biochim. Et Biophys. Acta 2008, 1784, 116–132. [Google Scholar] [CrossRef] [PubMed]
  37. Perez-Alvarez, M.J.; Villa Gonzalez, M.; Benito-Cuesta, I.; Wandosell, F.G. Role of mTORC1 Controlling Proteostasis after Brain Ischemia. Front. Neurosci. 2018, 12, 60. [Google Scholar] [CrossRef] [PubMed]
  38. Oddo, S. The role of mTOR signaling in Alzheimer disease. Front. Biosci. 2012, 4, 941–952. [Google Scholar] [CrossRef] [PubMed] [Green Version]
  39. Li, X.G.; Du, J.H.; Lu, Y.; Lin, X.J. Neuroprotective effects of rapamycin on spinal cord injury in rats by increasing autophagy and Akt signaling. Neural Regen. Res. 2019, 14, 721–727. [Google Scholar] [CrossRef] [PubMed]
  40. Zhu, Z.; Yang, C.; Iyaswamy, A.; Krishnamoorthi, S.; Sreenivasmurthy, S.G.; Liu, J.; Wang, Z.; Tong, B.C.; Song, J.; Lu, J.; et al. Balancing mTOR Signaling and Autophagy in the Treatment of Parkinson’s Disease. Int. J. Mol. Sci. 2019, 20, 728. [Google Scholar] [CrossRef] [PubMed] [Green Version]
  41. Dunlop, E.A.; Tee, A.R. mTOR and autophagy: A dynamic relationship governed by nutrients and energy. Semin. Cell Dev. Biol. 2014, 36, 121–129. [Google Scholar] [CrossRef] [PubMed]
  42. Bromme, D.; Panwar, P.; Turan, S. Cathepsin K osteoporosis trials, pycnodysostosis and mouse deficiency models: Commonalities and differences. Expert Opin. Drug Discov. 2016, 11, 457–472. [Google Scholar] [CrossRef] [PubMed]
  43. Haeckel, C.; Krueger, S.; Buehling, F.; Broemme, D.; Franke, K.; Schuetze, A.; Roese, I.; Roessner, A. Expression of cathepsin K in the human embryo and fetus. Dev. Dyn. Off. Publ. Am. Assoc. Anat. 1999, 216, 89–95. [Google Scholar] [CrossRef]
  44. Bernstein, H.G.; Bukowska, A.; Dobrowolny, H.; Bogerts, B.; Lendeckel, U. Cathepsin K and schizophrenia. Synapse 2007, 61, 252–253. [Google Scholar] [CrossRef]
  45. Dauth, S.; Sirbulescu, R.F.; Jordans, S.; Rehders, M.; Avena, L.; Oswald, J.; Lerchl, A.; Saftig, P.; Brix, K. Cathepsin K deficiency in mice induces structural and metabolic changes in the central nervous system that are associated with learning and memory deficits. BMC Neurosci. 2011, 12, 74. [Google Scholar] [CrossRef] [PubMed] [Green Version]
  46. Wendt, W.; Lubbert, H.; Stichel, C.C. Upregulation of cathepsin S in the aging and pathological nervous system of mice. Brain Res. 2008, 1232, 7–20. [Google Scholar] [CrossRef]
  47. Stolp, H.B.; Liddelow, S.A.; Sa-Pereira, I.; Dziegielewska, K.M.; Saunders, N.R. Immune responses at brain barriers and implications for brain development and neurological function in later life. Front. Integr. Neurosci. 2013, 7, 61. [Google Scholar] [CrossRef] [Green Version]
  48. Powell, J.D.; Pollizzi, K.N.; Heikamp, E.B.; Horton, M.R. Regulation of immune responses by mTOR. Annu. Rev. Immunol. 2012, 30, 39–68. [Google Scholar] [CrossRef] [PubMed] [Green Version]
  49. Araki, K.; Turner, A.P.; Shaffer, V.O.; Gangappa, S.; Keller, S.A.; Bachmann, M.F.; Larsen, C.P.; Ahmed, R. mTOR regulates memory CD8 T-cell differentiation. Nature 2009, 460, 108–112. [Google Scholar] [CrossRef] [PubMed] [Green Version]
  50. Pearce, E.L.; Walsh, M.C.; Cejas, P.J.; Harms, G.M.; Shen, H.; Wang, L.S.; Jones, R.G.; Choi, Y. Enhancing CD8 T-cell memory by modulating fatty acid metabolism. Nature 2009, 460, 103–107. [Google Scholar] [CrossRef] [PubMed]
  51. Xu, X.; Araki, K.; Li, S.; Han, J.H.; Ye, L.; Tan, W.G.; Konieczny, B.T.; Bruinsma, M.W.; Martinez, J.; Pearce, E.L.; et al. Autophagy is essential for effector CD8(+) T cell survival and memory formation. Nat. Immunol. 2014, 15, 1152–1161. [Google Scholar] [CrossRef] [PubMed] [Green Version]
  52. Li, W.; Prazak, L.; Chatterjee, N.; Gruninger, S.; Krug, L.; Theodorou, D.; Dubnau, J. Activation of transposable elements during aging and neuronal decline in Drosophila. Nat. Neurosci. 2013, 16, 529–531. [Google Scholar] [CrossRef] [PubMed] [Green Version]
  53. Jonsson, M.E.; Garza, R.; Johansson, P.A.; Jakobsson, J. Transposable Elements: A Common Feature of Neurodevelopmental and Neurodegenerative Disorders. Trends Genet. Tig. 2020, 36, 610–623. [Google Scholar] [CrossRef]
  54. Suarez, N.A.; Macia, A.; Muotri, A.R. LINE-1 retrotransposons in healthy and diseased human brain. Dev. Neurobiol. 2018, 78, 434–455. [Google Scholar] [CrossRef] [PubMed]
  55. Bodea, G.O.; McKelvey, E.G.Z.; Faulkner, G.J. Retrotransposon-induced mosaicism in the neural genome. Open Biol. 2018, 8. [Google Scholar] [CrossRef] [PubMed] [Green Version]
  56. Woolfrey, K.M.; Srivastava, D.P. Control of Dendritic Spine Morphological and Functional Plasticity by Small GTPases. Neural Plast. 2016, 2016, 3025948. [Google Scholar] [CrossRef] [Green Version]
  57. Wang, X.; Weiner, J.A.; Levi, S.; Craig, A.M.; Bradley, A.; Sanes, J.R. Gamma protocadherins are required for survival of spinal interneurons. Neuron 2002, 36, 843–854. [Google Scholar] [CrossRef] [Green Version]
  58. Prasad, T.; Wang, X.; Gray, P.A.; Weiner, J.A. A differential developmental pattern of spinal interneuron apoptosis during synaptogenesis: Insights from genetic analyses of the protocadherin-gamma gene cluster. Development 2008, 135, 4153–4164. [Google Scholar] [CrossRef] [PubMed] [Green Version]
  59. Weiner, J.A.; Wang, X.; Tapia, J.C.; Sanes, J.R. Gamma protocadherins are required for synaptic development in the spinal cord. Proc. Natl. Acad. Sci. USA 2005, 102, 8–14. [Google Scholar] [CrossRef] [Green Version]
  60. Garrett, A.M.; Schreiner, D.; Lobas, M.A.; Weiner, J.A. gamma-protocadherins control cortical dendrite arborization by regulating the activity of a FAK/PKC/MARCKS signaling pathway. Neuron 2012, 74, 269–276. [Google Scholar] [CrossRef] [PubMed] [Green Version]
Figure 1. The histogram illustrating the distribution density of the assembled transcripts depending on their length (bp).
Life 11 00137 g001
Figure 2. The results of the evaluation of transcriptome assembly completeness according to Benchmarking Universal Single-Copy Orthologs(BUSCO). Four datasets were used for the analysis: Eukaryota, Metazoa, Vertebrata, and Actinopterygii.
Life 11 00137 g002
Figure 3. The percentage of predicted N.guentheri translated open reading frames (ORFs) successfully mapped to the reference proteomes of four organisms: Danio rerio (Dre), Oryzias latipes (Ola), Tetraodon nigroviridis (Tni), and Nothobranchius furzeri (Nfu) depending on the minimal predicted ORF length (aa). The longer the predicted protein, the more of these proteins are successfully mapped to the reference proteomes.
Life 11 00137 g003
Figure 4. The number of genes (a) and transcripts (b) containing at least one gene ontology (GO) annotation derived based on either blastp/blastx mapping against UniProt and HMMER(profile hidden Markov model software for searching sequence databases for homologs) search against the Pfam-A database.
Life 11 00137 g004
Figure 5. Volcano plots of differentially expressed genes (DEGs) between the controls and the Torin 2 treated N. guentheri. Volcano plots of DEGs in (a) males and (b) females. DEGs with two-fold or more differences in the expression level, that passed the FDR(false discovery rate) < 0.05 threshold are shown in red.
Life 11 00137 g005
Table 1. Overall assembly statistics of N. guenteri transcriptome.
FeatureValue
total length, bp285,906,387
total length, bp
(only transcripts > 500 bp)
217,410,128
genes (any length)288,989
genes (transcripts > 500 bp)104,271
transcripts (any length) 352,297
transcripts > 500 bp127,262
transcripts > 1000 bp66,471
transcripts > 5000 bp6322
transcripts > 10,000 bp604
transcripts > 25,000 bp5
largest transcript, bp27,376
N50, bp2539
N75, bp1231
L50, bp24,581
L75, bp55,134
GC, %47.07
Table 2. Genes with significantly changed expression in the Torin 2 treated male fish N. guentheri. The embedded heatmap (blue-red gradient) show the relative gene expression profiles (log-scaled ratio of the expression level in a current sample to the average level across all the samples). Blue—expression level is below the average, red—above the average. LogFC—average binary logarithm of the expression level ratio between the treated and control organisms; LogCPM—binary logarithm of average read counts per million (CPM); FDR value—adjusted p-value for multiple testing.
Gene IDTop BLAST Hit in UniProt Gene NameControlTorin 2LogFCLogCPMFDR
TRINITY_DN217860_c0_g1CATKCathepsin K 1.054.10.032
TRINITY_DN6195_c0_g1CATSCathepsin S 1.204.80.046
TRINITY_DN369_c0_g1HMR1Major histocompatibility complex class I-related gene protein 1.166.60.023
TRINITY_DN118978_c0_g1HG2AHLA class II histocompatibility antigen gamma chain 1.064.60.039
TRINITY_DN217842_c0_g1DRAMamu class II histocompatibility antigen, DR alpha chain 1.025.10.021
TRINITY_DN6030_c0_g1CDN1BCyclin-dependent kinase inhibitor 1B 1.214.90.037
TRINITY_DN3092_c0_g1HEBP2Heme-binding protein 2 −1.035.10.013
TRINITY_DN17955_c0_g1PRODProline dehydrogenase 1 −0.854.30.046
TRINITY_DN121258_c0_g1PROF1Profilin-1 1.255.30.039
TRINITY_DN10729_c0_g1SMU1WD40 repeat-containing protein SMU1 −1.573.80.001
TRINITY_DN151812_c0_g1TEFTranscription factor VBP −1.534.80.000
TRINITY_DN918_c0_g1BHE41Class E basic helix-loop-helix protein 41 −1.505.20.000
TRINITY_DN217450_c0_g1CIARTCircadian-associated transcriptional repressor −1.543.20.000
TRINITY_DN6901_c0_g1CIPCCLOCK-interacting pacemaker −1.113.20.038
TRINITY_DN13536_c0_g1DBPD site-binding protein −1.254.80.000
TRINITY_DN3883_c0_g1NFIL3Nuclear factor interleukin-3-regulated protein 1.714.40.001
TRINITY_DN221983_c0_g1NR1D1Nuclear receptor subfamily 1 group D member 1 −1.674.00.000
TRINITY_DN2234_c0_g1NR1D2Nuclear receptor subfamily 1 group D member 2 −0.915.90.002
TRINITY_DN13399_c0_g1PER1Period circadian protein homolog 1 −1.394.20.001
TRINITY_DN12790_c0_g1PER2Period circadian protein homolog 2 −1.324.50.001
TRINITY_DN2073_c0_g1RORBNuclear receptor ROR-beta 1.215.50.000
Table 3. Genes with significantly changed expression in the Torin 2 treated female fish N. guentheri. For details, see the legend for Table 2.
Gene IDTop BLAST Hit in UniProtGene NameControlTorin 2LogFCLogCPMFDRvalue
TRINITY_DN9769_c0_g1PCDB1Protocadherin beta 1 −1.013.90.003
TRINITY_DN30433_c0_g1PCDHGBProtocadherin gamma subfamily B −0.922.90.002
TRINITY_DN29438_c0_g1PCDHGAProtocadherin gamma subfamily A −1.851.80.005
TRINITY_DN221187_c0_g1PCDHD2Protocadherin delta 2 −1.792.20.002
TRINITY_DN10099_c0_g1PCDHGCProtocadherin gamma subfamily C −1.433.10.002
TRINITY_DN5709_c0_g3ZBED1Zinc finger BED domain-containing protein 1 −1.214.40.0010
TRINITY_DN32433_c0_g1ZBED4Zinc finger BED domain-containing protein 4 −1.531.60.01
TRINITY_DN11566_c0_g2ZBED9SCAN domain-containing protein 3 −1.224.80.01
TRINITY_DN28479_c0_g1LITD1LINE-1 type transposase domain-containing protein 1 −2.221.50.002
TRINITY_DN5063_c0_g1PEG10Retrotransposon-derived protein PEG10 −1.374.00.009
TRINITY_DN6282_c0_g1RTL1Retrotransposon-like protein 1 −1.454.20.007
TRINITY_DN4053_c0_g1YTX1Transposon TX1 uncharacterized 149 kDa protein −1.373.70.003
TRINITY_DN18778_c0_g1PO22Retrovirus-related Pol polyprotein from type-1 retrotransposable element R2 −0.912.80.05
TRINITY_DN20585_c0_g1FMRFFMRF-amide neuropeptides −2.884.50.008
TRINITY_DN28618_c0_g1NEFHNeurofilament heavy polypeptide −1.052.80.002
TRINITY_DN36218_c0_g1CSMD1CUB and sushi domain-containing protein 1 −1.832.20.006
TRINITY_DN20186_c0_g1DYH10Dynein heavy chain 10, axonemal −1.322.40.004
TRINITY_DN23456_c0_g1FR1L6Fer-1-like protein 6 1.352.20.04
TRINITY_DN20670_c1_g1NMDE2Glutamate receptor ionotropic, NMDA 2B −1.182.50.01
TRINITY_DN19802_c0_g1SRFBP1Serum response factor-binding protein 1 −3.952.50.01
Publisher’s Note: MDPI stays neutral with regard to jurisdictional claims in published maps and institutional affiliations.

