
Uncoiling the Human Cochlea—Physical Scala Tympani Models to Study Pharmacokinetics Inside the Inner Ear

 ,
,  , and
, and 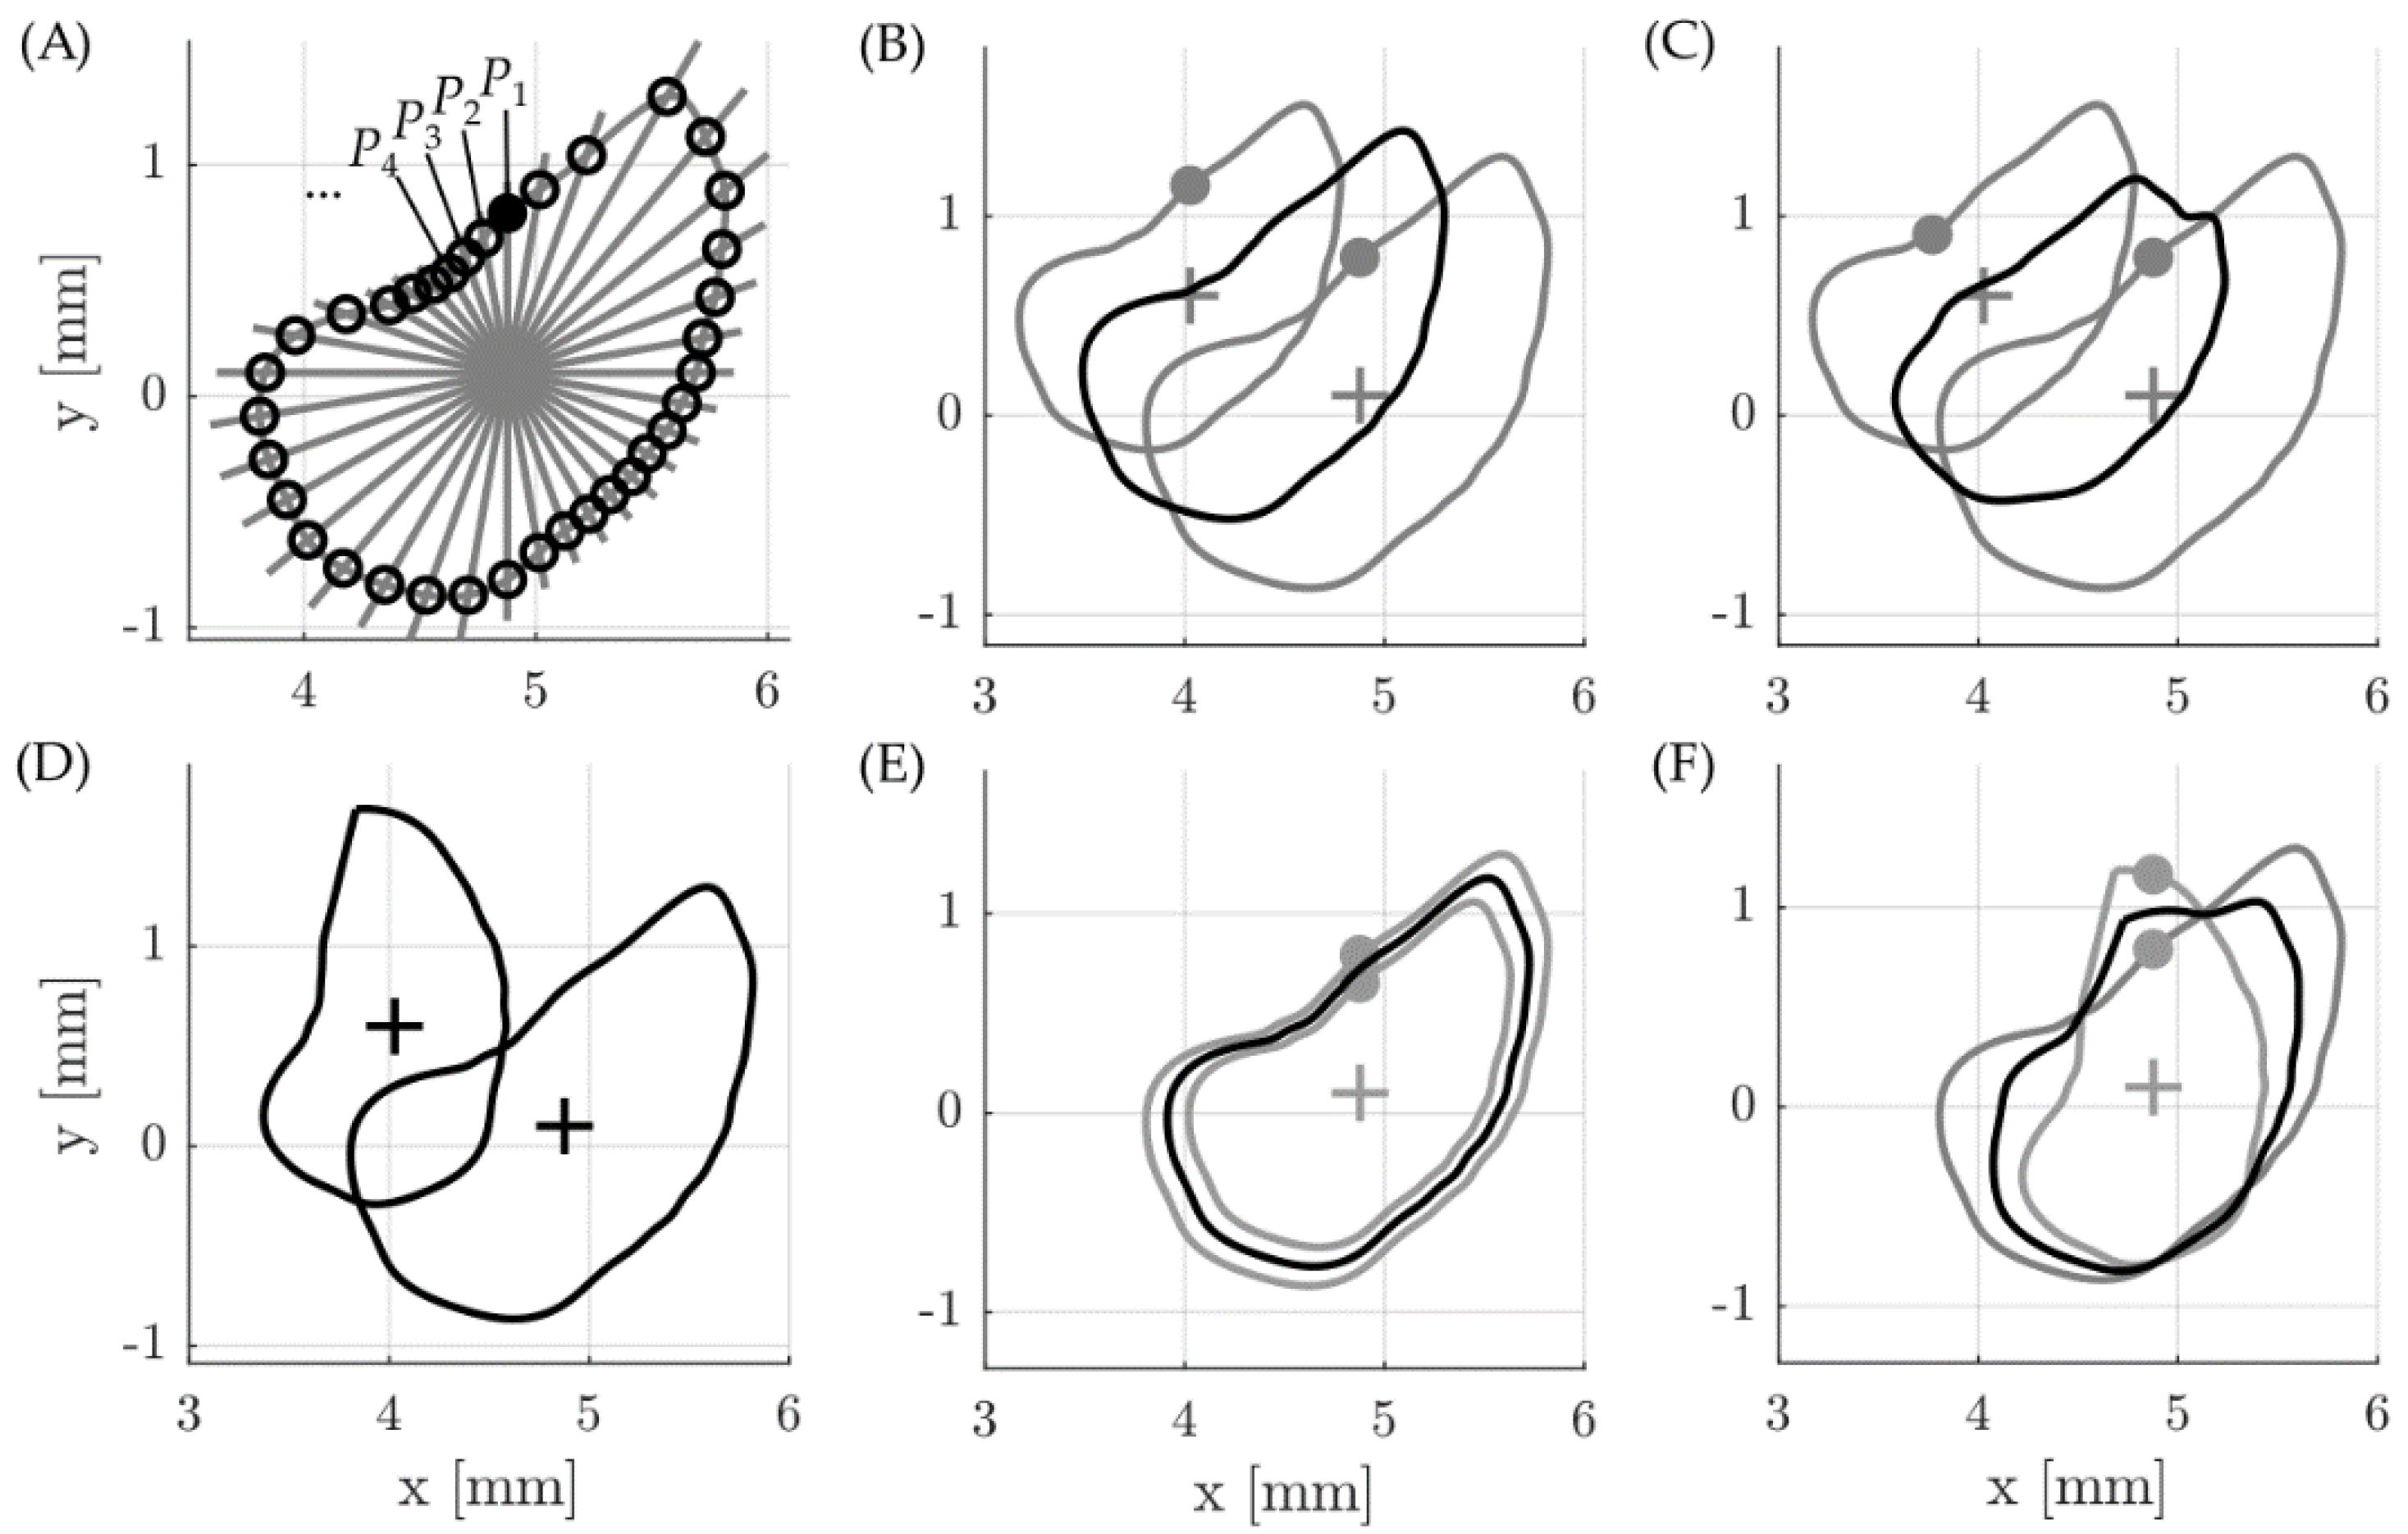
Abstract
:1. Introduction
2. Materials and Methods
2.1. Geometrical Averaging of Scala Tympani Contours
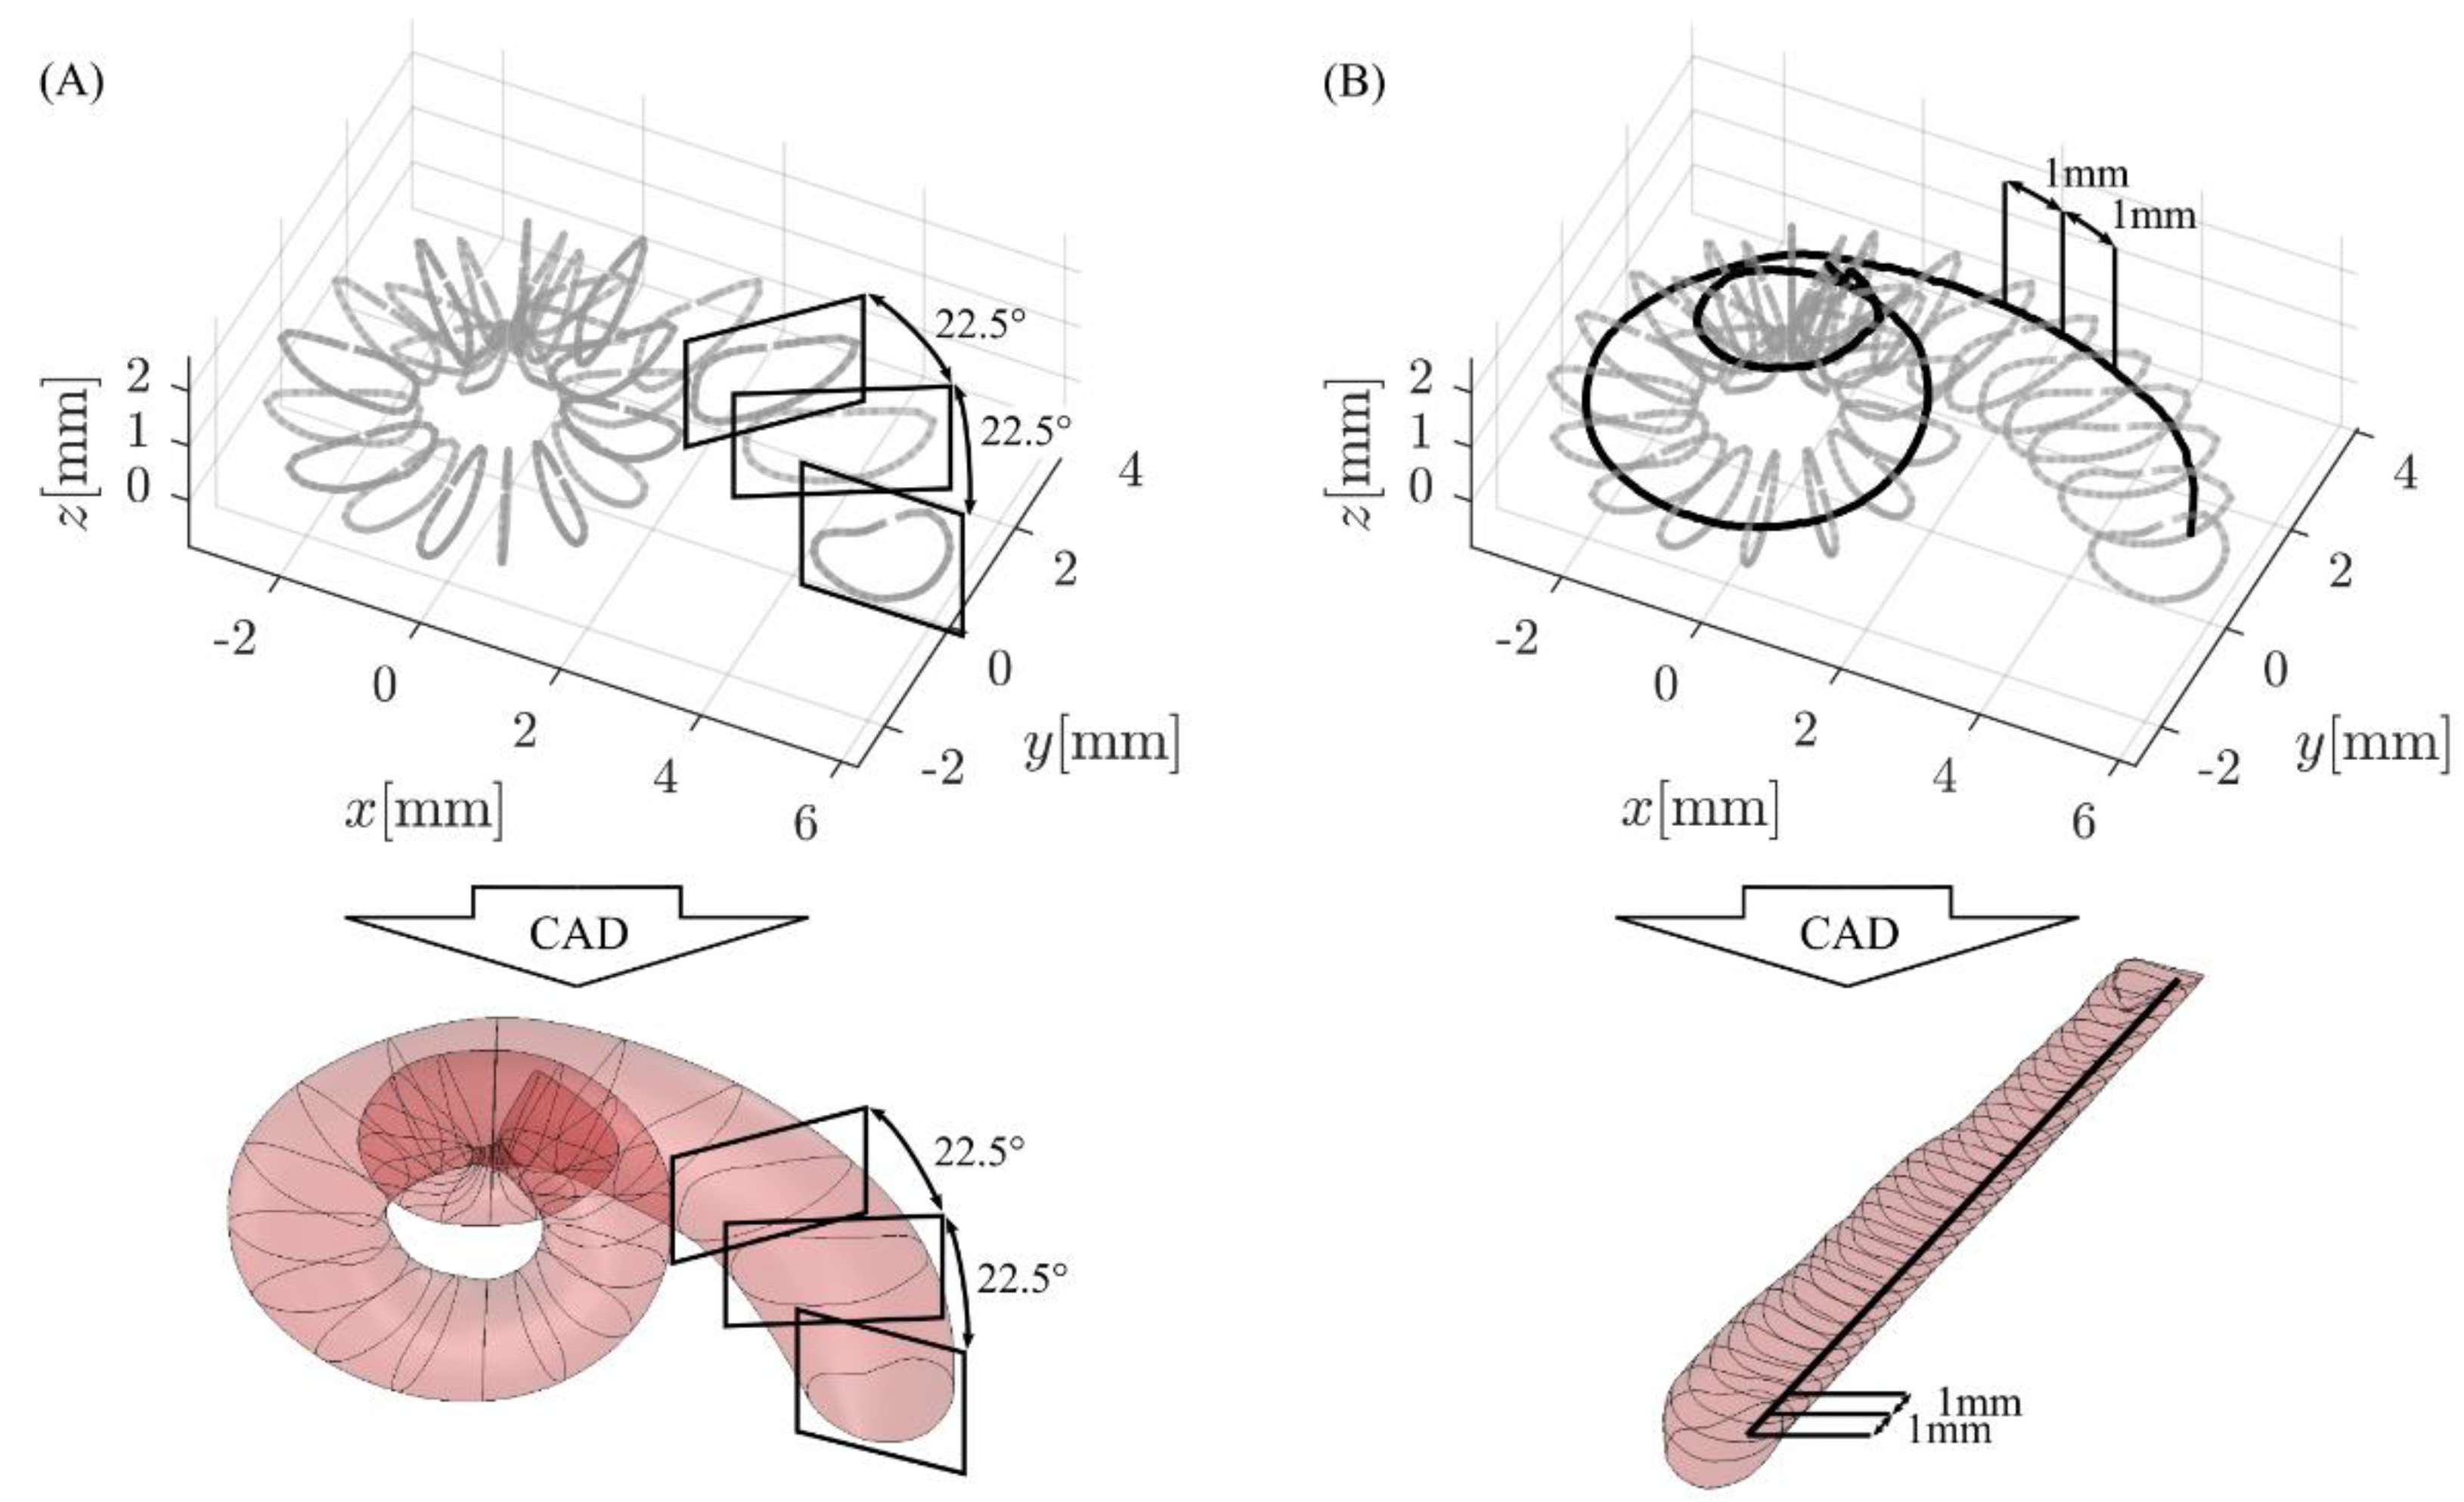
2.2. CAD Model Generation and Analysis
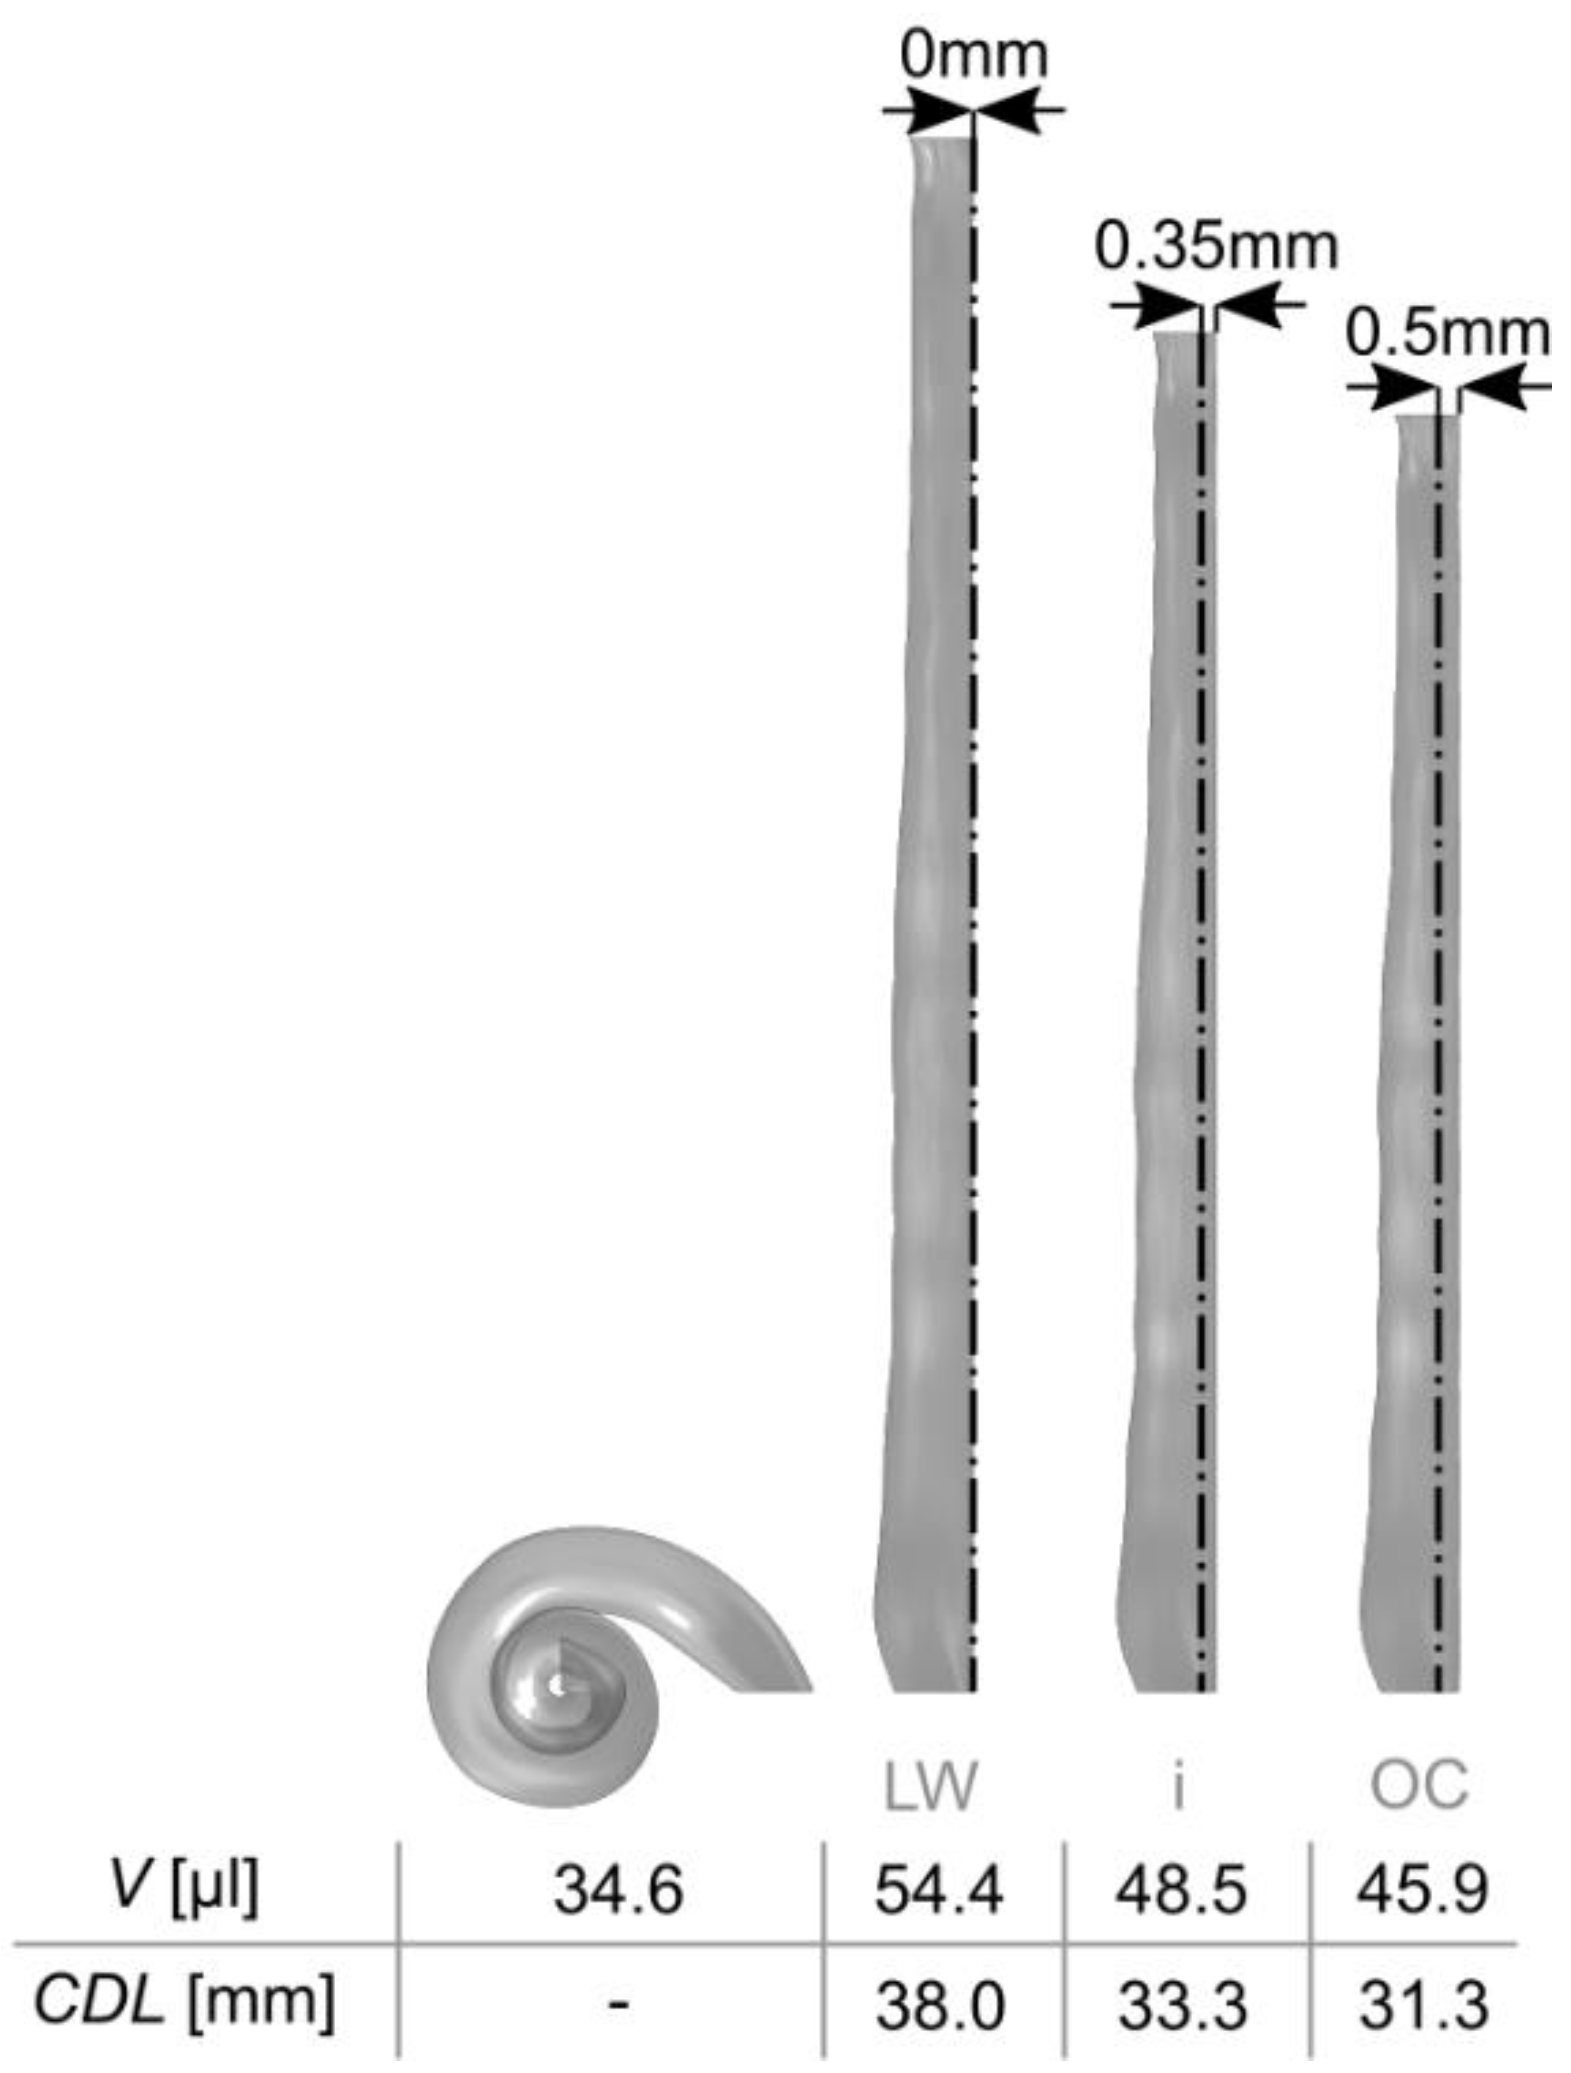
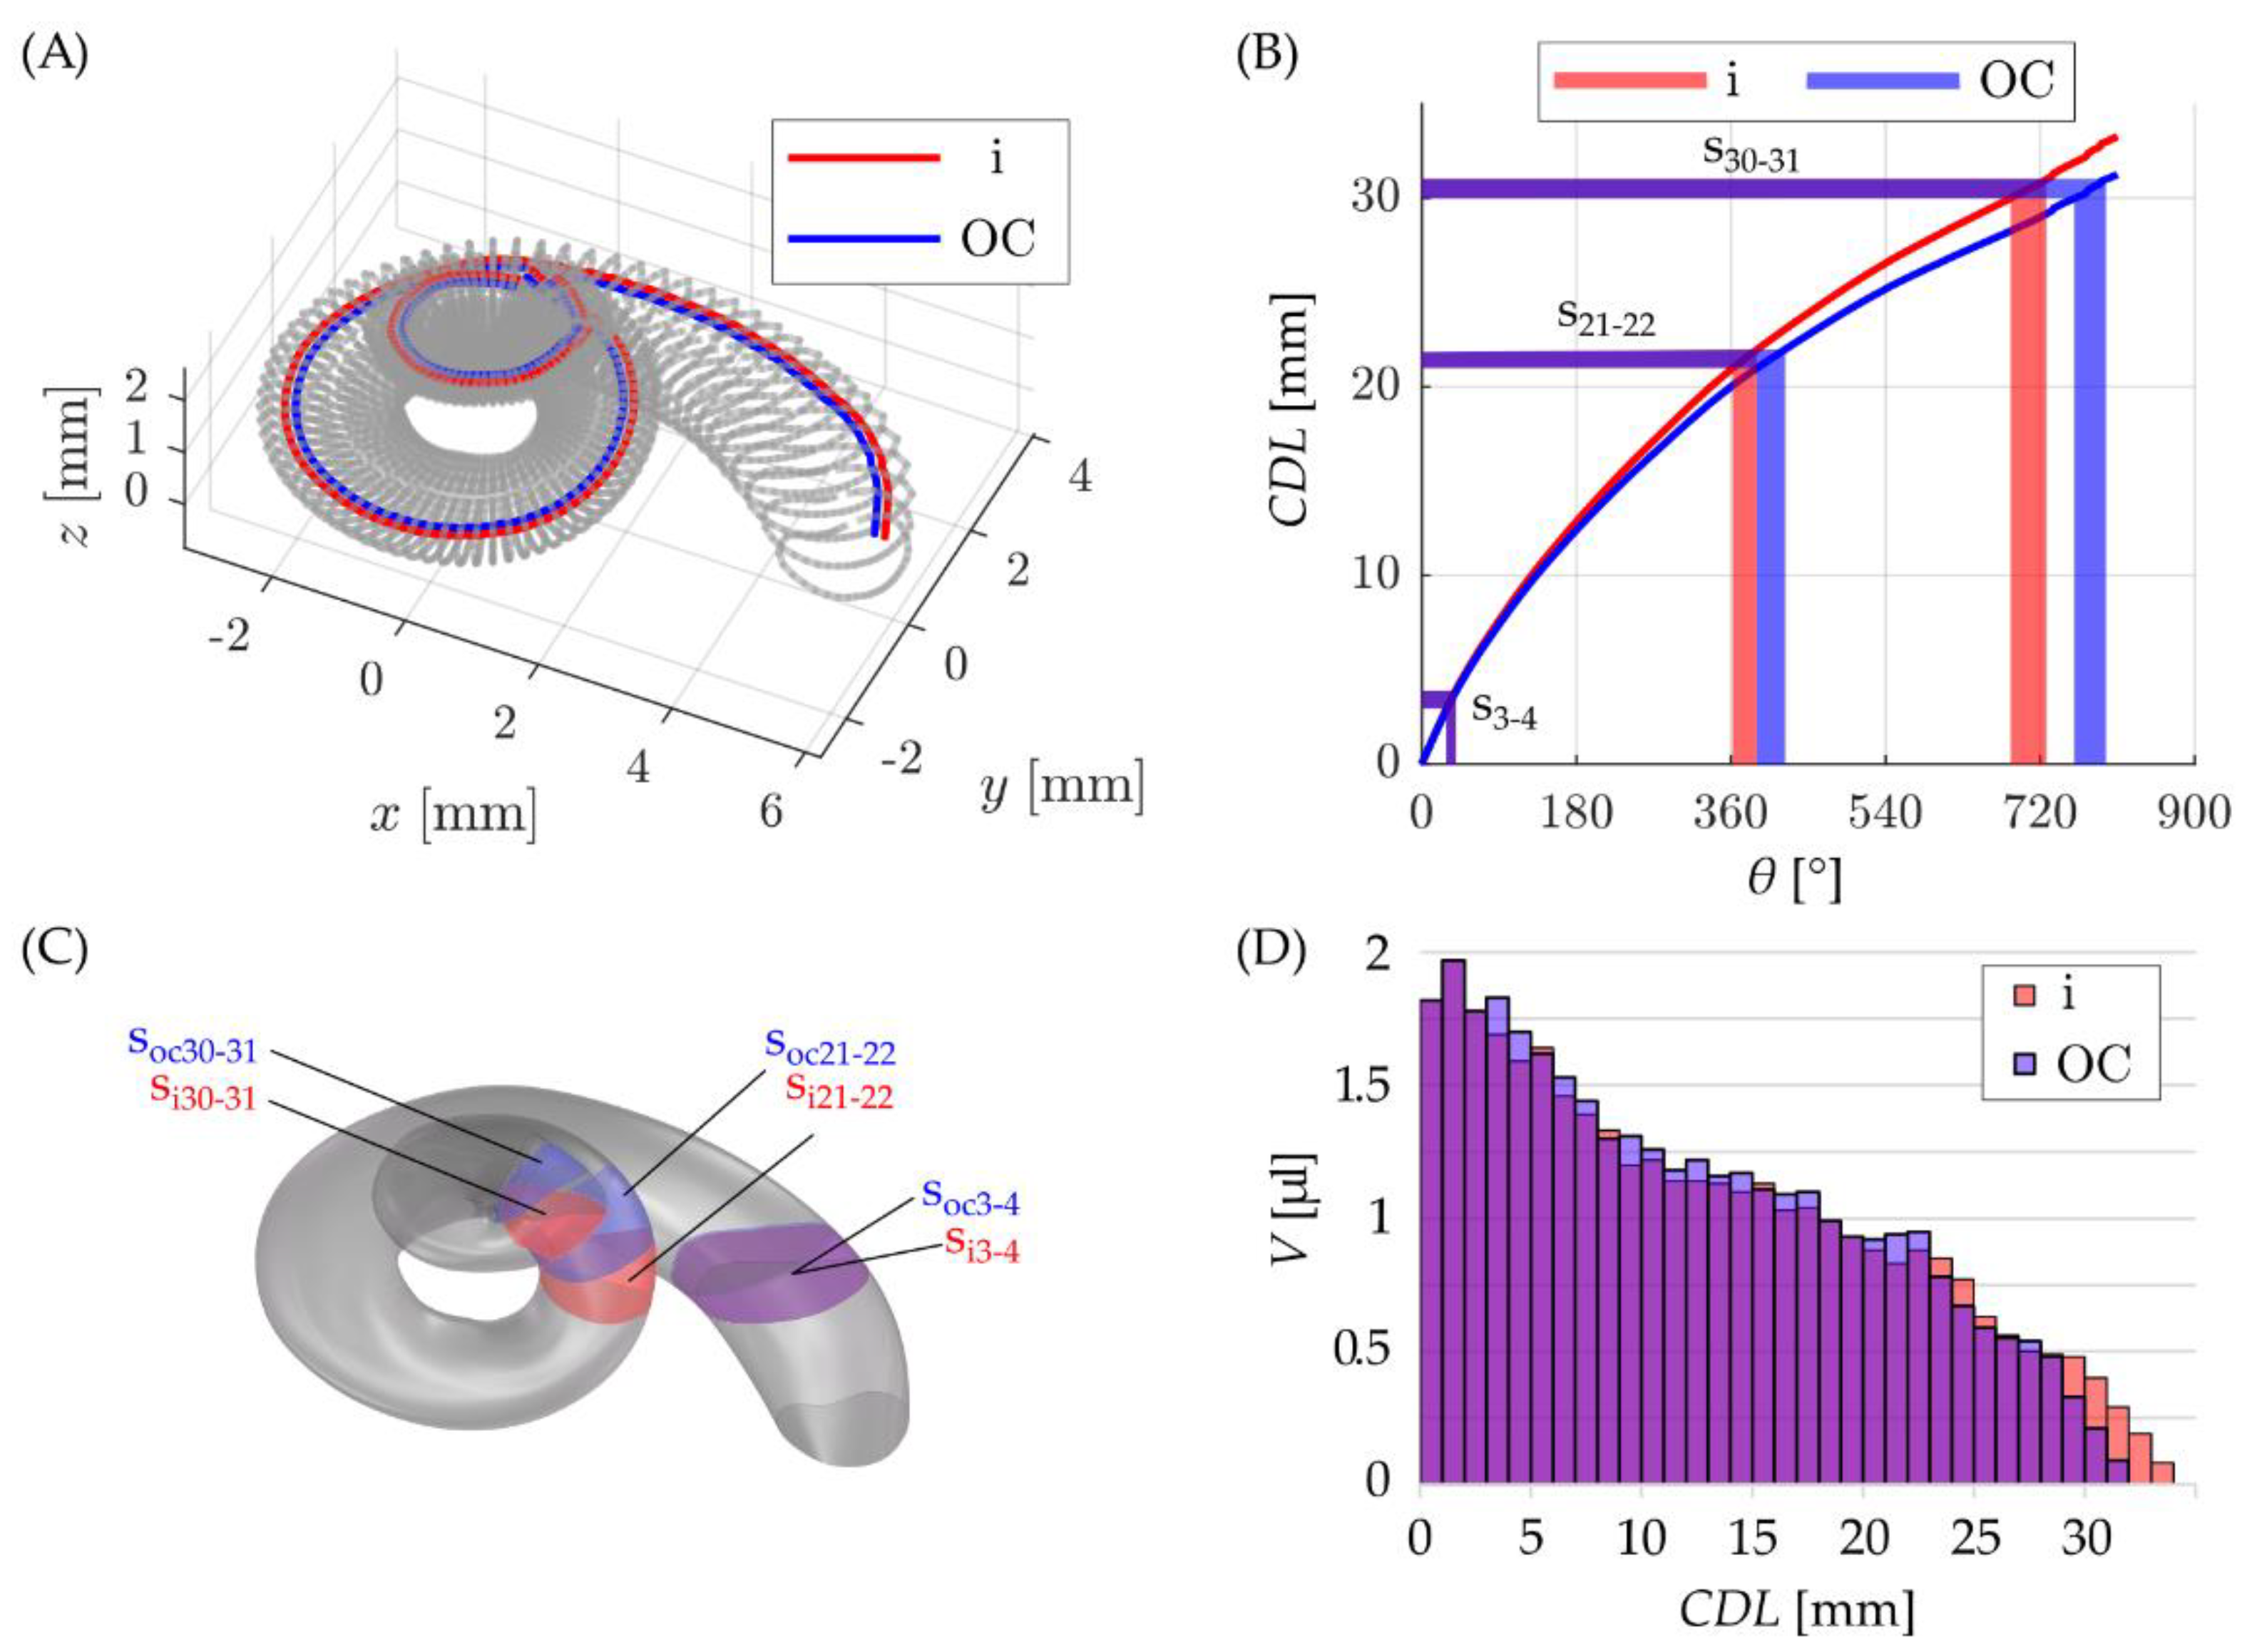
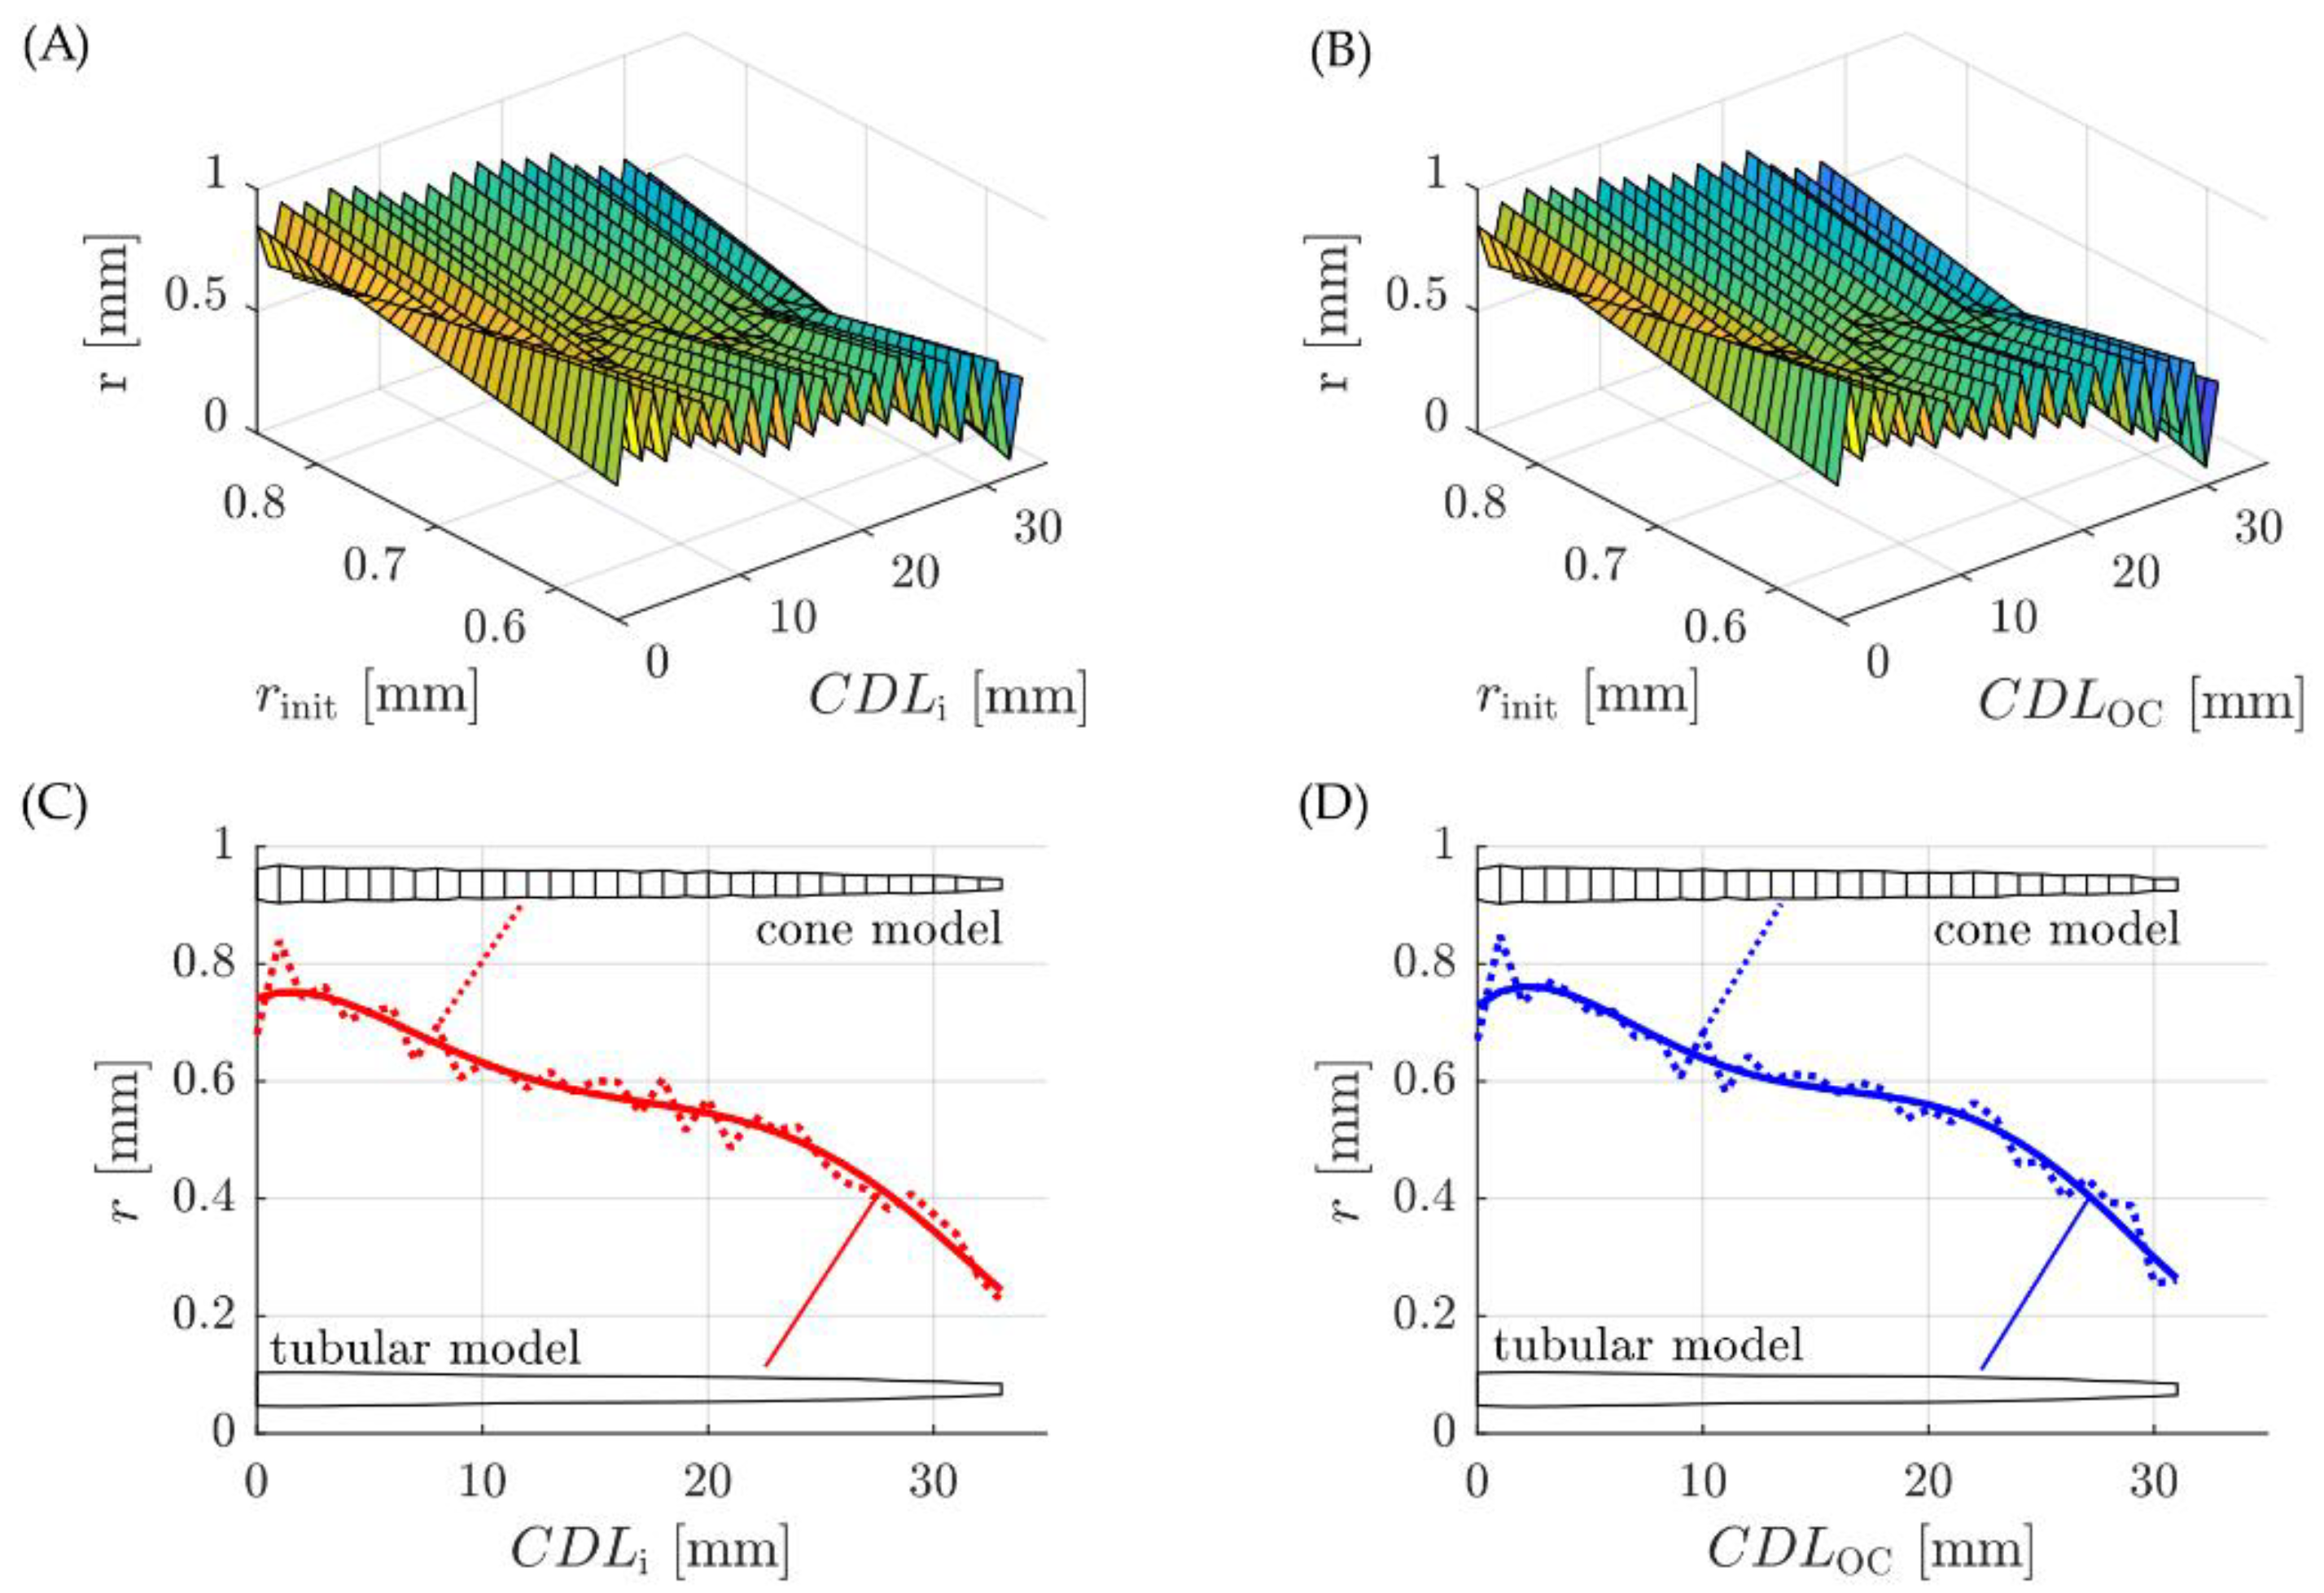
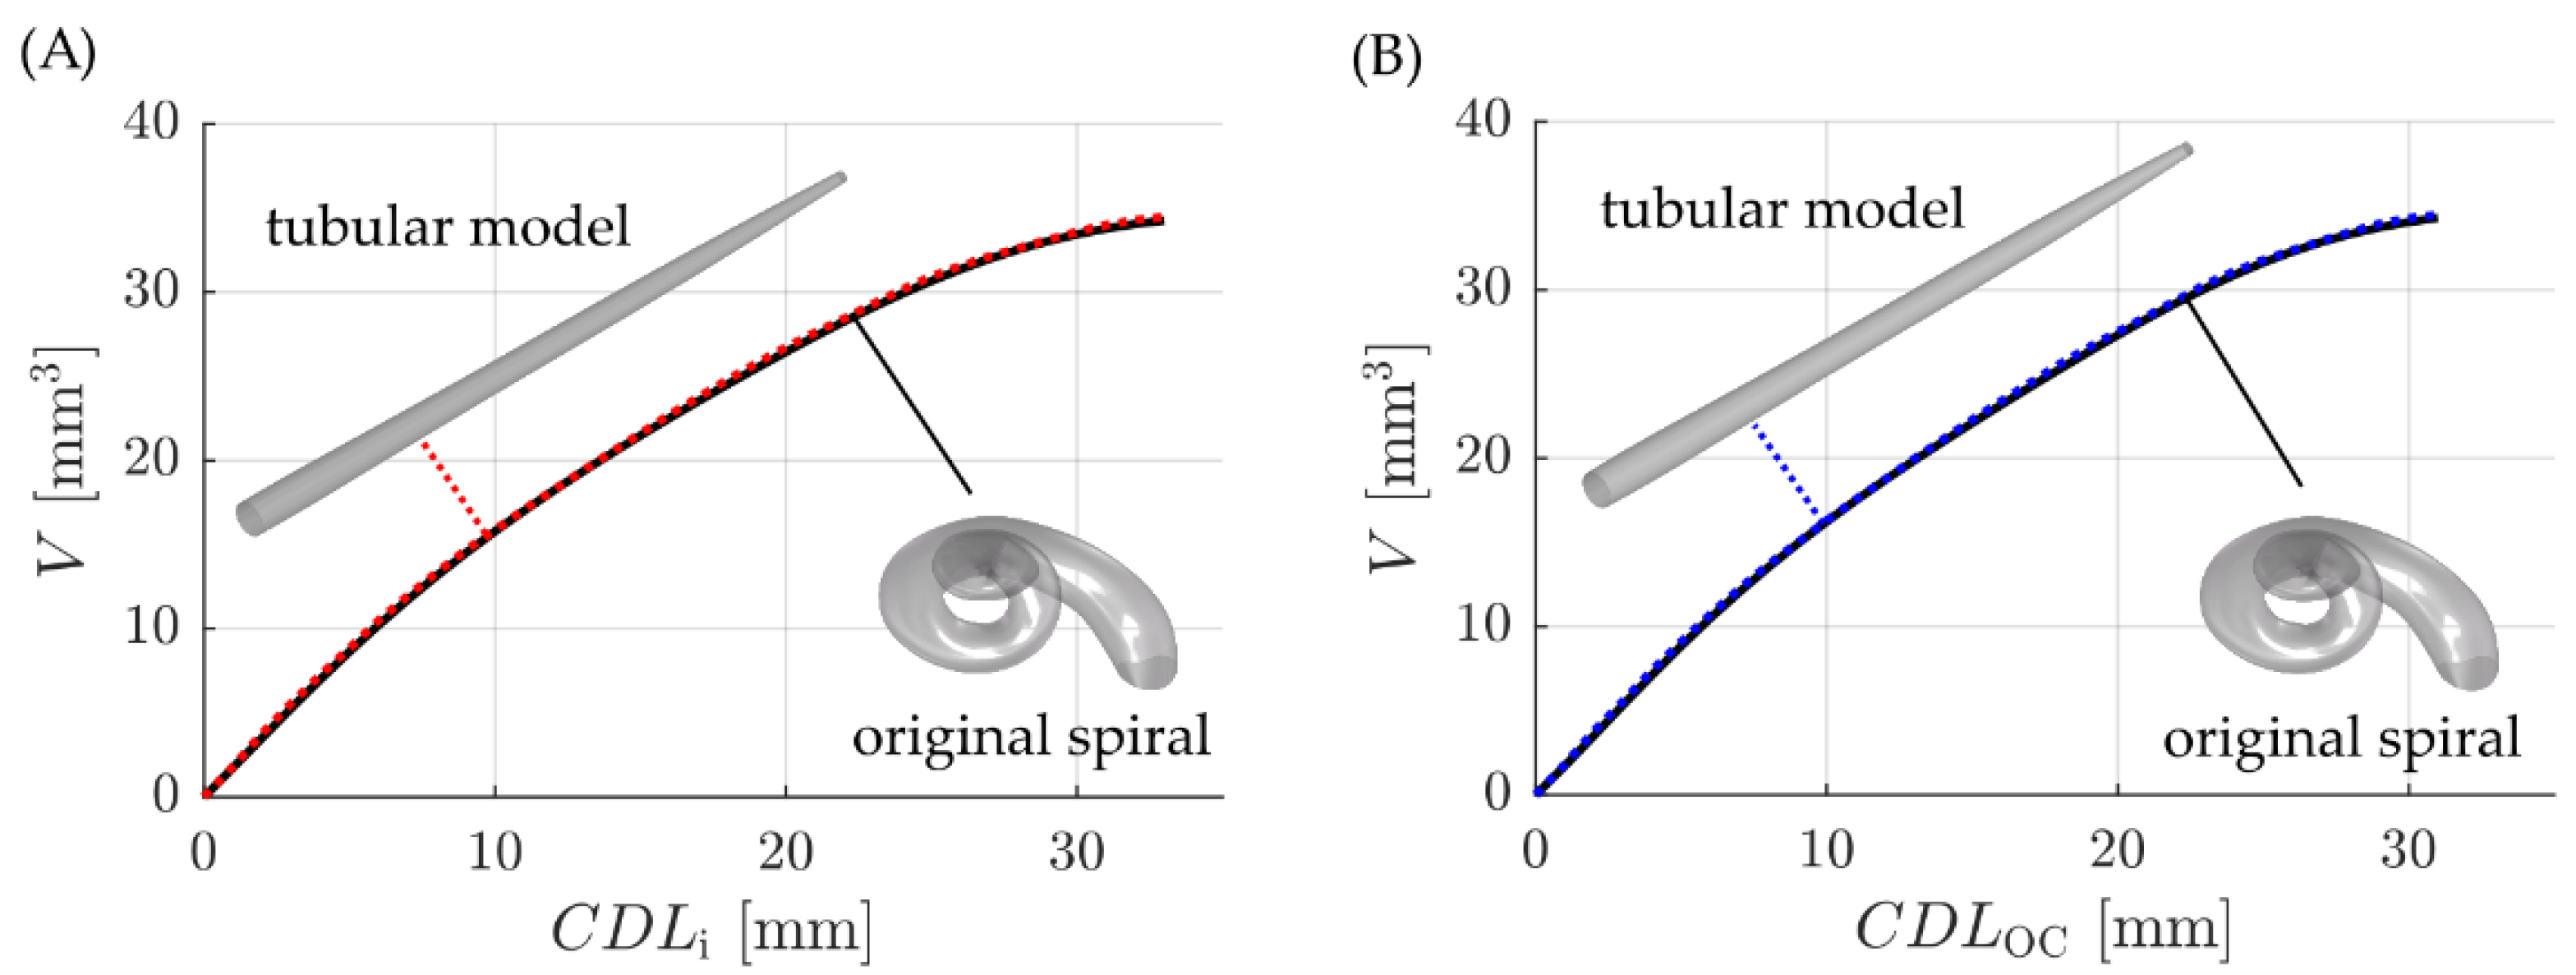
3. Results
4. Discussion
5. Conclusions
Author Contributions
Funding
Institutional Review Board Statement
Informed Consent Statement
Data Availability Statement
Conflicts of Interest
References
- Li, P.M.M.C.; Wang, H.; Northrop, C.; Merchant, S.N.; Nadol, J.B., Jr. Anatomy of the Round Window and Hook Region of the Cochlea with Implications for Cochlear Implantation and Other Endocochlear Surgical Procedures. Otol. Neurotol. 2007, 28, 641–648. [Google Scholar] [CrossRef] [PubMed] [Green Version]
- Walby, A.P. Scala tympani measurement. Ann. Otol. Rhinol. Laryngol. 1985, 94, 393–397. [Google Scholar] [PubMed]
- Wysocki, J. Dimensions of the human vestibular and tympanic scalae. Hear. Res. 1999, 135, 39–46. [Google Scholar] [CrossRef]
- Hatsushika, S.-I.; Shepherd, R.K.; Tong, Y.C.; Clark, G.M.; Funasaka, S. Dimensions of the scala tympani in the human and cat with reference to cochlear implants. Ann. Otol. Rhinol. Laryngol. 1990, 99, 871–876. [Google Scholar] [CrossRef] [PubMed]
- Avci, E.; Nauwelaers, T.; Lenarz, T.; Hamacher, V.; Kral, A. Variations in microanatomy of the human cochlea. J. Comp. Neurol. 2014, 522, 3245–3261. [Google Scholar] [CrossRef] [PubMed] [Green Version]
- Schurzig, D.; Timm, M.E.; Majdani, O.; Lenarz, T.; Rau, T.S. The Use of Clinically Measurable Cochlear Parameters in Cochlear Implant Surgery as Indicators for Size, Shape and Orientation of the Scala Tympani. Ear Hear. 2021. online ahead of print. [Google Scholar] [CrossRef]
- Rebscher, S.J.; Talbot, N.; Bruszewski, W.; Heilmann, M.; Brasell, J.; Merzenich, M.M. A transparent model of the human scala tympani cavity. J. Neurosci. Methods 1996, 64, 105–114. [Google Scholar] [CrossRef]
- Hügl, S.; Blum, T.; Lenarz, T.; Majdani, O.; Rau, T.S. Impact of anatomical variations on insertion forces. Curr. Dir. Biomed. Eng. 2018, 4, 509–512. [Google Scholar] [CrossRef]
- Avci, E.; Nauwelaers, T.; Hamacher, V.; Kral, A. Three-Dimensional Force Profile During Cochlear Implantation Depends on Individual Geometry and Insertion Trauma. Ear Hear. 2017, 38, e168–e179. [Google Scholar] [CrossRef]
- Rebscher, S.J.; Hetherington, A.; Bonham, B.; Wardrop, P.; Whinney, D.; Leake, P.A. Considerations for design of future cochlear implant electrode arrays: Electrode array stiffness, size, and depth of insertion. J. Rehabil. Res. Dev. 2008, 45, 731Y48. [Google Scholar] [CrossRef] [PubMed]
- Schurzig, D.; Lexow, G.J.; Majdani, O.; Lenarz, T.; Rau, T.S. Three-dimensional modeling of the cochlea by use of an arc fitting approach. Comput. Methods Biomec. Biomed. Eng. 2016, 19, 1785–1799. [Google Scholar] [CrossRef] [PubMed]
- Gulya, A.J.; Steenerson, R.L. The Scala Vestibuli for Cochlear Implantation: An Anatomic Study. Arch. Otolaryngol. Head Neck Surg. 1996, 122, 130–132. [Google Scholar] [CrossRef] [PubMed]
- Yoo, S.; Wang, G.; Rubinstein, J.; Skinner, M.; Vannier, M.W. Three-Dimensional Modeling and Visualization of the Cochlea on the Internet. IEEE Trans. Biomed. Eng. 2000, 4, 144–151. [Google Scholar] [CrossRef] [PubMed]
- Clark, J.R.; Warren, F.M.; Abbott, J.J. A Scalable Model for Human Scala-Tympani Phantoms. J. Med. Devices 2011, 5, 014501. [Google Scholar] [CrossRef]
- Schurzig, D.; Timm, M.E.; Lexow, G.J.; Majdani, O.; Lenarz, T.; Rau, T.S. Cochlea Helix and Duct Length Identification–Evaluation of Different Curve Fitting Techniques. Cochlear Implant. Int. 2018, 19, 268–283. [Google Scholar] [CrossRef]
- Pietsch, M.; Dávila, L.A.; Erfurt, P.; Avci, E.; Lenarz, T.; Kral, A. Spiral Form of the Human Cochlea Results from Spatial Constraints. Sci. Rep. 2017, 7, 1–11. [Google Scholar] [CrossRef] [PubMed] [Green Version]
- Timm, M.E.; Majdani, O.; Weller, T.; Windeler, M.; Lenarz, T.; Büchner, A.; Salcher, R.B. Patient Specific Selection of Lateral Wall Cochlear Implant Electrodes based on Anatomical Indication Ranges. PLoS ONE 2018, 13, e0206435. [Google Scholar] [CrossRef] [PubMed]
- Khurayzi, T.; Dhanasingh, A.; Almuhawas, F.; AlSanosi, A. Shape of the Cochlear Basal Turn: An Indicator for an Optimal Electrode-to-Modiolus Proximity With Precurved Electrode Type. Ear Nose Throat J. 2021, 100, 38–43. [Google Scholar] [CrossRef] [PubMed]
- Hao, J.; Li, S.K. Inner ear drug delivery: Recent advances, challenges, and perspective. Eur. J. Pharm. Sci. 2019, 126, 82–92. [Google Scholar] [CrossRef]
- Glueckert, R.; Chacko, L.J.; Rask-Andersen, H.; Liu, W.; Handschuh, S.; Schrott-Fischer, A. Anatomical basis of drug delivery to the inner ear. Hear. Res. 2018, 368, 10–27. [Google Scholar] [CrossRef] [PubMed]
- Stevens, J.P.; Watanabe, H.; Kysar, J.W.; Lalwani, A.K. Serrated needle design facilitates precise roundwindow membrane perforation. J. Biomed. Mater Res. A. 2016, 104, 1633–1637. [Google Scholar] [CrossRef] [PubMed] [Green Version]
- Yu, D.; Sun, C.; Zheng, Z.; Wang, X.; Chen, D.; Wu, H.; Wang, X.; Shi, F. Inner ear delivery of dexamethasone using injectable silk-polyethylene glycol (PEG) hydrogel. Int. J. Pharm. 2016, 503, 229–237. [Google Scholar] [CrossRef]
- Liu, Y.; Jolly, C.; Braun, S.; Stark, T.; Scherer, E.; Plontke, S.K.; Kiefer, J. In vitro and in vivo pharmacokinetic studyof a dexamethasone-releasing silicone for cochlear implants. Eur. Arch. Otorhinolaryngol. 2016, 273, 1745–1753. [Google Scholar] [CrossRef] [PubMed]
- Salt, A.; Hartsock, J.; Gill, R.; King, E.; Kraus, F.; Plontke, S. Perilymph pharmacokinetics of locally-applied gentamicin in the guinea pig. Hear. Res. 2016, 342, 101–111. [Google Scholar] [CrossRef] [PubMed] [Green Version]
- Salt, A.N.; Plontke, S.K. Local inner-ear drug delivery and pharmacokinetics. Drug Discov. Today 2005, 10, 1299–1306. [Google Scholar] [CrossRef] [Green Version]
- Salt, A.N.; Hirose, K. Communication pathways to and from the inner ear and their contributions to drug delivery. Hear. Res. 2018, 362, 25–37. [Google Scholar] [CrossRef] [PubMed]
- Mynatt, R.; Hale, S.A.; Gill, R.M.; Plontke, S.K.; Salt, A.N. Demonstration of a longitudinal concentration gradient along scala tympani by sequential sampling of perilymph from the cochlear apex. J. Assoc. Res. Otolaryngol. 2006, 7, 182–193. [Google Scholar] [CrossRef] [PubMed] [Green Version]
- Plontke, S.K.; Mynatt, R.; Gill, R.M.; Borgmann, S.; Salt, A.N. Concentration gradient along the scala tympani after local application of gentamicin to the round window membrane. Laryngoscope 2007, 117, 1191–1198. [Google Scholar] [CrossRef] [PubMed] [Green Version]
- Hahn, H.; Salt, A.N.; Schumacher, U.; Plontke, S.K. Gentamicin concentration gradients in scala tympani perilymph following systemic applications. Audiol. Neurootol. 2013, 18, 383–391. [Google Scholar] [CrossRef] [PubMed] [Green Version]
- Majdani, O.; Schurzig, D.; Hussong, A.; Rau, T.S.; Wittkopf, J.; Lenarz, T.; Labadie, R.F. Force measurement of insertion of cochlear implant electrode arrays in vitro: Comparison of surgeon to automated insertion tool. Acta. Otolaryngol. 2010, 130, 31–36. [Google Scholar] [CrossRef] [PubMed] [Green Version]
- Miroir, M.; Nguyen, Y.; Kazmitcheff, G.; Ferrary, E.; Sterkers, O.; Grayeli, A.B. Friction force measurement during cochlear implant insertion: Application to a force-controlled insertion tool design. Otol. Neurotol. 2012, 33, 1092–1100. [Google Scholar] [CrossRef] [PubMed]
- Lexow, G.J.; Schurzig, D.; Gellrich, N.-C.; Lenarz, T.; Majdani, O.; Rau, T.S. Visualization, measurement and modelling of the cochlea using rotating midmodiolar slice planes. Int. J. Comput. Assist. Radiol. Surg. 2016, 11, 1855–1869. [Google Scholar] [CrossRef] [PubMed]
- Alexiades, G.; Dhanasingh, A.; Jolly, C. Method to Estimate the Complete and Two-Turn Cochlear Duct Length. Otol. Neurotol. 2014, 36, 904–907. [Google Scholar] [CrossRef] [PubMed]
- Schurzig, D.; Timm, M.E.; Batsoulis, C.; Salcher, R.; Sieber, D.; Jolly, C.; Lenarz, T.; Zoka-Assadi, M. A Novel Method for Clinical Cochlear Duct Length Estimation toward Patient-Specific Cochlear Implantation. OTO Open 2018, 2, 2473974X18800238. [Google Scholar] [CrossRef] [PubMed]
- Schurzig, D.; Pietsch, M.; Erfurt, P.; Timm, M.E.; Lenarz, T.; Kral, A. A Cochlear Scaling Model for Accurate Anatomy Evaluation in Cochlear Implantation. Hear. Res. 2021, 403, 108166. [Google Scholar] [CrossRef] [PubMed]
- Saunders, E.; Cohen, L.; Aschendorff, A.; Shapiro, W.; Knight, M.; Stecker, M.; Richter, B.; Waltzman, S.; Tykocinski, M.; Roland, T.; et al. Threshold, comfortable level and impedance changes as a function of electrode-modiolar distance. Ear Hear. 2002, 23 (Suppl. 1), 28S–40S. [Google Scholar] [CrossRef] [PubMed]
- Tamir, S.; Ferrary, E.; Borel, S.; Sterkers, O.; Grayeli, A.B. Hearing preservation after cochlear implantation using deeply inserted flex atraumatic electrode arrays. Audiol. Neurootol. 2012, 17, 331–337. [Google Scholar] [CrossRef] [PubMed]
- Lenarz, T.; Scheper, V. Preserving Residual Hearing in Cochlear Implant Patients. In Free Radicals in ENT Pathology; Humana Press: Totowa, NJ, USA, 2015; pp. 423–443. [Google Scholar]
- Salt, A.N. Alec Salt’s Perilymph World. Available online: https://www.alecsalt.com/index.php/drug-delivery/size-and-diffusion-in-the-ear (accessed on 2 March 2021).
- Salt, A.N.; Henson, M.M.; Gewalt, S.L.; Keating, A.W.; DeMott, J.E.; Henson, O.W., Jr. Detection and quantification of endolymphatic hydrops in the guinea pig cochlea by magnetic resonance microscopy. Hear. Res. 1995, 88, 79–86. [Google Scholar] [CrossRef]
- Salcher, R.; Boruchov, A.; Timm, M.; Steffens, M.; Giesemann, A.; Lenarz, T.; Warnecke, A. On the Intracochlear Location of Straight Electrode Arrays After Cochlear Implantation: How Lateral Are Lateral Wall Electrodes? Otol. Neurotol. 2021, 42, 242–250. [Google Scholar] [CrossRef] [PubMed]
- Koch, R.W.; Elfarnawany, M.; Zhu, N.; Ladak, H.M.; Agrawal, S.K. Evaluation of Cochlear Duct Length Computations Using Synchrotron Radiation Phase-Contrast Imaging. Otol. Neurotol. 2017, 38, e92–e99. [Google Scholar] [CrossRef] [PubMed]
- Salt, A.N.; Plontke, S.K. Pharmacokinetic principles in the inner ear: Influence of drug properties on intratympanic applications. Hear. Res. 2018, 368, 28–40. [Google Scholar] [CrossRef] [PubMed]
- Thorne, M.; Salt, A.N.; DeMott, J.E.; Henson, M.M.; Henson, O.W., Jr.; Gewalt, S.L. Cochlear fluid space dimensions for six species derived from reconstructions of three-dimensional magnetic resonance images. Laryngoscope 1999, 109, 1661–1668. [Google Scholar] [CrossRef] [PubMed]
- Salt, A.N. Simulation of methods for drug delivery to the cochlear fluids. Adv. Otorhinolaryngol. 2002, 59, 140–148. [Google Scholar] [PubMed]


Publisher’s Note: MDPI stays neutral with regard to jurisdictional claims in published maps and institutional affiliations. |
© 2021 by the authors. Licensee MDPI, Basel, Switzerland. This article is an open access article distributed under the terms and conditions of the Creative Commons Attribution (CC BY) license (https://creativecommons.org/licenses/by/4.0/).
Share and Cite
Schurzig, D.; Fröhlich, M.; Raggl, S.; Scheper, V.; Lenarz, T.; Rau, T.S. Uncoiling the Human Cochlea—Physical Scala Tympani Models to Study Pharmacokinetics Inside the Inner Ear. Life 2021, 11, 373. https://doi.org/10.3390/life11050373
Schurzig D, Fröhlich M, Raggl S, Scheper V, Lenarz T, Rau TS. Uncoiling the Human Cochlea—Physical Scala Tympani Models to Study Pharmacokinetics Inside the Inner Ear. Life. 2021; 11(5):373. https://doi.org/10.3390/life11050373
Chicago/Turabian StyleSchurzig, Daniel, Max Fröhlich, Stefan Raggl, Verena Scheper, Thomas Lenarz, and Thomas S. Rau. 2021. "Uncoiling the Human Cochlea—Physical Scala Tympani Models to Study Pharmacokinetics Inside the Inner Ear" Life 11, no. 5: 373. https://doi.org/10.3390/life11050373