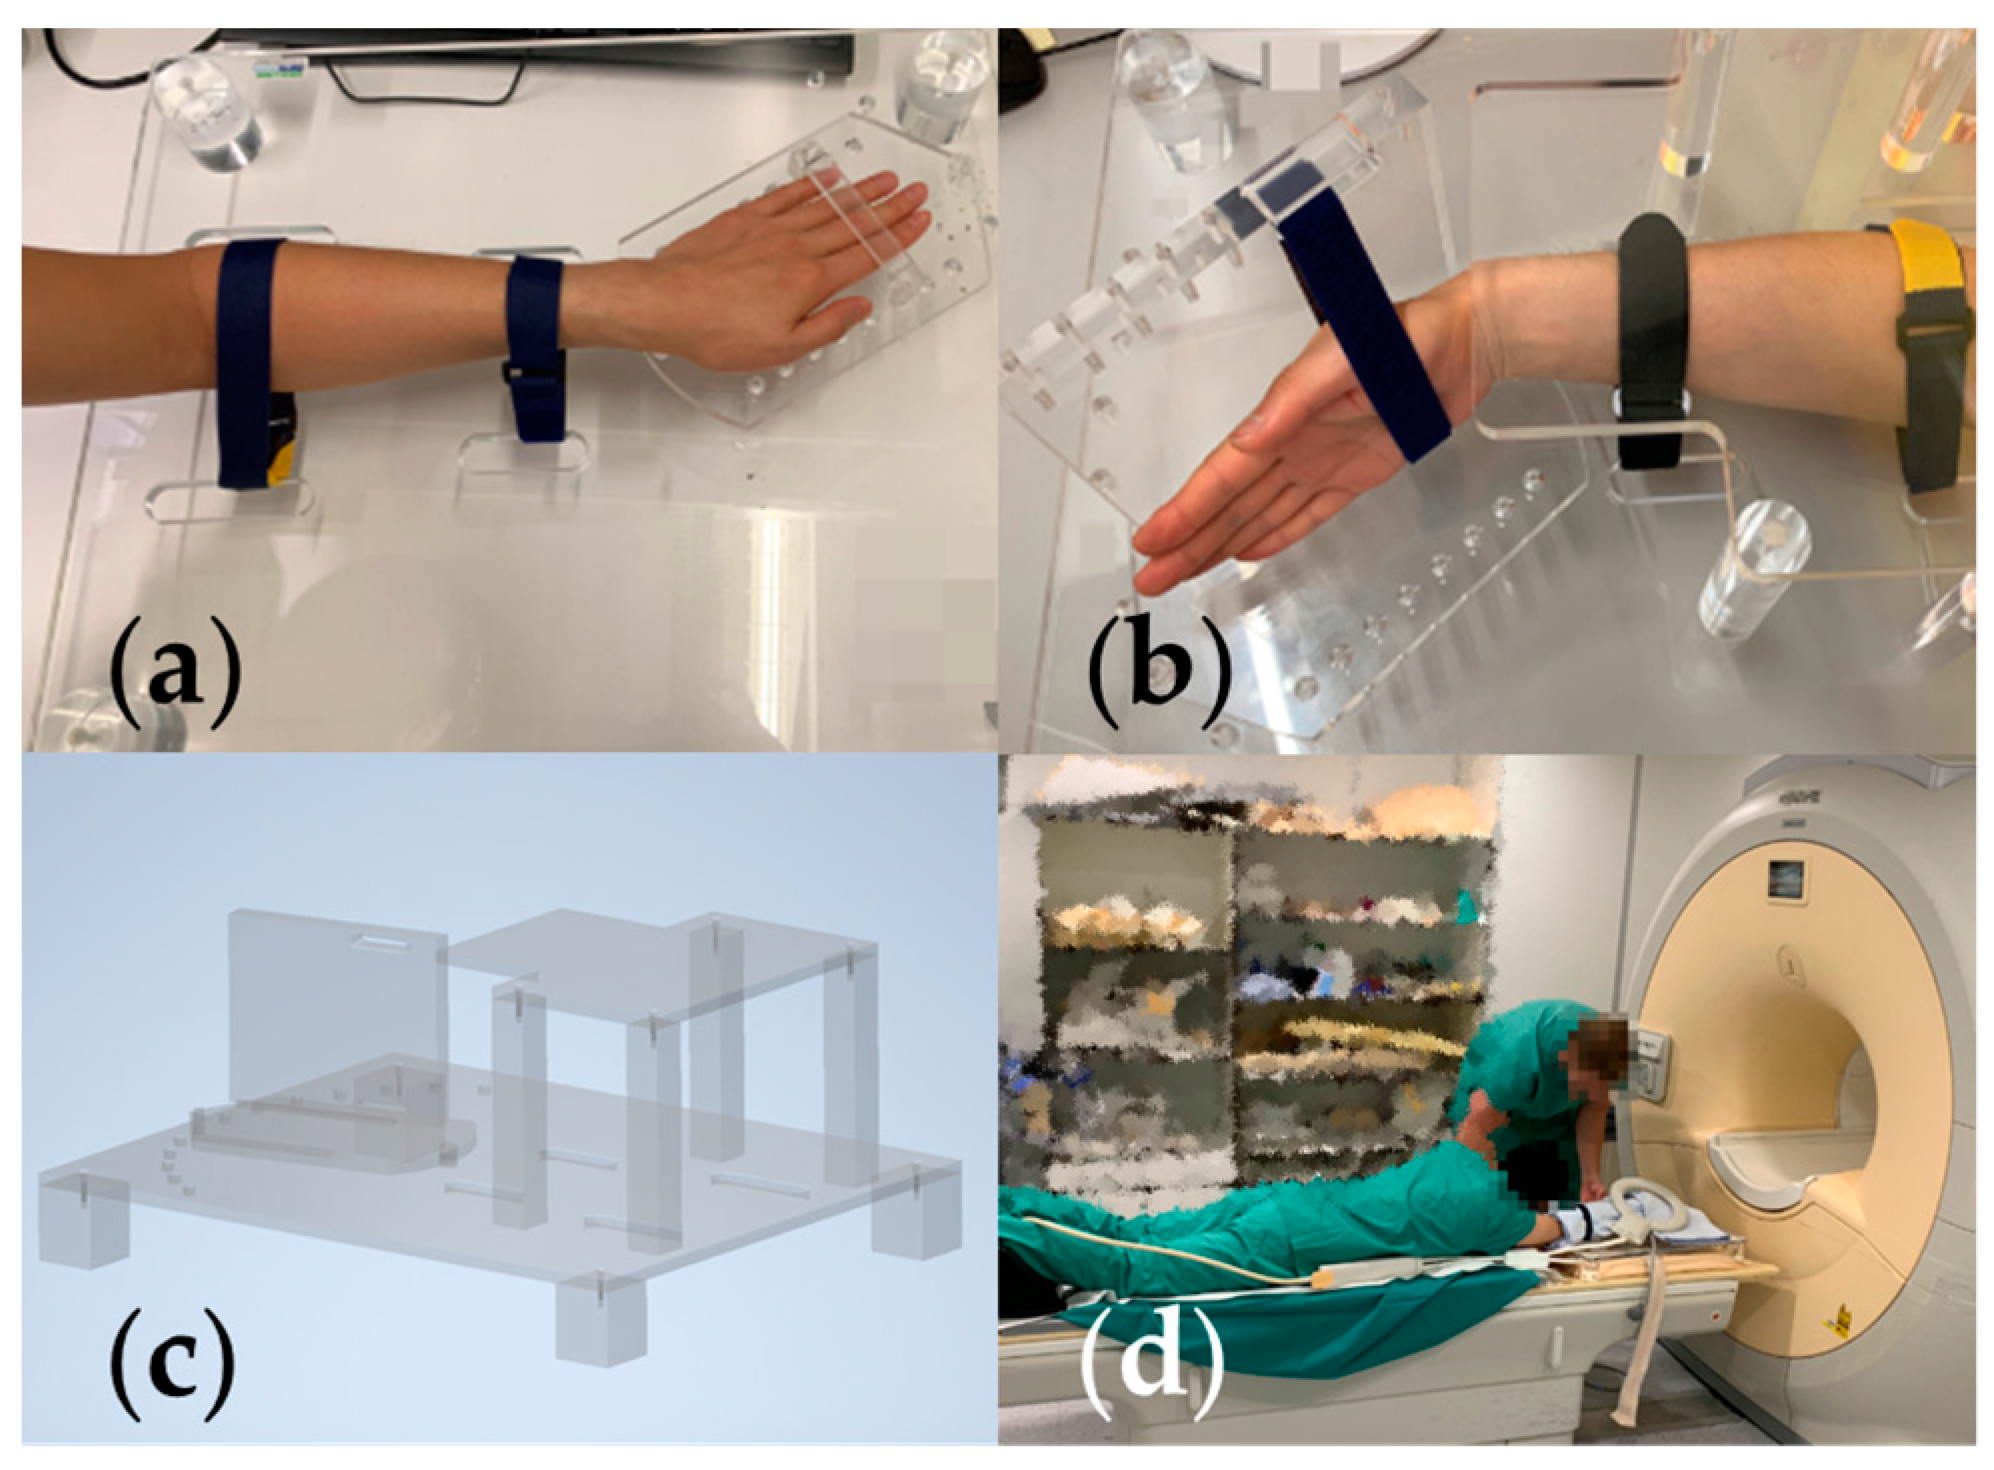
Figure 1.
(a) Holding device set-up for RUD, the one demonstrated is an ulnar deviation (UD) 20°. (b) Holding device set-up for FE, the one demonstrated is flexion 30°. (c) 3D model of the holding device. (d) Participant posture during acquisition.
Figure 1.
(a) Holding device set-up for RUD, the one demonstrated is an ulnar deviation (UD) 20°. (b) Holding device set-up for FE, the one demonstrated is flexion 30°. (c) 3D model of the holding device. (d) Participant posture during acquisition.
Figure 2.
An exemplary segmented MR image slice of the wrist, the right side is the corresponding labels.
Figure 2.
An exemplary segmented MR image slice of the wrist, the right side is the corresponding labels.
Figure 3.
An exemplary scaphoid bone before (left) and after (right) smoothing.
Figure 3.
An exemplary scaphoid bone before (left) and after (right) smoothing.
Figure 4.
(a) Two radii and scaphoid bones from the same subject of different acquisition protocols. (b) Ten aligned radii and two scaphoid bones from four subjects of different acquisition protocols. Each color represents one bone.
Figure 4.
(a) Two radii and scaphoid bones from the same subject of different acquisition protocols. (b) Ten aligned radii and two scaphoid bones from four subjects of different acquisition protocols. Each color represents one bone.
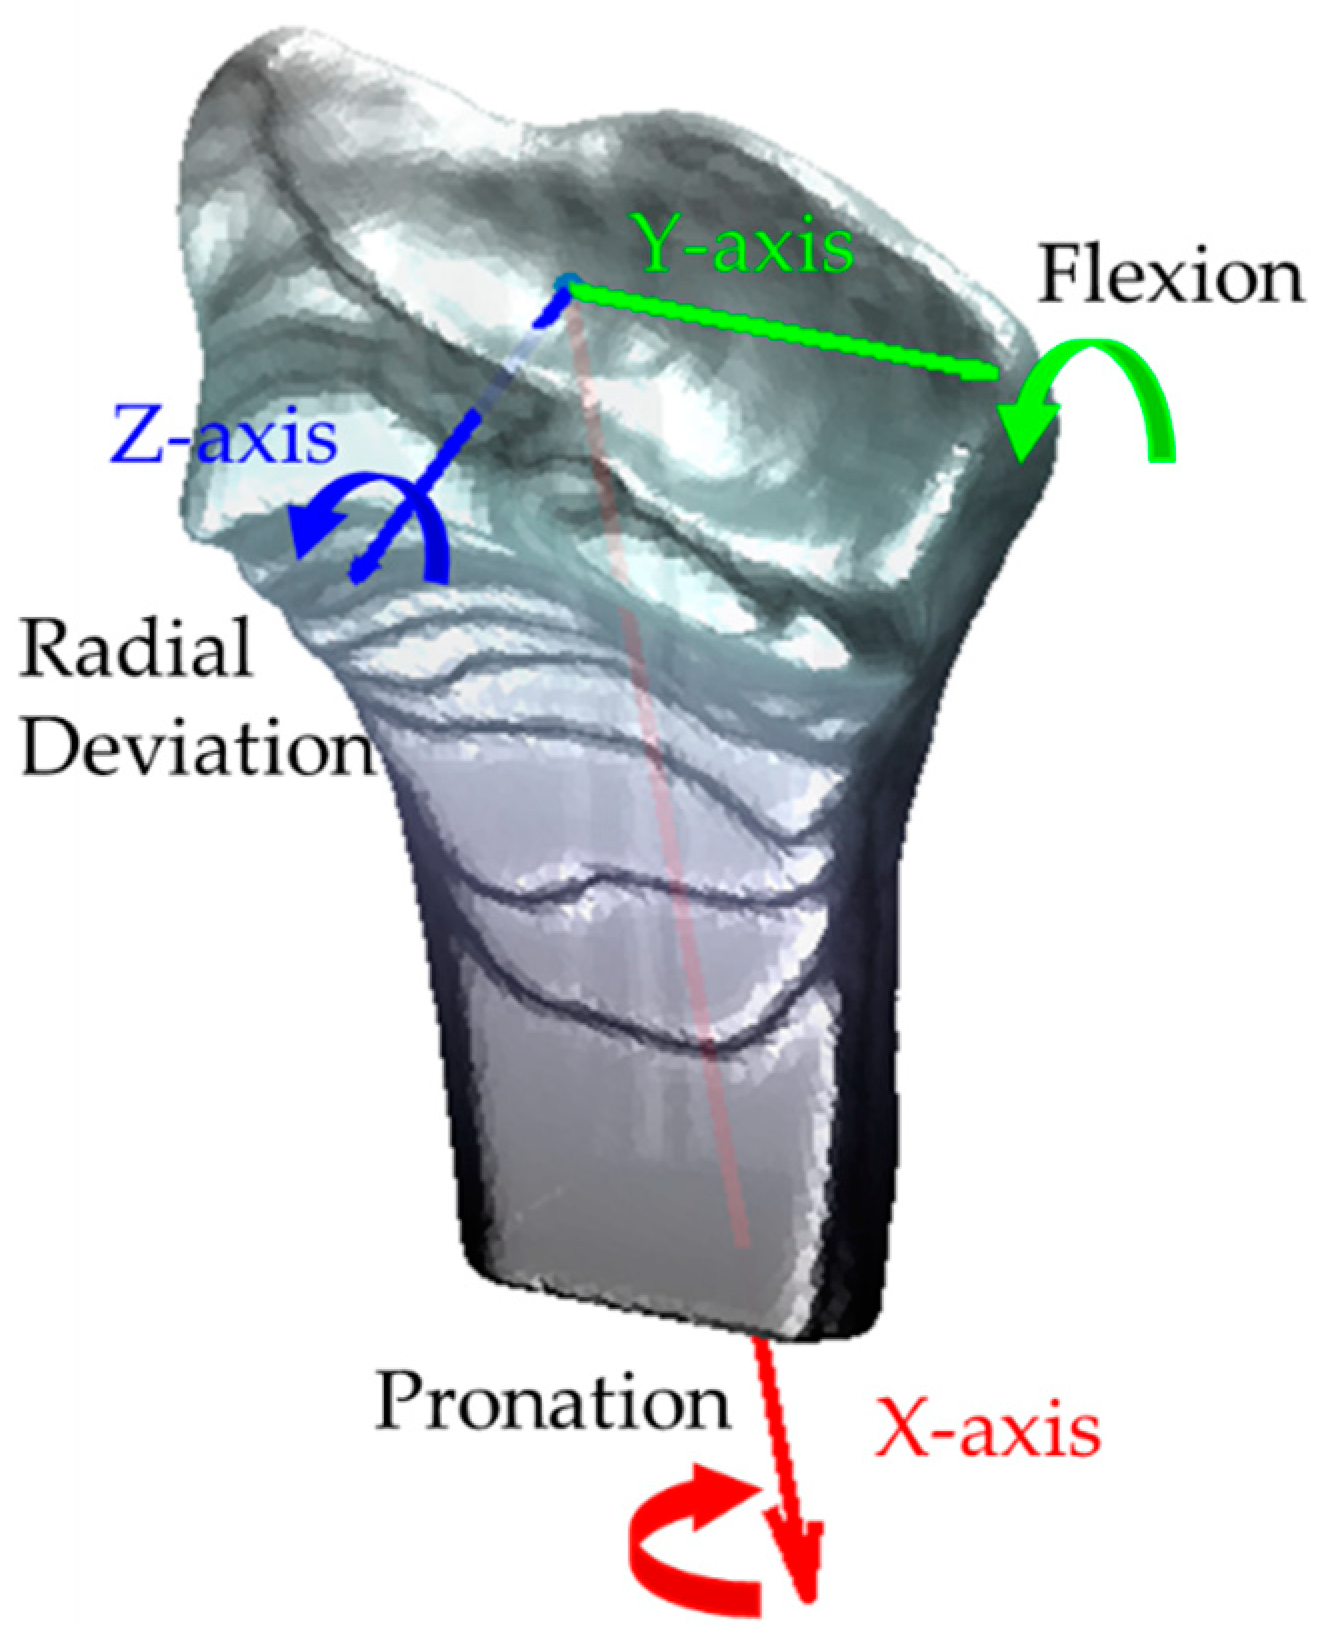
Figure 5.
Definition of the radius-based coordinate system, positive axis direction, and wrist motions.
Figure 5.
Definition of the radius-based coordinate system, positive axis direction, and wrist motions.
Figure 6.
(a) Different coordinate system representations of the principal inertial axes for the same trapezium. (b) A trapezium and its five centroid positions with unified (upper) and ununified (bottom) principal inertial axes orientation in FE.
Figure 6.
(a) Different coordinate system representations of the principal inertial axes for the same trapezium. (b) A trapezium and its five centroid positions with unified (upper) and ununified (bottom) principal inertial axes orientation in FE.
Figure 7.
(a) Right carpal bones and radius with their cartilages. (b) A left triquetrum in green with its cartilage in light green and the adjacent hamate with its cartilage in red points. The same bones without cartilages are shown in the right dashed box. (c) A left capitate in cyan with its cartilage in light cyan and the adjacent trapezoid with its cartilage in magenta points. The same bones without cartilages are shown in the right dashed box.
Figure 8.
HA of the proximal carpal row in FE: (a) the scaphoid and lunate; (b) the triquetrum and pisiform. The illustrated are from a left wrist. The upper shows a side palmer view, while the bottom shows a transverse view from distal to proximal. The bold black line shows the average direction of the HAs in FE. Short RGB bars and red dots indicate the orientations and centroids of the same carpal bone from all subjects. The carpal bone from its five FE positions was randomly selected from the subjects to demonstrate the bone movement.
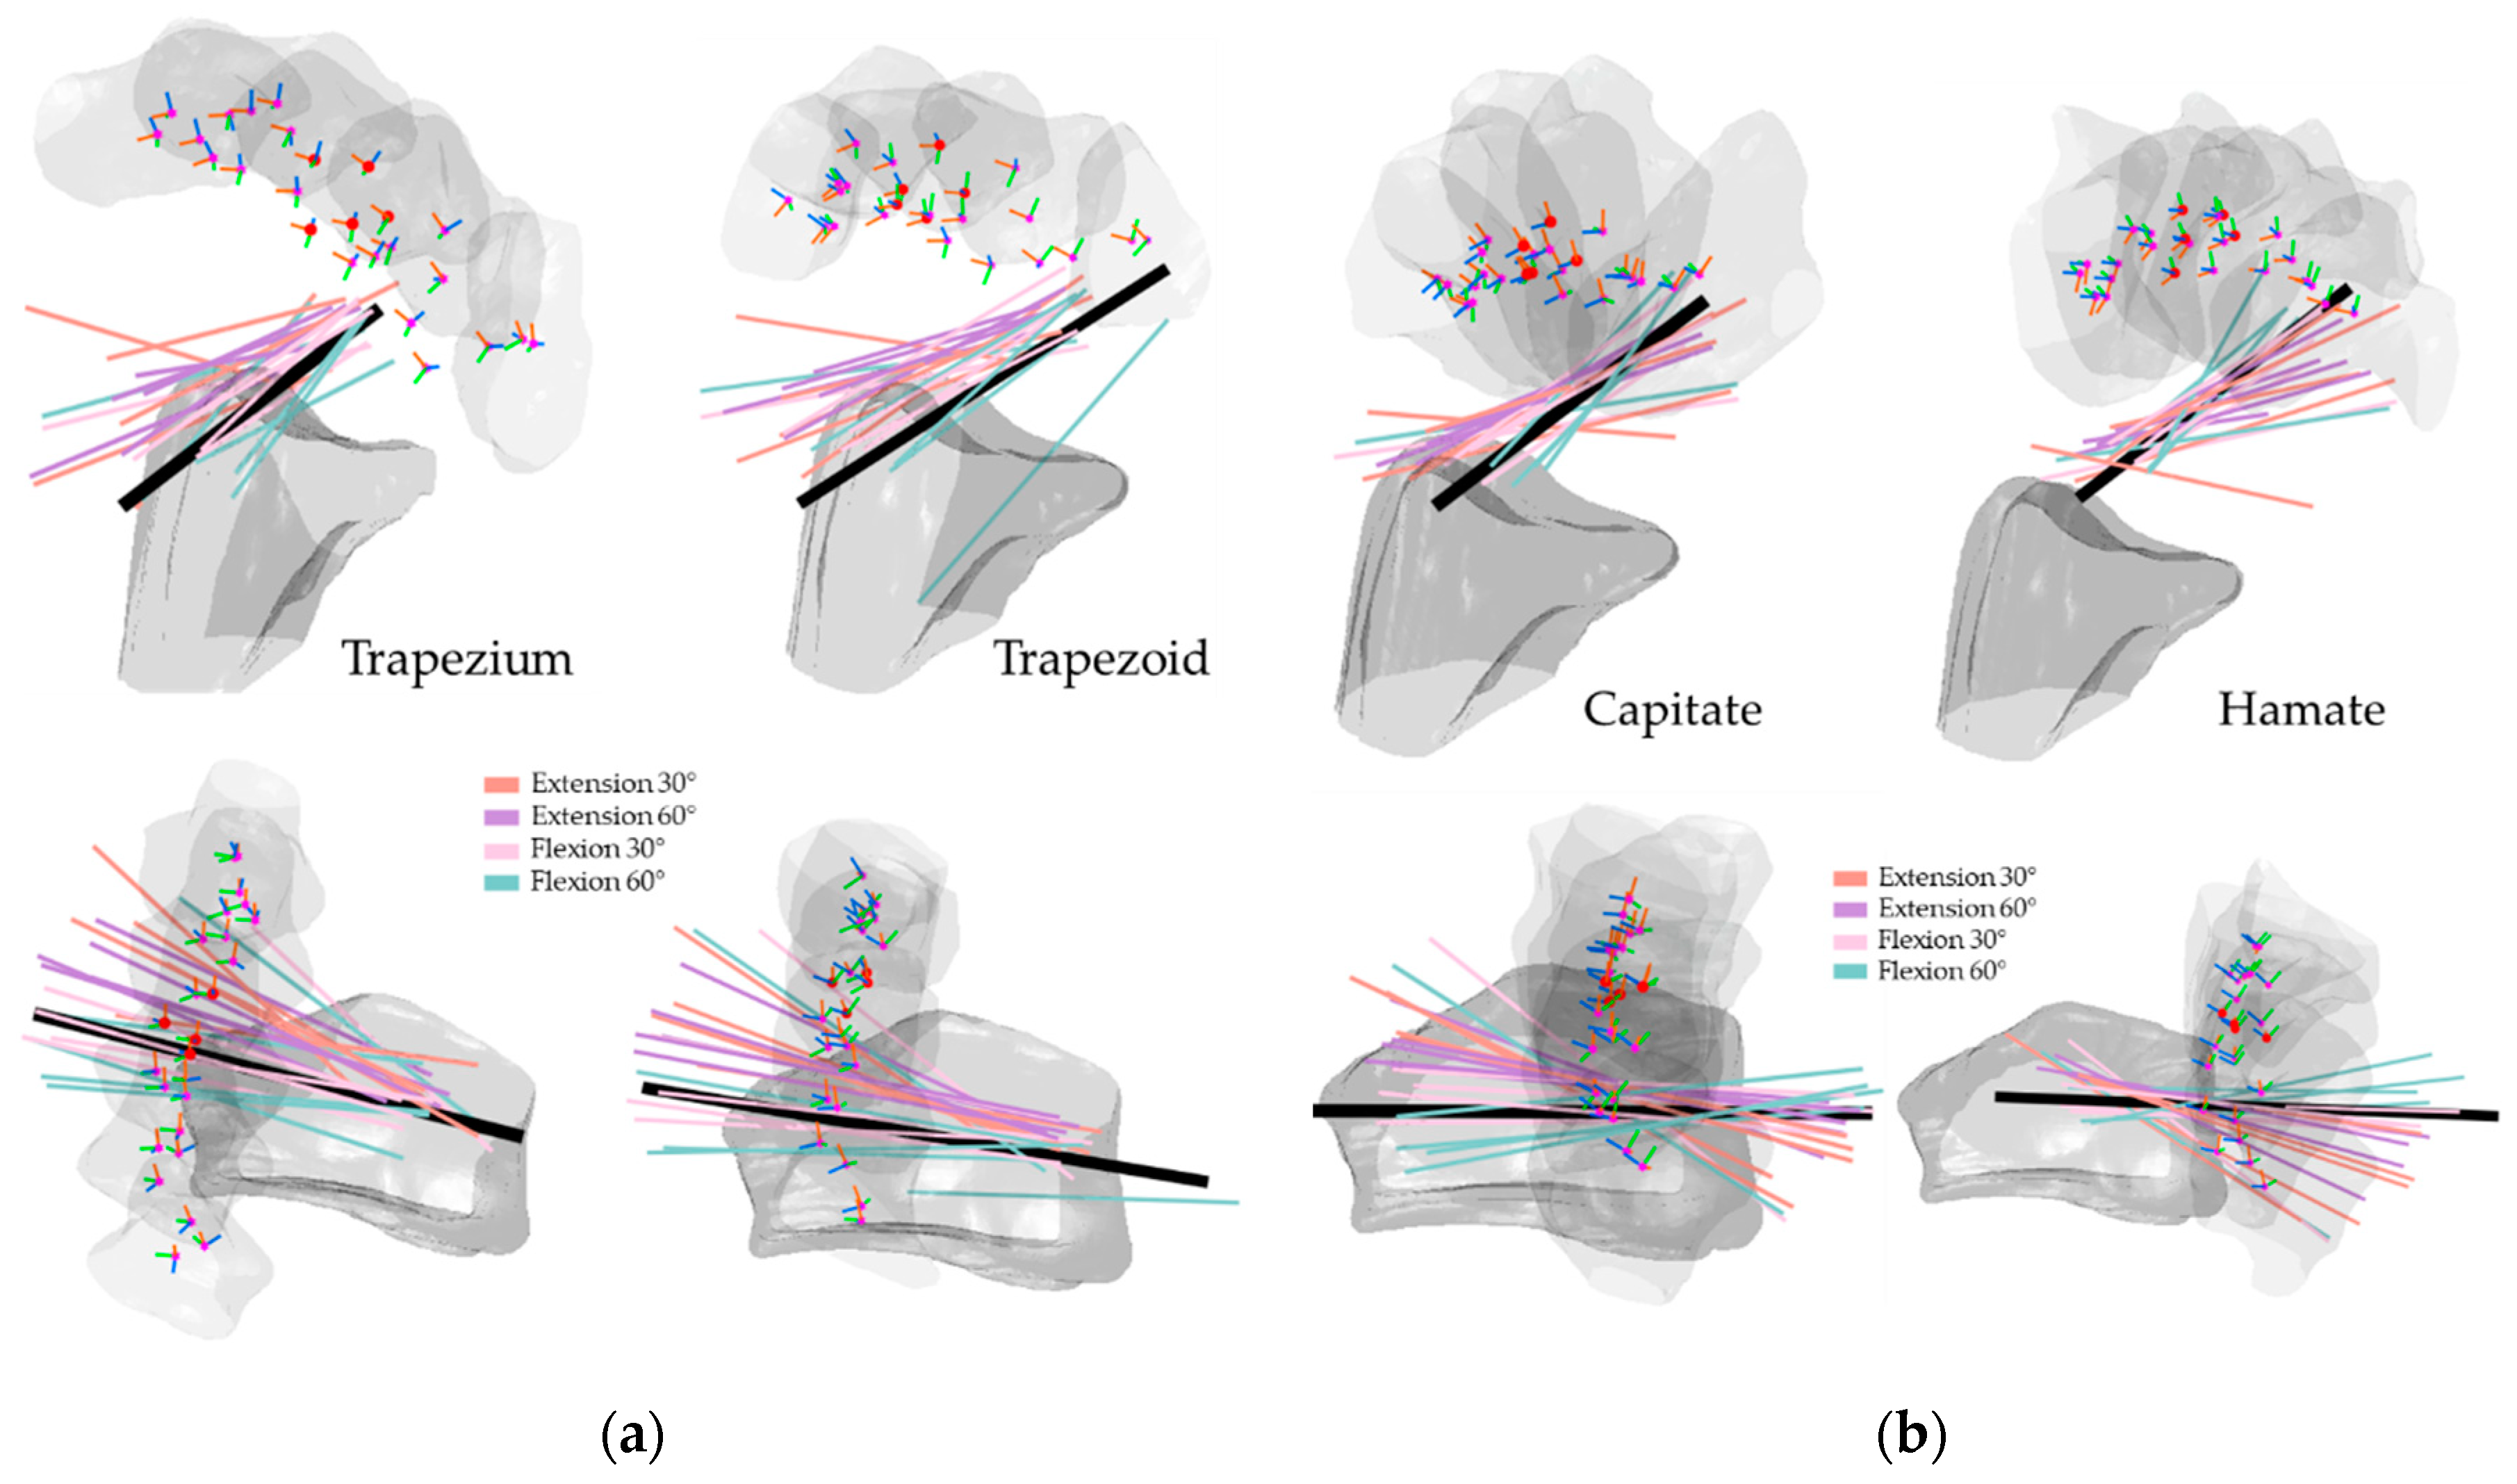
Figure 9.
HA of the distal carpal row in FE: (a) the trapezium and trapezoid; (b) the capitate and hamate. The illustrated are from a left wrist. The upper shows a side palmer view, while the bottom shows a transverse view from distal to proximal. The bold black line shows the average direction of the HAs in FE. Short RGB bars and red dots indicate the orientations and centroids of the same carpal bone from all subjects. The carpal bone from its five FE positions was randomly selected from the subjects to demonstrate the bone movement.
Figure 10.
HA of the proximal carpal row in RUD: (a) the scaphoid and lunate; (b) the triquetrum and pisiform. The illustrated are from a right wrist. The upper shows a side palmer view, while the bottom shows a transverse view from distal to proximal. The bold black line shows the average direction of the HAs in RUD. Short RGB bars and red dots indicate the orientations and centroids of the same carpal bone from all subjects. The carpal bone from its five RUD positions was randomly selected from the subjects to demonstrate the bone movement.
Figure 11.
HA of the distal carpal row in RUD: (a) the trapezium and trapezoid; (b) the capitate and hamate. The illustrated are from a right wrist. The upper shows a side palmer view, while the bottom shows a transverse view from distal to proximal. The bold black line shows the average direction of the HAs in RUD. Short RGB bars and red dots indicate the orientations and centroids of the same carpal bone from all subjects. The carpal bone from its five RUD positions was randomly selected from the subjects to demonstrate the bone movement.
Figure 12.
Decomposed rotation angle around the HA of proximal carpal row for left and right hand of five subjects in FE.
Figure 12.
Decomposed rotation angle around the HA of proximal carpal row for left and right hand of five subjects in FE.
Figure 13.
Decomposed rotation angle around the HA of distal carpal row for left and right hand of five subjects in FE.
Figure 13.
Decomposed rotation angle around the HA of distal carpal row for left and right hand of five subjects in FE.
Figure 14.
Decomposed rotation angle around the HA of proximal carpal row for left and right hand of five subjects in RUD.
Figure 14.
Decomposed rotation angle around the HA of proximal carpal row for left and right hand of five subjects in RUD.
Figure 15.
Decomposed rotation angle around the HA of distal carpal row for left and right hand of five subjects in RUD.
Figure 15.
Decomposed rotation angle around the HA of distal carpal row for left and right hand of five subjects in RUD.
Figure 16.
Boxplot for the Euclidean distance between the proximal carpal row and the radius in FE. The short bars outside the box indicate the maximum and the minimum distance, while the long bold bar inside draws the mean value, which is also shown under the minimum bar.
Figure 16.
Boxplot for the Euclidean distance between the proximal carpal row and the radius in FE. The short bars outside the box indicate the maximum and the minimum distance, while the long bold bar inside draws the mean value, which is also shown under the minimum bar.
Figure 17.
Boxplot for the Euclidean distance between the distal carpal row and the radius in FE. The short bars outside the box indicate the maximum and the minimum distance, while the long bold bar inside draws the mean value, which is also shown under the minimum bar.
Figure 17.
Boxplot for the Euclidean distance between the distal carpal row and the radius in FE. The short bars outside the box indicate the maximum and the minimum distance, while the long bold bar inside draws the mean value, which is also shown under the minimum bar.
Figure 18.
Boxplot for the Euclidean distance between the proximal carpal row and the radius in RUD. The short bars outside the box indicate the maximum and the minimum distance, while the long bold bar inside draws the mean value, which is also shown under the minimum bar.
Figure 18.
Boxplot for the Euclidean distance between the proximal carpal row and the radius in RUD. The short bars outside the box indicate the maximum and the minimum distance, while the long bold bar inside draws the mean value, which is also shown under the minimum bar.
Figure 19.
Boxplot for the Euclidean distance between the distal carpal row and the radius in RUD. The short bars outside the box indicate the maximum and the minimum distance, while the long bold bar inside draws the mean value, which is also shown under the minimum bar.
Figure 19.
Boxplot for the Euclidean distance between the distal carpal row and the radius in RUD. The short bars outside the box indicate the maximum and the minimum distance, while the long bold bar inside draws the mean value, which is also shown under the minimum bar.
Table 1.
Rotation angle around and translation along the HA of scaphoid for both hands, left hand, and right hand of five subjects. The p-value is given between the left and right hands. The R, T, avg, and sd represent rotation angle in degree [°], translation in [mm], mean value, and standard deviation, respectively.
| | Scaphoid |
|---|
| E60° | E30° | F30° | F60° | UD40° | UD20° | RD10° | RD20° |
|---|
| R | T | R | T | R | T | R | T | R | T | R | T | R | T | R | T |
|---|
| Both | avg | −42.20 | −1.35 | −25.39 | −0.79 | 16.97 | −0.17 | 36.30 | −0.25 | −14.42 | −0.87 | −20.98 | −1.78 | 4.06 | −0.09 | 7.11 | −0.05 |
| sd | 10.19 | 0.58 | 8.35 | 0.61 | 6.07 | 0.26 | 12.21 | 0.39 | 6.74 | 0.71 | 6.24 | 0.58 | 3.41 | 0.35 | 5.45 | 0.61 |
| Left | avg | −47.38 | −1.49 | −25.69 | −0.51 | 14.90 | −0.14 | 41.18 | 0.00 | −14.74 | −0.96 | −22.24 | −1.56 | 5.86 | 0.00 | 9.10 | −0.18 |
| sd | 4.44 | 0.67 | 4.95 | 0.80 | 3.25 | 0.26 | 5.56 | 0.23 | 5.74 | 1.05 | 1.47 | 0.62 | 5.10 | 0.16 | 7.68 | 0.22 |
| Right | avg | −38.76 | −1.25 | −25.19 | −0.98 | 18.35 | −0.19 | 33.05 | −0.42 | −14.21 | −0.81 | −20.14 | −1.93 | 2.86 | −0.15 | 5.77 | 0.03 |
| sd | 11.81 | 0.56 | 10.51 | 0.42 | 7.37 | 0.28 | 14.77 | 0.39 | 7.87 | 0.48 | 8.17 | 0.56 | 1.00 | 0.44 | 3.57 | 0.79 |
| p-value | 0.96 | 0.81 | 0.75 | 0.45 | 0.68 | 0.21 | 0.13 | 0.85 | 0.64 | 0.57 | 0.74 | 0.14 | 0.22 | 0.66 | 0.55 | 0.48 |
Table 2.
Rotation angle around and translation along the HA of lunate for both hands, left hand, and right hand of five subjects. The p-value is given between the left and right hands. The R, T, avg, and sd represent rotation angle in degree [°], translation in [mm], mean value, and standard deviation, respectively.
| | Lunate |
|---|
| E60° | E30° | F30° | F60° | UD40° | UD20° | RD10° | RD20° |
|---|
| R | T | R | T | R | T | R | T | R | T | R | T | R | T | R | T |
|---|
| Both | avg | −28.57 | −1.12 | −17.93 | −0.56 | 11.67 | 0.02 | 22.49 | 0.36 | −13.92 | −0.81 | −19.41 | −1.72 | 4.08 | −0.07 | 6.57 | −0.27 |
| sd | 8.15 | 0.51 | 8.15 | 0.63 | 5.64 | 0.20 | 8.94 | 0.63 | 6.94 | 0.78 | 8.22 | 0.77 | 3.49 | 0.40 | 5.16 | 0.59 |
| Left | avg | −30.86 | −1.13 | −17.74 | −0.21 | 9.76 | 0.05 | 23.91 | 0.79 | −14.82 | −1.10 | −21.28 | −1.76 | 5.19 | 0.03 | 8.75 | −0.11 |
| sd | 4.87 | 0.50 | 2.97 | 0.67 | 2.55 | 0.13 | 4.36 | 0.43 | 4.81 | 1.02 | 2.29 | 0.69 | 5.25 | 0.17 | 6.77 | 0.19 |
| Right | avg | −27.05 | −1.12 | −18.05 | −0.80 | 12.95 | −0.01 | 21.55 | 0.07 | −13.33 | −0.61 | −18.17 | −1.69 | 3.34 | −0.14 | 5.11 | −0.38 |
| sd | 9.91 | 0.56 | 10.69 | 0.54 | 6.97 | 0.25 | 11.39 | 0.59 | 8.46 | 0.59 | 10.67 | 0.89 | 1.92 | 0.51 | 3.74 | 0.75 |
| p-value | 0.82 | 0.8 | 0.76 | 0.57 | 0.64 | 0.2 | 0.18 | 0.55 | 0.8 | 0.35 | 0.94 | 0.93 | 0.52 | 0.69 | 0.6 | 0.43 |
Table 3.
Rotation angle around and translation along the HA of triquetrum for both hands, left hand, and right hand of five subjects. The p-value is given between the left and right hands. The R, T, avg, and sd represent rotation angle in degree [°], translation in [mm], mean value, and standard deviation, respectively.
| | Triquetrum |
|---|
| E60° | E30° | F30° | F60° | UD40° | UD20° | RD10° | RD20° |
|---|
| R | T | R | T | R | T | R | T | R | T | R | T | R | T | R | T |
|---|
| Both | avg | −29.56 | −1.18 | −18.18 | −0.53 | 12.86 | 0.21 | 24.56 | 0.77 | −13.39 | −0.26 | −19.52 | −1.26 | 4.04 | 0.16 | 6.46 | 0.09 |
| sd | 5.77 | 0.78 | 4.52 | 0.58 | 4.90 | 0.27 | 8.47 | 0.58 | 6.79 | 0.76 | 6.71 | 0.64 | 2.61 | 0.48 | 3.57 | 0.46 |
| Left | avg | −33.29 | −1.22 | −18.18 | −0.20 | 12.28 | 0.12 | 27.97 | 1.05 | −15.45 | −0.59 | −22.05 | −1.28 | 5.05 | 0.09 | 7.51 | 0.06 |
| sd | 3.51 | 0.87 | 3.95 | 0.69 | 1.53 | 0.24 | 1.71 | 0.57 | 5.87 | 0.84 | 0.88 | 0.19 | 3.91 | 0.47 | 4.21 | 0.31 |
| Right | avg | −27.07 | −1.16 | −18.18 | −0.74 | 13.25 | 0.27 | 22.28 | 0.59 | −12.01 | −0.03 | −17.83 | −1.24 | 3.36 | 0.20 | 5.75 | 0.12 |
| sd | 5.83 | 0.81 | 5.23 | 0.43 | 6.44 | 0.30 | 10.58 | 0.55 | 7.53 | 0.67 | 8.48 | 0.85 | 1.32 | 0.52 | 3.29 | 0.57 |
| p-value | 0.62 | 0.74 | 0.73 | 0.54 | 0.5 | 0.59 | 0.14 | 0.64 | 0.49 | 0.59 | 0.62 | 0.66 | 0.52 | 0.07 | 0.71 | 0.98 |
Table 4.
Rotation angle around and translation along the HA of pisiform for both hands, left hand, and right hand of five subjects. The p-value is given between the left and right hands. The R, T, avg, and sd represent rotation angle in degree [°], translation in [mm], mean value, and standard deviation, respectively.
| | Pisiform |
|---|
| E60° | E30° | F30° | F60° | UD40° | UD20° | RD10° | RD20° |
|---|
| R | T | R | T | R | T | R | T | R | T | R | T | R | T | R | T |
|---|
| Both | avg | −25.56 | 0.65 | −15.39 | 0.67 | 10.68 | 0.34 | 23.77 | 1.31 | −7.07 | −0.74 | −7.96 | −0.56 | 3.93 | −0.09 | 4.77 | 0.15 |
| sd | 7.98 | 3.17 | 2.69 | 1.69 | 4.87 | 0.91 | 11.62 | 1.50 | 4.19 | 1.60 | 4.04 | 0.67 | 3.01 | 0.71 | 2.51 | 1.12 |
| Left | avg | −27.95 | −0.29 | −16.39 | 0.42 | 12.39 | 0.61 | 31.13 | 1.40 | −8.08 | −0.60 | −9.30 | −0.83 | 3.44 | −0.14 | 3.77 | 0.15 |
| sd | 4.42 | 3.24 | 2.92 | 1.11 | 4.72 | 0.66 | 9.91 | 1.30 | 5.60 | 1.86 | 4.20 | 0.75 | 3.31 | 0.62 | 2.41 | 0.86 |
| Right | avg | −23.97 | 1.28 | −14.73 | 0.85 | 9.53 | 0.16 | 18.86 | 1.24 | −6.40 | −0.83 | −7.06 | −0.37 | 4.26 | −0.05 | 5.44 | 0.15 |
| sd | 9.77 | 3.25 | 2.57 | 2.08 | 5.04 | 1.06 | 10.58 | 1.73 | 3.38 | 1.58 | 4.05 | 0.61 | 3.07 | 0.81 | 2.56 | 1.34 |
| p-value | 0.65 | 0.22 | 0.22 | 0.71 | 0.25 | 0.08 | 0.06 | 0.28 | 0.9 | 0.71 | 0.3 | 0.73 | 0.59 | 0.13 | 0.75 | 0.32 |
Table 5.
Rotation angle around and translation along the HA of trapezium for both hands, left hand, and right hand of five subjects. The p-value is given between the left and right hands. The R, T, avg, and sd represent rotation angle in degree [°], translation in [mm], mean value, and standard deviation, respectively.
| | Trapezium |
|---|
| E60° | E30° | F30° | F60° | UD40° | UD20° | RD10° | RD20° |
|---|
| R | T | R | T | R | T | R | T | R | T | R | T | R | T | R | T |
|---|
| Both | avg | −39.56 | −1.58 | −22.33 | −1.41 | 17.07 | −0.44 | 37.97 | −0.95 | −13.69 | −1.45 | −19.17 | −2.19 | 5.16 | −0.52 | 7.92 | −0.31 |
| sd | 6.83 | 1.04 | 6.49 | 1.04 | 5.61 | 0.73 | 13.87 | 1.92 | 5.47 | 0.91 | 5.43 | 0.95 | 3.01 | 0.55 | 3.60 | 0.95 |
| Left | avg | −42.43 | −1.72 | −21.36 | −0.95 | 17.83 | −0.34 | 47.34 | −1.09 | −14.57 | −1.33 | −21.47 | −1.88 | 5.11 | −0.72 | 8.08 | −0.87 |
| sd | 6.17 | 0.66 | 7.36 | 0.59 | 5.15 | 0.49 | 5.30 | 3.02 | 5.60 | 0.91 | 4.00 | 0.49 | 3.58 | 0.69 | 4.71 | 0.99 |
| Right | avg | −37.64 | −1.50 | −22.98 | −1.71 | 16.56 | −0.51 | 31.73 | −0.86 | −13.11 | −1.53 | −17.64 | −2.40 | 5.20 | −0.39 | 7.82 | 0.07 |
| sd | 7.08 | 1.29 | 6.49 | 1.21 | 6.32 | 0.90 | 14.57 | 1.06 | 5.84 | 0.99 | 6.04 | 1.17 | 2.94 | 0.46 | 3.17 | 0.79 |
| p-value | 0.78 | 0.8 | 0.53 | 0.37 | 0.58 | 0.87 | 0.24 | 0.59 | 0.52 | 0.56 | 0.44 | 0.4 | 0.4 | 0.17 | 0.6 | 0.25 |
Table 6.
Rotation angle around and translation along the HA of trapezoid for both hands, left hand, and right hand of five subjects. The p-value is given between the left and right hands. The R, T, avg, and sd represent rotation angle in degree [°], translation in [mm], mean value, and standard deviation, respectively.
| | Trapezoid |
|---|
| E60° | E30° | F30° | F60° | UD40° | UD20° | RD10° | RD20° |
|---|
| R | T | R | T | R | T | R | T | R | T | R | T | R | T | R | T |
|---|
| Both | avg | −43.62 | −1.95 | −23.04 | −1.22 | 17.34 | −0.45 | 39.45 | −1.52 | −13.24 | −1.78 | −19.75 | −2.90 | 4.67 | −0.34 | 7.55 | −0.46 |
| sd | 7.77 | 0.53 | 6.16 | 0.97 | 5.34 | 0.67 | 16.47 | 1.53 | 5.58 | 0.92 | 5.41 | 1.08 | 3.16 | 0.91 | 3.95 | 1.02 |
| Left | avg | −45.54 | −2.08 | −21.66 | −0.82 | 17.51 | −0.32 | 45.86 | −1.86 | −14.44 | −1.67 | −20.28 | −2.60 | 4.48 | −0.98 | 8.20 | −0.86 |
| sd | 4.61 | 0.41 | 6.07 | 0.76 | 4.25 | 0.25 | 15.29 | 1.92 | 5.80 | 0.83 | 1.92 | 0.50 | 4.17 | 0.86 | 5.66 | 1.10 |
| Right | avg | −42.35 | −1.87 | −23.95 | −1.48 | 17.23 | −0.53 | 35.18 | −1.28 | −12.44 | −1.85 | −19.40 | −3.11 | 4.79 | 0.09 | 7.12 | −0.20 |
| sd | 9.54 | 0.62 | 6.61 | 1.06 | 6.36 | 0.87 | 17.12 | 1.35 | 5.84 | 1.04 | 7.08 | 1.35 | 2.75 | 0.71 | 2.88 | 0.97 |
| p-value | 0.99 | 0.83 | 0.47 | 0.44 | 0.72 | 0.78 | 0.51 | 0.17 | 0.62 | 0.87 | 0.84 | 0.35 | 0.64 | 0.07 | 0.92 | 0.62 |
Table 7.
Rotation angle around and translation along the HA of capitate for both hands, left hand, and right hand of five subjects. The p-value is given between the left and right hands. The R, T, avg, and sd represent rotation angle in degree [°], translation in [mm], mean value, and standard deviation, respectively.
| | Capitate |
|---|
| E60° | E30° | F30° | F60° | UD40° | UD20° | RD10° | RD20° |
|---|
| R | T | R | T | R | T | R | T | R | T | R | T | R | T | R | T |
|---|
| Both | avg | −42.30 | −1.25 | −23.38 | −1.15 | 18.38 | −0.44 | 42.73 | −0.27 | −15.45 | −1.58 | −22.29 | −2.64 | 5.32 | −0.28 | 8.81 | −0.32 |
| sd | 7.60 | 0.79 | 6.41 | 0.92 | 5.58 | 0.46 | 14.93 | 1.37 | 5.67 | 0.90 | 6.12 | 0.92 | 3.35 | 0.60 | 4.18 | 0.92 |
| Left | avg | −45.32 | −1.61 | −22.44 | −0.87 | 18.33 | −0.03 | 52.13 | 0.86 | −16.39 | −1.59 | −23.59 | −2.44 | 6.25 | −0.52 | 10.29 | −0.76 |
| sd | 5.01 | 0.50 | 6.41 | 0.70 | 5.75 | 0.32 | 2.83 | 0.85 | 4.65 | 0.98 | 2.11 | 0.63 | 4.57 | 0.60 | 5.52 | 0.84 |
| Right | avg | −40.29 | −1.01 | −24.00 | −1.33 | 18.41 | −0.71 | 36.47 | −1.02 | −14.81 | −1.56 | −21.42 | −2.78 | 4.70 | −0.11 | 7.82 | −0.02 |
| sd | 8.76 | 0.89 | 6.94 | 1.06 | 6.02 | 0.32 | 16.70 | 1.12 | 6.60 | 0.93 | 7.91 | 1.11 | 2.55 | 0.59 | 3.21 | 0.93 |
| p-value | 0.77 | 0.77 | 0.68 | 0.5 | 0.82 | 0.26 | 0.26 | 0.34 | 0.61 | 0.99 | 0.98 | 0.4 | 0.61 | 0.07 | 0.72 | 0.26 |
Table 8.
Rotation angle around and translation along the HA of hamate for both hands, left hand, and right hand of five subjects. The p-value is given between the left and right hands. The R, T, avg, and sd represent rotation angle in degree [°], translation in [mm], mean value, and standard deviation, respectively.
| | Hamate |
|---|
| E60° | E30° | F30° | F60° | UD40° | UD20° | RD10° | RD20° |
|---|
| R | T | R | T | R | T | R | T | R | T | R | T | R | T | R | T |
|---|
| Both | avg | −41.71 | −1.79 | −22.99 | −1.28 | 17.43 | −0.49 | 40.19 | −0.34 | −15.94 | −1.31 | −23.01 | −2.36 | 5.16 | −0.29 | 8.49 | −0.14 |
| sd | 7.35 | 0.75 | 6.64 | 0.90 | 5.12 | 0.50 | 13.28 | 1.40 | 5.90 | 1.07 | 6.40 | 1.20 | 3.01 | 0.55 | 4.31 | 1.15 |
| Left | avg | −45.51 | −2.17 | −22.01 | −0.97 | 17.01 | −0.08 | 47.28 | 0.71 | −17.27 | −1.42 | −24.10 | −2.10 | 5.42 | −0.65 | 9.02 | −0.59 |
| sd | 5.22 | 0.56 | 6.65 | 0.66 | 4.32 | 0.28 | 2.17 | 0.96 | 5.20 | 1.30 | 2.34 | 0.58 | 4.07 | 0.56 | 5.99 | 1.01 |
| Right | avg | −39.17 | −1.53 | −23.64 | −1.48 | 17.71 | −0.76 | 35.47 | −1.04 | −15.05 | −1.24 | −22.29 | −2.52 | 4.99 | −0.06 | 8.13 | 0.17 |
| sd | 7.84 | 0.80 | 7.17 | 1.04 | 5.98 | 0.43 | 15.74 | 1.22 | 6.64 | 1.01 | 8.29 | 1.52 | 2.50 | 0.43 | 3.39 | 1.23 |
| p-value | 0.63 | 0.78 | 0.66 | 0.58 | 0.83 | 0.21 | 0.27 | 0.38 | 0.5 | 0.73 | 0.98 | 0.11 | 0.46 | 0.06 | 0.98 | 0.19 |
Table 9.
Bone volumes in mm3 of involved subjects.
Table 9.
Bone volumes in mm3 of involved subjects.
| | Scaphoid | Lunate | Triquetrum | Pisiform | Trapezium | Trapezoid | Capitate | Hamate |
|---|
| Sub 1 | 2309.7 | 1699.8 | 1363.2 | 622.4 | 1673.0 | 1095.9 | 3243.0 | 2141.0 |
| Sub 2 | 2411.4 | 1569.1 | 1389.9 | 996.7 | 2012.0 | 1345.8 | 3389.4 | 2890.7 |
| Sub 3 | 2216.7 | 1632.1 | 1245.4 | 640.9 | 1865.8 | 1152.5 | 3249.2 | 2529.6 |
| Sub 4 | 2073.8 | 1733.2 | 1258.6 | 631.1 | 1494.9 | 1233.4 | 2862.5 | 2446.8 |
| Sub 5 | 1849.2 | 1184.0 | 1277.0 | 637.3 | 1695.8 | 1152.1 | 2643.1 | 2443.4 |
| mean | 1961.5 | 1458.6 | 1267.8 | 634.2 | 1595.3 | 1192.7 | 2752.8 | 2445.1 |
| SD | 196.0 | 198.1 | 58.4 | 145.6 | 176.6 | 86.8 | 279.0 | 240.0 |


