
ABA-Dependent Regulation of Calcium-Dependent Protein Kinase Gene GmCDPK5 in Cultivated and Wild Soybeans

 , , , and
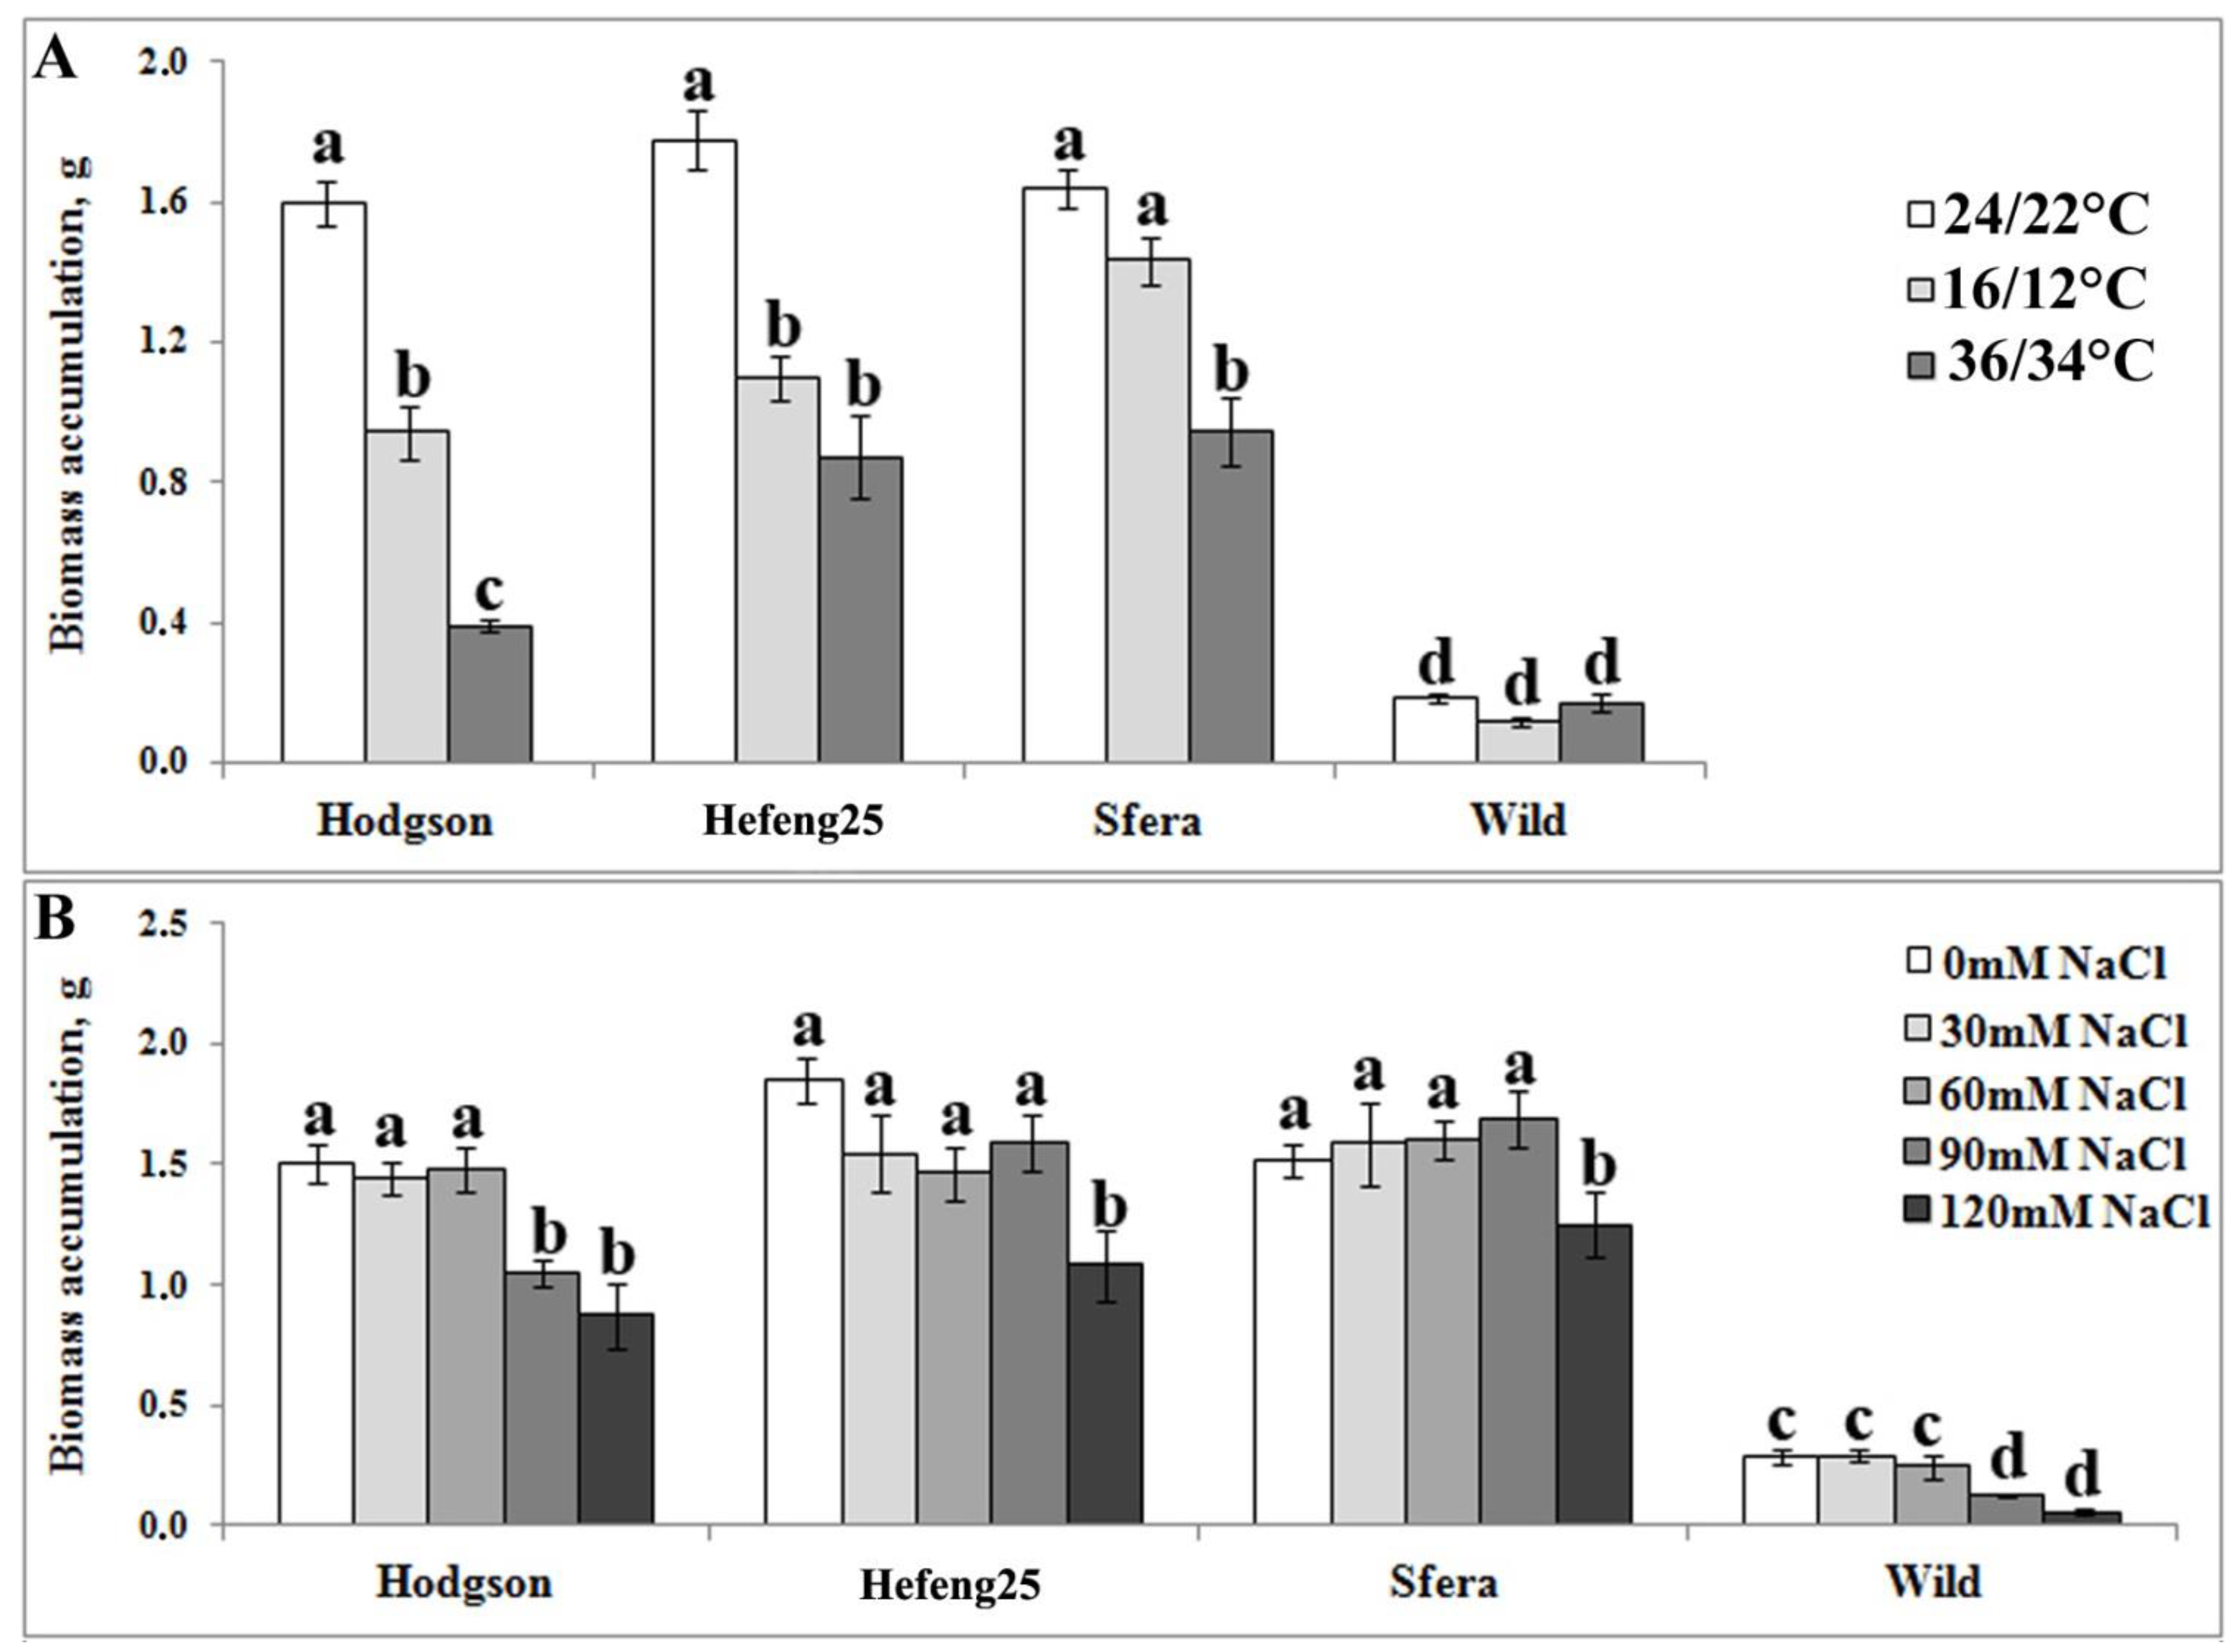
Abstract
1. Introduction
2. Materials and Methods
2.1. Plants Material, Cultivation, and Experimental Design
2.2. Molecular and Phylogenetic Analysis of the GmCDPKs and the Design of Unique Primer Pairs
2.3. RNA Extraction, cDNA Synthesis, and qPCR Reaction
2.4. ABA Measurement
2.4.1. Chemicals
2.4.2. Sample Preparation for HPLC-MS/MS
2.4.3. HPLC-MS/MS Analysis
2.5. Statistical Analysis
3. Results
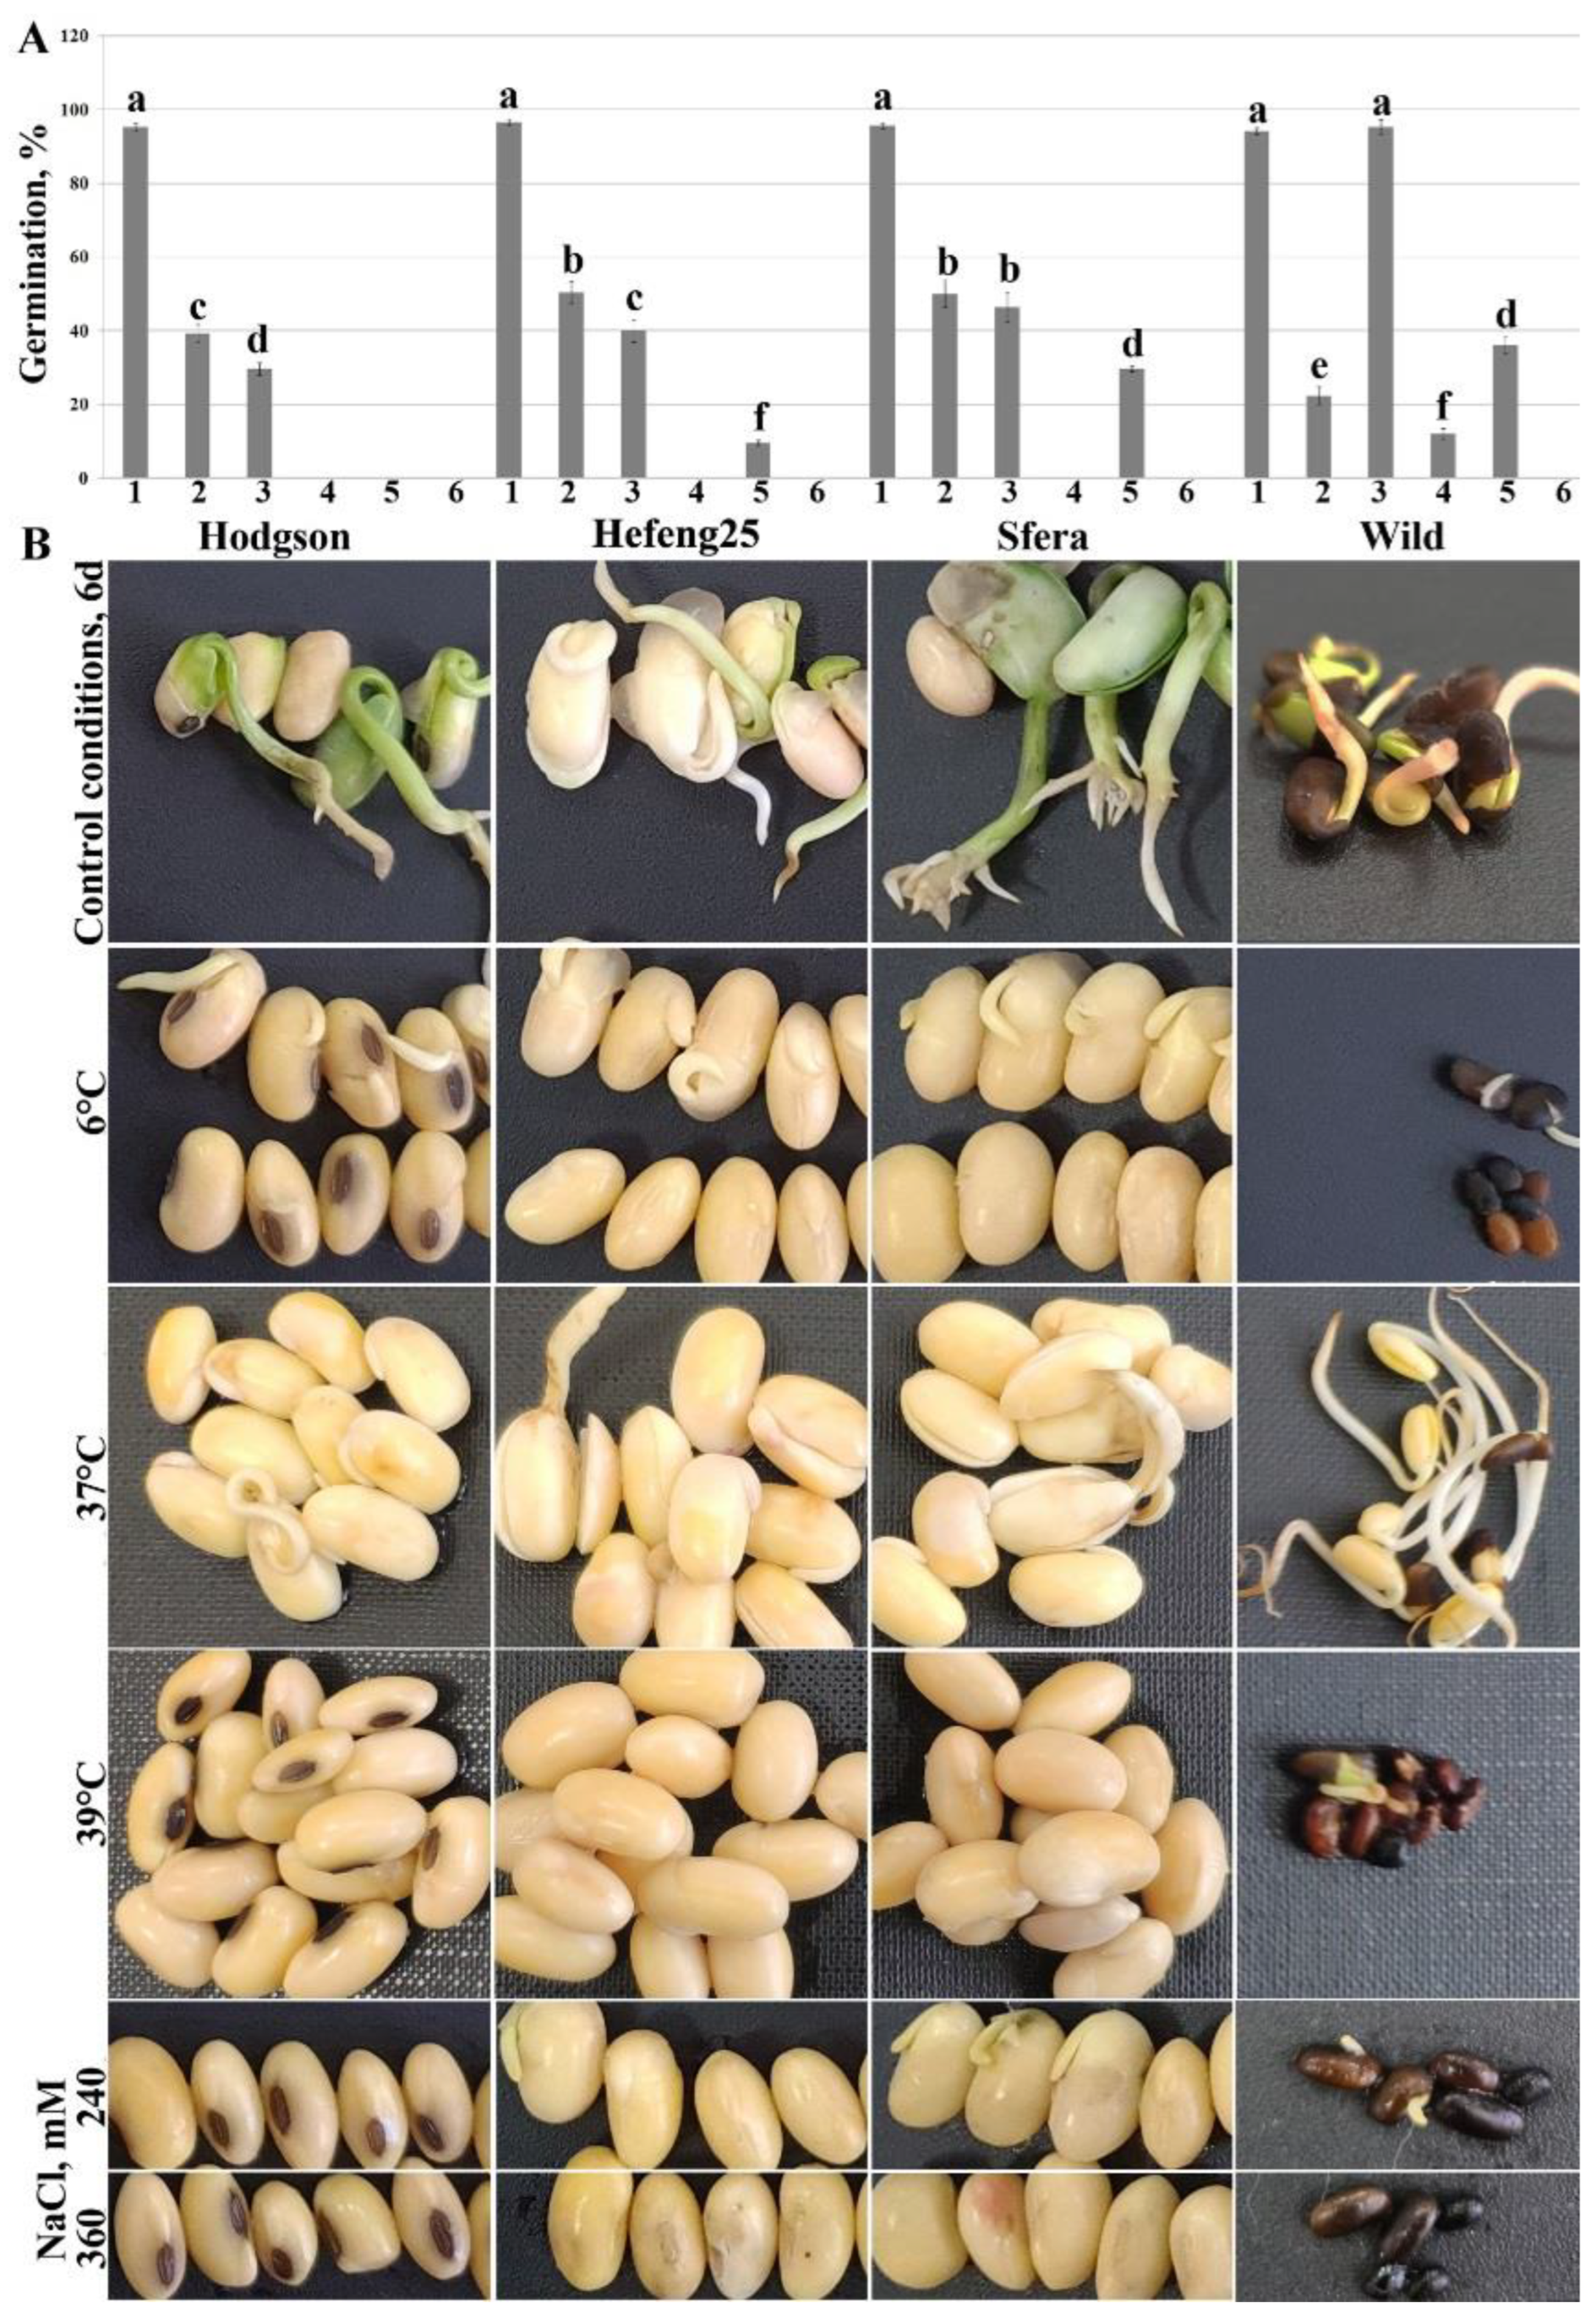
3.1. Comparative In Vitro Analysis of Abiotic Stress Resistance of Wild and Cultivated Soybean Plants
3.2. Molecular and Phylogenetic Analysis of G. max AtCDPK1 Homologues
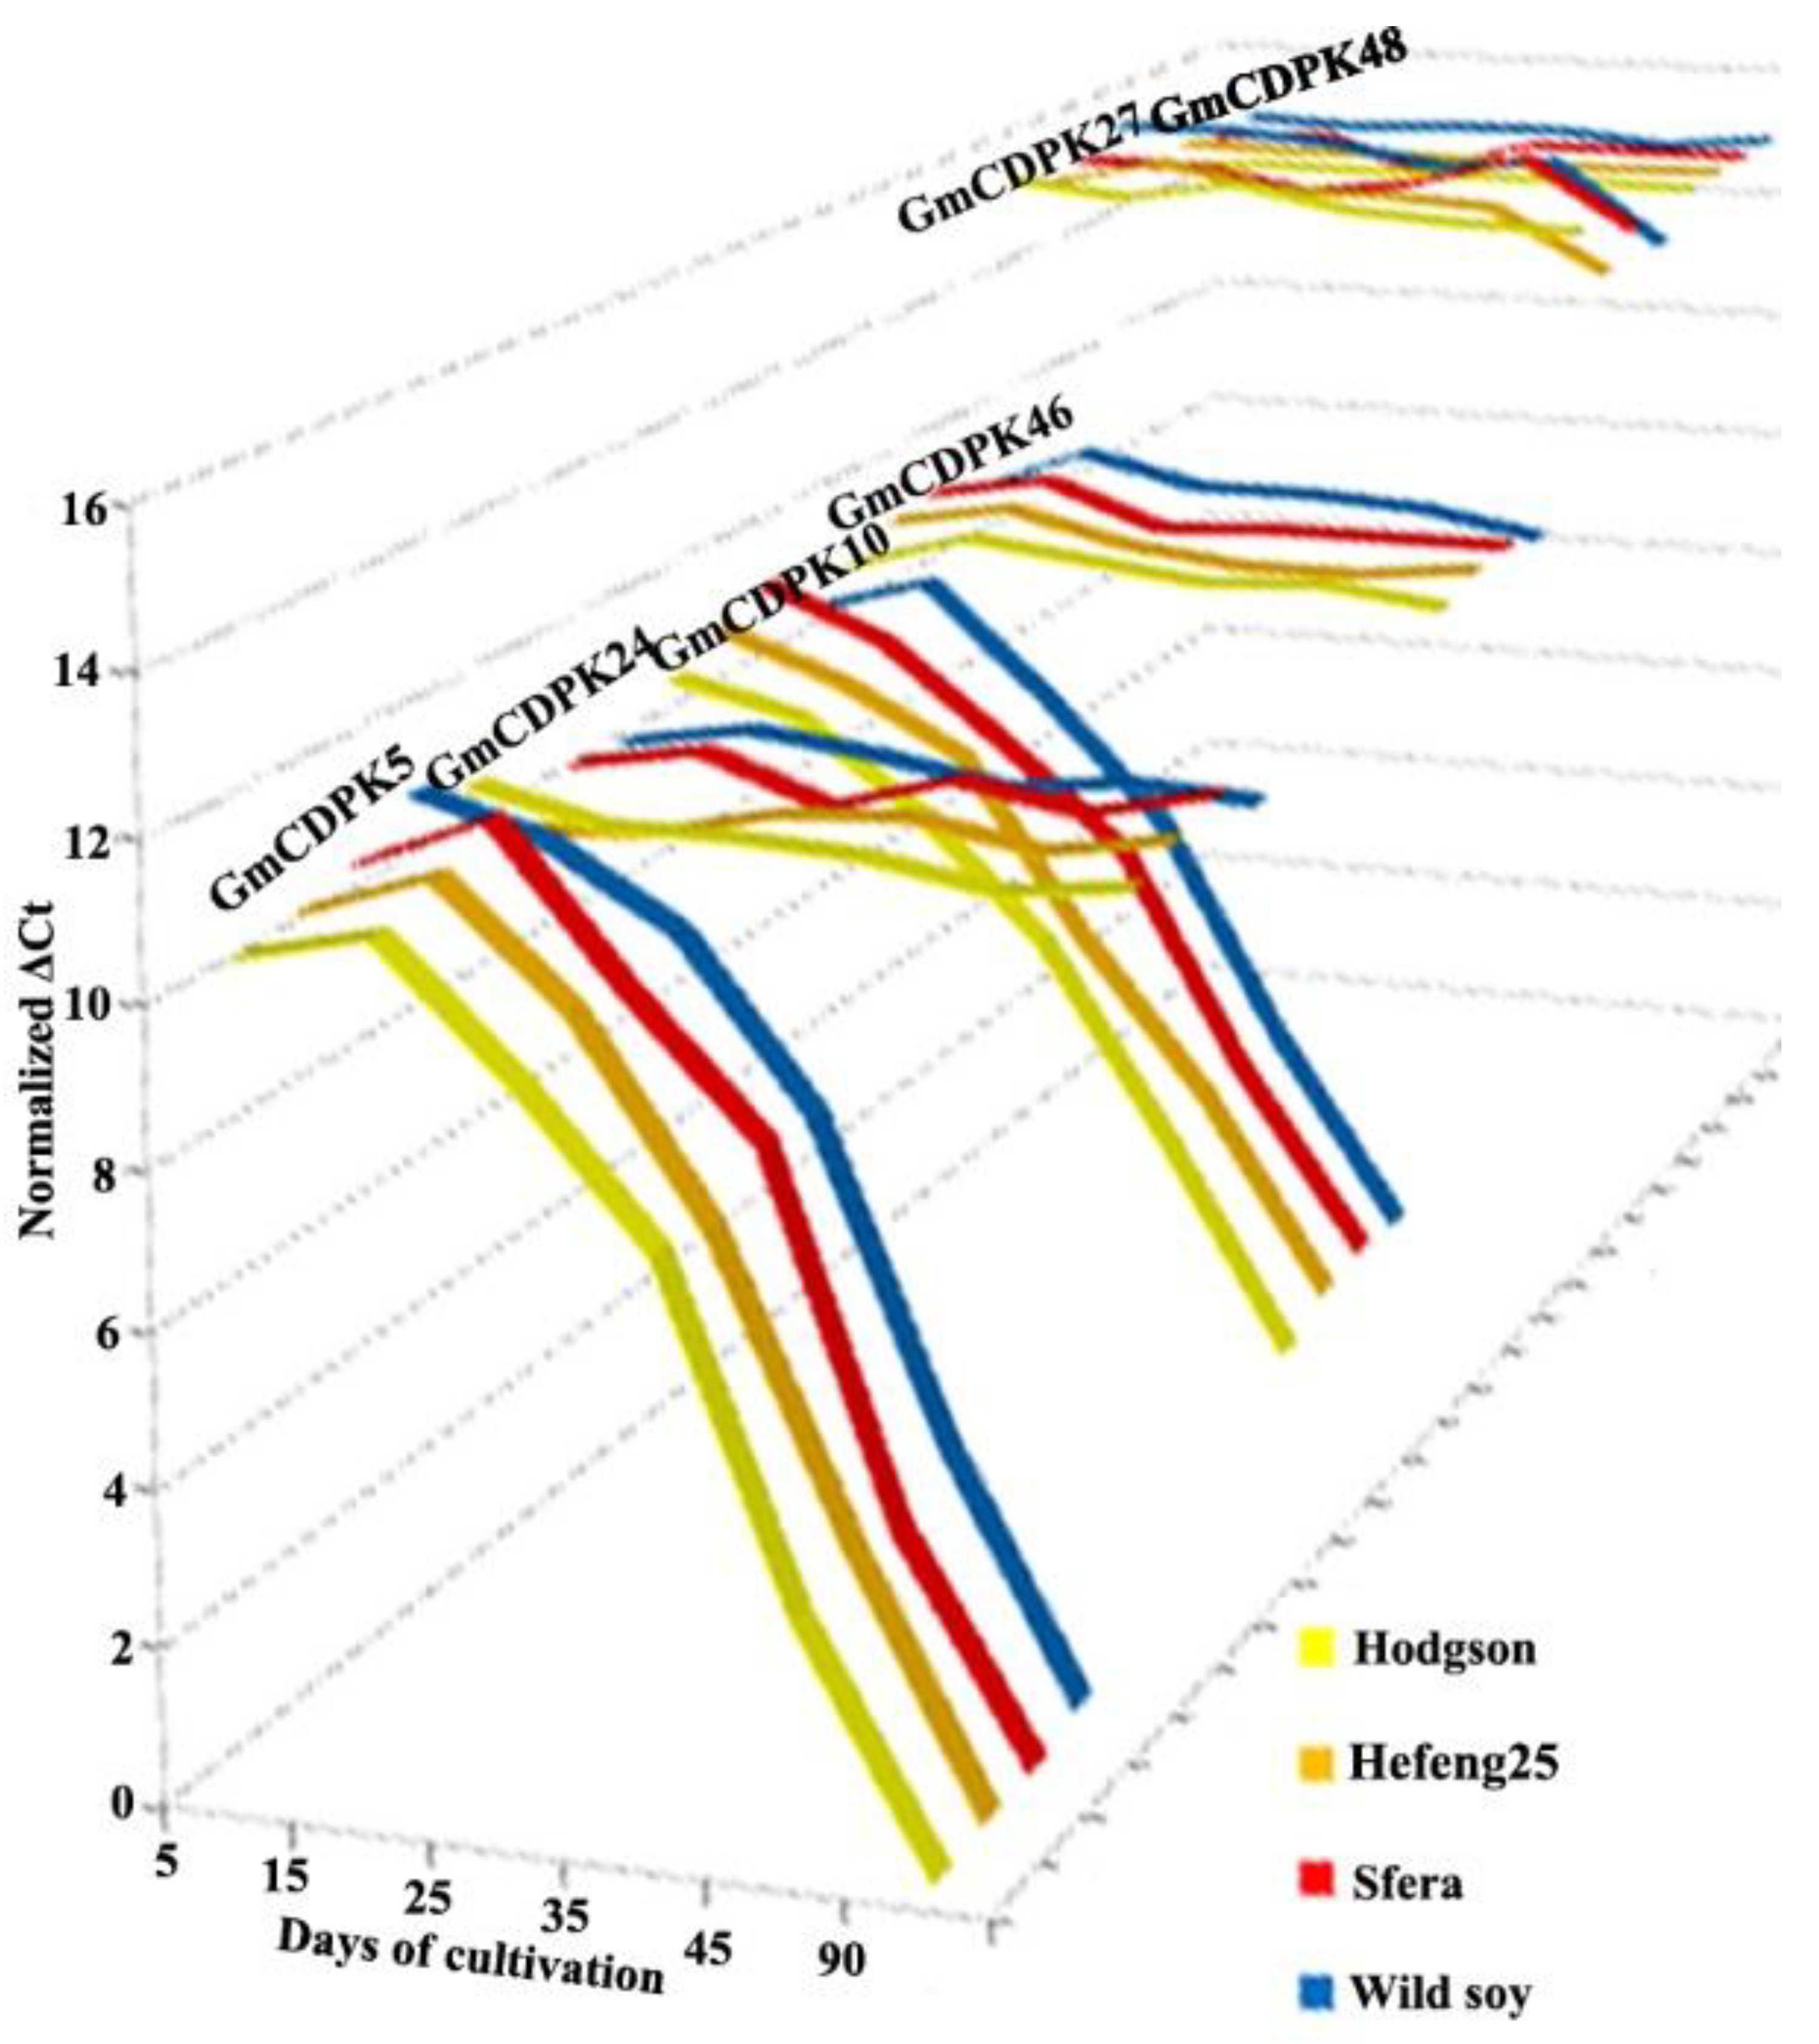
3.3. CDPK Expression during Growth Phases
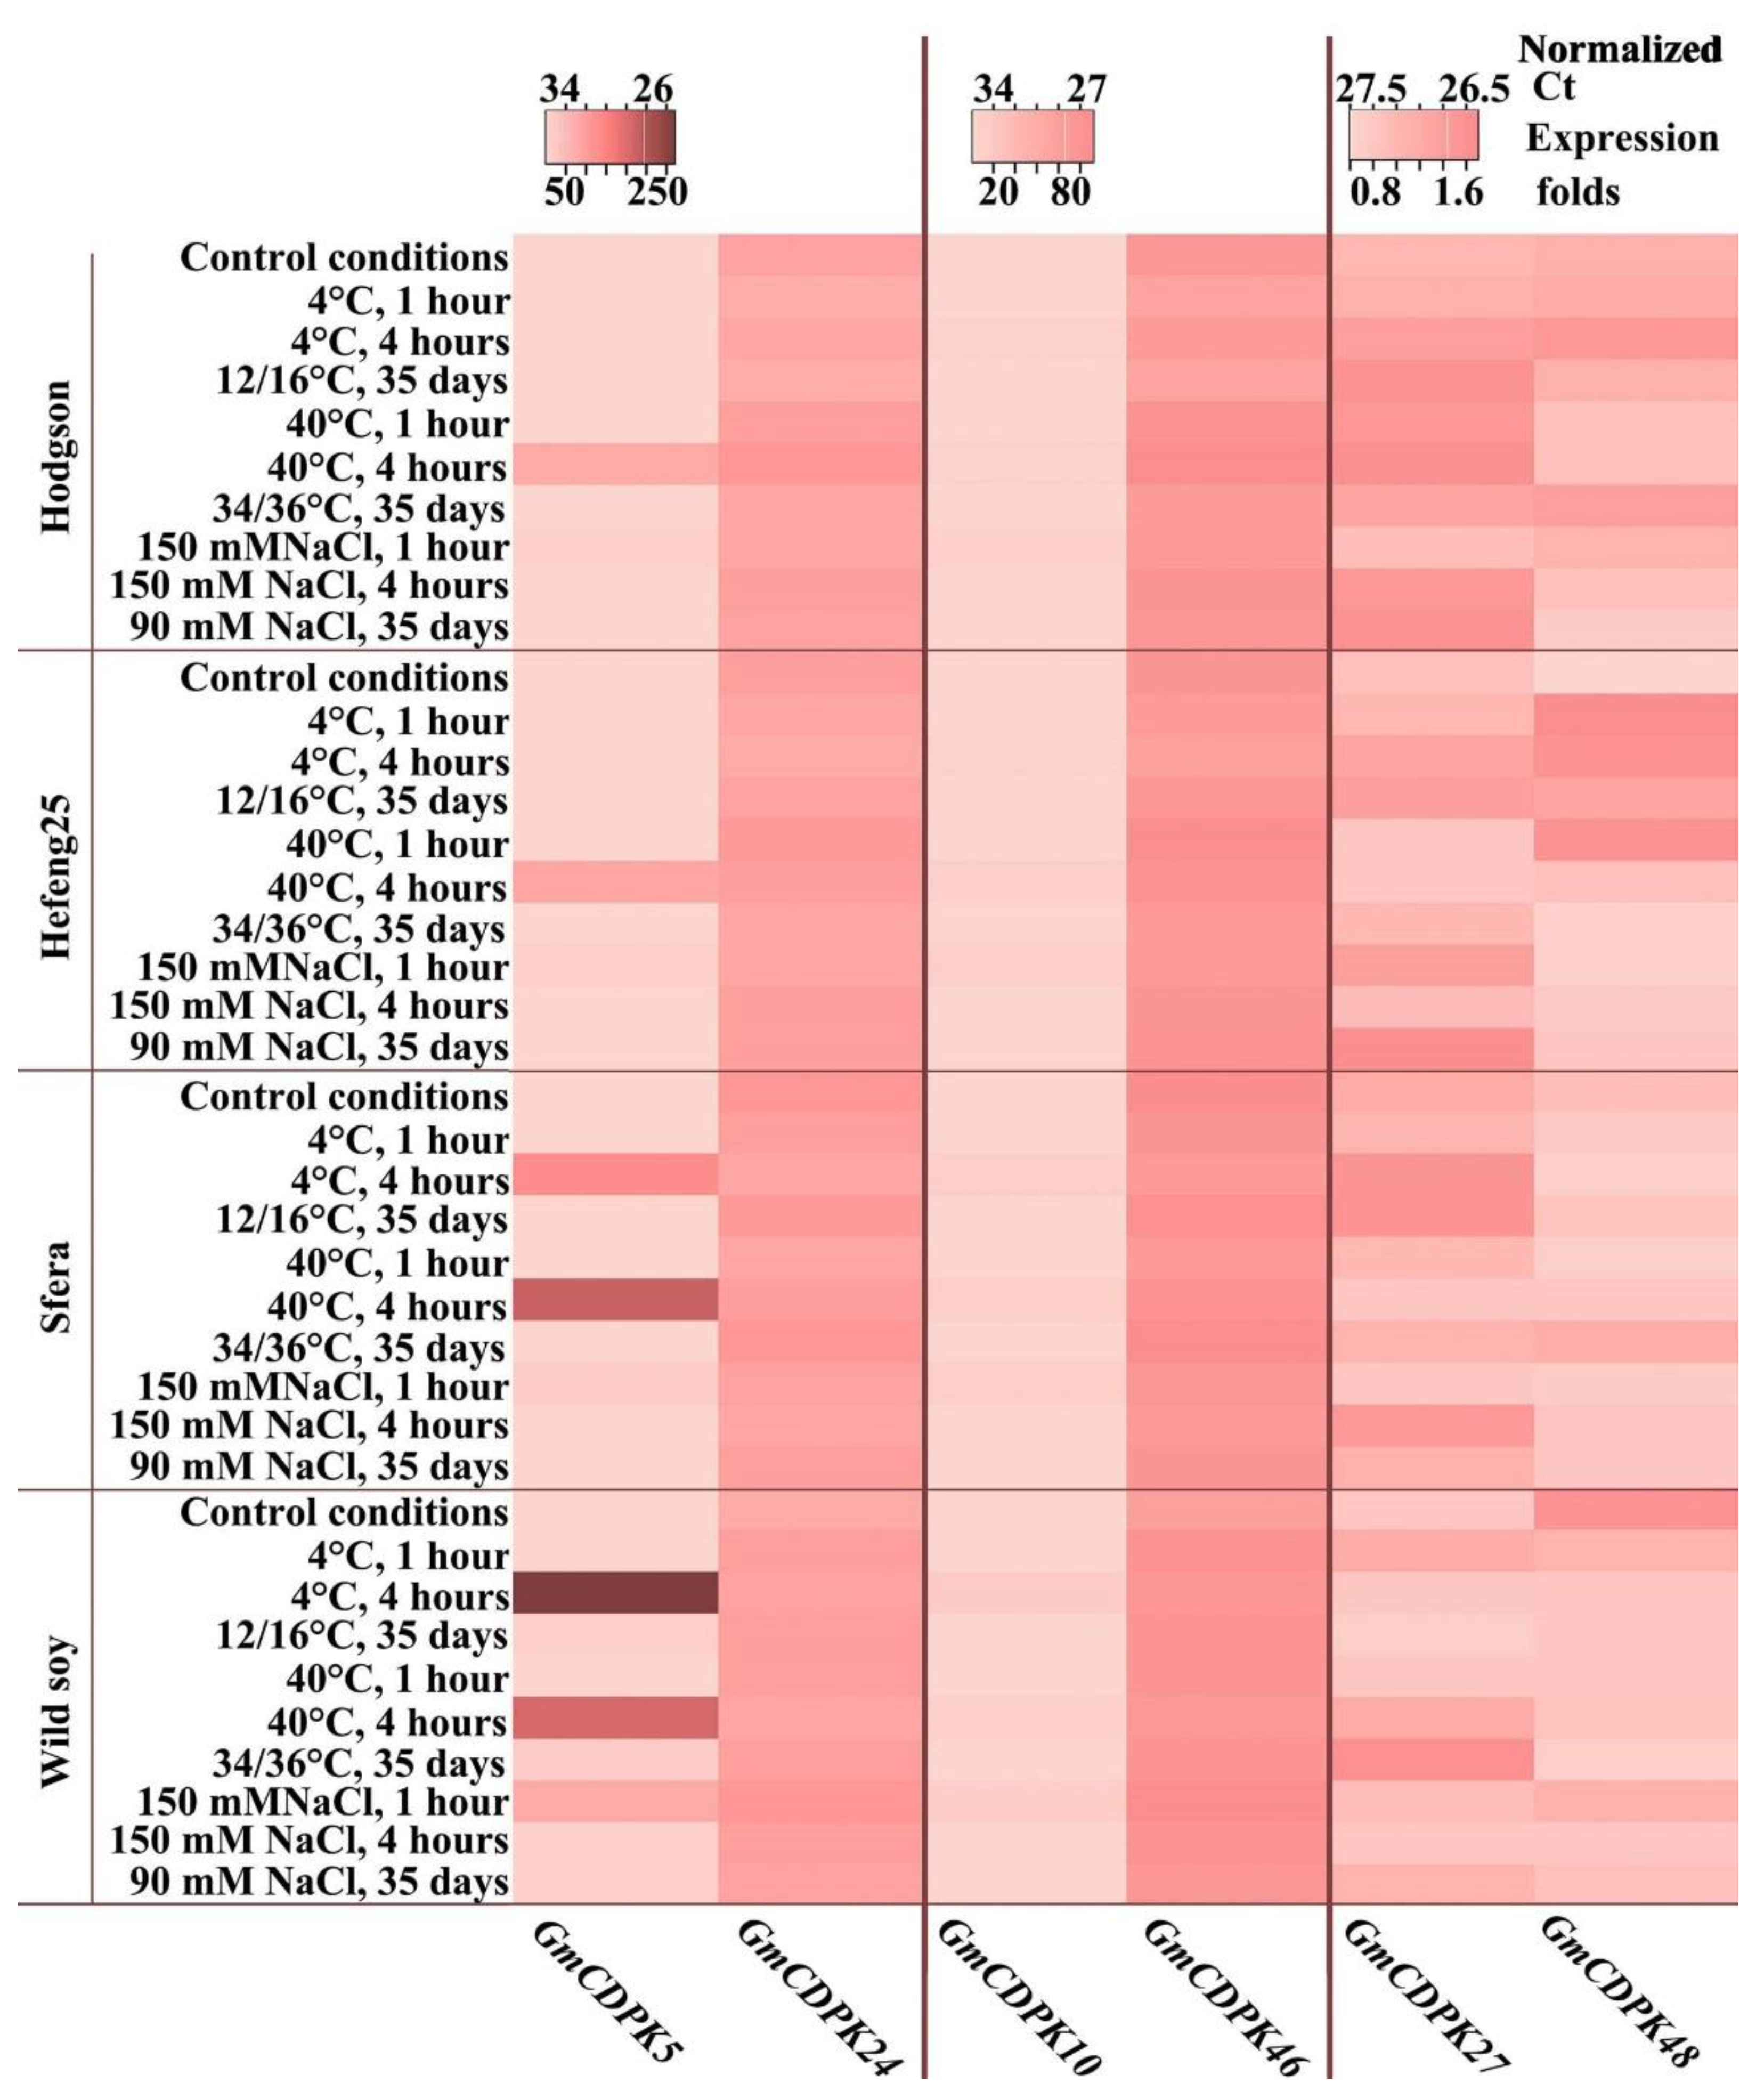
3.4. CDPK Expression under Short- and Long-Term Abiotic Stress Treatment
3.5. ABA Levels and 9-Cis-Epoxycarotenoid Dioxygenases Gene Expression
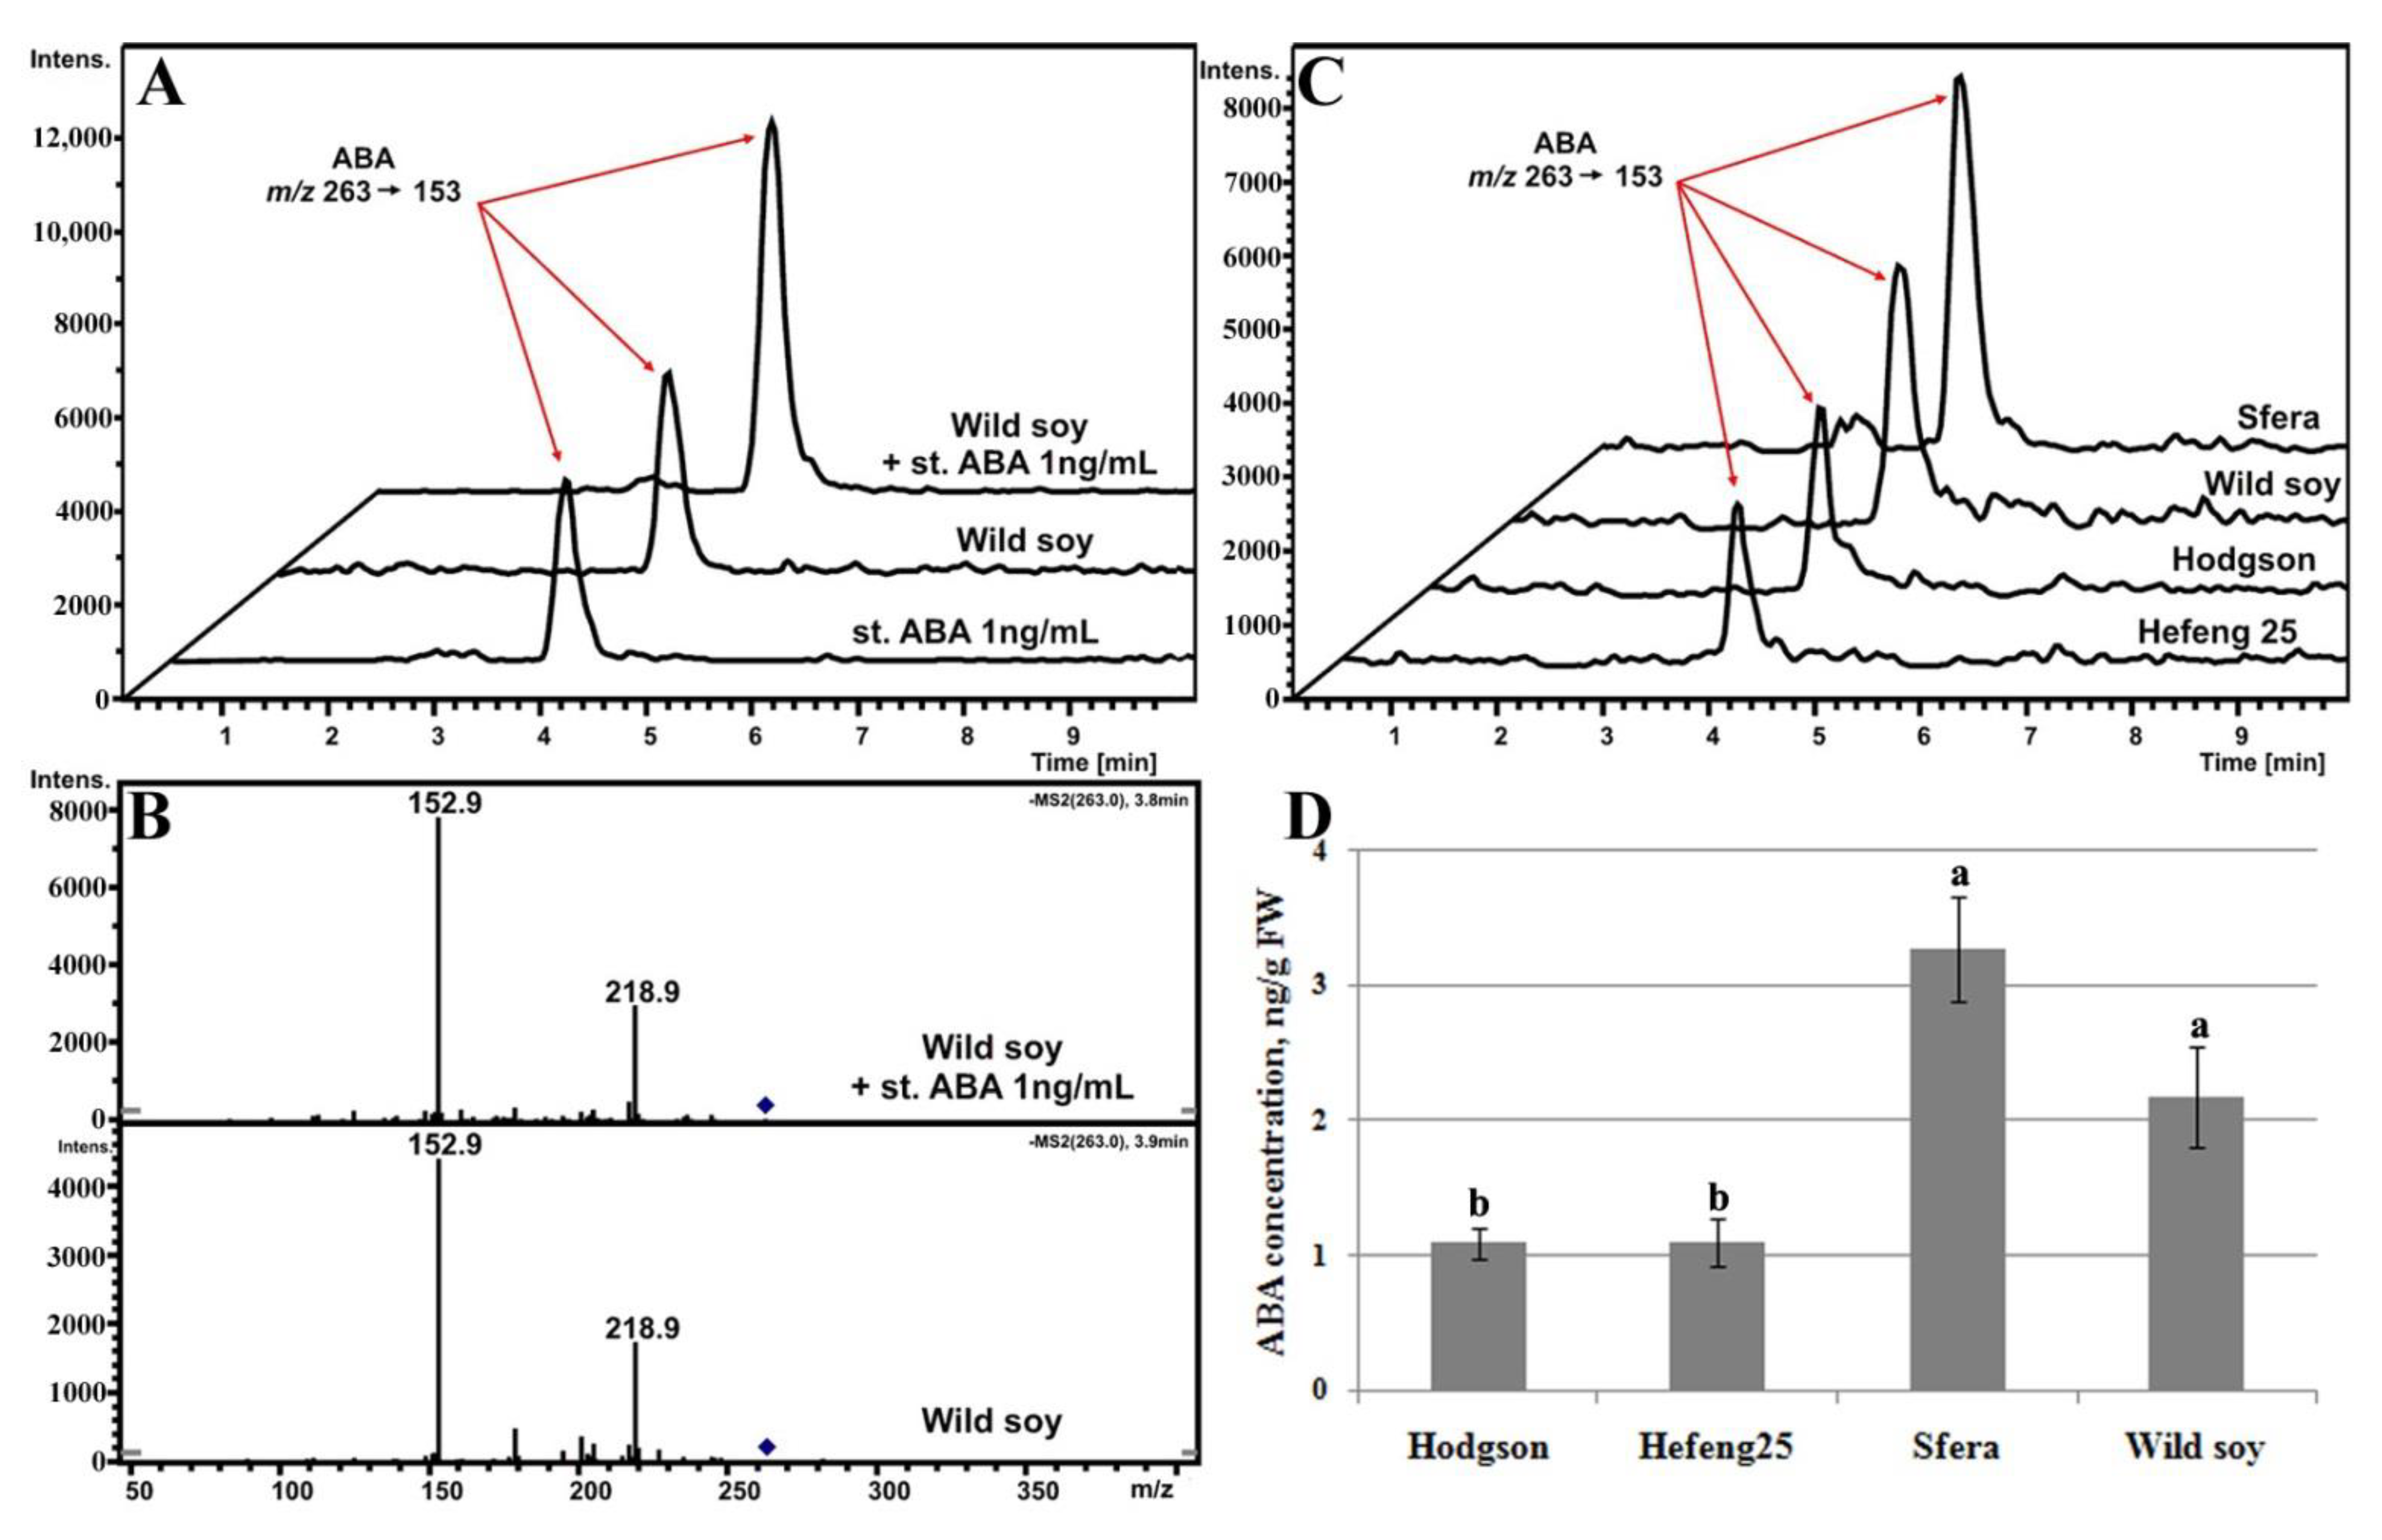
3.5.1. ABA Determination
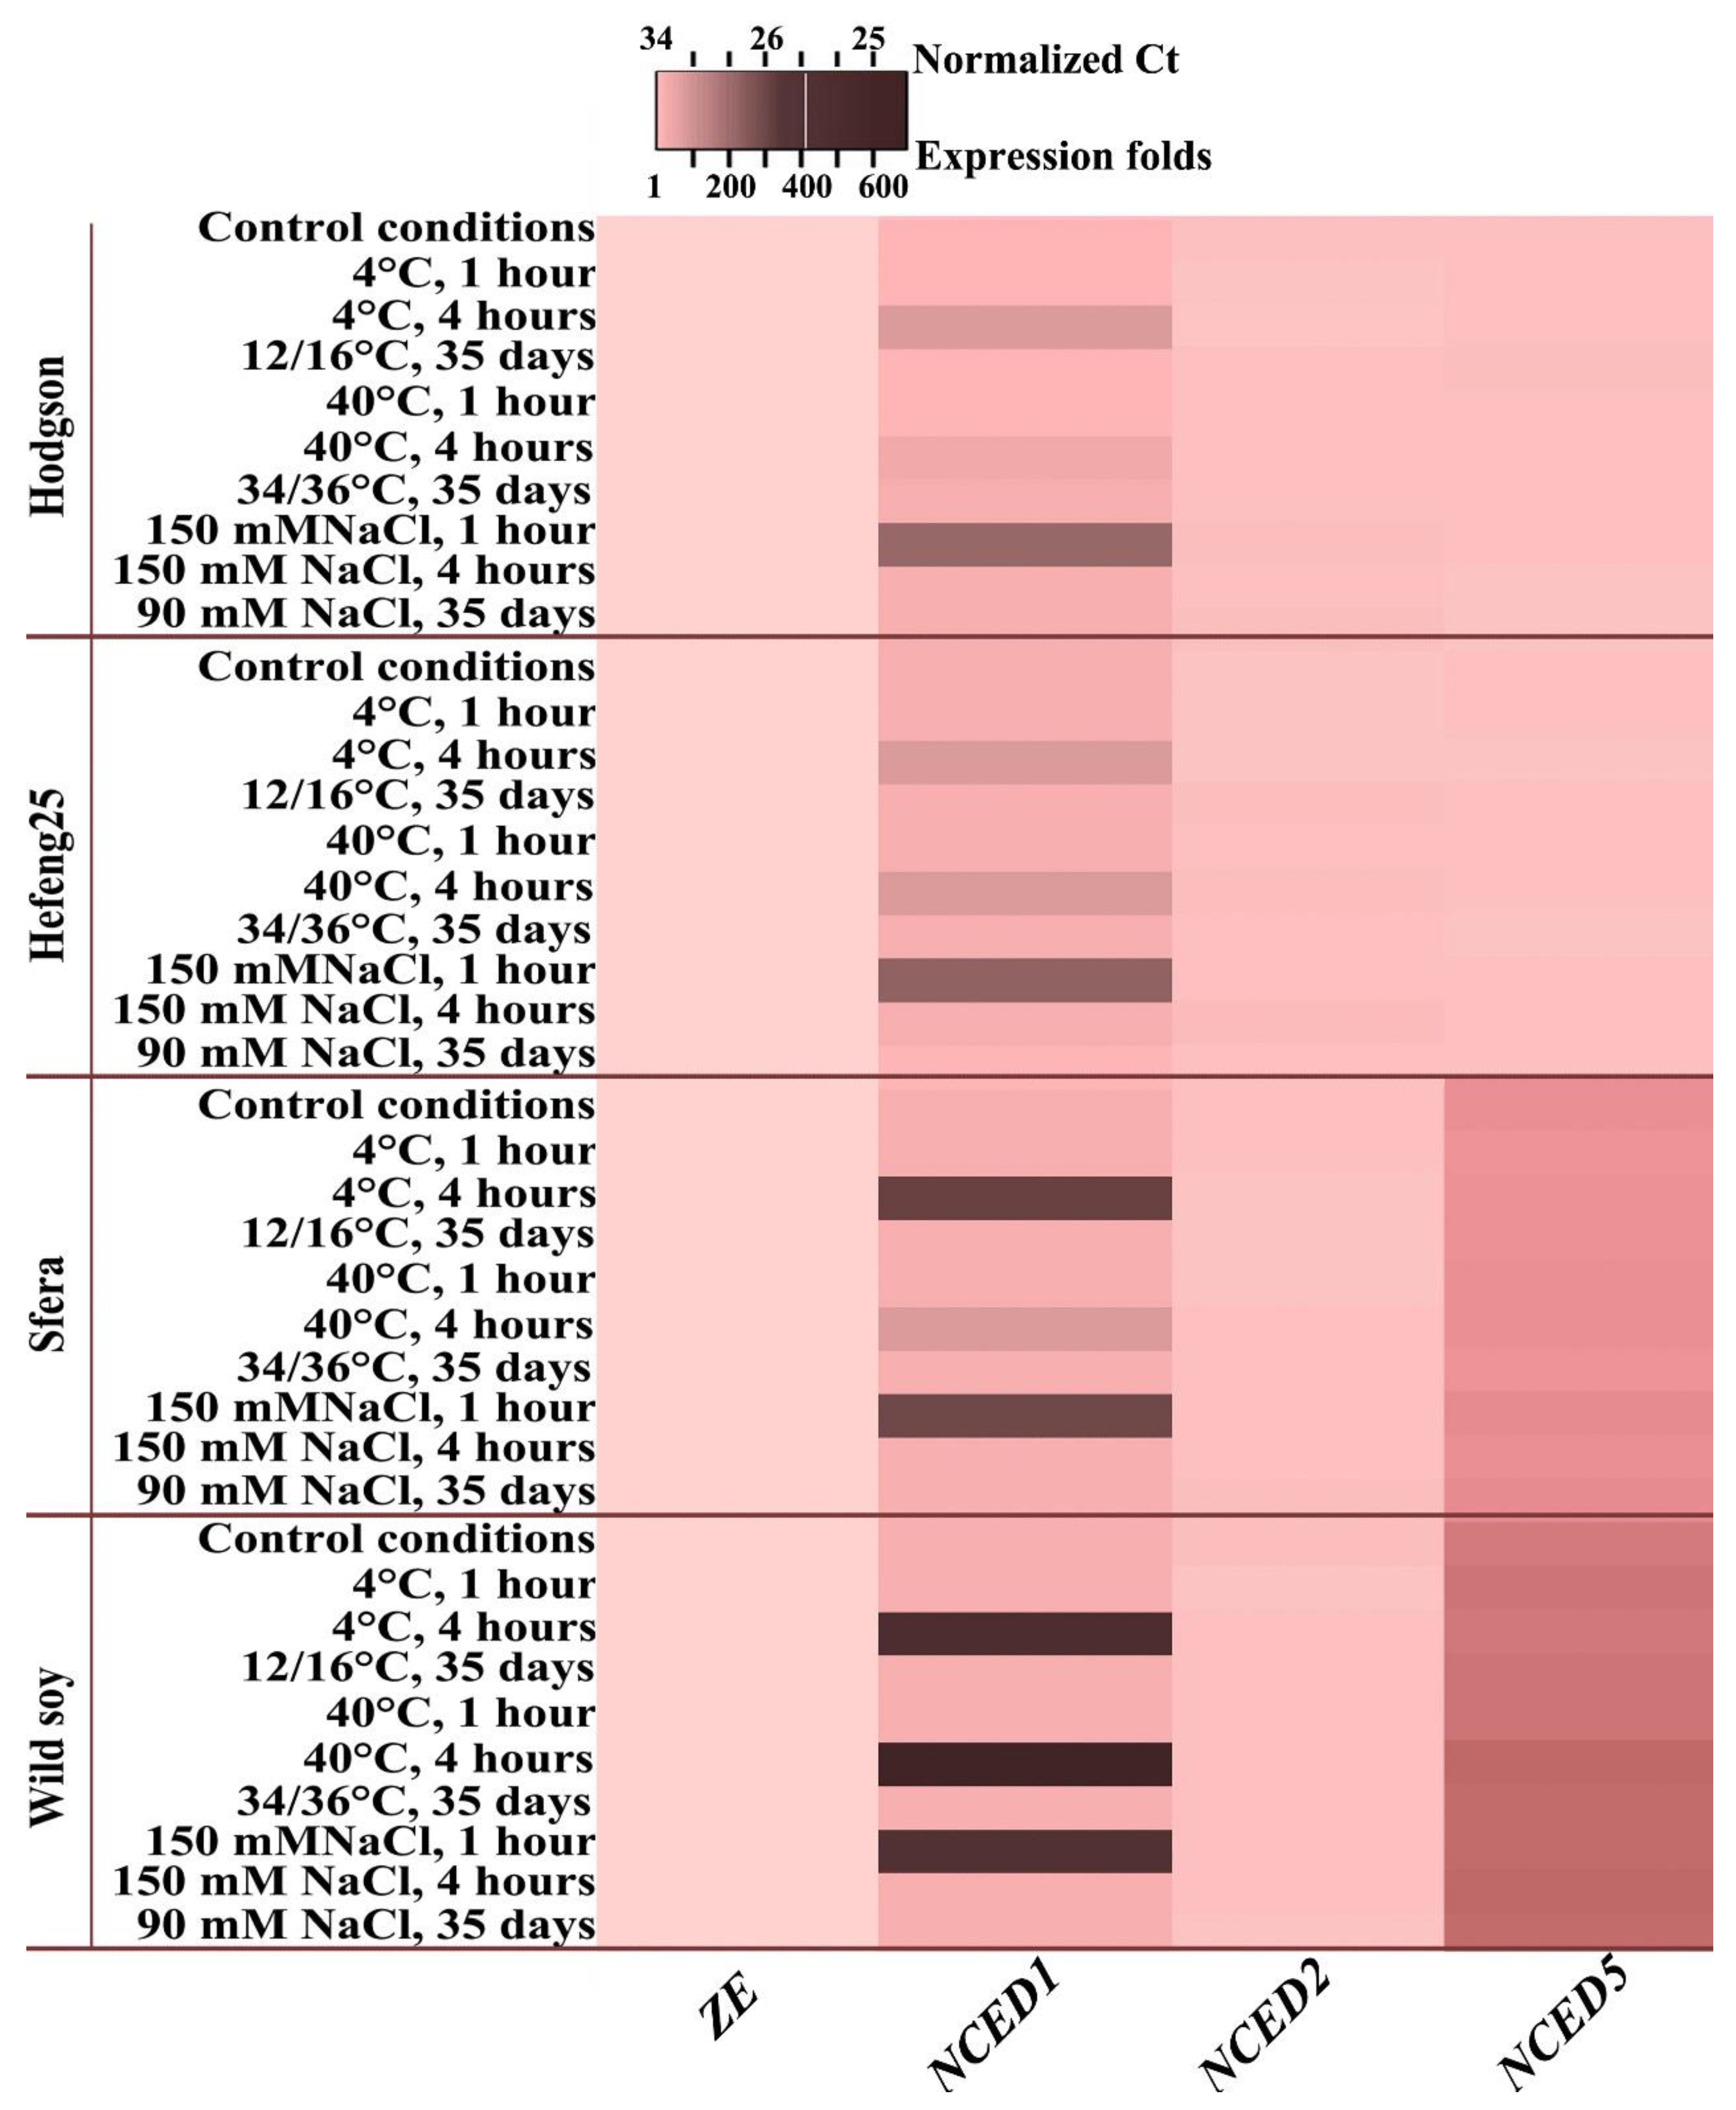
3.5.2. ABA-Biosynthesis-Related Gene Expression
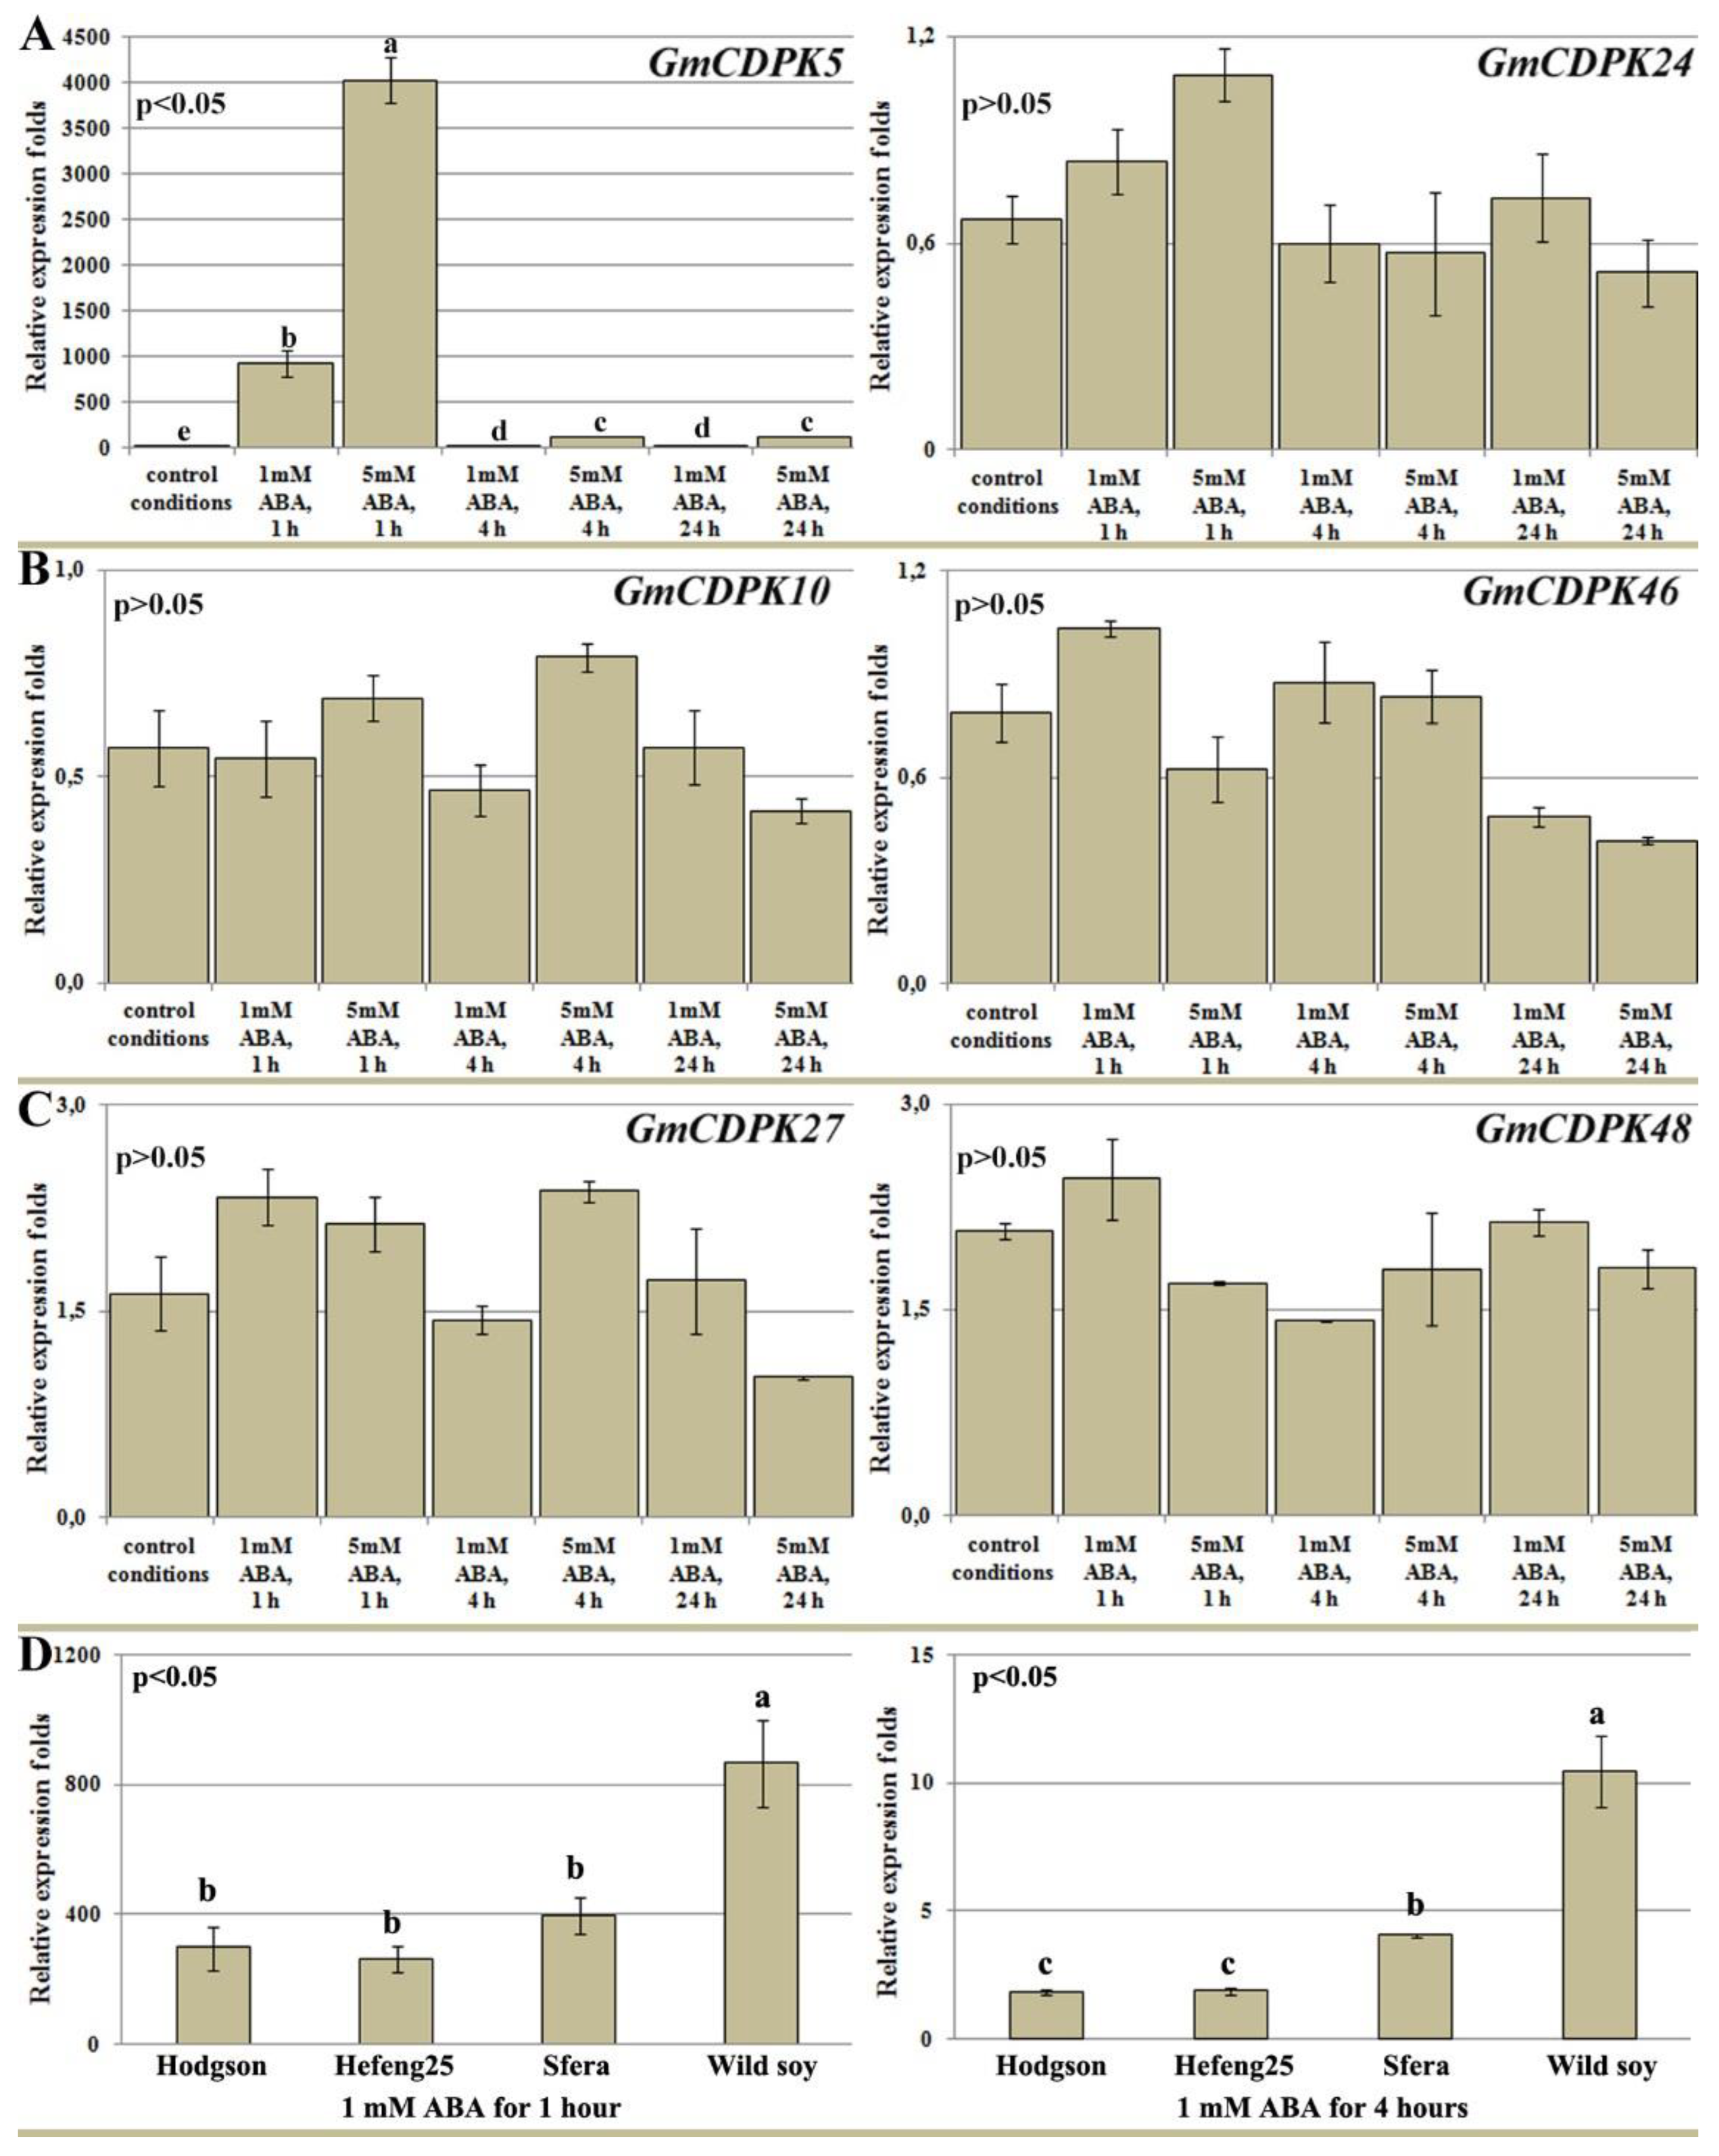
3.6. Effect of ABA Treatment on GmCDPK Expression
4. Discussion
5. Conclusions
Supplementary Materials
Author Contributions
Funding
Institutional Review Board Statement
Informed Consent Statement
Data Availability Statement
Conflicts of Interest
References
- Graham, N.; Patil, G.B.; Bubeck, D.M.; Dobert, R.C.; Glenn, K.C.; Gutsche, A.T.; Kumar, S.; Lindbo, J.A.; Maas, L.; May, G.D.; et al. Plant genome editing and the relevance of off-target changes. Plant Physiol. 2020, 183, 1453–1471. [Google Scholar] [CrossRef] [PubMed]
- Neto, S.; Nunes, J.; Souza, M.; Calonego, J. Soybean Crop: A Review on the Biotechnological Advances and Expectation for Modern Cultivars. J. Agric. Stud. 2020, 8, 194–207. [Google Scholar] [CrossRef]
- Schmutz, J.; Cannon, S.B.; Schlueter, J.; Ma, J.; Mitros, T.; Nelson, W.; Hyten, D.L.; Song, Q.; Thelen, J.J.; Cheng, J.; et al. Genome sequence of the palaeopolyploid soybean. Nature 2010, 463, 178–183. [Google Scholar] [CrossRef]
- Liu, S.; Zhang, M.; Feng, F.; Tian, Z. Toward a “Green Revolution” for Soybean. Mol. Plant 2020, 13, 688–697. [Google Scholar] [CrossRef]
- Zhang, M.; Liu, S.; Wang, Z.; Yuan, Y.; Zhang, Z.; Liang, Q.; Yang, X.; Duan, Z.; Liu, Y.; Kong, F.; et al. Progress in soybean functional genomics over the past decade. Plant Biotechnol. J. 2022, 20, 256–282. [Google Scholar] [CrossRef] [PubMed]
- Ranty, B.; Aldon, D.; Cotelle, V.; Galaud, J.P.; Thuleau, P.; Mazars, C. Calcium sensors as key hubs in plant responses to biotic and abiotic stresses. Front. Plant Sci. 2016, 7, 327. [Google Scholar] [CrossRef] [PubMed]
- Yip Delormel, T.; Boudsocq, M. Properties and functions of calcium-dependent protein kinases and their relatives in Arabidopsis thaliana. New Phytol. 2019, 224, 585–604. [Google Scholar] [CrossRef]
- Valmonte, G.R.; Arthur, K.; Higgins, C.M.; MacDiarmid, R.M. Calcium-dependent rotein kinases in plants: Evolution, expression and function. Plant Cell Physiol. 2014, 55, 551–569. [Google Scholar] [CrossRef]
- Huang, K.; Peng, L.; Liu, Y.; Yao, R.; Liu, Z.; Li, X.; Yang, Y.; Wang, J. Arabidopsis calcium-dependent protein kinase AtCPK1 plays a positive role in salt/drought-stress response. Biochem. Biophys. Res. Commun. 2018, 498, 92–98. [Google Scholar] [CrossRef]
- Veremeichik, G.N.; Shkryl, Y.N.; Gorpenchenko, T.Y.; Silantieva, S.A.; Avramenko, T.V.; Brodovskaya, E.V.; Bulgakov, V.P. Inactivation of the auto-inhibitory domain in Arabidopsis AtCPK1 leads to increased salt, cold and heat tolerance in the AtCPK1-transformed Rubia cordifolia L. cell cultures. Plant Physiol. Biochem. 2021, 159, 372–382. [Google Scholar] [CrossRef]
- Veremeichik, G.N.; Shkryl, Y.N.; Silantieva, S.A.; Gorpenchenko, T.Y.; Brodovskaya, E.V.; Yatsunskaya, M.S.; Bulgakov, V.P. Managing activity and Ca2+ dependence through mutation in the Junction of the AtCPK1 coordinates the salt tolerance in transgenic tobacco plants. Plant Physiol. Biochem. 2021, 165, 104–113. [Google Scholar] [CrossRef] [PubMed]
- Bulgakov, V.P.; Gorpenchenko, T.Y.; Shkryl, Y.N.; Veremeichik, G.N.; Mischenko, N.P.; Avramenko, T.V.; Fedoreyev, S.A.; Zhuravlev, Y.N. CDPK-driven changes in the intracellular ROS level and plant secondary metabolism. Bioeng. Bugs 2011, 2, 327–330. [Google Scholar] [CrossRef] [PubMed]
- Shkryl, Y.N.; Veremeichik, G.N.; Bulgakov, V.P.; Zhuravlev, Y.N. Induction of anthraquinone biosynthesis in Rubia cordifolia cells by heterologous expression of a calcium-dependent protein kinase gene. Biotechnol. Bioeng. 2011, 108, 1734–1738. [Google Scholar] [CrossRef] [PubMed]
- Shkryl, Y.N.; Veremeichik, G.N.; Makhazen, D.S.; Silantieva, S.A.; Mishchenko, N.P.; Vasileva, E.A.; Fedoreyev, S.A.; Bulgakov, V.P. Increase of anthraquinone content in Rubia cordifolia cells transformed by native and constitutively active forms of the AtCPK1 gene. Plant Cell Rep. 2016, 35, 1907–1916. [Google Scholar] [CrossRef]
- Veremeichik, G.N.; Grigorchuk, V.P.; Shkryl, Y.N.; Bulgakov, D.V.; Silantieva, S.A.; Bulgakov, V.P. Induction of resveratrol biosynthesis in Vitis amurensis cells by heterologous expression of the Arabidopsis constitutively active, Ca2+-independent form of the AtCPK1 gene. Process Biochem. 2016, 54, 144–155. [Google Scholar] [CrossRef]
- Veremeichik, G.N.; Grigorchuk, V.P.; Silanteva, S.A.; Shkryl, Y.N.; Bulgakov, D.V.; Brodovskaya, E.V.; Bulgakov, V.P. Increase in isoflavonoid content in Glycine max cells transformed by the constitutively active Ca2+ independent form of the AtCPK1 gene. Phytochemistry 2019, 157, 111–120. [Google Scholar] [CrossRef]
- Hettenhausen, C.; Sun, G.; He, Y.; Zhuang, H.; Sun, T.; Qi, J.; Wu, J. Genome-wide identification of calcium-dependent protein kinases in soybean and analyses of their transcriptional responses to insect herbivory and drought stress. Sci. Rep. 2016, 6, 18973. [Google Scholar] [CrossRef]
- Yasuda, M.; Ishikawa, A.; Jikumaru, Y.; Seki, M.; Umezawa, T.; Asami, T.; Maruyama-Nakashita, A.; Kudo, T.; Shinozaki, K.; Yoshida, S.; et al. Antagonistic interaction between systemic acquired resistance and the abscisic acid-mediated abiotic stress response in Arabidopsis. Plant Cell 2008, 20, 1678–1692. [Google Scholar] [CrossRef]
- Vishwakarm, K.; Upadhyay, N.; Kumar, N.; Yadav, G.; Singh, J.; Mishra, R.K.; Kumar, V.; Verma, R.; Upadhyay, R.G.; Pandey, M.; et al. Abscisic acid signaling and abiotic stress tolerance in plants: A review on current knowledge and future prospects. Front. Plant Sci. 2017, 8, 161. [Google Scholar] [CrossRef]
- Iuchi, S.; Kobayashi, M.; Taji, T.; Naramoto, M.; Seki, M.; Kato, T.; Tabata, S.; Kakubari, Y.; Yamaguchi-Shinozaki, K.; Shinozaki, K. Regulation of drought tolerance by gene manipulation of 9-cis-epoxycarotenoid dioxygenase, a key enzyme in abscisic acid biosynthesis in Arabidopsis. Plant J. 2001, 27, 325–333. [Google Scholar] [CrossRef]
- Molinari, M.D.C.; Fuganti-Pagliarini, R.; Marin, S.R.R.; Ferreira, L.S.; Barbosa, D.A.; Marcolino-Gomes, J.; Oliveira, M.S.N.; Mertz-Henning, L.M.; Kanamori, N.; Takasaki, H.; et al. Overexpression of AtNCED3 gene improved drought tolerance in soybean in greenhouse and field conditions. Genet. Mol. Biol. 2020, 43, 1–12. [Google Scholar] [CrossRef] [PubMed]
- Veremeichik, G.N.; Grigorchuk, V.P.; Butovets, E.S.; Lukyanchuk, L.M.; Brodovskaya, E.V.; Bulgakov, D.V.; Bulgakov, V.P. Isoflavonoid biosynthesis in cultivated and wild soybeans grown in the field under adverse climate conditions. Food Chem. 2021, 342, 128292. [Google Scholar] [CrossRef] [PubMed]
- Murashige, T.; Skoog, F. A revised medium for rapid growth and bio assays with tobacco tissue cultures. Physiol. Plant. 1962, 15, 473–497. [Google Scholar] [CrossRef]
- Dereeper, A.; Guignon, V.; Blanc, G.; Audic, S.; Buffet, S.; Chevenet, F.; Dufayard, J.F.; Guindon, S.; Lefort, V.; Lescot, M.; et al. Phylogeny.fr: Robust phylogenetic analysis for the non-specialist. Nucleic Acids Res. 2008, 36, W465–W469. [Google Scholar] [CrossRef] [PubMed]
- Bustin, S.A. Quantification of mRNA using real-time reverse transcription PCR (RT-PCR): Trends and problems. J. Mol. Endocrinol. 2002, 29, 23–39. [Google Scholar] [CrossRef]
- Bustin, S.; Benes, V.; Garson, J.; Hellemans, J.; Huggett, J.; Kubista, M.; Mueller, R.; Nolan, T.; Pfaffl, M.; Shipley, G.; et al. The MIQE Guidelines: Minimum Information for Publication of Quantitative Real-Time PCR Experiments. Clin. Chem. 2009, 55, 611–622. [Google Scholar] [CrossRef]
- Babicki, S.; Arndt, D.; Marcu, A.; Liang, Y.; Grant, J.R.; Maciejewski, A.; Wishart, D.S. Heatmapper: Web-enabled heat mapping for all. Nucleic Acids Res. 2016, 44, W147–W153. [Google Scholar] [CrossRef]
- Lu, Q.; Zhang, W.; Gao, J.; Lu, M.; Zhang, L.; Li, J. Simultaneous determination of plant hormones in peach based on dispersive liquidliquid microextraction coupled with liquid chromatography- ion trap mass spectrometry. J. Chromatogr. B Analyt. Technol. Biomed. Life Sci. 2015, 992, 8–13. [Google Scholar] [CrossRef]
- Tan, B.C.; Joseph, L.M.; Deng, W.T.; Liu, L.; Li, Q.B.; Cline, K.; McCarty, D.R. Molecular characterization of the Arabidopsis 9-cis epoxycarotenoid dioxygenase gene family. Plant J. 2003, 35, 44–56. [Google Scholar] [CrossRef]
- Jumrani, K.; Bhatia, V.S.; Pandey, G.P. Impact of elevated temperatures on specific leaf weight, stomatal density, photosynthesis and chlorophyll fluorescence in soybean. Photosynth. Res. 2017, 131, 333–350. [Google Scholar] [CrossRef]
- Kudla, J.; Becker, D.; Grill, E.; Hedrich, R.; Hippler, M.; Kummer, U.; Parniske, M.; Romeis, T.; Schumacher, K. Advances and current challenges in calcium signalling. New Phytol. 2018, 218, 414–431. [Google Scholar] [CrossRef] [PubMed]
- Liu, H.; Che, Z.; Zeng, X.; Zhou, X.; Sitoe, H.M.; Wang, H.; Yu, D. Genome-wide analysis of calcium-dependent protein kinases and their expression patterns in response to herbivore and wounding stresses in soybean. Funct. Integr. Genom. 2016, 16, 481–493. [Google Scholar] [CrossRef] [PubMed]
- Zhao, N.; Ding, X.; Lian, T.; Wang, M.; Tong, Y.; Liang, D.; An, Q.; Sun, S.; Jackson, S.A.; Liu, B.; et al. The effects of gene duplication modes on the evolution of regulatory divergence in wild and cultivated soybean. Front. Genet. 2020, 11, 1492. [Google Scholar] [CrossRef] [PubMed]
- Hamwieh, A.; Xu, D. Conserved salt tolerance quantitative trait locus (QTL) in wild and cultivated soybeans. Breed. Sci. 2008, 58, 355–359. [Google Scholar] [CrossRef]
- Wu, G.; Zhou, Z.; Chen, P.; Tang, X.; Shao, H.; Wang, H. Comparative ecophysiological study of salt stress for wild and cultivated soybean species from the Yellow River Delta, China. Sci. World J. 2014, 2014, 651745. [Google Scholar] [CrossRef]
- Lavrent’yeva, S.I.; Chernyshuk, D.K.; Martinenko, N.V.; Ivachenko, L.E.; Arsene, A.L.; Ercisli, S.; Tsatsakis, A.M.; Golokhvast, K.S.; Nawaz, M.A. Biochemical adaptation of wild and cultivated soybean against toxicity of lead salts. Environ. Toxicol. Pharmacol. 2020, 79, 103429. [Google Scholar] [CrossRef]
- Tsukamoto, C.; Nawaz, M.A.; Kurosaka, A.; Le, B.; Lee, J.D.; Son, E.; Yang, S.H.; Kurt, C.; Baloch, F.S.; Chung, G. Isoflavone profile diversity in korean wild soybeans (Glycine soja Sieb. & Zucc.). Turk. J. Agric. For. 2018, 42, 248–261. [Google Scholar]
- Skvortsov, B.V. Wild and Cultivated Soybean of East, Asia. Vestnik. Man’chzhurii 1927, 9, 35–43. [Google Scholar]
- Keim, P.; Beavis, W.; Schupp, J.; Freestone, R. Evaluation of soybean RFLP marker diversity in adapted germ plasm. Theor. Appl. Genet. 1992, 85, 205–212. [Google Scholar] [CrossRef]
- Skorupska, H.T.; Shoemaker, R.C.; Warner, A.; Shipe, E.R.; Bridges, W.C. Restriction fragment length polymorphism in soybean germplasm of the southern USA. Crop Sci. 1993, 33, 1169–1176. [Google Scholar] [CrossRef]
- Lorenzen, L.L.; Shoemaker, R.C. Genetic Relationships within Old US Soybean Cultivar Groups. Crop Sci. 1996, 36, 743–752. [Google Scholar] [CrossRef]
- Gizlice, Z.; Carter, T.E.; Gerig, T.M.; Burton, J.W. Genetic diversity patterns in North American public soybean cultivars based on coefficient of parentage. Crop Sci. 1996, 36, 753–765. [Google Scholar] [CrossRef]
- Lin, J.-J.; Kuo, J.; Ma, J.; Saunders, J.A.; Ke, H.; Beard, S.; Macdonald, M.H.; Ude, G.N.; Matthews, B.F. Identification of molecular markers in soybean comparing RFLP, RAPD and AFLP DNA Mapping Techniques. Plant Mol. Biol. Rep. 1996, 14, 156–169. [Google Scholar] [CrossRef]
- Seitova, A.M.; Ignatov, A.N.; Suprunova, T.P.; Tsvetkov, I.L.; Deineko, E.V.; Dorokhov, D.B.; Shumnyi, V.K.; Skryabin, K.G. Genetic Variation of Wild Soybean Glycine soja Sieb. et Zucc. in the Far East Region of the Russian Federation. Russ. J. Genet. 2004, 40, 165–171. [Google Scholar] [CrossRef]
- Leamy, L.J.; Lee, C.R.; Song, Q.; Mujacic, I.; Luo, Y.; Chen, C.Y.; Li, C.; Kjemtrup, S.; Song, B.H. Environmental versus geographical effects on genomic variation in wild soybean (Glycine soja) across its native range in northeast Asia. Ecol. Evol. 2016, 6, 6332–6344. [Google Scholar] [CrossRef]
- Gupta, A.; Hisano, H.; Hojo, Y.; Matsuura, T.; Ikeda, Y.; Mori, I.C.; Senthil-Kumar, M. Global profiling of phytohormone dynamics during combined drought and pathogen stress in Arabidopsis thaliana reveals ABA and JA as major regulators. Sci. Rep. 2017, 7, 4017. [Google Scholar] [CrossRef]
- Li, S.; Wang, N.; Ji, D.; Zhang, W.; Wang, Y.; Yu, Y.; Zhao, S.; Lyu, M.; You, J.; Zhang, Y.; et al. A GmSIN1/GmNCED3s/GmRbohBs feed-forward loop acts as a signal amplifier that regulates root growth in soybean exposed to salt stress. Plant Cell 2019, 31, 2107–2130. [Google Scholar] [CrossRef]
- Li, B.; Feng, Y.; Zong, Y.; Zhang, D.; Hao, X.; Li, P. Elevated CO2-induced changes in photosynthesis, antioxidant enzymes and signal transduction enzyme of soybean under drought stress. Plant Physiol. Biochem. 2020, 154, 105–114. [Google Scholar] [CrossRef]
- Oliveira, F.B.; Da-Silva, C.J.; Garcia, N.; Agualongo, D.A.P.; Oliveira, A.C.B.; Kanamori, N.; Takasaki, H.; Urano, K.; Shinozaki, K.; Nakashima, K.; et al. The overexpression of NCED results in waterlogging sensitivity in soybean. Plant Stress 2022, 3, 100047. [Google Scholar] [CrossRef]


Publisher’s Note: MDPI stays neutral with regard to jurisdictional claims in published maps and institutional affiliations. |
© 2022 by the authors. Licensee MDPI, Basel, Switzerland. This article is an open access article distributed under the terms and conditions of the Creative Commons Attribution (CC BY) license (https://creativecommons.org/licenses/by/4.0/).
Share and Cite
Veremeichik, G.N.; Brodovskaya, E.V.; Grigorchuk, V.P.; Butovets, E.S.; Lukyanchuk, L.M.; Bulgakov, V.P. ABA-Dependent Regulation of Calcium-Dependent Protein Kinase Gene GmCDPK5 in Cultivated and Wild Soybeans. Life 2022, 12, 1576. https://doi.org/10.3390/life12101576
Veremeichik GN, Brodovskaya EV, Grigorchuk VP, Butovets ES, Lukyanchuk LM, Bulgakov VP. ABA-Dependent Regulation of Calcium-Dependent Protein Kinase Gene GmCDPK5 in Cultivated and Wild Soybeans. Life. 2022; 12(10):1576. https://doi.org/10.3390/life12101576
Chicago/Turabian StyleVeremeichik, Galina N., Evgenia V. Brodovskaya, Valeria P. Grigorchuk, Ekaterina S. Butovets, Ludmila M. Lukyanchuk, and Victor P. Bulgakov. 2022. "ABA-Dependent Regulation of Calcium-Dependent Protein Kinase Gene GmCDPK5 in Cultivated and Wild Soybeans" Life 12, no. 10: 1576. https://doi.org/10.3390/life12101576
APA StyleVeremeichik, G. N., Brodovskaya, E. V., Grigorchuk, V. P., Butovets, E. S., Lukyanchuk, L. M., & Bulgakov, V. P. (2022). ABA-Dependent Regulation of Calcium-Dependent Protein Kinase Gene GmCDPK5 in Cultivated and Wild Soybeans. Life, 12(10), 1576. https://doi.org/10.3390/life12101576