Abstract
The technology of long reads substantially improved the contingency of the genome assembly, particularly resolving contiguity of the repetitive regions. By integrating the interactive fragment using Hi-C, and the HiFi technique, a solid genome of the honeybee Apis mellifera carnica was assembled at the chromosomal level. A distinctive pattern of genes involved in social evolution was found by comparing it with social and solitary bees. A positive selection was identified in genes involved with cold tolerance, which likely underlies the adaptation of this European honeybee subspecies in the north hemisphere. The availability of this new high-quality genome will foster further studies and advances on genome variation during subspeciation, honeybee breeding and comparative genomics.
1. Introduction
Insect pollination is essential for maintaining the balance of the ecosystem, which contributes approximately 35% to crop pollination [1]. The honeybee Apis mellifera is a key managed pollinator, with an estimated annual global economic value of $195 billion [2]. The recent decline of honeybee colonies has provoked serious concerns regarding the biodiversity, as well as food security [3]. A number of stressors have been proven to cause the honeybee collapses, including parasites, pesticide, climate change and habitat loss [4,5,6,7,8]. Among those stressors, parasites are a major cause leading to colony losses, with a synergistic effect with pesticide. It is known that honeybee strains showed variation in tolerance towards parasites and climates [9,10,11,12,13]. However, the genetic mechanism underlying that tolerance is yet not fully understood. In this study, we aim to reveal the genomic variation within A. mellifera species, which is essential to understand their evolution, adaptation to different climates, as well as to refine breeding strategies for disease-tolerant strains.
In this study, we provided a highly contiguous genome assembly of a valuable subspecies of the European honeybee, Apis mellifera carnica. Two complementary sequencing technologies of HIFI and Hi-C were used to generate a high-quality chromosome genome assembly. Comparative genomic analysis revealed gene families selected during the social evolution and climate adaptation.
2. Material and Methods
2.1. DNA Extraction and Sequencing Library Preparation
The honeybee A. mellifera carnica were collected from the national honeybee breeding center in Apicultural Science Institute of Jilin, China. Six A. mellifera carnica drone pupae were collected from a single colony, which were pooled for DNA extraction by AxyPrepTM Multisource Genomic DNA Miniprep Kit (Axygen, Irvine, CA, USA). The Qubitfluorimetry system was used to define the DNA concentration (Thermo Fisher, Waltham, MA, USA). Fragment size distribution was assessed using the Agilent 2100 Bioanalyzer with the 12,000 DNA kit (Agilent, Santa Clara, CA, USA). Then, 5 µg of high molecular weight genomic DNA was used to prepare the library. The DNA which uses g-Tube (Covaris, Woburn, MA, USA) to shear into 10 kb was used as input into the SMRTcell library preparation according to PacBio 10 kb library preparation protocol. The library was sequenced on a PacBio Sequel system using Sequencing Kit 3.0.
Additionally, five drone pupae from the same colony were fixed with formaldehyde and lysed for Hi-C library. The cross-linked genomic DNA was digested with Hind III overnight. Sticky ends of the genomic DNA were biotinylated and proximity-ligated to form chimeric junctions that were enriched for and then physically sheared to a size of 300–700 bp. Chimeric fragments representing the original cross-linked long-distance physical interactions were then processed into paired-end sequencing libraries and sequenced on the Illumina HiSeq X Ten platform.
2.2. Genome Assembly and Gene Annotation
The reads were filtered through Fastp with default parameters, and 2,602,139 clean Pacbio reads with a total size of 22,818,161,032 bp were obtained [14]. The reads were assembled by HGAP4 of SMRT Link (version 6.0) with default parameters. Additionally, 280,437,292 Hi-C reads with a total size of 84.13 Gb was obtained. The raw contigs were split into segments of 50 Kb on average. The Hi-C reads were aligned to the segments using BWA (version 0.7.10) with default parameters [15]. The uniquely mapped reads were retained to assemble the genome using LACHESIS package [16].
Augustus (v3.3.2) was used to train and predict the gene features with Amel_HAv3.1 gene set [17,18]. Based on the deduced amino acid sequences, the annotation was performed through BLASTP against the non-redundant peptide database with the cut-off E-value at 10−5 and RPS-BLAST against the Conserved Domain Database at E-value at 10−3 [19]. Gene ontology analysis was performed using BLASTP against the InterProScan [20]. The Pathway was constructed based on the KEGG database [19].
2.3. The Genome Completeness and Honeybee Evolution
The protein sequences were used to query the BUSCO arthropod ortholog set to evaluate the genome completeness. The genomes of honeybee subspecies A. mellifera mellifera and A. mellifera DH4 were further queried to A. mellifera carnica using minimap2 [21]. The alignment files were viewed using package pafr (https://github.com/dwinter/pafr, accessed on 7 January 2021). The microsatellite was identified using MISA (microsatellite identification tool) with default parameters [22]. The microsatellite markers primers were blasted against the three genomes and the congruent was analyzed using Chi-squared test, R [23].
2.4. Phylogenetic Analysis of Social Genes
To investigate the molecular mechanisms underlying sociality between social and solitary bees, the protein sequences of four insulin family proteins insulin receptor substrate 1 (IRS1), insulin receptor substrate 4 (IRS4), insulin receptor like (IR-like) and insulin-like peptides (IPR) were retrieved from Eastern honeybees (Apis cerana), dwarf honeybees (Apis florea), giant honeybees (Apis dorsata), bumble bees (Bombus terrestris), digger bees (Habropoda laboriosa), red mason bees (Osmia bicornis bicornis) and small carpenter bees (Ceratina calcarata) by NCBI blast with E-value cutoff ≤ 1 × 10⁻⁵. The protein sequences were aligned using Muscle with default parameters by MEGA X package (Version 10.0.2) [24]. The phylogenetic tree was constructed using the Neighbor joining model with 1000 bootstraps and the small carpenter bees were used to root the tree.
2.5. Identifying Genome Selection Pressures
Orthologs between 7 species (Nasonia vitripennis, Bombus terrestris, Bombus impatiens, Apis florea, Apis dorsata, Apis laboriosa, Apis cerana) and 4 subspecies (Apis mellifera carnica, Apis mellifera caucasica, Apis mellifera ligustica, Apis mellifera mellifera) were discovered using Orthofinder (v2.5.2) [25]. To optimize the number of single-copy orthologs, we categorized them as such if at least 3 Apis mellifera subspecies and Apis cerana had a single-copy gene for the given orthogroup, culminating at 6328 single-copy ortholog families. Phylogenetic tree reconstruction, including all species described above, was undertaken by OrthoFinder. For each single-copy ortholog family, the longest protein isoforms for each of the species’ gene were used in multiple sequence alignment with MAFFT (using local-pair algorithm and 1000 iterations) [26] and unreliably aligned residues and sequences were masked with GUIDANCE (v2.02) [27]. To optimize alignment length without gaps, we ran a maxalign script and removed subsequent sequences leading to more than 30% of gapped alignment as long as it did not result in the removal of any A. mellifera subspecies and A. cerana [28]. The protein sequences were replaced with coding sequences in the multiple alignments using the pal2nal script [29]. Furthermore, sequences containing a stop codon or having a length inconsistency between protein and DNA coding sequences (after removal of undefined bases) were filtered out. Alignments regions, where gapped positions were present, were removed with a custom python script, as these are the most problematic for positive selection inference [30,31]. Finally, CDS shorter than 100 nucleotides were eliminated [32].
Phylogenetic tests of positive selection in protein-coding genes usually contrast substitution rates at non-synonymous sites to substitution rates at synonymous sites taken as a proxy to neutral rates of evolution. The adaptive branch-site random effects model (aBSREL) from Hyphy software package was used to detect positive selection experienced by a gene family in a subset of sites in a specific branch of its phylogenetic tree [33]. The test for positive selection was run only on the branches leading to the origin of A. mellifera and on each A. mellifera subspecies. Results from the adaptive branch-site random effects model were corrected for multiple testing as one series using False Discovery Rate (FDR) and set up our significant threshold at 10% [34].
2.6. Test for Functional Category Enrichment
Gene Ontology (GO) annotations for our gene families were taken from Hymenoptera Genome database [35]. The enrichment of functional categories was evaluated with the package topGO version 2.4 of Bioconductor [36,37]. To identify functional categories enriched for genes under positive selection, strengthened, and relaxed selection pressure, the SUMSTAT test was used [38,39]. The SUMSTAT test is more sensitive than other methods and minimizes the rate of false positives [40,41,42,43]. To be able to use the distribution of log-likelihood ratios of the aBSREL and RELAX tests as scores in the SUMSTAT test, a fourth root transformation was used [39]. This transformation conserves the ranks of gene families [44]. Gene Ontology categories mapped to less than 10 genes were discarded. The list of significant gene sets resulting from enrichment tests is usually highly redundant. We therefore implemented the “elim” algorithm from the Bioconductor package topGO, to decorrelate the graph structure of the Gene Ontology. To account for multiple testing, the final list of p-values resulting from this test was corrected with the FDR and set up our significant threshold at 20%. To cluster the long list of significant functional categories, we used REVIGO with the SimRel semantic similarity algorithm and medium size (0.7) result list [45,46].
3. Results and Discussion
3.1. The Genome Assembly Statistics of A. mellifera carnica
A robust genome of 226.02 Mbp comprised of 313 contigs was assembled, which were further collapsed into 169 scaffolds (GCA_013841245.2) (Table 1). By aligning the predicted protein sequences to 1066 core arthropod Benchmarking Universal Single-copy orthologs (BUSCOs) [47], 93.53% of complete BUSCOs were identified. The results suggest that the assembled genome and predicted gene set were complete. Phylogenetic tree reconstruction revealed the subspeciation events of the European honeybees and the topology agreed with the evolution from solitary to social living (Figure 1) [48,49].

Table 1.
Statistics of the studied A. mellifera carnica genome and other recently assembled honeybee genomes. NA indicates that the genome was assembled at contig level.
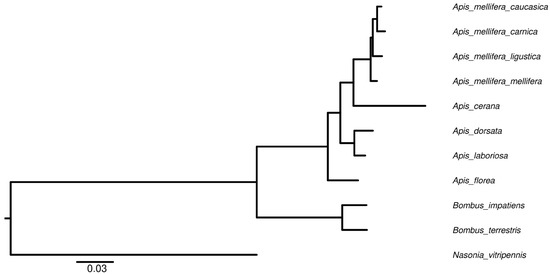
Figure 1.
Phylogenetic tree of the studies insects for the genome selection. All nodes were 100% bootstrap supported. N. vitripennis was used to root the tree. For A. mellifera carnica, 93.53% of complete BUSCOs were found, which suggests the assembly is complete.
3.2. Genome Alignment among Honeybee Subspecies
By pair-wised alignment, 83% and 89% of A. mellifera carnica genome can be perfectly aligned to A. mellifera mellifera and A. mellifera DH4 genome, respectively (Figure 2 and Figure S1). The average length of the aligned region was 103 Kbp and 108 Kbp for A. mellifera mellifera and A. mellifera DH4, respectively (Figure S2). The inverted fragment may reflect natural structural variation among the genomes, reflecting local adaption [50,51]. Overall, 88,380 microsatellites with dinucleotides motif were identified in A. mellifera carnica. Comparatively, 89,099 and 89,569 were identified in A. mellifera DH4 and A. mellifera mellifera, respectively. The relative abundance of microsatellites along the motifs were not significantly different among the three genomes (Pearson’s Chi-squared test, df = 24, p = 0.26). However, the number of microsatellites decreased with the increasing number of repeats for all three genomes (Pearson’s correlation coefficient, df = 9, p < 0.001, Figure 3A). A set of linkage map makers were further compared among the three genomes [52,53,54]. Out of 1081 paired microsatellite primers, 839 (77%) could be aligned to all three genomes (Figure S3), with an average density of 4.8 cM per locus (Figure 3B). For the remaining 242 markers, 162 were aligned to at least one genome. A. mellifera DH4 shared a higher number of markers with A. mellifera carnica compared with A. mellifera mellifera, which significantly deviated from random (Pearson’s Chi-squared test, df = 2, p < 0.01) and is congruent with the genome phylogenetic tree in general (Figure S4).
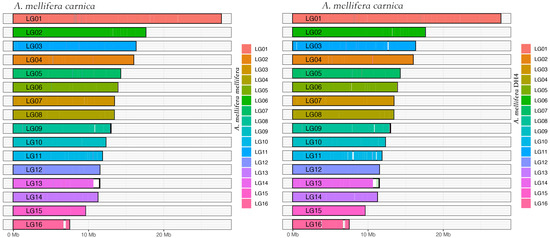
Figure 2.
Coverage map of the honeybee subspecies. The genomes of A. mellifera melllifera and A. mellifera DH4 were compared with A. mellifera carnica. Overall, 80% of the nucleotides were aligned.
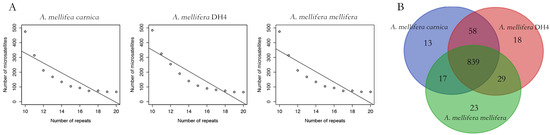
Figure 3.
Microsatellite analysis of the three honeybee subspecies. (A): the distribution of microsatellites of the dinucleotide motif. The number of microsatellites decreased with the increasing number of repeats for all three genomes. Overall, the variation of the microsatellite distribution among the three genomes was not significant. (B): Venn diagram of the linkage map makers among the three honeybee genomes. A. mellifera DH4 shared significantly higher number of markers with A. mellifera carnica compared with A. mellifera mellifera.
3.3. Phylogenetic Analysis of Sociality-Related Proteins
The evolutionary process of bee sociality is fascinating, and highlights how genomes evolved to give rise to new and complex behaviors [49,55,56]. Insulin is an essential gene family regulating honeybee caste determination [57,58]. Hexamerin regulates the reproductive tissue development after honeybee caste differentiation [59,60,61]. The two gene families were selected to indicate the social evolution. The phylogenetic tree of insulin and hexamerin gene families clearly showed that solitary bees (digger bees and red mason bees) were an early branch from the root (small carpenter bees), followed by bumble bees (Figure 4). The four honeybee species were clustered together, indicating that the a distinctive gene selection of sociality [62,63,64].
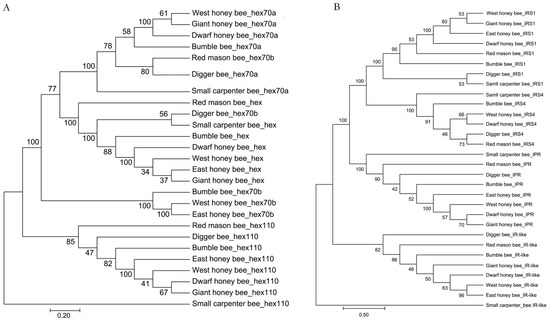
Figure 4.
Phylogenetic tree of social genes. (A): phylogenetic tree of hexamerin family proteins. (B): phylogenetic tree of insulin family. The orthologs were retrieved by BLAST in NCBI manually with E-value cutoff ≤ 1 × 10⁻⁵. The sequences were aligned with Muscle and the phylogenetic tree was constructed using Neighbor joining model with 1000 bootstrap.
3.4. Signature of Positive Selection
Overall, 4897 single-copy orthologous groups were identified, out of which 245 orthologous groups displayed signs of positive selection in at least one branch test. The number of orthologous groups under positive selection within each branch varied significantly (Chi-squared test, p < 2.2 × 10⁻¹⁶) and ranged from 10 to 114 with 10, 27, 45, 78, and 114 for A. mellifera caucasica, A. mellifera mellifera, A. mellifera spp., A. mellifera carnica, and A. mellifera ligustica, respectively (Table S1). Such a variation in the number of genes under positive selection among the different A. mellifera subspecies may highlight a fast pace of adaptation or directed domestication in A. mellifera carnica and A. mellifera ligustica compared with others [65,66]. However, this result could also be the consequence of different population structures among A. mellifera subspecies with differential gene flow and introgression levels. Only one orthologous group, encoding for the protein obscurin involved in myogenesis and Hippo signaling pathway [67,68], was found to be under positive selection in three branches (A. m. carnica, A. m. ligustica, and A. m. spp., Table 2). Moreover, a few orthologous groups were found under positive selection in more than one branch (Table 2). Additionally, Hippo signaling pathway was involved in cold temperature adaptation in bees [13].
Table 2.
Orthologous found to be under positive selection in more than one branch tested.
3.5. Functional Categories Enriched of Positively Selected Genes
We identified 11 significant functional categories in A. m. carnica, 28 in A. m. ligustica, 5 in A. m. mellifera and caucasica, and 6 in A. mellifera branch, which were enriched in genes under positive selection at 20% FDR. The long list of significant GO-terms found to be significantly enriched of positively selected genes in A. m. ligustica were mainly related to larval development (Figure 5), as demonstrated with clustering from REVIGO [45]. Interestingly, the two most significant enriched functional genes under positive selection in A. mellifera branch, chitin metabolism and mitochondrial translation (Figure 6), matched functional genes previously found in A. mellifera [34]. While functions found to be enriched of positively selected genes in A. m. mellifera were mainly related to the nervous system, in A. m. caucasica. They were mainly related to autophagy/cell death (Figure 6). In A. m. carnica, most of significant GO terms seems to be linked with stress tolerance, notably response to wounding, reactive oxygen species (ROS) metabolism, and larval midgut programmed cell death (Figure 6). More precisely, several significant GO terms are likely involved in cold resistance in honeybees, such as developmental growth [69], ROS metabolism [70], and hippo signaling [13]. Interestingly, the gene encoding the protein Dachsous, which was under positive selection in A. m. carnica and found in several significant GO terms, plays a key role in the adaptation to temperate climate in the A. m. sinisxinyuan [13]. Furthermore, the genes Amel_mTOR and Amel_Imp, encoding serine/threonine-protein kinase mTOR and insulin-like growth factor 2 mRNA-binding protein 1, respectively, might also play a role in cold tolerance as they both are involved in the insulin pathway regulating food intake, essential for cold tolerance [71,72]. Moreover, cold tolerance in A. cerana involved serine/threonine-protein kinases like mTOR [73]. The protein RB1-inducible coiled-coil protein 1, part of the GO term ‘larval midgut cell programmed cell death’, was found to be under positive selection in A. m. caucasica and involved in cold adaptation in amphipods [74].
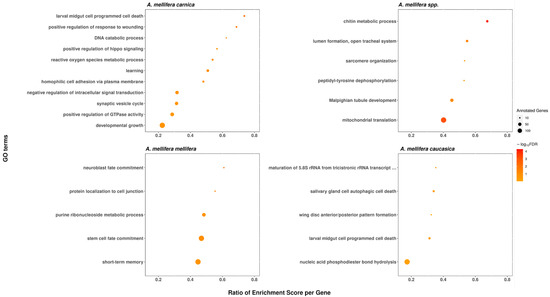
Figure 5.
Functional categories significantly enriched of genes under positive selection in the branch A. m. ligustica, using REVIGO to cluster the long list of significant GO terms. The medium cluster size was 0.7 and the semantic similarity measure SimRel.
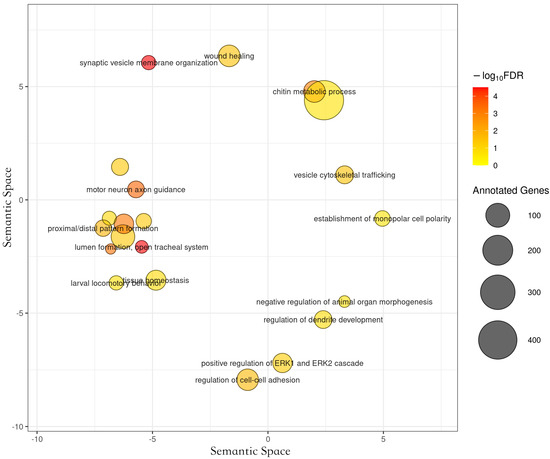
Figure 6.
Functional categories significantly enriched of genes under positive selection in the branch A. mellifera spp.
Supplementary Materials
The following supporting information can be downloaded at: https://www.mdpi.com/article/10.3390/life12101642/s1, Figure S1. Dot plot of among three honeybee subspecies. The honey bee Apis mellifer a carnica showed frame shifts and inversion compared with A. mellifera DH4 and A. mellifera mellifera. Figure S2. Aligned sequences between the genomes. The average length of the aligned region was 103 Kbp and 108 Kbp for A. mellifera mellifera and A. mellifera DH4 respectively. Figure S3. Linkage map markers using to align among the three honeybee genomes. Figure S4. Phylogenetic tree and estimated completeness of the studies 7 genomes. (a) The phylogenetic tree was constructed on protein sequences of 874 single-copy orthologs shared among all 7 genomes. All nodes were 100% bootstrap supported. D. melanogaster was used to root the tree. (b) Completeness of predicted protein sets of each genome was assessed by aligning to the arthropod BUSCOs. For A. mellifera carnica, 93.53% of complete BUSCOs were found, which suggest the assembly is complete. Table S1. Number of positively selected genes in each A. mellifera subspecies tested and as well as the A. mellifera branch and number of overlapping genes under positive selection in more than one branch.
Author Contributions
Z.-J.Z. conceived the experiment, Q.-S.N. collected the sample, Y.-Q.Z. and H.-J.Z. assembled the genome, Q.H. analyzed genome completeness, B.F. analyzed genome selection, X.-J.H. analyzed the phylogeny of sociality-related proteins, Q.H., Y.-Q.Z., B.F., X.-J.H., Q.-S.N., H.-J.Z. and Z.-J.Z. organized the manuscript. All authors have read and agreed to the published version of the manuscript.
Funding
This work was supported by the Initiation Package of Jiangxi Agricultural University (050014/923230722), National Natural Science Foundation of China (32172790), the Earmarked Fund for China Agriculture Research System (CARS-44-KXJ15) and EU-H2020 MSCA-IF-2020 fellowship (101024100, TEEPI).
Institutional Review Board Statement
Not applicable.
Informed Consent Statement
Not applicable.
Data Availability Statement
The raw sequencing reads have been deposited in BioProject PRJNA644991. The genome and gene annotation file are at: https://www.ncbi.nlm.nih.gov/assembly/GCA_013841245.2 (accessed date 31 August 2022).
Conflicts of Interest
The authors declare no conflict of interest.
References
- IPBES. The Assessment Report of the Intergovernmental Science-Policy Platform on Biodiversity and Ecosystem Services on Pollinators, Pollination and Food Production; Potts, S.G., Imperatriz-Fonseca, V.L., Ngo, H.T., Eds.; Secretariat of the Intergovernmen: Kuala Lumpur, Malaysia, 2016. [Google Scholar]
- Bauer, D.M.; Sue Wing, I. The macroeconomic cost of catastrophic pollinator declines. Ecol. Econ. 2016, 126, 1–13. [Google Scholar] [CrossRef]
- Parreño, M.A.; Alaux, C.; Brunet, J.-L.; Buydens, L.; Filipiak, M.; Henry, M.; Keller, A.; Klein, A.-M.; Kuhlmann, M.; Leroy, C.; et al. Critical links between biodiversity and health in wild bee conservation. Trends Ecol. Evol. 2022, 37, 309–321. [Google Scholar] [CrossRef] [PubMed]
- Flores, J.M.; Gámiz, V.; Jiménez-Marín, Á.; Flores-Cortés, A.; Gil-Lebrero, S.; Garrido, J.J.; Hernando, M.D. Impact of Varroa destructor and associated pathologies on the colony collapse disorder affecting honeybees. Res. Vet. Sci. 2021, 135, 85–95. [Google Scholar] [CrossRef] [PubMed]
- Anderson, D.; East, I.J. The latest buzz about colony collapse disorder. Science 2008, 319, 724–725. [Google Scholar] [CrossRef]
- Van Engelsdorp, D.; Hayes, J.; Underwood, R.M.; Pettis, J. A Survey of Honeybee Colony Losses in the U.S., Fall 2007 to Spring 2008. PLoS ONE 2008, 3, e4071. [Google Scholar]
- Cox-Foster, D.L.; Conlan, S.; Holmes, E.; Palacios, G.; Evans, J.D.; Moran, N.A.; Quan, P.L.; Briese, T.; Hornig, M.; Geiser, D.M. A metagenomic survey of microbes in honeybee colony collapse disorder. Science 2007, 318, 283–287. [Google Scholar] [CrossRef]
- Flores, J.M.; Gil-Lebrero, S.; Gámiz, V.; Rodríguez, M.I.; Ortiz, M.A.; Quiles, F.J. Effect of the climate change on honeybee colonies in a temperate Mediterranean zone assessed through remote hive weight monitoring system in conjunction with exhaustive colonies assessment. Sci. Total Environ. 2019, 653, 1111–1119. [Google Scholar] [CrossRef]
- Kurze, C.; Le Conte, Y.; Dussaubat, C.; Erler, S.; Kryger, P.; Lewkowski, O.; Muller, T.; Widder, M.; Moritz, R.F.A. Nosema Tolerant Honeybees (Apis mellifera) Escape Parasitic Manipulation of Apoptosis. PLoS ONE 2015, 10, e0140174. [Google Scholar] [CrossRef]
- Kurze, C.; Routtu, J.; Moritz, R.F.A. Parasite resistance and tolerance in honeybees at the individual and social level. Zoology 2016, 119, 290–297. [Google Scholar] [CrossRef]
- Thaduri, S.; Stephan, J.G.; de Miranda, J.R.; Locke, B. Disentangling host-parasite-pathogen interactions in a Varroa-resistant honeybee population reveals virus tolerance as an independent, naturally adapted survival mechanism. Sci. Rep. 2019, 9, 6221. [Google Scholar] [CrossRef]
- Li, X.; Ma, W.; Shen, J.; Long, D.; Feng, Y.; Su, W.; Xu, K.; Du, Y.; Jiang, Y. Tolerance and response of two honeybee species Apis cerana and Apis mellifera to high temperature and relative humidity. PLoS ONE 2019, 14, e0217921. [Google Scholar] [CrossRef]
- Chen, C.; Liu, Z.; Pan, Q.; Chen, X.; Wang, H.; Guo, H.; Liu, S.; Lu, H.; Tian, S.; Li, R.; et al. Genomic Analyses Reveal Demographic History and Temperate Adaptation of the Newly Discovered Honeybee Subspecies Apis mellifera sinisxinyuan n. ssp. Mol. Biol. Evol. 2016, 33, 1337–1348. [Google Scholar] [CrossRef]
- Chen, S.; Zhou, Y.; Chen, Y.; Gu, J. Fastp: An ultra-fast all-in-one FASTQ preprocessor. Bioinformatics 2018, 34, i884–i890. [Google Scholar] [CrossRef]
- Li, H.; Durbin, R. Fast and accurate short read alignment with Burrows-Wheeler transform. Bioinformatics 2009, 25, 1754–1760. [Google Scholar] [CrossRef]
- Burton, J.N.; Adey, A.; Patwardhan, R.P.; Qiu, R.; Kitzman, J.O.; Shendure, J. Chromosome-scale scaffolding of de novo genome assemblies based on chromatin interactions. Nat. Biotechnol. 2013, 31, 1119–1125. [Google Scholar] [CrossRef]
- Stanke, M.; Keller, O.; Gunduz, I.; Hayes, A.; Waack, S.; Morgenstern, B. AUGUSTUS: Ab initio prediction of alternative transcripts. Nucleic Acids Res. 2006, 34, 435–439. [Google Scholar] [CrossRef]
- Wallberg, A.; Bunikis, I.; Pettersson, O.V.; Mosbech, M.-B.; Childers, A.K.; Evans, J.D.; Mikheyev, A.S.; Robertson, H.M.; Robinson, G.E.; Webster, M.T. A hybrid de novo genome assembly of the honeybee, Apis mellifera, with chromosome-length scaffolds. BMC Genom. 2019, 20, 275. [Google Scholar] [CrossRef]
- Marchler-Bauer, A.; Lu, S.; Anderson, J.B.; Chitsaz, F.; Derbyshire, M.K.; DeWeese-Scott, C.; Fong, J.H.; Geer, L.Y.; Geer, R.C.; Gonzales, N.R.; et al. CDD: A Conserved Domain Database for the functional annotation of proteins. Nucleic Acids Res. 2011, 39, D225–D229. [Google Scholar]
- Mulder, N.J.; Apweiler, R. The InterPro Database and Tools for Protein Domain Analysis. Curr. Protoc. Bioinforma. 2008, 21, 2–7. [Google Scholar] [CrossRef]
- Li, H. Minimap2: Pairwise alignment for nucleotide sequences. Bioinformatics 2018, 34, 3094–3100. [Google Scholar] [CrossRef]
- Beier, S.; Thiel, T.; Münch, T.; Scholz, U.; Mascher, M. MISA-web: A web server for microsatellite prediction. Bioinformatics 2017, 33, 2583–2585. [Google Scholar] [CrossRef]
- R Core Team. R: A Language and Environment for Statistical Computing; R Foundations for Statistical Computing: Vienna, Austria, 2013; Available online: http://www.R-project.org/ (accessed on 4 June 2021).
- Edgar, R.C. MUSCLE: Multiple sequence alignment with high accuracy and high throughput. Nucleic Acids Res. 2004, 32, 1792–1797. [Google Scholar] [CrossRef]
- Emms, D.M.; Kelly, S. OrthoFinder: Phylogenetic orthology inference for comparative genomics. Genome Biol. 2019, 20, 238. [Google Scholar]
- Rozewicki, J.; Li, S.; Amada, K.M.; Standley, D.M.; Katoh, K. MAFFT-DASH: Integrated protein sequence and structural alignment. Nucleic Acids Res. 2019, 47, W5–W10. [Google Scholar]
- Sela, I.; Ashkenazy, H.; Katoh, K.; Pupko, T. GUIDANCE2: Accurate detection of unreliable alignment regions accounting for the uncertainty of multiple parameters. Nucleic Acids Res. 2015, 43, W7–W14. [Google Scholar]
- Gouveia-Oliveira, R.; Sackett, P.W.; Pedersen, A.G. MaxAlign: Maximizing usable data in an alignment. BMC Bioinform. 2007, 8, 312. [Google Scholar]
- Suyama, M.; Torrents, D.; Bork, P. PAL2NAL: Robust conversion of protein sequence alignments into the corresponding codon alignments. Nucleic Acids Res. 2006, 34, W609–W612. [Google Scholar]
- Fletcher, W.; Yang, Z. The effect of insertions, deletions, and alignment errors on the branch-site test of positive selection. Mol. Biol. Evol. 2010, 27, 2257–2267. [Google Scholar]
- Markova-Raina, P.; Petrov, D. High sensitivity to aligner and high rate of false positives in the estimates of positive selection in the 12 Drosophila genomes. Genome Res. 2011, 21, 863–874. [Google Scholar]
- Hambuch, T.M.; Parsch, J. Patterns of synonymous codon usage in Drosophila melanogaster genes with sex-biased expression. Genetics 2005, 170, 1691–1700. [Google Scholar] [CrossRef]
- Pond, S.L.K.; Frost, S.D.W.; Muse, S. V HyPhy: Hypothesis testing using phylogenies. Bioinformatics 2005, 21, 676–679. [Google Scholar] [CrossRef] [PubMed]
- Fouks, B.; Brand, P.; Nguyen, H.N.; Herman, J.; Camara, F.; Ence, D.; Hagen, D.E.; Hoff, K.J.; Nachweide, S.; Romoth, L.; et al. The genomic basis of evolutionary differentiation among honeybees. Genome Res. 2021, 31, 1203–1215. [Google Scholar] [CrossRef] [PubMed]
- Walsh, A.T.; Triant, D.A.; Le Tourneau, J.J.; Shamimuzzaman, M.; Elsik, C.G. Hymenoptera Genome Database: New genomes and annotation datasets for improved go enrichment and orthologue analyses. Nucleic Acids Res. 2022, 50, D1032–D1039. [Google Scholar] [CrossRef] [PubMed]
- Mi, H.; Muruganujan, A.; Ebert, D.; Huang, X.; Thomas, P.D. PANTHER version 14: More genomes, a new PANTHER GO-slim and improvements in enrichment analysis tools. Nucleic Acids Res. 2019, 47, D419–D426. [Google Scholar] [CrossRef] [PubMed]
- Alexa, A.; Rahnenfuhrer, J. TopGO: Enrichment Analysis for Gene Ontology; R Package Version 2.46.0; R Foundations for Statistical Computing: Vienna, Austria, 2021; Available online: https://bioconductor.org/packages/release/bioc/html/topGO.html (accessed on 31 August 2022).
- Efron, B.; Tibshirani, R. On testing the significance of sets of genes. Ann. Appl. Stat. 2007, 1, 107–129. [Google Scholar] [CrossRef]
- Roux, J.; Privman, E.; Moretti, S.; Daub, J.T.; Robinson-Rechavi, M.; Keller, L. Patterns of positive selection in seven ant genomes. Mol. Biol. Evol. 2014, 31, 1661–1685. [Google Scholar] [CrossRef]
- Ackermann, M.; Strimmer, K. A general modular framework for gene set enrichment analysis. BMC Bioinform. 2009, 10, 47. [Google Scholar] [CrossRef]
- Daub, J.T.; Hofer, T.; Cutivet, E.; Dupanloup, I.; Quintana-Murci, L.; Robinson-Rechavi, M.; Excoffier, L. Evidence for polygenic adaptation to pathogens in the human genome. Mol. Biol. Evol. 2013, 30, 1544–1558. [Google Scholar] [CrossRef]
- Fehringer, G.; Liu, G.; Briollais, L.; Brennan, P.; Amos, C.I.; Spitz, M.R.; Bickeböller, H.; Wichmann, H.E.; Risch, A.; Hung, R.J. Comparison of pathway analysis approaches using lung cancer GWAS data sets. PLoS ONE 2012, 7, e31816. [Google Scholar] [CrossRef]
- Tintle, N.L.; Borchers, B.; Brown, M.; Bekmetjev, A. Comparing gene set analysis methods on single-nucleotide polymorphism data from Genetic Analysis Workshop 16. BMC Proc. 2009, 3, S96. [Google Scholar] [CrossRef]
- Canal, L. A normal approximation for the chi-square distribution. Comput. Stat. Data Anal. 2005, 48, 803–808. [Google Scholar] [CrossRef]
- Supek, F.; Bošnjak, M.; Škunca, N.; Šmuc, T. REVIGO Summarizes and Visualizes Long Lists of Gene Ontology Terms. PLoS ONE 2011, 6, e21800. [Google Scholar] [CrossRef]
- Rimal, R.; Almøy, T.; Sæbø, S. A tool for simulating multi-response linear model data. Chemom. Intell. Lab. Syst. 2018, 176, 1–10. [Google Scholar] [CrossRef]
- Seppey, M.; Manni, M.; Zdobnov, E.M. BUSCO: Assessing Genome Assembly and Annotation Completeness BT—Gene Prediction: Methods and Protocols; Kollmar, M., Ed.; Springer: New York, NY, USA, 2019; pp. 227–245. ISBN 978-1-4939-9173-0. [Google Scholar]
- Peters, R.S.; Krogmann, L.; Mayer, C.; Donath, A.; Gunkel, S.; Meusemann, K.; Kozlov, A.; Podsiadlowski, L.; Petersen, M.; Lanfear, R.; et al. Evolutionary History of the Hymenoptera. Curr. Biol. 2017, 27, 1013–1018. [Google Scholar] [CrossRef]
- Kapheim, K.M.; Pan, H.; Li, C.; Salzberg, S.L.; Puiu, D.; Magoc, T.; Robertson, H.M.; Hudson, M.E.; Venkat, A.; Fischman, B.J.; et al. Social evolution. Genomic signatures of evolutionary transitions from solitary to group living. Science 2015, 348, 1139–1143. [Google Scholar] [CrossRef]
- Tichkule, S.; Cacciò, S.M.; Robinson, G.; Chalmers, R.M.; Mueller, I.; Emery-Corbin, S.J.; Eibach, D.; Tyler, K.M.; van Oosterhout, C.; Jex, A.R. Global Population Genomics of Two Subspecies of Cryptosporidium hominis during 500 Years of Evolution. Mol. Biol. Evol. 2022, 39, msac056. [Google Scholar] [CrossRef]
- Wallberg, A.; Schöning, C.; Webster, M.T.; Hasselmann, M. Two extended haplotype blocks are associated with adaptation to high altitude habitats in East African honeybees. PLOS Genet. 2017, 13, e1006792. [Google Scholar] [CrossRef]
- Solignac, M.; Mougel, F.; Vautrin, D.; Monnerot, M.; Cornuet, J.-M. A third-generation microsatellite-based linkage map of the honey bee, Apis mellifera, and its comparison with the sequence-based physical map. Genome Biol. 2007, 8, R66. [Google Scholar] [CrossRef]
- Behrens, D.; Huang, Q.; Geßner, C.; Rosenkranz, P.; Frey, E.; Locke, B.; Moritz, R.F.A.; Kraus, F.B. Three QTL in the honey bee Apis mellifera L. suppress reproduction of the parasitic mite Varroa destructor. Ecol. Evol. 2011, 1, 451–458. [Google Scholar] [CrossRef]
- Huang, Q.; Kryger, P.; Le Conte, Y.; Lattorff, H.M.G.; Kraus, F.B.; Moritz, R.F.A. Four quantitative trait loci associated with low Nosema ceranae (Microsporidia) spore load in the honeybee Apis mellifera. Apidologie 2014, 45, 248–256. [Google Scholar] [CrossRef]
- Saleh, N.W.; Ramírez, S.R. Sociality emerges from solitary behaviours and reproductive plasticity in the orchid bee Euglossa dilemma. Proc. R. Soc. B Biol. Sci. 2019, 286, 20190588. [Google Scholar] [CrossRef]
- Shell, W.A.; Steffen, M.A.; Pare, H.K.; Seetharam, A.S.; Severin, A.J.; Toth, A.L.; Rehan, S.M. Sociality sculpts similar patterns of molecular evolution in two independently evolved lineages of eusocial bees. Commun. Biol. 2021, 4, 253. [Google Scholar] [CrossRef]
- de Azevedo, S.V.; Hartfelder, K. The insulin signaling pathway in honeybee (Apis mellifera) caste development—Differential expression of insulin-like peptides and insulin receptors in queen and worker larvae. J. Insect Physiol. 2008, 54, 1064–1071. [Google Scholar] [CrossRef]
- Wang, Y.; Azevedo, S.V.; Hartfelder, K.; Amdam, G. V Insulin-like peptides (AmILP1 and AmILP2) differentially affect female caste development in the honeybee (Apis mellifera L.). J. Exp. Biol. 2013, 216, 4347–4357. [Google Scholar]
- Lago, D.C.; Humann, F.C.; Barchuk, A.R.; Abraham, K.J.; Hartfelder, K. Differential gene expression underlying ovarian phenotype determination in honeybee, Apis mellifera L., caste development. Insect Biochem. Mol. Biol. 2016, 79, 1–12. [Google Scholar] [CrossRef]
- Martins, J.R.; Nunes, F.M.F.; Cristino, A.S.; Simões, Z.L.P.; Bitondi, M.M.G. The four hexamerin genes in the honey bee: Structure, molecular evolution and function deduced from expression patterns in queens, workers and drones. BMC Mol. Biol. 2010, 11, 23. [Google Scholar] [CrossRef]
- Martins, J.R.; Morais Franco Nunes, F.; Luz Paulino Simões, Z.; Maria Gentile Bitondi, M. A honeybee storage protein gene, hex 70a, expressed in developing gonads and nutritionally regulated in adult fat body. J. Insect Physiol. 2008, 54, 867–877. [Google Scholar] [CrossRef]
- Page, R.E., Jr.; Scheiner, R.; Erber, J.; Amdam, G.V. The development and evolution of division of labor and foraging specialization in a social insect (Apis mellifera L.). Curr. Top. Dev. Biol. 2006, 74, 253–286. [Google Scholar]
- Wittwer, B.; Hefetz, A.; Simon, T.; Murphy, L.E.; Elgar, M.A.; Pierce, N.E.; Kocher, S.D. Solitary bees reduce investment in communication compared with their social relatives. Proc. Natl. Acad. Sci. USA 2017, 114, 6569–6574. [Google Scholar] [CrossRef]
- Smith, A.; Simons, M.; Bazarko, V.; Seid, M. The influence of sociality, caste, and size on behavior in a facultatively eusocial bee. Insectes Soc. 2019, 66, 153–163. [Google Scholar] [CrossRef]
- Oldroyd, B.P. Domestication of honeybees was associated with expansion of genetic diversity. Mol. Ecol. 2012, 21, 4409–4411. [Google Scholar] [CrossRef] [PubMed]
- Wallberg, A.; Han, F.; Wellhagen, G.; Dahle, B.; Kawata, M.; Haddad, N.; Simões, Z.L.P.; Allsopp, M.H.; Kandemir, I.; De la Rúa, P.; et al. A worldwide survey of genome sequence variation provides insight into the evolutionary history of the honeybee Apis mellifera. Nat. Genet. 2014, 46, 1081–1088. [Google Scholar] [CrossRef] [PubMed]
- Yamauchi, T.; Moroishi, T. Hippo Pathway in Mammalian Adaptive Immune System. Cells 2019, 8, 398. [Google Scholar] [CrossRef] [PubMed]
- Ma, S.; Meng, Z.; Chen, R.; Guan, K.-L. The Hippo Pathway: Biology and Pathophysiology. Annu. Rev. Biochem. 2019, 88, 577–604. [Google Scholar] [CrossRef]
- Ramirez, L.; Luna, F.; Mucci, C.A.; Lamattina, L. Fast weight recovery, metabolic rate adjustment and gene-expression regulation define responses of cold-stressed honeybee brood. J. Insect Physiol. 2021, 128, 104178. [Google Scholar] [CrossRef]
- Mucci, C.A.; Ramirez, L.; Giffoni, R.S.; Lamattina, L. Cold stress induces specific antioxidant responses in honeybee brood. Apidologie 2021, 52, 596–607. [Google Scholar] [CrossRef]
- Azevedo, S.V.; Caranton, O.A.M.; de Oliveira, T.L.; Hartfelder, K. Differential expression of hypoxia pathway genes in honeybee (Apis mellifera L.) caste development. J. Insect Physiol. 2011, 57, 38–45. [Google Scholar] [CrossRef]
- Liu, N.; Ren, Z.; Ren, Q.; Chang, Z.; Li, J.; Li, X.; Sun, Z.; He, J.; Niu, Q.; Xing, X. Full length transcriptomes analysis of cold-resistance of Apis cerana in Changbai Mountain during overwintering period. Gene 2022, 830, 146503. [Google Scholar] [CrossRef]
- Xu, K.; Niu, Q.; Zhao, H.; Du, Y.; Jiang, Y. Transcriptomic analysis to uncover genes affecting cold resistance in the Chinese honeybee (Apis cerana cerana). PLoS ONE 2017, 12, e0179922. [Google Scholar]
- Lipaeva, P.; Vereshchagina, K.; Drozdova, P.; Jakob, L.; Kondrateva, E.; Lucassen, M.; Bedulina, D.; Timofeyev, M.; Stadler, P.; Luckenbach, T. Different ways to play it cool: Transcriptomic analysis sheds light on different activity patterns of three amphipod species under long-term cold exposure. Mol. Ecol. 2021, 30, 5735–5751. [Google Scholar] [CrossRef]
Publisher’s Note: MDPI stays neutral with regard to jurisdictional claims in published maps and institutional affiliations. |
© 2022 by the authors. Licensee MDPI, Basel, Switzerland. This article is an open access article distributed under the terms and conditions of the Creative Commons Attribution (CC BY) license (https://creativecommons.org/licenses/by/4.0/).