
Quantitative Fluorescence Imaging of Perfusion—An Algorithm to Predict Anastomotic Leakage

 ,
,  , ,
, ,
Abstract
:1. Introduction
2. Methods
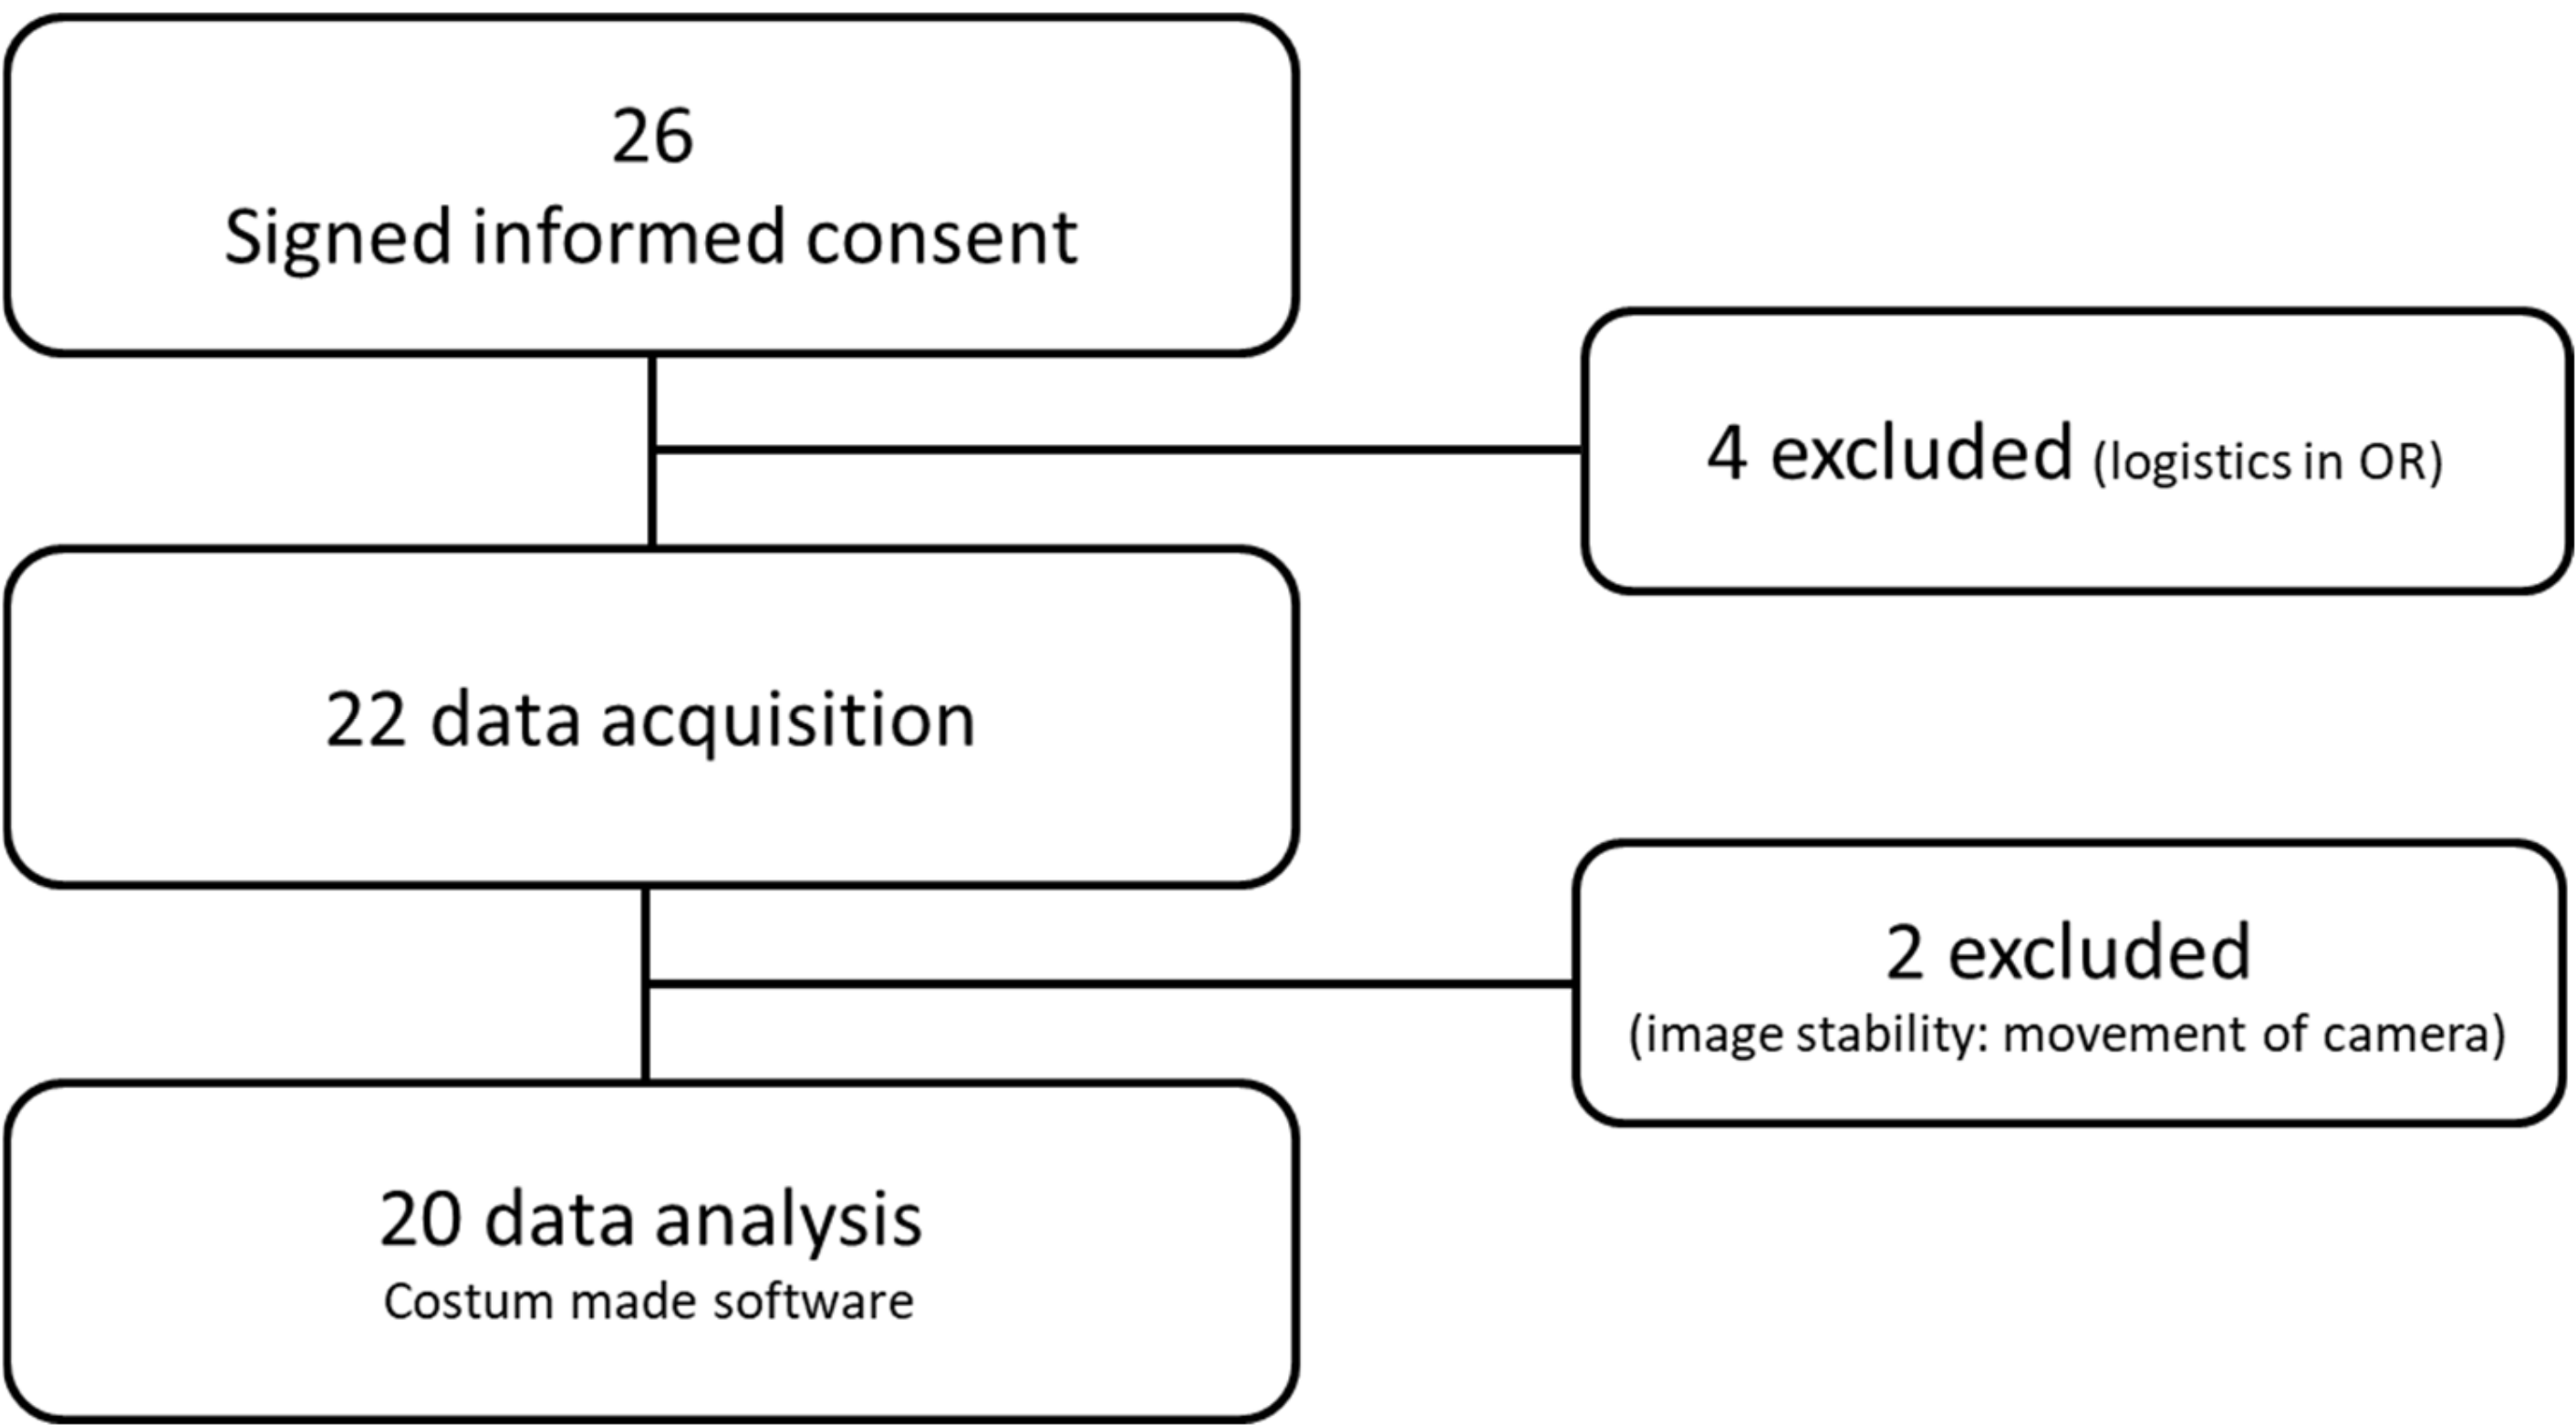
2.1. Patients
2.2. Surgical Procedure
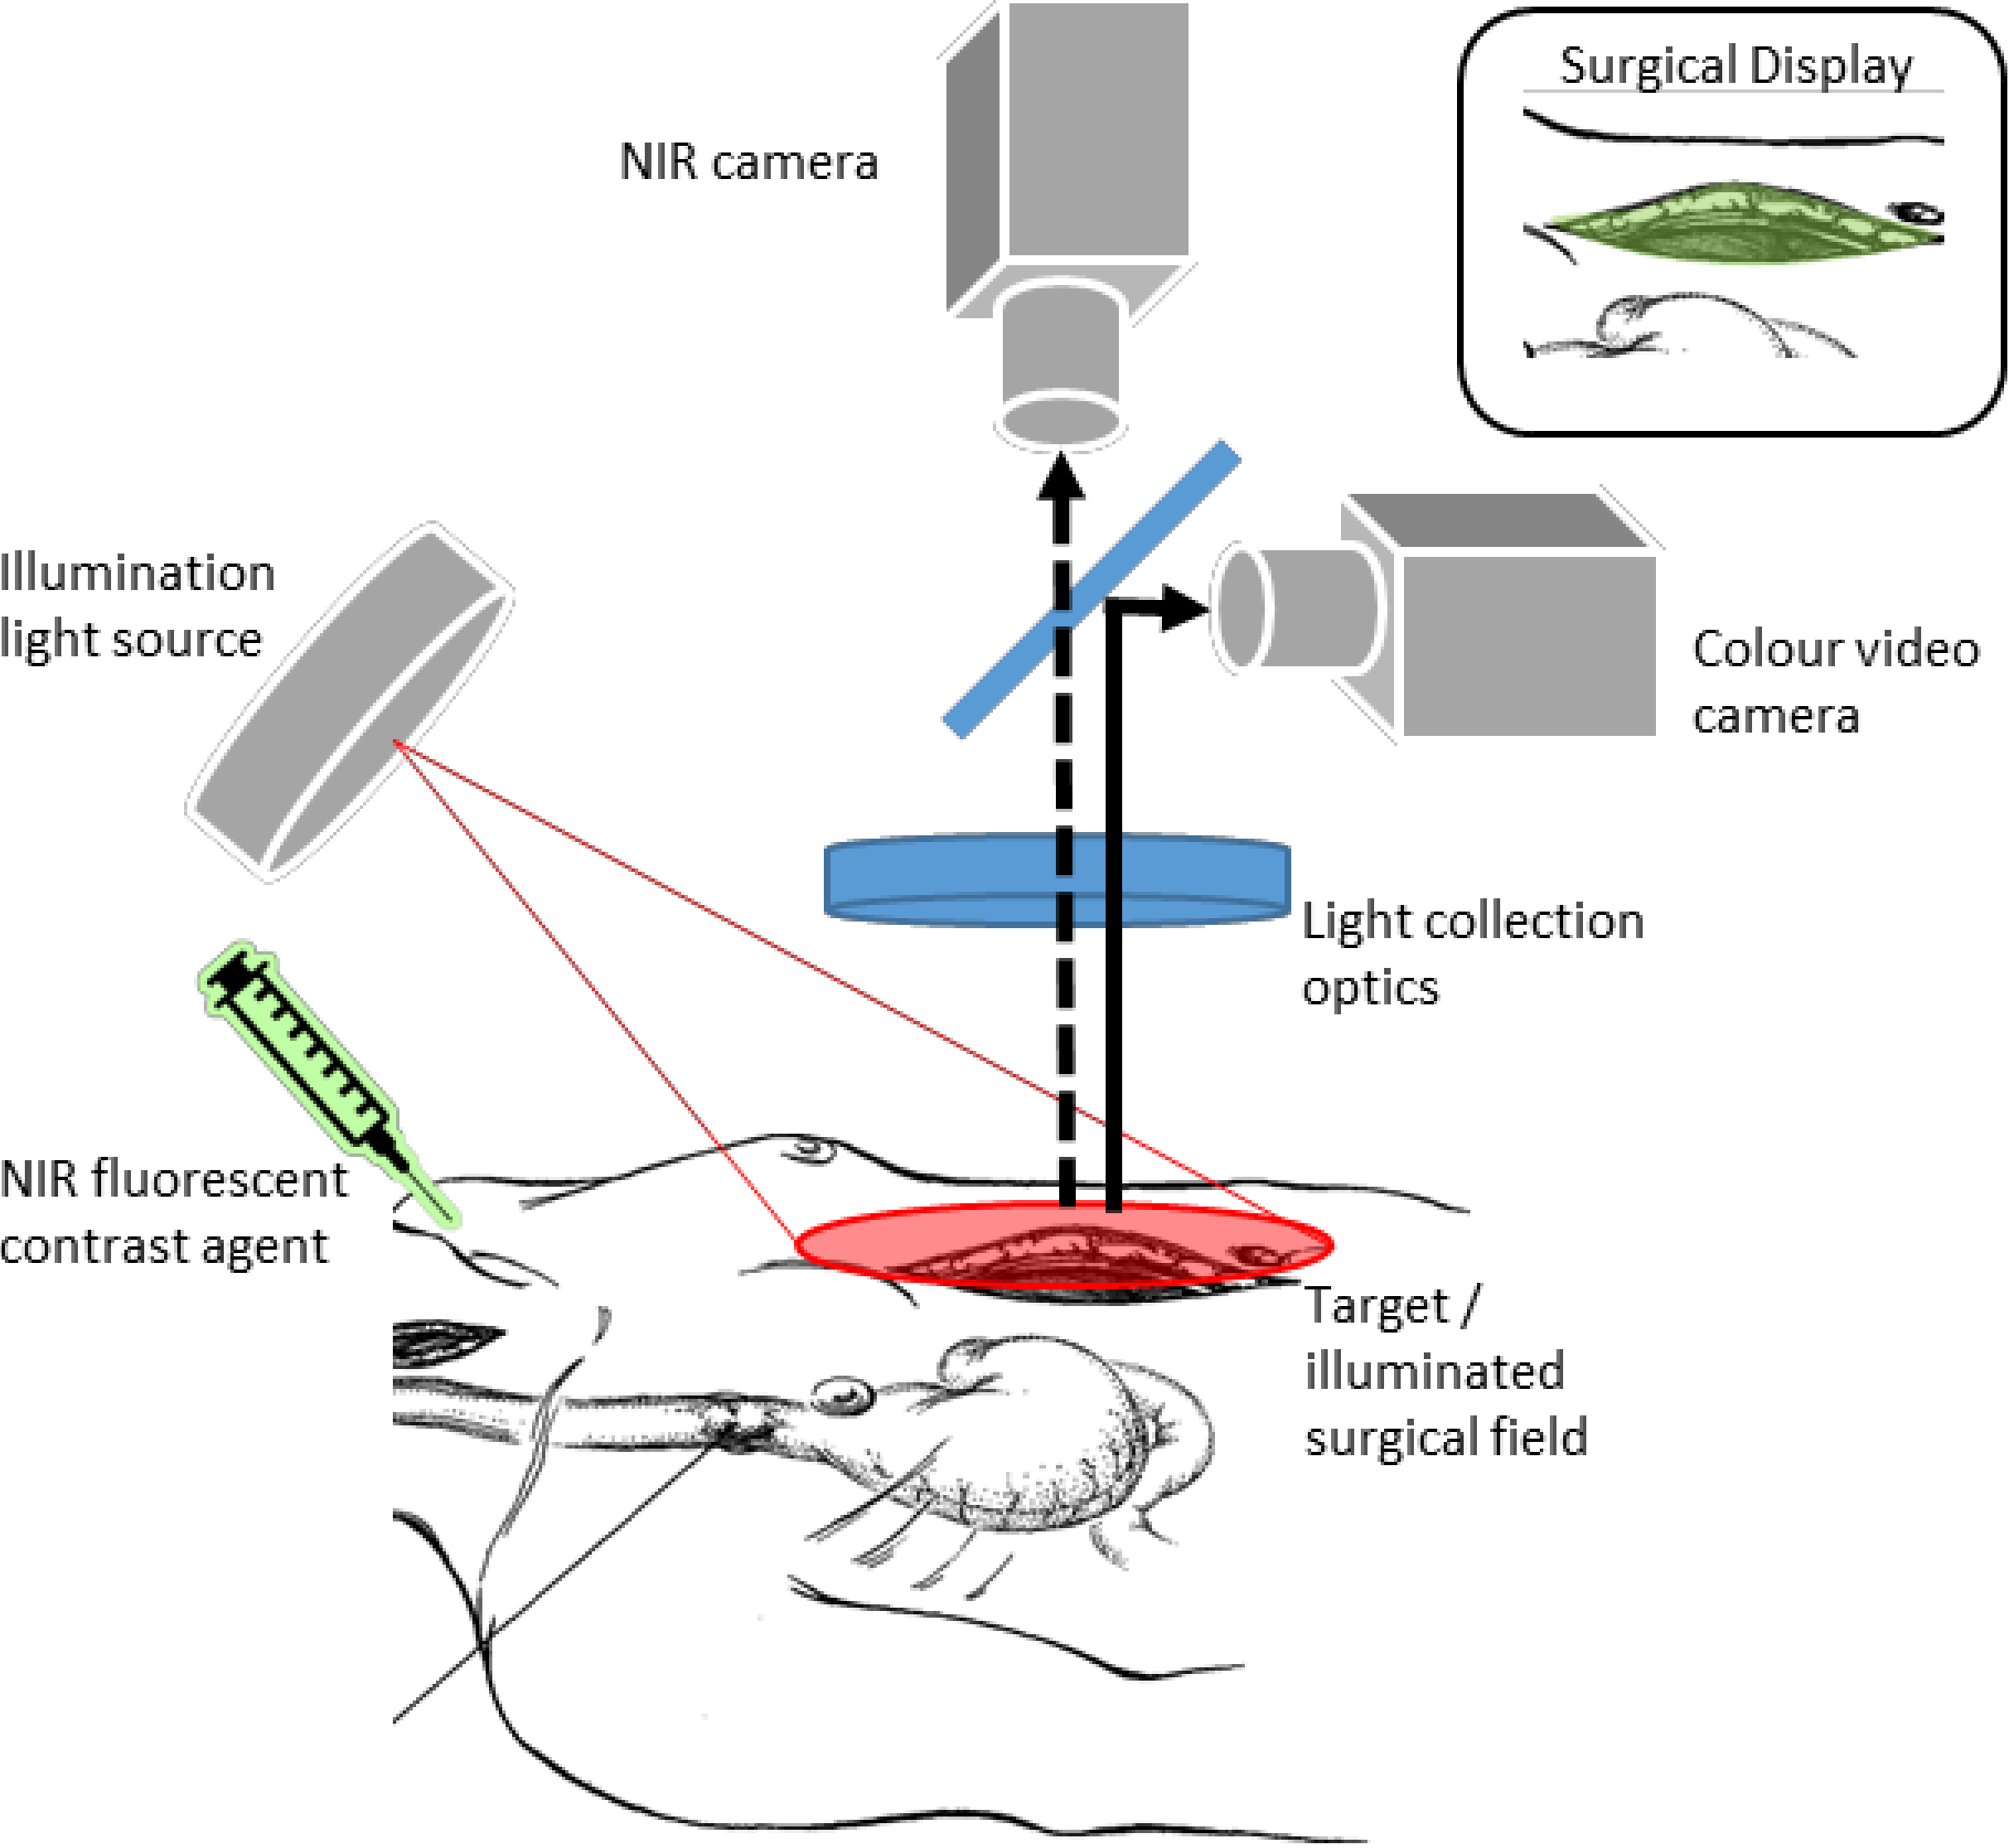
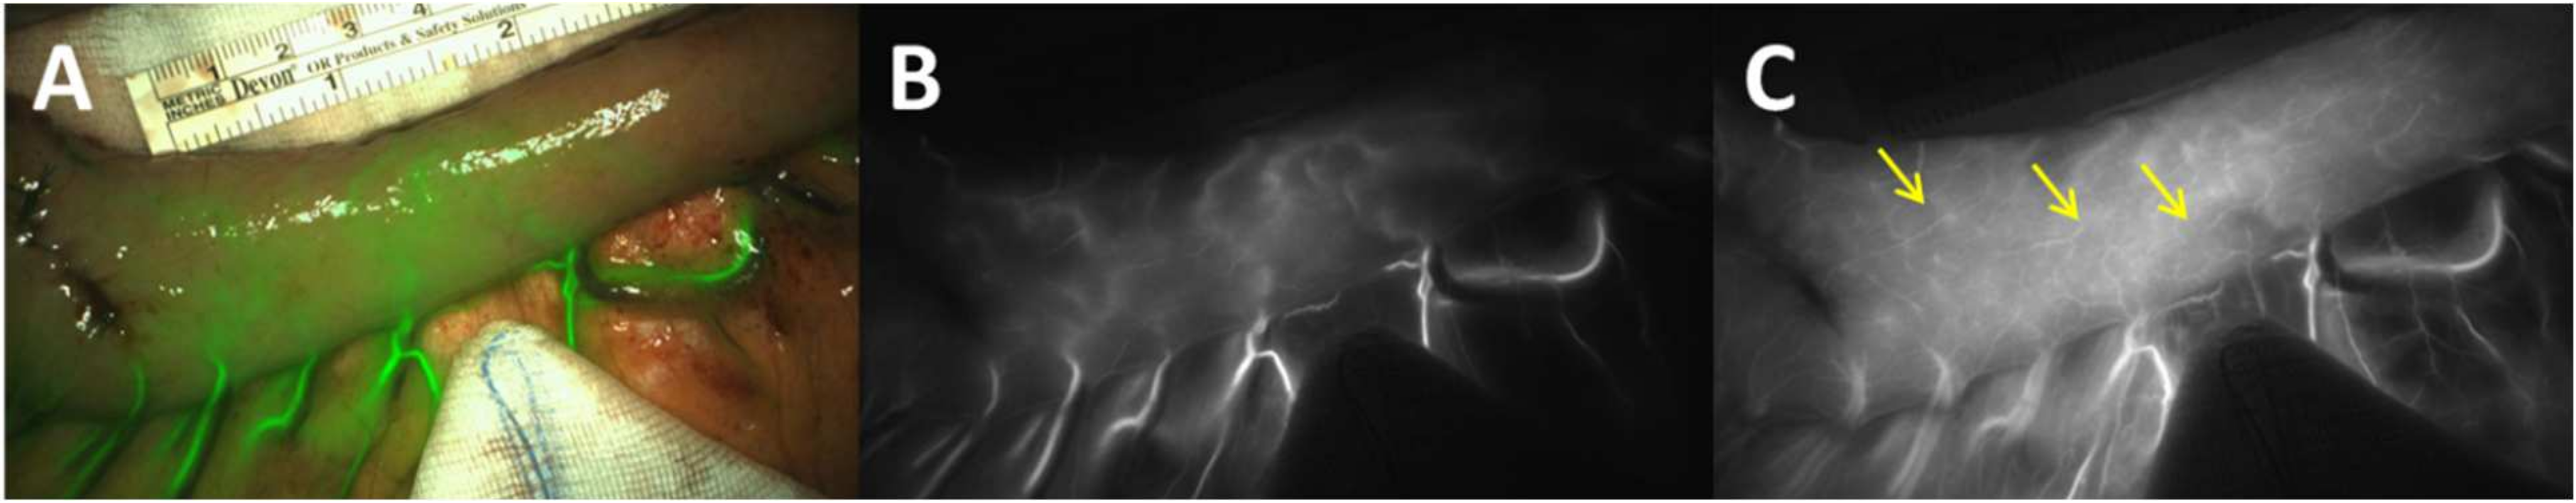
2.3. Intra-Operative Perfusion Imaging by Fluorescence Imaging
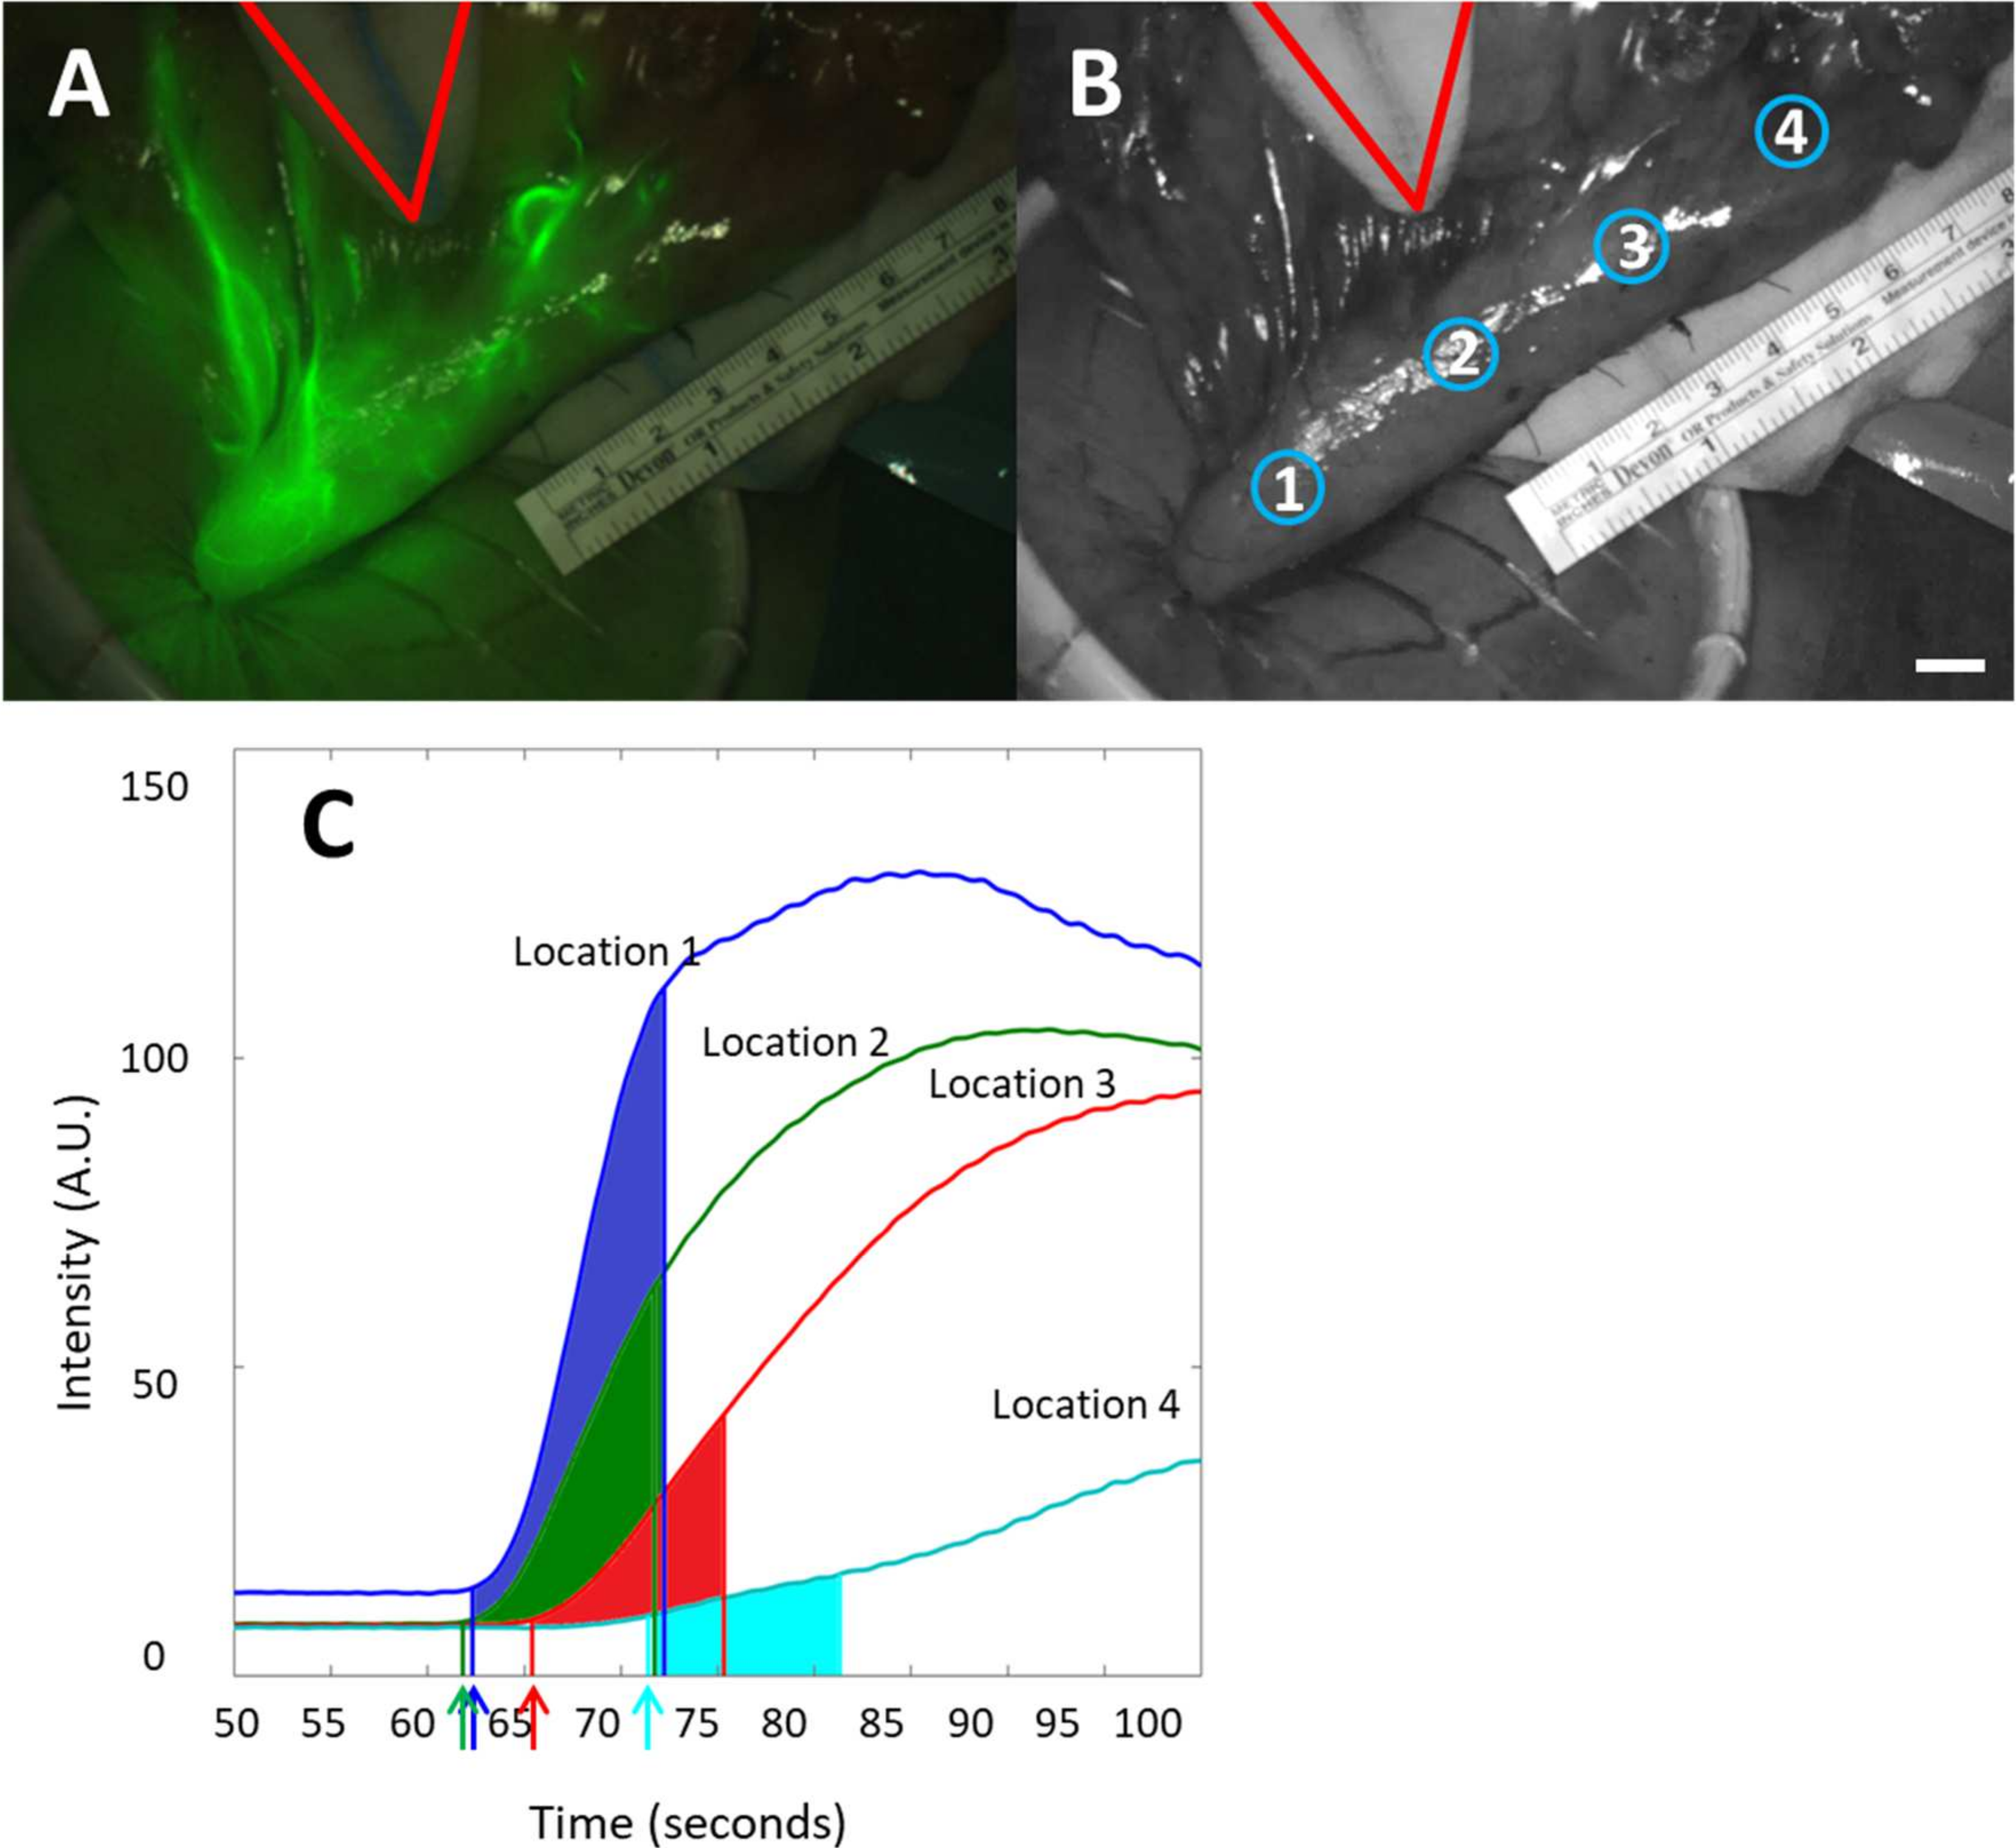
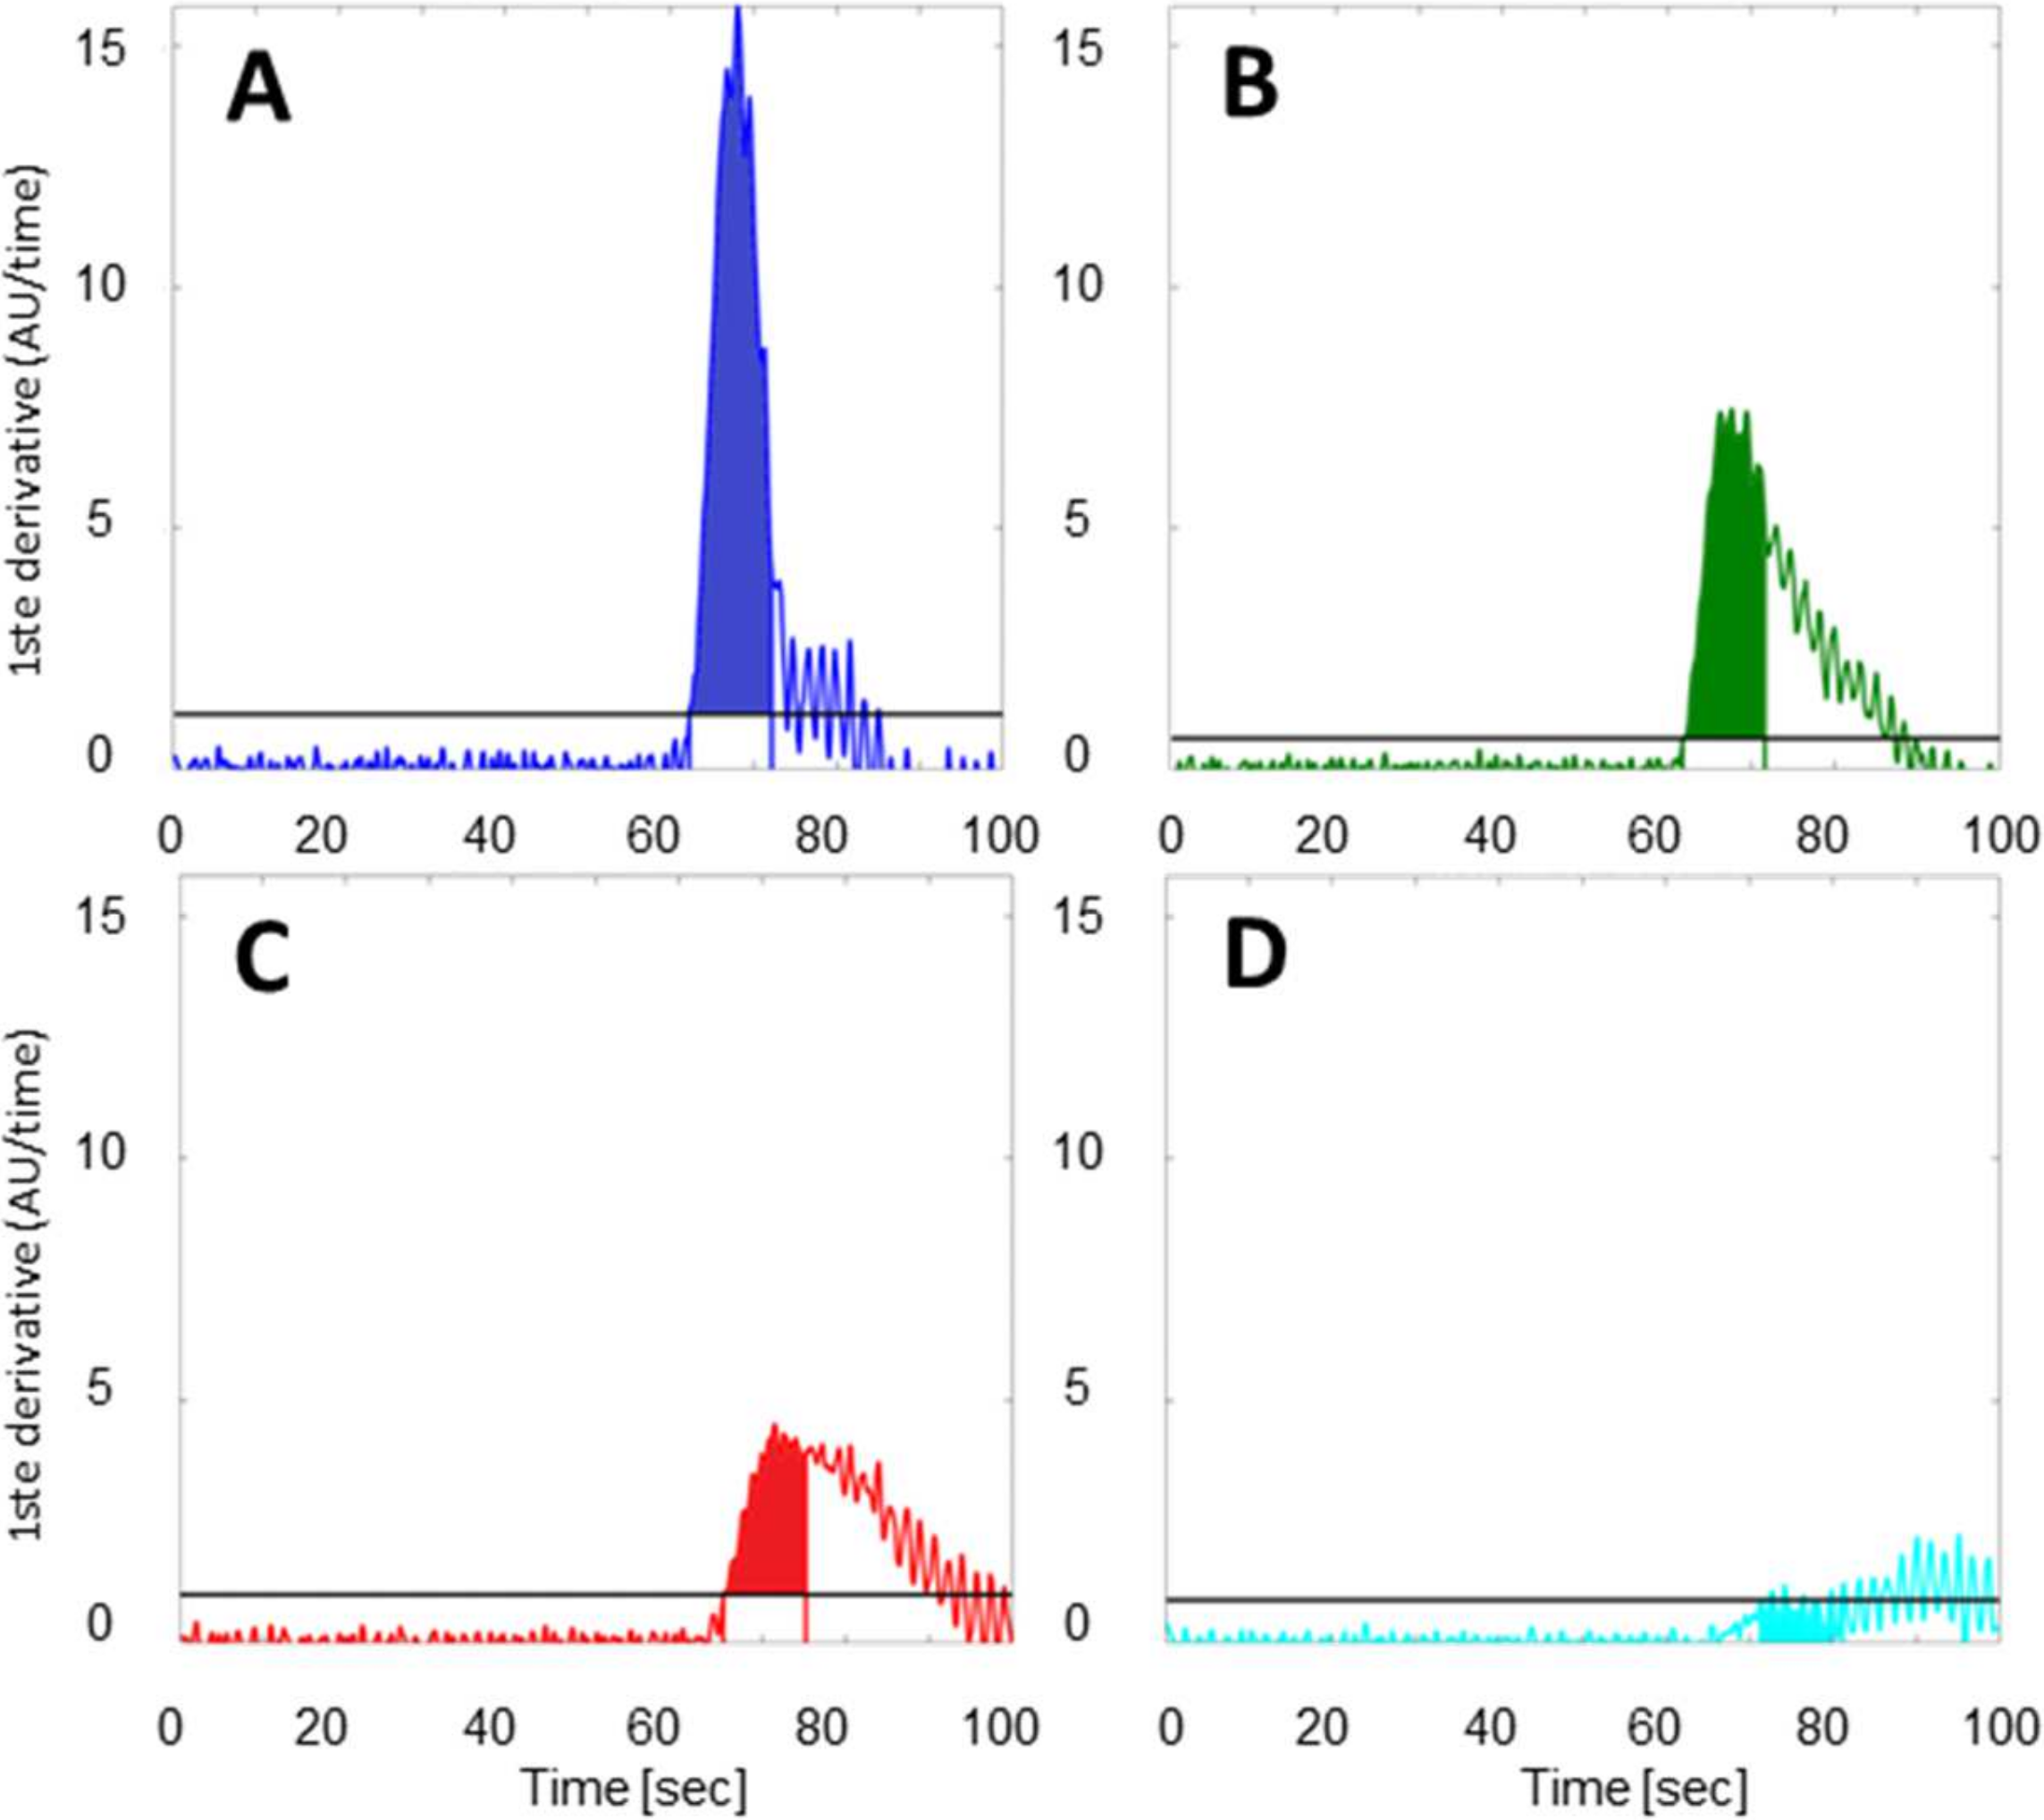
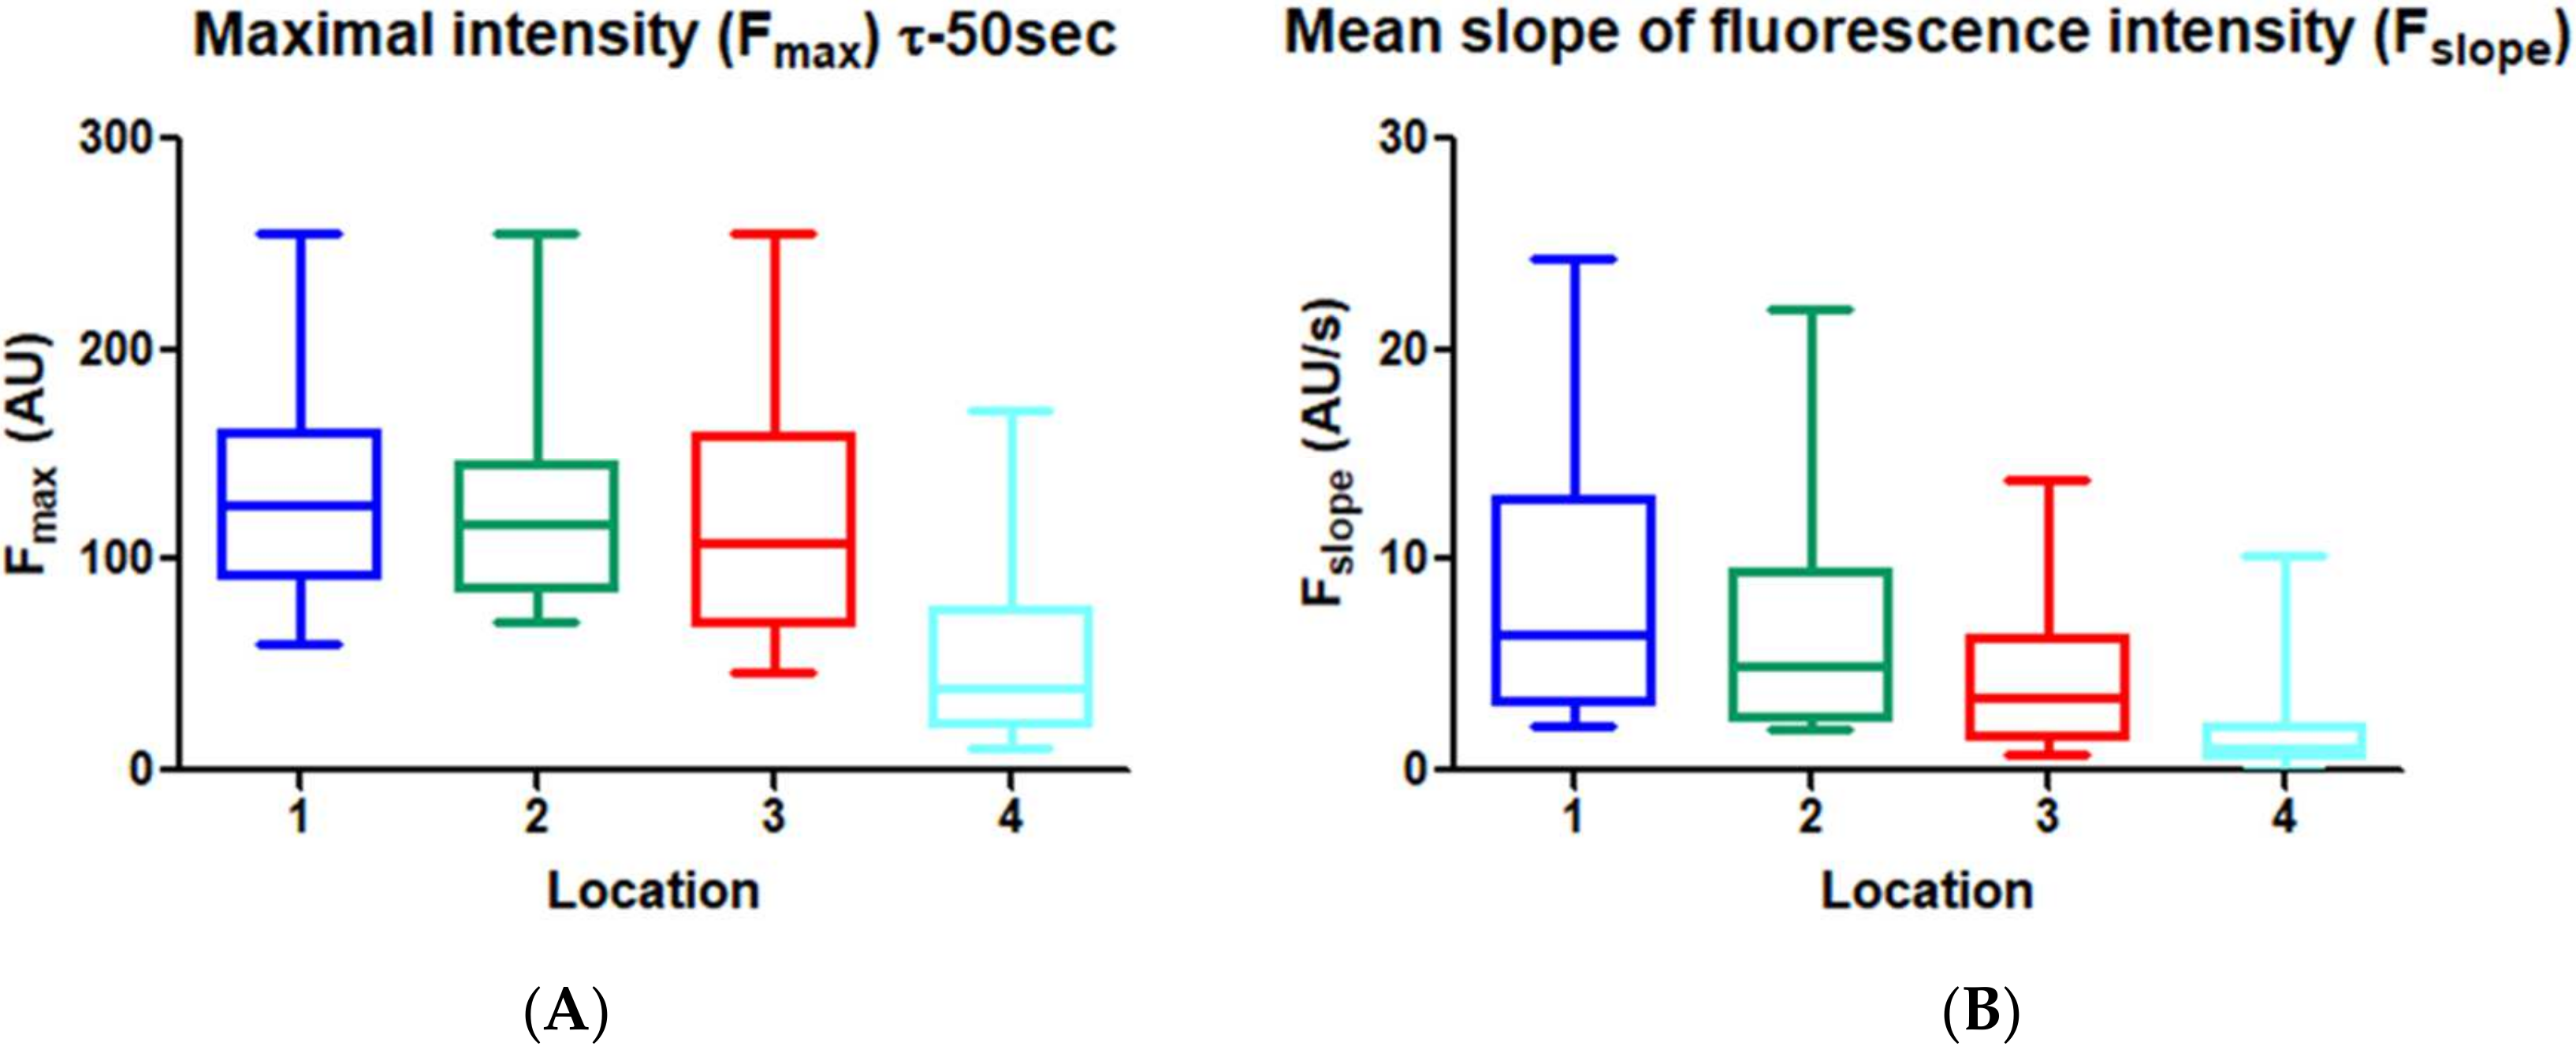
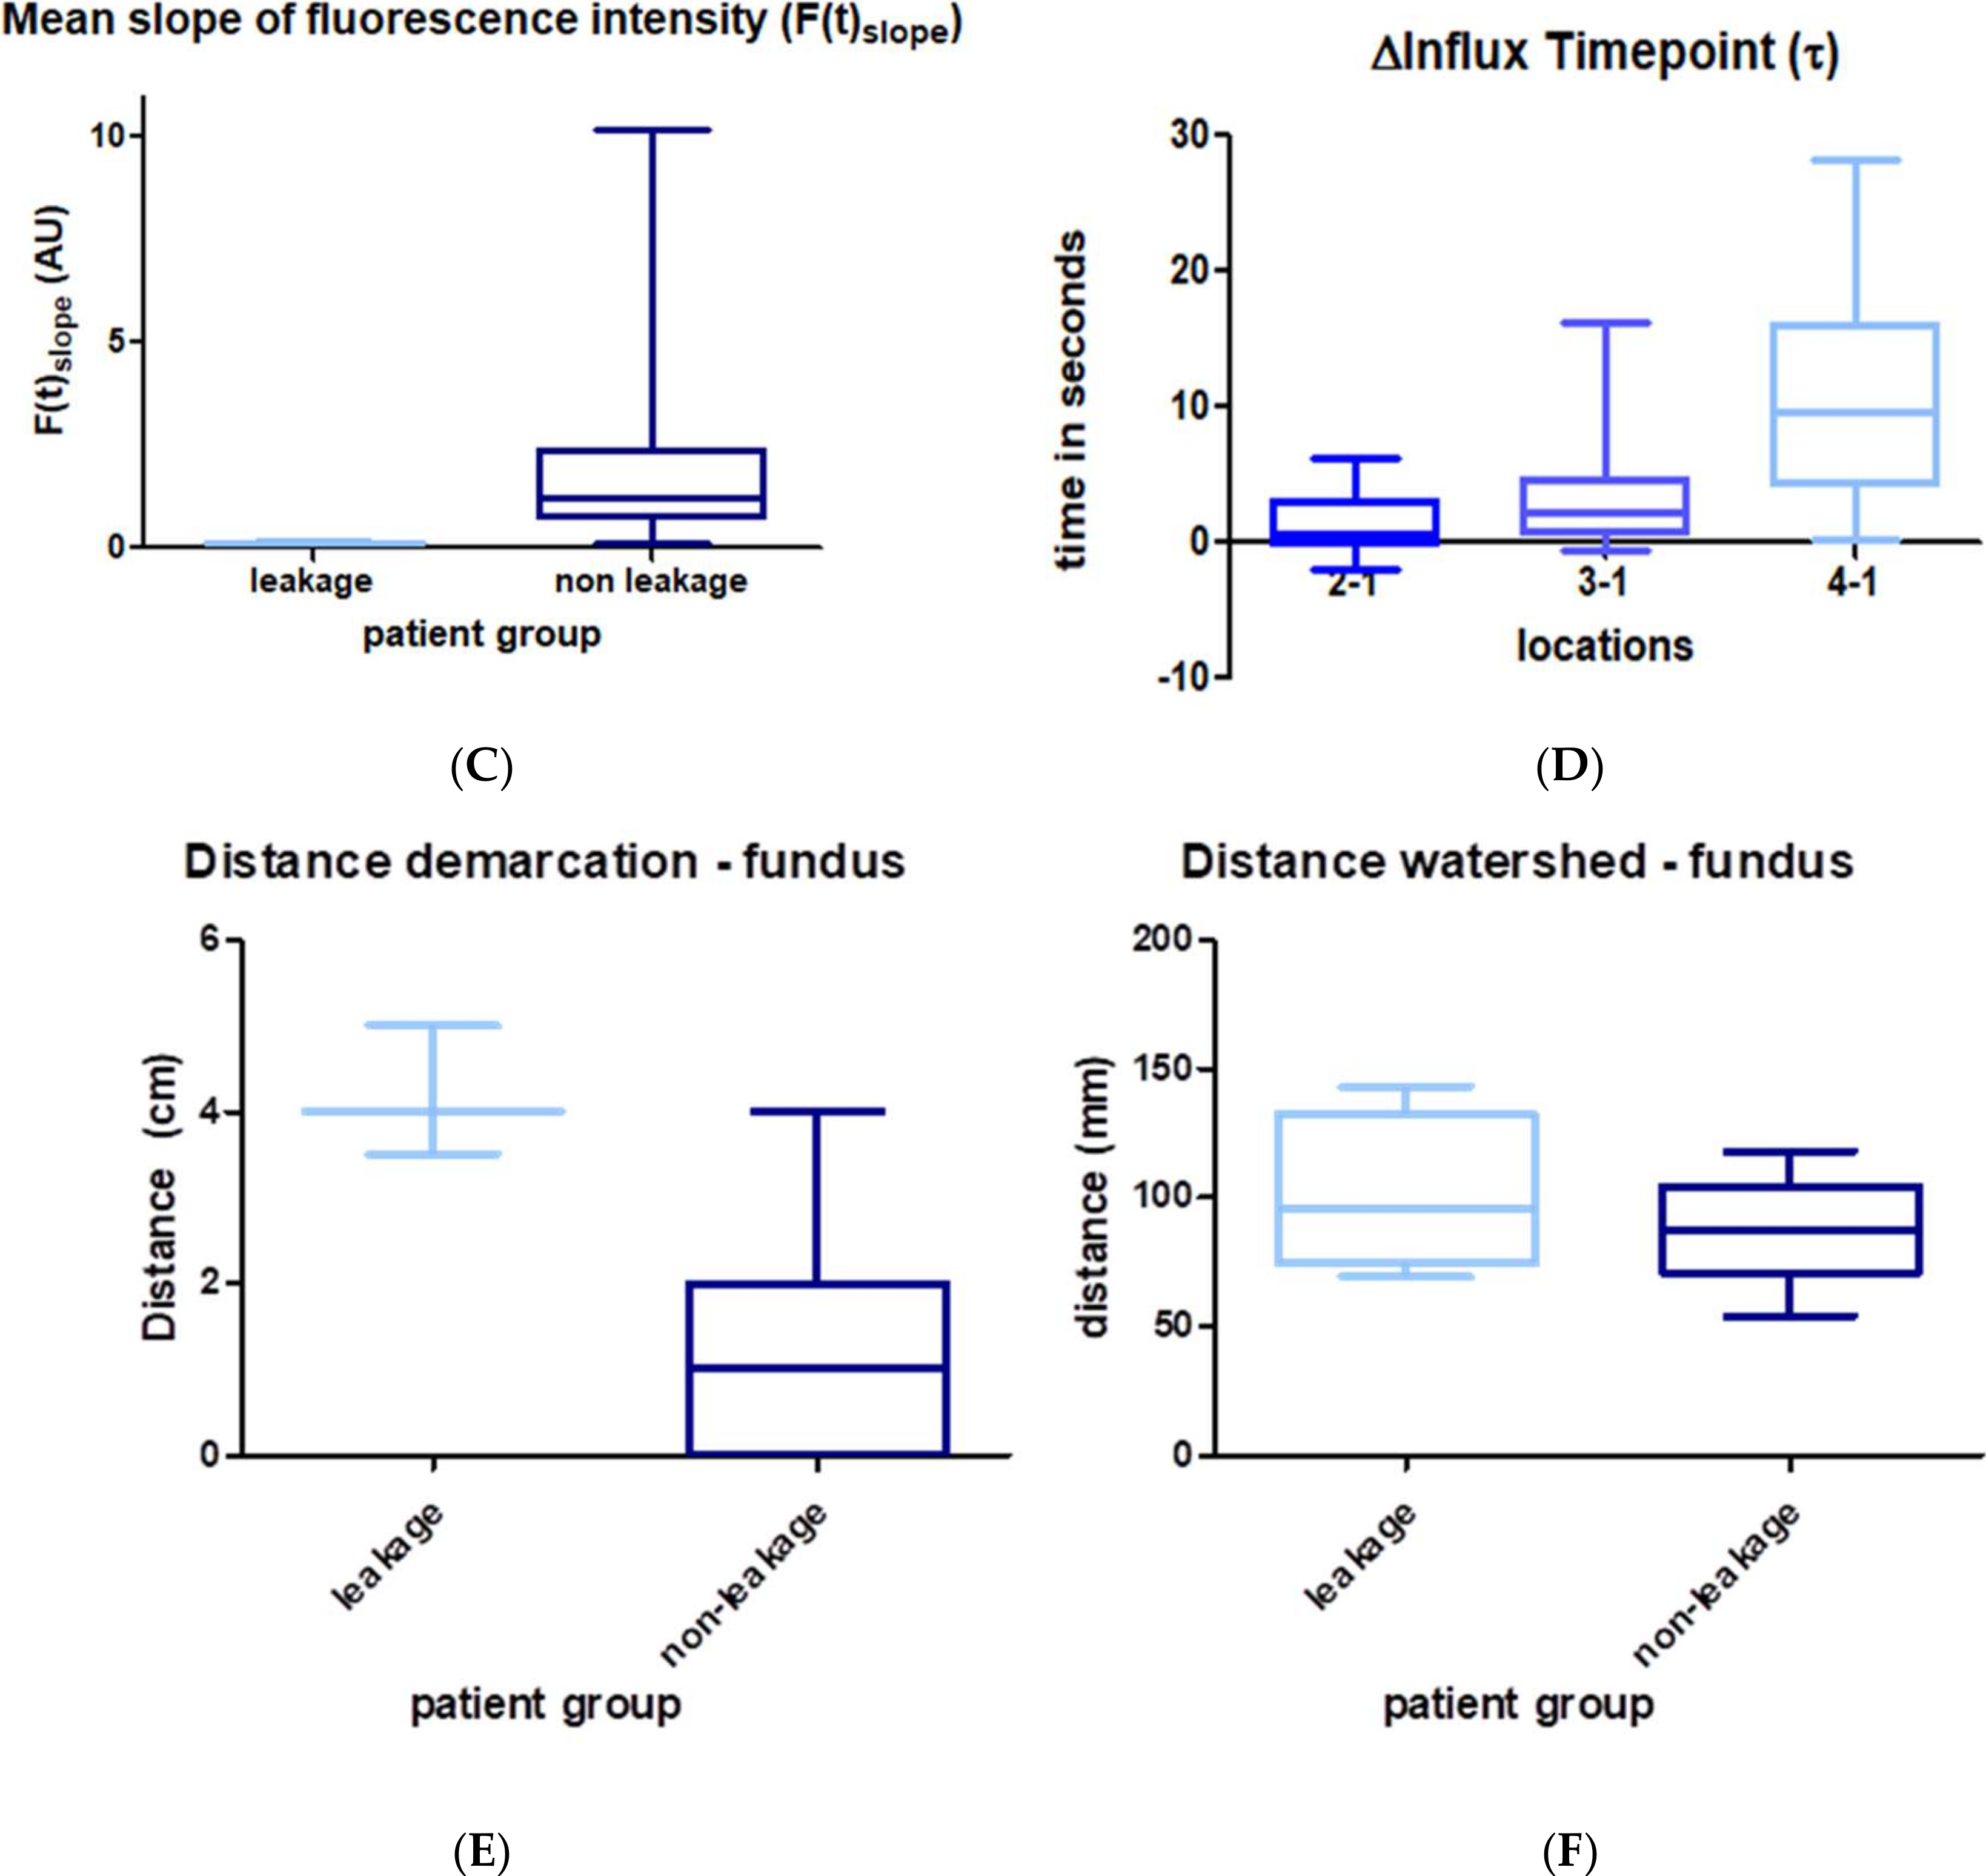
2.4. Data Analysis
2.5. Statistical Analysis
3. Results
3.1. Participants
3.2. Feasibility of Fluorescence Imaging
3.3. Quantitative Perfusion Imaging with FI
4. Discussion
5. Conclusions
Author Contributions
Funding
Institutional Review Board Statement
Informed Consent Statement
Data Availability Statement
Acknowledgments
Conflicts of Interest
References
- Futier, E.; Robin, E.; Jabaudon, M.; Guerin, R.; Petit, A.; Bazin, J.E.; Constantin, J.M.; Vallet, B. Central venous O(2) saturation and venous-to-arterial CO(2) difference as complementary tools for goal-directed therapy during high-risk surgery. Crit. Care 2010, 14, R193. [Google Scholar] [CrossRef] [Green Version]
- van Hagen, P.; Hulshof, M.C.; van Lanschot, J.J.; Steyerberg, E.W.; van Berge Henegouwen, M.I.; Wijnhoven, B.P.; Richel, D.J.; Nieuwenhuijzen, G.A.; Hospers, G.A.; Bonenkamp, J.J.; et al. Preoperative chemoradiotherapy for esophageal or junctional cancer. N. Engl. J. Med. 2012, 366, 2074–2084. [Google Scholar] [CrossRef] [Green Version]
- Rino, Y.; Yukawa, N.; Sato, T.; Yamamoto, N.; Tamagawa, H.; Hasegawa, S.; Oshima, T.; Yoshikawa, T.; Masuda, M.; Imada, T. Visualization of blood supply route to the reconstructed stomach by indocyanine green fluorescence imaging during esophagectomy. BMC Med. Imaging 2014, 14, 18. [Google Scholar] [CrossRef] [PubMed] [Green Version]
- Shimada, Y.; Okumura, T.; Nagata, T.; Sawada, S.; Matsui, K.; Hori, R.; Yoshioka, I.; Yoshida, T.; Osada, R.; Tsukada, K. Usefulness of blood supply visualization by indocyanine green fluorescence for reconstruction during esophagectomy. Esophagus 2011, 8, 259–266. [Google Scholar] [CrossRef] [PubMed] [Green Version]
- Kubota, K.; Yoshida, M.; Kuroda, J.; Okada, A.; Ohta, K.; Kitajima, M. Application of the HyperEye Medical System for esophageal cancer surgery: A preliminary report. Surg. Today 2013, 43, 215–220. [Google Scholar] [CrossRef] [PubMed]
- Kumagai, Y.; Ishiguro, T.; Haga, N.; Kuwabara, K.; Kawano, T.; Ishida, H. Hemodynamics of the reconstructed gastric tube during esophagectomy: Assessment of outcomes with indocyanine green fluorescence. World J. Surg. 2014, 38, 138–143. [Google Scholar] [CrossRef] [PubMed]
- Yukaya, T.; Saeki, H.; Kasagi, Y.; Nakashima, Y.; Ando, K.; Imamura, Y.; Ohgaki, K.; Oki, E.; Morita, M.; Maehara, Y. Indocyanine Green Fluorescence Angiography for Quantitative Evaluation of Gastric Tube Perfusion in Patients Undergoing Esophagectomy. J. Am. Coll. Surg. 2015, 221, e37–e42. [Google Scholar] [CrossRef]
- Zehetner, J.; DeMeester, S.R.; Alicuben, E.T.; Oh, D.S.; Lipham, J.C.; Hagen, J.A.; DeMeester, T.R. Intraoperative Assessment of Perfusion of the Gastric Graft and Correlation With Anastomotic Leaks After Esophagectomy. Ann. Surg. 2015, 262, 74–78. [Google Scholar] [CrossRef] [PubMed] [Green Version]
- Low, D.E.; Alderson, D.; Cecconello, I.; Chang, A.C.; Darling, G.E.; D’Journo, X.B.; Griffin, S.M.; Holscher, A.H.; Hofstetter, W.L.; Jobe, B.A.; et al. International Consensus on Standardization of Data Collection for Complications Associated With Esophagectomy: Esophagectomy Complications Consensus Group (ECCG). Ann. Surg. 2015, 262, 286–294. [Google Scholar] [CrossRef] [PubMed]
- McCulloch, P.; Altman, D.G.; Campbell, W.B.; Flum, D.R.; Glasziou, P.; Marshall, J.C.; Nicholl, J.; Collaboration, B. Surgical Innovation and Evaluation 3 No surgical innovation without evaluation: The IDEAL recommendations. Lancet 2009, 374, 1105–1112. [Google Scholar] [CrossRef]
- Vandenbroucke, J.P.; von Elm, E.; Altman, D.G.; Gotzsche, P.C.; Mulrow, C.D.; Pocock, S.J.; Poole, C.; Schlesselman, J.J.; Egger, M.; Initiative, S. Strengthening the Reporting of Observational Studies in Epidemiology (STROBE): Explanation and elaboration. Int. J. Surg. 2014, 12, 1500–1524. [Google Scholar] [CrossRef] [Green Version]
- Bossuyt, P.M.; Reitsma, J.B.; Bruns, D.E.; Gatsonis, C.A.; Glasziou, P.P.; Irwig, L.M.; Moher, D.; Rennie, D.; de Vet, H.C.; Lijmer, J.G.; et al. The STARD statement for reporting studies of diagnostic accuracy: Explanation and elaboration. Clin. Chem. 2003, 49, 7–18. [Google Scholar] [CrossRef]
- Chen, B.; Zhang, B.; Zhu, C.; Ye, Z.; Wang, C.; Ma, D.; Ye, M.; Kong, M.; Jin, J.; Lin, J.; et al. Modified McKeown minimally invasive esophagectomy for esophageal cancer: A 5-year retrospective study of 142 patients in a single institution. PLoS One 2013, 8, e82428. [Google Scholar] [CrossRef] [PubMed]
- Nguyen, N.T.; Follette, D.M.; Lemoine, P.H.; Roberts, P.F.; Goodnight, J.E., Jr. Minimally invasive Ivor Lewis esophagectomy. Ann. Thorac. Surg. 2001, 72, 593–596. [Google Scholar] [CrossRef]
- Jones, D.R. Minimally Invasive Ivor Lewis Esophagectomy. Oper. Tech. Thorac. Cardiovasc. Surg. 2013, 18, 254–263. [Google Scholar] [CrossRef] [Green Version]
- Vahrmeijer, A.L.; Frangioni, J.V. Seeing the invisible during surgery. Br. J. Surg. 2011, 98, 749–750. [Google Scholar] [CrossRef] [PubMed] [Green Version]
- Lin, L.; Bivard, A.; Krishnamurthy, V.; Levi, C.R.; Parsons, M.W. Whole-Brain CT Perfusion to Quantify Acute Ischemic Penumbra and Core. Radiology 2016, 279, 876–887. [Google Scholar] [CrossRef]
- Frangioni, J.V. In vivo near-infrared fluorescence imaging. Curr. Opin. Chem. Biol. 2003, 7, 626–634. [Google Scholar] [CrossRef] [PubMed]
- Yamaguchi, K.; Kumagai, Y.; Saito, K.; Hoshino, A.; Tokairin, Y.; Kawada, K.; Nakajima, Y.; Yamazaki, S.; Ishida, H.; Kinugasa, Y. The evaluation of the gastric tube blood flow by indocyanine green fluorescence angiography during esophagectomy: A multicenter prospective study. Gen. Thorac. Cardiovasc. Surg. 2021, 69, 1118–1124. [Google Scholar] [CrossRef]
- Moon, H.K.; Taylor, G.I. The vascular anatomy of rectus abdominis musculocutaneous flaps based on the deep superior epigastric system. Plast. Reconstr. Surg. 1988, 82, 815–832. [Google Scholar] [CrossRef]
- Jafari, M.D.; Lee, K.H.; Halabi, W.J.; Mills, S.D.; Carmichael, J.C.; Stamos, M.J.; Pigazzi, A. The use of indocyanine green fluorescence to assess anastomotic perfusion during robotic assisted laparoscopic rectal surgery. Surg. Endosc. 2013, 27, 3003–3008. [Google Scholar] [CrossRef] [PubMed]
- Kitagawa, H.; Namikawa, T.; Iwabu, J.; Fujisawa, K.; Uemura, S.; Tsuda, S.; Hanazaki, K. Assessment of the blood supply using the indocyanine green fluorescence method and postoperative endoscopic evaluation of anastomosis of the gastric tube during esophagectomy. Surg. Endosc. 2018, 32, 1749–1754. [Google Scholar] [CrossRef]
- Kono, K.; Sugai, H.; Omata, H.; Fujii, H. Transient bloodletting of the short gastric vein in the reconstructed gastric tube improves gastric microcirculation during esophagectomy. World J. Surg. 2007, 31, 780–784, discussion 785–786. [Google Scholar] [CrossRef]
- Maish, M.S.; DeMeester, S.R.; Choustoulakis, E.; Briel, J.W.; Hagen, J.A.; Peters, J.H.; Lipham, J.C.; Bremner, C.G.; DeMeester, T.R. The safety and usefulness of endoscopy for evaluation of the graft and anastomosis early after esophagectomy and reconstruction. Surg. Endosc. 2005, 19, 1093–1102. [Google Scholar] [CrossRef] [PubMed]
- Jansen, S.M.; de Bruin, D.M.; van Berge Henegouwen, M.I.; Bloemen, P.R.; Strackee, S.D.; Veelo, D.P.; van Leeuwen, T.G.; Gisbertz, S.S. Quantitative change of perfusion in gastric tube reconstruction by sidestream dark field microscopy (SDF) after esophagectomy, a prospective in-vivo cohort study. Eur. J. Surg. Oncol. 2021, 47, 1034–1041. [Google Scholar] [CrossRef] [PubMed]


| Patient Characteristics | |
|---|---|
| Age—yr | |
| median | 62 |
| range | 37–79 |
| Gender—m, f (n) | 19, 1 |
| Body mass index, kg/m2 | |
| Median | 25.9 |
| Range | 17–34.2 |
| Procedures—no.(%) | |
| Ivor Lewis | 19 (95) |
| McKeown | 1 (5) |
| Duration of operation—mean, sd (min) | 449 (46) |
| Blood transfusion—no. (%) | 1 (5) |
| Tumor stage—no. (%) | |
| T1 | 0 (0) |
| T2 | 4 (20) |
| T3 | 15 (75) |
| Tumor location—no. (%) | |
| Mid esophagus | 2 (10) |
| Distal esophagus | 18 (90) |
| Cardiovascular disease—no. (%) | 7 (35) |
| Diabetes Mellitis 1—no. (%) | 0 (0) |
| Diabetes Mellitis 2—no. (%) | 2 (10) |
| COPD—no. (%) | 2 (10) |
| Hemodynamic Parameters (Mean, SD) | |
|---|---|
| MAP (mm Hg) | 71 ± 9 |
| HR (beats/min) | 85 ± 14 |
| SBP (mm Hg) | 106 ± 17 |
| DBP (mm Hg) | 65 ± 16 |
| Temperature nasopharyx (°C) | 36.2 ± 0.6 |
| CO (L/min) | 6.9 ± 2.3 |
| SV (mL) | 75.4 ± 18.5 |
| SVV (%) | 7.8 ± 2.6 |
| CI (L/min m2) | 3.1 ± 0.9 |
Publisher’s Note: MDPI stays neutral with regard to jurisdictional claims in published maps and institutional affiliations. |
© 2022 by the authors. Licensee MDPI, Basel, Switzerland. This article is an open access article distributed under the terms and conditions of the Creative Commons Attribution (CC BY) license (https://creativecommons.org/licenses/by/4.0/).
Share and Cite
Jansen, S.M.; de Bruin, D.M.; Wilk, L.S.; van Berge Henegouwen, M.I.; Strackee, S.D.; Gisbertz, S.S.; van Bavel, E.T.; van Leeuwen, T.G. Quantitative Fluorescence Imaging of Perfusion—An Algorithm to Predict Anastomotic Leakage. Life 2022, 12, 249. https://doi.org/10.3390/life12020249
Jansen SM, de Bruin DM, Wilk LS, van Berge Henegouwen MI, Strackee SD, Gisbertz SS, van Bavel ET, van Leeuwen TG. Quantitative Fluorescence Imaging of Perfusion—An Algorithm to Predict Anastomotic Leakage. Life. 2022; 12(2):249. https://doi.org/10.3390/life12020249
Chicago/Turabian StyleJansen, Sanne M., Daniel M. de Bruin, Leah S. Wilk, Mark I. van Berge Henegouwen, Simon D. Strackee, Suzanne S. Gisbertz, Ed T. van Bavel, and Ton G. van Leeuwen. 2022. "Quantitative Fluorescence Imaging of Perfusion—An Algorithm to Predict Anastomotic Leakage" Life 12, no. 2: 249. https://doi.org/10.3390/life12020249
APA StyleJansen, S. M., de Bruin, D. M., Wilk, L. S., van Berge Henegouwen, M. I., Strackee, S. D., Gisbertz, S. S., van Bavel, E. T., & van Leeuwen, T. G. (2022). Quantitative Fluorescence Imaging of Perfusion—An Algorithm to Predict Anastomotic Leakage. Life, 12(2), 249. https://doi.org/10.3390/life12020249