
Application of Mass Spectrometry Imaging in Uro-Oncology: Discovering Potential Biomarkers

Abstract
:1. Introduction
2. Genitourinary Malignancies
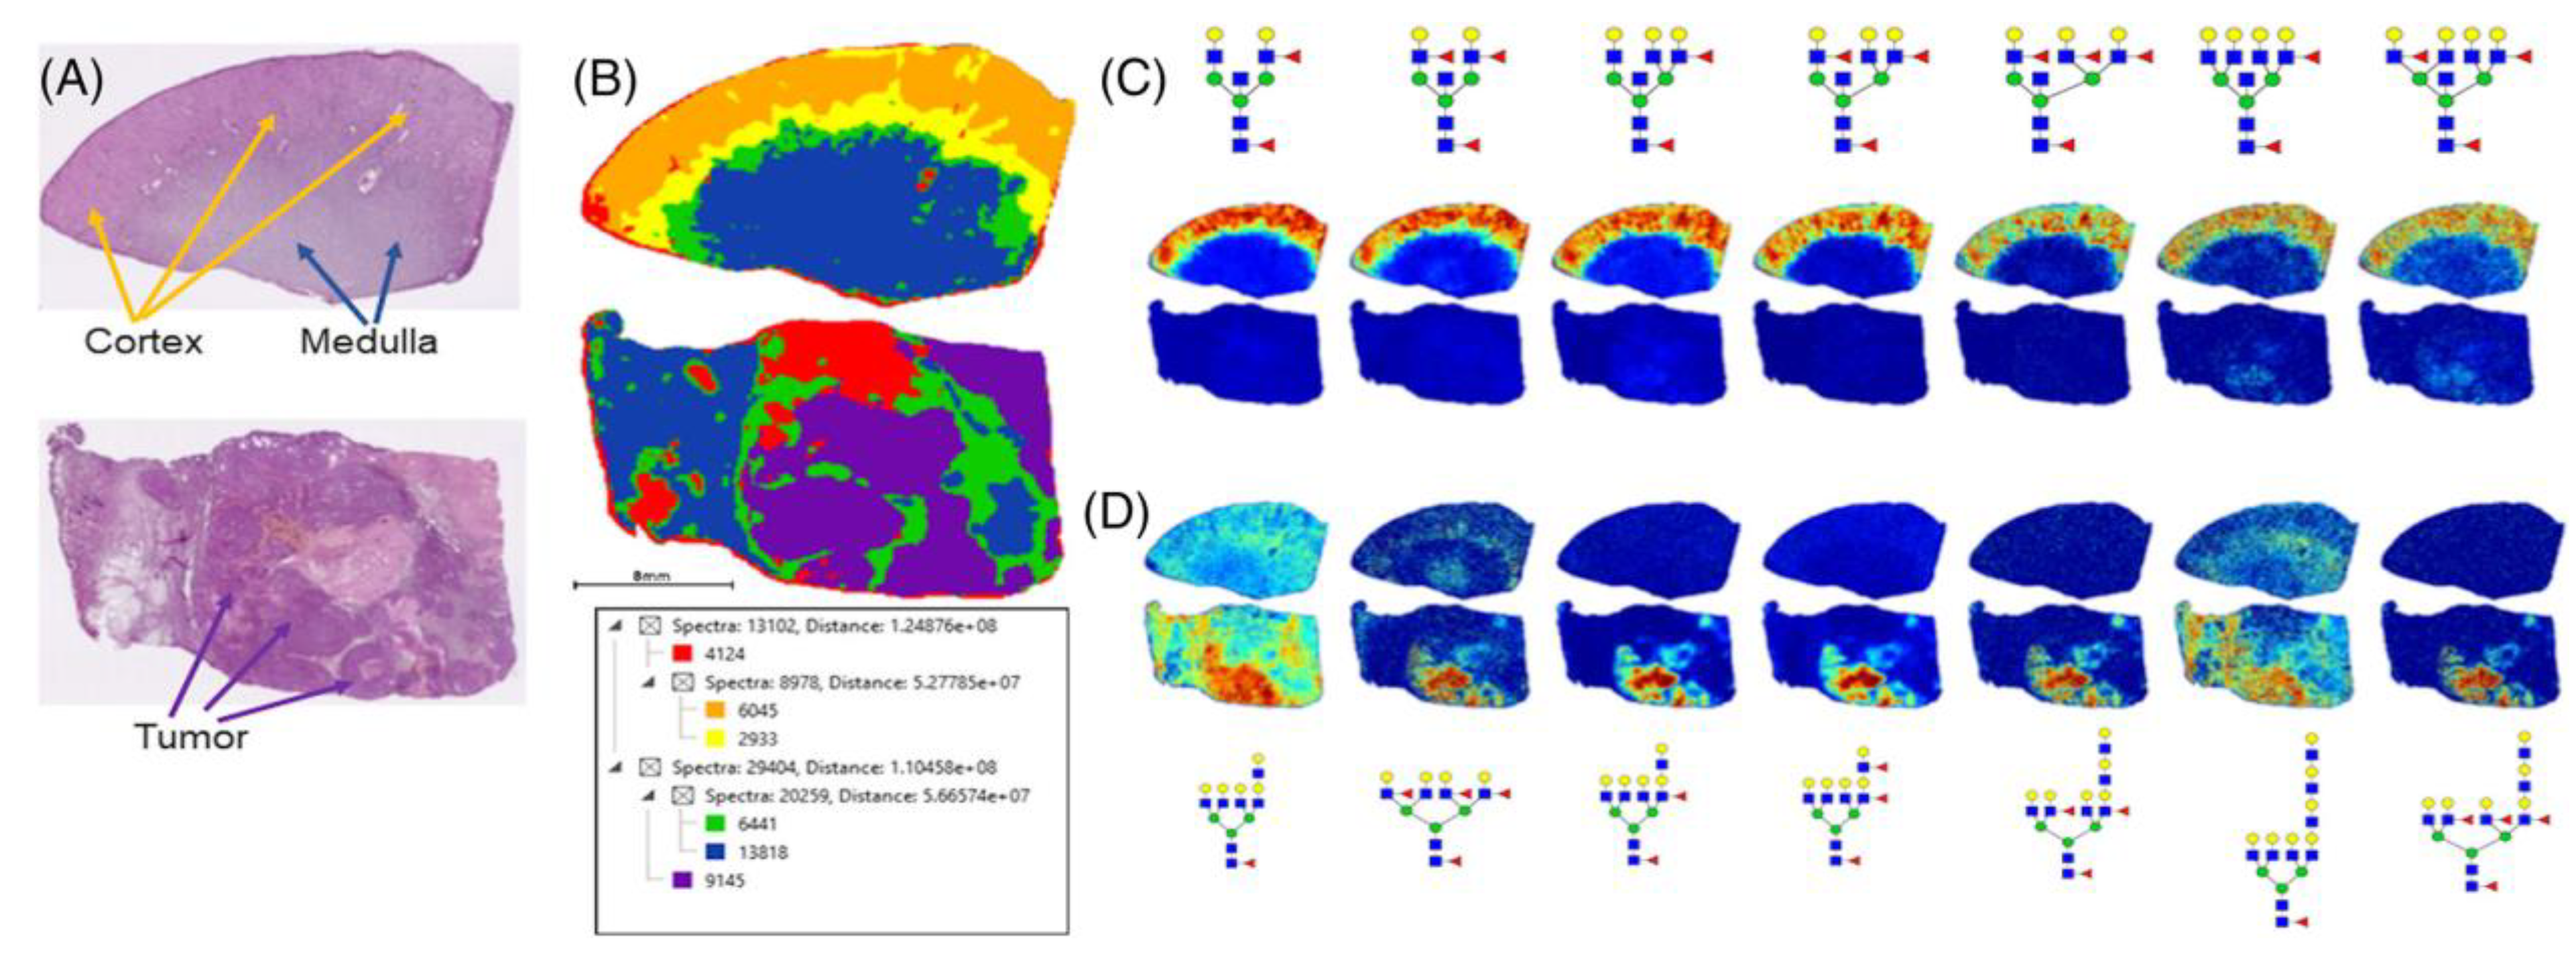
2.1. Kidney Tumors
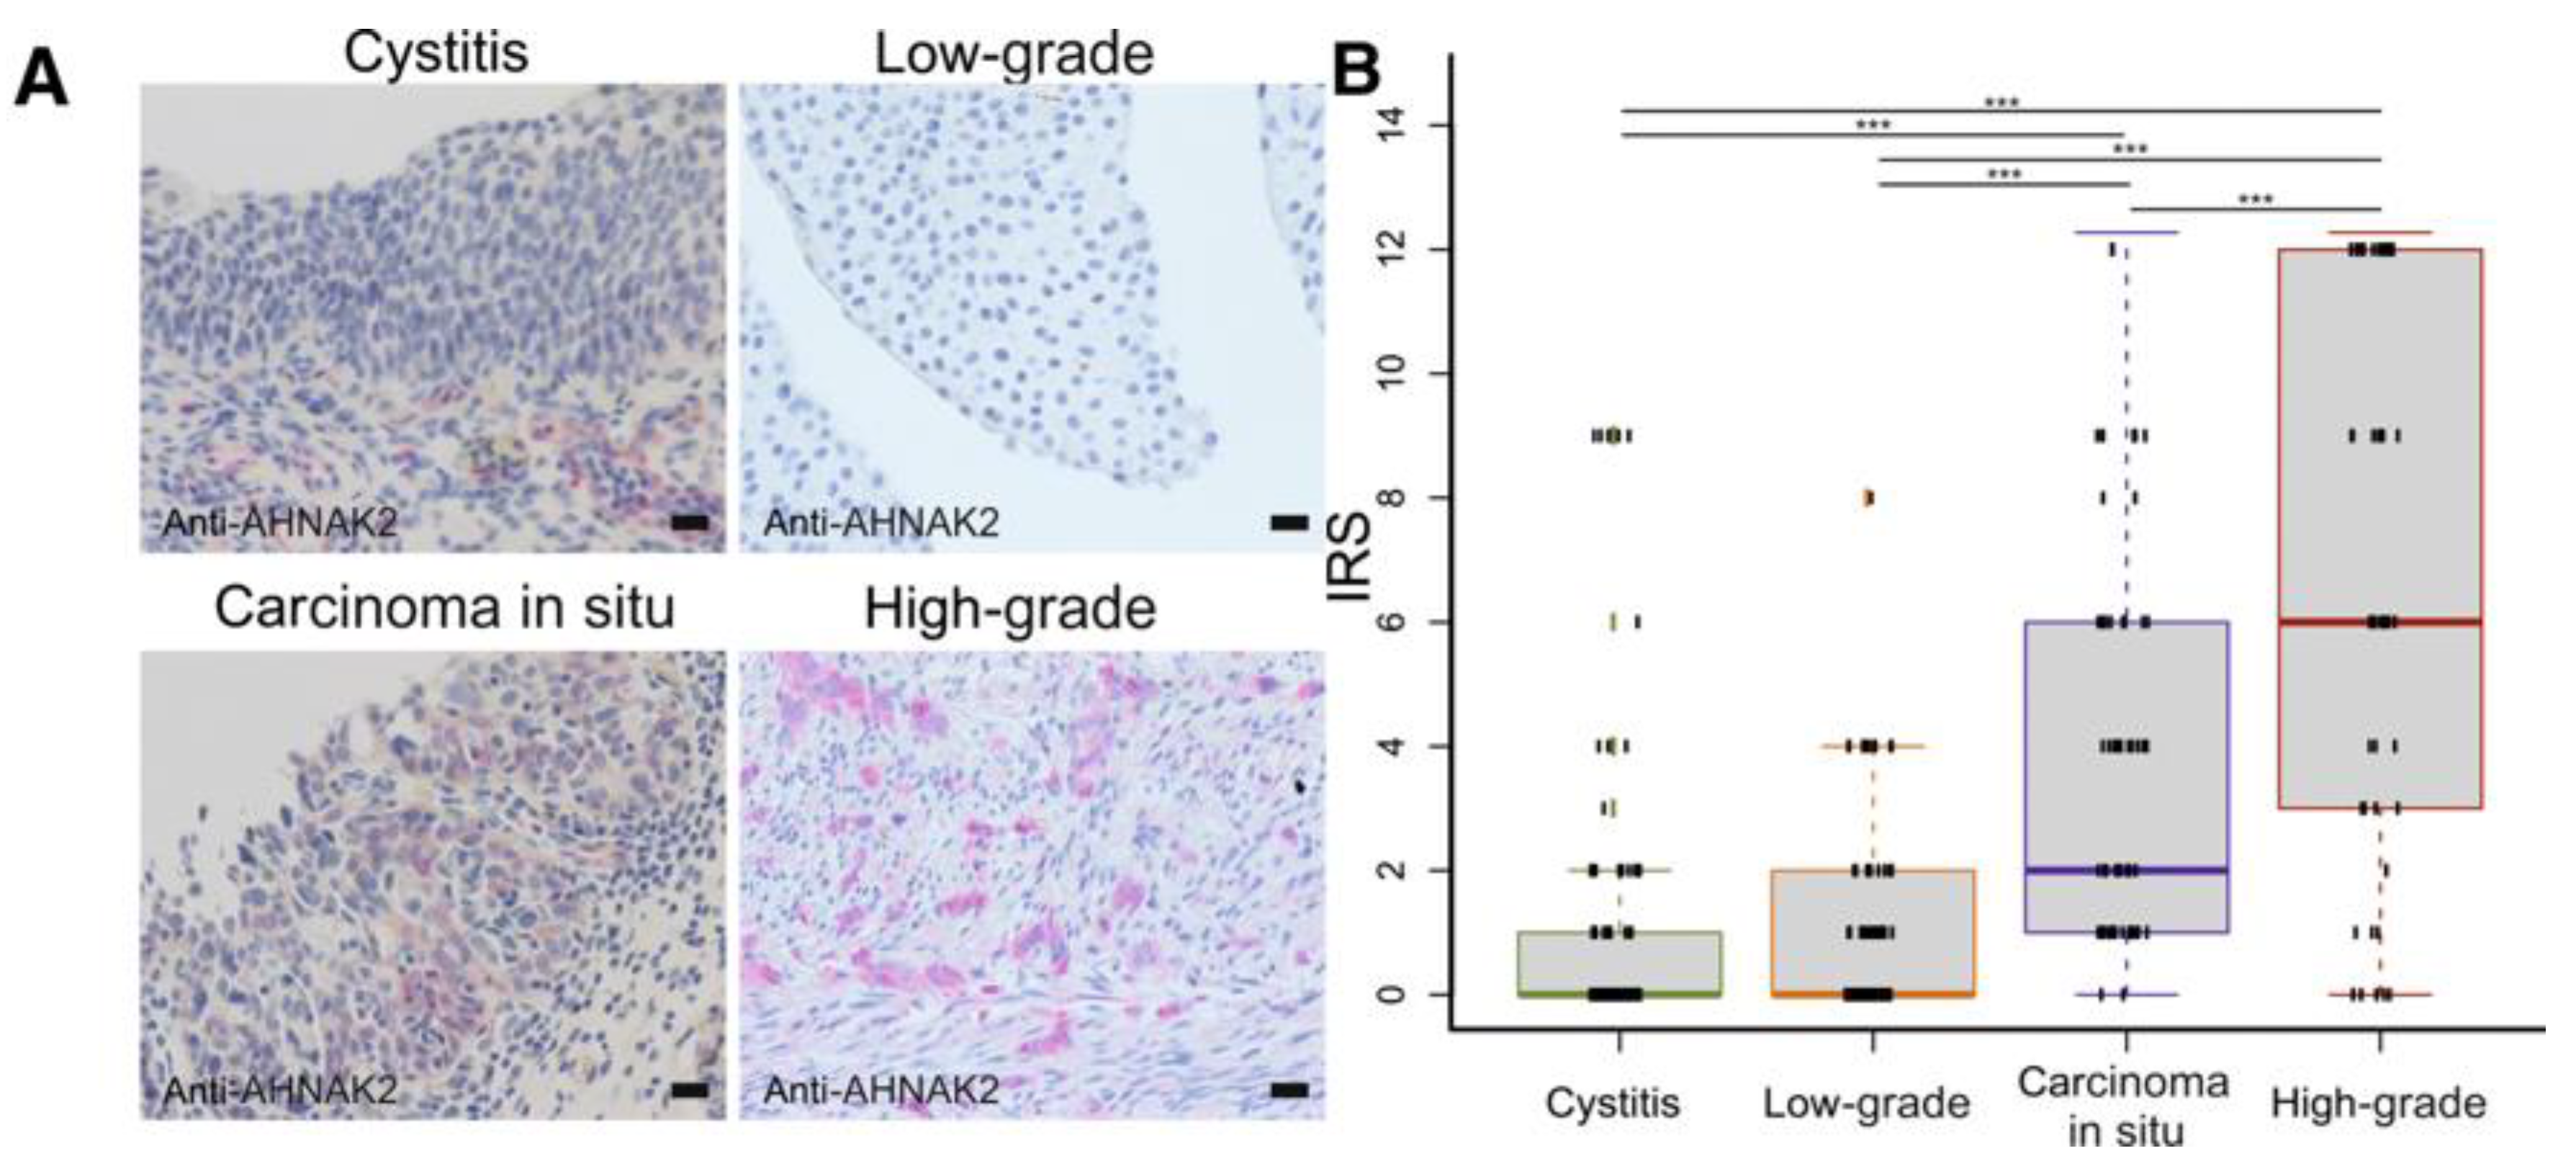
2.2. Bladder Tumors
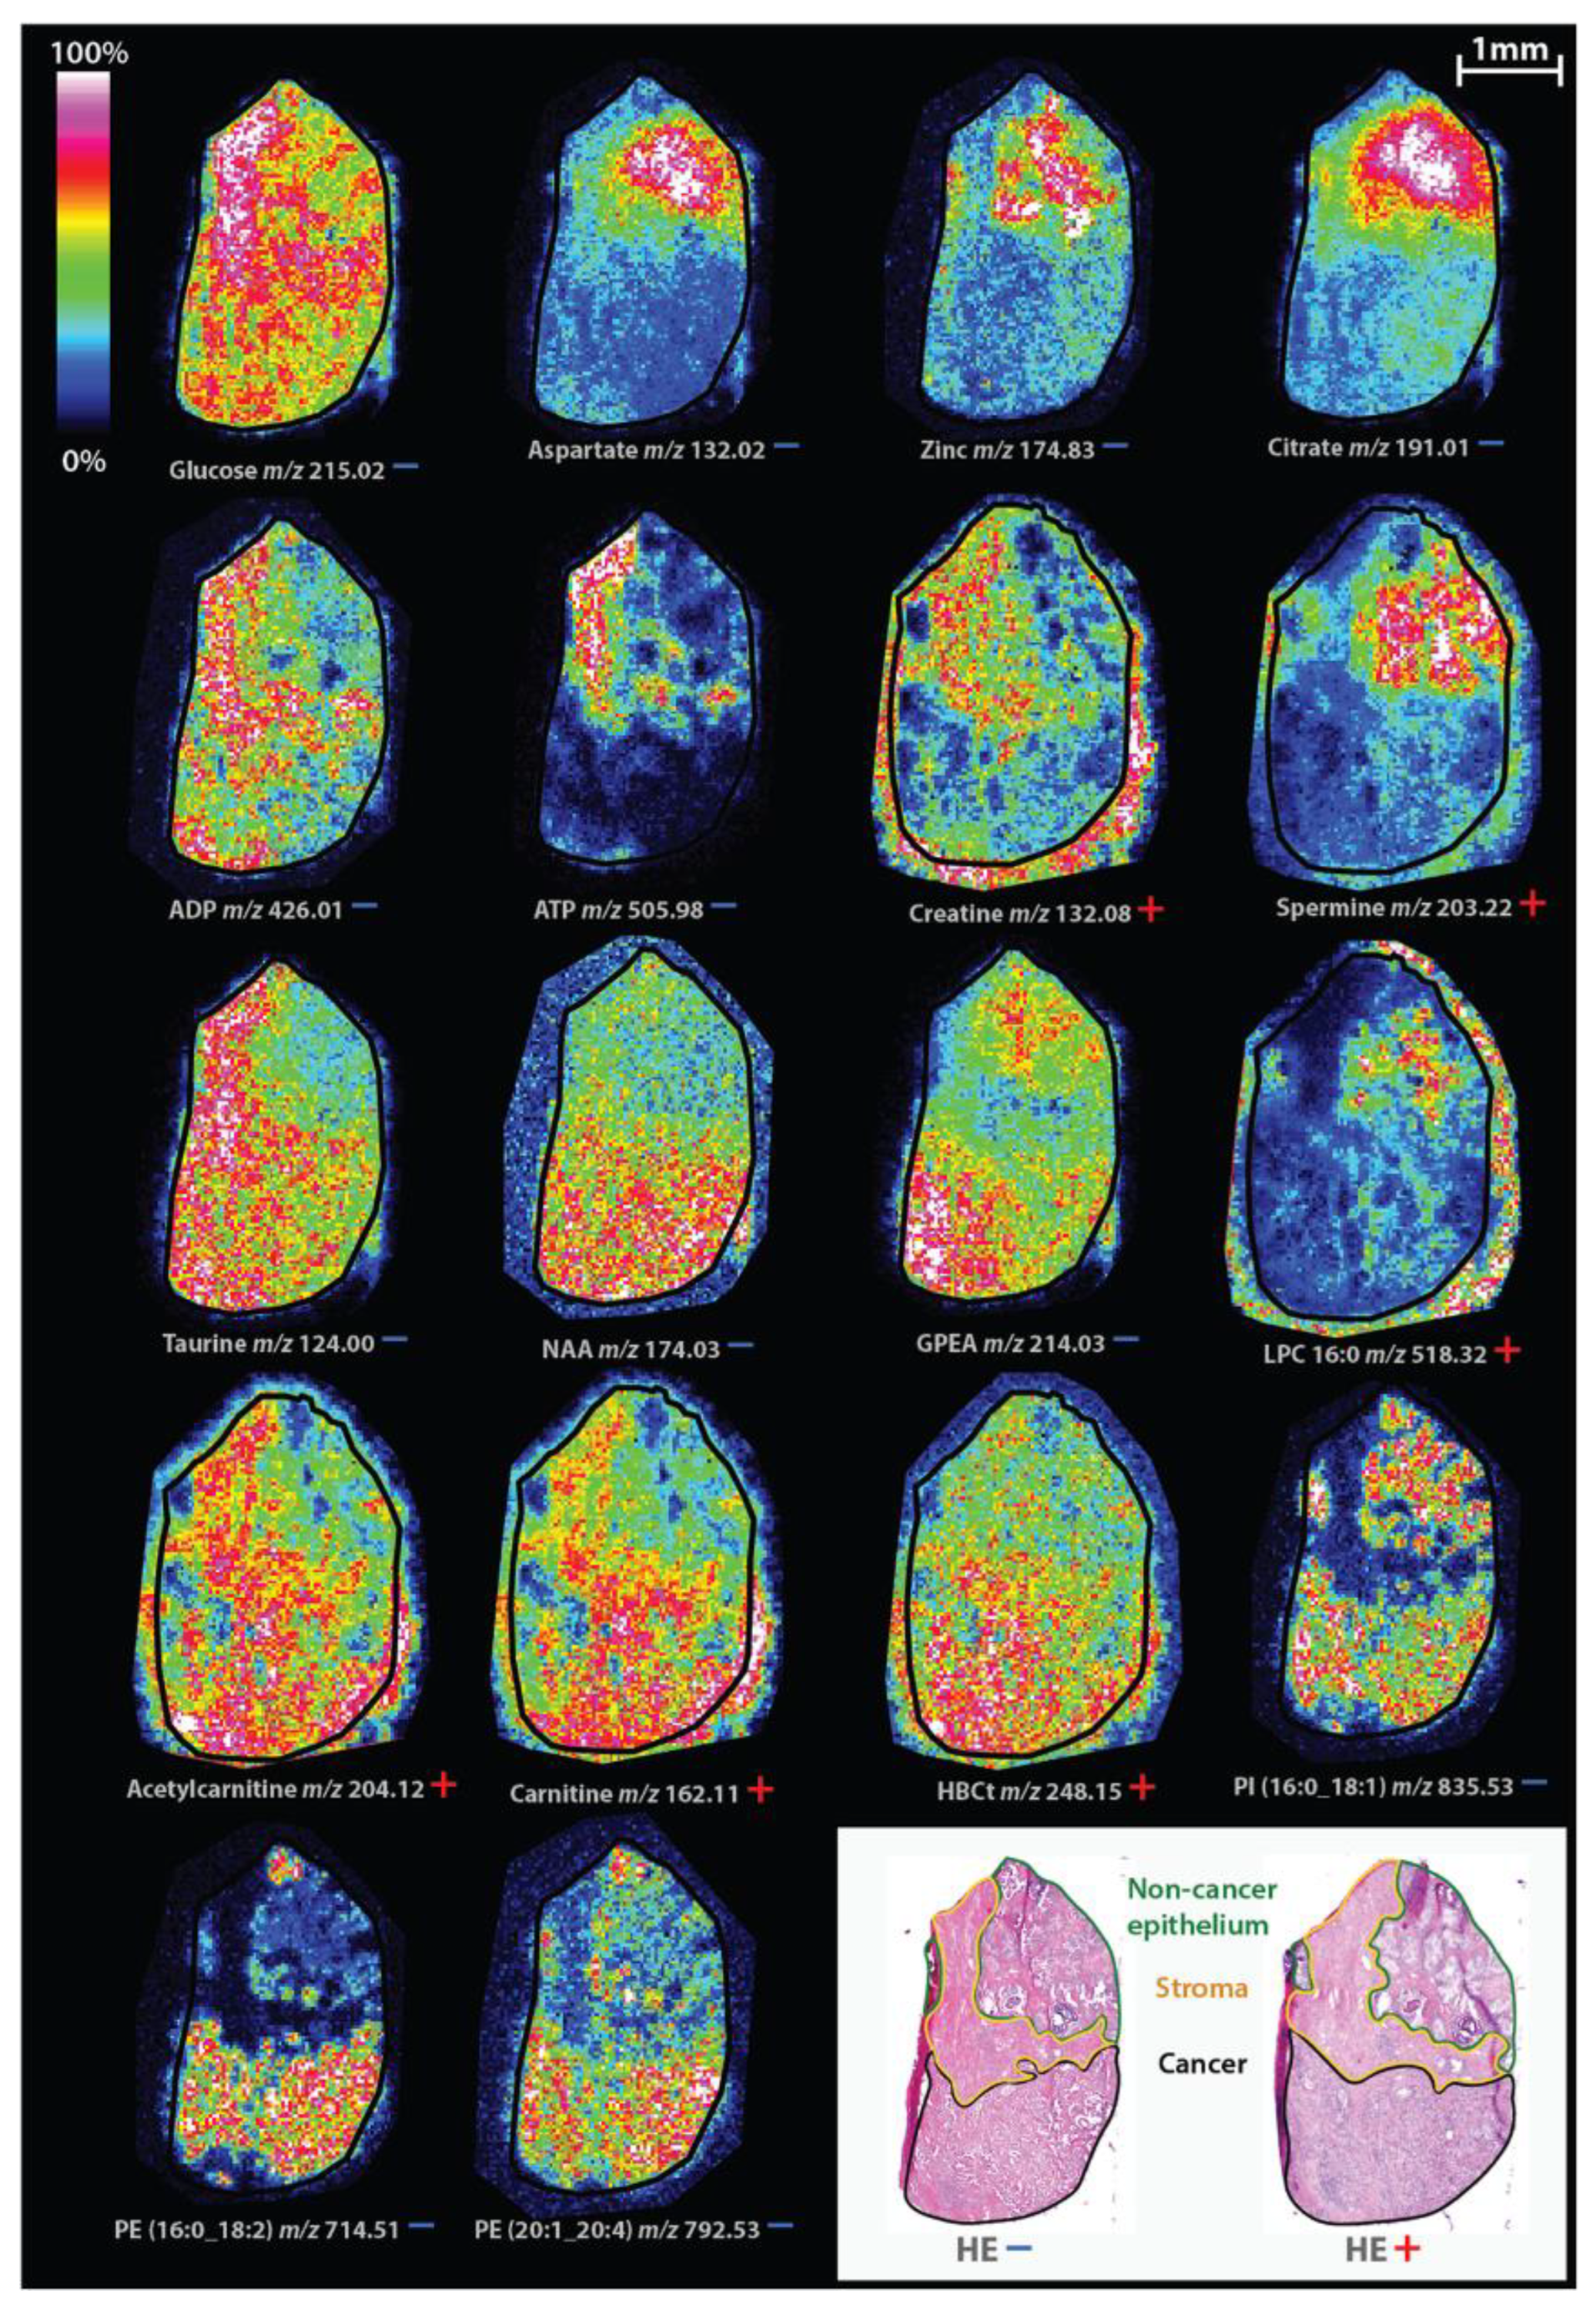
2.3. Prostate Tumors
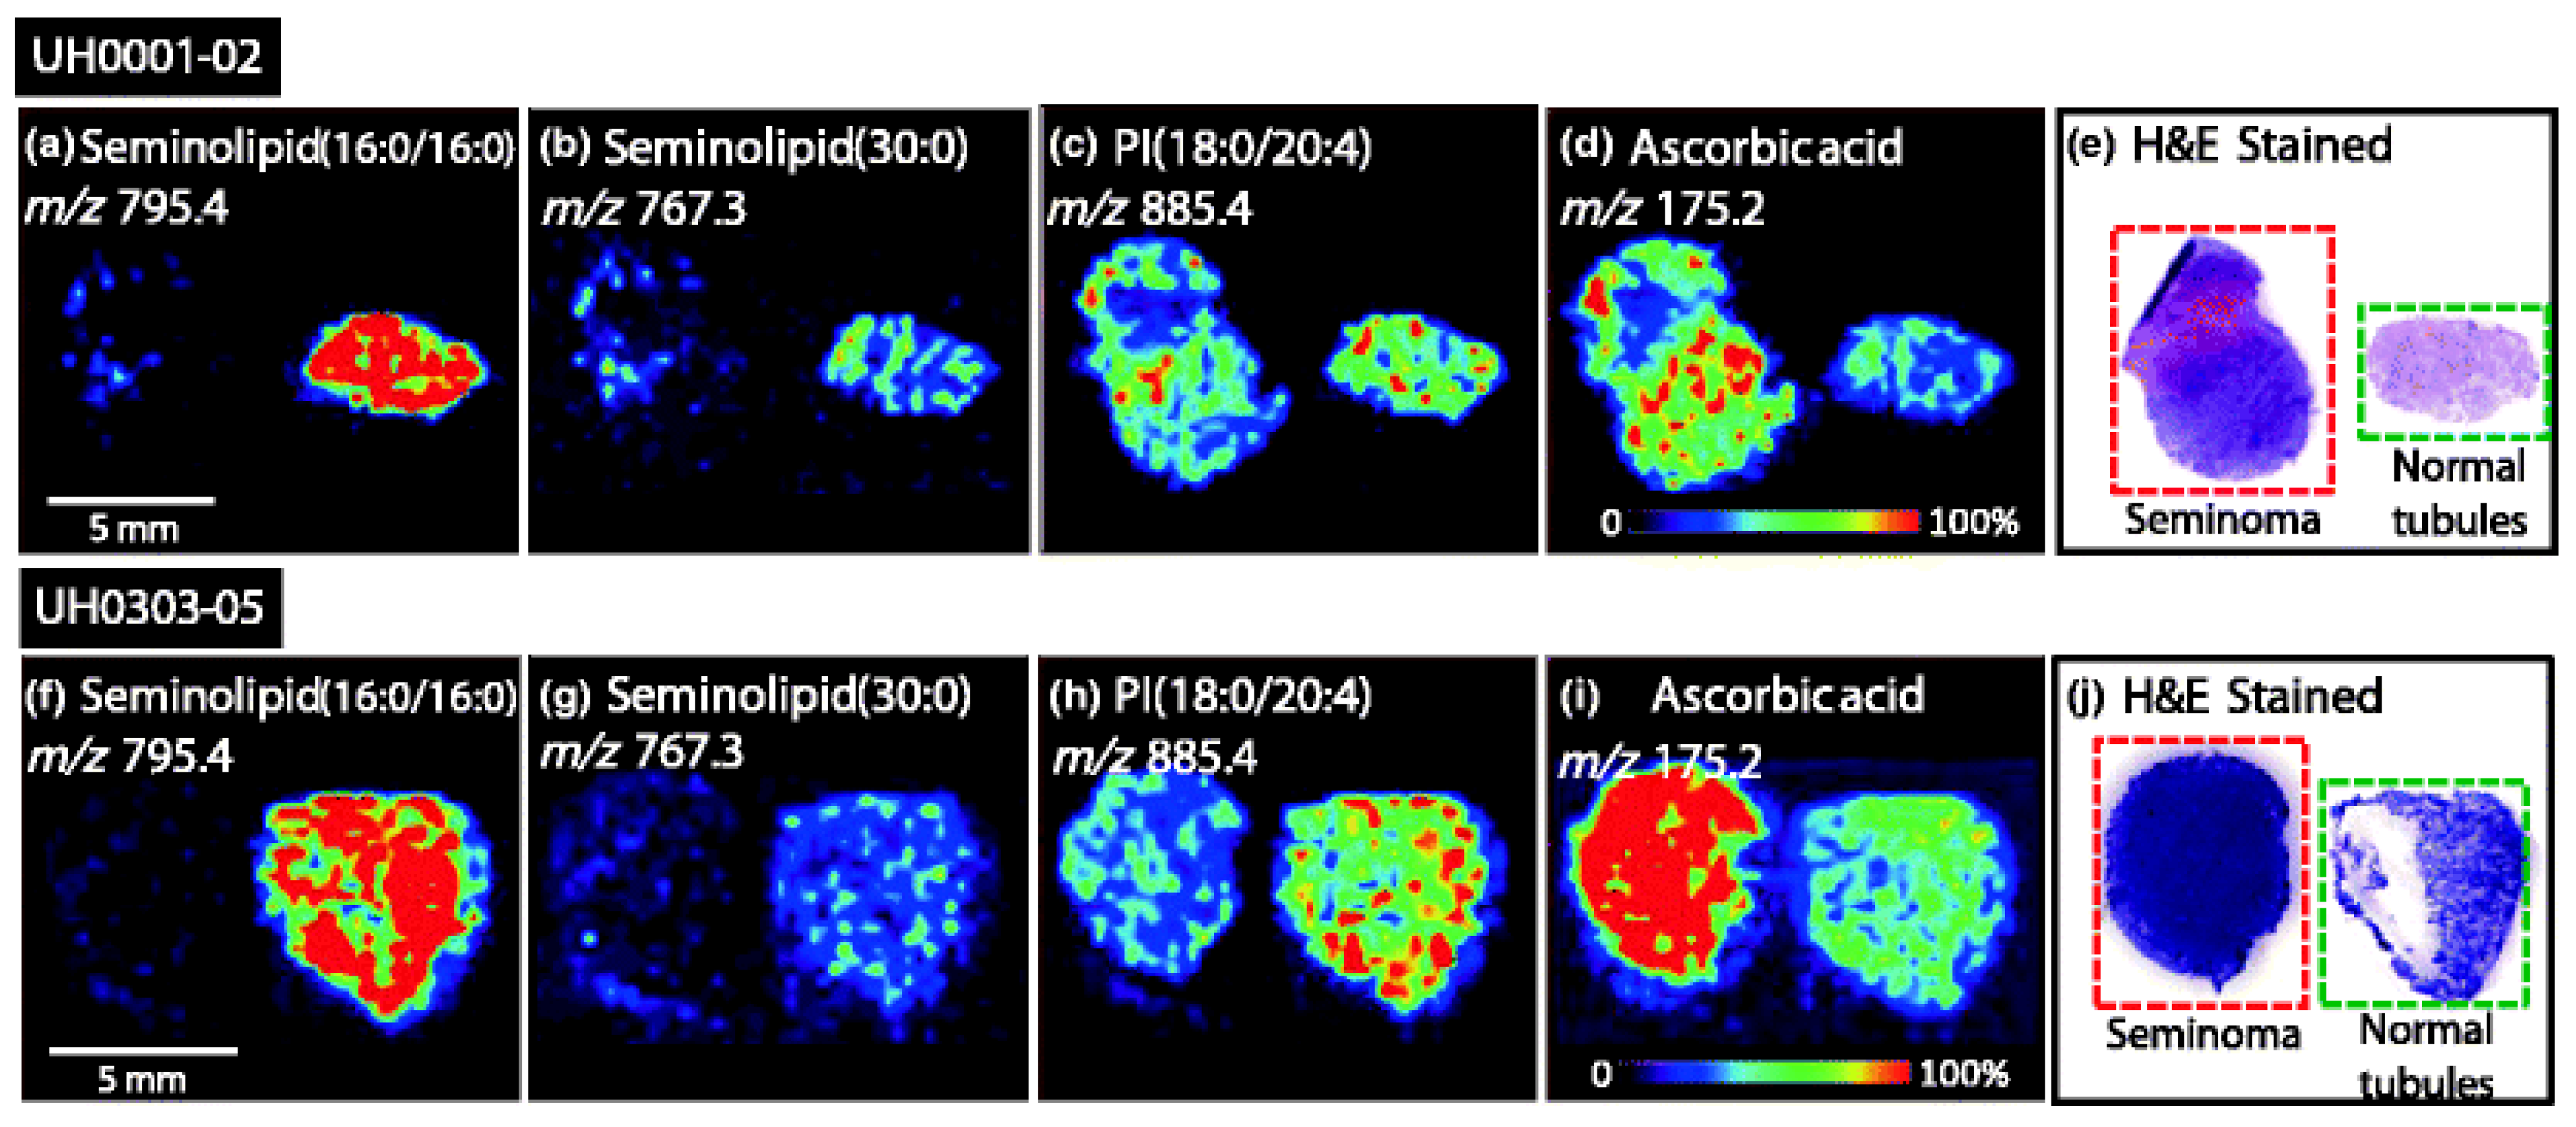
2.4. Testicular Tumors
3. Conclusions
Author Contributions
Funding
Conflicts of Interest
References
- Dy, G.W.; Gore, J.L.; Forouzanfar, M.H.; Naghavi, M.; Fitzmaurice, C. Global Burden of Urologic Cancers, 1990–2013. Eur. Urol. 2017, 71, 437–446. [Google Scholar] [CrossRef] [PubMed]
- Caprioli, R.M.; Farmer, T.B.; Gile, J. Molecular Imaging of Biological Samples: Localization of Peptides and Proteins Using MALDI-TOF MS. Anal. Chem. 1997, 69, 4751–4760. [Google Scholar] [CrossRef] [PubMed]
- Setou, M. Imaging Mass Spectrometry. Protocols for Mass Microscopy; Springer: New York, NY, USA, 2010; Available online: http://www.springer.com/life+sciences/book/978-4-431-09424-1 (accessed on 16 September 2021).
- Gross, J. (Ed.) Mass Spectrometry: A Textbook; Springer: Berlin/Heidelberg, Germany, 2011; Volume 49, pp. 49–1469. [Google Scholar] [CrossRef]
- Buchberger, A.R.; Delaney, K.; Johnson, J.; Jillian, J. Mass Spectrometry Imaging: A Review of Emerging Advancements and Future Insights. Anal. Chem. 2018, 90, 240–265. [Google Scholar] [CrossRef] [PubMed]
- Vékey, K.; Telekes, A.; Vertes, A. (Eds.) Medical Applications of Mass Spectrometry; Elsevier: Amsterdam, The Netherlands, 2008. [Google Scholar]
- Thomas, S.; Hao, L.; Ricke, W.; Li, L. Biomarker discovery in mass spectrometry-based urinary proteomics. Proteom.–Clin. Appl. 2016, 10, 358–370. [Google Scholar] [CrossRef] [PubMed]
- Oehr, P. Proteomics as a tool for detection of nuclear matrix proteins and new biomarkers for screening of early tumors stage. Anticancer Res. 2003, 23, 805–812. [Google Scholar]
- Oppenheimer, S.R.; Mi, D.; Sanders, M.E.; Caprioli, R.M. Molecular Analysis of Tumor Margins by MALDI Mass Spectrometry in Renal Carcinoma. J. Proteome Res. 2010, 9, 2182–2190. [Google Scholar] [CrossRef] [Green Version]
- Liu, S.; Lee, S.; Rashid, P.; Bangash, H.; Hamid, A.; Lau, J.; Cohen, R. Active surveillance is suitable for intermediate term follow-up of renal oncocytoma diagnosed by percutaneous core biopsy. Br. J. Urol. 2016, 118, 30–34. [Google Scholar] [CrossRef] [Green Version]
- Richard, P.O.; Jewett, M.A.; Bhatt, J.R.; Evans, A.J.; Timilsina, N.; Finelli, A. Active Surveillance for Renal Neoplasms with Oncocytic Features is Safe. J. Urol. 2015, 195, 581–587. [Google Scholar] [CrossRef]
- Miller, B.L.; Gettle, L.M.; Van Roo, J.R.; Ziemlewicz, T.J.; Best, S.L.; Wells, S.A.; Lubner, M.G.; Hinshaw, J.L.; Lee, F.T.; Nakada, S.Y.; et al. Comparative Analysis of Surgery, Thermal Ablation, and Active Surveillance for Renal Oncocytic Neoplasms. Urology 2018, 112, 92–97. [Google Scholar] [CrossRef]
- Zhang, J.; Li, S.Q.; Lin, J.Q.; Yu, W.; Eberlin, L.S. Mass Spectrometry Imaging Enables Discrimination of Renal Oncocytoma from Renal Cell Cancer Subtypes and Normal Kidney Tissues. Cancer Res. 2019, 80, 689–698. [Google Scholar] [CrossRef]
- Lu, H.-C.; Patterson, N.H.; Judd, A.M.; Reyzer, M.L.; Sehn, J.K. Imaging Mass Spectrometry Is an Accurate Tool in Differentiating Clear Cell Renal Cell Carcinoma and Chromophobe Renal Cell Carcinoma: A Proof-of-concept Study. J. Histochem. Cytochem. 2020, 68, 403–411. [Google Scholar] [CrossRef] [PubMed]
- Drake, R.R.; McDowell, C.; West, C.; David, F.; Powers, T.W.; Nowling, T.; Bruner, E.; Mehta, A.S.; Angel, P.M.; Marlow, L.A.; et al. Defining the human kidney N-glycome in normal and cancer tissues using MALDI imaging mass spectrometry. Biol. Mass Spectrom. 2019, 55, e4490. [Google Scholar] [CrossRef] [PubMed] [Green Version]
- van Rhijn, B.W.; van der Poel, H.G.; Van der Kwast, T. Urine Markers for Bladder Cancer Surveillance: A Systematic Review. Eur. Urol. 2005, 47, 736–748. [Google Scholar] [CrossRef] [PubMed]
- Beukers, W.; Van Der Keur, K.A.; Kandimalla, R.; Vergouwe, Y.; Steyerberg, E.W.; Boormans, J.L.; Jensen, J.B.; Lorente, J.A.; Real, F.X.; Segersten, U.; et al. FGFR3, TERT and OTX1 as a Urinary Biomarker Combination for Surveillance of Patients with Bladder Cancer in a Large Prospective Multicenter Study. J. Urol. 2017, 197, 1410–1418. [Google Scholar] [CrossRef] [PubMed]
- Steurer, S.; Singer, J.M.; Rink, M.; Chun, F.; Dahlem, R.; Simon, R.; Burandt, E.; Stahl, P.; Terracciano, L.; Schlomm, T.; et al. MALDI imaging–based identification of prognostically relevant signals in bladder cancer using large-scale tissue microarrays. Urol. Oncol. 2014, 32, 1225–1233. [Google Scholar] [CrossRef]
- Lamm, D.; Herr, H.; Jakse, G.; Kuroda, M.; Mostofi, F.; Okajima, E.; Sakamoto, A.; Sesterhenn, I.; da Silva, F.C. Updated concepts and treatment of carcinoma in situ. Urol. Oncol. 1998, 4, 130–138. [Google Scholar] [CrossRef]
- Witzke, K.E.; Großerueschkamp, F.; Jütte, H.; Horn, M.; Roghmann, F.; von Landenberg, N.; Bracht, T.; Kallenbach-Thieltges, A.; Käfferlein, H.; Brüning, T.; et al. Integrated Fourier Transform Infrared Imaging and Proteomics for Identification of a Candidate Histochemical Biomarker in Bladder Cancer. Am. J. Pathol. 2019, 189, 619–631. [Google Scholar] [CrossRef] [Green Version]
- Randall, E.C.; Zadra, G.; Chetta, P.; Lopez, B.G.C.; Syamala, S.; Basu, S.S.; Agar, J.N.; Loda, M.; Tempany, C.M.; Fennessy, F.M.; et al. Molecular Characterization of Prostate Cancer with Associated Gleason Score Using Mass Spectrometry Imaging. Mol. Cancer Res. 2019, 17, 1155–1165. [Google Scholar] [CrossRef]
- Curtius, K.; Wright, N.A.; Graham, T.A. An evolutionary perspective on field cancerization. Nat. Rev. Cancer 2018, 18, 19–32. [Google Scholar] [CrossRef]
- Nonn, L.; Ananthanarayanan, V.; Gann, P.H. Evidence for field cancerization of the prostate. Prostate 2009, 69, 1470–1479. [Google Scholar] [CrossRef] [Green Version]
- Andersen, M.K.; Høiem, T.S.; Claes, B.S.R.; Balluff, B.; Martin-Lorenzo, M.; Richardsen, E.; Krossa, S.; Bertilsson, H.; Heeren, R.M.A.; Rye, M.B.; et al. Spatial differentiation of metabolism in prostate cancer tissue by MALDI-TOF MSI. Cancer Metab. 2021, 9, 1–13. [Google Scholar] [CrossRef] [PubMed]
- Wu, X.; Daniels, G.; Lee, P.; E Monaco, M. Lipid metabolism in prostate cancer. Am. J. Clin. Exp. Urol. 2014, 2, 111–120. [Google Scholar] [PubMed]
- Liu, Y. Fatty acid oxidation is a dominant bioenergetic pathway in prostate cancer. Prostate Cancer Prostatic Dis. 2006, 9, 230–234. [Google Scholar] [CrossRef] [PubMed] [Green Version]
- Guth, A.; Monk, E.; Agarwal, R.; Bergman, B.C.; Zemski-Berry, K.A.; Minic, A.; Jordan, K.; Schlaepfer, I.R. Targeting Fat Oxidation in Mouse Prostate Cancer Decreases Tumor Growth and Stimulates Anti-Cancer Immunity. Int. J. Mol. Sci. 2020, 21, 9660. [Google Scholar] [CrossRef]
- Flaig, T.W.; Salzmann-Sullivan, M.; Su, L.-J.; Zhang, Z.; Joshi, M.; Gijón, M.A.; Kim, J.; Arcaroli, J.J.; Van Bokhoven, A.; Lucia, M.S.; et al. Lipid catabolism inhibition sensitizes prostate cancer cells to antiandrogen blockade. Oncotarget 2017, 8, 56051–56065. [Google Scholar] [CrossRef] [Green Version]
- Schlaepfer, I.R.; Glodé, L.M.; Hitz, C.A.; Pac, C.T.; Boyle, K.E.; Maroni, P.; Deep, G.; Agarwal, R.; Lucia, S.M.; Cramer, S.D.; et al. Inhibition of Lipid Oxidation Increases Glucose Metabolism and Enhances 2-Deoxy-2-[(18)F]Fluoro-D-Glucose Uptake in Prostate Cancer Mouse Xenografts. Mol. Imaging Biol. 2015, 17, 529–538. [Google Scholar] [CrossRef] [Green Version]
- Goto, T.; Terada, N.; Inoue, T.; Kobayashi, T.; Nakayama, K.; Okada, Y.; Yoshikawa, T.; Miyazaki, Y.; Uegaki, M.; Utsunomiya, N.; et al. Decreased expression of lysophosphatidylcholine (16:0/OH) in high resolution imaging mass spectrometry independently predicts biochemical recurrence after surgical treatment for prostate cancer. Prostate 2015, 75, 1821–1830. [Google Scholar] [CrossRef] [Green Version]
- Baci, D.; Bruno, A.; Cascini, C.; Gallazzi, M.; Mortara, L.; Sessa, F.; Pelosi, G.; Albini, A.; Noonan, D.M. Acetyl-L-Carnitine downregulates invasion (CXCR4/CXCL12, MMP-9) and angiogenesis (VEGF, CXCL8) pathways in prostate cancer cells: Rationale for prevention and interception strategies. J. Exp. Clin. Cancer Res. 2019, 38, 464. [Google Scholar] [CrossRef]
- Hayes-Lattin, B.; Nichols, C.R. Testicular Cancer: A Prototypic Tumor of Young Adults. Semin. Oncol. 2009, 36, 432–438. [Google Scholar] [CrossRef] [Green Version]
- Ueno, K.; Ishizuka, I.; Yamakawa, T. Glycolipid composition of human testis at different ages and the stereochemical configuration of seminolipid. Biochim. Biophys. Acta 1977, 487, 61–73. [Google Scholar]
- Ishizuka, I.; Yamakawa, T. Absence of Seminolipid in Seminoma Tissue with Concomitant Increase of Sphingoglycolipids. J. Biochem. 1974, 76, 221–223. [Google Scholar] [CrossRef] [PubMed]
- Masterson, T.A.; Dill, A.L.; Eberlin, L.S.; Mattarozzi, M.; Cheng, L.; Beck, S.D.W.; Bianchi, F.; Cooks, R.G. Distinctive Glycerophospholipid Profiles of Human Seminoma and Adjacent Normal Tissues by Desorption Electrospray Ionization Imaging Mass Spectrometry. J. Am. Soc. Mass Spectrom. 2011, 22, 1326–1333. [Google Scholar] [CrossRef] [PubMed] [Green Version]
- Nagy, B.; Mucsi, I.; Molnar, J.; Varga, A.; Thurzo, L. Chemosensitizing effect of vitamin C in combination with 5-fluorouracil in vitro. In Vivo 2003, 17, 289–292. [Google Scholar]
- Prasad, K.; Cole, W.; Kumar, B. Pros and cons of antioxidant use during radiation therapy. Cancer Treat. Rev. 2002, 28, 79–91. [Google Scholar] [CrossRef] [PubMed] [Green Version]
- Nason, G.; Aditya, I.; Leao, R.; Anson-Cartwright, L.; Jewett, M.; O’Malley, M.; Sweet, J.; Hamilton, R. Partial orchiectomy: The Princess Margaret cancer centre experience. Urol. Oncol. 2020, 38, 605.e19–605.e24. [Google Scholar] [CrossRef]
- Paffenholz, P.; Pfister, D.; Heidenreich, A. Testis-preserving strategies in testicular germ cell tumors and germ cell neoplasia in situ. Transl. Androl. Urol. 2020, 9, S24–S30. [Google Scholar] [CrossRef]

| Type of Malignancy | Molecule | Direction of Alteration, Potential Application | Reference |
|---|---|---|---|
| Kidney | Gluthatione | Increased level in chRCC, differentiating from RO | Zhang et al., 2020 |
| FUT11 | Increased level | Drake et al., 2020 | |
| Bladder | Collagen alpha-1 | Indicating recurrence and transformation to invasive malignancy | Steurer et al., 2014 |
| Two particular subforms of keratin (m/z = 850.4, m/z = 1104.4) | Assessing prognosis (accompanied with better outcome) | ||
| AHNAK2 | Indicating high grade disease, particularly CIS | Witzke et al., 2019 | |
| Prostate | Citrate, zinc, polyamine spermine | Decreased levels | Andersen et al., 2021 |
| Choline, glycerophospho-etanolamine | Increased levels | ||
| Carnitine, acetylcarnitine, hydroxybutyrylcarnitine | Increased levels | ||
| LPC (16:0) | Decreased level, indicating biochemical recurrence after radical prostatectomy | Andersen et al., 2021, Goto et. al., 2015 | |
| Testis | Seminolipids | Decreased levels | Masterson et al., 2011 |
| Absorbic acid | Increased level |
Publisher’s Note: MDPI stays neutral with regard to jurisdictional claims in published maps and institutional affiliations. |
© 2022 by the authors. Licensee MDPI, Basel, Switzerland. This article is an open access article distributed under the terms and conditions of the Creative Commons Attribution (CC BY) license (https://creativecommons.org/licenses/by/4.0/).
Share and Cite
Czétány, P.; Gitta, S.; Balló, A.; Sulc, A.; Máté, G.; Szántó, Á.; Márk, L. Application of Mass Spectrometry Imaging in Uro-Oncology: Discovering Potential Biomarkers. Life 2022, 12, 366. https://doi.org/10.3390/life12030366
Czétány P, Gitta S, Balló A, Sulc A, Máté G, Szántó Á, Márk L. Application of Mass Spectrometry Imaging in Uro-Oncology: Discovering Potential Biomarkers. Life. 2022; 12(3):366. https://doi.org/10.3390/life12030366
Chicago/Turabian StyleCzétány, Péter, Stefánia Gitta, András Balló, Alexandra Sulc, Gábor Máté, Árpád Szántó, and László Márk. 2022. "Application of Mass Spectrometry Imaging in Uro-Oncology: Discovering Potential Biomarkers" Life 12, no. 3: 366. https://doi.org/10.3390/life12030366