Article

B-Cell Activating Factor Increases Related to Adiposity, Insulin Resistance, and Endothelial Dysfunction in Overweight and Obese Subjects

by
Diana Carolina Villalpando Sánchez
1,2,3,
Sergio Gutiérrez Castellanos
3,4,
Martha Eva Viveros Sandoval
5 and
Anel Gómez García
3,*
1
Departamento de Inmunología, Escuela Nacional de Ciencias Biológicas, Instituto Politécnico Nacional, México City 11340, Mexico
2
Posgrado en Inmunología, Escuela Nacional de Ciencias Biológicas, Instituto Politécnico Nacional, México City 11340, Mexico
3
Centro de Investigación Biomédica de Michoacán, División de Investigación Clínica, Instituto Mexicano del Seguro Social, Morelia 58341, Mexico
4
Laboratorio de Citopatología Molecular, División de Estudios de Posgrado, Facultad de Ciencias Médicas y Biológicas “Dr. Ignacio Chávez”, Universidad Michoacana de San Nicolás de Hidalgo, Morelia 58020, Mexico
5
Laboratorio de Hemostasia y Biología Vascular, División de Estudios de Posgrado, Facultad de Ciencias Médicas y Biológicas “Dr. Ignacio Chávez”, Universidad Michoacana de San Nicolás de Hidalgo, Morelia 58020, Mexico
*
Author to whom correspondence should be addressed.
Life 2022, 12(5), 634; https://doi.org/10.3390/life12050634
Submission received: 1 April 2022 / Revised: 12 April 2022 / Accepted: 21 April 2022 / Published: 25 April 2022

Abstract

:
Obesity (OB) is a major healthcare problem that results from long-term energy imbalance. Adipokines and pro-inflammatory cytokines facilitate adipose tissue (AT) remodeling to safely store excess nutrients. B-cell activating factor (BAFF) is a newly described adipokine whose role in enhancing adipogenesis has been reported. The present study aimed to evaluate serum BAFF association with adiposity distribution, serum adipokines, pro-inflammatory cytokines, and metabolic and endothelial dysfunction markers. The study included 124 young Mexican adults with no diagnosed comorbidities, divided according to their BMI. Anthropometric measurements, blood counts, and serum molecules (i.e., glucose, lipid profile, insulin, leptin, pro- and anti-inflammatory cytokines, von Willebrand factor (vWF), and BAFF) were assessed. The analysis showed positive correlation between BAFF and increased fat mass in all anthropometric measurements (p < 0.0001). BAFF augmentation was related to systemic inflammatory environment (p < 0.05), and linked with insulin resistance status (p < 0.05). BAFF increment was also correlated with early endothelial damage markers such as vWF (p < 0.0001). Linear regression analysis showed a role for BAFF in predicting serum vWF concentrations (p < 0.01). In conclusion, our data show that BAFF is an adipokine dynamically related to OB progression, insulin resistance status, and systemic inflammatory environment, and is a predictor of soluble vWF augmentation, in young overweight and obese Mexican subjects.

1. Introduction

Obesity (OB) is considered “the XXI century epidemic”, as it has exponentially spread worldwide, rising over the last 40 years to affect nearly 700 million people, with an alarming increasing tendency among children and adolescents [1]. Not being exclusive to developed countries, ethnic groups, or socioeconomic strata, OB is becoming a major public health problem in Mexico, since 74% of Mexican adults are now OB or overweight (OW), while national surveys show an exponential growth, with low odds of reaching a plateau stage [2].
OB is a complex multifactorial disease derived from long-term energy imbalance between consumed and expended calories, resulting in increased fat deposits in white adipose tissue (WAT), which are detrimental to health [3]. During OB progression, WAT undergoes a dynamic remodeling process that allows safe storage of excess nutrients from high caloric intake [4]; this metabolic organ is distributed throughout the body in two major depots: subcutaneous WAT (SCAT), and visceral WAT (VAT) [5]. Though SCAT and VAT differ in their main metabolic characteristics, both are abundantly infiltrated with resident immune cells [6] that secrete pro-inflammatory cytokines such as TNF-α and IL-6, which actively promote adipocyte differentiation [7]. However, when maintained for long time, chronic low-grade inflammation has been described as one of the principal links between OB and its pathophysiological sequelae, such as insulin resistance (IR) [8], metabolic syndrome (MS) [9], endothelial dysfunction (ED) [10], type 2 diabetes mellitus (T2DM), and cardiovascular disease (CVD) [11].
Furthermore, WAT functions as an endocrine organ per se, expressing cytokines, hormones (e.g., leptin, adiponectin, resistin), and peptides termed “adipokines”, which modulate peripheral appetitive signals, as well as tissue metabolic activities [12]. B-cell activating factor (BAFF) is a newly described adipokine whose expression in mature human [13,14] and murine [15] adipocytes has been reported, as well as its role enhancing adipogenesis in vitro [16].
BAFF (also known as BLYS, TALL-1, THANK, TNFSF20, or CD257) is a cytokine member of the TNF ligand superfamily coded in the gene TNFSF13B, whose expression had traditionally been described in immune cells such as monocytes, macrophages, and dendritic cells, as well as T cells [17]. BAFF is mainly recognized by its receptor (BAFF-R), and to a lesser extent by TACI (transmembrane activator, calcium modulator, and cyclophilin ligand interactor) and BCMA (B-cell maturation antigen) receptors. BAFF-R is expressed in B cells, and activates downstream pathways that regulate cell survival and proliferation [18,19].
Thus, serum BAFF increase has been associated with autoimmune diseases in which polyclonal hypergammaglobulinemia occurs as part of the disease pathophysiology, such as systemic lupus erythematosus (SLE), Sjögren’s syndrome (SS), and rheumatoid arthritis [20]. Studies carried out in Norwegian [21] and Mexican [22] subjects with SS, as well as cohorts of Australian individuals with SLE [23], reported elevated serum BAFF concentrations. Moreover, BAFF’s role in the pathophysiology of OB, as well as its metabolic sequelae, has begun to be described. Bienertova et al. [24] reported high diet-related serum BAFF in Czech Caucasian individuals, as well as its relationship with body fat and abdominal OB in women, whereas high serum BAFF was also found to be an independent risk factor for non-alcoholic steatohepatitis (NASH) developing in OW and OB Japanese subjects [25].
Hence, serum BAFF has been related to body fat and OB-related metabolic alterations. However, studies that demonstrate BAFF’s relationship with adiposity distribution, its dynamics during OB progression, and its relationship with serum adipokines, pro-inflammatory cytokines, and metabolic and endothelial dysfunction markers, are currently lacking. Therefore, the aim of this study was to assess these features in young OW and OB Mexican adults without diagnosed comorbidities.

2. Materials and Methods

2.1. Study Group

A comparative cross-sectional study was carried out. This investigation was approved by the Health Research and Ethics Committee of the Mexican Social Security Institute, with the registration number R-2017-1602-7. Beneficiaries of Family Medicine Unit No. 80 of the Mexican Institute of Social Security in Michoacán, Mexico, were included. Participants were clustered in three groups based on their BMI measurements: obese (30–44.9 kg/m2), overweight (25–29.9 kg/m2), and normal weight (18.5–24.9 kg/m2) [26] (see study flowchart in Figure 1).
Meanwhile, sample size was calculated by a difference in proportions equation, considering an alpha significance level of 95% [27]. Participants between 18 and 55 years old, who gave their written consent and denied having been diagnosed with autoimmune diseases, immunodeficiencies, cancer, and other comorbidities (e.g., AHT, T2DM, CKD), who were not chronic consumers of alcohol or tobacco, and had not undergone invasive surgical procedures, had not suffered acute infectious or inflammatory processes (for at least a month prior to recruitment), and were not consuming antibiotic, anti-inflammatory, immunosuppressive, or immunomodulatory drugs (for at least two weeks prior to blood sampling), were included in the present study.

2.2. Anthropometric Measurements

Participants’ weight, height, and waist and hip circumferences were measured, as well as their percentages of body fat and lean mass, which were assessed via bioelectrical impedance analysis (BIA) (BC-558 Tanita, Arlington Heights, Illinois). Blood pressure was determined with a calibrated mercury baumanometer (W. A. Baum, Copiague, NY, USA).

2.3. Hematic and Biochemical Analyses; Leucoglycemic Index Calculation

Peripheral vein puncture was performed after 12 h of fasting to examine serum molecules. Serum glycemia and lipid profile (total cholesterol, HDL-c, LDL-c, VLDL-c, triglycerides) were quantified by enzymatic–colorimetric techniques (C-4000 Architect, Abbott, Chicago, IL, USA). Complete blood counts were performed using an automated hematology analyzer (XN-1000 Sysmex, Wakinohama, Japan). Leucoglycemic index was calculated as reported by Quiroga et al. [28]: glycemia (mg/dL) × leukocyte count (106/L)/1000.

2.4. Quantification of Serum BAFF, Insulin, Leptin, and Von Willebrand Factor

Serum BAFF (DBLYS0B Human BAFF/BLyS/TNFSF13B, R&D Systems, Minneapolis, MN, USA), insulin (EIA-2935 Insulin ELISA, DRG Diagnostics, Springfield, IL, USA), leptin (EIA-2395 Leptin Sandwich ELISA, DRG Diagnostics, Springfield, IL, USA), and von Willebrand factor (Inmubind vWF ELISA, Sekisui Diagnostics, Osaka, Japan) were assessed using commercial ELISA kits, following instructions provided by the manufacturer.

2.5. Quantification of Pro- and Anti-Inflammatory Cytokines

Serum cytokines (i.e., IL-2, IFN-γ, TNF-α, IL-6, IL-17A, IL-10, and IL-4) were evaluated using cytometric bead arrays (CBA Human Th1/Th2/Th17 Cytokine Kit, Becton Dickinson, Franklin Lakes, NJ, USA). According to the kit instructions, seven bead populations with distinct allophycocyanin (APC) fluorescence intensities, coated with capture antibodies specific to IL-2, IFN-γ, TNF-α, IL-6, IL-17A, IL-10, or IL-4, were mixed to form the bead array. Subsequently, each serum sample was incubated with the bead array and a mix of phycoerythrin (PE)-conjugated monoclonal antibodies specific to each assessed cytokine (i.e., IL-2, IFN-γ, TNF-α, IL-6, IL-17A, IL-10, or IL-4). A minimum amount of 3 × 10² events from each bead population were acquired. Different APC fluorescence intensities were read with the FL-4 detector as indicative of each capture bead population, while PE fluorescence was directly proportional to the serum concentration of each analyzed cytokine (i.e., IL-2, IFN-γ, TNF-α, IL-6, IL-17A, IL-10, and IL-4), and was read using the FL-2 detector of a BD Accuri C6 cytometer (Becton Dickinson, Franklin Lakes, NJ, USA) (see Supplementary Figure S1).
Obtained data were analyzed using FCAP Array software (Becton Dickinson, Franklin Lakes, NY, USA), and the serum concentration (pg/mL) of each assessed cytokine was calculated via standard 4-parameter curve interpolation, as instructed in the kit.

2.6. Statistical Analysis

Statistical analysis was performed using SPSS version 23 and Prism 7.0 software for Mac. The Kolmogorov–Smirnov test was applied to each variable for data behavior assessment, central tendency measurements were used to summarize continuous numerical variables, and frequencies were used in categorical variables. To estimate the association between continuous numerical variables, Pearson or Spearman correlations were performed. Contrast between groups was made by mean comparison for independent-sample tests (ANOVA or the Kruskal–Wallis test), and post hoc tests were applied when needed (Tukey’s or Dunn’s multiple comparisons tests). To evaluate the relationship between a dependent variable and predictors, multiple linear regression analysis was performed. Statistical significance was denoted as * p < 0.05, ** p < 0.01, and *** p < 0.001.

3. Results

3.1. Characterization of the Metabolic, Inflammatory, and Endothelial Markers of Study Subjects

A total of 166 subjects were recruited to participate in the present study. Only 124 subjects met the inclusion criteria and attended their medical appointments, so they were included and classified according to their BMI: obese (OB, n = 41), overweight (OW, n = 43), or normal-weight (NW, n = 40) subjects, as shown in Figure 1.
Study participants’ clinical, anthropometric, and laboratory test characteristics are shown in Table 1. Statistical differences between OB, OW, and NW subjects were observed in blood pressure (p < 0.0001), adiposity measurements (BMI, % body fat, visceral fat index, waist circumference, and waist–hip ratio) (p < 0.0001), glycemia (p = 0.001), triglyceridemia (p < 0.0001), total cholesterol, and HDL-c (p < 0.05). Likewise, higher levels of serum leptin, insulin, and HOMA-IR were present in OB vs. OW and NW subjects (p < 0.0001), while leukocyte count was increased in OB subjects (p < 0.05).
Nonetheless, when assessing whether these increased anthropometric and biochemical levels were beyond established limits, it was observed that only 9% of OB subjects presented high blood pressure, and 28% presented hyperglycemia, without exceeding the T2DM threshold. Moreover, dyslipidemia was the most frequent metabolic disturbance observed (50%, 26% hypertriglyceridemia; 61%, 42% high-density hypolipoproteinemia) in OB and OW individuals, respectively. Due to the aim of this research consisting of evaluating OW and OB subjects without comorbidities, the high proportion of MS (49%, 14%) and IR (89%, 47%) drew our attention (see Table 2); since at the time of recruitment none of the subjects had an established diagnosis or were on pharmacological treatment, this could have biased of results.
In that respect, when observing the occurrence of metabolic alterations in OB and OW subjects, we proceeded to characterize their systemic inflammatory status, assessing soluble molecules such as pro-inflammatory (e.g., IL-2, IFN-γ, TNF-α, IL-6, IL17A) and anti-inflammatory (e.g., IL-4, IL-10) cytokines. To determine early endothelial dysfunction status, von Willebrand factor (vWF) was measured, as this has been described as an acute-phase reactant, indicative of endothelial homeostasis disturbance [29], whereas leucoglycemic index (LGI) is a systemic inflammatory marker broadly used as a predictive parameter of poor cardiovascular prognosis in myocardial infarction [30,31], acute coronary syndrome [32], and atherothrombotic cerebral ischemia [33].
Inflammatory and endothelial dysfunction markers are summarized in Table 3. Statistical differences in classical OB-associated pro-inflammatory cytokines such as TNF-α (p = 0.001) and IL-6 (p = 0.019) were observed in OB vs. OW and OB vs. NW subjects. Interestingly, pro-inflammatory cytokines whose increase is less described in OB and OW subjects, such as IL-2 (p = 0.003) and IL-17A (p = 0.010), were also statistically different between these study subjects. Similarly, vWF (p < 0.0001) and LGI (p = 0.002) were found to be significantly higher in OB and OW subjects vs. NW controls, highlighting that early ED is detectable before systemic pro-inflammatory onset, which is observed until OB consolidation.

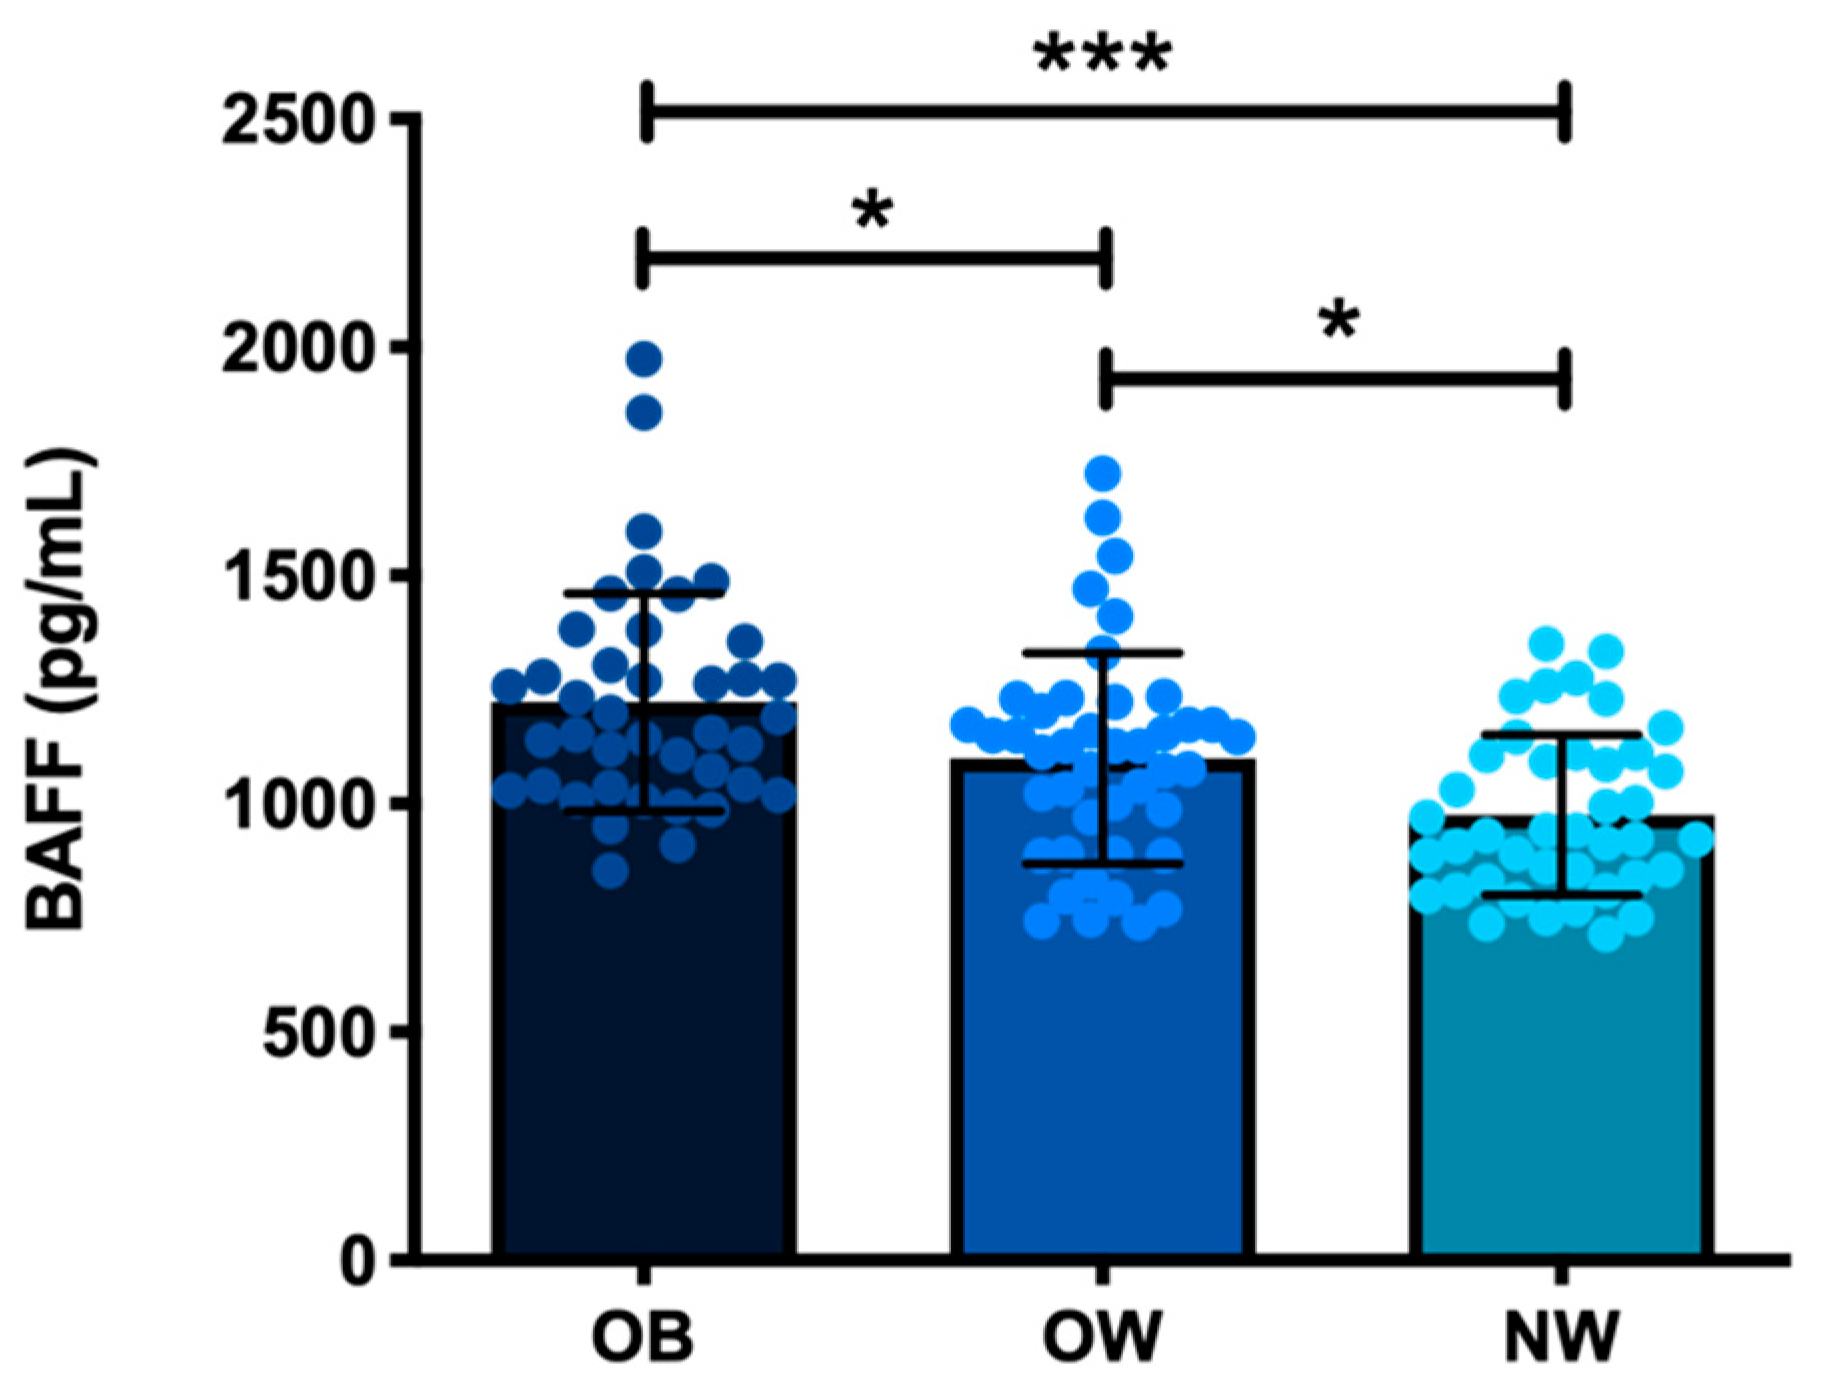
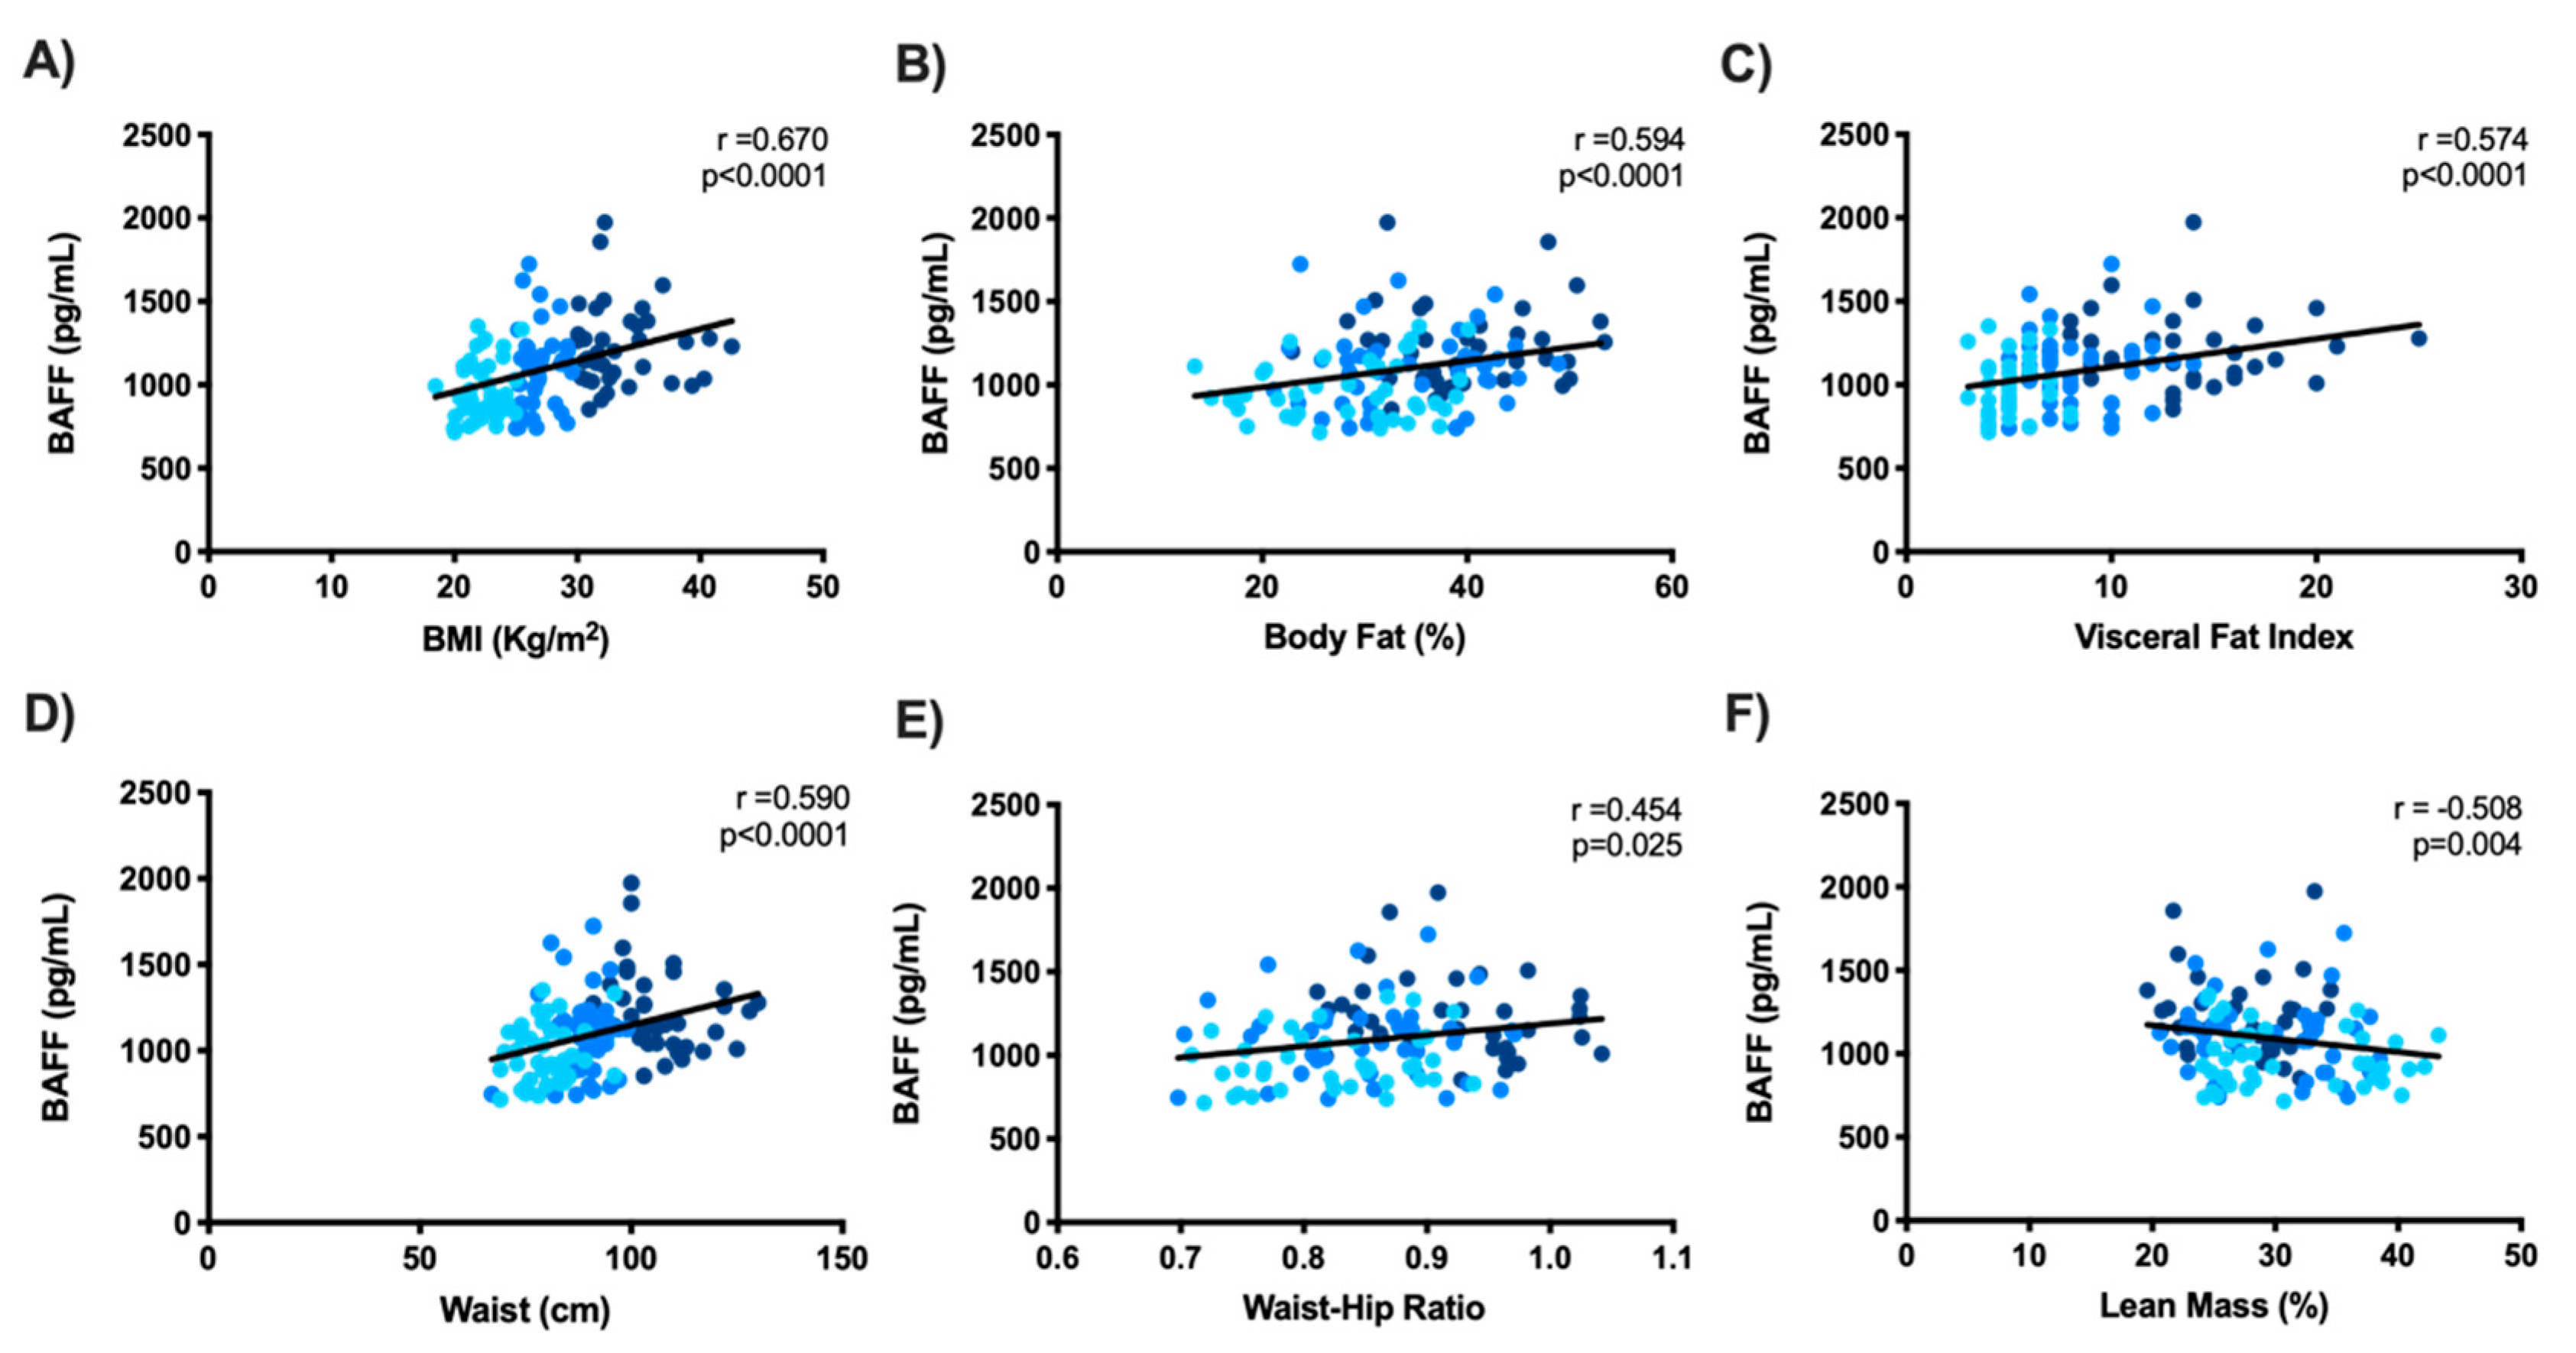
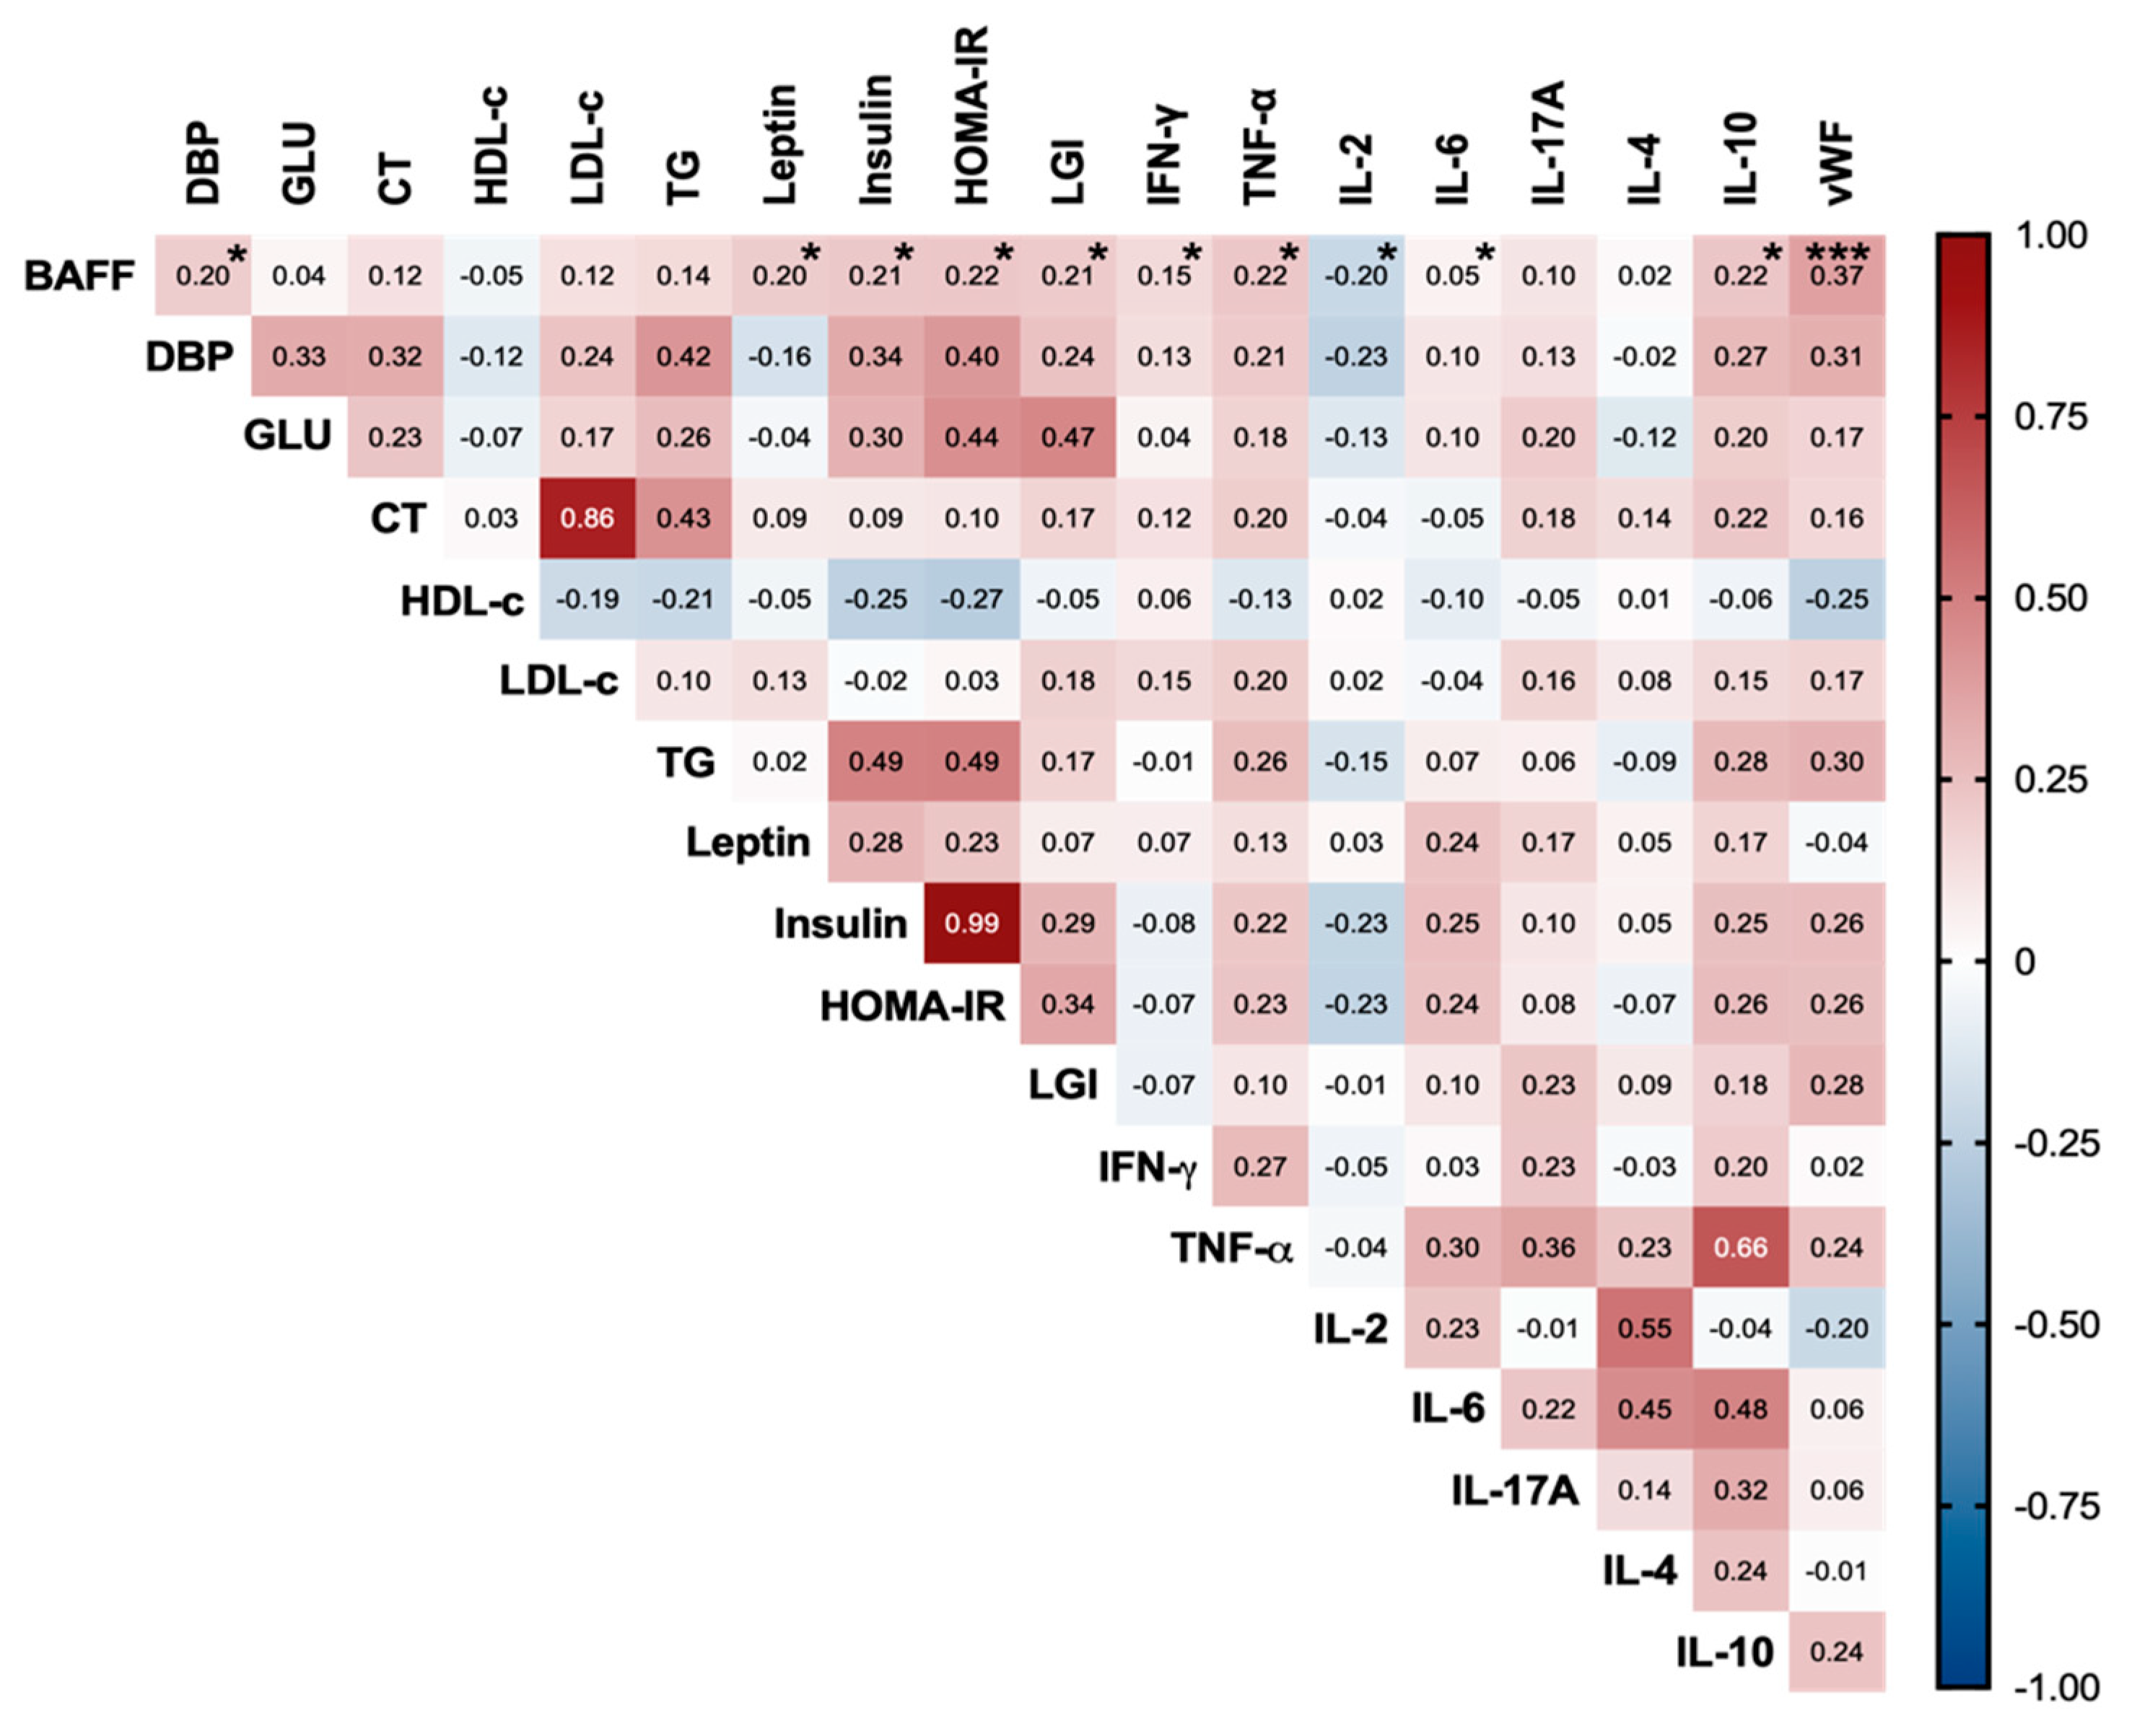
3.2. Serum BAFF’s Relationship with Metabolic, Inflammatory, and Endothelial Markers in the Study Subjects

As we observed a marked pro-inflammatory systemic and ED context in subjects with increased BMI, we proceeded to quantify BAFF serum levels. We found that, similar to previous observations of metabolic, inflammatory, and endothelial affectation, serum BAFF was higher in OB (p < 0.0001) and OW subjects (p < 0.05) vs. NW controls (see Figure 2).
As BAFF is a relatively recently described adipokine, we proceeded to assess whether its increase proportionally to BMI was directly related to any fat compartment. To do so, the relationships between BAFF and BMI, % body fat, visceral fat index (VFI), waist circumference (WC), and waist–hip ratio (WHR) were assessed, as well as the relationship between BAFF and % lean mass (see Figure 3).
No difference was observed while evaluating BAFF’s relationship with general or abdominal fat. Nevertheless, this adipokine showed strong correlation with every adiposity measurement (p < 0.0001), as well as a negative correlation with lean mass (p = 0.004), reflecting its close link with body adiposity, regardless of the anatomical region of its deposition.
To our knowledge, there are no data on BAFF’s relationship with metabolic, serum inflammatory, and ED parameters in OW and OB subjects, so we set out to assess whether these relationships exist, and our findings are depicted in Figure 4.
No relationship was observed between BAFF and metabolic parameters. However, a positive correlation that reached statistical significance was found between BAFF and insulinemia, as well as HOMA-IR (r = 0.2, p < 0.05). BAFF serum concentration also increased in a systemic inflammatory context mediated by pro-inflammatory cytokines, such as TNF-α (r = 0.22, p < 0.05) and IFN-γ (r = 0.15, p < 0.05), as well as the anti-inflammatory cytokine IL-10 (r = 0.22, p < 0.05).
However, it was the high magnitude of correlation between BAFF and vWF (r = 0.37, p < 0.0001) that caught our attention, since to the best of our knowledge no mechanistic relation between increased BAFF and ED has been reported.
Hence, we proceeded to evaluate whether BAFF could be influencing increased serum vWF in a linear regression analysis, where classical clinical and metabolic risk factors for ED were included. Consistent with the above, the assessed model showed a significant predictive role of BAFF for increased vWF, as well as an inverse prediction of HDL-c for augmented vWF (R2= 0.408, F = 7.376, p = 0.001) (see Table 4).

4. Discussion

4.1. Low-Grade Systemic Inflammation, Insulin Resistance, and Endothelial Dysfunction in OB and OW Study Subjects

The prevalence of obesity and MS in Mexico has been consistently increasing in recent decades, mostly attributable to sedentism, high-carbohydrate and high-fat diets, genetic factors, and insufficient public policies targeted to decreasing its impact on the general population [36]. This study was conducted in a young adult population without comorbidities, despite which high dyslipidemia (hypertriglyceridemia and high-density hypolipoproteinemia), IR, and MS frequencies stood out in all study groups. Similar findings have been reported in young Mexican populations, where some of the most frequent MS traits found were low HDL-c and hypertriglyceridemia [36,37]—observations that are consistent with the high prevalence of low HDL-c levels reported in all previous Mexican health surveys [38]. Additionally, research performed in a young OW and OB Mexican population showed similar frequencies of MS and IR to those reported in this study [39]. Thus, this reflects the alarming reality of metabolic alterations in clinically healthy Mexican young adults, as well as the urgent need for corrective strategies to be applied.
In addition to metabolic alterations, during OB progression, a chronic, low-grade inflammatory state takes place [40]. Many studies have shown an increase in inflammatory mediators during OB progression, regulating different mechanisms during VAT and SCAT remodeling [41,42], among which pro-inflammatory cytokines such as TNF-α [43,44,45,46] and IL-6 [45,47,48] stand out. In this study, we observed statistically significant differences in the systemic concentrations of both pro-inflammatory (TNF-α, IL-2, IL-6, IL-17A) and anti-inflammatory (IL-10) cytokines in OB vs. NW as well as OB vs. OW subjects. There are only few reports in the literature that have evaluated this same cytokine panel using the same methodology in subjects according to their BMI; therefore, our comparison material is limited; however, Schmidt et al. [49], reported lower IL-2 and TNF-α concentrations in a study conducted in an OB German population, although it is worth noting that differences in lifestyles and genetic backgrounds could explain these differences, since our patients presented greater metabolic alterations and reported a more sedentary lifestyle than in the study of Schmidt et al. Meanwhile, in Mexican subjects, classified according to their metabolic status, Ferreira-Hermosillo et al. [50] reported serum levels of IL-6, TNF, and IL-10-α more comparable to our findings. Finally, Aradillas-García et al. [51] have recently reported a similar behavior for serum IL-17A in young OB Mexicans. Interestingly, we did not observe differences between OW and NW subjects, which allows us to highlight that, in this population, serum increase in pro-inflammatory cytokines is poorly represented during tissue remodeling and fat mass gain, consolidating until reaching OB status, and it is also noteworthy that our strict inclusion criteria allow us to attribute the inflammatory process merely to OB progression and metabolic stress, since there were no comorbidities or confounding variables in the study subjects that could bias the latter observations.
Additionally, LGI was assessed as a reflection of inflammatory and metabolic stress, which has been used to evaluate poor prognosis in cardiovascular disease [28,31,32,33]. We found statistically significant higher LGI in OB and OW subjects, but considerably lower levels than those reported during myocardial infarction [31] and atherothrombotic cerebral ischemia [33], as was expected due to the clinical severity of those pathologies. However, LGI was expected to be higher in OB and OW subjects since, in OB progression, fatty tissue remodeling induces an adipokine profile abundant in chemoattractant molecules, as well as inflammatory ligands derived from adipocyte necrosis, hypoxia, or tissue-resident macrophage activation [52], which increase leukocyte recruitment from the bone marrow into blood circulation [53]. Though to a lesser extent, these mechanisms are importantly shared with leukocyte recruitment to the vascular endothelium during the progression of cardiovascular pathology [54].
Moreover, it has been reported that during acute [55] and chronic inflammation [56], shear forces and inflammatory molecules promote EC dysfunction, increasing vWF secretion into circulation which, upon contact with circulating platelets, can trigger thrombogenic processes [57]. In OB subjects, circulating vWF concentrations have been directly related to BMI, increasing with higher BMI of the study subjects [58,59]. Consistent with reports from the literature, we found increased vWF in OB vs. NW subjects, as well as OW vs. NW subjects. The latter is relevant, since it shows that ED starts before the onset of OB, highlighting the importance of early intervention strategies to prevent the progression of endothelial damage to cardiovascular complications in these patients.

4.2. Increased Serum BAFF Related to Adiposity, Insulin Resistance, Systemic Inflammation, and Endothelial Dysfunction in the Study Subjects

BAFF is a cytokine member of the TNF ligand superfamily, whose expression has been classically described in innate and adaptive immune cells [17]. More recently, BAFF’s role as an adipokine [13] was described in murine [15] and human [16] SCAT pre-adipocytes during differentiation, suggesting its pro-adipogenic role. Clinically, diet-related serum BAFF in OB Czech Caucasian subjects was reported by Bienertova et al. [24], where higher serum BAFF was observed in OB women vs. OB men. Although we did not perform gender analysis, concentrations observed in our OB group were comparable to those in OB women, while NW subjects’ BAFF was found to be slightly lower than Bienertova´s non-OB subjects; however, this could be explained as a result of their non-OB classification including 18 ≤ BMI < 30 kg/m2.
More recently, Chan et al. [60] conducted a study in pediatric OB patients with BMI > 50 kg/m2, where serum BAFF concentrations were found to be considerably lower than those observed in our OB subjects; however, concentrations of their control group were comparable to our NW group—the latter could be explained if we take into consideration that our OB subjects’ BMI was considerably lower and, to date, BAFF serum dynamics at extremely high BMI, e.g., 50 kg/m2, have not been fully elucidated.
Increased BAFF expression in SCAT [16] and VAT [61] has been described in high-fat diet (HFD) murine models. Meanwhile, in OB women, a positive correlation between BAFF, % body fat, and WC has been demonstrated [24]. In our study, we assessed % lean mass, % body fat, and VFI via BIA, as well as WC and WHR, to evaluate BAFF’s relationship with general and abdominal adiposity from both VAT and SCAT. Our results highlighted that serum BAFF showed an increased dynamic related to adiposity gain, regardless of body deposition. However, a limitation of the present study is that BAFF’s relationship with more SCAT deposits was not assessed to further describe this phenomenon. Additionally, we evaluated whether serum BAFF increases in OB and OW subjects were related to other adipokines, such as leptin, which increases during OB progression [12]. This relationship was reported to be negative by Bienertova et al. [24]; however, in our study’s subjects, it was found to be positive, which reflects the active adipogenic state present in these subjects.
BAFF is an adipokine that links OB to inflammation, since murine [15] and human adipocytes treated with TNF-α [13] or H2O2 [62] showed increased BAFF expression, while 3T3-L1 treatment with exogenous BAFF caused overexpression of IL-6 and TNF-α, identifying the NF-κB pathway as an effector mechanism [61]. Therefore, BAFF participates in the OB adipogenic–inflammatory axis; thus, when investigating whether there was a relationship between serum pro-inflammatory cytokines and BAFF, consistent with previous reports, we observed a positive correlation between BAFF and classically described pro-inflammatory cytokines, such as IFN-γ, TNF-α, and IL-6.
Additionally, it has been described in the literature that adipocyte treatment with exogenous BAFF decreases glucose uptake and tyrosine phosphorylation of IRS-1, inducing a cellular state of IR [61]. In the present study, we reported elevated frequencies of IR in OB (89%) and OW (47%) subjects. Interestingly we found a positive correlation between BAFF and insulinemia, as well as HOMA-IR, which mechanistically could be directly or indirectly related to systemic BAFF, through its inducing effect on pro-inflammatory cytokine expression, and their respective effects on systemic glucose metabolism.
Finally, expression of BAFF and TACI has been reported in the human vascular endothelium [16], while BAFF neutralization with anti-BAFF monoclonal antibodies in atherosclerosis-prone mice increased atherosclerotic plaque size and complexity, indicating a direct effect of BAFF on endothelial tissue [63]. In our study, BAFF was positively correlated with DPB, LGI, and vWF—a known marker of ED and atherosclerosis. Meanwhile, when constructing a linear regression model to assess whether there was influence from BAFF and classically described risk factors for ED, we found a predictive role of BAFF for serum vWF increase, so we can hypothesize that, although BAFF’s absence is detrimental to atherosclerotic progression, excessive serum BAFF—resulting from increased body adiposity and inflammation—in turn, has a detrimental effect on endothelial homeostasis, which could be indirectly mediated by TNF-α and IL-6—known endothelium activator molecules—or directly induced by BAFF downstream signaling through its TACI receptor.

5. Conclusions

On this basis, we conclude that in young Mexican OW and OB subjects without comorbidities, BAFF’s systemic increase is directly related to fat mass gain, in both VAT and SCAT depots. BAFF increase is related to chronic systemic inflammation and linked to IR development during OB progression. Finally, we found that BAFF influences augmented serum vWF—an early endothelial dysfunction marker.

Supplementary Materials

The following supporting information can be downloaded at: https://www.mdpi.com/article/10.3390/life12050634/s1. Figure S1. Representative gating strategy of cytometric bead arrays.

Author Contributions

Conceptualization, D.C.V.S., A.G.G. and M.E.V.S.; methodology, D.C.V.S. and S.G.C.; statistics, D.C.V.S. and A.G.G.; writing—original draft preparation, D.C.V.S.; writing—review and editing, A.G.G.; project administration, A.G.G.; supervision, A.G.G., S.G.C. and M.E.V.S.; funding acquisition, A.G.G. All authors have read and agreed to the published version of the manuscript.

Funding

This research was financed by the Fondo de Investigación en Salud–IMSS: FIS/IMSS/PROT/MD17/1687.

Institutional Review Board Statement

This study was conducted in accordance with the Declaration of Helsinki, and approved by Health Research and Ethics Committee of the Mexican Social Security Institute (Registration No. R-2017-1602-7).

Informed Consent Statement

Written informed consent was obtained from all subjects involved in the study.

Data Availability Statement

The data are available upon request.

Acknowledgments

We want to acknowledge and thank Lic. Hector Ismael Páramo Hernández, and QFB. María Lucía Enríquez Ramírez for their support in patient recruitment organization, as well as the performance of routine laboratory tests. Without you, this research would not have been possible.

Conflicts of Interest

The authors declare no conflict of interest.

References

  1. Grosso, G. Obesity during COVID-19: An underrated pandemic? eClinicalMedicine 2021, 39, 101062. [Google Scholar] [CrossRef]
  2. Barquera, S.; Hernandez-Barrera, L.; Trejo-Valdivia, B.; Shamah, T.; Campos-Nonato, I.; Rivera-Dommarco, J. Obesity in Mexico, prevalence andtrends in adults. Ensanut 2018-19. Salud Public. Mex. 2020, 62, 682–692. [Google Scholar] [CrossRef] [PubMed]
  3. Lin, X.; Li, H. Obesity: Epidemiology, Pathophysiology, and Therapeutics. Front. Endocrinol. 2021, 12, 706978. [Google Scholar] [CrossRef] [PubMed]
  4. Choe, S.S.; Huh, J.Y.; Hwang, I.J.; Kim, J.I.; Kim, J.B. Adipose Tissue Remodeling: Its Role in Energy Metabolism and Metabolic Disorders. Front. Endocrinol. 2016, 7, 30. [Google Scholar] [CrossRef] [PubMed] [Green Version]
  5. Kojta, I.; Chacinska, M.; Blachnio-Zabielska, A. Obesity, Bioactive Lipids, and Adipose Tissue Inflammation in Insulin Resistance. Nutrients 2020, 12, 1305. [Google Scholar] [CrossRef] [PubMed]
  6. Bourgeois, C.; Gorwood, J.; Olivo, A.; Le Pelletier, L.; Capeau, J.; Lambotte, O.; Bereziat, V.; Lagathu, C. Contribution of Adipose Tissue to the Chronic Immune Activation and Inflammation Associated with HIV Infection and Its Treatment. Front. Immunol. 2021, 12, 670566. [Google Scholar] [CrossRef]
  7. Wernstedt Asterholm, I.; Tao, C.; Morley, T.S.; Wang, Q.A.; Delgado-Lopez, F.; Wang, Z.V.; Scherer, P.E. Adipocyte inflammation is essential for healthy adipose tissue expansion and remodeling. Cell Metab. 2014, 20, 103–118. [Google Scholar] [CrossRef] [Green Version]
  8. Saltiel, A.R.; Olefsky, J.M. Inflammatory mechanisms linking obesity and metabolic disease. J. Clin. Investig. 2017, 127, 1–4. [Google Scholar] [CrossRef] [PubMed]
  9. Al-Hazzaa, H.M.; Albawardi, N.M. Obesity, Lifestyle Behaviors, and Dietary Habits of Saudi Adolescents Living in Riyadh (ATLS-2 Project): Revisited after a Ten-Year Period. Life 2021, 11, 1078. [Google Scholar] [CrossRef] [PubMed]
  10. Grazioli, E.; Romani, A.; Marrone, G.; Di Lauro, M.; Cerulli, C.; Urciuoli, S.; Murri, A.; Guerriero, C.; Tranchita, E.; Tesauro, M.; et al. Impact of Physical Activity and Natural Bioactive Compounds on Endothelial Dysfunction in Chronic Kidney Disease. Life 2021, 11, 841. [Google Scholar] [CrossRef]
  11. Sun, Y.; Rawish, E.; Nording, H.M.; Langer, H.F. Inflammation in Metabolic and Cardiovascular Disorders-Role of Oxidative Stress. Life 2021, 11, 672. [Google Scholar] [CrossRef] [PubMed]
  12. Lejawa, M.; Osadnik, K.; Czuba, Z.; Osadnik, T.; Pawlas, N. Association of Metabolically Healthy and Unhealthy Obesity Phenotype with Markers Related to Obesity, Diabetes among Young, Healthy Adult Men. Analysis of MAGNETIC Study. Life 2021, 11, 1350. [Google Scholar] [CrossRef] [PubMed]
  13. Do, M.S.; Joing, H.S.; Choi, B.H.; Hunter, L.; Langley, S.; Pazmany, L.; Trayhurn, P. Inflammatory Gene Expression Patterns Revealed by DNA Microarray Analysis in TNF-α-treated SGBS Human Adipocytes. Yonsei Med. J. 2006, 47, 729–736. [Google Scholar] [CrossRef] [PubMed]
  14. Pelekanou, V.; Kampa, M.; Kafousi, M.; Darivianaki, K.; Sanidas, E.; Tsiftsis, D.D.; Stathopoulos, E.N.; Tsapis, A.; Castanas, E. Expression of TNF-superfamily members BAFF and APRIL in breast cancer: Immunohistochemical study in 52 invasive ductal breast carcinomas. BMC Cancer 2008, 8, 76. [Google Scholar] [CrossRef] [PubMed]
  15. Kim, Y.H.; Choi, B.H.; Cheon, H.G.; Do, M.S. B cell activation factor (BAFF) is a novel adipokine that links obesity and inflammation. Exp. Mol. Med. 2009, 41, 208–216. [Google Scholar] [CrossRef] [Green Version]
  16. Alexaki, V.I.; Notas, G.; Pelekanou, V.; Kampa, M.; Valkanou, M.; Theodoropoulos, P.; Stathopoulos, E.N.; Tsapis, A.; Castanas, E. Adipocytes as immune cells: Differential expression of TWEAK, BAFF, and APRIL and their receptors (Fn14, BAFF-R, TACI, and BCMA) at different stages of normal and pathological adipose tissue development. J. Immunol. 2009, 183, 5948–5956. [Google Scholar] [CrossRef] [Green Version]
  17. Smulski, C.R.; Eibel, H. BAFF and BAFF-Receptor in B Cell Selection and Survival. Front. Immunol. 2018, 9, 2285. [Google Scholar] [CrossRef]
  18. Mackay, F.; Schneider, P. Cracking the BAFF code. Nat. Rev. Immunol. 2009, 9, 491–502. [Google Scholar] [CrossRef] [Green Version]
  19. Rowland, S.L.; Leahy, K.F.; Halverson, R.; Torres, R.M.; Pelanda, R. BAFF receptor signaling aids the differentiation of immature B cells into transitional B cells following tonic BCR signaling. J. Immunol. 2010, 185, 4570–4581. [Google Scholar] [CrossRef] [Green Version]
  20. Moisini, I.; Davidson, A. BAFF: A local and systemic target in autoimmune diseases. Clin. Exp. Immunol. 2009, 158, 155–163. [Google Scholar] [CrossRef]
  21. Szodoray, P.; Alex, P.; Jonsson, M.V.; Knowlton, N.; Dozmorov, I.; Nakken, B.; Delaleu, N.; Jonsson, R.; Centola, M. Distinct profiles of Sjogren’s syndrome patients with ectopic salivary gland germinal centers revealed by serum cytokines and BAFF. Clin. Immunol. 2005, 117, 168–176. [Google Scholar] [CrossRef] [PubMed]
  22. Carrillo-Ballesteros, F.J.; Palafox-Sanchez, C.A.; Franco-Topete, R.A.; Munoz-Valle, J.F.; Orozco-Barocio, G.; Martinez-Bonilla, G.E.; Gomez-Lopez, C.E.; Marin-Rosales, M.; Lopez-Villalobos, E.F.; Luquin, S.; et al. Expression of BAFF and BAFF receptors in primary Sjogren’s syndrome patients with ectopic germinal center-like structures. Clin. Exp. Med. 2020, 20, 615–626. [Google Scholar] [CrossRef] [PubMed]
  23. Vincent, F.B.; Kandane-Rathnayake, R.; Koelmeyer, R.; Hoi, A.Y.; Harris, J.; Mackay, F.; Morand, E.F. Analysis of serum B cell-activating factor from the tumor necrosis factor family (BAFF) and its soluble receptors in systemic lupus erythematosus. Clin. Transl. Immunol. 2019, 8, e01047. [Google Scholar] [CrossRef] [PubMed] [Green Version]
  24. Bienertova-Vasku, J.; Bienert, P.; Zlamal, F.; Tomandl, J.; Forejt, M.; Tomandlova, M.; Vavrina, M.; Kudelková, J.; Splichal, Z.; Vasku, A. B-cell activating factor (BAFF)—A new factor linking immunity to diet? Open Med. 2012, 7, 275–283. [Google Scholar] [CrossRef]
  25. Miyake, T.; Abe, M.; Tokumoto, Y.; Hirooka, M.; Furukawa, S.; Kumagi, T.; Hamada, M.; Kawasaki, K.; Tada, F.; Ueda, T.; et al. B cell-activating factor is associated with the histological severity of nonalcoholic fatty liver disease. Hepatol. Int. 2013, 7, 539–547. [Google Scholar] [CrossRef] [PubMed]
  26. Obesity: Preventing and Managing the Global Epidemic. In Report of a WHO Consultation; WHO: Geneva, Switzerland, 2000; pp. 1–253.
  27. Talavera, J.O.; Rivas-Ruiz, R.; Bernal-Rosales, L.P. Investigación clínica V. Tamaño de muestra. Rev. Med. Inst. Mex. Seguro. Soc. 2011, 49, 517–522. [Google Scholar] [PubMed]
  28. Quiroga-Castro, W.C.E.; Zelaya, F.; Isa, M.; Pacheco, G.; Sala, J.; Carlos, B. Estratificación del riesgo en el infarto agudo de miocardio según el índice leucoglucémico ¿El «Killip-Kimball» de laboratorio? Rev. Fed. Arg. Cardiol. 2010, 39, 29–34. [Google Scholar]
  29. Lelas, A.; Greinix, H.T.; Wolff, D.; Eissner, G.; Pavletic, S.Z.; Pulanic, D. Von Willebrand Factor, Factor VIII, and Other Acute Phase Reactants as Biomarkers of Inflammation and Endothelial Dysfunction in Chronic Graft-Versus-Host Disease. Front. Immunol. 2021, 12, 676756. [Google Scholar] [CrossRef]
  30. Chermiti, I.; Ghazal, H.; Dimassi, R.; Mahdhoui, S.; Gnena, H.; Chiboub, S.; Chkir, M.; Souissi, S. Prognostic Value of Leuko-glycemic Index in ST Segment Elevation Myocardial Infarction. J. Emerg. Med. 2017, 53, 435. [Google Scholar] [CrossRef]
  31. Leon-Aliz, E.; Moreno-Martinez, F.L.; Perez-Fernandez, G.A.; Vega-Fleites, L.F.; Rabassa-Lopez-Calleja, M.A. Leuko-glycemic index as an in-hospital prognostic marker in patients with ST-segment elevation myocardial infarction. Clin. Investig. Arterioscler. 2014, 26, 168–175. [Google Scholar]
  32. Saldaña-Martínez, A.; Mendoza, R.M.; López-González, A. Índice leucoglucémico como predictor de complicaciones en el síndrome coronario agudo. Med. Crit. 2018, 32, 27–33. [Google Scholar]
  33. Hernández-Sánchez, M.M.; Lozano-Nuevo, J.J.; Suárez-Cuenca, J.A.; Mendoza-Portillo, E.; Vergara-Orduña, F.I.; Palacios-Pérez, E.; González-Moreno, F.J.; Villanueva-Domínguez, J. Índice leuco-glucémico asociado con complicaciones en isquemia cerebral aterotrombótica. Med. Inter. Méx. 2019, 35, 39–44. [Google Scholar]
  34. Grundy, S.M.; Cleeman, J.I.; Daniels, S.R.; Donato, K.A.; Eckel, R.H.; Franklin, B.A.; Gordon, D.J.; Krauss, R.M.; Savage, P.J.; Smith, S.C., Jr.; et al. Diagnosis and management of the metabolic syndrome: An American Heart Association/National Heart, Lung, and Blood Institute Scientific Statement. Circulation 2005, 112, 2735–2752. [Google Scholar] [CrossRef] [PubMed] [Green Version]
  35. Azevedo-Salgado, A.L.F.; de Carvalho, L.; Oliveira, A.C.; Dos Santos, V.N.; Vieira, J.G.; Parise, E.R. Insulin resistance index (HOMA-IR) in the differentiation of patients with non-alcoholic fatty liver disease and healthy individuals. Arq. Gastroenterol. 2010, 47, 165–169. [Google Scholar] [CrossRef] [Green Version]
  36. Bello-Chavolla, O.Y.; Vargas-Vazquez, A.; Antonio-Villa, N.E.; Del Razo-Olvera, F.M.; Elias-Lopez, D.; Aguilar-Salinas, C.A.; Metabolic Syndrome Study Group. A High Incidence of Metabolic Syndrome Traits in Mexicans Points at Obesity-Related Metabolic Dysfunction. Diabetes Metab. Syndr. Obes. 2021, 14, 1073–1082. [Google Scholar] [CrossRef] [PubMed]
  37. Reyes-Márquez, R.; Aguilar-Galarza, B.A.; Anaya-Loyola, M.A.; Moreno-Celis, U.; Elton-Puente, J.E.; Lloret, M.; Sosa-Ferreyra, C.F.; García-Gasca, T. Metabolic Alterations in Mexican Young Adults: Sensitivity and Specificity Approaches between Anthropometric Parameters and Biochemical Markers; Universidad Autónoma de Querétraro: Querétaro, México, 2017; Available online: https://fcn.uaq.mx/index.php/programas/posgrados/mnh/publicaciones-mcnh (accessed on 15 March 2022).
  38. Aguilar-Salinas, C.A.; Olaiz, G.; Valles, V.; Torres, J.M.R.; Pérez, F.J.G.; Rull, J.A.; Rojas, R.; Franco, A.; Sepulveda, J. High prevalence of low HDL cholesterol concentrations and mixed hyperlipidemia in a Mexican nationwide survey. J. Lipid Res. 2001, 42, 1298–1307. [Google Scholar] [CrossRef]
  39. Murguia-Romero, M.; Jimenez-Flores, J.R.; Sigrist-Flores, S.C.; Tapia-Pancardo, D.C.; Jimenez-Ramos, A.; Mendez-Cruz, A.R.; Villalobos-Molina, R. Prevalence of Metabolic Syndrome in Young Mexicans: A Sensitivity Analysis on Its Components. Nutr. Hosp. 2015, 32, 189–195. [Google Scholar] [PubMed]
  40. Moghbeli, M.; Khedmatgozar, H.; Yadegari, M.; Avan, A.; Ferns, G.A.; Ghayour Mobarhan, M. Cytokines and the immune response in obesity-related disorders. Adv. Clin. Chem. 2021, 101, 135–168. [Google Scholar] [PubMed]
  41. Pou, K.M.; Massaro, J.M.; Hoffmann, U.; Vasan, R.S.; Maurovich-Horvat, P.; Larson, M.G.; Keaney, J.F., Jr.; Meigs, J.B.; Lipinska, I.; Kathiresan, S.; et al. Visceral and subcutaneous adipose tissue volumes are cross-sectionally related to markers of inflammation and oxidative stress: The Framingham Heart Study. Circulation 2007, 116, 1234–1241. [Google Scholar] [CrossRef] [Green Version]
  42. Rakotoarivelo, V.; Lacraz, G.; Mayhue, M.; Brown, C.; Rottembourg, D.; Fradette, J.; Ilangumaran, S.; Menendez, A.; Langlois, M.F.; Ramanathan, S. Inflammatory Cytokine Profiles in Visceral and Subcutaneous Adipose Tissues of Obese Patients Undergoing Bariatric Surgery Reveal Lack of Correlation with Obesity or Diabetes. eBioMedicine 2018, 30, 237–247. [Google Scholar] [CrossRef] [PubMed] [Green Version]
  43. Alzamil, H. Elevated Serum TNF-alpha Is Related to Obesity in Type 2 Diabetes Mellitus and Is Associated with Glycemic Control and Insulin Resistance. J. Obes. 2020, 2020, 5076858. [Google Scholar] [CrossRef] [PubMed] [Green Version]
  44. Olszanecka-Glinianowicz, M.; Zahorska-Markiewicz, B.; Janowska, J.; Zurakowski, A. Serum concentrations of nitric oxide, tumor necrosis factor (TNF)-alpha and TNF soluble receptors in women with overweight and obesity. Metabolism 2004, 53, 1268–1273. [Google Scholar] [CrossRef] [PubMed]
  45. Popko, K.G.E.; Stelmaszczyk-Emmel, A.; Plywaczewski, R.; Stoklosa, A.; Gorecka, D.; Pyrzak, B.; Demkow, U. Proinflammatory Cytokines IL-6 and TNF-α and the Development of Inflammation in Obese Subjects. Eur. J. Med. Res. 2010, 15, 120–122. [Google Scholar] [CrossRef] [PubMed]
  46. Rosc, D.; Adamczyk, P.; Boinska, J.; Szafkowski, R.; Ponikowska, I.; Stankowska, K.; Goralczyk, B.; Ruszkowska-Ciastek, B. CRP, but not TNF-alpha or IL-6, decreases after weight loss in patients with morbid obesity exposed to intensive weight reduction and balneological treatment. J. Zhejiang Univ. Sci. B 2015, 16, 404–411. [Google Scholar] [CrossRef]
  47. Fontana, L.; Eagon, J.C.; Trujillo, M.E.; Scherer, P.E.; Klein, S. Visceral fat adipokine secretion is associated with systemic inflammation in obese humans. Diabetes 2007, 56, 1010–1013. [Google Scholar] [CrossRef] [PubMed] [Green Version]
  48. Sola, E.; Jover, A.; Lopez-Ruiz, A.; Jarabo, M.; Vaya, A.; Morillas, C.; Gomez-Balaguer, M.; Hernandez-Mijares, A. Parameters of inflammation in morbid obesity: Lack of effect of moderate weight loss. Obes. Surg. 2009, 19, 571–576. [Google Scholar] [CrossRef] [PubMed]
  49. Schmidt, F.M.; Weschenfelder, J.; Sander, C.; Minkwitz, J.; Thormann, J.; Chittka, T.; Mergl, R.; Kirkby, K.C.; Fasshauer, M.; Stumvoll, M.; et al. Inflammatory cytokines in general and central obesity and modulating effects of physical activity. PLoS ONE 2015, 10, e0121971. [Google Scholar] [CrossRef]
  50. Ferreira-Hermosillo, A.; Molina-Ayala, M.; Ramirez-Renteria, C.; Vargas, G.; Gonzalez, B.; Isibasi, A.; Archundia-Riveros, I.; Mendoza, V. Inflammatory Cytokine Profile Associated with Metabolic Syndrome in Adult Patients with Type 1 Diabetes. J. Diabetes Res. 2015, 2015, 972073. [Google Scholar] [CrossRef] [Green Version]
  51. Aradillas-García, C.; Monreal-Escalante, E.; Vargas-Morlaes, J.M.; Alegría-Torres, J.; Rosales-Méndoza, S.; Terán-García, M.; Portales-Pérez, D.P. Serum IL-17, obesity, and metabolic risk in Mexican young adults. RESPYN Rev. Salud Pública. Y Nutr. 2021, 20, 1–7. [Google Scholar] [CrossRef]
  52. Malesza, I.J.; Malesza, M.; Walkowiak, J.; Mussin, N.; Walkowiak, D.; Aringazina, R.; Bartkowiak-Wieczorek, J.; Madry, E. High-Fat, Western-Style Diet, Systemic Inflammation, and Gut Microbiota: A Narrative Review. Cells 2021, 10, 3164. [Google Scholar] [CrossRef] [PubMed]
  53. Chan, P.C.; Hsieh, P.S. The Chemokine Systems at the Crossroads of Inflammation and Energy Metabolism in the Development of Obesity. Int. J. Mol. Sci. 2021, 22, 13528. [Google Scholar] [CrossRef] [PubMed]
  54. Marchini, T.; Mitre, L.S.; Wolf, D. Inflammatory Cell Recruitment in Cardiovascular Disease. Front. Cell Dev. Biol. 2021, 9, 635527. [Google Scholar] [CrossRef] [PubMed]
  55. Rusu, L.; Minshall, R.D. Endothelial Cell von Willebrand Factor Secretion in Health and Cardiovascular Disease. In Endothelial Dysfunction—Old Concepts and New Challenges; IntechOpen: London, UK, 2018; Available online: https://www.intechopen.com/books/6209 (accessed on 21 March 2022).
  56. Berk, K.A.; Oudshoorn, T.P.; Verhoeven, A.J.M.; Mulder, M.T.; Roks, A.J.M.; Dik, W.A.; Timman, R.; Sijbrands, E.J.G. Diet-induced weight loss and markers of endothelial dysfunction and inflammation in treated patients with type 2 diabetes. Clin. Nutr. ESPEN 2016, 15, 101–106. [Google Scholar] [CrossRef] [PubMed]
  57. Crocco, M.; d’Annunzio, G.; La Valle, A.; Piccolo, G.; Chiarenza, D.S.; Bigatti, C.; Molteni, M.; Milanaccio, C.; Garre, M.L.; Di Iorgi, N.; et al. Endothelial Dysfunction in Childhood Cancer Survivors: A Narrative Review. Life 2021, 12, 45. [Google Scholar] [CrossRef] [PubMed]
  58. Atiq, F.; Fijnvandraat, K.; van Galen, K.P.M.; Laros-Van Gorkom, B.A.P.; Meijer, K.; de Meris, J.; Coppens, M.; Mauser-Bunschoten, E.P.; Cnossen, M.H.; van der Bom, J.G.; et al. BMI is an important determinant of VWF and FVIII levels and bleeding phenotype in patients with von Willebrand disease. Am. J. Hematol. 2019, 94, E201–E205. [Google Scholar] [CrossRef] [Green Version]
  59. Mertens, I.V.G.; Van Gaal, L.F. Obesity, haemostasis and the fibrinolytic system. Obes. Rev. 2002, 3, 85–101. [Google Scholar] [CrossRef] [PubMed]
  60. Chan, C.C.; Harley, I.T.W.; Pfluger, P.T.; Trompette, A.; Stankiewicz, T.E.; Allen, J.L.; Moreno-Fernandez, M.E.; Damen, M.; Oates, J.R.; Alarcon, P.C.; et al. A BAFF/APRIL axis regulates obesogenic diet-driven weight gain. Nat. Commun. 2021, 12, 2911. [Google Scholar] [CrossRef] [PubMed]
  61. Hamada, M.; Abe, M.; Miyake, T.; Kawasaki, K.; Tada, F.; Furukawa, S.; Matsuura, B.; Hiasa, Y.; Onji, M. B cell-activating factor controls the production of adipokines and induces insulin resistance. Obesity 2011, 19, 1915–1922. [Google Scholar] [CrossRef] [PubMed]
  62. Tada, F.A.M.; Kawasaki, K.; Miyake, T.; Shiyi, C.; Hiasa, Y.; Matsura, B.; Onji, M. B cell activating factor in obesity is regulated by oxidative stress in adipocytes. J. Clin. Biochem. Nutr. 2013, 52, 120–127. [Google Scholar] [CrossRef] [PubMed] [Green Version]
  63. Tsiantoulas, D.; Sage, A.P.; Goderle, L.; Ozsvar-Kozma, M.; Murphy, D.; Porsch, F.; Pasterkamp, G.; Menche, J.; Schneider, P.; Mallat, Z.; et al. B Cell-Activating Factor Neutralization Aggravates Atherosclerosis. Circulation 2018, 138, 2263–2273. [Google Scholar] [CrossRef] [PubMed]
Figure 1. Flowchart of study participants.
Life 12 00634 g001
Figure 2. Systemic BAFF is increased in obese patients. Serum BAFF quantification was performed via ELISA. Data are shown as mean ± standard deviation. * ANOVA with Tukey’s post hoc test (n = 41 OB, n = 43 OW, n = 40 NW), significant differences are denoted as * p < 0.05, *** p <  0.001.
Life 12 00634 g002
Figure 3. BAFF increases with body adiposity: Spearman correlation between BAFF and (A) BMI, and (C) visceral fat. Pearson correlation between BAFF and (B) body fat percentage, (D) waist circumference, (E) waist–hip ratio, and (F) lean mass percentage (n = 124).
Life 12 00634 g003
Figure 4. BAFF increases related to hyperinsulinemia, insulin resistance, and endothelial dysfunction. Correlogram of metabolic, inflammatory, and endothelial dysfunction markers related to obesity. Pearson and Spearman correlations are shown according to variable distribution (n = 124). BAFF significant correlations are denoted as * p < 0.05 and *** p < 0.001. BAFF: B-cell activating factor, DBP: diastolic blood pressure, Glu: glucose, CT: total cholesterol, HDL-c: high-density lipoprotein cholesterol, LDL-c: low-density lipoprotein cholesterol, TG: triglycerides, HOMA-IR: homeostatic model assessment, LGI: leucoglycemic index, IFN-γ: interferon gamma, TNF-α: tumor necrosis factor alpha, IL: interleukin, vWF: von Willebrand factor.
Life 12 00634 g004
Table 1. Clinical, anthropometric, and laboratory test characteristics of the study population.
Obese
n = 41
Overweight
n = 43
Normal Weight
n = 40
p
Clinical characteristics
Age (years)35.5 ± 9.035.2 ± 9.033.8 ± 9.50.692
SBP (mmHg)116.5 ± 8.8 110.5 ± 11.5 ϑ105.1 ± 10.40.0001 Φ
DBP (mmHg)77.9 ± 6.4 73.1 ± 9.2 ϑ68.1 ± 6.6 θ0.0001 Φ
Anthropometric measurements
Weight (kg)96.9 ± 15.3 73.7 ± 8.0 ϑ61.5 ± 7.9 θ0.0001 Φ
Height (m)1.7 ± 0.091.7 ± 0.08 ϑ1.7 ± 0.080.037 *
BMI (kg/m2)33.5 ± 3.3 26.9 ± 1.4 ϑ22.3 ± 1.6 θ0.0001 Φ
Body fat (%)39.6 ± 7.4 34.4 ± 7.2 ϑ28.5 ± 7.4 θ0.0001 *
Lean mass (%)27.3 ± 4.3 29.5 ± 5.330.1 ± 6.20.012 *
Visceral fat index13.0 ± 4.5 8.5 ± 2.4 ϑ5.0 ± 1.3 θ0.0001 Φ
Waist (cm)106.6 ± 10.1 89.1 ± 5.9 ϑ79.6 ± 6.4 θ0.0001 *
WHR0.91 ± 0.07 0.85 ± 0.07 ϑ0.82 ± 0.060.0001 *
Biochemical parameters
Glucose (mg/dL)93.7 ± 9.4 89.9 ± 8.585.9 ± 9.80.001 Φ
Cholesterol (mg/dL)182.0 ± 33.5175.9 ± 32.6164.5 ± 26.70.037 *
HDL-c (mg/dL)41.7 ± 7.1 44.4 ± 8.448.9 ± 10.20.001 *
LDL-c (mg/dL)110.9 ± 33.5103.3 ± 31.297.8 ± 22.80.14
Triglycerides (mg/dL)157.7 ± 58.5 140.8 ± 94.886.6 ± 42.5 θ0.0001 Φ
Hormones
Leptin (ng/mL)11.3 ± 7.7 6.3 ± 7.3 ϑ7.6 ± 6.30.0001 Φ
Insulin (µUI/mL)27.0 ± 16.2 15.6 ± 11.0 ϑ 8.9 ± 5.2 θ0.0001 Φ
HOMA-IR6.4 ± 4.1 3.6 ± 2.7 ϑ1.9 ± 1.1 θ0.0001 Φ
Hematic biometry parameters
Leukocytes (103/µL)7.5 ± 1.6 7.1 ± 1.96.2 ± 1.20.025 Φ
Neutrophils (103/µL)4.2 ± 1.14.1 ± 1.63.5 ± 0.90.061
Lymphocytes (103/µL)2.5 ± 0.72.3 ± 0.72.1 ± 0.60.115
Monocytes (103/µL)0.5 ± 0.20.5 ± 0.20.4 ± 0.10.132
Eosinophils (103/µL)0.2 ± 0.10.2 ± 0.10.1 ± 0.10.072
Basophils (103/µL)0.05 ± 0.020.04 ± 0.010.04 ± 0.020.081
Platelets (103/µL)277.4 ± 62.5274.5 ± 68.2286.1 ± 72.10.794
SBP: systolic blood pressure, DBP: diastolic blood pressure, BMI: body mass index, WHR: waist–hip ratio, HDL-c: high-density lipoprotein cholesterol, LDL-c: low-density lipoprotein cholesterol, HOMA-IR: homeostatic model assessment. Results are displayed as the mean ± standard deviation. * ANOVA with Tukey’s post hoc test, Φ Kruskal–Wallis test, Dunn’s multiple comparisons test, OB vs. NW, ϑ OB vs. OW, θ OW vs. NW, p < 0.05.
Table 2. Frequency of metabolic alterations in the study population.
Obese
n (%)
Overweight
n (%)
Normal Weight
n (%)
Fasting glucose
(≥100 mg/dL)
11 (28%)4 (9%)0 (0%)
Triglycerides
(≥150 mg/dL)
20 (50%)11 (26%)4 (10%)
HDL-c
(<40 mg/dL—men)
(<50 mg/dL—women)
23 (61%)18 (42%)16 (39%)
Blood pressure
(≥130 mmHg—systolic)
(≥85 mmHg—diastolic)
3 (9%)5 (12%)0 (0%)
Waist circumference
(≥102 cm—men)
(≥88 cm—women)
36 (95%)13 (31%)3 (8%)
Metabolic Syndrome
(>3 above criteria)
19 (49%)6 (14%)0 (0%)
Insulin Resistance
(≥2.5 HOMA-IR)
37 (89%)20 (47%)5 (14%)
Metabolic syndrome was estimated according to Adult Treatment Panel III (ATP-III) guidelines [34], whereas HOMA-IR threshold was estimated according to literature reports [35]. HDL-c: high-density lipoprotein cholesterol, HOMA-IR: homeostatic model assessment. Results are displayed as number (frequency) of cases.
Table 3. Inflammatory and endothelial dysfunction markers in the study population.
Obese
n = 41
Overweight
n = 43
Normal Weight
n = 40
p
Inflammatory indices
LGI702.0 ±175.3 651.3 ± 184.5548.3 ± 110.1 θ0.002 Φ
Pro-inflammatory cytokines
IFN-γ (pg/mL)0.86 ± 0.060.86 ± 0.100.85 ± 0.070.217
TNF-α (pg/mL)5.4 ± 1.0 4.8 ± 0.9 ϑ4.5 ± 1.00.001 *
IL-2 (pg/mL)2.7 ± 1.1 3.1 ± 1.23.5 ± 1.30.003 Φ
IL-6 (pg/mL)5.5 ± 3.0 4.3 ± 1.3 ϑ6.5 ± 7.60.019 Φ
IL-17A (pg/mL)13.1 ± 10.3 9.2 ± 5.1 ϑ8.2 ± 3.10.010 Φ
Anti-inflammatory cytokines
IL-4 (pg/mL)6.4 ± 2.26.4 ± 1.36.5 ± 1.10.996
IL-10 (pg/mL)6.0 ± 4.2 4.7 ± 0.7 ϑ4.8 ± 1.90.0001 Φ
Endothelial markers
vWF (mU/mL)1292.8 ± 366.1 1290.9 ± 435.5527.0 ± 314.4 θ0.0001 Φ
LGI: leucoglycemic index, IFN-γ: interferon gamma, TNF-α: tumor necrosis factor alpha, IL: interleukin, vWF: von Willebrand factor. Results are displayed as the mean ± standard deviation. * ANOVA with Tukey’s post hoc test, Φ Kruskal–Wallis test, Dunn’s multiple comparisons test, OB vs. NW, ϑ OB vs. OW, θ OW vs. NW; p < 0.05.
Table 4. Linear regression analysis of variables predicting vWF.
Variableβtp
Included variables
BAFF0.8012.9840.004 **
HDL-c−14.181−2.4090.018 *
Excluded variables
SBP0.0860.7740.441
DBP0.0800.7170.476
Cholesterol−0.007−0.0640.949
LDL-c−0.022−0.2030.840
Triglycerides0.0270.2470.806
TNF-α0.0930.8500.398
IFN-γ−0.041−0.3820.703
IL-6−0.124−1.1400.258
LGI0.1631.5220.132
BAFF: B-cell activating factor, HDL-c: high-density lipoprotein cholesterol, SBP: systolic blood pressure, DBP: diastolic blood pressure, LDL-c: low-density lipoprotein cholesterol, TNF-α: tumor necrosis factor alpha, IFN-γ: interferon gamma, LGI: leucoglycemic index, vWF: von Willebrand factor. β: coefficient β, t: t-distribution, * p < 0.05, ** p < 0.01.
Publisher’s Note: MDPI stays neutral with regard to jurisdictional claims in published maps and institutional affiliations.

