Article

No Reduction in Yield of Young Robusta Coffee When Grown under Shade Trees in Ecuadorian Amazonia

1
School of Agricultural, Forest and Food Sciences (HAFL), Bern University of Applied Sciences (BFH), Länggasse 85, 3052 Zollikofen, Switzerland
2
Plants and Pathogens Group, Research Institute Land Nature and Environment, Geneva School of Engineering, Architecture and Landscape (HEPIA), HES-SO University of Applied Sciences and Arts Western Switzerland, Route de Presinge 150, 1254 Jussy, Switzerland
3
National Institute of Agronomical Research (INIAP), Central Experimental Station of Amazonia, km 3 Vía Sacha San Carlos, La Joya de los Sachas 220350, Ecuador
*
Authors to whom correspondence should be addressed.
Life 2022, 12(6), 807; https://doi.org/10.3390/life12060807
Submission received: 1 May 2022 / Revised: 26 May 2022 / Accepted: 26 May 2022 / Published: 29 May 2022
(This article belongs to the Section Plant Science)

Abstract

:
Little is known on what impact shade trees have on the physiology of Coffea canephora (robusta coffee) under tropical humid conditions. To fill this gap, a field experiment was conducted in the Ecuadorian Amazon to investigate how growth, nutrition (leaf N), phenological state (BBCH-scale) and yield of 5-year-old robusta coffee shrubs are affected by the presence or absence of leguminous trees, the type (organic v conventional) and intensity of management. The experiment was a factorial 5 × 4 design with four cropping systems: intensive conventional (IC), moderate conventional (MC), intensive organic (IO) and low organic (LO), and with five shading systems in a split-plot arrangement: full sun (SUN), both Erythrina spp. and Myroxylon balsamum (TaE), M. balsamum (TIM), E. spp. (ERY) and Inga edulis (GUA). Three monthly assessments were made. Cherry yields of coffee shrubs under moderate shade (c. 25%) were similar to those under high light exposure. Coffee shrubs grown with either E. spp. or I. edulis were taller (+10%) and had higher leaf N concentrations (22%) than those grown without consistent shade. Unless receiving c. 25% of shade, coffee shrubs grown under organic cropping systems showed reduced growth (25%). No correlation was found between height, cherry yield and leaf N. Both shading and cropping systems affected leaf N concentration, also depending on phenological state and yield. Further research is needed to confirm our findings in the long-term as well as to elucidate how leguminous trees may induce physiological responses in robusta coffee under humid tropical conditions.

1. Introduction

The main coffee varieties produced and traded are Coffea arabica (hereafter “arabica coffee”) and C. canephora (hereafter “robusta coffee”), which represented 59% and 41% of global coffee production, respectively, in 2019 [1]. Global coffee consumption has been increasing by 1.7% annually since 2015 [1]. Coffee is grown by 25–30 million farmers, of whom 70% are smallholders owning less than 10 ha [2,3]. Since 2010, annual global production of robusta and arabica has increased by 3% and 2%, respectively [1]. Nevertheless, coffee production is threatened by several factors including: (a) climate change which may result in reduction of coffee yield and area climatically suitable for coffee by, e.g., favoring pests and diseases outbreaks [4,5,6,7,8,9]; and, (b) biodiversity loss which affects coffee agroecosystem resilience by reducing, e.g., biocontrol interactions [10,11,12].
Both arabica and robusta coffee are grown in Ecuador, which is one of the top 20 coffee-exporting countries, with approximately 6000 tonnes of green coffee produced annually from 2013–2019, although production has decreased by 60% since 1990 [13]. Average coffee yield in Ecuador is low (c. 160 kg/ha in 2018) [13]. Robusta coffee in Ecuador accounts for almost 50% of the total coffee production, mainly produced in the Ecuadorian Amazon Region (EAR), where more than 60% of the farmers cultivate coffee [1,14]. This low productivity has been attributed in the EAR to unsuitable soils, pests and disease losses, and the lack of education and training for farmers [14].
Coffee agroforestry systems (CAS), which include overstorey trees in coffee crops, may provide agricultural, social and environmental benefits [15]. If shade trees are properly selected and managed, CAS can modify microclimate by buffering extreme temperatures, increasing air relative humidity so reducing water losses through both lower soil evaporation and lower crop transpiration [16,17,18]. CAS could therefore constitute an adequate mitigation strategy to counter the detrimental effects of climate change [7,19,20]. Other ecosystem services can be enhanced by CAS such as carbon sequestration [21], soil nutrient availability through complementary partitioning of resources [22,23,24] and biodiversity conservation [25]. However, contrasting shade effects have been reported on coffee growth, productivity, pests and diseases and arabica coffee cup quality [26,27,28,29,30,31]. This might be because shade effects interact with site biophysical parameters [32], diseases [26], shade tree species and their management [16,28,33,34,35], shade level [16,36,37], shade tree age and type of coffee clone [38]. Thus, it is crucial to test interactions among CAS components to highlight the specific conditions under which CAS can be viable. As a general rule, moderate levels of shade (<50%) do not compromise coffee productivity, while heavy shade increases vegetative growth reducing flower bud production, which needs photoperiodism changes and a drop in temperature [39,40]. Nevertheless, lower bud production may be offset by an improved flowering process and fruit set [40,41]. Shade can reduce year-to-year variability in yield, namely for arabica coffee, [42]. Coffee leaf chlorophyll concentration can be modified by shade [43,44], and is positively correlated with leaf nitrogen (N) concentration and can influence coffee aroma [45,46]. N plays a key role in photoinhibition, among others, allowing to reduce occurrence of photodamage and to acclimate the coffee shrub to high irradiance conditions [42,47]. N may also improve net carbon assimilation rate (A) under optimal hydric conditions and stomatal conductance to water vapor (gs) by enhancing carbon isotope discrimination [48,49]. Shade may increase gs, although contrasting effects have been found on A [50,51]. In Ecuador, CAS have already been recognized to play a key role in ensuring food and nutrition security, albeit the increase of productivity of CAS remains a challenge [52].
Although the shade impacts on arabica coffee have been widely assessed, there are few papers dealing with these impacts on robusta coffee and the possible interactive mechanisms behind them [38]. It is important to address shade effects on both arabica and robusta coffee separately, owing to differing ecology [53,54,55] and fertilisation requirements [56]. Furthermore, robusta and arabica coffee may not have the same susceptibility to pests and diseases, which might alter the interactive shade-plant health effect on coffee yield [26,57]. Arabica and robusta coffee species do not have the same pollination type [40] nor the same temporal productivity pattern [58], further underlining the relevance of considering the species as an interactive factor with shade. Treating both species together would have created confounding effect given different responses to shade [54,59,60]. Furthermore, applied work on robusta coffee in Amazonian agroforestry systems is almost non-existent [61]. To help to fill this knowledge gap, we evaluated: (a) how different shading methods combined with different crop management packages (weed, fertilisation and plant health management) may impact physiological responses (height, leaf chlorophyll and yield) of robusta coffee shrubs; (b) if there is any correlation between robusta coffee leaf chlorophyll and N concentration; and (c) to identify the best agroforestry practices for maximising coffee yield.
Our study used three species as shade providers: Myroxylon balsamum L. (MB), Erythrina spp. (ES) and Inga edulis Mart. (IE), all Fabaceae. Litterfall and pruning residues of N2-fixing trees might fulfil coffee nutrient requirements [62] by enhancing N mineralization [63] thus benefiting crop nutrition [64,65]. IE is native to Amazonia and provides edible fruit [66,67]. ES, a pantropical legume tree, is widely used as a shelter tree, especially as a green manure [68]. MB is common in tropical forests and could provide a significant income due to its resin being widely used by the pharmaceutical industry [69]. In combination with these shade trees, various cropping systems were assessed, since few authors have tried to link physiological responses of coffee shrubs with both shading management and varying level of farming intensities. Interactions between farming practices (organic and conventional) and shade have been recently reported on coffee morphology [70] and on biogeophysical soil parameters [23], yet these studies dealt exclusively with arabica coffee. Indeed, literature investigating such interactions with robusta coffee is lacking.
We hypothesized that shade could increase robusta coffee growth and leaf chlorophyll concentration, which may be correlated positively with leaf N. Under sub-optimal Amazonian conditions, we hypothesized that robusta coffee yield may not be significantly impacted by shading managements (Figure 1), given that the shade trees were 5 years old and hence provided light shade amount, but rather by cropping systems. We hypothesized that nutrient impacts on physiological responses would be less obvious in plots with higher shade levels, owing to plant growth light-limitation. However, we hypothesized that intensive cropping systems would be associated with increased growth and chlorophyll concentration, especially under shaded conditions given a better nutrient release availability. Furthermore, an association between response variables assessed is expected.

2. Materials and Methods

2.1. Site Description

The experiment was at the INIAP’s Amazonian Central Station (EECA), La Joya de los Sachas, Orellana, Ecuador (00°21′31.2″ S, 76°52′40.1″ W; 250 m. a. s. l.). Soil is classified as an Andic Dystrudept (30% sand, 27% silt, 43% clay) [71] and the climate as Af (tropical rainforest climate) according to the Köppen–Geiger classification [72]. Vegetation is humid, moist forest [73]. Mean annual temperature is 26.5 °C [74] and mean annual rainfall is 3250 mm [75]. Measurements were made from April–June 2020 with a low rainfall period, followed by a high rainfall period (Table 1; Supplementary Materials, Figures S1 and S2).

2.2. Experimental Design

The trial, previously a palm oil plantation, was set up in 2015 in a split-block design with shading system as the main-plot (120 × 36 m) factor and cropping system as the sub-plot (30 × 36 m) factor (n = 3). Coffea canephora ‘Robusta’ NP-3013 and NP-2024 clones were planted in all plots at a distance of 3 × 2.5 m (1333 shrubs ha−1) in 2015. Five shading systems were then applied to the coffee plots and were named as follows: Full-sun (SUN); Timber (TIM); Erythrina (ERY); Guaba (GUA); Timber and Erythrina (TaE). Table 2 gives the main features of each shading system, differing in shade tree species, number of shade tree species, shade tree density, shade amount and pruning regime.
In 2017 and 2018, formative pruning of all shade trees was done. All shading systems except the SUN one also contained Musa spp. AAB (plantain) as temporary shade at 333 plants ha−1 (5 × 6 m spacing) from 2016 to 2018. Therefore, Table 2 shows shading percentages without banana trees.
Shade %, i.e., the quantity of light (W m−2) retained by the shade tree canopy, of the five shading systems was assessed by taking 5 measurements (apex, east, west, north and south) per coffee shrub at 3 m height with a pyranometer Apogee MP-200 under full sunlight conditions. A reference was also taken in full sun next to each coffee shrub. To account for the heterogeneous shade distribution within the plots, zones between shade trees were defined and 3 coffee shrubs per zone were selected (Supplementary Materials, Table S1). Pyranometer measurements were also done at: 900–1030, 1130–1300 and 1400–1530 h. Shade % was thus calculated by taking into account the extent of the different zones encompassing each shading system, the variation of light intensity and sun direction throughout the day. Shade % was calculated with the following formula, for each coffee shrub assessed: shade % = (1 − (average W m−2 under shade/W m−2 in shade-free)) × (100) and this was used to calculate the mean shade percentage per zone. The weighted average shade % of the shading system was estimated for each time slot as:
[((average shade % of zone1) × (net area percentage of zone1)) + ((average shade percentage of zone2) × (net area percentage of zone2)) + … + ((average shade percentage of zone18) × (net area percentage of zone18))] × (100).
Finally, the daily average shade % of the plot was estimated by averaging the weighted average shade % of each time slot.
Four cropping systems were also applied to coffee plots: intensive conventional (IC); moderate conventional (MC); intensive organic (IO) and low organic (LO). In conventional plots, synthetic NPK fertiliser was applied 1–2 times per year, yet MC plots received 30% less NPK inputs than the IC ones (Supplementary Materials, Table S2). In organic plots, organic fertilizer (poultry manure) was applied once a year, yet LO plots received 50% less NPK inputs than the IO ones (Supplementary Materials, Table S2). The fertilizer was applied around the coffee stems in all plots. Only coffee shrubs received fertilizer applications.
Weeds were controlled by means of herbicides, with 7 applications per year in IC plots against 5 in MC plots. Furthermore, mechanical weeding with brush-cutters was done, with respectively 4, 5, 9 and 7 interventions in IC, MC, IO and LO plots (Supplementary Materials, Table S3).
Treatments with systemic and organic fungicides, insecticides and Beauveria sp. were done (Supplementary Materials, Table S4). IC plots received 2 treatments per year with systemic fungicides, 1 with an organic fungicide and 3 with insecticides mainly to control Hypothenemus hampei. MC plots received 1 treatment per year with systemic fungicides, 2 with an organic fungicide and 2 with insecticides. Nevertheless, only an organic fungicide (3 times per year) with Beauveria sp. (twice per year) were applied to IO plots. LO plots did not receive any phytosanitary treatment.
Overall, effects of 20 agroforestry treatments (5 shading systems × 4 cropping systems) on robusta coffee height, fresh yield and leaf chlorophyll concentration were assessed.

2.3. Measurements

Height was measured once in April 2020 manually from the ground to the apical bud of one randomly selected stem per coffee shrub. The height of 18 coffee shrubs per plot was taken according to a systematic sampling scheme, allowing to include the NP-3013 and NP-2024 robusta clones. This composite sampling avoided the impact of the clone on the variables measured in the study. The same coffee stems were used for all other evaluations. Height was chosen as a suitable vegetative growth measure because (i) crown reduction has never been done on coffee shrubs in the whole trial and (ii) it is well responsive to varying levels of shade and nitrogen inputs [77,78].
Total leaf absolute chlorophyll concentration (TLACC), given in μmol m−2, was measured monthly from April to June 2020 with an optical portable chlorophyll meter Apogee MC-100. TLACC measurements were thus in situ and non-destructive. Each coffee stem was divided into 3 equal parts: low, middle and bottom sections. One branch in the middle section was randomly selected, so that 1 branch per selected coffee stem was used. The 4 middle leaves of the selected branch were used for TLACC determination. Two optical measurements per leaf at 1 cm from the main vein and on the middle part of the leaf blade were done. In total, the mean of 8 readings per selected stem from the chlorophyll meter was obtained. Although a significant positive correlation between TLACC and total N concentration (TNC) has already been found [79], we reassessed this correlation, as Apogee MC-100 and SPAD-502 outputs do not follow the same pattern in terms of correlation with TLACC. Thus, 17 TLACC classes ranging from 271 to 780 μmol m−2 were defined and 3 randomly selected leaves falling into each class were destructively sampled. TNC, given in %, was analysed by microkjeldahl digestion with sulphuric acid, distilled with sodium hydroxide and collected with boric acid [80]. TNC extractions were conducted by the EECA Soil, Plant and Water Laboratory, La Joya de los Sachas, Orellana, Ecuador.
Fresh coffee cherry yield (CFY) was assessed monthly from April to June 2020. Prior to harvesting, an extended BBCH-scale describing the phenological stages of Coffea shrubs was used to select the productive coffee stems, i.e., the stems with more than 50% of the fruits (almost) fully ripe, referred to BBCH 85 and 88 growth stages. Coffee fruits of selected stems were then manually harvested and weighted in g. A coffee shrub could have multiple stems.

2.4. Statistical Analysis

Statistical analysis was performed with R v. 4.0.2 [81]. Height, TLACC and CFY results were first assessed for residual normality and homogeneity of variance graphically by respectively using residuals versus fits plots and quantile-quantile plots from the lattice package [82]. Variables were transformed when necessary to respect assumption of homoscedasticity and normality before being analysed with linear mixed-effects models from the lme4 package [83]. Height, TLACC and CFY statistical models were, respectively, the following:
lmer(Height_stem ~ Cropping_system × Shading_system + (1|Clone_type) + (1|Stem_nbr) + (1|Block_nbr/Parcel_nbr), data = df_Height_stem);
lmer(TLACC ~ Month × Cropping_system × Shading_system + (1|Stem_nbr) + (1|Block_nbr/Parcel_nbr), data = df_TLACC); lmer(log_CFY ~ Month × Cropping_system × Shading_system + (1|Stem_nbr) + (1|ID) + (1|Block_nbr/Parcel_nbr), data = df_CFY).
Random factors with estimated variance almost null were not included in the models. For the CFY, the ID of the coffee shrub was included as a random factor, owing to possible dependencies between repeated harvests on the same coffee shrub during the 3-month evaluation. Models with varying number of explanatory variables nested with or without interactions were stepwise assessed by selecting the model with the lowest deviance. Lsmeans package [84] was used to get least-squares means, 95% CIs and treatments contrasts with Tukey’s multiple comparisons adjustment. Correlation between height, TLACC and CFY was assessed and plotted through the chart.Correlation function of the package PerformanceAnalytics [85]. Regression analysis were made to assess relation between TLACC and TNC by using ggpubr package [86]. All figures were plotted with the ggplot2 package [87].

3. Results

3.1. General Results

Cropping system, shading system and month interactively influenced robusta CFY and coffee TLACC (Table 3). Additionally, robusta coffee height was impacted by both cropping system and shading system without any significant interaction.

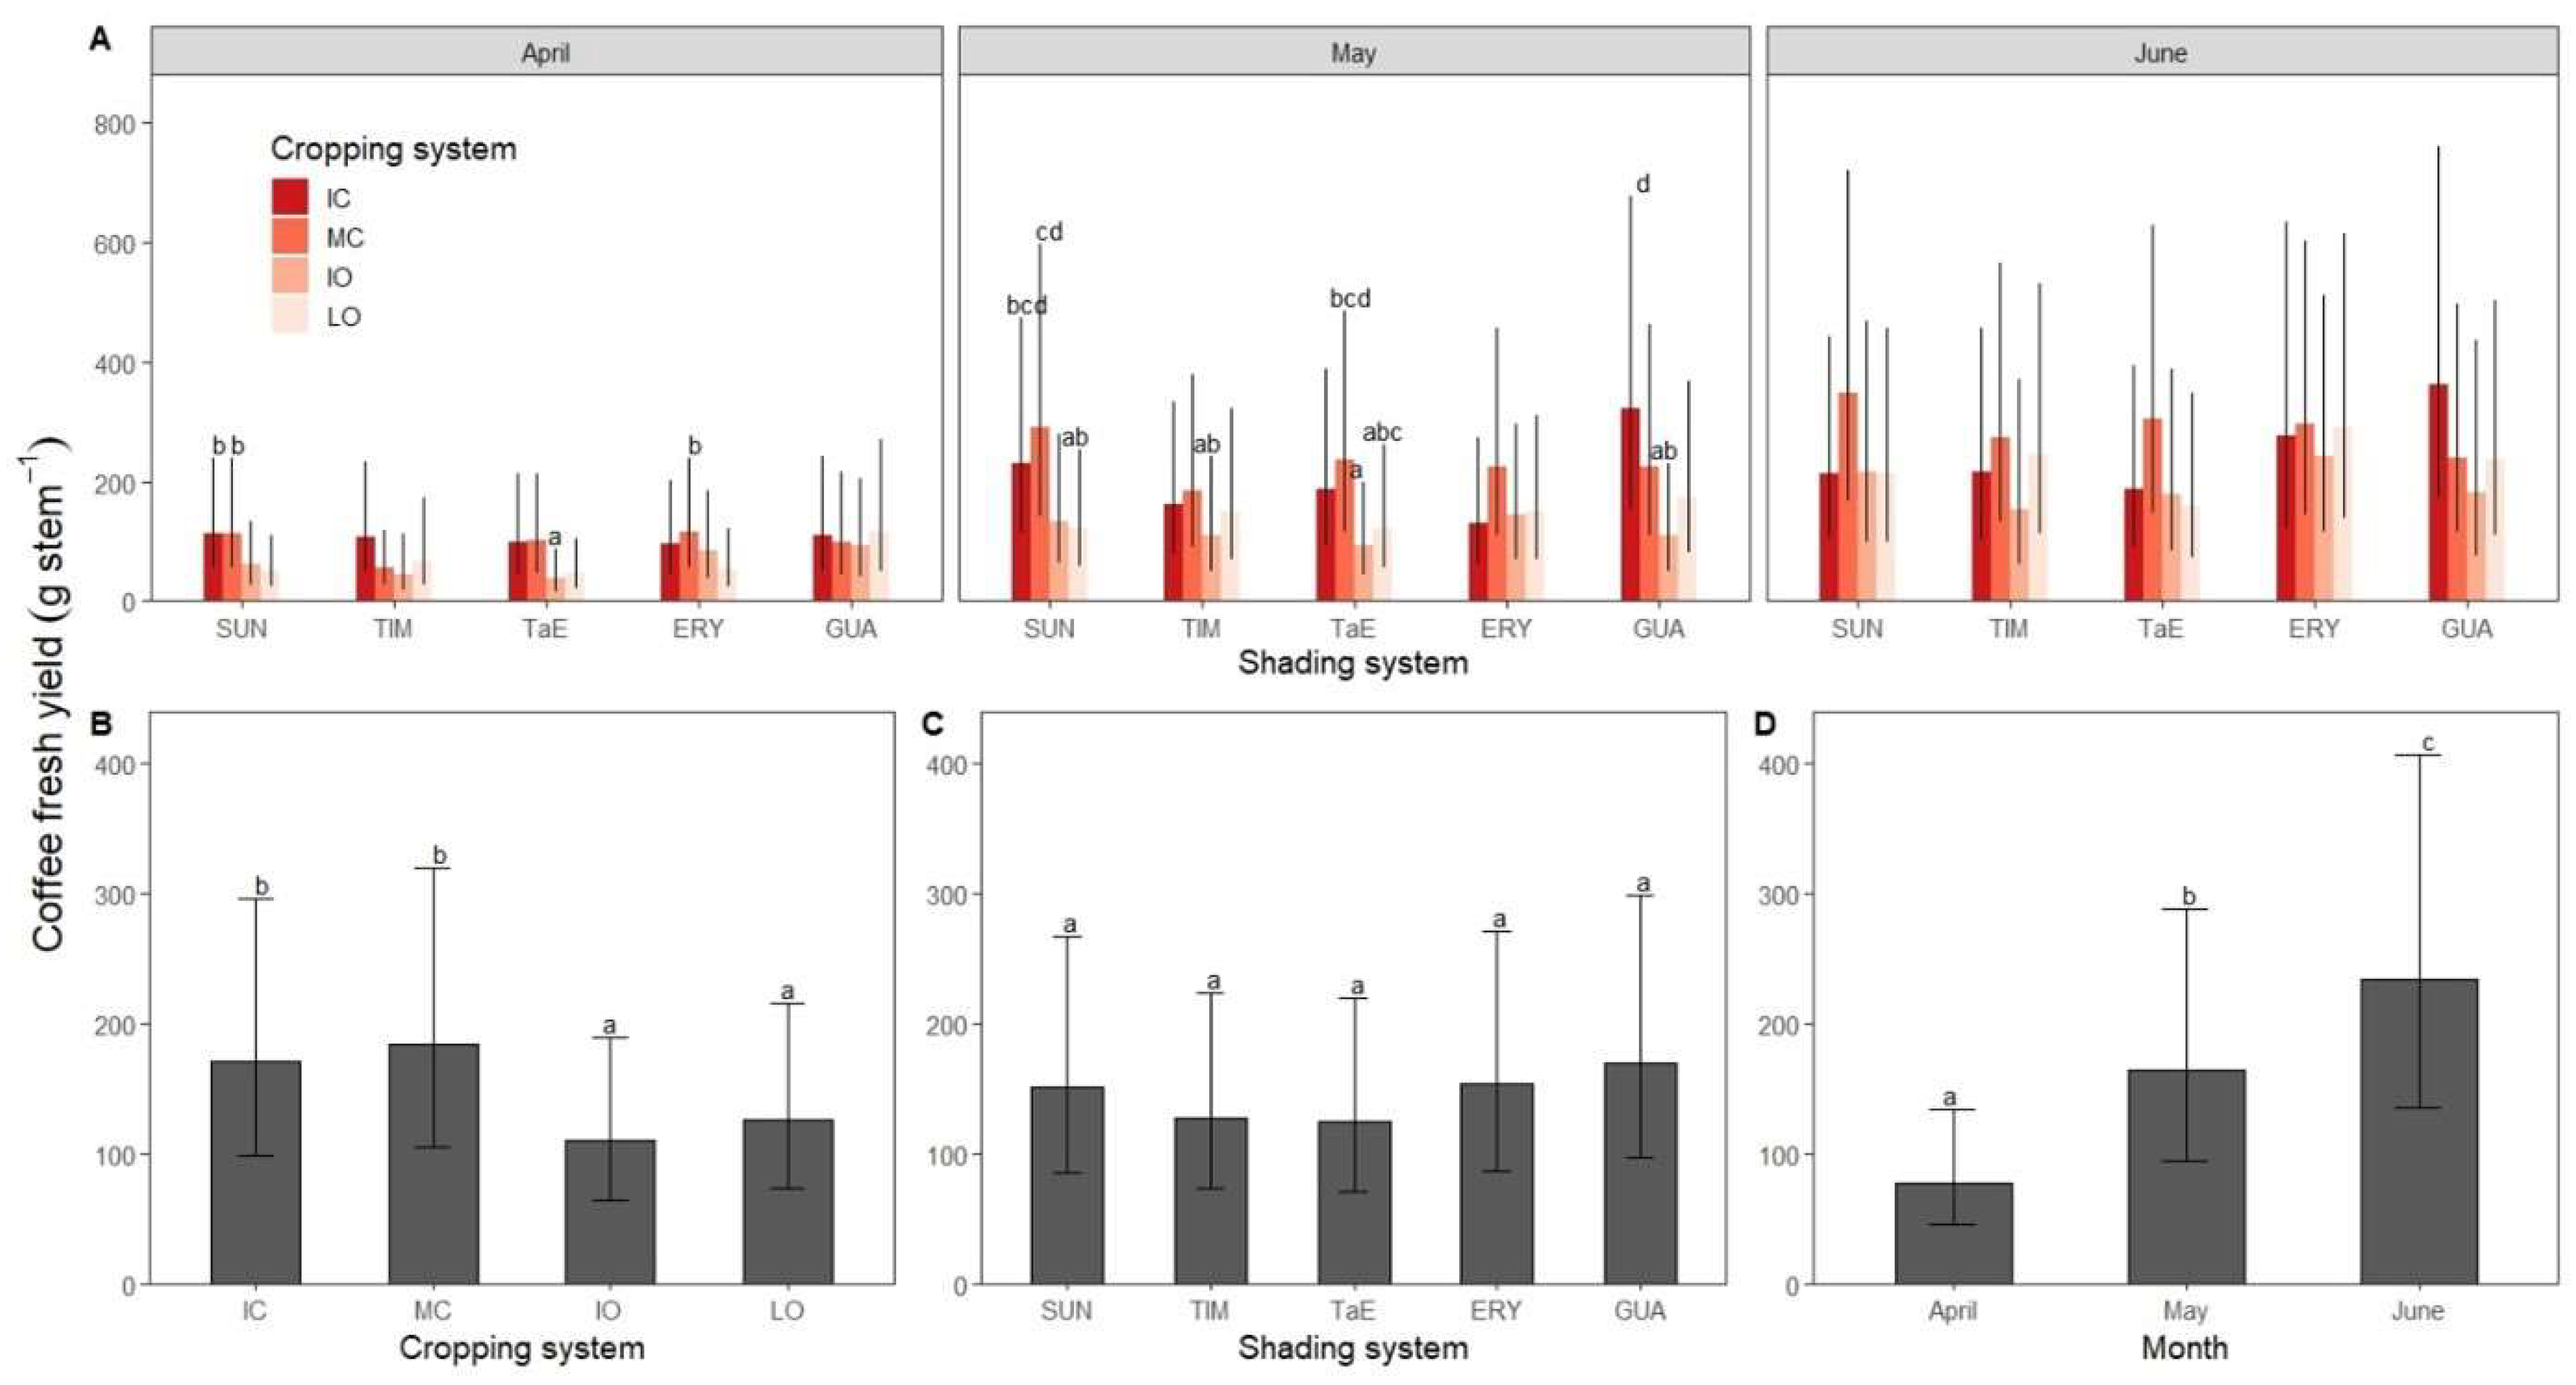
3.2. Coffee Fresh Yield

Different combinations of shading and cropping systems resulted in different fruit maturation patterns and yields. (Figure 2A). The TIM and ERY treatments had higher yields in May and June in the moderate conventional than in the intensive conventional (Table 2). The, TaE treatment had higher yields in the low organic than the high ones in April and May (Figure 2A). Yields in moderate conventional were higher than in intensive conventional plots in both May and June (Figure 2B).
In May, coffee shrubs grown under moderate conventional and full-sun conditions had higher CFY (291 g·stem−1) than organic systems, whether full-sun or shaded (−59% with LO × SUN p < 0.05; −62% with IO × TIM p < 0.05; −68% with IO × TaE p < 0.01; −63% with IO × GUA p < 0.05). However, plots with an I. edulis canopy managed intensively had higher CFY (321 g·stem−1) in May compared with those organically managed, whether without shade trees (−63% p < 0.05), with M. balsamum (−66% p < 0.05) or both M. balsamum and Erythrina spp. (−71% p < 0.01). It is therefore clear that plots without or with shade trees needed intensive management to keep high levels of production. However, plots with a medium level of shade managed intensively did not show a significant decrease in CFY compared to those grown in full-sun conditions (Figure 2A).
As the three-way interactions highlighted for the CFY were significant (p = 0.011) and homogenous among the treatments, it is worth reporting single factor effects which also influenced robusta coffee yield (Table 3). CFY of conventional plots were greater than organic ones with 110, 125, 183 and 170 g stem−1 for IO, LO, MC and IC cropping systems, respectively (Figure 2B). Significant differences in CFY were found between the following cropping systems: IC and IO (p < 0.001); IC and LO (p < 0.05); MC and IO (p < 0.01); MC and LO (p < 0.01). CFY did not differ significantly between shading systems (Figure 2C), however, numerically, GUA (170 g stem−1) and ERY (154 g stem−1) plots yielded more than TaE (125 g stem−1) and TIM (128 g stem−1) ones with the comparison between TaE and GUA being at p = 0.057. CFY per month increased from April to June 2020 (Figure 3D).

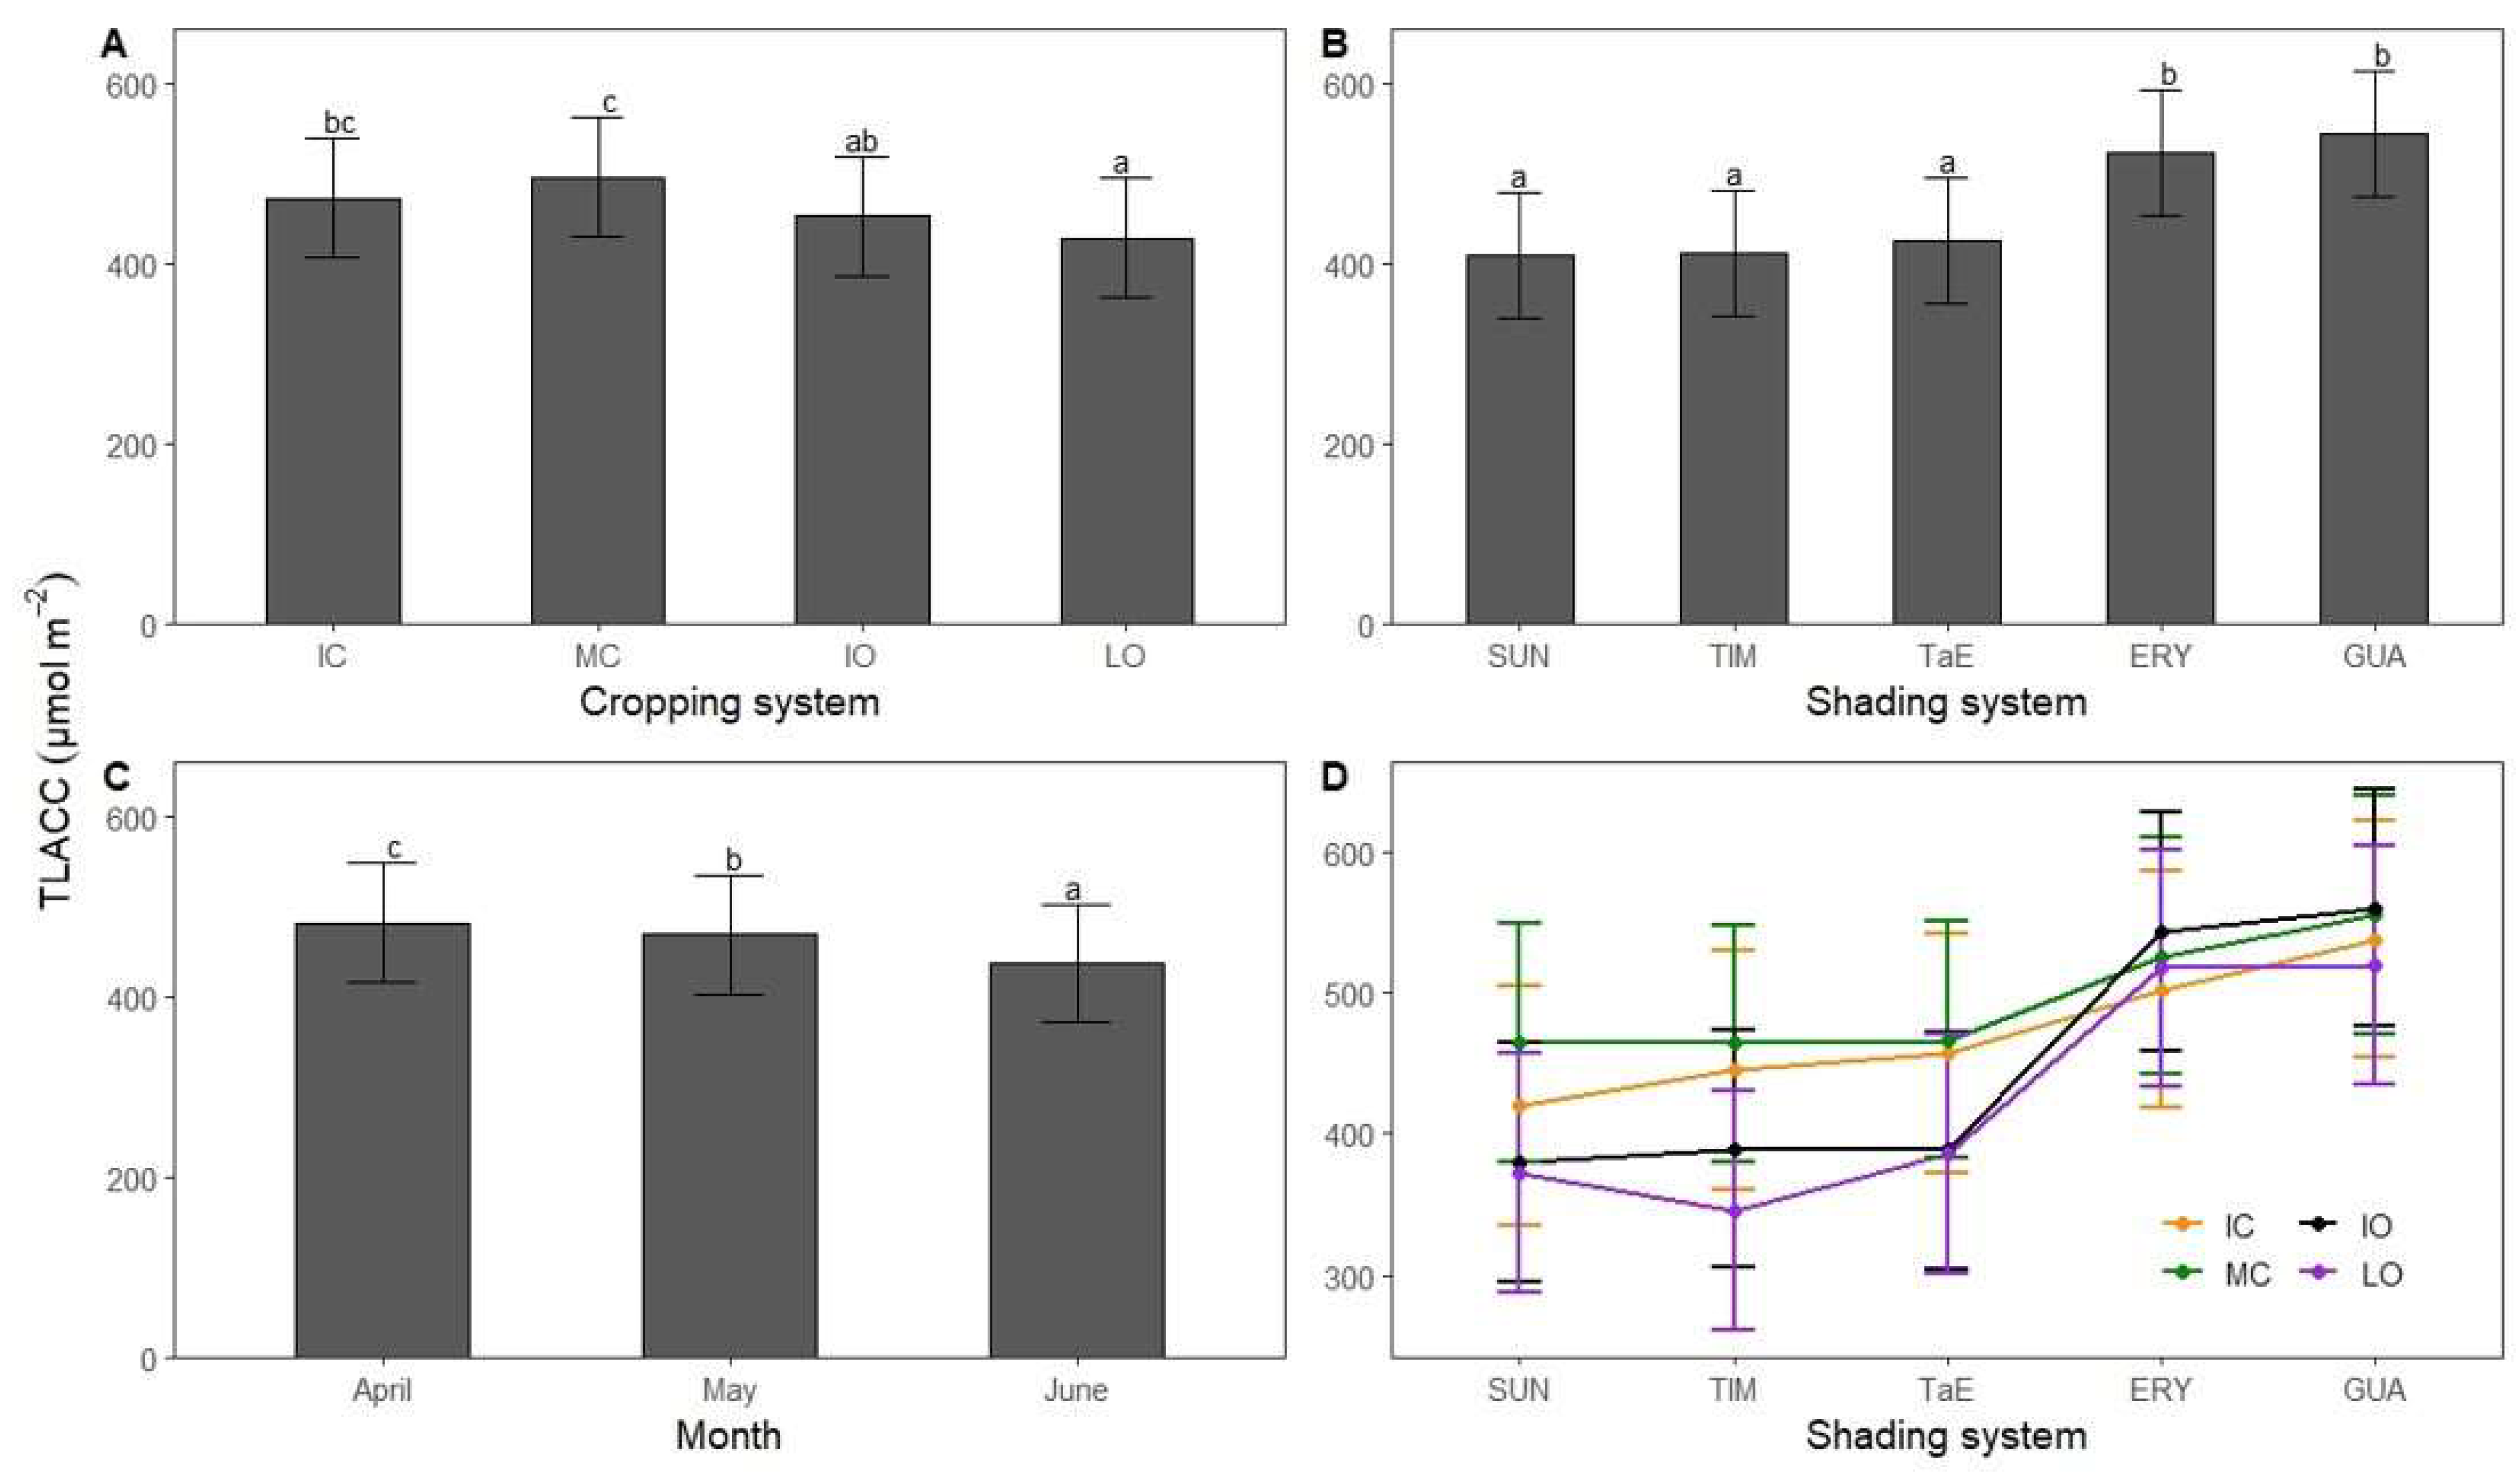
3.3. Total Leaf Absolute Chlorophyll Concentration
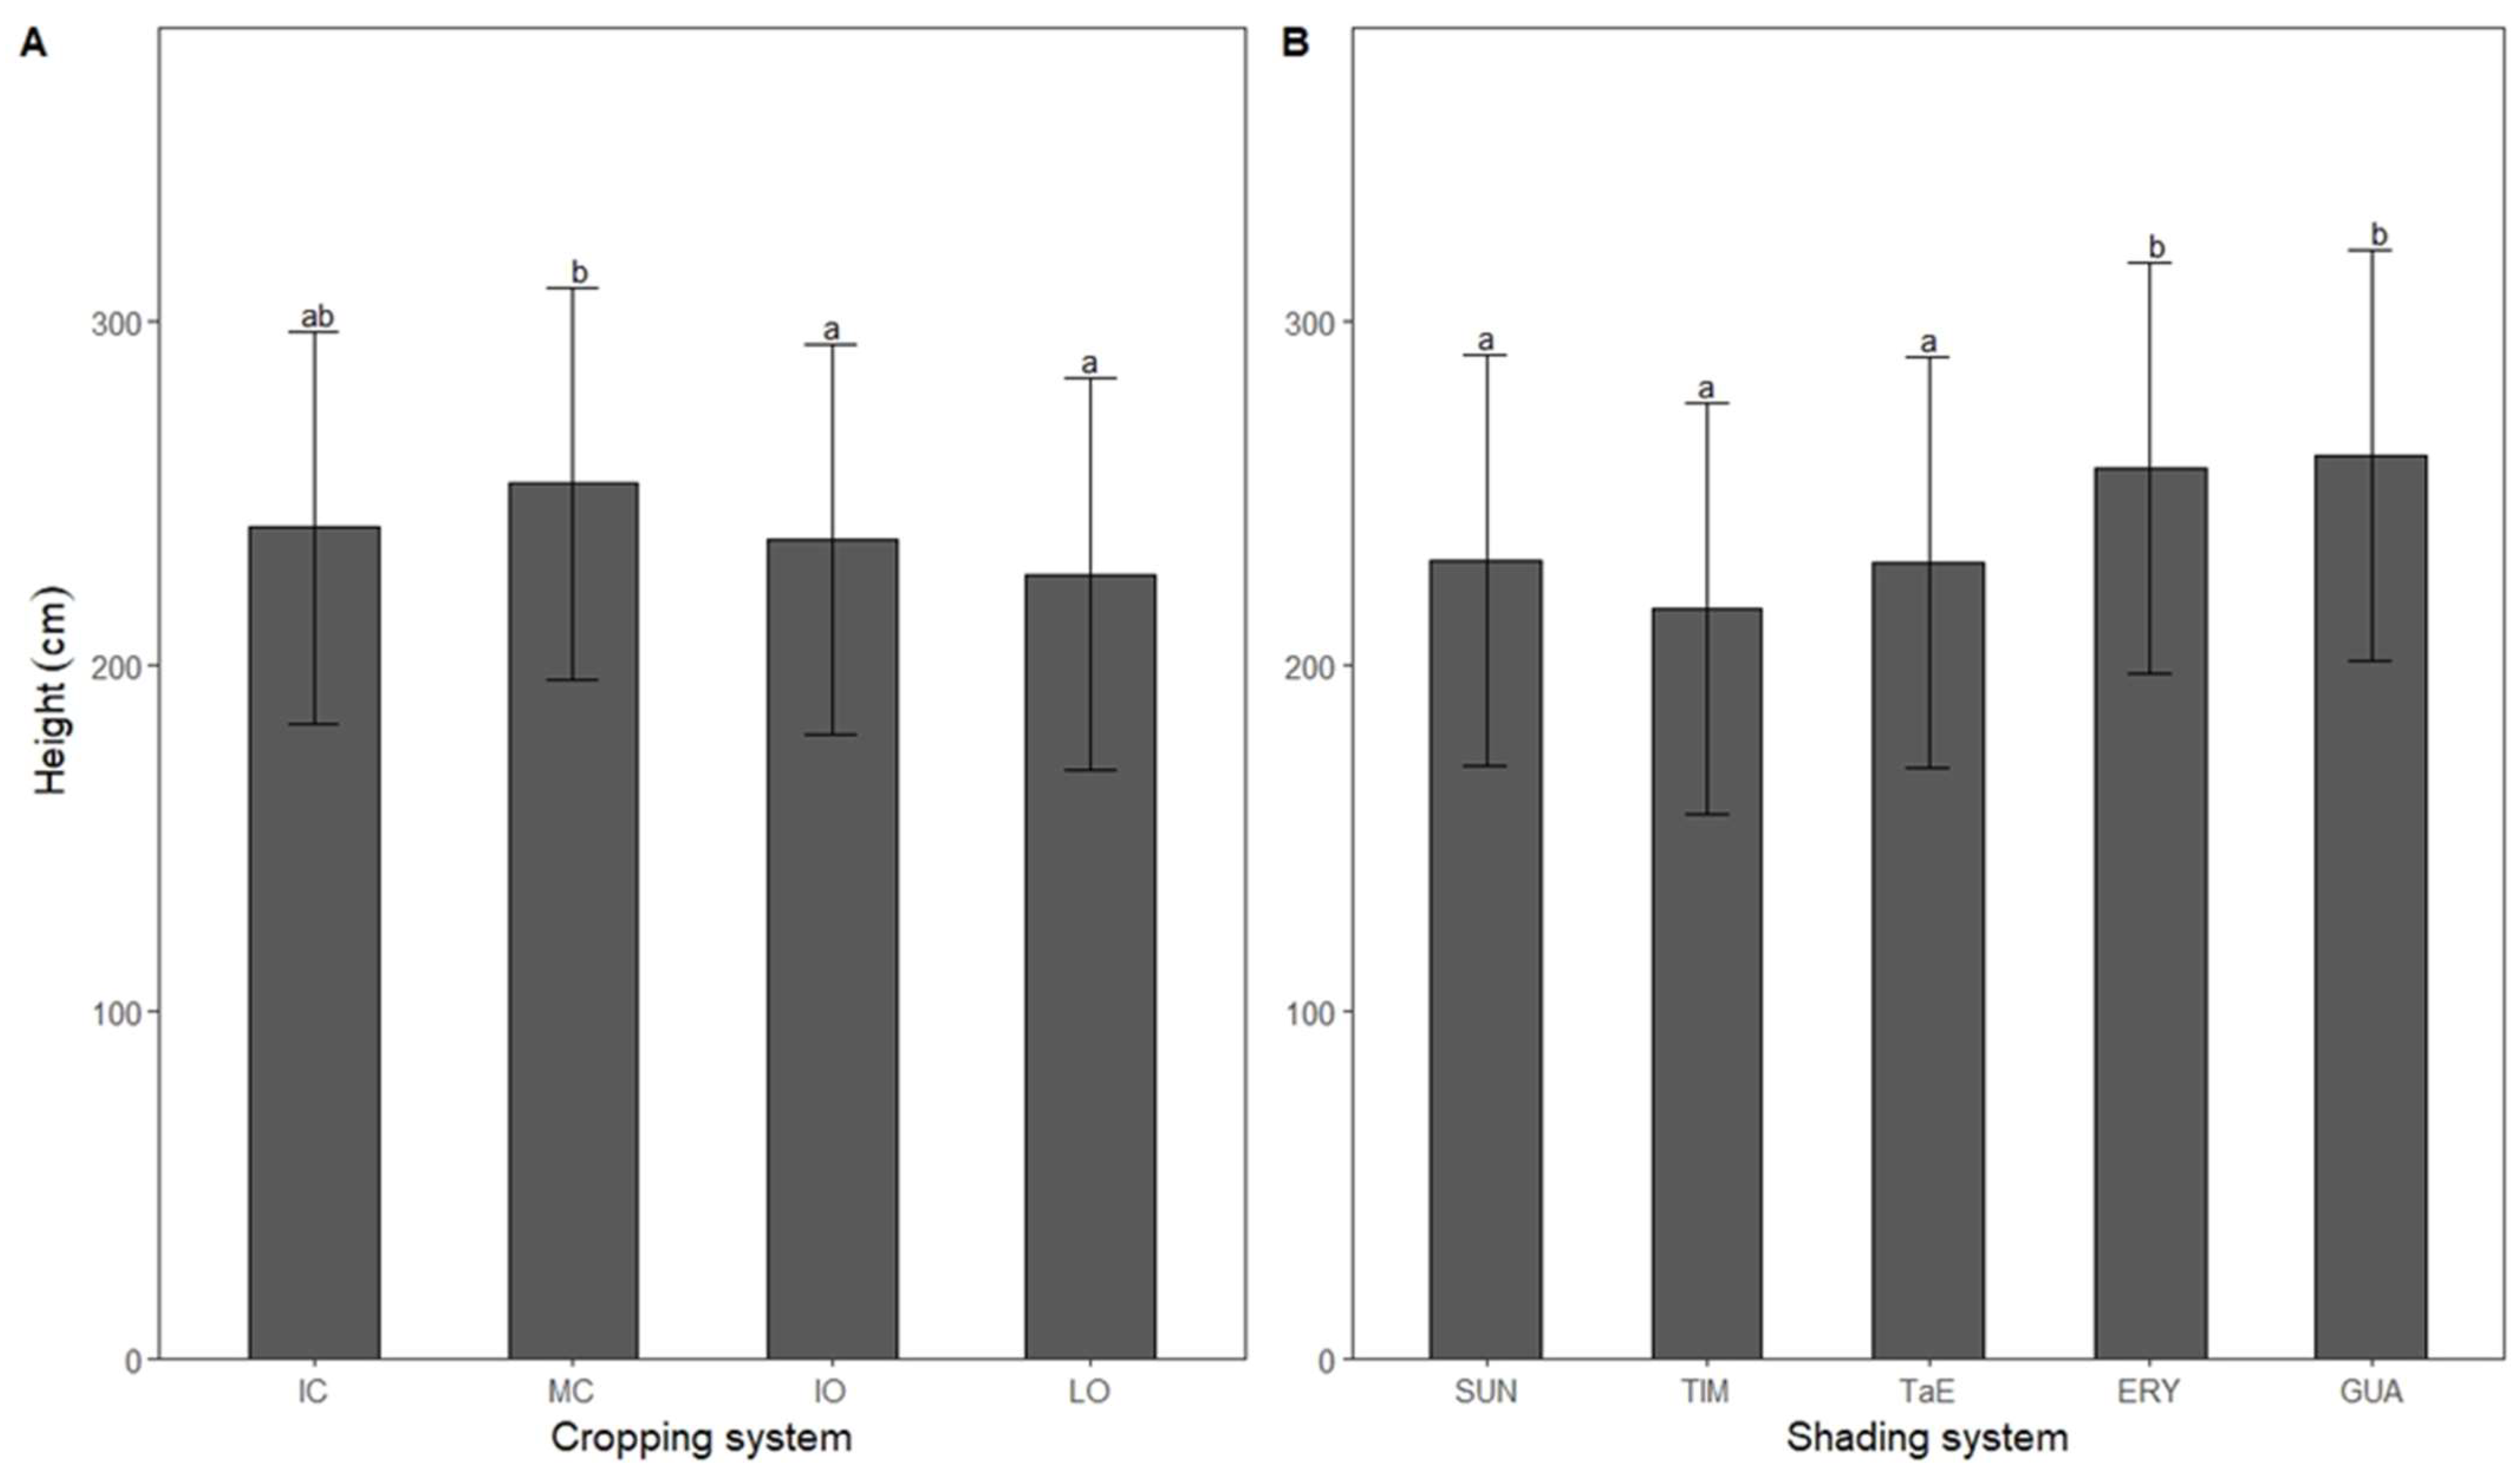
The effect of shading system on robusta coffee TLACC depended on the cropping system (Figure 3). Interactions were more pronounced for SUN, TIM and TaE shading systems than for ERY and GUA ones. Indeed, TLACC in SUN, TIM and TaE shading systems were higher under conventional than under organic cropping systems. However, in ERY and GUA plots, conventional and organic cropping systems showed approximatively the same TLACC. Post-hoc tests show that conventional cropping systems had higher TLACC than organic ones with 428, 452, 472 and 495 μmol m−2 for LO, IO, IC and MC cropping systems, respectively (Figure 4A). Significant differences were found between IC and LO (p < 0.001), MC and either IO or LO (p < 0.001) cropping systems. Shading systems with reduced shade level (Table 2) had lower TLACC than those with moderate shade level with 409, 411, 424, 522 and 543 μmol m−2 for SUN, TIM, TaE, ERY and GUA shading systems, respectively (Figure 4B). Both ERY and GUA shading systems had higher TLACC than SUN, TIM and TaE shading systems (p < 0.001). Contrary to the trend observed for CFY, Figure 4C shows that TLACC gradually decreased from April to June 2020 (p < 0.001).

3.4. Height

Robusta coffee shrubs under moderate conventional conditions (253 cm) were taller than those under either intensive or low organic conditions (−6% p < 0.05). Furthermore, in plots dominated by either I. edulis (261 cm) or Erythrina. spp. (257 cm), coffee shrubs were taller than those without shade shrub (26–30 cm less p < 0.001), with M. balsamum (40–44 cm less p < 0.001) or both M. balsamum and E. spp. (27–31 cm less p < 0.001), as illustrated in Figure 5B.

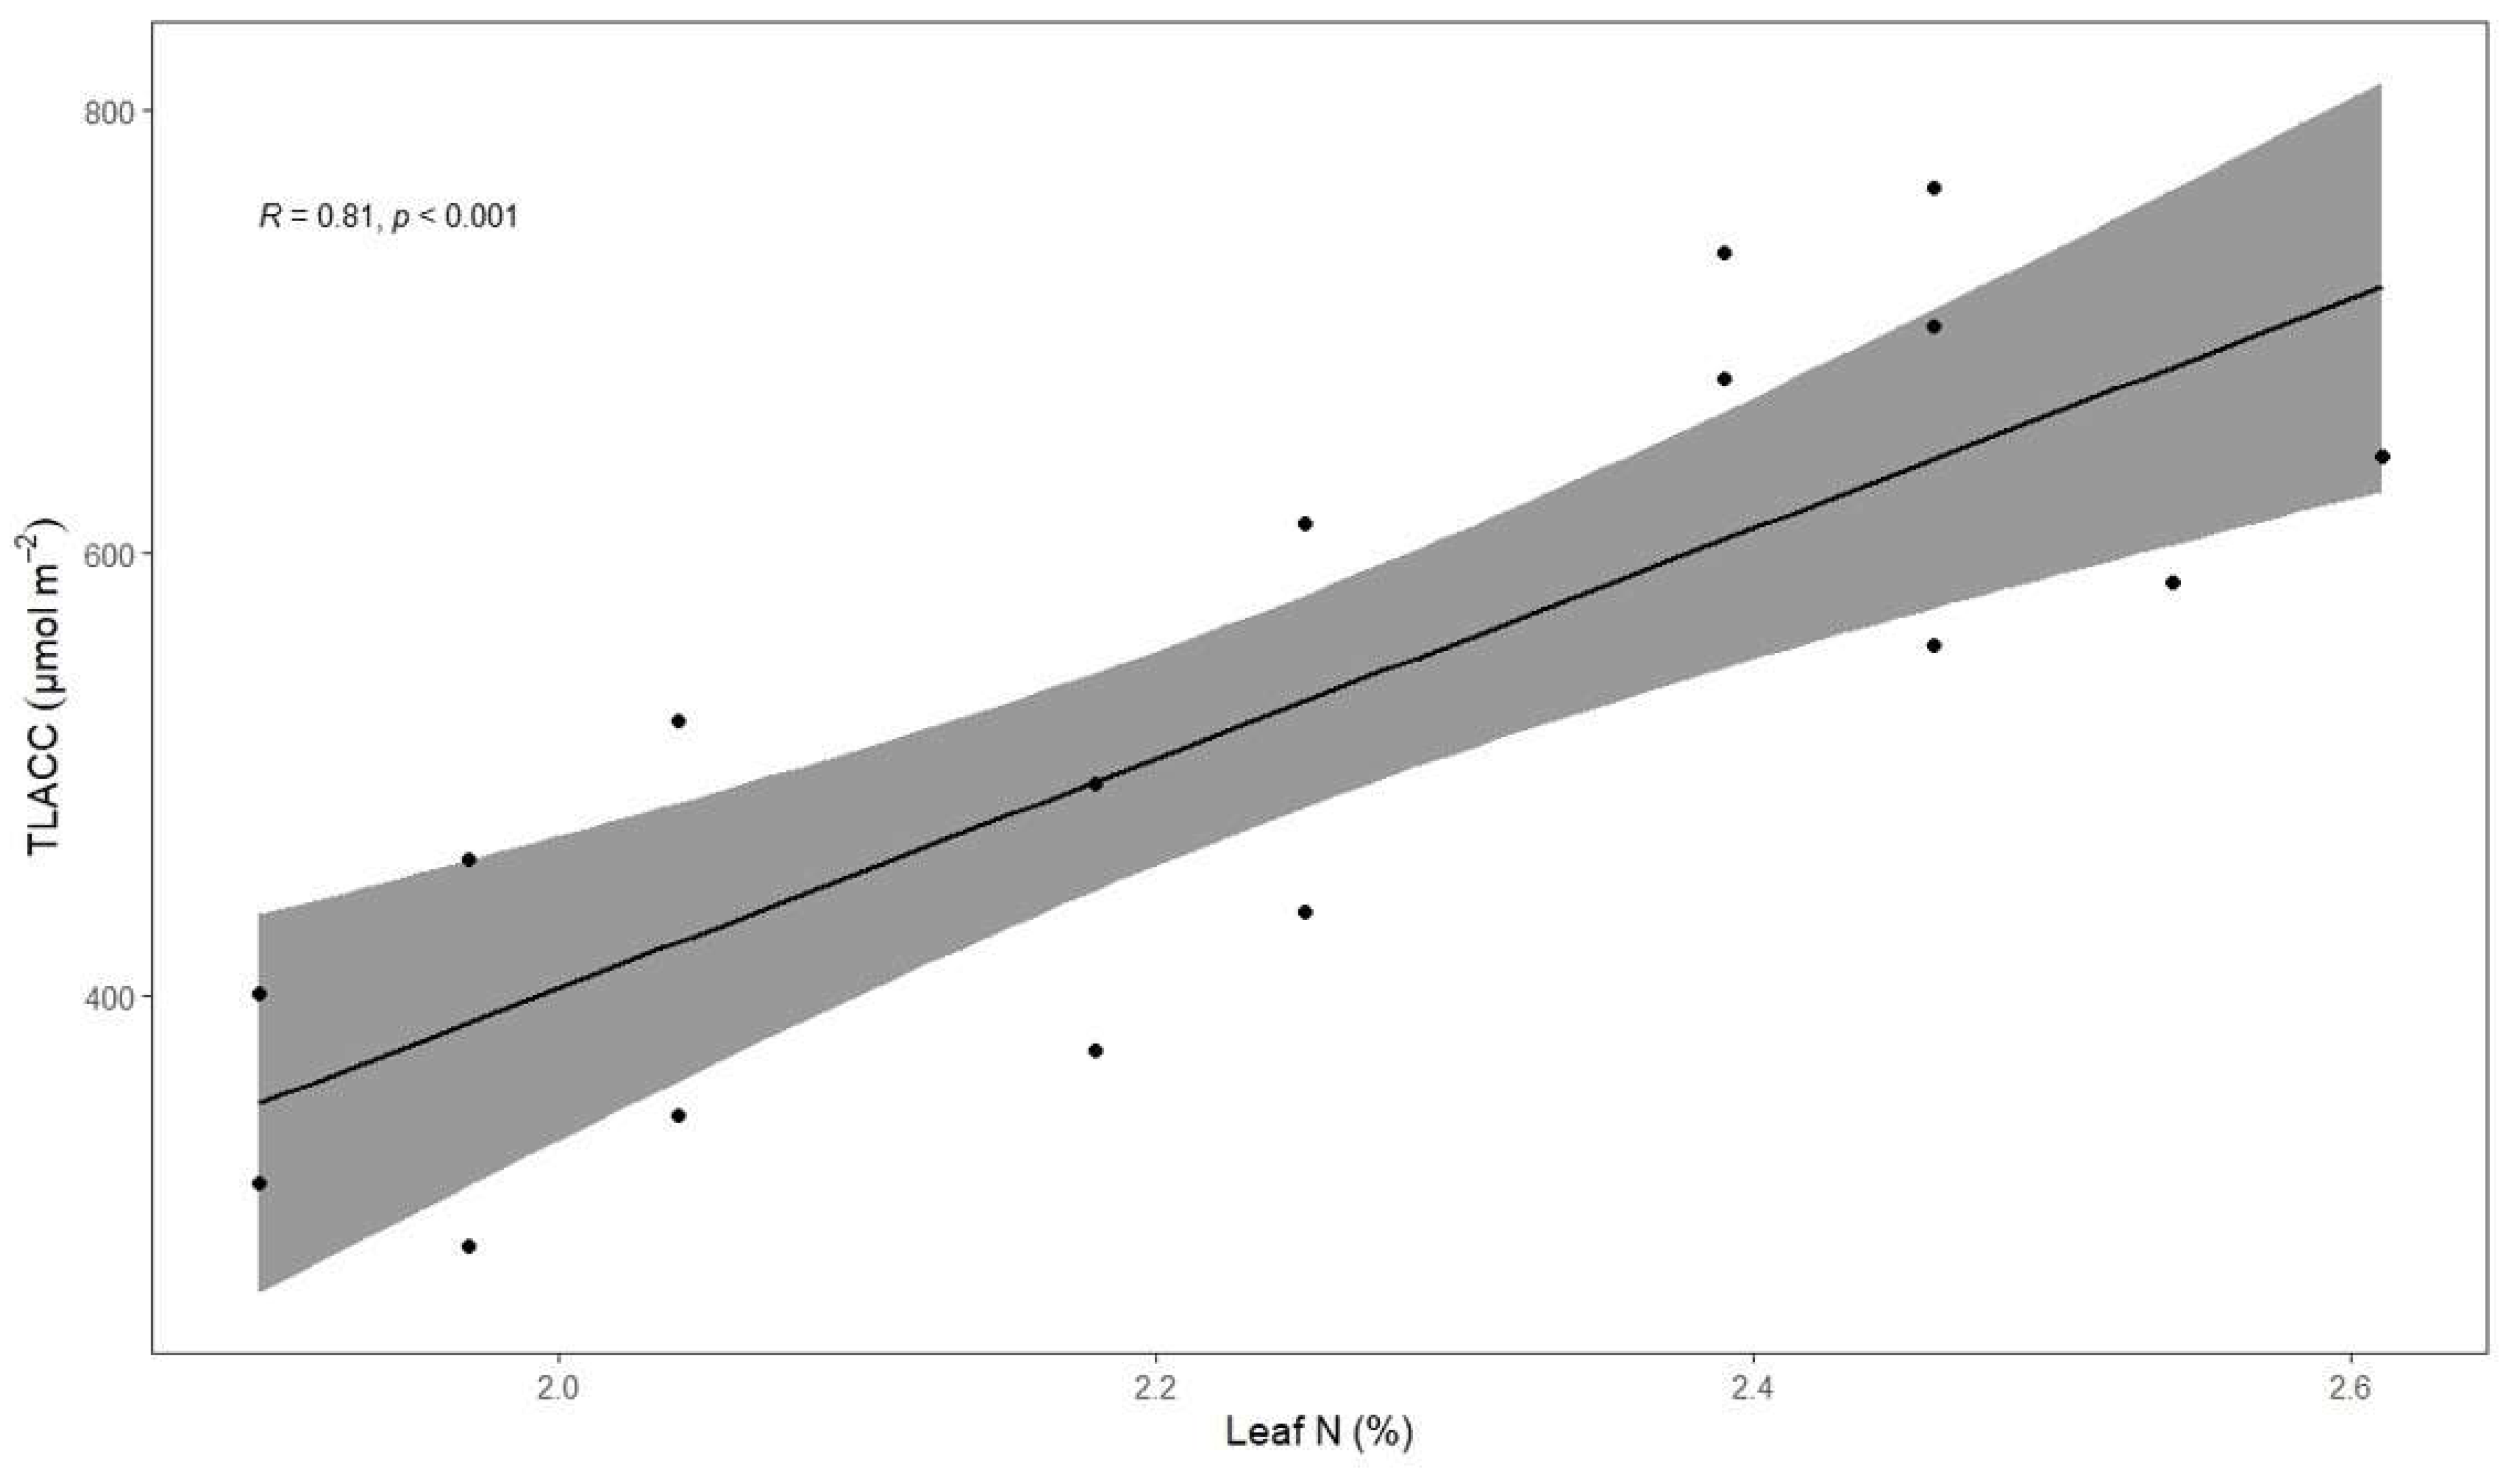
3.5. Associations between Total Leaf Absolute Chlorophyll Concentration, Coffee Fresh Yield, Height and Leaf Total N Concentration

TNC was strongly positively correlated with TLACC (p < 0.001, Figure 6). TLACC was weakly positively correlated with height (p < 0.001), meaning that higher vegetative growth tended to exhibit higher chlorophyll concentration in leaves (Figure 7). However, both TLACC and CFY were not correlated. Therefore, leaf chlorophyll concentration was not correlated with fully ripe cherry yield (BBCH 85 and 88). Additionally, no significant correlation was found between both height and CFY (p < 0.05). Consequently, higher leaf N concentration could not be associated with higher fully ripe cherry yield.

4. Discussion

4.1. Coffee Fresh Yield

Inclusion of shade trees in robusta coffee fields may change fruit-ripening and production patterns, depending on the cropping systems used and the harvest time. High-input cropping systems, i.e., IC and IO, induced earlier and higher yield, most likely because weed, pest and disease pressures were lower. Another explanation would be that increasing weed pressure in low-input systems, regardless of whether organic or conventional, may result in soil water deficit which could fasten cherry maturation [88]. Our results further support that after 3 months of production, robusta CAS, regardless of shade tree used or farming practice, may have the same productivity as robusta coffee grown under full-sun conditions as shade might improve coffee quality, e.g., bean weight [89] by delaying berry ripening by up to 1 month [31] as shade trees might mitigate extreme microclimate variations [90,91]. This finding is in agreement with previous studies [16,27,92]. Nevertheless, considering the production period at an early stage (April or May), robusta coffee grown under either E. spp. trees or both E. spp. and M. balsamum trees produced among the highest CFY, when managed conventionally. Schnabel et al. [70] also encountered a similar trend, albeit with high-input systems as they were most productive where the density of shade trees was higher, possibly inducing higher N demand. Table 3 puts forward a significant distinct effect of the shading system on CFY, although post-hoc tests fail to detect consistent differences among shading systems. Our results show that coffee shrubs with moderate shade level (<30%) provided either by E. spp. or I. edulis may yield more than those in full sun conditions, since full-sun coffee shrubs may suffer from dieback associated with heavy bearing causing a low leaf-to-fruit ratio [93]. During the expansion stage, coffee fruits need high quantities of K and N (up to 95% of total N uptake) and are susceptible to N foliar deficiency in case of heavy bearing [39]. Consequently, N deficiency may impair photosynthesis [49].

4.2. Total Leaf Absolute Chlorophyll Concentration

Robusta coffee TLACC was interactively affected by both shading and cropping systems (Figure 3D). Under light shade or full-sun conditions, TLACC was lower in organic cropping systems than in conventional ones, probably because coffee leaves suffered more from N deficiencies, worsened by heavy bearing. Apparently, the high N requirements were not fulfilled under organic conditions without moderate degree of shading (c. 25%). In our study, we found that N is strongly associated with chlorophyll (Figure 5), which is in agreement with previous studies performed on both arabica coffee and robusta coffee but with a different type of chlorophyll meter [79,94]. Taken all the above into account, TLACC can detect N deficiency. Previous studies have shown that full-sun coffee shrubs had lower N concentrations than shaded ones [89,95], further enhancing the negative effect of organic systems combined with (almost) full-sun conditions on TLACC. Nitrogen deficiency as well as excess light can promote photo-oxidative stress [47], such as H2O2 production causing stomatal closure and cell membrane damage as well as chlorophyll degradation [96]. This highlights the importance to adapt the nitrogen supply to the intensity of light exposure, meaning that robusta full-sun systems may need more nitrogen than shaded ones to dissipate the excess of energy by the production of both xanthophylls and carotenes [97], as well as produce more antioxidant enzymes to detoxify reactive oxygen species [98]. In our study, TLACC of robusta coffee leaves under either Erythrina spp. or I. edulis trees was higher than that under light shade or no shade, as found in other studies [99,100]. As leaf N concentration have been correlated with soil N concentrations across several species [101], it is likely that Erythrina spp. or I. edulis produced notable biomass resulting in high litterfall inputs [102,103] to the soil which may have improved soil fertility, further enhanced by the ability to fix N. Indeed, it has been demonstrated that E. verna can fix much N fixation [104] and E. spp. can decompose and release N quickly in the soil, owing to low polyphenolic concentrations in the leaves [105]. Therefore, the presence of shade trees providing c. 25% shade might have contributed to sustained continuous nutrient release in robusta CAS. We showed that CFY and TLACC had opposite patterns from April to June (Figure 2D and Figure 3C); higher cherry production resulted in lower chlorophyll and thus N leaf concentration (Figure 5). This might be because late coffee fruit development may induce powerful sink effects which can cause N foliage deficiency, as 95% of total N uptake can be allocated to fruits [39,106]. In contrast, Partelli et al. [107] found higher leaf N concentration during fruit maturation stage, owing to higher N inputs applied which may interact with the phenological stage [108]. However, no correlation was found between CFY and TLACC (Figure 6) most likely because only fully ripe cherries of BBCH 85 and 88 coffee shrubs had been harvested. Therefore, the harvests did not reflect the total coffee production, including non-ripe fruits.

4.3. Height

Coffee shrubs were taller when grown under Erythrina spp. or I. edulis shade and this suggested that vegetative growth is more responsive to canopy openness than to competitiveness among aboveground species. Previous investigators found similar results [77,109], even with greater shade percentages, most likely because shade may induce higher light-use efficiency in coffee leaves resulting in increased net primary production [110]. Nevertheless, excessive shade (>70%) may impair plant fitness although this was not the case in our study [26]. Some plants become etiolated under shade [111]. However, results obtained cannot be explained by a concurrent relationship between CFY and height (Figure 5), i.e., reproductive and vegetative development, since no difference was found in yield between shade systems (Figure 2C). Similarly, shade does not affect coffee fruit set [112]. Furthermore, fruiting and leaf production generally do not occur at the same time [58]. Coffee shrubs from MC plots were taller than those from organic plots (Figure 4A) as it is likely that pests and diseases were better controlled there. As the use of pesticides was reduced in MC plots compared to IC plots, it is likely that natural enemies were more active and thus contributed to long-lasting pests and disease control [113].

5. Conclusions

Literature on the physiological responses of robusta coffee in agroforestry systems is lacking. During this three-month period, we showed that robusta coffee under moderate shading (c. 25%) yielded as much as when grown under high light exposure, regardless of the level of intensification. Our work highlighted that shade provided by overstorey trees, such as Erythrina spp. or I. edulis, may stimulate vegetative growth of robusta coffee without compromising yield. We presented strong empirical evidence that leaf N concentration is affected by both shading and by the cropping systems. Nitrogen deficiency in low input-systems, whether organic or not, might be avoided by adding leguminous trees with high biomass production. For the first time, we show that the absolute chlorophyll meter (Apogee MC-100) can be used to monitor robusta coffee leaf N concentration under Amazonian conditions. Our study adds to the body of evidence showing that agroforestry systems can improve performance of robusta coffee under sub-optimal conditions. Further research is needed to corroborate our findings in the long-term as well as to elucidate the mechanisms through which leguminous trees may induce physiological responses in robusta coffee under humid tropical conditions.

Supplementary Materials

The following are available online at https://www.mdpi.com/article/10.3390/life12060807/s1, Figure S1: Mean monthly daily max and min air temperatures (°C), total monthly precipitation (mm) from June 2019 to June 2020 at the EECA weather station in La Joya de los Sachas, Orellana, Ecuador [76]. Figure S2: Mean monthly relative humidity at 7 a.m., 1 p.m. and 7 p.m. (%) from January to June 2020 at the EECA weather station in La Joya de los Sachas, Orellana, Ecuador [76]. Table S1: Defined zones with homogeneous shade, according to distance from coffee shrubs to shelter trees. Table S2: NPK inputs in intensive conventional (IC), moderate conventional (MC), intensive organic (IO) and low organic (LO) cropping systems in 2018 and 2019. Table S3: Number of weeding interventions with concentration of active ingredient in brackets in intensive conventional (IC), moderate conventional (MC), intensive organic (IO) and low organic (LO) cropping systems from 2018 to 2020. Table S4: Number of phytosanitary treatments with systemic fungicides (Sf), organic fungicide (Of), insecticides (In) and Beauveria sp. (Bb) in intensive conventional (IC), moderate conventional (MC), intensive organic (IO) and low organic (LO) cropping systems in 2019 and 2020. Table S5: Total aggregated coffee fresh yield (g), number of coffee stems harvested and aggregated coffee fresh yield per stem (g) from April to June 2020 in 20 agroforestry treatments combining 4 cropping systems (IC = intensive conventional; MC = moderate conventional; IO = intensive organic; LO = low organic) and 5 shading systems (SUN = full sun; TIM = Myroxylon balsamum; TaE = M. balsamum and Erythrina spp.; ERY = E. spp.; GUA = Inga edulis) located in La Joya de los Sachas, Orellana, Ecuador.

Author Contributions

Conceptualization, K.P., C.S., F.L., J.P., D.C. and L.N.; analysis, K.P.; interpretation, K.P. and L.N.; writing—original draft, K.P.; writing—review and editing, K.P., C.S., F.L., J.P., D.C. and L.N.; supervision, L.N. and F.L. All authors have read and agreed to the published version of the manuscript.

Funding

K.P. received support for travel and minor research costs for his MSc work from the BFH/HAFL (Bern University of Applied Sciences, School of Agricultural, Forest and Food Sciences) in Switzerland in 2020.

Institutional Review Board Statement

Not applicable.

Informed Consent Statement

Not applicable.

Data Availability Statement

The data presented in this study are available on request from the corresponding author.

Acknowledgments

The authors are grateful to the staff of INIAP/EECA and HEPIA for its scientific and technical support. We thank two anonymous reviewers as their comments on an earlier version of the paper led to significant improvements.

Conflicts of Interest

The authors declare no conflict of interest.

References

  1. USDA. PSD Data Sets: Coffee. Available online: https://apps.fas.usda.gov/psdonline/app/index.html#/app/downloads (accessed on 5 October 2020).
  2. Waller, J.M.; Bigger, M.; Hillocks, R.J. Coffee Pests, Diseases and Their Management; CABI Pub: Wallingford, UK; Cambridge, MA, USA, 2007; ISBN 1845931297. [Google Scholar]
  3. Fridell, G. Coffee; Polity: Cambridge, UK, 2014; ISBN 9780745670768. [Google Scholar]
  4. Craparo, A.; van Asten, P.; Läderach, P.; Jassogne, L.; Grab, S.W. Coffea arabica yields decline in Tanzania due to climate change: Global implications. Agric. For. Meteorol. 2015, 207, 1–10. [Google Scholar] [CrossRef] [Green Version]
  5. Torres Castillo, N.E.; Melchor-Martínez, E.M.; Ochoa Sierra, J.S.; Ramirez-Mendoza, R.A.; Parra-Saldívar, R.; Iqbal, H.M.N. Impact of climate change and early development of coffee rust—An overview of control strategies to preserve organic cultivars in Mexico. Sci. Total Environ. 2020, 738, 140225. [Google Scholar] [CrossRef] [PubMed]
  6. Jayakumar, M.; Rajavel, M.; Surendran, U.; Gopinath, G.; Ramamoorthy, K. Impact of climate variability on coffee yield in India—with a micro-level case study using long-term coffee yield data of humid tropical Kerala. Clim. Chang. 2017, 145, 335–349. [Google Scholar] [CrossRef]
  7. Pham, Y.; Reardon-Smith, K.; Mushtaq, S.; Cockfield, G. The impact of climate change and variability on coffee production: A systematic review. Clim. Chang. 2019, 156, 609–630. [Google Scholar] [CrossRef]
  8. Lambot, C.; Herrera, J.C.; Bertrand, B.; Sadeghian, S.; Benavides, P.; Gaitán, A. Chapter 2—Cultivating Coffee Quality—Terroir and Agro-Ecosystem. In The Craft and Science of Coffee; Folmer, B., Ed.; Academic Press: Cambridge, MA, USA, 2017; pp. 17–49. ISBN 978-0-12-803520-7. [Google Scholar]
  9. Gomes, L.C.; Bianchi, F.; Cardoso, I.M.; Fernandes, R.; Filho, E.F.; Schulte, R. Agroforestry systems can mitigate the impacts of climate change on coffee production: A spatially explicit assessment in Brazil. Agric. Ecosyst. Environ. 2020, 294, 106858. [Google Scholar] [CrossRef]
  10. Moreira, C.C.; Celestino, D.; Guerra Sobrinho, T.; Cardoso, I.M.; Elliot, S.L. Agroforestry coffee soils increase the insect-suppressive potential offered by entomopathogenic fungi over full-sun soils: A case proposing a “bait survival technique”. Ecol. Evol. 2019, 9, 10777–10787. [Google Scholar] [CrossRef] [PubMed] [Green Version]
  11. Medeiros, H.R.; Grandinete, Y.C.; Manning, P.; Harper, K.A.; Cutler, G.C.; Tyedmers, P.; Righi, C.A.; Ribeiro, M.C. Forest cover enhances natural enemy diversity and biological control services in Brazilian sun coffee plantations. Agron. Sustain. Dev. 2019, 39, 50. [Google Scholar] [CrossRef] [Green Version]
  12. IPBES. Global Assessment Report on Biodiversity and Ecosystem Services of the Intergovernmental Science-Policy Platform on Biodiversity and Ecosystem Services; IPBES secretariat: Bonn, Germany, 2019. [Google Scholar]
  13. Food and Agriculture Organization of the United Nations. FAOSTAT: Crops. Available online: http://www.fao.org/faostat/en/#data/QC (accessed on 22 July 2020).
  14. Nieto, C.; Caicedo, C.E.V. Análisis Reflexivo Sobre el Desarrollo Agropecuario Sostenible en la Amazonia Ecuatoriana. Publicación Miscelánea, 405. INIAP: Joya de los Sachas, Ecuador, 118 p. Available online: http://repositorio.iniap.gob.ec/handle/41000/3791 (accessed on 22 July 2020).
  15. Alves, V.; Goulart, F.F.; Jacobson, T.K.B.; Filho, R.J.D.M.; Ribas, C.E.D.C. Shade’s Benefit: Coffee Production under Shade and Full Sun. JAS 2016, 8, 11. [Google Scholar] [CrossRef]
  16. Rigal, C.; Xu, J.; Hu, G.; Qiu, M.; Vaast, P. Coffee production during the transition period from monoculture to agroforestry systems in near optimal growing conditions, in Yunnan Province. Agric. Syst. 2020, 177, 102696. [Google Scholar] [CrossRef]
  17. Jha, S.; Bacon, C.M.; Philpott, S.M.; Ernesto Méndez, V.; Läderach, P.; Rice, R.A. Shade Coffee: Update on a Disappearing Refuge for Biodiversity. Bioscience 2014, 64, 416–428. [Google Scholar] [CrossRef] [Green Version]
  18. Lin, B.B. The role of agroforestry in reducing water loss through soil evaporation and crop transpiration in coffee agroecosystems. Agric. For. Meteorol. 2010, 150, 510–518. [Google Scholar] [CrossRef]
  19. The Intergovernmental Panel on Climate Change. An IPCC Special Report on Climate Change, Desertification, Land Degradation, Sustainable Land Management, Food Security, and Greenhouse Gas Fluxes in Terrestrial Ecosystems. Available online: https://www.ipcc.ch/srccl/ (accessed on 23 July 2020).
  20. Jaramillo, J.; Setamou, M.; Muchugu, E.; Chabi-Olaye, A.; Jaramillo, A.; Mukabana, J.; Maina, J.; Gathara, S.; Borgemeister, C. Climate change or urbanization? Impacts on a traditional coffee production system in East Africa over the last 80 years. PLoS ONE 2013, 8, e51815. [Google Scholar] [CrossRef] [PubMed] [Green Version]
  21. Ehrenbergerová, L.; Cienciala, E.; Kučera, A.; Guy, L.; Habrová, H. Carbon stock in agroforestry coffee plantations with different shade trees in Villa Rica, Peru. Agrofor. Syst. 2016, 90, 433–445. [Google Scholar] [CrossRef]
  22. Buchanan, S.; Isaac, M.E.; van den Meersche, K.; Martin, A.R. Functional traits of coffee along a shade and fertility gradient in coffee agroforestry systems. Agrofor. Syst. 2019, 93, 1261–1273. [Google Scholar] [CrossRef]
  23. Sauvadet, M.; van den Meersche, K.; Allinne, C.; Gay, F.; de Melo Virginio Filho, E.; Chauvat, M.; Becquer, T.; Tixier, P.; Harmand, J.-M. Shade trees have higher impact on soil nutrient availability and food web in organic than conventional coffee agroforestry. Sci. Total Environ. 2019, 649, 1065–1074. [Google Scholar] [CrossRef] [PubMed]
  24. Muñoz-Villers, L.E.; Geris, J.; Alvarado-Barrientos, M.S.; Holwerda, F.; Dawson, T. Coffee and shade trees show complementary use of soil water in a traditional agroforestry ecosystem. Hydrol. Earth Syst. Sci. 2020, 24, 1649–1668. [Google Scholar] [CrossRef] [Green Version]
  25. Alvarez-Alvarez, E.A.; Almazán-Núñez, R.C.; González-García, F.; Brito-Millán, M.; Méndez-Bahena, A.; García-Ibáñez, S. Shade coffee plantations maintain woody plant diversity and structure in a cloud forest landscape of southern Mexico. J. For. Res. 2020, 32, 637–648. [Google Scholar] [CrossRef]
  26. Durand-Bessart, C.; Tixier, P.; Quinteros, A.; Andreotti, F.; Rapidel, B.; Tauvel, C.; Allinne, C. Analysis of interactions amongst shade trees, coffee foliar diseases and coffee yield in multistrata agroforestry systems. Crop Prot. 2020, 133, 105137. [Google Scholar] [CrossRef]
  27. Jezeer, R.E.; Santos, M.J.; Verweij, P.A.; Boot, R.G.; Clough, Y. Benefits for multiple ecosystem services in Peruvian coffee agroforestry systems without reducing yield. Ecosyst. Serv. 2019, 40, 101033. [Google Scholar] [CrossRef]
  28. Avelino, J.; Vílchez, S.; Segura-Escobar, M.B.; Brenes-Loaiza, M.A.; Virginio Filho, E.d.M.; Casanoves, F. Shade tree Chloroleucon eurycyclum promotes coffee leaf rust by reducing uredospore wash-off by rain. Crop Prot. 2020, 129, 105038. [Google Scholar] [CrossRef]
  29. Haggar, J.; Barrios, M.; Bolaños, M.; Merlo, M.; Moraga, P.; Munguia, R.; Ponce, A.; Romero, S.; Soto, G.; Staver, C.; et al. Coffee agroecosystem performance under full sun, shade, conventional and organic management regimes in Central America. Agrofor. Syst. 2011, 82, 285–301. [Google Scholar] [CrossRef]
  30. Bosselmann, A.S.; Dons, K.; Oberthur, T.; Olsen, C.S.; Ræbild, A.; Usma, H. The influence of shade trees on coffee quality in small holder coffee agroforestry systems in Southern Colombia. Agric. Ecosyst. Environ. 2009, 129, 253–260. [Google Scholar] [CrossRef]
  31. Vaast, P.; Bertrand, B.; Perriot, J.-J.; Guyot, B.; Génard, M. Fruit thinning and shade improve bean characteristics and beverage quality of coffee (Coffea arabica L.) under optimal conditions. J. Sci. Food Agric. 2006, 86, 197–204. [Google Scholar] [CrossRef]
  32. Sarmiento-Soler, A.; Vaast, P.; Hoffmann, M.P.; Jassogne, L.; van Asten, P.; Graefe, S.; Rötter, R.P. Effect of cropping system, shade cover and altitudinal gradient on coffee yield components at Mt. Elgon, Uganda. Agric. Ecosyst. Environ. 2020, 295, 106887. [Google Scholar] [CrossRef]
  33. Siles, P.; Harmand, J.-M.; Vaast, P. Effects of Inga densiflora on the microclimate of coffee (Coffea arabica L.) and overall biomass under optimal growing conditions in Costa Rica. Agrofor. Syst. 2010, 78, 269–286. [Google Scholar] [CrossRef]
  34. Piato, K.; Subía, C.; Pico, J.; Calderón, D.; Norgrove, L.; Lefort, F. Organic Farming Practices and Shade Trees Reduce Pest Infestations in Robusta Coffee Systems in Amazonia. Life 2021, 11, 413. [Google Scholar] [CrossRef]
  35. Boreux, V.; Vaast, P.; Madappa, L.P.; Cheppudira, K.G.; Garcia, C.; Ghazoul, J. Agroforestry coffee production increased by native shade trees, irrigation, and liming. Agron. Sustain. Dev. 2016, 36, 42. [Google Scholar] [CrossRef] [Green Version]
  36. Moreira, S.L.; Pires, C.V.; Marcatti, G.E.; Santos, R.H.; Imbuzeiro, H.M.; Fernandes, R.B. Intercropping of coffee with the palm tree, macauba, can mitigate climate change effects. Agric. For. Meteorol. 2018, 256, 379–390. [Google Scholar] [CrossRef]
  37. Staver, C.; Guharay, F.; Monterroso, D.; Muschler, R.G. Designing pest-suppressive multistrata perennial crop systems: Shade-grown coffee in Central America. Agrofor. Syst. 2001, 53, 151–170. [Google Scholar] [CrossRef]
  38. Piato, K.; Lefort, F.; Subía, C.; Caicedo, C.; Calderón, D.; Pico, J.; Norgrove, L. Effects of shade trees on robusta coffee growth, yield and quality. A meta-analysis. Agron. Sustain. Dev. 2020, 40, 1–13. [Google Scholar] [CrossRef]
  39. Cannell, M.G.R. Physiology of the Coffee Crop. In Coffee: Botany, Biochemistry and Production of Beans and Beverage; Clifford, M.N., Willson, K.C., Clifford, M.N., Willson, K.C., Eds.; Springer: Boston, MA, USA, 1985; pp. 108–134. ISBN 978-1-4615-6657-1. [Google Scholar]
  40. Wintgens, J.N. The Coffee Plant. In Coffee: Growing, Processing, Sustainable Production: A Guidebook for Growers, Processors, Traders and Researchers; Wintgens, J.N., Ed.; Wiley-VCH: Weinheim, Germany, 2008; pp. 1–24. ISBN 9783527619627. [Google Scholar]
  41. Prado, S.G.; Collazo, J.A.; Irwin, R.E. Resurgence of specialized shade coffee cultivation: Effects on pollination services and quality of coffee production. Agric. Ecosyst. Environ. 2018, 265, 567–575. [Google Scholar] [CrossRef]
  42. Damatta, F.M. Ecophysiological constraints on the production of shaded and unshaded coffee: A review. Field Crops Res. 2004, 86, 99–114. [Google Scholar] [CrossRef]
  43. Araujo, A.V.; Partelli, F.L.; Oliosi, G.; Pezzopane, J.R.M. Microclimate, development and productivity of robusta coffee shaded by rubber trees and at full sun. Rev. Ciênc. Agron. 2016, 47, 700–709. [Google Scholar] [CrossRef] [Green Version]
  44. Partelli, F.L.; Araujo, A.V.; Vieira, H.D.; Machado Dias, J.R.; de Menezes, T.; Fernando, L.; Ramalho, J.C. Microclimate and development of ‘Conilon’ coffee intercropped with rubber trees. Pesqui. Agropecuária Bras. 2014, 49, 872–881. [Google Scholar] [CrossRef] [Green Version]
  45. Reis, A.R.; Favarin, J.L.; Malavolta, E.; Júnior, J.L.; Moraes, M.F. Photosynthesis, Chlorophylls, and SPAD Readings in Coffee Leaves in Relation to Nitrogen Supply. Commun. Soil Sci. Plant Anal. 2009, 40, 1512–1528. [Google Scholar] [CrossRef]
  46. Cheng, B.; Smyth, H.E.; Furtado, A.; Henry, R.J. Slower development of lower canopy beans produces better coffee. J. Exp. Bot. 2020, 71, 4201–4214. [Google Scholar] [CrossRef] [PubMed]
  47. Pompelli, M.F.; Martins, S.C.V.; Antunes, W.C.; Chaves, A.R.M.; Damatta, F.M. Photosynthesis and photoprotection in coffee leaves is affected by nitrogen and light availabilities in winter conditions. J. Plant Physiol. 2010, 167, 1052–1060. [Google Scholar] [CrossRef]
  48. Gutierrez, M.V.; Meinzer, F.C. Carbon Isotope Discrimination and Photosynthetic Gas Exchange in Coffee Hedgerows during Canopy Development. Funct. Plant Biol. 1994, 21, 207–219. [Google Scholar] [CrossRef]
  49. Damatta, F.M.; Loos, R.A.; Silva, E.A.; Loureiro, M.E. Limitations to photosynthesis in Coffea canephora as a result of nitrogen and water availability. J. Plant Physiol. 2002, 159, 975–981. [Google Scholar] [CrossRef]
  50. Franck, N.; Vaast, P. Limitation of coffee leaf photosynthesis by stomatal conductance and light availability under different shade levels. Trees 2009, 23, 761–769. [Google Scholar] [CrossRef]
  51. Fahl, J.I.; Carelli, M.L.C.; Vega, J.; Magalhães, A.C. Nitrogen and irradiance levels affecting net photosynthesis and growth of young coffee plants (Coffea arabica L.). J. Hortic. Sci. 1994, 69, 161–169. [Google Scholar] [CrossRef]
  52. Ponce Vaca, L.A.; Acuna Velazquez, I.R.; Proano Ponce, W.P.; Oreliana Suarez, K.D. The coffee agroforestry system. Its importance for the agro-alimentary and nutritional security in Ecuador. Rev. Cuba. De Cienc. For. 2018, 6, 116–129. [Google Scholar]
  53. Davis, A.; Govaerts, R.; Bridson, D.; Stoffelen, P. An annotated taxonomic conspectus of the genus Coffea (Rubiaceae). Bot. J. Linn. Soc. 2006, 152, 465–512. [Google Scholar] [CrossRef] [Green Version]
  54. Nesper, M.; Kueffer, C.; Krishnan, S.; Kushalappa, C.G.; Ghazoul, J. Shade tree diversity enhances coffee production and quality in agroforestry systems in the Western Ghats. Agric. Ecosyst. Environ. 2017, 247, 172–181. [Google Scholar] [CrossRef]
  55. Tumwebaze, S.B.; Byakagaba, P. Soil organic carbon stocks under coffee agroforestry systems and coffee monoculture in Uganda. Agric. Ecosyst. Environ. 2016, 216, 188–193. [Google Scholar] [CrossRef]
  56. Ferwerda, F.P. Coffee Breeding in Java. Econ. Bot. 1948, 2, 258–272. [Google Scholar] [CrossRef]
  57. Mariño, Y.A.; Vega, V.J.; García, J.M.; Rodrigues, V.; García, N.M.; Bayman, P. The Coffee Berry Borer (Coleoptera: Curculionidae) in Puerto Rico: Distribution, infestation, and population per fruit. J. Insect. Sci. 2017, 17, 1–8. [Google Scholar] [CrossRef] [Green Version]
  58. Damatta, F.M.; Ronchi, C.P.; Maestri, M.; Barros, R.S. Ecophysiology of coffee growth and production. Braz. J. Plant Physiol. 2007, 19, 485–510. [Google Scholar] [CrossRef] [Green Version]
  59. Beer, J.; Muschler, R.; Kass, D.; Somarriba, E. Shade management in coffee and cacao plantations. Agrofor. Syst. 1997, 38, 139–164. [Google Scholar] [CrossRef]
  60. Cerda, R.; Allinne, C.; Gary, C.; Tixier, P.; Harvey, C.A.; Krolczyk, L.; Mathiot, C.; Clément, E.; Aubertot, J.-N.; Avelino, J. Effects of shade, altitude and management on multiple ecosystem services in coffee agroecosystems. Eur. J. Agron. 2017, 82, 308–319. [Google Scholar] [CrossRef]
  61. Ehrenbergerova, L.; Senfeldr, M.; Habrova, H. Impact of tree shading on the microclimate of a coffee plantation: A case study from the Peruvian Amazon. Bois Et For. Des Trop. 2017, 334, 13–22. [Google Scholar] [CrossRef] [Green Version]
  62. Glover, N.; Beer, J. Nutrient cycling in two traditional Central American agroforestry systems. Agrofor. Syst. 1986, 4, 77–87. [Google Scholar] [CrossRef]
  63. Haggar, J.P.; Tanner, E.; Beer, J.W.; Kass, D. Nitrogen dynamics of tropical agroforestry and annual cropping systems. Soil Biol. Biochem. 1993, 25, 1363–1378. [Google Scholar] [CrossRef]
  64. Batterman, S.A.; Hedin, L.O.; van Breugel, M.; Ransijn, J.; Craven, D.J.; Hall, J.S. Key role of symbiotic dinitrogen fixation in tropical forest secondary succession. Nature 2013, 502, 224–227. [Google Scholar] [CrossRef]
  65. Sierra, J.; Nygren, P. Transfer of N fixed by a legume tree to the associated grass in a tropical silvopastoral system. Soil Biol. Biochem. 2006, 38, 1893–1903. [Google Scholar] [CrossRef]
  66. Vargas Tierras, Y.B.; Prado-Beltrán, J.K.; Nicolalde-Cruz, J.R.; Casanoves, F.; Virginio-Filho, E.d.M.; Viera Arroyo, W.F. Caracterización y rol de los frutales amazónicos en fincas familiares en las provincias de Sucumbíos y Orellana (Ecuador). CTA 2018, 19, 485–499. [Google Scholar] [CrossRef] [Green Version]
  67. Barrance, A.; Beer, J.; Boshier, D.H.; Chamberlain, J.; Cordero, J.; Detlefsen, G.; Finegan, B.; Galloway, G.; Gómez, M.; Gordon, J.; et al. Inga edulis Mart. In Árboles de Centroamérica: Un Manual Para Extensionistas; Cordero, J., Ed.; CATIE: Turrialba, Costa Rica, 2003; pp. 605–606. ISBN 0850741610. [Google Scholar]
  68. Kass, D.L. Erythrina species: Pantropical multipurpose tree legumes. In Forage Tree Legumes in Tropical Agriculture; Gutteridge, R.C., Shelton, H.M., Eds.; CAB International: Wallingford, UK, 1994; pp. 84–96. ISBN 0851988687. [Google Scholar]
  69. Riesmeier, M.; Mattonai, M.; Wong, S.S.; Veall, M.-A.; Betts, J.; Johnston, M.; Ribechini, E.; Devièse, T. Molecular profiling of Peru Balsam reveals active ingredients responsible for its pharmaceutical properties. Nat. Prod. Res. 2020, 35, 5311–5316. [Google Scholar] [CrossRef]
  70. Schnabel, F.; Filho, E.D.M.V.; Xu, S.; Fisk, I.D.; Roupsard, O.; Haggar, J. Shade trees: A determinant to the relative success of organic versus conventional coffee production. Agrofor. Syst. 2017, 92, 1535–1549. [Google Scholar] [CrossRef]
  71. Soil Survey Staff. Keys to Soil Taxonomy, 12th ed.; United States Department of Agriculture (USDA); Natural Resources Conservation Service (NRCS): Washington, DC, USA, 2014; ISBN 9780359573240.
  72. Peel, M.C.; Finlayson, B.L.; McMahon, T.A. Updated world map of the Köppen-Geiger climate classification. Hydrol. Earth Syst. Sci. 2007, 11, 1633–1644. [Google Scholar] [CrossRef] [Green Version]
  73. Holdridge, L.R.; Tosi, J.A. Life Zone Ecology; Tropical Science Center: San Jose, CA, USA, 1967. [Google Scholar]
  74. INAMHI. Mapa de Temperatura Media Multianual: Serie 1965–1999; Instituto Nacional de Meteorología e Hidrología (INAMHI): Quito, Ecuador, 2000. [Google Scholar]
  75. INAMHI. Mapa de Precipitación Media Multianual: Serie 1965–1999; Instituto Nacional de Meteorología e Hidrología (INAMHI): Quito, Ecuador, 2000. [Google Scholar]
  76. INAMHI. Meteorological Data; EECA: La Joya de los Sachas, Ecuador, 2020. [Google Scholar]
  77. Bote, A.D.; Ayalew, B.; Ocho, F.L.; Anten, N.P.; Vos, J. Analysis of coffee (Coffea arabica L.) performance in relation to radiation levels and rates of nitrogen supply I. Vegetative growth, production and distribution of biomass and radiation use efficiency. Eur. J. Agron. 2018, 92, 115–122. [Google Scholar] [CrossRef]
  78. Morais, H.; Marur, C.J.; Caramori, P.H.; Ribeiro, A.M.d.A.; Gomes, J.C. Características fisiológicas e de crescimento de cafeeiro sombreado com guandu e cultivado a pleno sol. Pesqui. Agropecuária Bras. 2003, 38, 1131–1137. [Google Scholar] [CrossRef] [Green Version]
  79. Netto, A.T.; Campostrini, E.; Oliveira, J.G.d.; Bressan-Smith, R.E. Photosynthetic pigments, nitrogen, chlorophyll a fluorescence and SPAD-502 readings in coffee leaves. Sci. Hortic. 2005, 104, 199–209. [Google Scholar] [CrossRef]
  80. Salinas, J.G.; García, R. Métodos Químicos Para el Análisis de Suelos Ácidos y Plantas Forrajeras; Centro Internacional de Agricultura Tropical, Programa de Pastos Tropicales: Cali, Colombia, 1985; ISBN 8489206503. [Google Scholar]
  81. R Core Team. R: A Language and Environment for Statistical Computing; R Foundation for Statistical Computing: Vienna, Austria, 2020. [Google Scholar]
  82. Sarkar, D. Lattice: Multivariate Data Visualization with R; Springer: New York, NY, USA, 2008; ISBN 978-0-387-75968-5. [Google Scholar]
  83. Bates, D.; Maechler, M.; Bolker, B.; Walker, S. Fitting Linear Mixed-Effects Models Using lme4. J. Stat. Softw. 2015, 67, 48. [Google Scholar] [CrossRef]
  84. Russell, V.L. Least-Squares Means: The R Package lsmeans. J. Stat. Softw. 2016, 69, 1–33. [Google Scholar] [CrossRef] [Green Version]
  85. Peterson, B.G.; Carl, P.; Boudt, K.; Bennett, R.; Ulrich, J.; Zivot, E.; Cornilly, D.; Hung, E.; Lestel, M.; Balkissoon, K.; et al. Performance Analytics: Econometric Tools for Performance and Risk Analysis, R Package Version 2.0.4; 2020. Available online: https://cran.r-project.org/web/packages/PerformanceAnalytics/PerformanceAnalytics.pdf (accessed on 17 September 2021).
  86. Kassambara, A. ggpubr: ‘ggplot2’ Based Publication Ready Plots, R Pacckage. Version 0.4.0.; 2020. Available online: https://cran.r-project.org/web/packages/ggpubr/index.html (accessed on 17 September 2021).
  87. Wickham, H. ggplot2: Elegant Graphics for Data Analysis; Springer: New York, NY, USA, 2016; ISBN 978-3-319-24277-4. [Google Scholar]
  88. De Oliveira Aparecido, L.E.; Rolim, G.d.S.; Da Moraes, J.R.S.C.d.; Valeriano, T.T.B.; Lense, G.H.E. Maturation periods for Coffea arabica cultivars and their implications for yield and quality in Brazil. J. Sci. Food Agric. 2018, 98, 3880–3891. [Google Scholar] [CrossRef] [PubMed]
  89. Bote, A.D.; Struik, P.C. Effects of shade on growth, production and quality of coffee (Coffea arabica) in Ethiopia. J. Hortic. For. 2011, 3, 336–341. [Google Scholar]
  90. Sarmiento-Soler, A.; Rötter, R.P.; Hoffmann, M.P.; Jassogne, L.; van Asten, P.; Graefe, S.; Vaast, P. Disentangling effects of altitude and shade cover on coffee fruit dynamics and vegetative growth in smallholder coffee systems. Agric. Ecosyst. Environ. 2022, 326, 107786. [Google Scholar] [CrossRef]
  91. Merle, I.; Villarreyna-Acuña, R.; Ribeyre, F.; Roupsard, O.; Cilas, C.; Avelino, J. Microclimate estimation under different coffee-based agroforestry systems using full-sun weather data and shade tree characteristics. Eur. J. Agron. 2022, 132, 126396. [Google Scholar] [CrossRef]
  92. Ehrenbergerová, L.; Klimková, M.; Cano, Y.G.; Habrová, H.; Lvončík, S.; Volařík, D.; Khum, W.; Němec, P.; Kim, S.; Jelínek, P.; et al. Does Shade Impact Coffee Yield, Tree Trunk, and Soil Moisture on Coffea canephora Plantations in Mondulkiri, Cambodia? Sustainability 2021, 13, 13823. [Google Scholar] [CrossRef]
  93. Chaves, A.R.; Martins, S.C.; Batista, K.D.; Celin, E.F.; Damatta, F.M. Varying leaf-to-fruit ratios affect branch growth and dieback, with little to no effect on photosynthesis, carbohydrate or mineral pools, in different canopy positions of field-grown coffee trees. Environ. Exp. Bot. 2012, 77, 207–218. [Google Scholar] [CrossRef] [Green Version]
  94. Reis, A.R.; Furlani Junior, E.; Buzetti, S.; Andreotti, M. Diagnóstico da exigência do cafeeiro em nitrogênio pela utilização do medidor portátil de clorofila. Bragantia 2006, 65, 163–171. [Google Scholar] [CrossRef]
  95. Rodríguez-López, N.F.; Cavatte, P.C.; Silva, P.E.M.; Martins, S.C.V.; Morais, L.E.; Medina, E.F.; Damatta, F.M. Physiological and biochemical abilities of robusta coffee leaves for acclimation to cope with temporal changes in light availability. Physiol. Plant. 2013, 149, 45–55. [Google Scholar] [CrossRef] [PubMed] [Green Version]
  96. Veal, E.A.; Day, A.M.; Morgan, B.A. Hydrogen peroxide sensing and signaling. Mol. Cell 2007, 26, 1–14. [Google Scholar] [CrossRef] [PubMed]
  97. Ramalho, J.C.; Pons, T.L.; Groeneveld, H.W.; Azinheira, H.G.; Nunes, M.A. Photosynthetic acclimation to high light conditions in mature leaves of Coffea arabica L.: Role of xanthophylls, quenching mechanisms and nitrogen nutrition. Funct. Plant Biol. 2000, 27, 43–51. [Google Scholar] [CrossRef]
  98. Reis, A.R.; Favarin, J.L.; Gratão, P.L.; Capaldi, F.R.; Azevedo, R.A. Antioxidant metabolism in coffee (Coffea arabica L.) plants in response to nitrogen supply. Theor. Exp. Plant Physiol. 2015, 27, 203–213. [Google Scholar] [CrossRef] [Green Version]
  99. Dossa, E.L.; Fernandes, E.C.M.; Reid, W.S.; Ezui, K. Above- and belowground biomass, nutrient and carbon stocks contrasting an open-grown and a shaded coffee plantation. Agrofor. Syst. 2008, 72, 103–115. [Google Scholar] [CrossRef]
  100. Anim-Kwapong, G.J.; Anim-Kwapong, E.; Amoah, F.M. Nutrient status and rooting of Robusta coffee (Coffea canephora Pierre ex Froehner) cuttings from stock plants under Gliricidia sepium. Trop. Agr. 1999, 76, 263–268. [Google Scholar]
  101. Ordoñez, J.C.; van Bodegom, P.M.; Witte, J.-P.M.; Wright, I.J.; Reich, P.B.; Aerts, R. A global study of relationships between leaf traits, climate and soil measures of nutrient fertility. Glob. Ecol. Biogeogr. 2009, 18, 137–149. [Google Scholar] [CrossRef]
  102. Mamani-Pati, F.; Clay, D.E.; Clay, S.A.; Smeltekop, H.; Yujra-Callata, M.A. The Influence of Strata on the Nutrient Recycling within a Tropical Certified Organic Coffee Production System. ISRN Agron. 2012, 2012, 1–8. [Google Scholar] [CrossRef]
  103. Celentano, D.; Zahawi, R.A.; Finegan, B.; Ostertag, R.; Cole, R.J.; Holl, K.D. Litterfall Dynamics Under Different Tropical Forest Restoration Strategies in Costa Rica. Biotropica 2011, 43, 279–287. [Google Scholar] [CrossRef]
  104. Duarte, E.M.G.; Cardoso, I.M.; Stijnen, T.; Mendonça, M.A.F.C.; Coelho, M.S.; Cantarutti, R.B.; Kuyper, T.W.; Villani, E.M.A.; Mendonça, E.S. Decomposition and nutrient release in leaves of Atlantic Rainforest tree species used in agroforestry systems. Agrofor. Syst. 2013, 87, 835–847. [Google Scholar] [CrossRef]
  105. Palm, C.A.; Sanchez, P.A. Decomposition and Nutrient Release Patterns of the Leaves of Three Tropical Legumes. Biotropica 1990, 22, 330–338. [Google Scholar] [CrossRef]
  106. Amaral, J.T.; Da Matta, F.; Rena, A. Effects of fruiting on the growth of Arabica coffee trees as related to carbohydrate and nitrogen status and to nitrate reductase activity. Rev. Bras. Fisiol. Veg. 2001, 13, 66–74. [Google Scholar] [CrossRef] [Green Version]
  107. Partelli, F.L.; Oliveira, M.G.; Covre, A.M.; Vieira, H.D.; Machado Dias, J.R.; Braun, H. Nutritional standards and nutritional diagnosis of the Conilon coffee plants in phenological growth stages. J. Plant Nutr. 2018, 41, 2536–2546. [Google Scholar] [CrossRef]
  108. Neto, A.P.; Favarin, J.L.; de Almeida, R.E.M.; dos Santos Dias, C.T.; Tezotto, T.; Alves, A.L.G.; Moraes, M.F. Changes of Nutritional Status during a Phenological Cycle of Coffee under High Nitrogen Supply by Fertigation. Commun. Soil Sci. Plant Anal. 2011, 42, 2414–2425. [Google Scholar] [CrossRef]
  109. Venancio, L.P.; Do Amaral, J.F.T.; Cavatte, P.C.; Vargas, C.T.; Dos Reis, E.F.; Dias, J.R. Vegetative growth and yield of robusta coffee genotypes cultivated under different shading levels. Biosci. J. 2019, 35, 1490–1503. [Google Scholar] [CrossRef] [Green Version]
  110. Charbonnier, F.; Roupsard, O.; Le Maire, G.; Guillemot, J.; Casanoves, F.; Lacointe, A.; Vaast, P.; Allinne, C.; Audebert, L.; Cambou, A.; et al. Increased light-use efficiency sustains net primary productivity of shaded coffee plants in agroforestry system. Plant Cell Environ. 2017, 40, 1592–1608. [Google Scholar] [CrossRef]
  111. Casal, J.J. Shade avoidance. Arab. Book 2012, 10, e0157. [Google Scholar] [CrossRef] [Green Version]
  112. Van Long, N.; Ngoc, N.Q.; Dung, N.N.; Kristiansen, P.; Yunusa, I.; Fyfe, C. The Effects of Shade Tree Types on Light Variation and Robusta Coffee Production in Vietnam. Engineering 2015, 7, 742–753. [Google Scholar] [CrossRef]
  113. Aristizábal, L.F.; Johnson, M.; Shriner, S.; Hollingsworth, R.; Manoukis, N.C.; Myers, R.; Bayman, P.; Arthurs, S.P. Integrated Pest Management of Coffee Berry Borer in Hawaii and Puerto Rico: Current Status and Prospects. Insects 2017, 8, 123. [Google Scholar] [CrossRef] [Green Version]
Figure 1. Robusta plants growing under (© Kevin Piato): (a) Erythrina spp., (b) Myroxylon balsamum, (c) Inga edulis and (d) full-sun conditions.
Life 12 00807 g001
Figure 2. Robusta coffee interaction plots with mean coffee fresh yield as a criterion, cropping system (IC = intensive conventional; MC = moderate conventional; IO = intensive organic; LO = low organic) as predictor and (A) both month (April, May, June 2020) and shading system (SUN = full sun; TIM = Myroxylon balsamum; TaE = M. balsamum and Erythrina spp.; ERY = E. spp.; GUA = Inga edulis) as moderators; (B) month as moderator. Dots show least-squares means with 95% CIs.
Life 12 00807 g002
Figure 3. Robusta coffee fresh yield in relation to (A) the cropping system (IC = intensive conventional; MC = modera te conventional; IO = intensive organic; LO = low organic) × shading system (SUN = full sun; TIM = Myroxylon balsamum; TaE = M. balsamum and Erythrina spp.; ERY = E. spp.; GUA = Inga edulis) treatments in April, May and June 2020; (B) the cropping system; (C) the shading system; (D) the month. Bars show least-squares means with 95% CIs. Means with the same letter are not significantly different according to Tukey’s test (p < 0.05). Absence of letter indicates no significant difference with all other groups.
Life 12 00807 g003
Figure 4. Robusta coffee (A) mean total leaf absolute chlorophyll concentration (TLACC) in relation to the cropping system (IC = intensive conventional; MC = moderate conventional; IO = intensive organic; LO = low organic); (B) mean TLACC in relation to the shading system (SUN = full sun; TIM = Myroxylon balsamum; TaE = M. balsamum and Erythrina spp.; ERY = E. spp.; GUA = Inga edulis); (C) mean TLACC in April, May and June 2020; (D) interaction plot with mean TLACC as a criterion, shading system as predictor and cropping system as moderator. Bars show least-squares means with 95% CIs. Means with the same letter are not significantly different according to Tukey’s test (p < 0.05).
Life 12 00807 g004
Figure 5. Robusta coffee mean height in relation to (A) the cropping system (IC = intensive conventional; MC = moderate conventional; IO = intensive organic; LO = low organic) and (B) the shading system (SUN = full sun; TIM = Myroxylon balsamum; TaE = M. balsamum and Erythrina spp.; ERY = E. spp.; GUA = Inga edulis). Bars show least-squares means with 95% CIs. Means with the same letter are not significantly different according to Tukey’s test (p < 0.05).
Life 12 00807 g005
Figure 6. Relation between total leaf absolute chlorophyll concentration (TLACC) and total leaf N (n = 17). Line represents regression line fitted. Grey shading shows 95% CI. Pearson correlation coefficient and its p-value are also provided.
Life 12 00807 g006
Figure 7. Correlation matrix depicting the correlation between the height (H, n = 718), the coffee fresh yield (CFY, n = 718) and the total leaf absolute chlorophyll concentration (TLACC, n = 718). Across the diagonal histograms with kernel density and rug plots are shown below the diagonal scatter plots with fitted lines. Pearson correlation coefficients with significance level (<0.001 ***) are shown above the diagonal.
Life 12 00807 g007
Table 1. Mean monthly daily max and min air temperatures (°C), total monthly precipitation (mm) and mean monthly relative humidity at 7 a.m., 1 p.m. and 7 p.m. (%) from April–June 2020 at the EECA weather station in La Joya de los Sachas, Orellana, Ecuador. Adapted with permission from Ref. [76]. 2020. INAMHI.
Total Precipitation (mm)Mean Daily Temperature (°C)Relative Humidity (%)
Month MaxMin7 a.m.1 p.m.7 p.m.
April86331997.59296
May5032.520.5979096
June238.53121.5978592
Table 2. Shade tree species, # of shade tree species, shade tree density, shade amount, frequency of shade tree pruning and pruning type for each shading system applied to coffee plots.
Shading System
SUNTIMERYGUATaE
Shade Tree Species-Myroxylon balsamumErythrina spp.Inga edulisM. balsamum; E. spp.
# of shade tree species01112
Shade tree density (ha−1)0833338383
Shade amount (%)0725249
# of shade tree pruning (year−1)001–211–2
Pruning type--½ pollarding at 2 m; ½ crown reduction (50%)Crown thinningOnly E. spp. crown
reduction (50%)
Table 3. Results of ANOVA conducted on coffee fresh yield (CFY), height and total leaf absolute chlorophyll concentration (TLACC) for the 3 explanatory variables, i.e., month (M), cropping system (CS) and shading system (SS). Month factor was not included in the height model, since this response variable was measured once. Effects of random variables are not reported. Analysis of variance was performed with Satterthwaite’s method.
Response VariableFactorSum of sq.Mean sq.Num. d.f.Den. D.f.F-Valuep-Value
CFY (g)M166.683.32869.6277.2<0.001***
CS11.13.7337.912.3<0.001***
SS3.30.8438.22.80.042*
M:CS5.61.068573.20.003**
M:SS3.90.58864.91.60.113
CS:SS4.50.41237.11.30.288
M:CS:SS12.90.524846.91.80.011*
Height (cm)CS19,1996399.7338.27.4<0.001***
SS63,63215,908.1438.118.4<0.001***
CS:SS19,9411661.812381.90.062
TLACC (μmol m−2)M1,167,19558,359823133.275.8<0.001***
CS391,475130,492338.216.9<0.001***
SS2,178,395544,599438.1770.7<0.001***
M:CS59,060984363133.21.30.263
M:SS102,49512,81283133.21.70.102
CS:SS300,36425,0301238.033.30.003**
M:CS:SS126,3545265243133.20.7 0.872
Significances at 95% with ‘***’ p < 0.001, ‘**’ p < 0.01, ‘*’ p < 0.05.
Publisher’s Note: MDPI stays neutral with regard to jurisdictional claims in published maps and institutional affiliations.

